Research on Private Label Introduction and Sales Mode Decision-Making for E-Commerce Platforms Considering Coupon Promotion Strategies


Abstract
1. Introduction
- (1)
- Is it advisable for platforms to adopt a reselling mode? How does the implementation of the reselling mode affect the overall profitability of the supply chain?
- (2)
- Should platforms launch their own private brands? In what ways does the introduction of private labels modify the profit distribution mechanism within the supply chain?
- (3)
- Under varying sales modes and private brand strategies, how can e-commerce platforms strategically design coupon strategies to balance the interests of brand owners and their own objectives, thereby promoting collaborative development across the supply chain?
2. Literature Review
2.1. Sales Mode Choice
2.2. Private Label Introduction
2.3. Coupon Strategies
2.4. Research Gap Analysis and Contributions

| Study | Decisions | |||
|---|---|---|---|---|
| Agency Selling | Reselling | PL Introduction | Coupon Strategies | |
| Alan et al. [9] | √ | |||
| Shopova. [20] | √ | |||
| Choi and Turut [10] | √ | |||
| Hu et al. [31] | √ | |||
| Abhishek et al. [7] | √ | √ | ||
| Li et al. [8] | √ | √ | ||
| Tan et al. [18] | √ | √ | ||
| Bauner et al. [30] | √ | √ | ||
| Yuan et al. [19] | √ | √ | √ | |
| Hemmati et al. [36] | √ | √ | √ | |
| Chu et al. [21] | √ | √ | √ | |
| Shen et al. [6] | √ | √ | √ | |
| Li et al. [32] | √ | √ | ||
| Niu et al. [34] | √ | √ | ||
| Wan et al. [11] | √ | √ | ||
| This paper | √ | √ | √ | √ |
3. Selling Mode
3.1. Problem Definition
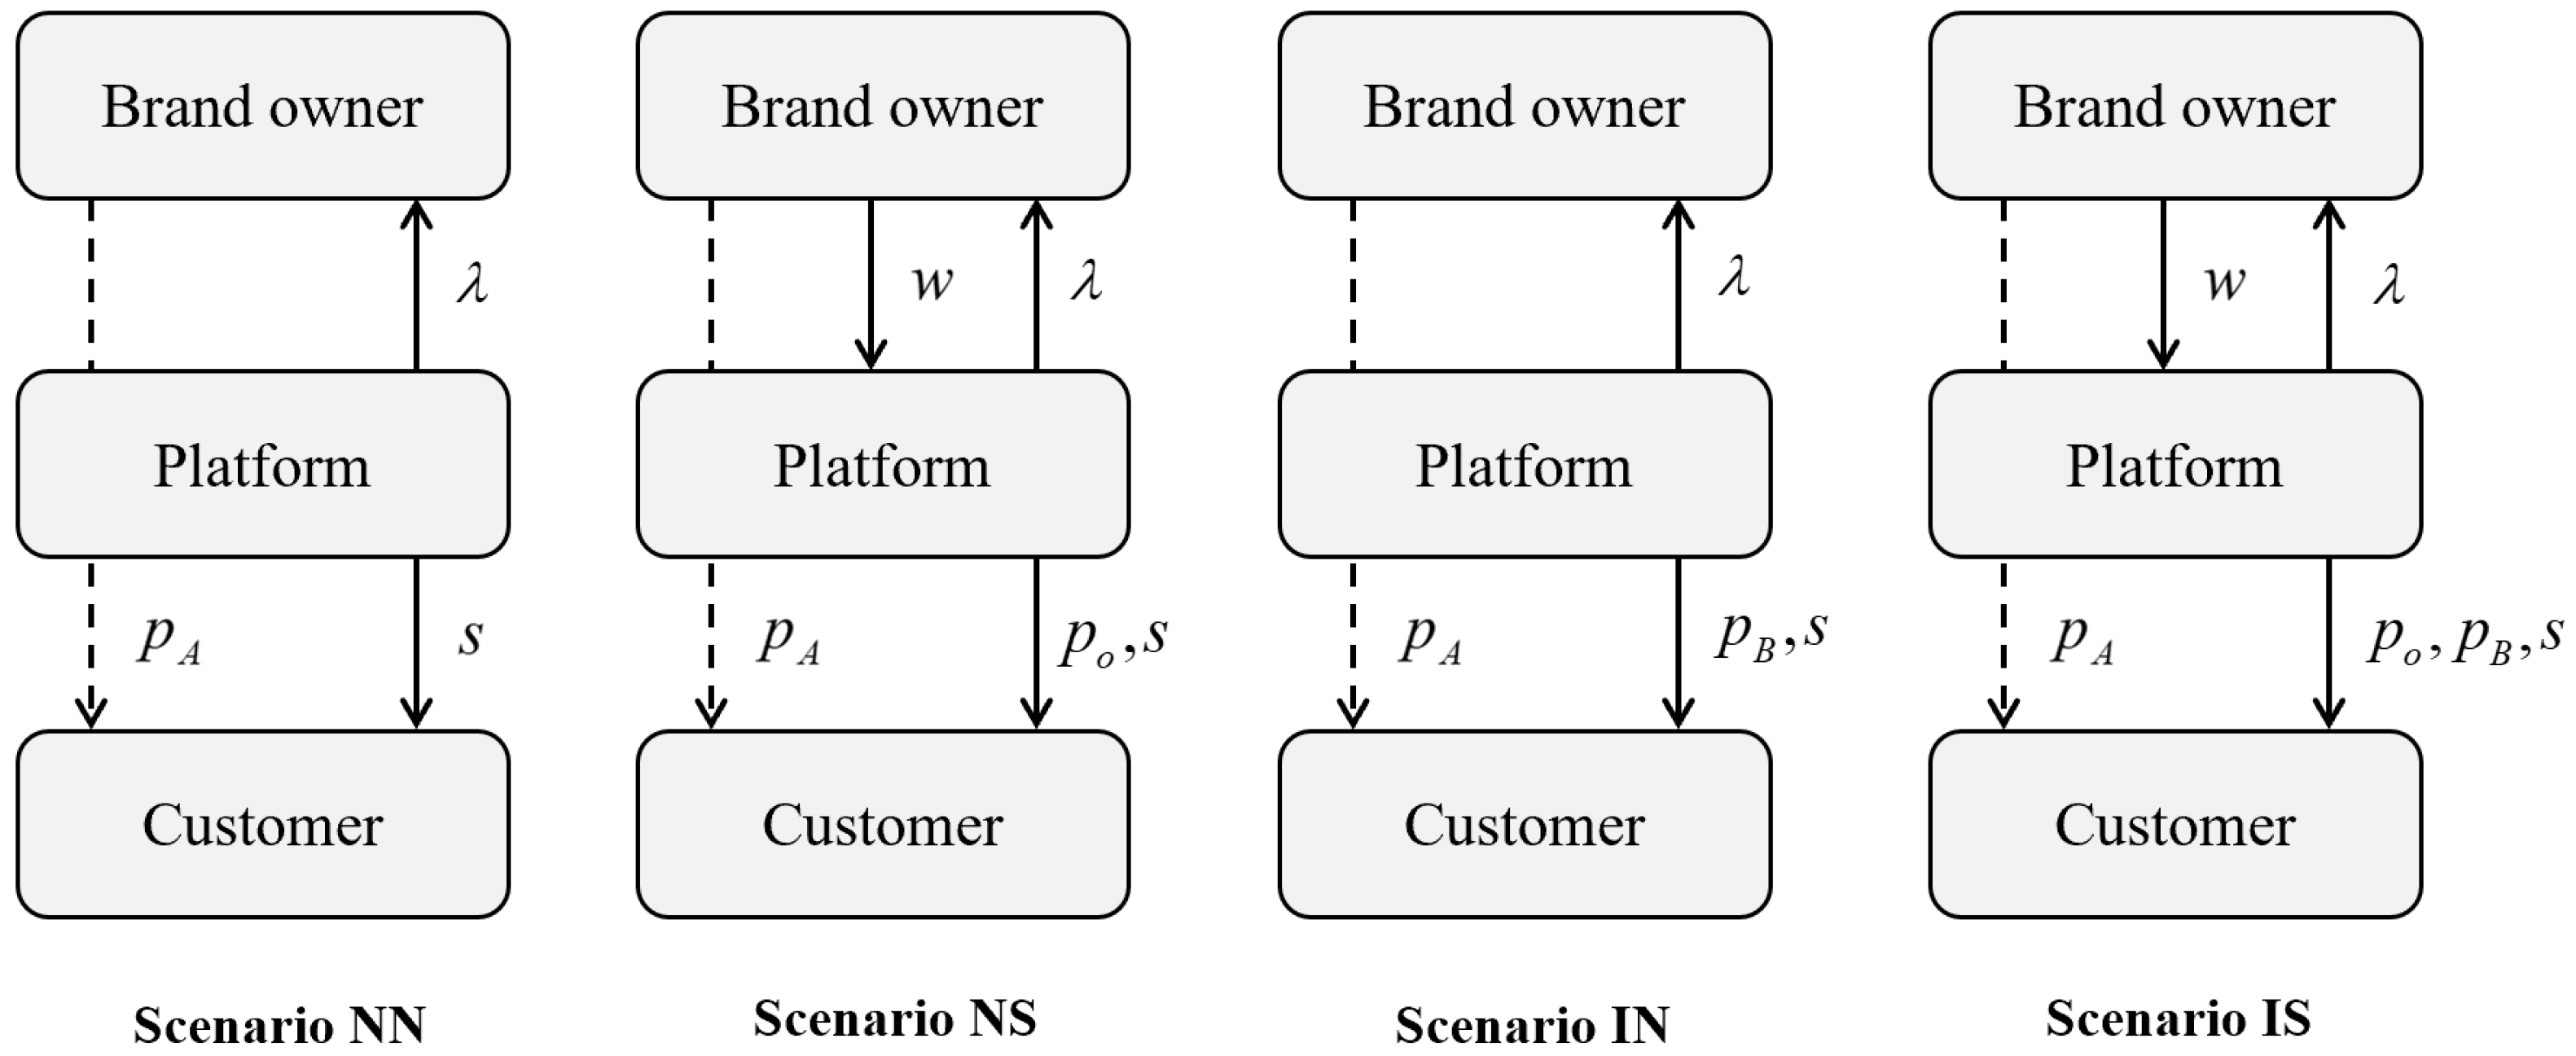
3.2. Mode Setup
4. Mode Analysis
4.1. Parameter Sensitivity Analysis
- (i)
- Scenario NN
- (ii)
- Scenario NS
- (iii)
- Scenario INIf , then ;If , ; .
- (iv)
- Scenario ISIf , then ;If , then ; .
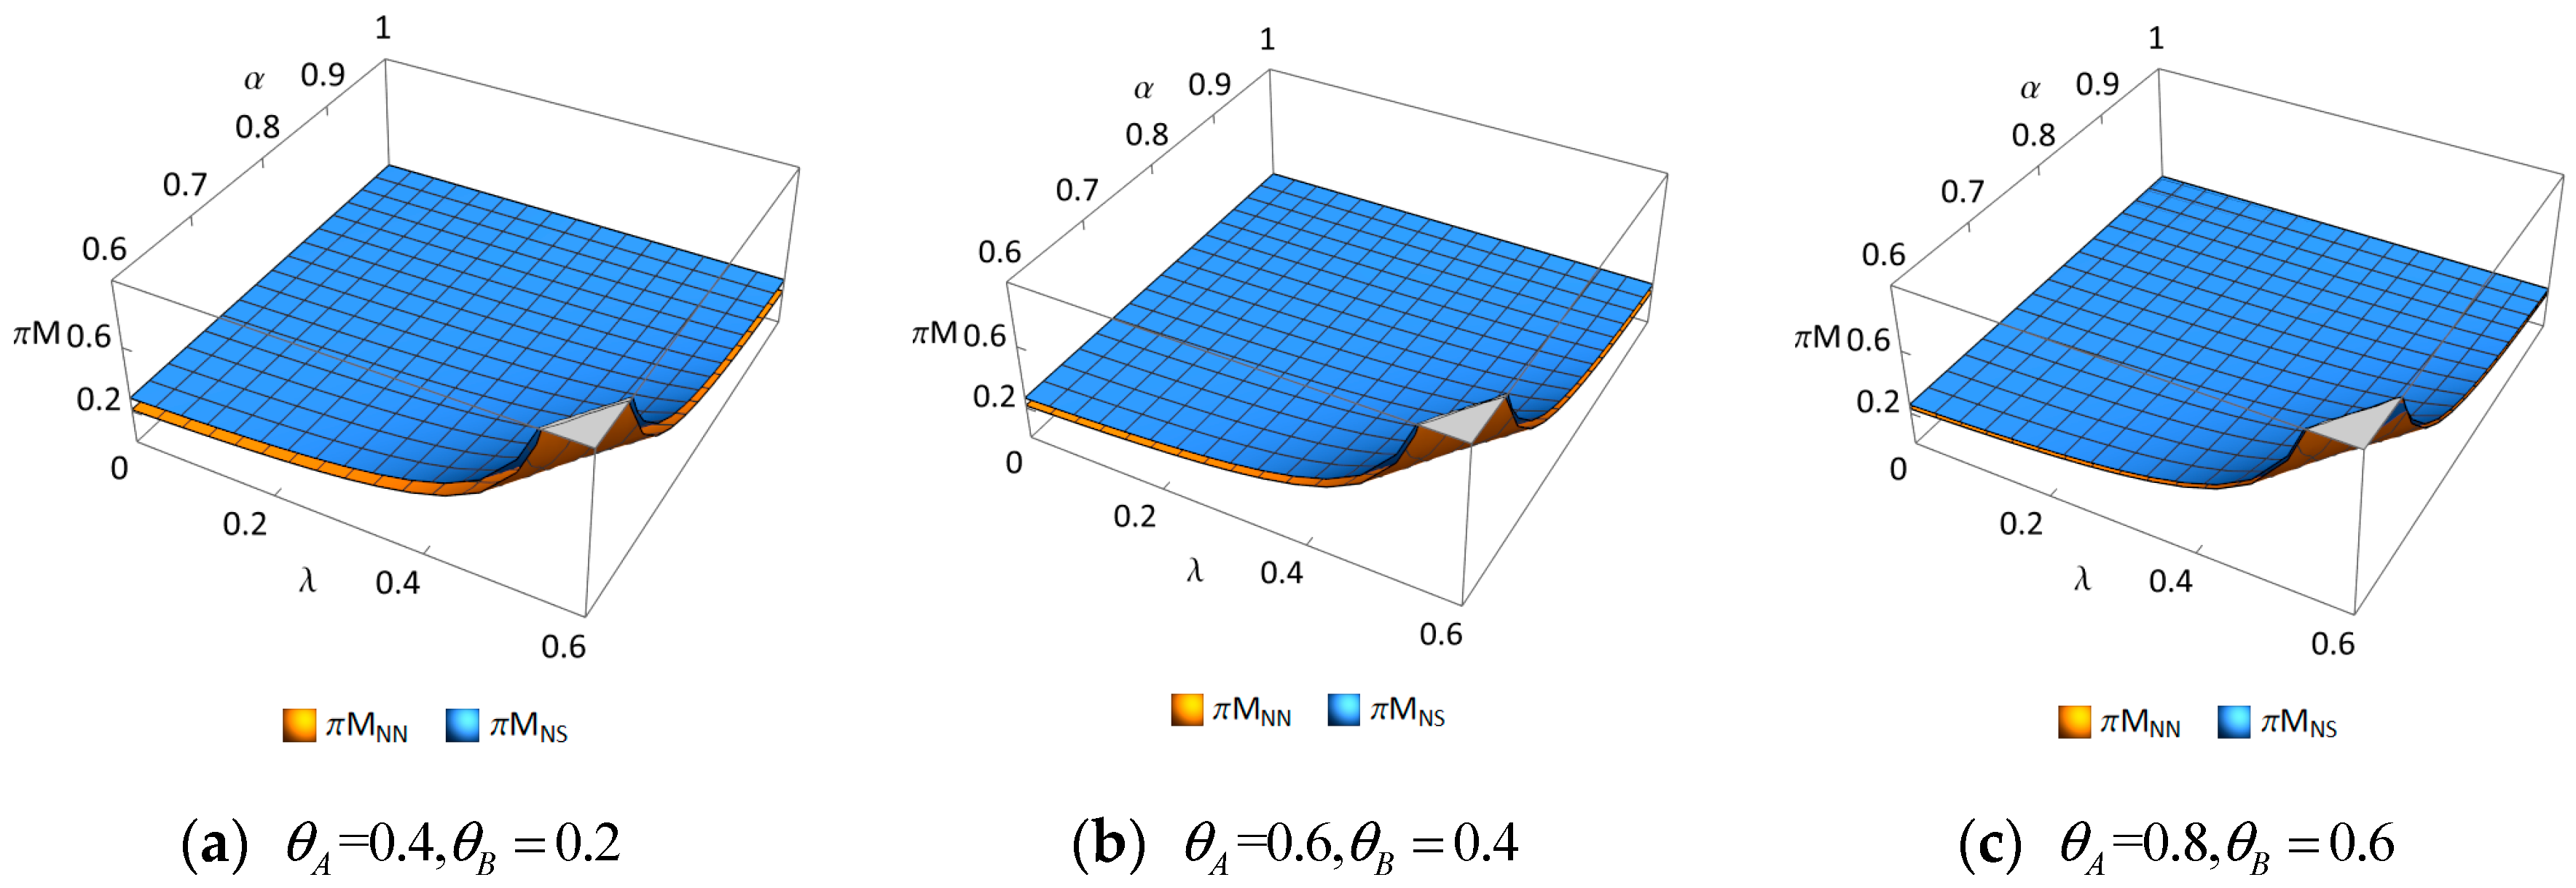
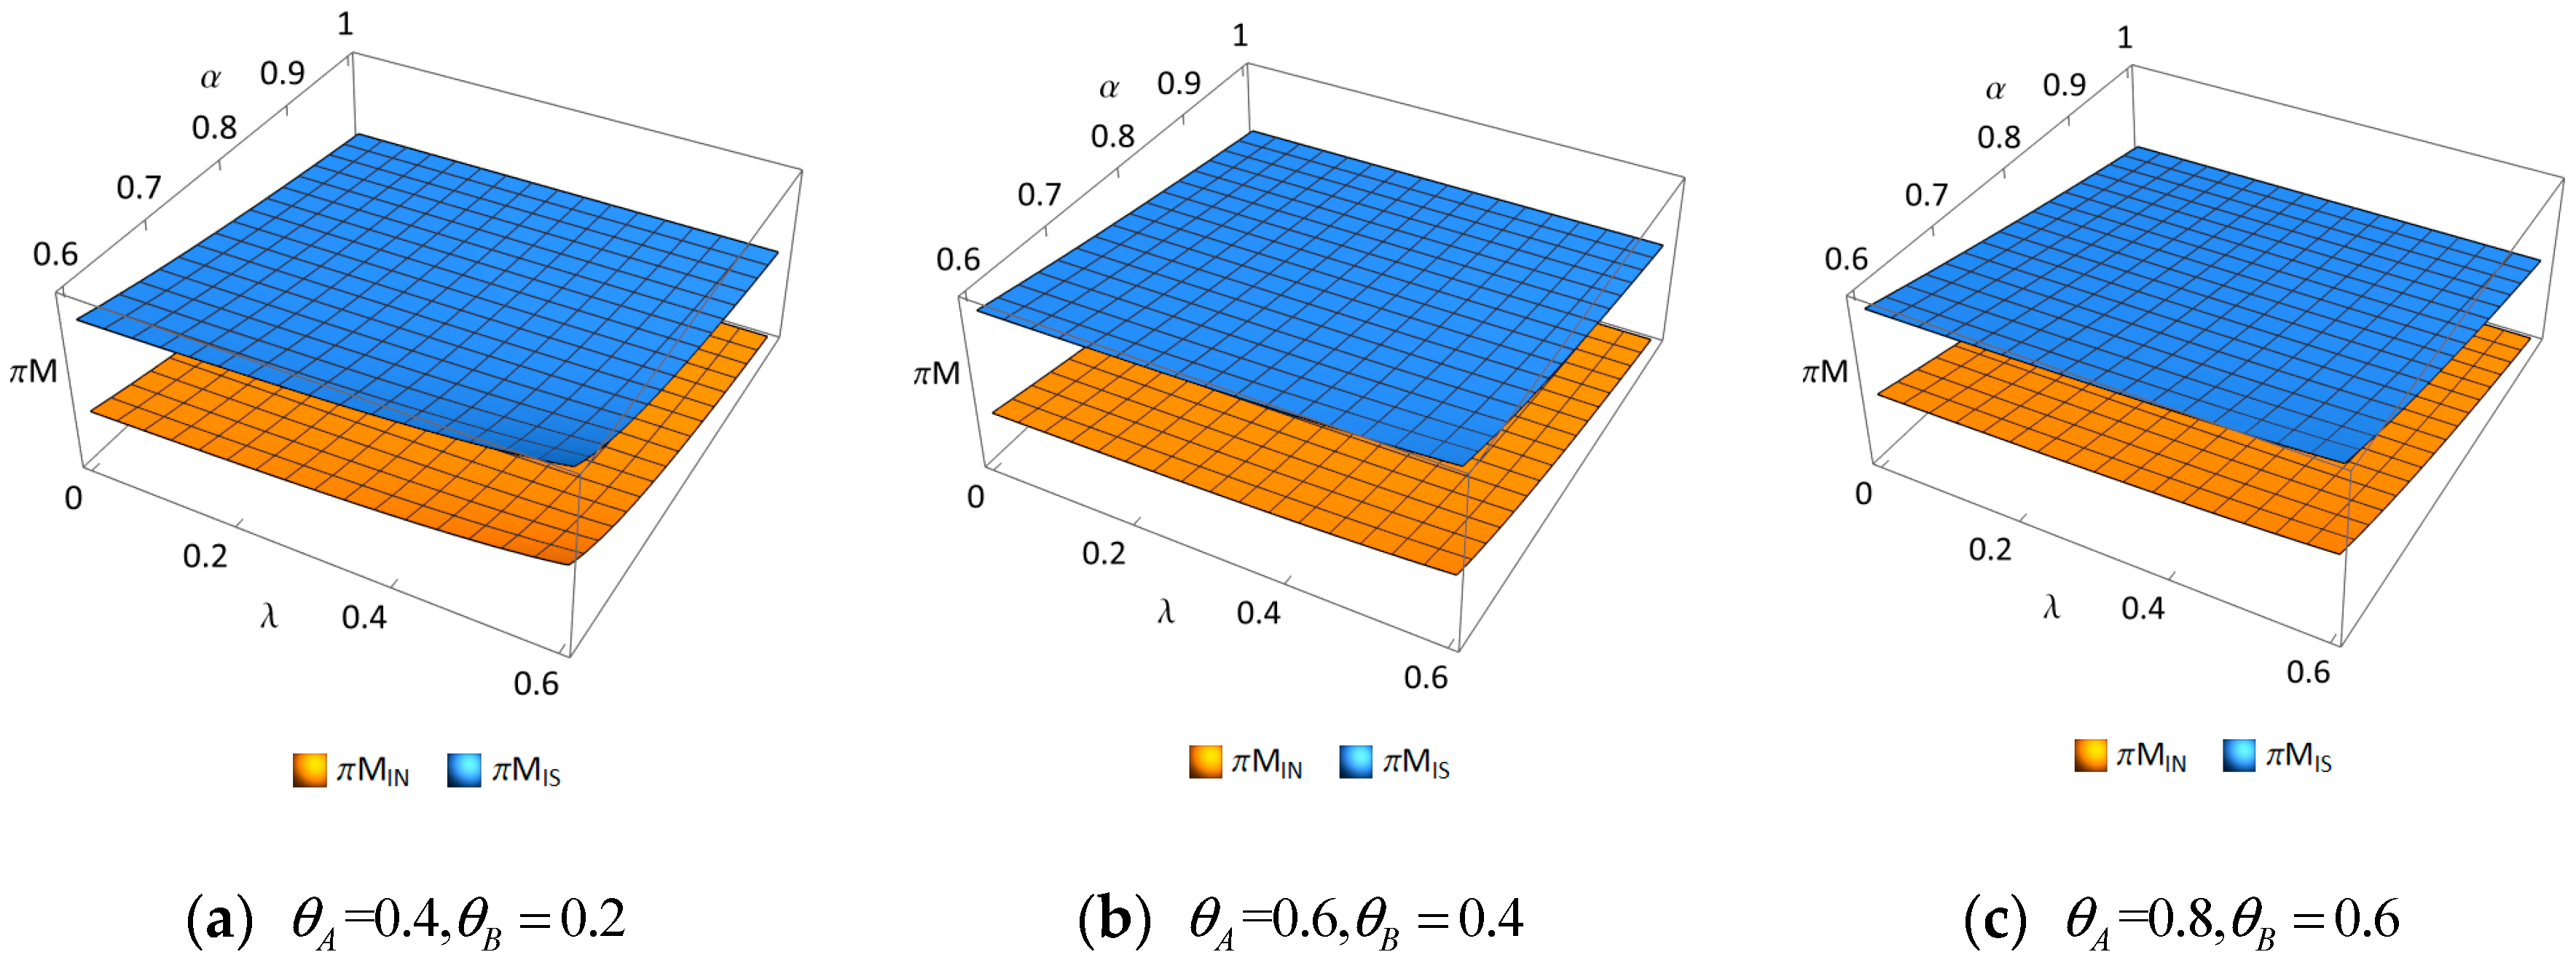
4.2. Analysis of Introduction of Reselling Mode
- (i)
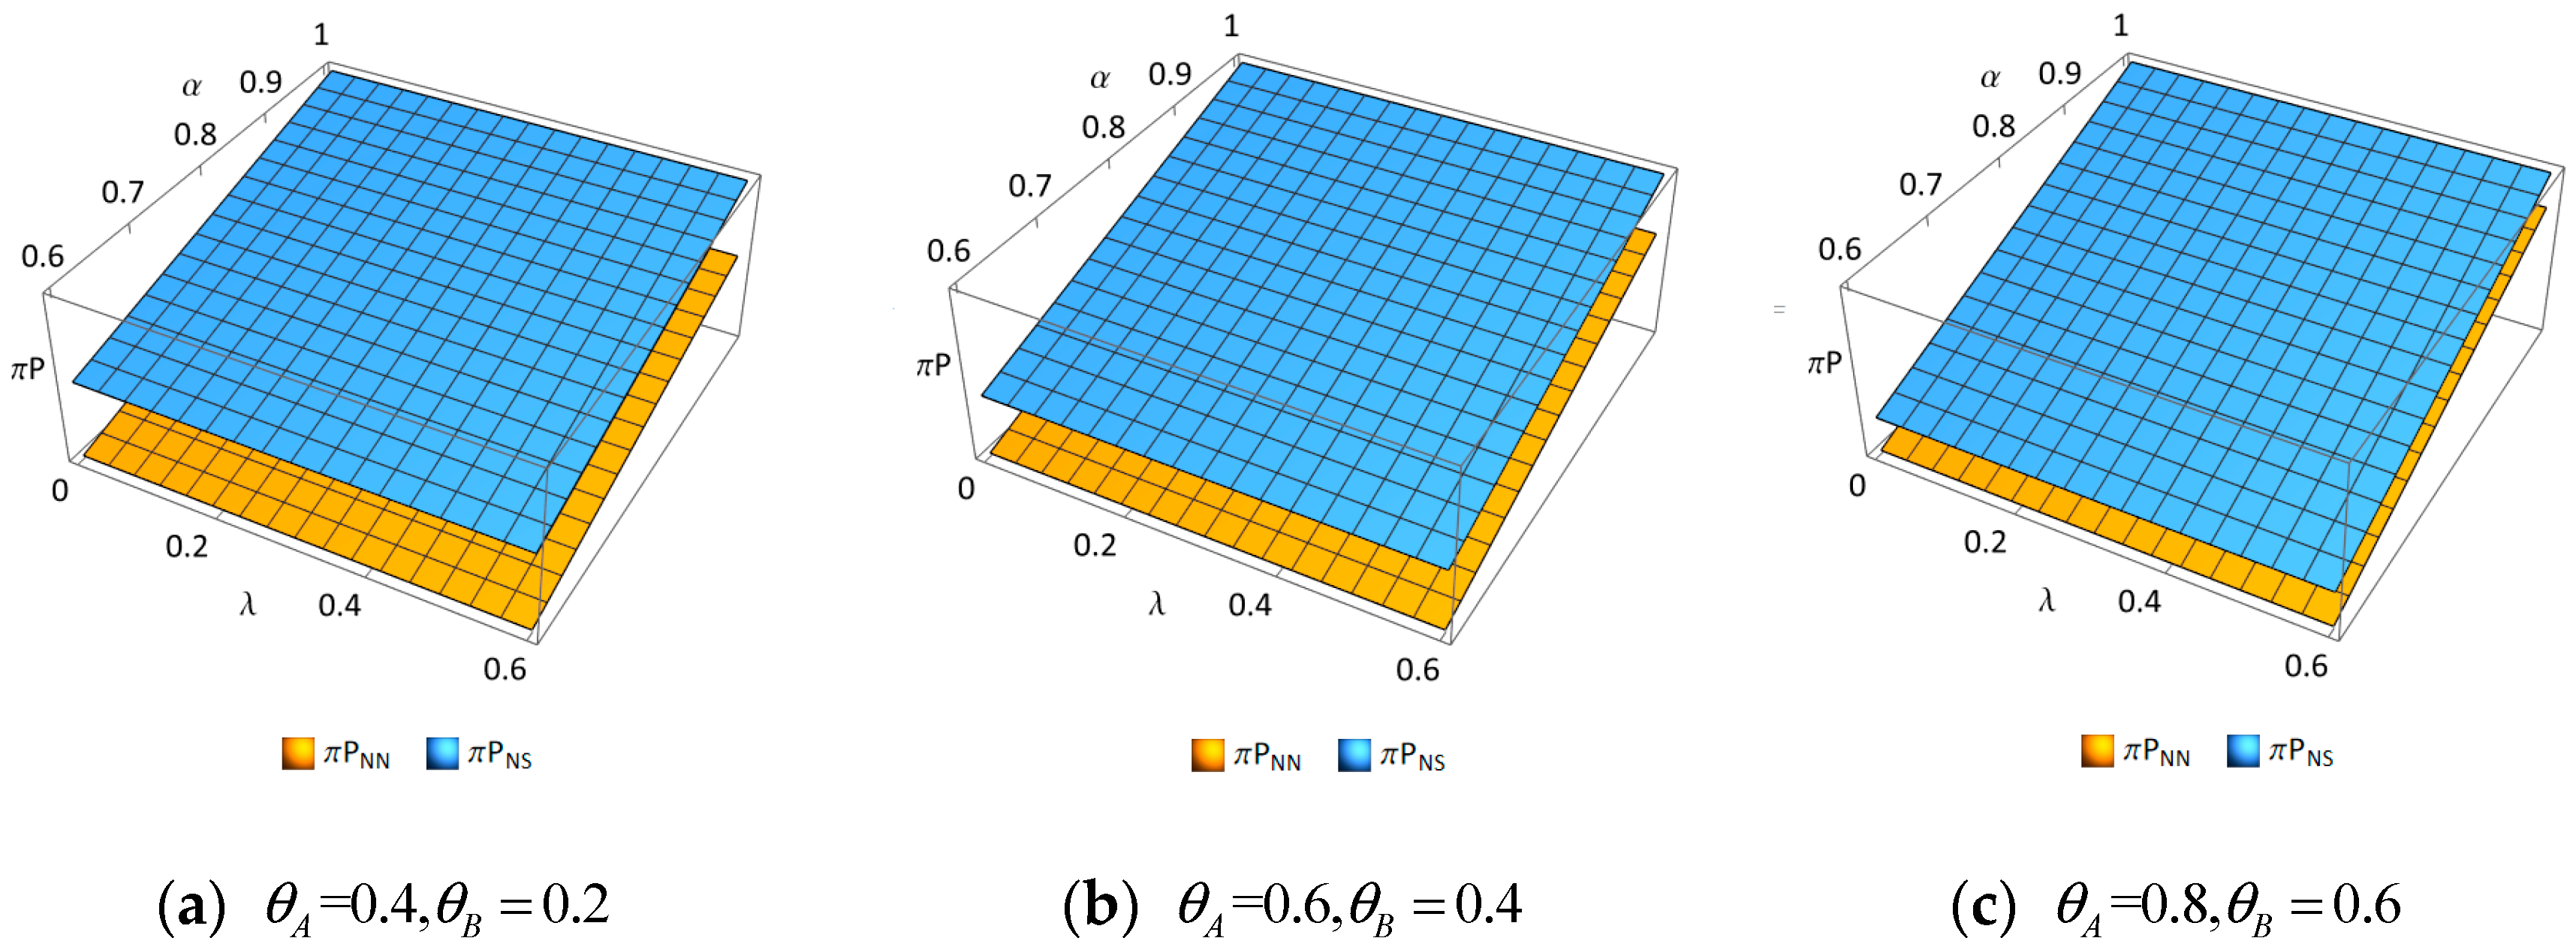
- Scenario NN vs. Scenario NS
- (ii)
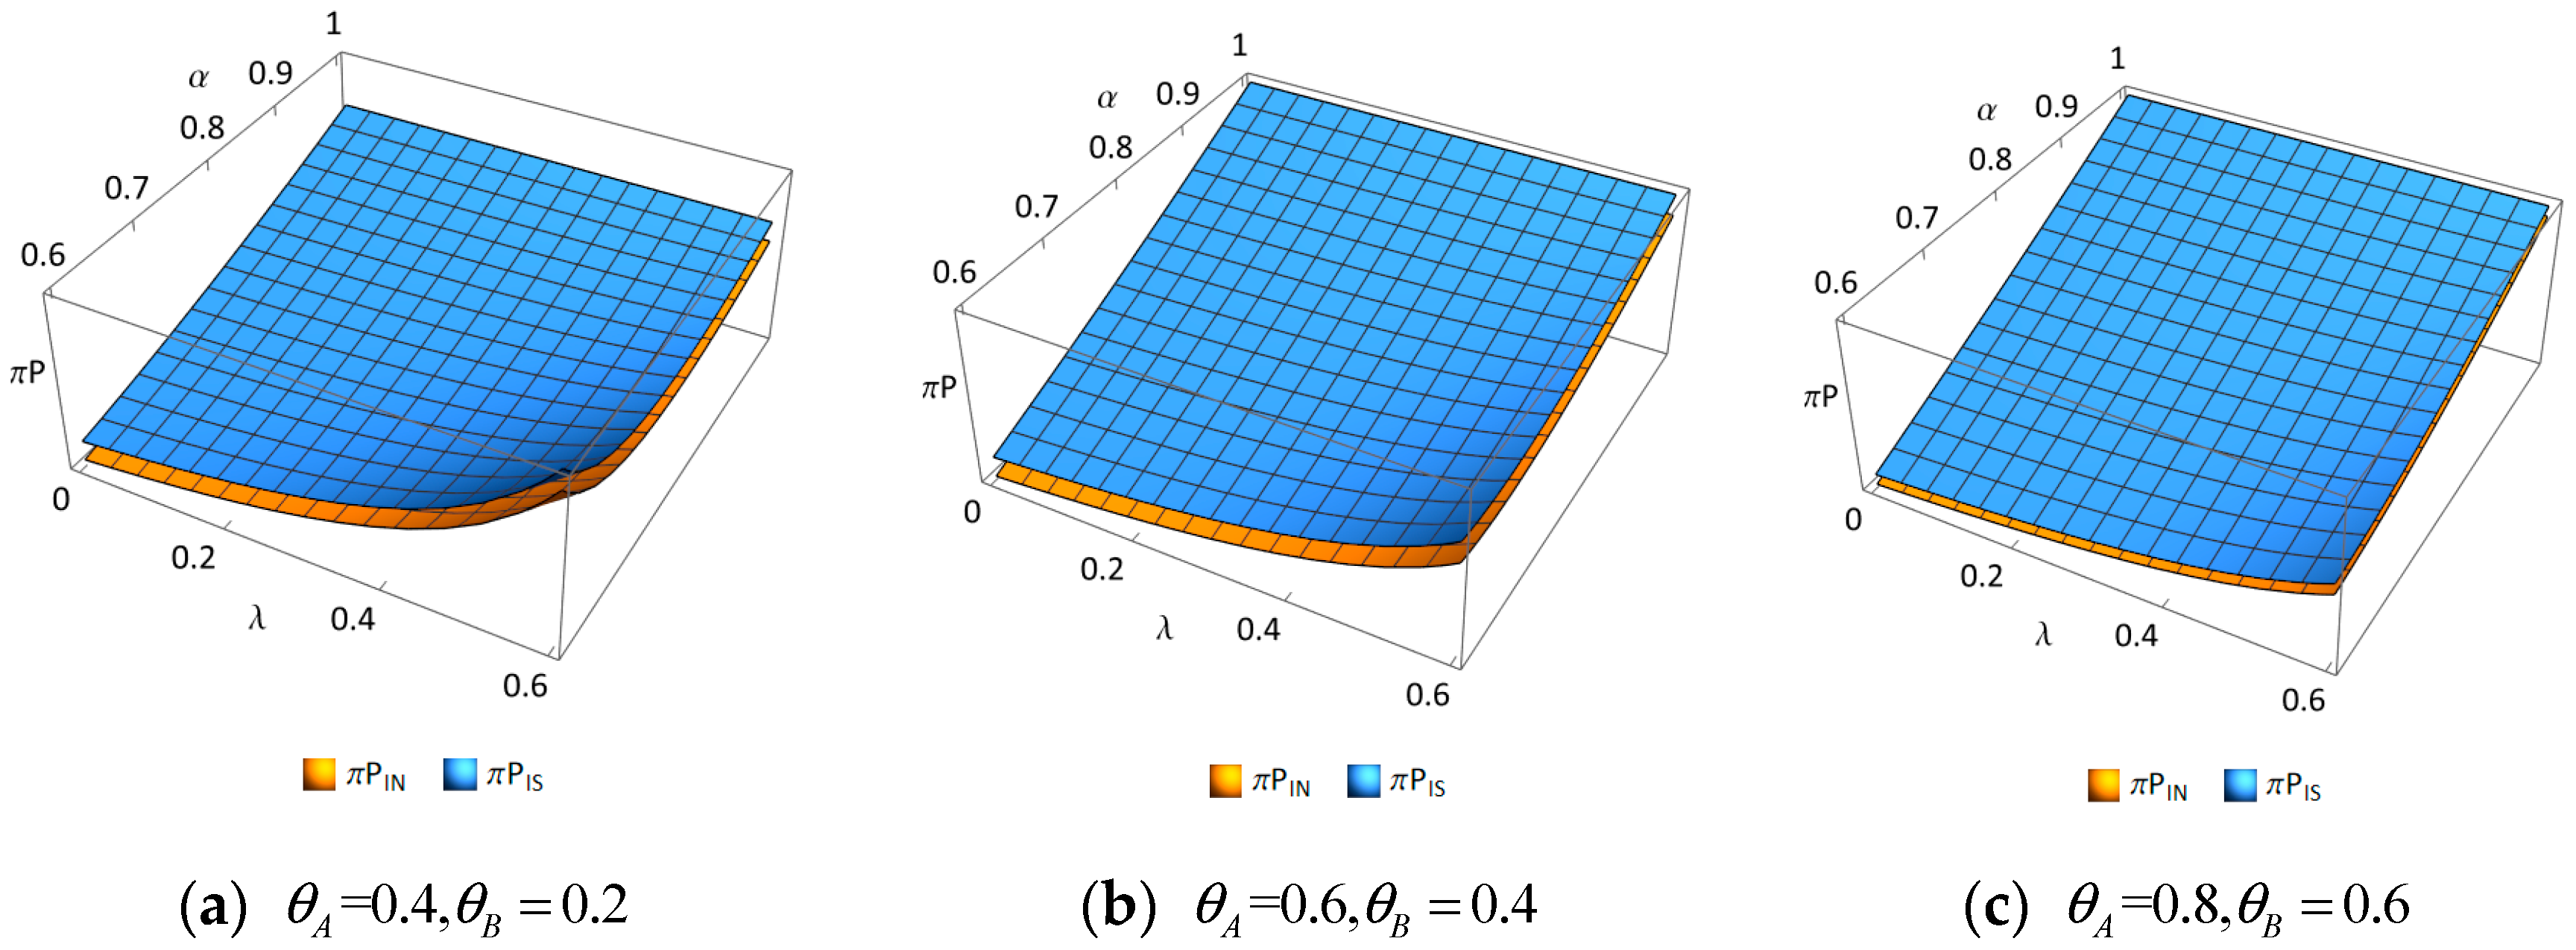
- Scenario IN vs. Scenario IS
- (i)
- Scenario NN vs. Scenario NS
- (ii)
- Scenario IN vs. Scenario IS
- (i)
- Scenario NN vs. Scenario NS
- (ii)
- Scenario IN vs. Scenario IS
- (i)
- Scenario NN vs. Scenario NS
- (ii)
- Scenario IN vs. Scenario IS
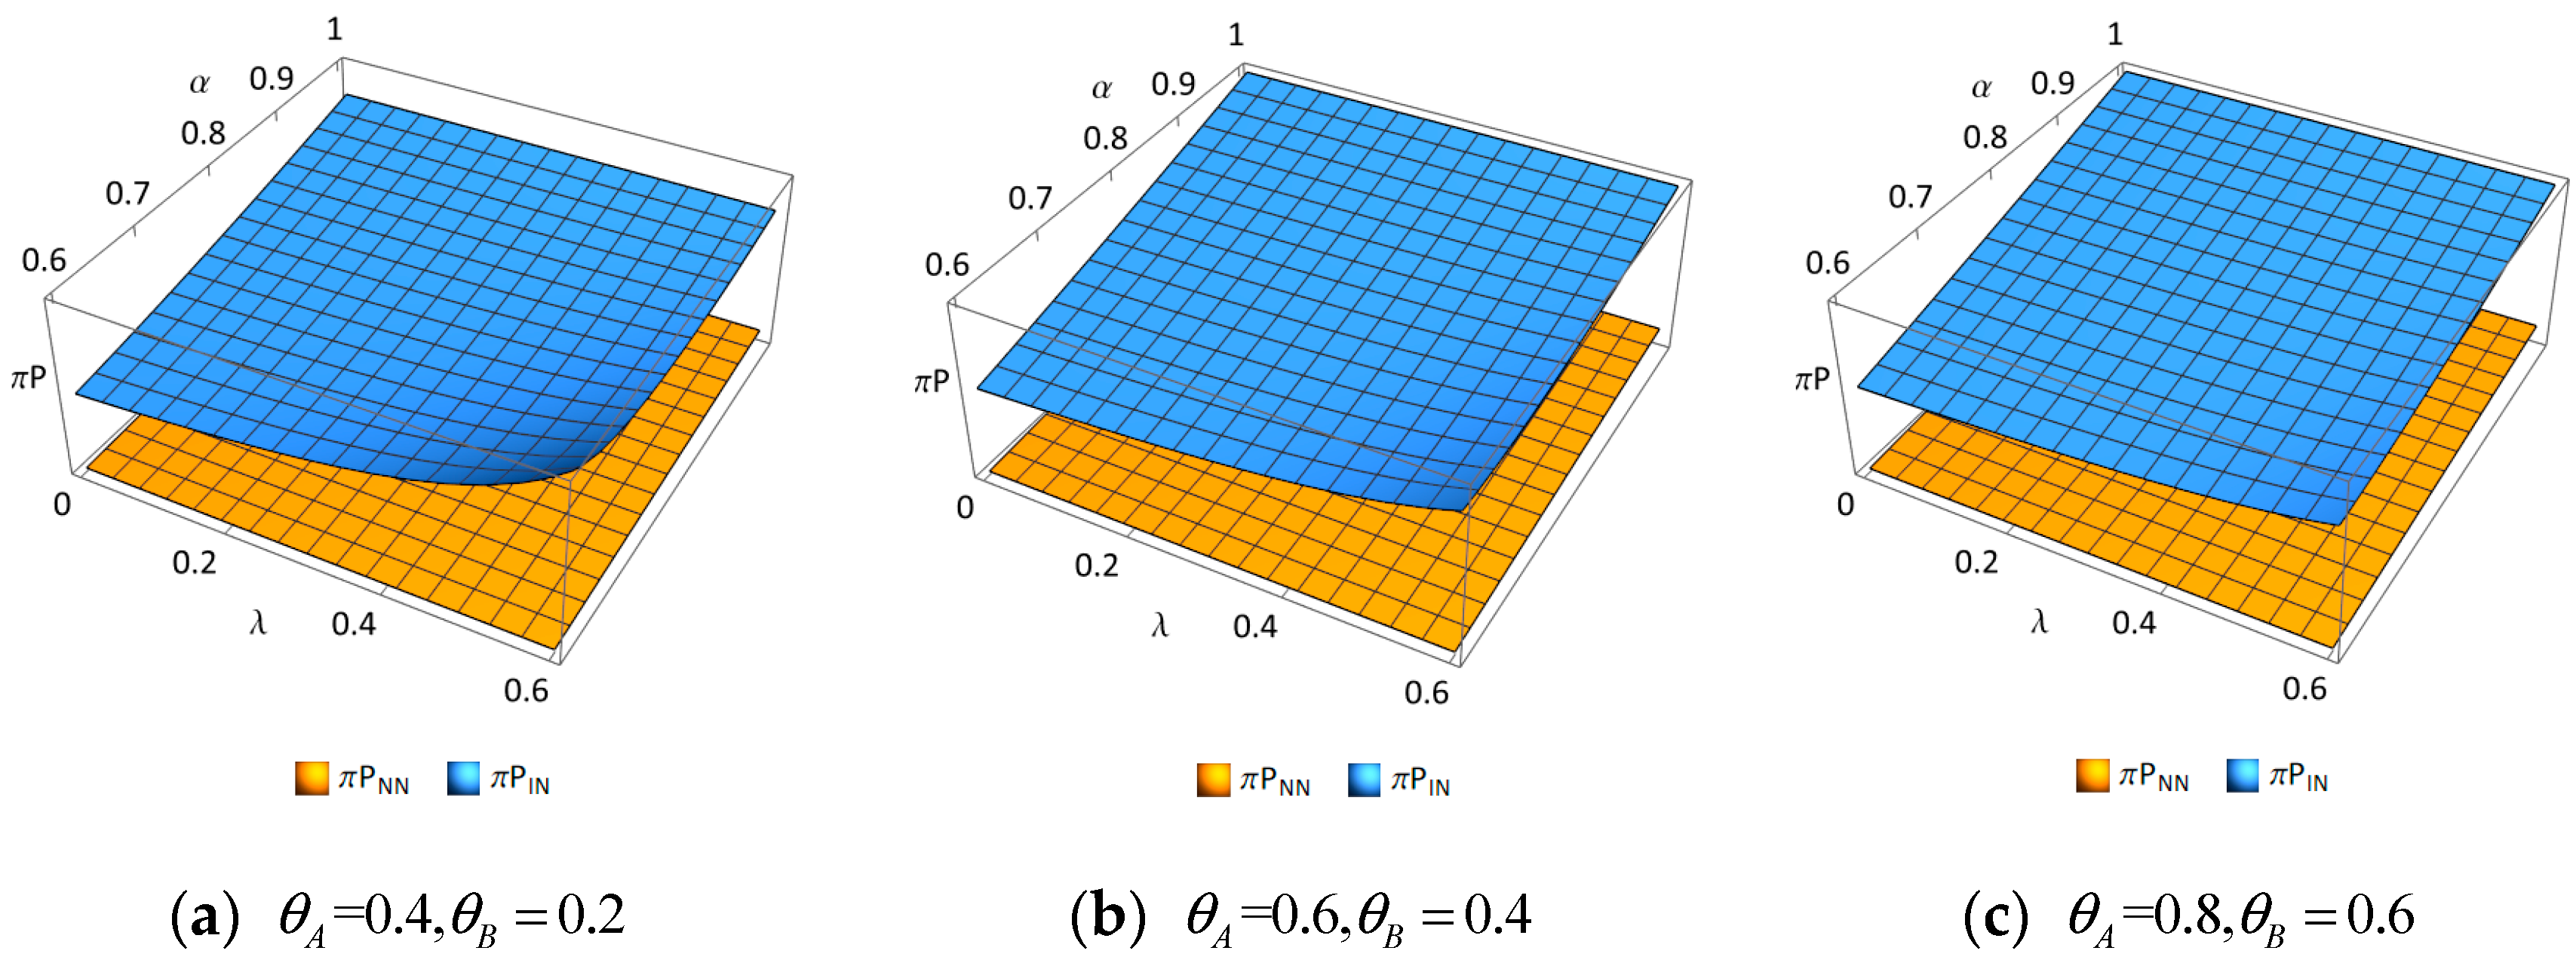
4.3. Analysis of the Introduction of PLs
- (i)
- Scenario NN vs. Scenario INif and ; if are large.
- (ii)
- Scenario NS vs. Scenario ISif and ; if ; if are large.
- (i)
- Scenario NN vs. Scenario INIf , .
- (ii)
- Scenario NS vs. Scenario ISIf and , ; .
- (i)
- Scenario NN vs. Scenario IN
- (ii)
- Scenario NS vs. Scenario IS
- (i)
- Scenario NN vs. Scenario INif is large; if is low and increases.
- (ii)
- Scenario NS vs. Scenario ISif is large; if is low and increases.
5. Conclusions
5.1. Main Findings
5.2. Managerial Insights
- (1)
- For e-commerce platforms: It is essential to proactively explore the introduction of a reselling mode to broaden business channels and effectively integrate supply chain resources. Furthermore, platforms should actively expand their sales modes by introducing private labels and establishing a diversified business ecosystem that incorporates agency selling, reselling, and PLs. This approach will better address the diverse needs of consumers while enhancing market competitiveness. Lastly, platforms must flexibly adjust coupon face values in response to changes in redemption rates, commission rates, and consumer sensitivity, thereby avoiding an over-reliance on coupon promotions. Taking industrial practice as an example, JD.com dynamically adjusts the face value and usage conditions of coupons based on users’ purchasing behaviors, consumption frequencies, and other relevant factors. For instance, to attract new or high-value users, JD.com may provide coupons with higher denominations, thereby encouraging first-time purchases or increasing purchase frequencies.
- (2)
- For brand owners: It is crucial to actively participate in the reselling mode of e-commerce platforms. By capitalizing on the channel advantages of these platforms, brands can broaden their market reach and target a wider consumer base—particularly price-sensitive consumers—thereby enhancing both their sales volume and revenue. Although the reselling mode may introduce price competition, brands can address this challenge by optimizing supply chain management, improving operational efficiency and service quality, and driving profit growth. Additionally, brand owners must focus on strengthening brand equity, elevating the brand image and consumer awareness, and cultivating brand loyalty to effectively compete with private-label offerings from e-commerce platforms. Furthermore, brands should closely monitor changes in coupon redemption rates and commission structures, maintain transparent communication with e-commerce platforms, and collaboratively develop strategic promotional plans.
5.3. Limitations and Future Research
Author Contributions
Funding
Data Availability Statement
Conflicts of Interest
Appendix A
- (1)
- Scenario NN: Since , then e-commerce platforms can always make optimal decisions based on the decisions of brand owners. Let , showing that . Substituting the above equation into , since , it can be seen that there is a unique maximum value for the brand’s profit. Let , showing that . Substituting the above equation into , we obtain the equilibrium results.
- (2)
- Scenario NS: The Hessian of is , Minor , Minor . The Hessian is negative definite and is jointly concave with respect to . Simultaneously solving gives the equilibrium as , . Substituting these two equations into , the Hessian of is , Minor , Minor . When , the Hessian is negative definite and is jointly concave with respect to . Simultaneously solving gives the equilibrium results.
- (3)
- Scenario IN: The Hessian of is , Minor , Minor . When , the Hessian is negative definite and is jointly concave with respect to . Simultaneously solve and let ; since , when , then ; it can be seen that there is a unique maximum value for the brand’s profit. Solving gives the equilibrium results.
- (4)
- Scenario IS: The Hessian of is , Minor . When , Minor . When , Minor . The Hessian is negative definite and is jointly concave with respect to . Simultaneously solving and substituting the solutions into , the Hessian of is , Minor , when , ; it can be seen that there is a unique maximum value for the brand’s profit. Solving gives the equilibrium results. □
- Scenario NN, ; , ; ; since , then .
- Scenario NS, , , ; , , , ; ; since , then .
- Scenario IN(1) ; if , we obtain . If , when , then . If , when , then ., same proof as above. , same proof as above.(2) Let , which is a quadratic function with respect to the opening up of . If , we obtainWhen , then ; when or , then .(3) .Since , then .
- Scenario IS(1) ; if , we obtain . If , when , then . If , when , then ., same proof as above. , same proof as above., same proof as above., same proof as above.(2) , let , which is a quadratic function with respect to the opening up of . If , we obtainwhen , then ; when or , then ., same proof as above., same proof as above.(3) .Since , then . □
- Scenario NN vs. Scenario IN(1) .Solving , we obtain , . Since , if , then . If , then . When and or and , then . When and or and , then . Here, we assumed .
- Scenario NS vs. Scenario IS(1) , same proof as above.(2) .Solving , we obtain , . If , then and . If , then and . Here, we assumed . □
- Scenario NN vs. Scenario IN(1) . is quadratic function with respect to the opening downward of . Solving , we obtain . Since , when , , and when or , .
- Scenario NS vs. Scenario IS(1) . Let . When , we obtain the solution to the equation: . Let ; if , then . Conversely, we have when . So, when and or and , we have . Then, when and or and , we have . Here, we assumed .(2) □
References
- The Development of the Online Retail Market in 2022. Available online: https://m.mofcom.gov.cn/article/xwfb/xwsjfzr/202301/20230103380919.shtml (accessed on 30 January 2023).
- Cai, Y.J.; Lo, C.K. Omni-channel management in the new retailing era: A systematic review and future research agenda. Int. J. Prod. Econ. 2020, 229, 107729. [Google Scholar] [CrossRef]
- Wang, X.; Chaolu, T.; Gao, Y.; Wen, Y.; Liu, P. Marketplace channel encroachment under private brand introduction of online platform. Int. J. Ind. Eng. Comput. 2023, 14, 1–12. [Google Scholar] [CrossRef]
- Chunyu, L.I.; Cuihua, Z.H.A.N.G.; Yong, M.A. Interaction Between Quality Investment and Private Label Encroachment in Different Sales Modes. J. Syst. Manag. 2024, 33, 849. [Google Scholar] [CrossRef]
- Wang, J.; Yan, Y.; Du, H.; Zhao, R. The optimal sales format for green products considering downstream investment. Int. J. Prod. Res. 2020, 58, 1107–1126. [Google Scholar] [CrossRef]
- Shen, Y. Platform retailing with slotting allowance and revenue sharing. J. Oper. Res. Soc. 2018, 69, 1033–1045. [Google Scholar] [CrossRef]
- Abhishek, V.; Jerath, K.; Zhang, Z.J. Agency selling or reselling? Channel structures in electronic retailing. Manag. Sci. 2016, 62, 2259–2280. [Google Scholar] [CrossRef]
- Li, G.; Zheng, Z.; Cheng, T.C.E.; Wang, W.; Wu, F. Agency selling or reselling: The impact of logistics service on selling mode choice. Transp. Res. Part E Logist. Transp. Rev. 2025, 193, 103849. [Google Scholar] [CrossRef]
- Alan, Y.; Kurtuluş, M.; Wang, C. The role of store brand spillover in a retailer’s category management strategy. Manuf. Serv. Oper. Manag. 2019, 21, 620–635. [Google Scholar] [CrossRef]
- Choi, S.C.; Turut, O. National brand’s competition with premium private labels: The role of context-dependent preferences. J. Bus. Res. 2023, 165, 114038. [Google Scholar] [CrossRef]
- Ke, W.; Zhou, X.; Lev, B.; Zhang, K. Agency, reselling, or hybrid mode? Competing with store brand. Transp. Res. Part E Logist. Transp. Rev. 2024, 184, 103487. [Google Scholar] [CrossRef]
- Wang, L.; Chen, J.; Song, H. Marketplace or reseller? Platform strategy in the presence of customer returns. Transp. Res. Part E Logist. Transp. Rev. 2021, 153, 102452. [Google Scholar] [CrossRef]
- Tian, L.; Vakharia, A.J.; Tan, Y.; Xu, Y. Marketplace, reseller, or hybrid: Strategic analysis of an emerging e-commerce mode. Prod. Oper. Manag. 2018, 27, 1595–1610. [Google Scholar] [CrossRef]
- Li, L.; Li, G. Integrating logistics service or not? The role of platform entry strategy in an online marketplace. Transp. Res. Part E Logist. Transp. Rev. 2023, 170, 102991. [Google Scholar] [CrossRef]
- Xu, X.; He, P.; Zhang, S. Channel addition from marketplace or reselling under regional carbon cap-and-trade regulation. Int. J. Prod. Econ. 2021, 236, 108130. [Google Scholar] [CrossRef]
- Pu, X.; Wang, Z.; Zhang, W. Optimal homing policy of the manufacturer facing competing platforms: The effect of selling formats. Int. J. Prod. Res. 2024, 62, 7382–7411. [Google Scholar] [CrossRef]
- Luo, H.; Zhong, L.; Nie, J. Quality and distribution channel selection on a hybrid platform. Transp. Res. Part E Logist. Transp. Rev. 2022, 163, 102750. [Google Scholar] [CrossRef]
- Tan, M.; Pei, F.; He, L.; Cheng, H.; Huang, S. Optimal decision-making of closed-loop supply chains in e-commerce platform considering sales cooperations under environmental effects and WEEE regulations. Int. J. Environ. Res. Public Health 2023, 20, 5724. [Google Scholar] [CrossRef] [PubMed]
- Yuan, X.; Sheng, W.; Wang, M.; Zhang, D. Logistics Service Selection Strategy of Green Manufacturers in Green Low-Carbon Supply Chain. Int. J. Environ. Res. Public Health 2023, 20, 3356. [Google Scholar] [CrossRef] [PubMed]
- Shopova, R. Private labels in marketplaces. Int. J. Ind. Organ. 2023, 89, 102949. [Google Scholar] [CrossRef]
- Chu, Q.; Zhang, Z.; Wu, T.J.; Zhang, Z. Interaction between online retail platforms’ private label brand introduction and manufacturers’ channel selection. J. Retail. Consum. Serv. 2025, 84, 104208. [Google Scholar] [CrossRef]
- Hara, R.; Matsubayashi, N. Premium store brand: Product development collaboration between retailers and national brand manufacturers. Int. J. Prod. Econ. 2017, 185, 128–138. [Google Scholar] [CrossRef]
- Wang, K.; Lin, J.; Zhang, Q.; Li, J. Store brand introduction under platform financing and competition. Transp. Res. Part E Logist. Transp. Rev. 2023, 176, 103209. [Google Scholar] [CrossRef]
- Yu, D.; Luo, C.; Wang, B.; Tian, X.; Zhou, X. Manufacturer technology investment: A bane or boon to the store brand encroachment. Transp. Res. Part E Logist. Transp. Rev. 2023, 176, 103188. [Google Scholar] [CrossRef]
- Li, Q.; Wang, Q.; Song, P. The effects of agency selling on reselling on hybrid retail platforms. Int. J. Electron. Commer. 2019, 23, 524–556. [Google Scholar] [CrossRef]
- Lyu, G.; Hu, H.; Zhuang, G. C2M strategies on an e-commerce platform under brand competition. Transp. Res. Part E Logist. Transp. Rev. 2023, 177, 103184. [Google Scholar] [CrossRef]
- Chen, P.; Zhao, R.; Yan, Y.; Li, X. Promotional pricing and online business mode choice in the presence of retail competition. Omega 2020, 94, 102085. [Google Scholar] [CrossRef]
- Zhen, X.; Xu, S.; Li, Y.; Shi, D. When and how should a retailer use third-party platform channels? The Impact of spillover effects. Eur. J. Oper. Res. 2022, 301, 624–637. [Google Scholar] [CrossRef]
- Yang, W.; Govindan, K.; Zhang, J. Spillover effects of live streaming selling in a dual-channel supply chain. Transp. Res. Part E Logist. Transp. Rev. 2023, 180, 103298. [Google Scholar] [CrossRef]
- Bauner, C.; Jaenicke, E.; Wang, E.; Wu, P.C. Couponing strategies in competition between a national brand and a private label product. J. Retail. 2019, 95, 57–66. [Google Scholar] [CrossRef]
- Hu, L.; Zhang, M.; Wen, X. Optimal distribution strategy of coupons on e-commerce platforms: Sufficient or scarce? Int. J. Prod. Econ. 2023, 266, 109031. [Google Scholar] [CrossRef]
- Li, Z.; Guan, X.; Mei, W. Coupon promotion and its cross-channel effect in omnichannel retailing industry: A time-sensitive strategy. Int. J. Prod. Econ. 2023, 258, 108778. [Google Scholar] [CrossRef]
- Li, H.; Chen, H.; Chai, J.; Shi, V. Private label sourcing for an e-tailer with agency selling and service provision. Eur. J. Oper. Res. 2023, 305, 114–127. [Google Scholar] [CrossRef]
- Niu, B.; Liu, J.; Zhang, J.; Chen, K. Promised-delivery-time-driven reselling facing global platform’s private label competition: Game analysis and data validation. Omega 2024, 123, 102990. [Google Scholar] [CrossRef]
- Xiao, M.; Gu, Q.; He, X. Selection of sales mode for E-commerce platform considering corporate social responsibility. Systems 2023, 11, 543. [Google Scholar] [CrossRef]
- Hemmati, M.; Ghomi, S.F.; Sajadieh, M.S. The impact of advertising and product quality on sales mode choice in the presence of private label. Int. J. Prod. Econ. 2024, 269, 109164. [Google Scholar] [CrossRef]
- Liu, R.L.; Sprott, D.E.; Spangenberg, E.R.; Czellar, S.; Voss, K.E. Consumer preference for national vs. private brands: The influence of brand engagement and self-concept threat. J. Retail. Consum. Serv. 2018, 41, 90–100. [Google Scholar] [CrossRef]
- Ryan, J.K.; Sun, D.; Zhao, X. Competition and coordination in online marketplaces. Prod. Oper. Manag. 2012, 21, 997–1014. [Google Scholar] [CrossRef]
- Yan, Y.; Zhao, R.; Liu, Z. Strategic introduction of the marketplace channel under spillovers from online to offline sales. Eur. J. Oper. Res. 2018, 267, 65–77. [Google Scholar] [CrossRef]
- Zhang, S.; Zhang, J.; Zhu, G. Retail service investing: An anti-encroachment strategy in a retailer-led supply chain. Omega 2019, 84, 212–231. [Google Scholar] [CrossRef]


| Variable | Description |
|---|---|
| Consumer valuation of goods | |
| The utility of purchasing the good from channel i for the type r consumer in | |
| Commission rates, | |
| Face value of coupons placed on e-commerce platform | |
| Coupon redemption rate, | |
| Coupon coefficients on individual store items, | |
| Consumer preference for different channels, | |
| Wholesale prices of goods | |
| Prices of goods in channel | |
| Consumer sensitivity to services | |
| Level of service provided by e-commerce platform | |
| Service investment cost factor | |
| The profit of (, where denotes the brand owner and denotes the platform) | |
| Subscript | , where indicates the reselling mode, indicates the agency selling mode, and indicates the PL |
| Variable | Scenario NN | Scenario NS | Scenario IN | Scenario IS |
|---|---|---|---|---|
| — | — | |||
| — | — | |||
| — | — | |||
Disclaimer/Publisher’s Note: The statements, opinions and data contained in all publications are solely those of the individual author(s) and contributor(s) and not of MDPI and/or the editor(s). MDPI and/or the editor(s) disclaim responsibility for any injury to people or property resulting from any ideas, methods, instructions or products referred to in the content. |
© 2025 by the authors. Licensee MDPI, Basel, Switzerland. This article is an open access article distributed under the terms and conditions of the Creative Commons Attribution (CC BY) license (https://creativecommons.org/licenses/by/4.0/).
Share and Cite
Lu, Z.; Si, Y.; Han, Z.; Ma, C. Research on Private Label Introduction and Sales Mode Decision-Making for E-Commerce Platforms Considering Coupon Promotion Strategies. Systems 2025, 13, 437. https://doi.org/10.3390/systems13060437
Lu Z, Si Y, Han Z, Ma C. Research on Private Label Introduction and Sales Mode Decision-Making for E-Commerce Platforms Considering Coupon Promotion Strategies. Systems. 2025; 13(6):437. https://doi.org/10.3390/systems13060437
Chicago/Turabian StyleLu, Zuoying, Yinyuan Si, Zhihua Han, and Chao Ma. 2025. "Research on Private Label Introduction and Sales Mode Decision-Making for E-Commerce Platforms Considering Coupon Promotion Strategies" Systems 13, no. 6: 437. https://doi.org/10.3390/systems13060437
APA StyleLu, Z., Si, Y., Han, Z., & Ma, C. (2025). Research on Private Label Introduction and Sales Mode Decision-Making for E-Commerce Platforms Considering Coupon Promotion Strategies. Systems, 13(6), 437. https://doi.org/10.3390/systems13060437