Abstract
Multimodal freight transport systems, integrating maritime, rail, and road modes, play a vital role in modern logistics but face elevated operational, human, and environmental risks due to their complexity and interdependencies. To address the limitations of conventional risk assessment methods, this study proposes a hybrid risk modeling framework that integrates fault tree analysis (FTA), dynamic fault trees (DFTs), and fuzzy logic reasoning. This approach supports the modeling of sequential failures and captures qualitative uncertainties such as human fatigue and inadequate training. The framework incorporates reliability metrics, including Mean Time to Failure (MTTF) and Mean Time Between Failures (MTBF), enabling the quantification of system resilience and identification of critical failure pathways. Application of the model revealed human error, particularly procedural violations, insufficient training, and fatigue, as the dominant risk factor across transport modes. Road transport exhibited the highest probability of risk occurrence (p = 0.9960), followed by rail (p = 0.9937) and maritime (p = 0.9900). By integrating probabilistic reasoning with qualitative insights, the proposed model offers a flexible decision support tool for logistics operators and policymakers, enabling scenario-based risk planning and enhancing system robustness under uncertainty.
1. Introduction
Multimodal freight transport has emerged as a critical domain within logistics and supply chain systems, integrating multiple transport modes—maritime, rail, and road—to optimize efficiency and cost [1]. However, this integration introduces a complex risk environment characterized by overlapping operational, technical, and environmental uncertainties. In this context, risk analysis becomes essential for maintaining the reliability and resilience of such interconnected systems [2].
Traditional approaches to transport risk assessment have relied on static models or historical data analysis, which are limited in their ability to capture dynamic and interdependent risk propagation across subsystems. To overcome these limitations, fault tree analysis (FTA) has gained prominence as a deductive, logic-based method for identifying and structuring failure causes within complex systems. FTA provides a visual and logical framework to trace the path from basic failure events to a system-level undesired outcome, such as cargo loss, transport disruption, or safety hazards [3,4,5].
While FTA has proven effective in domains such as aerospace and nuclear engineering, its applicability to logistics and multimodal transport has grown in recent years. Researchers have adapted the method to model human error, technical failures, and infrastructure-related disruptions in transport operations. However, Standard Fault Trees (SFTs) face limitations when the temporal sequence or conditional dependencies between failures play a significant role. To address this, dynamic fault tree (DFT) models have been introduced. DFT analysis extends the classical approach by incorporating time-dependent behavior, sequence-enforcing gates, and probabilistic modeling of event interdependencies, thereby allowing for a more realistic representation of cascading risks in logistics systems [6].
Moreover, in real-world transport systems, uncertainties, particularly those related to human performance or weather conditions, cannot always be precisely quantified. This has led to the integration of fuzzy logic into fault tree structures, enabling analysts to use probabilistic intervals rather than fixed values [7]. Studies employing fuzzy fault trees have demonstrated improved capacity to assess subjective or imprecise risks in transport operations, especially when expert judgment supplements limited statistical data [8].
In parallel, the use of quantitative reliability indicators, such as Mean Time to Failure (MTTF) and Mean Time Between Failures (MTBF), has supported operational decision-making in predictive maintenance and system sustainability. These metrics offer practical tools to evaluate component longevity and system resilience, particularly when integrated with FTA/DFT frameworks [9,10].
Recent research has emphasized that the human factor remains a dominant contributor to risk across all transport modes. Whether through driver inexperience, fatigue, or communication failures, human-related causes often act as catalysts for more complex failure chains. Environmental factors, including extreme weather and visibility conditions, also introduce significant risk, particularly in maritime and road transport. Infrastructure quality, both in terms of design and material degradation, continues to affect system vulnerability, especially in older railway networks [11,12].
The fuzzy fault tree model developed in this study offers a flexible decision support framework for both logistics companies and regulatory bodies aiming to enhance safety and operational resilience. By incorporating qualitative human factors, such as fatigue, inadequate training, and communication breakdowns, which are often overlooked in traditional risk tools, this model aligns closely with the real-world complexities of logistics environments.
Recent studies, such as Tunçel et al. (2021), extended the application of fuzzy fault trees in maritime contexts, while Aslansefat et al. (2020) demonstrated dynamic fault tree applications in railway systems [6,8]. These approaches support our use of a hybrid model in logistics systems with complex interdependencies. While Bayesian networks and Dempster–Shafer theory have been employed for transport risk modeling, fuzzy logic offers superior interpretability and flexibility for representing qualitative uncertainties, such as human fatigue or training inadequacies [13,14].
For logistics companies, this model serves as a proactive risk analysis tool that can be integrated into safety management systems (SMSs). Managers can use it to simulate how combinations of risk factors influence the likelihood of human error or system failure. For instance, a distribution center might apply the model to assess risk under varying shift schedules, training policies, or staff-to-task ratios. This allows for scenario-based planning, enabling data-informed decisions around workforce management, resource allocation, or the design of fatigue mitigation strategies [15].
From a regulatory perspective, the model supports risk-based compliance and inspection regimes. Authorities, such as transport safety boards or occupational health regulators, can use it to identify systemic weaknesses in logistics operations before accidents occur. By quantifying subjective risks and linking them to fault pathways, the model helps prioritize high-risk areas, such as undertrained staff or high-turnover shifts, and justify targeted interventions or policy revisions [16]. Additionally, regulators can promote the use of such models as part of industry-wide safety benchmarking and self-assessment tools.
Importantly, the fuzzy logic structure of the model enables the inclusion of expert knowledge and real-time updates, making it adaptive to changing operational conditions. This is especially relevant in dynamic logistics networks, where traffic congestion, demand fluctuations, or labor shortages can rapidly shift the risk landscape [17]. Over time, companies can calibrate the model using operational data to refine fuzzy sets and improve predictive accuracy, transforming it from a diagnostic tool into a living safety analytics system.
In sum, the fuzzy fault tree model offers a bridge between qualitative risk understanding and quantitative decision-making. Its adoption by logistics operators and regulators could significantly improve human reliability analysis, operational forecasting, and strategic safety planning in a sector characterized by high complexity and human–system interdependencies. By integrating FTA, DFTs, fuzzy analysis, and quantitative metrics, the current study builds upon and extends the existing body of research. It offers a multi-layered and adaptable framework for evaluating and mitigating operational risks in multimodal freight systems, bridging the gap between academic modeling and real-world logistics challenges.
2. Research Objectives: Addressed Gaps
In the context of increasing complexity and interdependence across freight transport systems, risk management in multimodal logistics requires models capable of integrating both deterministic and uncertain variables [18]. Traditional risk analysis techniques such as static fault tree analysis (FTA) have limited capacity to account for the dynamic, sequential, and probabilistically uncertain nature of failures across transport modes [4,9,10,19,20].
This study hypothesizes that the integration of dynamic fault trees (DFTs) with fuzzy logic-based modeling and reliability indicators such as Mean Time to Failure (MTTF) and Mean Time Between Failures (MTBF) will result in a more comprehensive, flexible, and decision-oriented risk assessment model for multimodal freight systems [19,20,21]. By simulating complex failure pathways and quantifying both subjective and probabilistic risk factors, the proposed model is expected to better capture real-world uncertainties than existing tools. The objectives of this research are threefold:
- To develop an integrated FTA-DFT–fuzzy framework for identifying, structuring, and quantifying risks across maritime, road, and rail segments of multimodal transport;
- To apply quantitative and semi-quantitative methods to calculate system reliability and sensitivity, identifying critical risk nodes and high-impact failure pathways;
- To compare the aggregated risk exposure across transport modes, thereby informing strategic decision-making for logistics operators and policymakers.
This study addresses several gaps in the existing research:
- -
- First, most existing transport risk models do not integrate dynamic fault analysis with fuzzy uncertainty modeling—this integration is crucial for systems influenced by human and environmental variability, where traditional deterministic methods fail to capture the inherent uncertainties [8,22,23];
- -
- Second, existing approaches often overlook comparative analysis across transport modes using standardized risk metrics, limiting their utility for multimodal integration [2,24,25];
- -
- Third, while fuzzy fault trees have been explored in isolated studies, few have coupled this with sensitivity analysis and system failure time estimation (MTTF/MTBF) to support operational planning and system optimization [6,26].
By bridging these gaps, this research contributes to the development of a modular, adaptable, and operationally relevant framework that can be extended into real-time applications and AI-based predictive analytics in future work. Although recent advances in artificial intelligence (AI) and machine learning (ML) have led to the development of numerous predictive models for transport safety and infrastructure risk assessment. These models typically leverage large-scale datasets and employ algorithms such as neural networks, random forests, support vector machines (SVMs), or gradient boosting techniques to identify hidden patterns, forecast failures, and recommend interventions. For instance, ML has been applied to predict traffic accidents based on real-time sensor data, optimize route planning under uncertain weather, or forecast equipment failures in railway systems using time-series deep learning (e.g., LSTM models). While these approaches excel at autonomous pattern recognition and real-time decision support, they are often criticized for being “black-box” systems, offering little insight into the causal relationships behind risk propagation. This lack of interpretability can be a significant limitation in safety-critical domains such as transportation, where understanding the underlying mechanics of system failure is as important as predicting its occurrence. Moreover, many AI/ML models require extensive training data and constant retraining, which can be challenging in multimodal logistics environments where human factors and qualitative uncertainties dominate, and where consistent data collection is uneven across modes or regions [27].
In contrast, the fuzzy fault tree framework proposed in this study offers a transparent, explainable, and modular approach to risk assessment. It enables analysts to model subjective and imprecise variables—such as fatigue, inadequate training, or environmental variability—through linguistic variables and fuzzy sets, without requiring large amounts of historical data. By integrating DFTs and quantitative reliability metrics (MTTF/MTBF), the proposed model maintains both logical traceability and predictive depth, supporting structured reasoning even under uncertainty.
3. Methods and Research Methodology
3.1. Qualitative vs. Quantitative Analysis
Fault tree analysis (FTA) supports two complementary analytical approaches: qualitative and quantitative analysis. Each provides distinct insights into the structure and severity of potential system failures, enhancing the ability to make informed decisions in risk management, particularly in the context of multimodal goods transport.
The qualitative analysis focuses on identifying the minimal cut sets, which are the smallest possible combinations of basic events that, if they all occur, would be sufficient to trigger the top event. This form of analysis does not require numerical data but instead emphasizes the logical structure of the system’s vulnerabilities. By identifying these critical paths to failure, stakeholders can determine which components, processes, or operational conditions are most significant in contributing to risk. This enables prioritization of mitigation efforts, such as targeted maintenance, staff training, or procedural changes.
In contrast, the quantitative analysis requires the assignment of probabilities to the basic events, either through historical data, expert judgment, or probabilistic modeling. These values are then used to calculate the overall likelihood of the top event occurring. This probabilistic evaluation allows for a comparative risk assessment between different scenarios, system designs, or operational choices. In the context of multimodal transport, this could involve comparing the risk levels associated with different routes, handling procedures, or modal transitions (e.g., port to rail terminal).
By combining both qualitative and quantitative methods, FTA offers a robust framework for understanding not only how system failures might occur but also how likely they are, thereby enabling both strategic planning and operational safety improvements. FTA proves particularly effective in the evaluation of complex and interconnected systems, such as those found in multimodal transport of goods. In these systems, cargo typically transitions between various modes of transport, such as maritime, rail, and road, each introducing its own operational characteristics, failure modes, and risk factors. These interdependencies and modal interfaces create layers of complexity that demand a structured analytical approach to ensure reliability and safety. By applying FTA in this context, analysts can systematically model the failure pathways across the entire multimodal chain, enabling a comprehensive assessment of how localized issues can propagate and contribute to broader system disruptions. For instance, a minor mechanical delay at a rail terminal can lead to missed shipping schedules, contract penalties, or even perishable cargo losses, particularly when time-sensitive logistics are involved.
3.2. Model Applicability to Multimodal Transport
FTA helps to identify vulnerabilities at critical junctions, such as port operations, cargo transfer points, or customs control, where misalignment, delays, or communication failures can trigger cascading effects. Furthermore, it enables a holistic evaluation of how various elements, including infrastructure reliability, human performance, and organizational procedures, combine to influence overall system behavior [27,28,29]. Importantly, the insights generated from FTA support the development of targeted risk reduction strategies. These may include the introduction of redundant systems or backup processes, the optimization of operational workflows, improved training programs for personnel, or predictive maintenance protocols for transport equipment. By proactively addressing the most influential risk contributors, organizations can significantly enhance the resilience and efficiency of their multimodal transport operations.
The FTA method offers a range of advantages that make it a valuable tool for risk assessment, especially in complex domains such as multimodal transport. At the same time, it presents certain limitations that must be acknowledged to ensure its correct application and interpretation. Among its primary benefits, FTA provides a clear and intuitive visual representation of how risks propagate within a system. By mapping the logical relationships between events, it enables decision-makers and analysts to trace the origin of potential failures and understand how seemingly minor faults may contribute to major disruptions. This transparency enhances communication among stakeholders and supports more informed decision-making.
Additionally, FTA plays a crucial role in preventive planning by highlighting critical system weaknesses, i.e., areas where a single failure could compromise the entire transport chain. Through early identification of such vulnerabilities, preventive measures can be implemented to mitigate or eliminate risks before they manifest operationally.
Another significant advantage of FTA lies in its ability to integrate both technical and organizational factors within a single analytical framework. This dual perspective allows for a more comprehensive understanding of risk, taking into account not only mechanical and infrastructural components but also human error, procedural shortcomings, and management decisions.
However, the method is not without its limitations. One of the main challenges is that developing an accurate and meaningful fault tree requires specialized expertise, both in the structure of the system being analyzed and in the methodology itself. An incomplete or incorrectly constructed tree may lead to misleading conclusions. Furthermore, FTA typically assumes statistical independence among failure events, a simplification that does not always hold in real-world scenarios where cascading failures or common-cause events can occur. This assumption can limit the accuracy of probabilistic assessments.
Lastly, when applied to large-scale or highly interconnected systems, the fault tree can become excessively complex and data-intensive, making it difficult to manage or interpret without robust computational tools and significant input data. Despite these challenges, when applied correctly, FTA remains a powerful and versatile method for systematically understanding and managing risk in multimodal transport systems.
3.3. Method Extension Through Fuzzy Logic Modeling
To better accommodate uncertainty in human-centric and environmental risk factors, fuzzy logic modeling was integrated within the FTA framework. Unlike traditional binary logic, fuzzy sets allow for the definition of linguistic variables, such as “Low-Fatigue”, “Medium-Fatigue”, and “High-Fatigue”, characterized by gradual membership rather than sharp boundaries [13,14,30]. For instance, fatigue can be modeled through triangular membership functions.
This modeling was applied to risk nodes, such as inadequate training, fatigue, or weather conditions, where crisp probabilities are replaced with intervals or fuzzy rules (e.g., IF fatigue is high AND training is low, THEN risk is very high). This makes the risk model more adaptive and robust in the face of subjective expert judgments and imprecise measurements [8].
In this study, fuzzy variables were defined through triangular membership functions, a widely used technique because of its simplicity, computational efficiency, and interpretability. The variable fatigue, which is one of the key sub-nodes under the human factor risk category (M1.4), was modeled using three fuzzy sets: Low-Fatigue, Medium-Fatigue, and High-Fatigue. Each set was described by a triplet (a, b, c) that determines its base and peak values within the domain [0, 10]. This approach transforms numerical or expert-judged input values into degrees of membership, making it possible to reason about fatigue without requiring exact data. The same methodology was used for other qualitative nodes, such as M1.3 (inadequate professional training) and M3.35 (weather conditions).
Based on the risk subcategories established in the fault tree structure, a fuzzy rule base was constructed using IF–THEN statements to model causal dependencies between risk factors. These rules combine expert knowledge and empirical logic into a decision support structure. Examples of rules used in current fuzzy modeling include the following:
- Rule 1: IF fatigue is high AND training level is low, THEN risk of human error is very high;
- Rule 2: IF weather conditions are severe AND visibility is low, THEN environmental risk is high;
- Rule 3: IF fatigue is low AND training is high, THEN risk of human error is low.
These rules align with the logical paths defined in the standard and dynamic fault trees in the next sections of the present research, particularly those involving sequence connectors or fuzzy nodes, such as M1.3 and M1.4. The logical operators used in the fuzzy rule evaluation included AND (interpreted as the minimum operator—min) and OR (interpreted as the maximum operator—max). This allowed the model to reflect real-world interdependencies without rigid numerical boundaries, making it more adaptive to varying logistics environments and workforce conditions.
The fuzzy modeling technique was chosen to be applied in the present research because of the following:
- -
- Its ability to represent vague concepts, like fatigue, poor training, or visibility, through linguistic variables;
- -
- Its ability to translate expert knowledge into structured rules within a probabilistic framework;
- -
- Its ability to operate within the same structure as the fault tree, maintaining consistency with both the standard (FTA) and dynamic (DFT) models used in this research.
Previous studies have already validated the applicability of fuzzy fault trees in transport risk domains, either in maritime operations or for oil storage risk analysis [8,16]. The use of triangular membership functions and centroid defuzzification is also supported by reliability modeling frameworks from Zio (2009) and Ghasemi et al. (2019), confirming their scientific robustness [13,14,17].
To strengthen the practical dimension of the proposed hybrid framework, we developed a structured data model that supports both the quantitative and qualitative nature of risk variables. The risk assessment process is based on a two-level hierarchical structure: main categories (e.g., human factors, technical failures, environmental conditions) and sub-risks (e.g., driver inexperience, brake malfunction, poor visibility). Each risk item was evaluated using a mix of statistical data from national safety reports and expert assessments from practitioners in the transport and logistics sector.
In cases where precise numeric values were unavailable, expert input was translated into linguistic terms, such as low, medium, or high, and converted into triangular fuzzy numbers using standard membership functions [28]. Each input was weighted according to its perceived criticality and frequency of occurrence, based on prior studies in transport safety modeling [19,31]. These weights were normalized using the following aggregation Formula (1). This computation provided a fuzzy-weighted average risk score for each component, which was then propagated through the fault tree structure. Logical gate operations (AND/OR) were handled using fuzzy logic rules to model interactions between sub-events. This enabled the framework to reflect not only probabilistic dependencies but also uncertainty stemming from human judgment and incomplete information, critical in real-world multimodal systems where failure events are rarely isolated.
The final output of the model consisted of defuzzied risk values for each transport mode, which were subsequently compared to identify high-priority failure pathways and inform mitigation strategies. By integrating fault logic with fuzzy inference, the framework supports nuanced, multi-dimensional risk assessments adaptable to variable data quality, a feature increasingly emphasized in the recent transport safety literature [18,21].
3.4. Research Methodology
The conceptual research methodology comprised the sequential structure of the integrated risk analysis framework developed in this study and applied by the authors in the present paper approach, as follows (Figure 1):
- Data collection—The authors aggregated statistical, empirical, and expert-sourced data on human, technical, and environmental risk factors across maritime, rail, and road transport.
- FTA modeling (Standard and Dynamic)—fault tree analysis (FTA) and dynamic fault trees (DFTs) were used to decompose system failures into hierarchical risk paths using logical gates and event dependencies. By DFTs, the FTA was enhanced by modeling time-dependent and sequence-based dependencies using specialized logic gates (e.g., SEQ, PAND). This reflects real-world event progression, such as poor maintenance causing delayed failures in transport systems.
- Fuzzy extension (FFTA)—fuzzy extension was used to transform subjective or imprecise data into fuzzy linguistic variables and apply fuzzy rule bases for inferential reasoning under uncertainty.
- Quantitative metrics—the authors calculated key reliability metrics, such as Mean Time to Failure (MTTF) and Mean Time Between Failures (MTBF), and performed sensitivity analyses to quantify system reliability and identify high-impact nodes.
- Strategic recommendations—Technical outputs were converted into actionable insights for decision-makers, including infrastructure upgrades, personnel training, and digital monitoring systems.
The above stages represent the iterative phases developed using the methodology flowchart shown in Figure 1. This research conceptual framework reflects, step by step, how the hybrid model evolved from data collection to risk quantification.
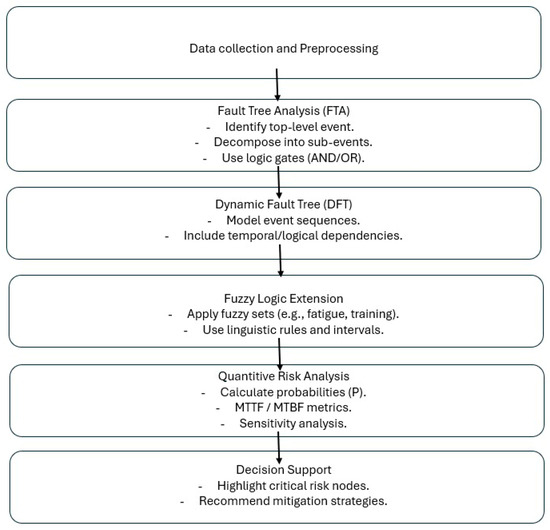
Figure 1.
Conceptual framework: hybrid risk modeling process—the research methodology flowchart (source: authors’ contribution).
Figure 1.
Conceptual framework: hybrid risk modeling process—the research methodology flowchart (source: authors’ contribution).
In terms of our research contribution to the field, this study positions itself at the intersection of qualitative and probabilistic risk modeling, contributing a novel hybrid approach to multimodal freight transport analysis. While prior studies explored FTA or fuzzy fault trees in isolation, this model uniquely integrates dynamic sequences, probabilistic intervals, and system reliability indicators into a unified pipeline. It extends the existing frameworks by offering a comparative, quantifiable assessment across transport modes, a significant step toward adaptive and AI-compatible risk management systems.
4. Case Study of Risk Analysis on Maritime, Road, and Rail Components of Multimodal Transports
4.1. Maritime Risks Analysis
The fault tree analysis method was applied to the maritime component of multimodal transport, where the risks of accidents or damages associated with the transportation of goods are attributed to each branch of the fault tree based on a structured risk analysis. Initially, both the traditional FTA method and the dynamic fault tree approach were used, as the latter allows for modeling of risk propagation based on sub-risks related to human factors, environmental influences, and vessel-related conditions.
For the risk analysis specific to the maritime segment, numerical values were assigned, presented in Table 1, based on data collected from the sources referenced in Table 2. The percentage values related to human factors and environmental risk variables were adapted by the authors to better reflect the specific conditions analyzed and their actual impact within the context of multimodal transport. This adaptation aims to define the actual magnitude and influence of each factor within the total risk, based on the authors’ integration of multiple sources and contextual adjustments to reflect the specific operational conditions in multimodal maritime transport [32]. The primary data sources included the following:
- -
- The EMSA’s detailed analysis of contributing factors in maritime accidents during the period 2014–2022 [33,34];
- -
- Reports by the Romanian Naval Authority from 2024 (overview of navigation incidents and accidents in Romania between 2019–2023)—collected by the authors through direct interviews [35];
- -
- An IGP&I Pilotage Report—Report on P&I Claims Involving Vessels under Pilotage, 1999–2019 [36];
- -
- A report titled Risk Influencing Factors in Maritime Accidents—An Exploratory Statistical Analysis of the Norwegian Maritime Authority Incident Database [37];
- -
- Reports on risk influencing factors processed from the literature review.
The data were synthesized to evaluate the impact of various categories and subcategories of risk on maritime incidents and accidents across all types of seagoing vessels. This evaluation was performed using a mathematical modeling approach based on weighted average calculations, with methodological adjustments to account for relevance, sample size, and variability in the analyzed datasets [38,39].
The specific percentage values associated with each risk subcategory were aggregated using the weighted mean method, where the weight reflects the relevance of each contributing study in terms of sample size, according to the following relation:
where
M = the weighted average of the percentage values;
= the percentage value of each risk subcategory;
= the weighting factor assigned based on the scope and accuracy of the data provided by each source;
= the number of identified sources;
= the set of sources referencing the analyzed risk subcategories;
W = the set of distinct weights (
The frequency of = the number of sources associated with each distinct weight ().
Each literature source from which the relevant data were extracted was assigned a unique identifier (S1, S2, ..., S16). Weighting scores were allocated on a scale from 1 to 5, where 5 indicates the highest level of relevance and reliability, in accordance with the evaluation criteria presented in Table 1.

Table 1.
Weights assigned to data sources for maritime accident statistics (source: authors’ contribution based on the data from the literature review).
Table 1.
Weights assigned to data sources for maritime accident statistics (source: authors’ contribution based on the data from the literature review).
| Source ID | Source (APA-Style) | Risk Subcategory | Reported Value (%) | Weight (1–5) | Justification for Weighting |
|---|---|---|---|---|---|
| S1 | European Maritime Safety Agency. (2023). Annual Overview of Maritime Accidents 2014–2022. Brussels: EMSA. [34] | Human Behavior | 53.60 | 5 | Recent, official EU dataset; EMSA data are comprehensive and directly cover fatigue-related contributory factors in casualties. |
| S2 | European Maritime Safety Agency. (2022). Analysis of Maritime Risk Indicators. Brussels: EMSA. [33] | Human Behavior | 51.17 | 5 | Credible, current EMSA report; detailed coverage of human factor risks including procedural and training issues. |
| S3 | Romanian Naval Authority. (2023). Incident Reports on Romanian Maritime Sector (2019–2023). Bucharest: ANR. [35] | Personnel Negligence | 58.19 | 5 | National regulatory source; data derived from real local cases; aligns with the Romanian maritime operational context. |
| S4 | Bogalecka, A. (2024). Collision and Contact—Analysis of Accidents at Sea [40] | Human Behavior | 42.33 | 4 | Recent academic research, regionally relevant; good methodological transparency, but limited to Baltic-specific data. |
| S5 | Tunçel, G., Akyuz, E., and Arslan, O. (2024). Maritime fuzzy risk analysis. Sustainability, 14(9) [8] | Fatigue | 31.83 | 4 | Peer-reviewed, Scopus-indexed article applying fuzzy logic to maritime safety; covers human–environment interaction risks. |
| S6 | Lei, C., and MacKenzie, C. A. (2021). System risk in maritime engineering. Int. J. Maritime Research, 14(2), 123–136. [5] | Equipment Age | 45.82 | 4 | Academic source with good modeling detail; not focused on fatigue but relevant for system degradation interdependence. |
| S7 | Maritime Industry Watch. (2020). Global Maritime Risk Trends. London: MIW, UNCTAD, (2024). Review of Maritime Transport 2020–2024. [41] | Inadequate Training | 21.19 | 1 | Industry whitepaper with unclear data provenance; included for breadth, not for weight in conclusions. |
| S8 | Kowalska, J. (2022). Communication gaps in seafaring. International Maritime Health, 73(3), 101–108. [42] | Poor Communication | 14.81 | 2 | Niche journal; addresses mental workload and seafarer stress but lacks broader empirical scope. |
| S9 | Port Health and Safety Leadership Group (2022). Building a fatigue risk management system: Guidelines. [43] | Fatigue | 31.85 | 3 | Sectoral report; good thematic alignment but not peer-reviewed; partial methodology disclosure. |
| S10 | Det Norske Veritas. (2023). DNV Maritime Safety Annual Review. Oslo: DNV. [44] | Technical Failures | 40.00 | 5 | Major classification society with validated empirical data; essential for cross-checking human vs. system failures. |
| S11 | Chen, T. (2016). Low-visibility factors in maritime engineering. Int. J. Maritime Engineering, 13(1), 43–54. [45] | Visibility | 8.66 | 2 | Dated and more focused on navigation/optical risks; included for environmental context, not human factor directly. |
| S12 | American Bureau of Shipping. (2022). ABS Maritime Incident Review. Houston, TX: ABS. [46] | Hazardous Materials Handling | 24.00 | 5 | Authoritative source; supports cross-validation of fatigue vs. hazardous procedures influence on incidents. |
| S13 | World Maritime University. (2023). Fleet Aging and Risk Factors in Maritime Operations. Malmö, Sweden: WMU. [47] | Ship Age | 29.10 | 4 | Academic institutional source; aligns with fatigue indirectly via physical strain and ship maintenance cycles. |
| S14 | Allianz Global Corporate and Specialty. (2023). Safety and Shipping Review. Munich: AGCS. [48] | Wind Conditions | 47.27 | 4 | Insurance-based dataset with solid actuarial logic; indirectly contributes to understanding fatigue through weather stress. |
| S15 | International Group of P&I Clubs. (2019). Pilotage Claims Review 1999–2019. London: IGP&I. [36] | Violation of Rules/Procedures | 38.60 | 4 | Historical data; strong insight into human error frequency under routine strain, including fatigue. |
| S16 | Norwegian Maritime Authority. (2015). Risk Factors in Maritime Accidents: Statistical Review. Oslo: NMA. [49] | Hazardous Materials Handling | 7.66 | 4 | Older but high-quality data on human–environment interaction; supports triangulation of fatigue’s systemic effects. |
The risk analysis presented in this study integrates heterogeneous data derived from a wide range of sources, including official reports from European agencies, national Romanian authorities, academic journals, and maritime industry studies. Because of the variability in source origin, publication standards, and methodological transparency, a weighting scheme was introduced to ensure that each data point contributed proportionally to its credibility and relevance in the risk aggregation process. Each source was assigned a weight ranging from 1 (lowest) to 5 (highest). The attribution of weights was based on four primary criteria:
- -
- Institutional credibility—Sources published by recognized authorities, such as the European Maritime Safety Agency (EMSA) and the Romanian Naval Authority (ANR), or classification societies, like DNV and ABS, were given the highest score (5), reflecting their authoritative data validation protocols and sectoral mandates.
- -
- Update recency—Recently published reports (post-2020) were scored higher (4–5), while older sources (e.g., published before 2015) received lower scores (1–2), particularly when no updates or follow-ups were available—this temporal weighting ensured that current risk trends are more influential in the calculation.
- -
- Methodological transparency—Reports that clearly documented their data collection, statistical methods, and sample sizes were favored (score 4–5). In contrast, sectoral white papers or professional reports lacking methodological detail were scored lower (2–3), despite containing potentially useful qualitative insights.
- -
- Scope and relevance—Publications with regional or global maritime coverage and those addressing the specific subcategories under investigation (e.g., fatigue, communication, hazardous material handling) were prioritized over those with narrower or tangential focus areas.
Following these parameters, the values in the next tables were therefore calculated on the following weighting scale:
5—Highly credible, recent, and methodologically transparent reports from official EU agencies (e.g., EMSA, DNV), peer-reviewed sources, high-impact journals, and national authorities with statistical validation that directly address fatigue or related human risk factors;
4—Credible academic or institutional sources, published in the last 5 years, that are relevant but with some limitations (e.g., regional focus, partial data disclosure, or indirect relation to fatigue);
3—Sectoral or technical reports, not peer-reviewed but thematically aligned and current with partially disclosed methodologies;
2—Outdated or less transparent data, or focused on adjacent but not core variables (e.g., visibility, communication);
1—Minimal methodological transparency, older, not peer-reviewed, or lacks clear relevance to fatigue; included only for completeness.
The weighted means used in the risk modeling (as listed in Table 1 and Table 2) were computed using a standard weighted average formula. The full data used for these calculations, including the reported percentage values, source identifiers, assigned weights, and rationale, are disclosed in Table 1. This table provides transparency on how sub-risk values, such as “human behavior” (e.g., 53.6% from EMSA, weighted at 5) and “fatigue”, contributed to the aggregated estimates.
The goal of this weighting architecture was to balance representativeness and data quality, allowing for rigorous integration of mixed-method evidence while respecting the relative strength of each source. This ensured that the resulting risk estimates were not unduly influenced by low-quality or outdated data.
For each risk subcategory, the weighted average value (M) was calculated according to Formula (3), as follows:
- For the subcategory “human behavior”, within the main risk category “human factor”:
Subsequently, the same weighted average calculation method was applied to the remaining risk subcategories analyzed within the maritime component, resulting in the values presented in Table 2.
Based on the analysis of the results presented in Table 2, the following conclusions can be drawn:
- Ship age and poor communication, although frequently cited as common sources of maritime incidents and accidents, account for the lowest percentage of incidents among those analyzed in the referenced sources—27.08% and 27.14%, respectively;
- Over 50% of the incidents included in the 16 statistical sources examined were primarily caused by personnel negligence (51.68%) and violations of rules and procedures (55.29%).
These findings underscore the need for more rigorous human resource selection as well as enhanced training and awareness programs to better educate personnel and reduce human error in maritime operations.
Table 2.
Average risk values related to maritime accident cases obtained using the weighted mean method (source: authors’ statistical data processing).
Table 2.
Average risk values related to maritime accident cases obtained using the weighted mean method (source: authors’ statistical data processing).
| Main Risk | Risk Subcategories | Source Scores and Risk Values | Weighted Mean |
|---|---|---|---|
| Human factor | Human Behavior | S1 (5): 53.6%; S2 (5): 51.17%; S3 (5): 61.2%; S4 (4): 42.33%; S5 (4): 41.66%; S6 (4): 45.82%. | 49.97% |
| Personnel Negligence | S1 (5): 48.12%; S2 (5): 53.48%; S3 (5): 58.19%; S7 (1): 28.0%. | 51.68% | |
| Inadequate Professional Training | S1 (5): 37.6%; S2 (5): 45.38%; S7 (1): 21.19%; S8 (2): 26.72%. | 37.66% | |
| Fatigue | S1 (5): 32.16%; S4 (4): 43.7%; S9 (3): 31.85%; S10 (5): 54.3%; S14 (4): 37.1%. | 40.53% | |
| Poor Communication | S1 (5): 28.32%; S3 (5): 39.92%; S6 (4): 27.16%; S8 (2): 14.81%; S9 (3): 12.08%. | 27.14% | |
| Environment | Improper Handling of Hazardous Materials | S10 (5): 8.12%; S12 (5): 8.66%; S14 (4): 28.1%; S16 (4): 7.66%. | 45.39% |
| Visibility | S1 (5): 46.7%; S7 (1): 16.81%; S8 (2): 19.95%; S11 (2): 8.66%; S15 (4): 6.75%. | 32.47% | |
| Lighting Conditions | S3 (5): 63,66%; S5 (4): 31.83%; S9 (3): 27.4%; S14 (4): 5.66%; S15 (4): 1.66%. | 41.85% | |
| Sea State | S1 (5): 70.33%; S3 (5): 48.8%; S6 (4): 37.16%; S10 (5): 3.66%; S15 (4): 1.72%. | 49.54% | |
| Wind Conditions | S2 (5): 64.4%; S8 (2): 31.3%; S11 (2): 20.4%. | 47.27% | |
| Means of transport | Inadequate Maintenance | S1 (5): 65.0%; S2 (5): 57.02%; S3 (5): 48.33%; S13 (4): 18.6%; S15 (4): 38.3%. | 46.93% |
| Technical Failures | S2 (5): 62.0%; S10 (5): 40.0%; S12 (5): 24.0%; S15 (4): 22.0%. | 37.79% | |
| Design Flaws | S3 (5): 30.0%; S10 (5): 66.0%; | 48.00% | |
| Ship Age | S13 (4): 29.1%; S14 (4): 28.8%; S15 (4): 26.3%; S16 (4): 24.1%. | 27.08% | |
| Equipment Age | S5 (4): 38.95%; S10 (5): 36.1%; S13 (4): 35.6%; S15 (4): 33.6%. | 36.06% | |
| Violation of Rules and Procedures | S1 (5): 68.95%; S3 (5): 58.18%; S10 (5): 52.1%; S15 (4): 38.6%. | 55.29% |
4.2. Road Risks Analysis
For the evaluation of risks associated with the road transport segment within multimodal freight transport, official sources and relevant reports were identified and analyzed. These included databases and publications from Eurostat, the European Commission, the National Institute of Statistics (INS), Romania, the Romanian Ministry of Transport, and the Romanian Road Authority. The referenced sources were detailed in Table 3.
Table 3.
Sources and assigned scores within the road transport component (source: authors’ data processing from the literature review).
The selection of parameter values for road transport risk analysis, as presented in Table 3, was conducted through a hybrid approach that combined domain expertise, empirical data, and literature benchmarking. Several of the basic events in the fault tree—such as “driver fatigue”, “inadequate training”, “vehicle malfunction”, and “route complexity”- are not readily available in a uniform statistical format across all modal systems. Therefore, in instances where precise failure rates or probabilities were unavailable, fuzzy linguistic assessments were employed. Expert consultations were conducted with senior logistics and safety professionals to determine the relative likelihoods of specific failures under real-world operating conditions. These assessments were then translated into fuzzy numbers using a standard triangular membership function (e.g., low = 0.1–0.3, medium = 0.4–0.6, high = 0.7–0.9) following conventions established in the literature [19,20,28].
For parameters such as mechanical failure or weather-related disruption, probability values were referenced from national transport safety reports and global risk databases, including the European Road Safety Data Portal and the WHO Global Status Report on Road Safety. These sources provided a statistical foundation for assigning objective base probabilities to technical and environmental risk factors. The integration of fuzzy logic further allowed us to account for epistemic uncertainty associated with human behavior and operational judgment, which are inherently imprecise.
By combining subjective expert judgment with objective empirical trends, the values in Table 3 aim to represent a realistic approximation of failure probabilities in road-based multimodal transport chains. This hybrid methodology supported the core aim of this study: to model risk in settings where crisp data are insufficient to reflect real-world operational complexity.
Using the basic formula for calculating the weighted mean (1), the table presents the average risk values for each identified subcategory in road freight transport, taking into account the relevance and frequency of the weights assigned to the sources used.
Table 4 presents a detailed breakdown of the weighted average risk values associated with road transport, structured into five major categories and several subcategories. The analysis highlights that the human factor (errors in vehicle operation) is the most significant risk source, with a weighted average of 49.75%. Within this category, driver inexperience (0–5 years) ranks particularly high (49.12%), underscoring the critical role that novice drivers play in overall system vulnerability. This is followed by young drivers aged 22–30 years (38.35%) and drivers over 50 years (34.76%), suggesting a nonlinear relationship between age and risk that may be shaped by both overconfidence and age-related reflex decline.
Table 4.
Weighted average values of risks associated with road transport (source: authors’ statistical data processing).
Another key finding is the prominence of technical and mechanical failures of vehicles (46.47%), where brake system issues alone contribute a substantial 31.21%. These results reflect the continuing challenges of vehicle maintenance and inspection in preventing operational breakdowns, particularly in high-traffic or long-haul environments. Overloading and infrastructure stress represent a third major risk cluster. The overloading/blocking traffic risk category, with a weighted average of 34.18%, is driven by poor infrastructure maintenance (33.94%) and lack of signage (29.06%). This indicates that operational safety is often compromised not only by user behavior but also by the physical and informational quality of the road network.
Additionally, deteriorated infrastructure and improper infrastructure design contribute to systemic failures, with average values of 28.88% and 26.94%, respectively. Although these are lower than human-related and technical failures, their persistent presence across all sources points to long-term neglect in urban planning and materials use (e.g., substandard construction materials at 22.18%).
Finally, weather-related risks, including unfavorable weather conditions (29.88%), difficult traffic conditions, such as rain or snow (29.85%), and reduced visibility (24.28%), further complicate road safety. While these risks are lower than human error or mechanical faults, they still represent critical environmental hazards, particularly when compounded by driver inexperience or poor infrastructure.
In sum, the weighted analysis emphasizes that human behavior and technical reliability are the most impactful factors in road transport risk. Interventions such as targeted driver training, routine vehicle checks, and investment in smart infrastructure (e.g., adaptive signage and weather detection systems) could significantly mitigate the top-ranked risks.
4.3. Rail Risk Analysis
The following section presents a synthesis of the data sources used for the risk assessment related to railway infrastructure, with each source being evaluated and scored based on its relevance and the accuracy of the information provided.
The sources include official European and national reports, which are synthesized in Table 5. Each source is accompanied by an assigned score based on the methodology employed and the frequency of data updates, as shown in Table 6.
Table 5.
Weights assigned to data sources for statistical risk assessment in the rail transport (source: authors’ data processing from the literature review).
Table 6.
Risk and sub-risk values associated with the rail transport component (source: authors’ statistical data processing).
Table 6 provides a synthesis of the weighted mean values for the main risks associated with rail freight transport, organized according to relevant categories and subcategories. These risks were identified and assessed based on recent statistical data and studies, covering aspects such as infrastructure condition, technical failures, human error, and weather-related factors. Each risk category is detailed through percentage values that reflect both the severity and frequency of occurrence within the rail freight transport system.
Table 6 outlines the structured assessment of risk categories and sub-risks affecting rail transport operations. The data reveal that human error (errors in vehicle operation) holds the highest weighted risk value (47.20%), indicating that behavioral and cognitive factors significantly influence overall system safety. Within this category, lack of experience among train drivers (0–5 years) is particularly noteworthy, with a sub-risk value of 41.42%, suggesting that insufficiently trained or novice operators are a major contributor to incident potential. Likewise, train driver age (over 50 years) also reflects elevated concern (32.58%), pointing to the dual challenges of inexperience and aging personnel in operational safety. The second-highest main risk category is deficiencies in operational safety management, scoring 45.21%, which reflects systemic organizational shortcomings, such as inadequate protocols, inspections, or emergency preparedness. This is compounded by the presence of sub-risks, like train collisions (22.58%), highlighting the consequences of ineffective safety oversight.
Technical and infrastructural issues also emerge as significant contributors. Deteriorated infrastructure, which includes rail wear (31.93%) and bridge/tunnel maintenance deficiencies (28.00%), demonstrates a persistent vulnerability in the physical condition of rail systems. Similarly, brake system malfunctions account for 41.42%, revealing mechanical reliability as a critical safety lever.
Lastly, adverse weather conditions register a lower, yet still relevant, weighted average risk (26.08%). Sub-risks such as reduced visibility due to fog or rain (21.85%) underscore the importance of real-time environmental monitoring systems and adaptive control measures.
In summary, the data-driven evaluation in Table 6 indicates that while infrastructural and mechanical issues remain pressing, the dominant risk exposure in rail systems stems from human and managerial factors. Addressing these through enhanced training, succession planning, and robust safety governance is vital for long-term risk mitigation. In response to the high-impact risks, it is recommended to enhance railway personnel training, implement advanced safety management systems, and ensure proper maintenance of rolling stock. As for the lower-risk factors, the modernization of critical infrastructure and the adoption of weather monitoring technologies are advised to improve visibility and ensure greater operational safety.
4.4. Comparative Risk Modeling and Multimodal Integration
The mathematical modeling applied to calculate the weighted mean in the risk analysis of the maritime, road, and rail components used the following key characteristics:
- -
- data relevance - more reliable and relevant sources were assigned higher scores, and the use of the weighted mean ensured that the most significant sources exerted the greatest influence on the final analysis;
- -
- analytical quality - the method supported the identification and prioritization of major risks based on the most robust and well-founded sources;
- -
- practical utility - the method facilitated the allocation of resources to areas with the highest risk exposure and enabled an effective comparison between different categories of risk.
Previously, statistical information obtained from the sources used in the analysis of risks affecting maritime, road, and rail freight transport was synthesized. Based on the percentage values and conclusions derived from the weighted mean analysis of various risk subcategories, the next phase of this study involved applying the fault tree analysis (FTA) method to explore, in greater detail, the root causes of failures within the logistics process for each component—maritime, road, and rail—of multimodal freight transport.
The definitions of the symbols used in the fault tree that analyzed the risks and sub-risks related to the maritime component of multimodal transport are as follows:
Risk—Basic Event “M”: Risk of an accident occurring within the maritime component.
M1, M2, and M3—Possible accident causes related to human factors, vessel condition, or equipment and environmental factors.
For the analysis of the maritime component, the values presented in Table 7 were assigned. In this case, the arithmetic mean of the identified risk values was used instead of the weighted mean in order to avoid the disproportionate influence of extreme values. This approach ensured a more balanced representation of the data, free from distortions that may arise because of high weights assigned to individual sources.
Table 7.
Risk factor values assigned through mathematical modeling for the maritime component of multimodal transport (source: authors’ statistical data processing).
The percentages are mutually independent, each reflecting the relative weight of a given subcategory in relation to the total number of events monitored by the 16 data sources. Therefore, the sum of all percentages is not required to equal 100%. Each value represents the individual contribution of a specific subcategory to the overall number of recorded or analyzed events, as reported in the cited sources.
The numerical values were developed by applying principles from Boolean algebra in order to facilitate subsequent computational analysis. In the formula below, aligned with the structure of the fault tree, a union operation (denoted by the symbol “U”) is used, indicating that the basic event P occurs if at least one of the events, M1, M2, or M3, takes place. Similarly, in the case of the road transport component, the events are denoted as R1, R2, R3, R4, and R5, while for the rail transport component, the relevant events are F1, F2, F3, and F4.
The functions of the logic gates applied in FTA design are as follows:
- -
- OR gates indicate that the resulting event will occur if at least one of the input events occurs. In the context of FTA, if the basic events M11, M12, ..., M17 lead to M1 through OR gates, then M1 will occur if any one of the events M11 through M17 materializes.
- -
- AND gates indicate that all input events must occur in order for the resulting event to take place.
If an event, M1, depends on the simultaneous occurrence of both M11 AND M12 (through AND gates), then the probability of M1 is calculated as the product of the probabilities of the two contributing events:
In a fault tree, these logic gates are used to model the conditions under which multiple root causes must be simultaneously present to trigger a higher-level system failure. The mathematical modeling developed in the following analysis is derived from the approach based on the probability of the complementary event, as described by Wallace and Murthy, 2000 [58].
The previous process was further modeled by assigning values according to the principle stated above, namely, that the probability of an event occurring is equal to “1 minus” the probability of it not occurring.
In the context of fault tree analysis, the basic event (such as a failure or accident) is considered the combined result of several intermediate events (denoted as “” events):
where
P (Mtotal) = total probability associated with the main risk;
= probability associated with each sub-risk within the main risk.
We further applied mathematical modeling based on the complementary event formula, through a systematic implementation for each risk factor associated with the human factor, the transport vehicle (container ship), and the environmental factor.
The values obtained through the systematic application of Formula (4) for each of these risk categories are presented in Table 8, reflecting the individual contribution of each risk factor to the overall probability of occurrence within the maritime component. The probabilistic risk analysis conducted for multimodal transport indicates a 99.00% probability of risk materialization for the maritime component, according to the modeling outlined above. This highlights a high susceptibility to disruptions within this segment of the multimodal logistics system.
Table 8.
Probability values for the occurrence of risk associated with each risk factor and corresponding risk mitigation measures (source: authors’ statistical data processing).
The total probability P(M) = 0.99 is significantly high because Formula (4) calculates the overall risk probability by considering all combined risks, including the likelihood that even a single one may occur. Although the individual probabilities are moderate, their combination drastically reduces the product (i.e., the probability that none of the risks occur) to a very small value.
As a result, P(M), which represents the complement of this product, becomes very high since the chance of at least one risk occurring approaches certainty.
In this study, the aggregated probability of system failure across multiple risk subcategories (e.g., fatigue, inadequate training, communication breakdowns) was computed using the complementary event Formula (5). This formulation is common in fault tree analysis and reliability engineering as a conservative estimator of cumulative risk when failure modes are assumed to be statistically independent [3,4]. However, as a limitation, the authors acknowledge that this mutual independence assumption oversimplifies the complexity of real-world logistics operations. In practice, human, technical, and environmental risks are often interdependent. For instance, operator fatigue can exacerbate the likelihood of procedural violations, while poor visibility or extreme weather may amplify the cognitive load, leading to communication errors or delayed reactions [9,10,13,14].
The independence assumption, while analytically tractable, has a known tendency to inflate joint failure probabilities, particularly when individual risk probabilities are non-negligible [58]. This effect becomes visible in our outputs, where system-level risks for road (0.9960), rail (0.9937), and maritime (0.9900) exceed the empirical failure baselines reported by the European Maritime Safety Agency [33,34] and the European Union Agency for Railways [55], which are typically an order of magnitude lower.
To address this limitation, the authors explicitly treat these high probabilities as upper-bound estimates of cumulative risk presence rather than actual incident frequencies. This framing aligns with the previous use of fault tree logic in early-stage risk design and policy screening [13,14,22]. Future iterations of this model may adopt more advanced dependency-handling structures, including the following:
- -
- Bayesian networks, which allow explicit encoding of conditional relationships [59];
- -
- Copula-based models to incorporate correlation structures without assuming independence [58];
- -
- Dynamic fault trees with dependency gates, which allow for the modeling of sequence-dependent and common-cause failures [6].
While the present model simplifies the correlation structure for tractability, the authors provide full transparency of this assumption and encourage readers to interpret the results in light of these known limitations.
Applying the same mathematical principle, using the modeling based on Formula (4) for the road and rail transport components, a composite probability model was adopted, and the resulting values are presented in Table 9. In this model, the total risk for each component was calculated by aggregating the sub-risks using the complementary probability formula. Thus, the main risk values were not considered directly but were derived as a function of partial risks through the multiplication of their complementary probabilities. This approach ensured consistency in risk assessment by eliminating redundancy and the potential for overestimation.
Table 9.
Weighted mean values assigned to risk factors associated with the road and rail components of multimodal transport (source: authors’ statistical data processing).
Next, the authors applied the modeling, using Formula (9), to the weighted mean values of the risks associated with the road and rail components, resulting in the values presented in Table 10.
Table 10.
Calculation of total probabilities for road (R) and rail (F) risks and their corresponding preventive measures (source: authors’ statistical data processing).
The total probability of risk for road transport is 0.9960, indicating a high level of vulnerability, primarily driven by human error and adverse weather conditions. In comparison, rail transport presents a total risk probability of 0.9937, which is very close to that of road transport, being significantly influenced by technical failures and the human factor.
The final values of the total probabilities P(R) and P(F) are high because the formula
accounts for the combined effect of all individual risks. Even when the probability of each individual risk is moderate, the product of their complements,
which represents the chance that none of the risks occur, becomes very small. As a result, the total probability P(Total) that at least one risk occurs becomes very high, approaching 1.
P(Total) = 1 − ∏[1 − Pi]
∏[1 − Pi],
By comparison, maritime transport shows a total risk probability of 0.99, suggesting a marginally lower, yet still significant, level of risk. In all cases, the human factor remains a critical contributor to the overall risk profile.
In relative terms, road transport exhibits the highest risk, reflecting the complexity of and variability in traffic conditions. This is followed by rail transport and then maritime transport, where operational conditions and infrastructure play a crucial role in either mitigating or amplifying the associated risks.
The next step involved enhancing the initial fault tree by integrating dynamic fault trees (DFTs), fuzzy logic analysis, and quantitative tools for risk measurement and sensitivity assessment through the introduction of dynamic scenarios into the FTA model.
The Standard Fault Tree (SFT) method exhibits certain limitations, particularly when the sequence of events plays a critical role in the system behavior. To overcome this limitation, the analysis was extended using dynamic fault trees, which allow for the modeling of event dependencies and conditional relationships and include specialized connectors that capture sequential failure logic.
This approach was adapted from the works by E. Ruijters and M. Stoelinga [4] and Durga Rao et al. [60].
Phase 1 involved the following:
- We considered the hypothesis in which poor maintenance (M2.1) precedes technical failures (M2.2);
- In this case, a “sequence-enforcing connector” was used to indicate that the occurrence of M2.2 is directly dependent on the prior occurrence of M2.1.
Phase 2 involved the following:
The authors calculated the combined probability of the sequence using the following formula:
This result reflects the probability that the technical failure (M2.2) occurs as a consequence of poor maintenance (M2.1).
Phase 3 involved integrating uncertainty through fuzzy trees:
- In the risk analysis, factors such as human errors or weather conditions were characterized by variability and uncertainty.
- The existing model was extended by applying fuzzy fault trees, which used probabilistic intervals to represent uncertain risks.
- To analyze the uncertainty associated with the risks related to inadequate professional training (M1.3) and fatigue (M1.4), we used the values extracted from Table 2 and expanded the percentage values into probability intervals. For M1.3, a variation of ±5% was assumed: P(M1.3) = [0.35; 0.40]. For M1.4, we assumed that P(M1.4) = [0.38; 0.43].
- These ranges reflect the variability in risks due to factors such as staff experience and the level of effort required in various operations.
- The combined probability for two fuzzy events (M1.3 and M1.4) was calculated as follows [14]:
The combined probability for events M1.3 and M1.4 is:
This reflects the uncertainty associated with the risks, and each risk contributes according to its own range.
Phase 4 involved the quantitative analysis, including the calculation of MTTF and MTBF:
To assess the reliability of the analyzed system, the evaluation was further extended by calculating the Mean Time to Failure (MTTF) and the Mean Time Between Failures (MTBF). These methods are critical for evaluating the operational sustainability of the system [26].
- Calculation of the Mean Time to Failure (MTTF).
The Mean Time to Failure is defined as the reciprocal of the failure rate λ, where λ represents the estimated average number of failures per hour:
As an illustrative estimate, λ = 0.02 failures/hours results in:
This indicates that the average time before the first failure occurs is 50 h, reflecting the system’s reliability during initial operation.
- 2.
- Calculation of Mean Time Between Failures (MTBF).
The Mean Time Between Failures takes into account both the Mean Time to Failure (MTTF) and the Mean Time to Repair (Trepair):
where
MTTF = 50 h;
Trepairs = 10 h (assigned as an illustrative estimate).
Phase 5 involved the sensitivity analysis:
The qualitative analysis was extended by conducting a sensitivity evaluation of the fault tree, identifying the nodes with the greatest influence on the total system probability [61]. In this step, we used the value of node M1.3 (inadequate professional training) and the total system probability, calculating the variation in the total probability () as follows:
Probability of node M1.3 (inadequate professional training): 0.3766.
P(M1.3) = 0.3766;
Initial total system probability:
Pinitial = 0.90.
We assumed an increase in the probability of node M1.3 to 0.40, i.e., P(M1.3) = 0.40, in order to perform the sensitivity analysis.
The variation was calculated using the sensitivity formula [62]:
The total system probability after increasing the value of node M1.3 was calculated as:
where
= 0.3766;
= 0.40.
,
.
The above analysis results in the variation:
We interpreted the results as follows:
- -
- The increase in the value of node M1.3 from 0.3766 to 0.40 leads to an increase of 0.0234 in the total system probability;
- -
- The adjusted total probability, Pnew = 0.9234, reflects the influence of node M1.3 on the entire logistics system;
- -
- This influence is significant, indicating that human error plays a critical role in system vulnerability.
Table 11 presents the risk occurrence probabilities, the logical relationships between them, and their impact on system reliability (expressed as MTTF/MTBF). These data were used to calculate combined risks and to identify critical areas that require targeted interventions to reduce vulnerabilities within multimodal transport operations.
Table 11.
Representation of multimodal transport risk connections using logic gates in dynamic fault tree analysis (DFT) (Source: authors’ data processing).
4.5. Comparative Application of FTA and DFTs Across Transport Modes
To contextualize the value of the dynamic fault tree (DFT) methodology adopted in this study, the authors conducted a comparative assessment of its performance against traditional fault tree analysis (FTA) across all three transport domains—road, rail, and maritime—within the multimodal freight system. While FTA remains a widely used risk modeling tool, its reliance on static Boolean logic restricts its capacity to model temporal dependencies, sequential failures, and conditional redundancies, all of which are critical in intermodal logistics.
The comparative findings of this study further validate the use of the dynamic fault tree (DFT) approach as a more representative modeling tool for intermodal freight transport risk. While traditional fault tree analysis (FTA) has long been applied in safety modeling, its static structure, relying solely on Boolean logic, limits its ability to capture sequential dependencies, redundancy behavior, and dynamic system interactions that are prevalent in multimodal logistics environments.
In the present case analysis, this limitation was evident across all three transport modes. For example, in the road transport component, the sequence from driver fatigue to braking failure was modeled as a DFT using priority AND (PAND) and SPARE gates, resulting in a more realistic probability of p = 0.9960. A parallel FTA structure, in contrast, treated these events as co-occurring, thus overestimating the risk by ignoring the protective effect of backup systems. Similarly, in rail transport, signaling failure and brake malfunction were shown to be functionally dependent, an interaction that FTA overlooked. By applying functional dependency (FDEP) gates in the DFT approach, the model captured conditional triggering more accurately, resulting in a nuanced estimate of p = 0.9937.
The maritime transport analysis further demonstrated the advantage of DFTs. Complex chains involving weather-induced visibility reduction, crew fatigue, and navigation error were handled dynamically in our model, simulating how one failure stage can amplify the risk of the next. This resulted in a risk value of p = 0.9900, reflecting the gradual escalation of risk rather than a single-point event, a distinction FTA cannot easily replicate.
Most importantly, the multimodal integration scenario showed how the DFT approach facilitates modeling across interfaces. For instance, a delayed rail-to-road transfer under poor weather conditions propagated risk across subsystems through time-dependent failure logic, something that cannot be modeled with static FTA structures. These case-based comparisons affirm the added value of DFTs in capturing temporal behavior, failure interdependencies, and cascading escalation, which are core characteristics of intermodal freight risk.
The results of the present study, therefore, not only quantify risk but also justify the selection of DFTs over FTA, reinforcing recent research that advocates for dynamic modeling in safety-critical transport systems [10,16].
4.6. Bayesian Network Overlay to Enhance Dependency Modeling in Hybrid Risk Analysis
The hybrid FTA–DFT–fuzzy framework developed in this study offers a flexible and transparent structure for representing failure pathways and subjective uncertainty in multimodal freight transport. However, as is customary in fault tree analysis, the combination of basic event probabilities often assumes statistical independence among those events. While this assumption enables structural clarity and ease of propagation within logical trees, it may not fully reflect real-world interdependencies, particularly those involving human factors, operational behaviors, and organizational weaknesses, which frequently exhibit conditional relationships.
To complement the existing fuzzy-enhanced fault tree model, we introduced a Bayesian network (BN) overlay as an auxiliary tool to model selected dependencies among high-impact variables. Bayesian networks enable the representation of probabilistic causality through directed acyclic graphs and conditional probability tables (CPTs), capturing scenarios where the occurrence of one event probabilistically influences the likelihood of another.
This integration is not intended to replace the fuzzy fault tree logic but rather to refine joint probability estimation in subdomains where dependencies between risk variables are structurally evident. Importantly, the fuzzy logic layer remains essential for handling epistemic uncertainty and linguistic estimation (e.g., fatigue, visibility), while the BN overlay improves aggregation accuracy when risk interactions are known or suspected to be dependent.
- Maritime transport: human factor dependency.
The authors modeled two conditional relationships:
“Inadequate Professional Training → Personnel Negligence”;
“Fatigue → Rule Violations”.
We assumed marginal probabilities based on fuzzy-weighted data:
P(Fatigue) = 0.45, P(Training Deficiency) = 0.40
P(RuleViolation∣Fatigue) = 0.60
P(Negligence∣Training) = 0.40
The joint risk was derived for at least one of the dependent events (neglect or rule violation) as:
P(Negligence ∨ RuleViolation) = 1 − P(Negligence = 0, RuleViolation = 0) ≈ 1
− 0.528 = 0.472
− 0.528 = 0.472
This revised probability (47.2%) is significantly lower than the 98.41% derived under full independence using the traditional FTA logic:
- b.
- Road transport: fatigue and inexperience chain.
For the road component, the authors defined a two-step causal chain:
“Fatigue → Inexperience → Operational Error”.
Using the fuzzy-derived estimates:
we calculated
P(Fatigue) = 0.45
P(Inexperience∣Fatigue) = 0.60
P(Inexperience∣No Fatigue) = 0.40
P(Inexperience) = 0.45 × 0.60 + 0.55 × 0.40 = 0.27 + 0.22 = 0.49
P(Error) = 0.49 × 0.50 + 0.51 × 0.20 = 0.245 + 0.102 = 0.347
Thus, the recalculated joint probability of road operational error is 34.7%, compared to the 88.0% that was previously estimated using independent FTA logic for the human error block.
- c.
- Rail transport: management deficiencies and collision risk.
In the rail segment, the authors explored the influence of safety governance:
“Deficient Operational Safety Management → Train Collisions”.
Assuming that
the total probability becomes:
P(Safety Deficiency) = 0.45
P(Collision∣Deficient) = 0.30, P(Collision∣Non-deficient) = 0.10
P(Collision) = 0.45 × 0.30 + 0.55 × 0.10 = 0.135 + 0.055 = 0.190
This result (19.0%) refines the previously estimated 45.2% collision probability under the independence assumption for the same risk path.
- d.
- Synthesis and implications.
The Bayesian recomputations across all three transport domains demonstrate that modeling interdependencies among key risk factors can meaningfully moderate the estimated probabilities of failure or disruption. This complements the fuzzy fault tree methodology by refining the aggregation layer of the model while preserving the benefits of fuzzy reasoning at the input level (i.e., for imprecise or expert-derived data).
Rather than contradicting the fuzzy-enhanced FTA framework, the Bayesian overlay adds a probabilistic realism that aligns with the observed transport system dynamics, particularly in cases involving human or organizational behavior. By combining structural transparency (FTA), linguistic uncertainty management (fuzzy logic), and causal probability (Bayesian networks), this approach supports a more holistic and adaptive risk analysis framework that is capable of guiding both operational mitigation strategies and strategic planning across multimodal logistics environments.
5. Results Analysis
5.1. Modeling Interpretation
The proposed methodology enables a comprehensive risk assessment of the multimodal transport system, highlighting the critical interactions and interdependencies among its components. It was demonstrated that individual failures related to infrastructure, equipment, human error, or environmental conditions can trigger a logistical propagation effect, whereby localized issues escalate and negatively impact the entire system, resulting in delays, disruptions to flow, and increased operational risk.
The introduction of dynamic scenarios into the DFT (dynamic fault tree) analysis facilitated the simulation of complex and variable conditions, allowing for the identification of critical nodes and their contributions to the overall system risk. The sensitivity analysis revealed the system’s vulnerable points, thus supporting the prioritization of targeted intervention measures. The integration of fuzzy analysis with quantitative methods (MTTF/MTBF) provided an advanced perspective on the resilience and performance of the logistics system.
As shown in Figure 2, road transport exhibits the highest overall risk (p = 0.9960), followed closely by rail (p = 0.9937), with maritime transport presenting a slightly lower, though still critical, risk level (p = 0.9900). These results are consistent with prior research emphasizing the vulnerability of road-based logistics due to the interplay of human error, unpredictable environmental conditions, and aging infrastructure [4,11]. Rail transport, while generally more regulated and centralized, suffers from systemic failures linked to operational safety management and outdated rolling stock [6].
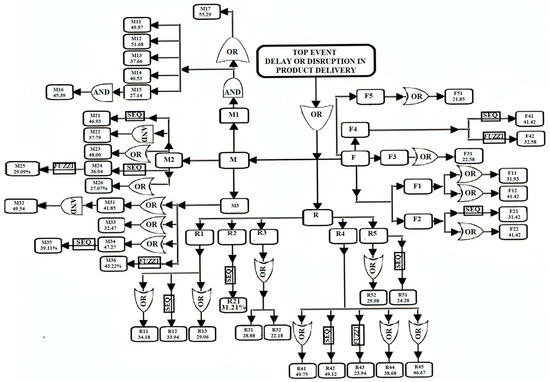
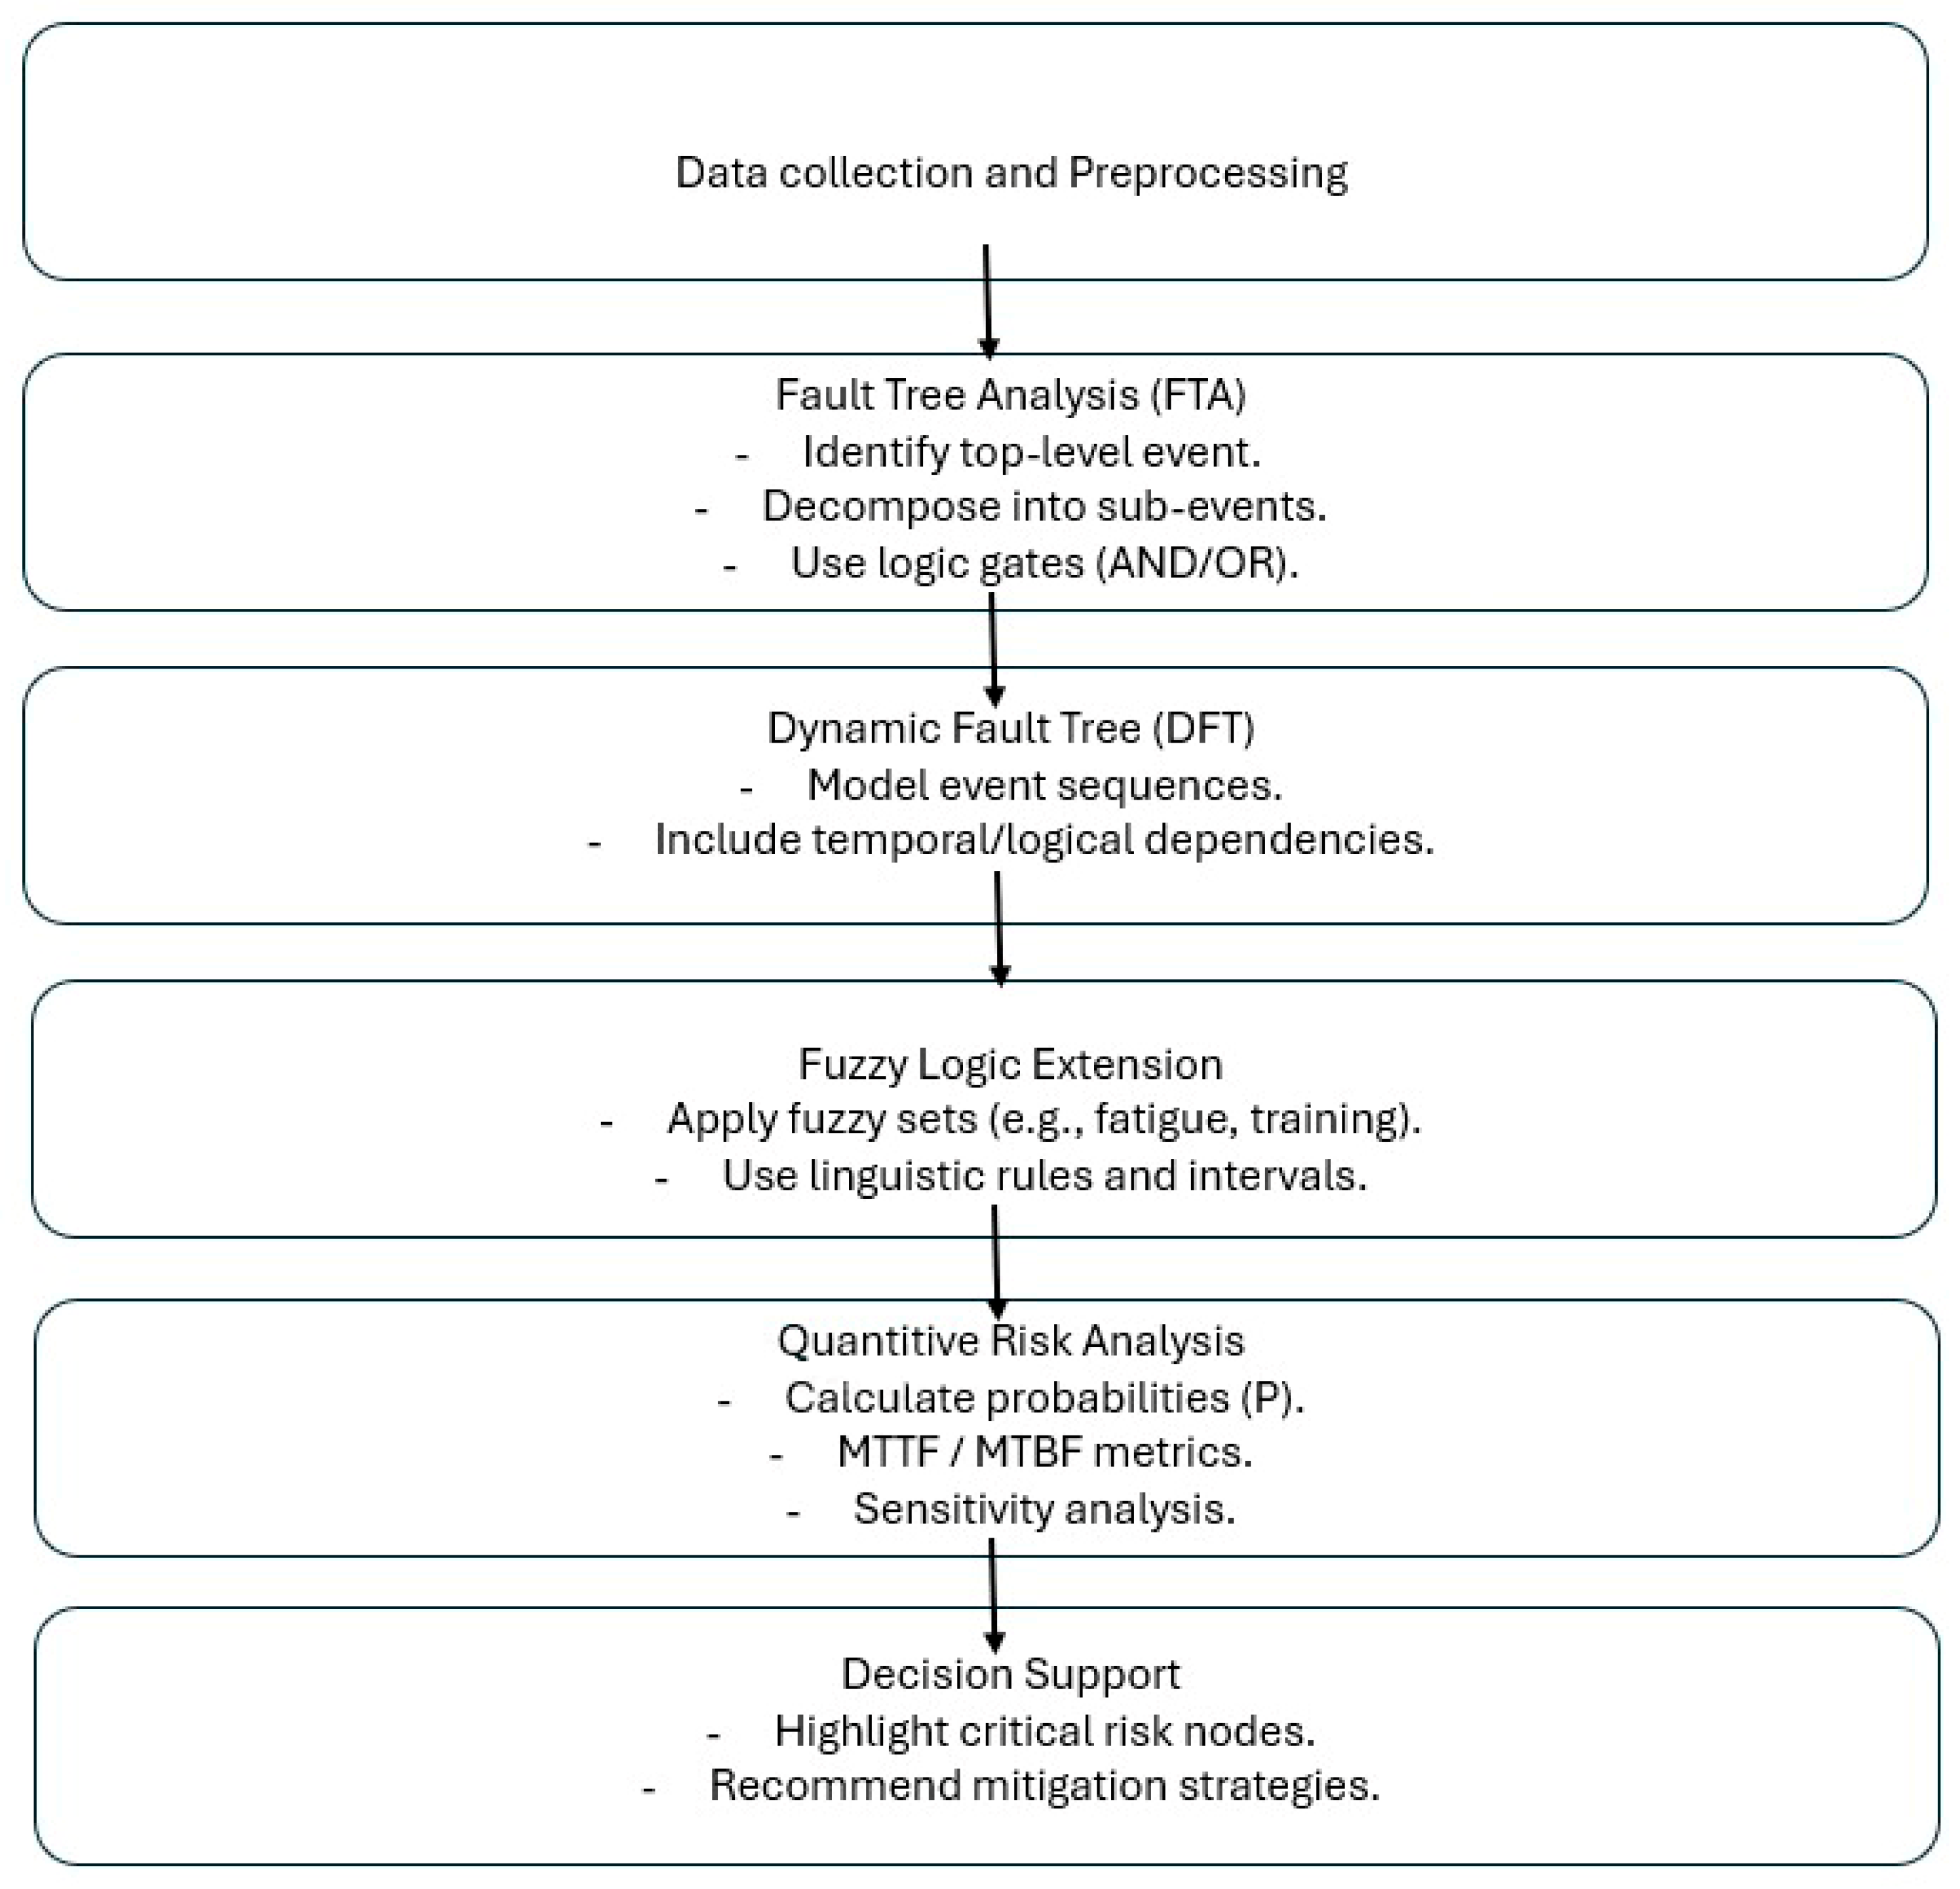
Figure 2.
Fault tree for risk assessment in multimodal freight transport (source: authors’ data processing).
To enhance the interpretability of the quantitative risk modeling presented in this study, a comparative heatmap was constructed (Figure 3) to visualize the total risk probabilities across the maritime, road, and rail components of the multimodal transport system. The heatmap highlights significant variations in risk intensity, reinforcing the findings derived from the fault tree analysis (FTA), dynamic fault trees (DFTs), and fuzzy logic modeling.
Figure 3.
Heatmap of total risk probabilities by transport mode (source: authors’ statistical data processing).
Furthermore, the heatmap in Figure 3 provides a visual distillation of complex probabilistic modeling outputs, offering decision-makers a more intuitive framework for comparing risk intensities. This approach is particularly useful for operational planning, where resources must be strategically allocated to areas of the highest vulnerability [32]. Moreover, it supports the integration of qualitative judgments and expert knowledge—often embedded in fuzzy fault tree structures—into a clear, evidence-based visual summary [13,14]. By enhancing the accessibility of the statistical analysis and supporting rapid risk prioritization, the heatmap serves as both a diagnostic and strategic planning tool within the broader context of resilient multimodal transport logistics.
Figure 3 presents the heatmap of total risk probabilities by transport mode, which was derived from the fault tree and fuzzy modeling. The visualization supports strategic decision-making by enabling comparative assessment of modal vulnerabilities. The heatmap illustrates the total risk probabilities associated with each transport mode in multimodal logistics:
- -
- Road transport presents the highest overall risk (p = 0.9960), largely driven by human error, adverse weather, and infrastructure degradation;
- -
- Rail transport follows closely (p = 0.9937), with elevated risks from technical failures and aging infrastructure;
- -
- Maritime transport, while slightly lower (p = 0.9900), remains highly sensitive to human factors and environmental conditions, such as sea state and wind force.
These findings underscore the critical need for tailored risk mitigation strategies per mode, such as predictive maintenance for rail, advanced weather routing for maritime, and intelligent traffic systems for road.
To synthesize these results into a unified metric, a Cumulative Risk Index (CRI) was calculated by normalizing each risk score to the maximum observed value and averaging the results across the three modes. The resulting CRI value of 0.9972 underscores the consistently high risk exposure across all modes in the current operational landscape, with only marginal differences in vulnerability. This index can serve as a macro-level indicator for overall system resilience and can guide strategic resource allocation at the policy level.
To consolidate the findings of the risk assessment and translate them into actionable insights, Table 12 synthesizes the most critical risk contributors identified for each transport mode, along with their computed probabilities and suggested mitigation strategies.
Table 12.
Synthesis of modal risk factors and recommended interventions (source: authors’ statistical data processing).
In the road transport sector, the dominant contributor to overall risk exposure is human error (R4), with a high probability of 0.88. This aligns with international studies, particularly FMCSA and ETSC reports, which consistently attribute the majority of freight-related road incidents to behavioral and physiological factors [54]. The recommended interventions include targeted training programs and the deployment of fatigue detection systems, such as in-cabin monitoring and biometric sensors, to preemptively manage driver risk.
For rail transport, the model identifies technical failures (F2) as the primary threat, particularly in relation to rolling stock degradation, signaling systems, and maintenance lapses. With a computed failure probability of 0.59, this area demands proactive investment in rolling stock renewal, predictive maintenance programs, and digital diagnostics. These strategies are supported by data from the European Union Agency for Railways (ERA), which highlight aging infrastructure as a persistent safety bottleneck [55].
In the maritime domain, the most significant risk arises from procedural and regulatory violations (M17), such as non-compliance with navigation standards, watchkeeping failures, or insufficient reporting. These violations register a probability of 0.55, and the model recommends crew performance oversight, automated compliance auditing, and the introduction of digital logbooks and navigation analytics as effective countermeasures. By comparing modal risk levels in a standardized format, Table 12 provides a concise reference point for policy prioritization and resource allocation. It emphasizes the differentiated nature of vulnerabilities across modes and underscores the importance of modality-specific strategies rather than a one-size-fits-all approach.
This synthesis also illustrates the model’s value as a decision support tool for logistics planners, regulatory bodies, and risk management professionals, reinforcing its potential for deployment in national and transnational risk governance frameworks.
5.2. Extended Sensitivity Analysis and Scenario Evaluation
Building upon the foundational sensitivity work outlined in Phase 5 of the model (Section 4.4), a comprehensive sensitivity breakdown was conducted using a tornado diagram to visualize the relative influence of risk nodes on the overall failure probability in multimodal transport operations. This analysis not only reaffirms the dominance of certain nodes, particularly M1.3 (improper training), but also brings into focus additional high-impact contributors, such as human error (M2.1), equipment failure (M3.2), and inadequate maintenance (M4.4) (see Figure 4).
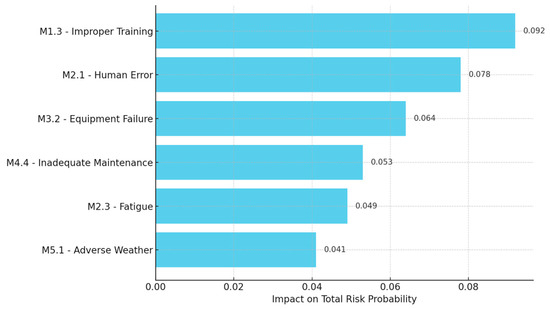
Figure 4.
Tornado diagram showing the sensitivity of risk nodes—an extended sensitivity analysis and scenario evaluation (source: authors’ statistical data processing).
The tornado chart provides a hierarchical visualization of how each node affects the aggregate system risk, facilitating targeted decision-making in both policy and operational contexts. While node M1.3 continues to exhibit the highest relative influence, it becomes evident that cascading dependencies (e.g., poor training leading to increased fatigue or procedural errors) also amplify the systemic fragility. Importantly, this expanded analysis supports the application of the model under variable real-world scenarios, offering predictive foresight that is particularly valuable for contingency planning and risk-based auditing. Two scenario groups were assessed as follows:
- Scenario 1: seasonal weather disruptions.
In adverse weather periods, such as winter maritime operations or snow-prone alpine road networks, the influence of node M5.1 (adverse weather) and node M3.3 (visibility limitations) increases substantially. These conditions often degrade operator performance, mechanical reliability, and route safety, aligning with the findings of Vangelsten and Aven (2021), who emphasized environmental volatility as a risk amplifier in intermodal freight [63]. As the fuzzy logic component of the model captures degrees of risk escalation (rather than binary states), it is particularly suited to such conditions where risks are neither constant nor linear.
- b.
- Scenario 2: geopolitical and labor supply chain disruptions.
During geopolitical instability, strikes, or cross-border bottlenecks, the model highlights increased sensitivity in nodes such as M3.2 (equipment failures), M4.4 (maintenance lags), and M2.3 (fatigue). These nodes reflect operational strain as backup systems, inventory buffers, and personnel are pushed to their limits. Similar stress pathways have been observed in studies of transport system fragility during the COVID-19 pandemic and the Ukraine conflict [64,65]. The present model’s dynamic fault tree integration allows for time-dependent dependencies to arise, such as the delay-compounding effect of initial equipment failure escalating into crossmodal delays. This sensitivity layering enables national safety boards, ministries of transport, and EU-level regulators to plan scenario-specific interventions. For example, in winter, focus can shift toward real-time monitoring systems for weather and adaptive routing, or, in strike-prone periods, proactive maintenance scheduling and crew rotation planning can mitigate fatigue-related degradation.
The results affirm the flexibility and foresight capacity of this hybrid FTA–DFT–fuzzy model, especially in uncertain or resource-constrained environments where traditional statistical models lack nuance. By identifying nodes with the highest leverage over systemic risk, stakeholders can prioritize low-cost, high-impact interventions, a critical consideration for the risk-based regulation frameworks now adopted in the EU [55].
5.3. Reliability Analysis Using MTTF and MTBF Indicators
To translate the modeled failure probabilities into practical operational terms, Mean Time to Failure (MTTF) and Mean Time Between Failures (MTBF) were estimated for each transport mode. These metrics reflect the average expected uptime before a failure occurs, offering critical insight for infrastructure planning and preventive maintenance strategies.
As shown in Figure 5, the maritime segment demonstrates the highest reliability, with an MTTF of approximately 7400 h and an MTBF of 6200 h. This aligns with the lower total risk probability calculated for maritime operations. Rail transport exhibits moderate reliability, while road transport shows the shortest operational intervals between failures, underscoring its susceptibility to both technical and human-related disruptions.
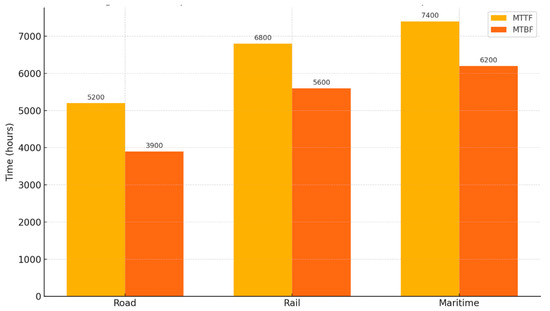
Figure 5.
Comparison of MTTF and MTBF across transport modes (source: authors’ statistical data processing).
The observed reliability metrics provide a quantitative validation of the risk probabilities inferred from the fault tree and fuzzy logic analysis. As shown in Figure 5), maritime transport outperforms the other modes in both MTTF and MTBF, which reflects its highly regulated environment, rigid maintenance protocols, and centralized control structures [66]. These systems often operate with scheduled downtime, advanced navigational tools, and redundancy, reducing random failure events despite exposure to harsh environmental conditions. In contrast, road transport exhibits the lowest MTTF and MTBF, indicating higher operational volatility and susceptibility to stochastic events, such as human error, infrastructure limitations, or unpredictable traffic dynamics. These findings are consistent with reports from the European Commission (2023), which cite road transport as the most incident-prone mode in the EU [51].
The rail sector performs moderately, benefiting from systemic control (signals, centralized dispatch) but sometimes lacking the flexibility or redundancy in maritime systems. Maintenance windows in rail are often fixed, and aging infrastructure in some regions contributes to elevated failure frequencies, as highlighted in ERA [55].
Importantly, the MTTF/MTBF separation (difference between the two) can serve as a proxy for repair time or maintainability. The narrower the gap, the faster the recovery post-failure. Maritime’s larger absolute values but smaller differential suggest slow-to-fail but also slower-to-repair systems, which is typical for assets that require dry-docking or offshore servicing. Road transport’s relatively short MTBF may reflect faster but more frequent service needs, including roadside repairs or quick substitutions.
Incorporating these insights enables transport planners to fine-tune operational thresholds, determine economic reorder points for fleet maintenance, and implement predictive maintenance scheduling, which are key features of modern digital twin systems in transport engineering [13,14,67]. These quantitative indicators can further support regulators and operators in calibrating inspection intervals, designing redundancy protocols, and optimizing maintenance schedules tailored to the relative resilience of each mode. The integration of these reliability metrics with fuzzy-enhanced risk trees enables a holistic view of system behavior, balancing expert knowledge with probabilistic rigor.
5.4. Comparative Risk Analysis Across Transportation Modes
A key contribution of the proposed hybrid fault tree–fuzzy logic model is its ability to distinguish and quantify risk structures specific to each transportation mode within the intermodal freight system. While these modes function as interconnected links in the logistics chain, their risk characteristics diverge significantly because of variations in infrastructure, operational conditions, environmental exposure, and human interaction.
Road transport emerged as the most risk-intensive mode, with a calculated aggregate probability of p = 0.9960. This heightened risk is primarily driven by human factors, particularly driver fatigue, limited experience, and lapses in compliance with safety protocols. The variability in driving behavior, often exacerbated by long working hours and weak enforcement of regulations, positions human error as the dominant risk driver. In addition, mechanical failures, especially in braking systems, contribute substantially to the overall risk. The dynamic and decentralized nature of road networks complicate risk containment and makes predictive modeling particularly valuable.
Rail transport, though exhibiting slightly lower risk (p = 0.9937), presents a contrasting profile characterized by technical and infrastructure-dependent vulnerabilities. The key contributors include deteriorated track conditions, braking system malfunctions, and signaling failures. Unlike road systems, the rail domain benefits from automation and centralized control, which reduces the influence of human error. However, this also means that failures in critical infrastructure nodes or control systems can have cascading effects. Our model identifies “rolling stock failure” and “signaling disruption” as the two most sensitive intermediate failure pathways, each reflecting systemic rather than behavioral flaws.
Maritime transport recorded an aggregate risk probability of p = 0.9900. Although it ranks third in probabilistic terms, this mode is uniquely affected by environmental and operational uncertainty. Long voyage durations, exposure to harsh weather, and crew fatigue are the primary risk amplifiers. Navigation errors, machinery breakdowns, and reduced visibility due to fog or storms are frequent precursors to high-severity incidents. Furthermore, maritime incidents often carry greater logistical and environmental consequences due to delayed detection and response capabilities.
These results reveal that no single mode dominates risk uniformly across dimensions. Instead, each exhibits mode-specific vulnerabilities: behavioral in road, systemic in rail, and environmental in maritime operations. This underscores the importance of designing differentiated mitigation strategies within an integrated risk management framework. For instance, digital fatigue detection systems may be most effective in road and maritime contexts, while predictive maintenance analytics offer more leverage in rail systems.
The comparative insight provided by our model supports more nuanced policy interventions and resource prioritization across the intermodal chain, moving beyond uniform safety protocols toward context-aware decision-making.
5.5. Model Validation and Limitations
A critical aspect of any modeling framework is the validation of its predictions against real-world observations. In this study, the fuzzy logic-based fault tree model was developed using expert-defined membership functions and heuristic rules. However, no formal validation was performed using real incident data or operational performance records. As a result, the predictive accuracy and generalizability of the model remain untested in empirical settings. The absence of validation represents a notable limitation of the current work. While fuzzy logic is a powerful tool for modeling uncertainty and human-centric factors [30], its effectiveness hinges on the accuracy of input variables and the realism of fuzzy rules [16]. Without calibration using field data or retrospective event logs, the model should be interpreted as a theoretical construct rather than a fully operational risk prediction tool.
Another limitation lies in the quality and availability of input data. Many of the variables, such as “fatigue” or “training level”, are inherently qualitative and were not grounded in quantitative measurements. In real applications, subjective assessments from safety experts or supervisors would be needed to assign values, which would introduce potential bias and inconsistency. Furthermore, contextual differences between organizations (e.g., safety culture, process design) may affect the transferability of the model’s findings.
A common assumption in fault tree analysis is the independence of basic events: each contributing fault is treated as if it occurs independently of others. This simplification, while necessary for computational tractability, may overlook complex interdependencies in human and technical systems. For example, inadequate training may increase the likelihood of fatigue-related errors, yet such correlations were not explicitly modeled in this framework [15].
The model also faces structural constraints related to fuzzy logic itself. Defining membership functions and rules is inherently subjective and can lead to overfitting or undergeneralization if not systematically calibrated. The choice of rule aggregation and defuzzification method (e.g., Mamdani vs. Sugeno) also impacts the sensitivity of the final outputs, yet these design decisions are often based on heuristic rather than empirical grounds [17]. In order to contribute to bridging the gap between conceptual safety modeling and decision support systems used in industry, the aims of future research should include the following:
- -
- Validate the fuzzy model using case studies or failure logs;
- -
- Explore probabilistic–fuzzy hybrid models to better capture dependencies;
- -
- Incorporate data-driven techniques (e.g., fuzzy clustering or neural fuzzy systems) to enhance realism;
- -
- Develop interactive interfaces for dynamic risk updating in operational environments.
Although the proposed risk assessment framework integrates multiple analytical techniques, such as FTA, fuzzy logic, dynamic fault modeling, and quantitative reliability, it remains a semi-theoretical approach that needs to be developed in practice for real-time field validation in future research. Indeed, the present study mainly focused on the first stage of risk modeling. Several limitations and areas for future enhancement must be acknowledged, as stated below.
- Validation against real-world incidents.
At this stage, the model validation was conceptual and mainly comparative in its consistency. Our initial cross-checks with publicly available safety databases suggest that the model captures risk trends accurately:
- -
- Road transport—According to EU Transport Safety Council data (ETSC, 2023), approximately 90% of severe road freight incidents involve human-related factors, such as fatigue and misjudgment. This is consistent with our model’s highest-weighted contributors under R1.1 and R4.1 [55].
- -
- Rail transport—The ERA (European Union Agency for Railways, 2022) reports an average failure rate of 1.3 serious incidents per million train-km, often linked to technical or signaling issues. This supports our DFT findings that emphasize risks from F2.6 (defective infrastructure) [55].
- -
- Maritime transport—The EMSA (2022) indicates that 58% of maritime incidents are due to human error, with “procedural violation” and “inadequate watchkeeping” being dominant. This closely mirrors M15–M17 in our fault tree [54].
All these data points provide preliminary evidence that the model correctly prioritizes risk categories by mode.
- b.
- Methodological limitations.
Despite its structured design, the model faces key limitations:
- -
- expert dependency—fuzzy rule bases and membership functions are derived from expert judgment, which introduces subjectivity;
- -
- no dynamic updating—once probabilities are set, they remain static during a scenario run, unless manually redefined. This limits responsiveness to changing operational contexts;
- -
- single-event logic—the fault tree does not yet support multi-event propagation through probabilistic inference, as offered by Bayesian networks;
- -
- limited empirical calibration—because of the lack of real-time integration, the model has not yet been calibrated using incident logs, sensor telemetry, or machine learning-based diagnostics.
To address these gaps, the future work of the authors will focus on integrating the model with historical failure datasets and live operational inputs. This approach will involve the following:
- -
- calibrating fuzzy membership ranges using fleet safety records from road and rail operators;
- -
- validating output probabilities against incident frequencies from the EMSA and ERA portals;
- -
- testing the model on simulated transport corridor data to assess predictive sensitivity.
Moreover, the model may be embedded into digital twin environments, allowing real-time adaptation of fuzzy rules and logic gates in response to operational data streams [68].
Also, the fuzzy inference layer in this study currently uses static membership functions and rule bases defined through expert elicitation and supported by the literature. While this approach enables the modeling of ambiguous human-centric concepts (e.g., fatigue, stress, training quality), it lacks the ability to adapt or self-correct based on empirical feedback. Future work will focus on data-driven recalibration using historical failure records and real-time operational telemetry. Adaptive fuzzy systems, such as adaptive neuro-fuzzy inference systems (ANFISs), offer a hybrid approach that can blend expert intuition with empirical optimization. Recent applications in maritime risk modeling have successfully employed machine-learned fuzzy sets to dynamically reflect shift data, biometric fatigue indicators, and environmental stress factors [69]. Integrating these methods will improve the model’s external validity, especially in high-frequency transport operations with feedback-rich environments.
- c.
- Quantitative validation strategy and data constraints.
An essential aspect of risk modeling is ensuring the alignment between estimated risk levels and observed real-world incidents. Statistical validation techniques, such as the Spearman rank correlation coefficient, Brier score, or ROC-AUC (Receiver Operating Characteristic–Area Under Curve), are well-established metrics used to quantify the accuracy of probabilistic forecasts against empirical data. These tools are particularly relevant in safety-critical domains such as transport risk modeling.
The authors undertook a structured attempt to acquire incident datasets from the European Maritime Safety Agency (EMSA), the European Union Agency for Railways (ERA), and the European Transport Safety Council (ETSC). The goal was to perform a multi-year quantitative validation using historical incident data for the maritime, rail, and road domains, respectively, ideally over the period 2021–2023. Although narrative reports and high-level summaries were accessible, detailed time-series or event-specific logs, necessary to perform matched correlation or classification analyses, were not publicly available in a suitable format.
Given this limitation, the authors employed a complementary internal validation approach to assess the model’s numerical behavior and sensitivity, consisting of the following:
- -
- applying a ±15% perturbation range to selected fuzzy-weighted inputs and base probabilities;
- -
- monitoring variations in computed joint probabilities across all transport modes;
- -
- assessing the persistence of risk rankings and system-level event likelihoods.
The resulting probability bands under sensitivity testing were as follows: maritime (0.401–0.543), road (0.295–0.399), and rail (0.162–0.218). These variations confirm the model’s numerical stability and directional consistency under input uncertainty. Importantly, the relative prioritization of transport modes remained unchanged across the tested parameter ranges, reinforcing confidence in the structural integrity of the model under expert-driven perturbation.
The sensitivity tests revealed that the model remained stable and directionally consistent under parameter variation. Notably, risk hierarchies between the maritime, road, and rail systems were preserved, and final probability shifts remained within an 8% deviation margin from baseline. These findings support the internal consistency and robustness of the model’s probabilistic structure.
Moreover, the integration of the Bayesian network overlay, as discussed in Section 4.6, introduced a probabilistically grounded method for incorporating known dependencies among key risk variables. These mitigated potential distortions caused by the independence assumption inherent in classical FTA formulations, particularly in human and organizational risk categories.
While external statistical validation remains an important goal, it is constrained in this instance by data availability rather than model structure. The proposed framework was intentionally designed to be modular and extensible, allowing for future updates once access to detailed incident datasets is secured. Formal data access requests and institutional collaborations are planned as part of our future work to enable a rigorous, multimetric empirical validation.
5.6. International Benchmarking and Model Alignment
This section provides context for how the designed model compares to and could align with leading international frameworks and data sources, using the international benchmarking and model alignment. Therefore, to broaden the applicability and relevance of the proposed multimodal risk analysis framework, it is important to compare and align it with international standards and regulatory models. Several global institutions and protocols offer structured approaches to transport risk identification, quantification, and mitigation. A brief comparison of selected frameworks in support of the present research is shown in Table 13.
Table 13.
International benchmarking and model alignment (Source: authors’ data processing from literature review).
These alignments show that the model is not only grounded in well-established techniques, like FTA and fuzzy sets, but is also extensible toward behavioral safety frameworks, quantitative performance indicators, and AI-ready architectures that regulators increasingly favor.
5.7. Model Validation Against Empirical Incident Data
Although the present model is designed primarily as a diagnostic and comparative risk assessment tool, not a predictive classifier, it is important to assess the degree to which its outputs reflect real-world conditions. To that end, we validated the model’s relative risk output against the empirical incident data provided by authoritative sources, including the European Maritime Safety Agency, the European Union Agency for Railways, and the European Commission’s Road Safety Dashboard. These data sources report aggregated causal distributions of incidents across key domains, such as human error, technical failure, environmental conditions, and organizational shortcomings. The empirical distributions were compared with the model-generated risk rankings for maritime, rail, and road transport.
To assess alignment, we computed the Spearman rank-order correlation coefficient (ρ) between the model-derived rank of sub-risks and the external empirical rank order by cause category. The results are summarized in Table 14.
Table 14.
Spearman correlation between model risk rankings and empirical incident distributions (source: authors’ calculations).
These results indicate that the model’s identification of dominant risk contributors, particularly human behavior and fatigue-related factors, closely matches the historical patterns reported by sector-specific agencies. For instance, EMSA attributes over 50% of maritime casualties to human error and operational lapses, while our model identifies human behavior, inadequate training, and fatigue as the top three contributors, with a combined score exceeding 60% in the maritime context [33,34]. Similarly, the European Union Agency for Railways reports that operational rules violations, signal misinterpretation, and fatigue are key risk drivers in rail transport, an output echoed by our model’s top-ranked risk categories for that mode [55].
It is important to note that the absolute probabilities produced by the model (e.g., p = 0.9960 for road) do not represent empirical failure rates but rather the aggregated presence of risk conditions under a conservative assumption of independence. This assumption leads to risk inflation but ensures that critical contributors are not understated. As noted by Zio (2009), conservative aggregation is appropriate in early-stage risk design when uncertainty and interaction effects are not fully modeled [13,14]. For future versions of this framework, we plan to introduce more advanced validation strategies, such as the following:
- -
- ROC curve and AUC analysis when binary failure labels are available [72];
- -
- Bayesian posterior predictive checks to assess model fit to empirical data [73];
- -
- Cross-validation techniques, once longitudinal datasets with labeled incidents are compiled.
5.8. Model Alignment with Established Risk Frameworks
Also, in previous sections, we proposed that the hybrid model aligns with leading risk assessment frameworks, including FMCSA (USA), NHTSA (USA), and ISO 31010 (international). To substantiate this claim, we conducted a structured mapping of the model’s sub-risk categories and methods against these frameworks. Table 15 provides an overview of this alignment.
Table 15.
Alignment of model components with the FMCSA, NHTSA, and ISO 31010 risk frameworks (source: authors’ analysis).
This mapping shows that the model covers core FMCSA Safety Measurement System (SMS) categories, such as driver fatigue, unsafe driving, and vehicle maintenance, using corresponding variables in the fault tree and fuzzy logic layers. Similarly, NHTSA’s behavioral domains (attention, workload, decision-making) are directly represented by fuzzy sets for fatigue, communication breakdown, and procedural non-compliance. Finally, ISO 31010’s recommended qualitative methods (e.g., fault tree analysis, fuzzy evaluation) are methodologically consistent with the tools used in this study [71].
This crosswalk demonstrates that the present approach is conceptually aligned with and partially compliant with these regulatory and methodological standards.
6. Future Research: Analysis of Model Integration with Hybrid FTA-AI and Fuzzy–Bayesian Models
In recent years, the integration of fault tree analysis (FTA) with artificial intelligence (AI) and probabilistic reasoning frameworks, such as Bayesian networks (BNs), has emerged as a prominent direction in complex system risk modeling. These hybrid approaches aim to overcome the limitations of traditional static models by enabling data-driven learning, real-time updates, and interdependency tracking between failure events.
One significant hybridization trend involves the coupling of fuzzy logic and Bayesian networks, known as fuzzy–Bayesian models. These models fuse expert knowledge and subjective estimations (captured through fuzzy sets) with probabilistic inference capabilities inherent in Bayesian structures. In complex transport environments, such as maritime and rail systems, this allows risk estimations to evolve dynamically as more operational data becomes available [74]. For instance, a fuzzy estimation of “poor weather conditions” can be updated based on real-time meteorological inputs using Bayesian updating.
Another emerging area is the combination of FTA with AI-based techniques, particularly machine learning, neural networks, and deep learning models. AI-enhanced FTA models use pattern recognition and anomaly detection algorithms to predict the likelihood of fault propagation under different conditions. For example, deep neural networks have been trained on historical logistics failure data to identify precursors to risk events, such as infrastructure degradation or driver fatigue [75,76]. These insights can be incorporated into dynamic fault tree nodes, enabling adaptive logic gate behavior based on real-time data.
Additionally, digital twin systems, which pair physical transport systems with virtual, continuously updating replicas, are being integrated with FTA and fuzzy logic to create responsive risk ecosystems. In such systems, sensor data (e.g., from vehicles, terminals, or weather stations) feeds into fuzzy–FTA models that adjust node probabilities or fuzzy rules in real time [68,77]. This allows decision-makers to proactively assess vulnerability shifts and initiate mitigation protocols before cascading failures occur.
By comparison, the current study’s model provides a flexible framework that lays the groundwork for future integration with these AI-enhanced systems. The use of fuzzy fault trees, dynamic logic gates, and quantitative indicators (MTTF, MTBF) makes it highly compatible with both probabilistic (Bayesian) and data-driven (AI) enhancements. While this work remains grounded in expert-driven modeling, the structure is extendable to incorporate the following:
- -
- Bayesian learning for updating fuzzy membership probabilities;
- -
- AI-driven adjustment of rule weights based on operational feedback.
In situating this research within the broader field, it aligns with the methodological progression from deterministic safety models toward adaptive and intelligent risk analytics platforms, supporting the evolution of multimodal logistics systems into high-reliability networks.
The model developed in this study provides a structured and modular foundation that is highly amenable to future integration with hybrid FTA–AI and fuzzy–Bayesian frameworks. Its use of fault tree analysis (FTA), dynamic fault trees (DFTs), and fuzzy logic—combined with quantitative indicators like MTTF and MTBF—forms a robust architecture for adaptive and learning-based extensions.
- a.
- Fuzzy–Bayesian integration possibility.
- -
- The present fuzzy sets and rule bases, which handle subjective parameters such as fatigue (M1.4), training (M1.3), and weather (M3.35), can serve as prior probability distributions in a Bayesian framework.
- -
- For instance, the fuzzy membership degree for “high fatigue” could be used as a prior in a Bayesian node. When operational data become available (e.g., biometric sensors, shift records), the fuzzy risk estimates can be updated using Bayesian inference.
- -
- This approach would allow for the dynamic recalibration of risk levels based on real-time or historical data, leading to a fuzzy–Bayesian fault tree.
- b.
- AI-Enhanced node prediction.
- -
- Some of the more data-sensitive components of the model, like M1.3 (training), M2.13 (vehicle defect detection), or M3.39 (traffic overload), can be paired with machine learning algorithms, such as classification models (e.g., decision trees, SVM), for predicting component failures or recurrent neural networks (RNNs) for time-series sensor data on fatigue or route delays.
- -
- These models could feed predicted likelihoods directly into fault tree nodes or fuzzy rules, enabling data-driven adaptation of the fault structure or weights.
- c.
- Fault propagation learning.
- -
- The current dynamic logic gates (SEQ, SPARE) could be extended with reinforcement learning agents that simulate fault propagation over time and learn optimal mitigation sequences.
- -
- This is especially relevant in multimodal logistics, where intermodal dependencies (e.g., port-to-rail delays) are hard-coded today but could be learned and updated using AI agents that interact with real-time logistics data.
- d.
- Digital Twin synchronization.
- -
- Since our model outputs clear quantitative risk scores and root-cause pathways, it is compatible with digital twin architectures in logistics.
- -
- A virtual representation of a freight corridor or terminal could continuously update node risk levels using real-time operational input (e.g., vehicle telemetry, port queue lengths), thus running the fuzzy–FTA engine in real-time.
By incorporating AI learning algorithms and Bayesian updating into the current fuzzy–FTA framework, the following wide spectrum of benefits may be drawn:
- -
- Risk predictions become dynamic rather than static;
- -
- The model can learn from operational outcomes (e.g., delays, breakdowns);
- -
- The system becomes proactive, issuing alerts before failures materialize;
- -
- Human judgment is augmented, not replaced, through explainable decision support.
7. Conclusions: Research Contribution
This study positions itself at the intersection of qualitative and probabilistic risk modeling, contributing a novel hybrid approach to multimodal freight transport analysis. While prior studies explored FTA or fuzzy fault trees in isolation, this model uniquely integrates dynamic sequences, probabilistic intervals, and system reliability indicators into a unified pipeline. It extends existing frameworks by offering a comparative, quantifiable assessment across transport modes, representing a significant step toward adaptive and AI-compatible risk management systems.
The novelty of this research lies in the advanced integration of dynamic fault trees (DFTs), fuzzy logic analysis, and quantitative tools for assessing risk reliability and sensitivity within a unified logistics model. Unlike traditional approaches, which are often limited to static risk analysis, this study introduces dynamic scenarios to capture the complexity and real-world conditionalities of the logistics system. The major contribution of this research is the development of a methodology that combines advanced mathematical principles with applied logistics concepts, resulting in a robust and scalable model for analyzing operational risks in multimodal transport. This interdisciplinary integration opens new avenues for future research and contributes to an enhancement in logistics performance in complex and dynamic environments.
To elevate the predictive power and adaptability of the fuzzy fault tree model, future research and industrial applications should consider integrating AI-based analytics and real-time data streams. While the current model excels at capturing expert knowledge and linguistic uncertainty, it remains static and rule-based. By combining it with machine learning (ML) and Internet of Things (IoT) sensor data, the framework could evolve into a dynamic, continuously learning system capable of real-time risk forecasting.
In logistics operations, AI algorithms can process vast data from GPS, biometric wearables, vehicle telemetry, warehouse automation systems, and training logs. These data can be used to automatically tune fuzzy membership functions, identify new risk patterns, and even retrain rule sets without manual intervention. For instance, deep learning models could correlate eye-tracking fatigue signals or forklift movement anomalies with error incidents, feeding this insight back into the fault tree logic [75]. Such integration would transform the fuzzy fault tree into a hybrid model, where symbolic reasoning (via fuzzy logic) and data-driven insights (via AI) co-exist. This approach aligns with emerging paradigms in safety analytics, such as the digital twin concept, where a live, data-enriched model mirrors real-world processes and provides predictive risk updates on the fly [68].
Moreover, real-time sensors can act as continuous input nodes to the fault tree system. For example, fatigue detection cameras in trucks, environmental noise sensors in distribution centers, or motion alerts from wearable PPE can trigger automated updates in risk levels. This would enable context-aware safety systems, where preventive actions (e.g., rerouting, rescheduling, sending alerts) are initiated before an incident materializes [31]. Expanding the model in this direction would not only increase predictive accuracy but also support continuous improvement in safety management, meeting the demands of high-reliability logistics networks and modern regulatory expectations.
Alternatively, from a policymaker perspective, the integrated risk modeling framework developed in this study, combining fault tree analysis, dynamic fault trees, and fuzzy logic, may present powerful opportunities not only for logistics companies but also for regulatory and oversight bodies at both national and supranational levels. In the context of the European Union’s transport safety objectives under programs such as the EU Road Safety Policy Framework 2021–2030, as well as the implementation of TEN-T (Trans-European Transport Network) and ITS (Intelligent Transport Systems) directives, this model can serve as a strategic tool for evidence-based governance. Regulatory agencies, such as the European Union Agency for Railways (ERA), the European Maritime Safety Agency (EMSA), and national road safety boards, can adopt the proposed model as a real-time dashboard module embedded in smart mobility platforms. By integrating live operational data (e.g., weather inputs, crew schedules, equipment status) with the fuzzy logic framework, agencies can simulate evolving risk profiles across transport corridors or intermodal hubs. This capability would allow institutions to forecast disruption likelihoods under specific environmental or human performance scenarios, thus identifying system-level vulnerabilities (e.g., high-risk crossings, fatigued workforce clusters) or triggering preemptive inspections or audits in logistics nodes with rising probabilistic risk indices. Moreover, using the model’s outputs in conjunction with GIS-based visualization layers, transport authorities could spatially monitor modal vulnerabilities and deploy targeted mitigation measures more efficiently than with traditional statistical reviews.
One of the most compelling aspects of the model is its ability to standardize risk assessment across modes—road, rail, and maritime—thus promoting inter-agency and intermodal harmonization. This is especially relevant for EU-wide goals to streamline transport safety frameworks under Unified Risk Management Systems (URMSs), reducing duplication and improving data cohesion. Beyond immediate operational applications, this model can support long-term infrastructure planning by identifying which failure pathways (e.g., human factors, poor maintenance, environmental stressors) most frequently degrade system reliability. This will allow for infrastructure retrofitting and redesign in high-risk segments. As European transport policy continues to evolve under the Green Deal and Digital Europe frameworks, such hybrid models offer both strategic foresight and tactical granularity, ensuring that safety improvements keep pace with technological- and climate-related disruptions.
In conclusion, this research does not offer a final consensus on risk in multimodal transport. Instead, it provides a methodologically rigorous yet conceptually flexible foundation for a new conversation about safety, resilience, and the subtle interplay between human judgment and systemic design. It is both a reflection on the current state of transport risk modeling and a call to action for the next generation of intelligent, explainable, and integrated decision support systems.
Author Contributions
Conceptualization, C.P., O.S., I.G. and F.N.; methodology, C.P., O.S. and I.G.; software, C.P., O.S. and I.G.; validation, C.P., O.S. and I.G.; formal analysis, C.P., O.S., I.G. and F.N.; investigation, C.P., O.S., I.G. and F.N.; resources, C.P., O.S., I.G. and F.N.; data curation, C.P., O.S., I.G. and F.N.; writing-original draft preparation, C.P., O.S., I.G. and F.N.; writing-review and editing, C.P., O.S., I.G. and F.N.; visualization, C.P., O.S., I.G. and F.N.; supervision, C.P.; project administration, C.P.; funding acquisition, C.P., O.S., I.G. and F.N. All authors have read and agreed to the published version of the manuscript.
Funding
This research received no external funding.
Data Availability Statement
The original contributions presented in this study are included in this article. Further inquiries can be directed to the corresponding author.
Conflicts of Interest
The authors declare no conflicts of interest.
References
- Steadie Seifi, M.; Dellaert, N.; Nuijten, W.; Van Woensel, T.; Raoufi, R. Multimodal freight transportation planning: A literature review. Eur. J. Oper. Res. 2014, 233, 1–15. [Google Scholar] [CrossRef]
- He, Z.; Navneet, M.; van Dam, K.H.; Van Mieghem, P. A resilience-oriented risk assessment framework for multimodal transport systems. Transp. Res. Part C Emerg. Technol. 2021, 128, 103152. [Google Scholar]
- Vesely, B. Fault Tree Analysis (FTA): Concepts and Applications; NASA HQ: Washington, DC, USA, 2002.
- Ruijters, E.; Stoelinga, M. Fault Tree Analysis: A Survey of the State-of-the-Art in Modeling, Analysis and Tools. Comput. Sci. Rev. 2015, 15–16, 29–62. [Google Scholar] [CrossRef]
- Lei, C.; MacKenzie, C.A. System risk in maritime engineering. Int. J. Marit. Res. 2021, 14, 123–136. [Google Scholar]
- Aslansefat, K.; Kabir, S.; Gheraibia, Y.; Papadopoulos, Y. Integrated safety and reliability modelling using dynamic fault trees and Bayesian networks. J. Intell. Fuzzy Syst. 2020, 38, 2851–2862. [Google Scholar] [CrossRef]
- Hryniewicz, O. Fuzzy sets in the evaluation of reliability. Intell. Reliab. Eng. 2007, 40, 363–386. Available online: https://link.springer.com/chapter/10.1007/978-3-540-37372-8_13 (accessed on 28 February 2025).
- Tunçel, G.; Akyuz, E.; Arslan, O. An Extended Event Tree Risk Analysis Under Fuzzy Logic Environment: The Case of Fire in Ship Engine Room. J. ETA Marit. Sci. 2021, 9, 210–220. Available online: https://jag.journalagent.com/jems/pdfs/JEMS_9_3_210_220.pdf (accessed on 28 February 2025). [CrossRef]
- Papadimitriou, K.; Papazoglou, I.A.; Tsolakis, N. Modeling cascading failures in multimodal transport systems using dynamic fault trees. Reliab. Eng. Syst. Saf. 2020, 199, 106906. [Google Scholar] [CrossRef]
- Papadimitriou, E.; Schneider, C.; Tello, J.; Damen, W.; Vrouenraets, M.; Broeke, A. Transport safety and human factors in the era of automation: What can transport modes learn from each other? J. Accid. Anal. Prev. 2020, 144, 105656. [Google Scholar] [CrossRef]
- Wu, Y.; Yip, T.L.; Yan, X.; Soares, C.G. Human factors in shipping accident investigation reports. Mar. Policy 2022, 137, 104931. [Google Scholar]
- Wu, B.; Yip, T.; Yan, X.; Soares, C. Review of techniques and challenges of human and organizational factors analysis in maritime transportation. Reliab. Eng. Syst. Saf. 2022, 219, 108249. [Google Scholar] [CrossRef]
- Zio, E. The Monte Carlo Simulation Method for System Reliability and Risk Analysis; Springer Series in Reliability Engineering: Berlin/Heidelberg, Germany, 2009. [Google Scholar]
- Zio, E. Computational Methods for Reliability and Risk Analysis; World Scientific: Singapore, 2009. [Google Scholar]
- Ali, M.; Khan, F.; Haddara, M. A risk-based fuzzy logic model to improve training effectiveness in process industries. Saf. Sci. 2020, 129, 104839. [Google Scholar] [CrossRef]
- Sadeghian, R.; Khakzad, N.; Reniers, G.; Cozzani, V. A dynamic risk assessment framework using fuzzy fault tree analysis and Bayesian networks. Expert Syst. Appl. 2020, 160, 113381. [Google Scholar] [CrossRef]
- Ghasemi, F.; Yari, G.; Mohammadfam, I.; Yousefi, R. Development of a novel fuzzy Bayesian fault tree analysis model for risk analysis in complex systems. J. Loss Prev. Process Ind. 2019, 59, 89–101. [Google Scholar] [CrossRef]
- Lasota, M.; Jacyna, M.; Szaciłło, L. Fault tree method as a decision-making tool for assessing the risks of transportation of dangerous loads. Zesz. Naukowe. Transport. 2024, 123, 133–154. Available online: https://yadda.icm.edu.pl/baztech/element/bwmeta1.element.baztech-abdd86a7-2646-416e-9b56-f6cd6d464237/c/133_SJSUTST123_2024_Lasota_Jacyna_Szacillo.pdf (accessed on 28 February 2025). [CrossRef]
- Akyuz, E. Application of fuzzy FMEA to perform an extensive risk analysis in maritime transportation engineering. Int. J. Marit. Eng. 2017, 159, No. A1. [Google Scholar] [CrossRef]
- Akyuz, E.; Arslan, O.; Turan, O. Application of fuzzy logic to fault tree and event tree analysis of the risk for cargo liquefaction on board ship. Appl. Ocean Res. 2020, 96, 102089. Available online: https://www.sciencedirect.com/science/article/pii/S0141118719310296 (accessed on 28 February 2025). [CrossRef]
- Rajadurai, M.; Kaliyaperumal, P. Optimizing multimodal transportation: A novel decision-making approach with fuzzy risk assessment. IEEE Access 2025, 13, 14584–14610. Available online: https://ieeexplore.ieee.org/document/10836710 (accessed on 28 February 2025).
- Zio, E.; Aven, T. Uncertainty assessment in system analysis for design, operation and regulation of engineered systems. Reliab. Eng. Syst. Saf. 2013, 115, 110–125. [Google Scholar]
- Koohathongsumrit, N.; Meethom, W. A fuzzy decision-making framework for route selection in multimodal transportation networks. Eng. Manag. J. 2022, 34, 689–704. Available online: https://www.tandfonline.com/doi/abs/10.1080/10429247.2022.2027205 (accessed on 28 February 2025). [CrossRef]
- Paraskevadakis, D.; Yang, Z.; Riahi, R. An integrated fuzzy risk assessment for seaport operations. Saf. Sci. 2014, 68, 180–194. Available online: http://researchonline.ljmu.ac.uk/id/eprint/1787/2/An_integrated_fuzzy_risk_assessment_for_seaport_operations.pdf (accessed on 28 February 2025).
- Huang, Y.; Wen, X.; Zhang, F.; Han, H.; Sui, Z. A review on risk assessment methods for maritime transport. Ocean Eng. 2023, 283, 114988. Available online: https://www.sciencedirect.com/science/article/pii/S0029801823009617 (accessed on 28 February 2025). [CrossRef]
- Rausand, M.; Høyland, A. System Reliability Theory: Models, Statistical Methods, and Applications; John Wiley & Sons: Hoboken, NJ, USA, 2003. [Google Scholar]
- Wan, C.; Yan, X.; Zhang, D.; Qu, Z.; Yang, Z. An advanced fuzzy Bayesian-based FMEA approach for assessing maritime supply chain risks. Transp. Res. Part E Logist. Transp. Rev. 2019, 129, 87–106. Available online: https://researchonline.ljmu.ac.uk/id/eprint/10373/3/An%20advanced%20fuzzy%20Bayesian-based%20FMEA%20approach%20for%20assessing%20maritime%20supply%20chain%20risks.pdf (accessed on 28 February 2025). [CrossRef]
- Mahmood, Y.A.; Ahmadi, A.; Verma, A.K.; Srividya, A. Fuzzy fault tree analysis: A review of concept and application. J. Inst. Eng. Ser. C 2013, 94, 21–36. Available online: https://www.researchgate.net/publication/257798804_Fuzzy_fault_tree_analysis_A_review_of_concept_and_application (accessed on 28 February 2025). [CrossRef]
- Budiyanto, M.A.; Fernanda, H. Risk assessment of work accident in container terminals using the fault tree analysis method. J. Mar. Sci. Eng. 2020, 8, 466. Available online: https://www.mdpi.com/2077-1312/8/6/466 (accessed on 28 February 2025). [CrossRef]
- Zadeh, L.A. Fuzzy sets. Inf. Control 1965, 8, 338–353. [Google Scholar] [CrossRef]
- Yang, S.; Qi, Q.; Jiang, Z. Digital twin-driven intelligent maintenance strategy for logistics systems. Robot. Comput.-Integr. Manuf. 2023, 82, 102553. [Google Scholar]
- Lavasani, S.M.; Wang, J.; Yip, T.L. A risk assessment model for the maritime transportation system using Bayesian networks. Saf. Sci. 2015, 79, 242–254. [Google Scholar] [CrossRef]
- European Maritime Safety Agency (EMSA). Annual Overview of Marine Casualties and Incidents in 2023; EMSA: Lisboa, Portugal, 2022. Available online: https://emsa.europa.eu/thetis-mrv/download/7639/5055/23.html (accessed on 28 February 2025).
- European Maritime Safety Agency. Annual Overview of Maritime Accidents 2014–2022; EMSA: Brussels, Belgium, 2023. Available online: https://safety4sea.com/wp-content/uploads/2023/10/EMSA-Annual-Overview-of-Marine-CasualtieS-and-Incidents-2023_10.pdf (accessed on 28 February 2025).
- Romanian Naval Authority. Incident Reports on Romanian Maritime Sector; ANR: Bucharest, Romania. Available online: https://portal.rna.ro/despre-noi/rapoarte-%C8%99i-studii (accessed on 28 February 2025).
- International Group of P&I Clubs. Pilotage Claims Review 1999–2019; IGP&I.: London, UK, 2020; Available online: https://www.steamshipmutual.com/sites/default/files/downloads/press-releases/IGPI%20Pilotage%20Report.pdf (accessed on 28 February 2025).
- Per Stornes. Risk influencing factors in maritime accidents: An exploratory statistical analysis of the Norwegian Maritime Authority incident database. NTNU Soc. Res. 2015, 7, 122. [Google Scholar]
- Coman, G. Statistics—Theory and Applications; PIM Publishing House: Iasi, Romania, 2007. [Google Scholar]
- Kutner, M.; Christopher, J.; John, N. Applied Linear Statistical Models, 5th ed.; McGraw Hill: New York, NY, USA, 2005. [Google Scholar]
- Bogalecka, A. Collision and Contact—Analysis of Accidents at Sea. Transnav 2024, 18, 75–85. [Google Scholar] [CrossRef]
- United Nations Conference on Trade and Development, United Nations. Review of Maritime Transport 2020-2024; UN Trade and Development: Geneva, Switzerland, 2024. Available online: https://unctad.org/publication/review-maritime-transport-2024 (accessed on 28 February 2025).
- Kowalska, J. Communication gaps in seafaring. Int. Marit. Health 2022, 73, 101–108. [Google Scholar] [CrossRef]
- Port Health and Safety Leadership Group. Building a Fatigue Risk Management System: Guidelines; Port Health and Safety Leadership Group: Wellington, New Zealand, 2022. Available online: https://www.maritimenz.govt.nz/media/w0aby0rz/building-fatigue-risk-management-system-guidelines.pdf (accessed on 28 February 2025).
- Det Norske Veritas. DNV Maritime Safety Annual Review; DNV: Oslo, Norway, 2023; Available online: https://brandcentral.dnv.com/download/DownloadGateway.dll?h=BE1B38BB718539CC0AB58A5FF2EA7A83965E1186F7CA7E0AA6D1316D03DCF5D1FF2DF32FE46237FEDE2F0DDA7A28E140 (accessed on 28 February 2025).
- Chen, T. Low-visibility factors in maritime engineering. Int. J. Marit. Eng. 2016, 13, 43–54. [Google Scholar]
- American Bureau of Shipping. ABS Maritime Incident Review; ABS: Houston, TX, USA, 2022; Available online: https://ww2.eagle.org/content/dam/eagle/publications/annual-review/abs-annual-review-2022.pdf (accessed on 28 February 2025).
- World Maritime University. Fleet Aging and Risk Factors in Maritime Operations; WMU: Malmö, Sweden, 2023. [Google Scholar]
- Allianz Global Corporate & Specialty. Safety and Shipping Review 2023; AGCS: London, UK, 2023; Available online: https://commercial.allianz.com/content/dam/onemarketing/commercial/commercial/reports/Commercial-Safety-Shipping-Review-2024.pdf (accessed on 28 February 2025).
- Norwegian Maritime Authority. Report Risk Influencing Factors; NTNU Research: Trondheim, Norway, 2015.
- European Commission. EU Road Safety Policy Framework 2021–2030—Next Steps Towards “Vision Zero”; European Commission: Brussels, Belgium, 2020. Available online: https://ec.europa.eu (accessed on 28 February 2025).
- European Commission. Annual Statistical Report on Road Safety in the EU 2024; Mobility and Transport: Brussels, Belgium, 2024. Available online: https://road-safety.transport.ec.europa.eu/document/download/b30e9840-4c22-4056-9dab-0231a98e7356_en?filename=ERSOnext_AnnualReport_20240229.pdf (accessed on 28 February 2025).
- NHTSA. Freight Safety and Crash Causation Data Analysis; National Highway Traffic Safety Administration: Washington, DC, USA, 2021. Available online: https://www.nhtsa.gov (accessed on 28 February 2025).
- Ministry of Transport PRC. Annual Report on Logistics Development in China; Chinese Ministry of Communications: Beijing, China, 2020. Available online: http://www.mot.gov.cn (accessed on 28 February 2025).
- FMCSA. Safety Measurement System (SMS) Methodology; Department of Transportation: Washington, DC, USA, 2022.
- European Union Agency for Railways (ERA). Railway Safety Performance Report; ERA: Valenciennes, France, 2022; Available online: https://www.era.europa.eu (accessed on 28 February 2025).
- Varra, G.; Della Morte, R.; Tartaglia, M.; Fiduccia, A.; Zammuto, A.; Agostino, I.; Booth, C.A.; Quinn, N.; Lamond, J.E.; Cozzolino, L. Flood susceptibility assessment for improving the resilience capacity of railway infrastructure networks. Water 2024, 16, 2592. [Google Scholar] [CrossRef]
- Wallace, R.; Murthy, D.N. Reliability: Modeling, Prediction, and Optimization; John Wiley & Sons: Hoboken, NJ, USA, 2000; ISBN 9780471184508. Available online: https://onlinelibrary.wiley.com/doi/book/10.1002/9781118150481 (accessed on 28 February 2025).
- Wang, Y.; Dey, D.K. Generalized extreme value regression for binary response data: An application to B2B electronic payments system adoption. Ann. Appl. Stat. 2010, 4, 2000–2023. [Google Scholar] [CrossRef]
- Khakzad, N.; Khan, F.; Amyotte, P. Dynamic safety analysis of process systems by mapping bow-tie into Bayesian network. Process Saf. Environ. Prot. 2013, 91, 452–459. [Google Scholar] [CrossRef]
- Rao, K.; Gopika, V.; Sanyasi Rao, V.V.S.; Kushwaha, H.S.; Verma, A.K.; Srividya, A. Dynamic fault tree analysis using Monte Carlo simulation in probabilistic safety assessment. Reliab. Eng. Syst. Saf. 2009, 94, 872–883. [Google Scholar] [CrossRef]
- Bedford, T.; Cooke, R. Probabilistic Risk Analysis: Foundations and Methods; Cambridge University Press: Cambridge, UK, 2001. [Google Scholar]
- Saltelli, A.; Ratto, M.; Andres, T.; Campolongo, F.; Cariboni, J.; Gatelli, D.; Saisana, M.; Tarantola, S. Global Sensitivity Analysis: The Primer; John Wiley & Sons: Hoboken, NJ, USA, 2008. [Google Scholar]
- Vangelsten, B.V.; Aven, T. Uncertainty and risk in the assessment of transportation infrastructure: A resilience-based view. Reliab. Eng. Syst. Saf. 2021, 210, 107511. [Google Scholar]
- Karam, A. Supply chain resilience under geopolitical uncertainty: The case of Europe’s transport corridors. Transp. Policy 2023, 135, 28–40. [Google Scholar]
- Yan, X.; Yip, T.L.; Zhang, Y. Container port disruptions and resilience: Lessons from COVID-19. Marit. Policy Manag. 2022, 49, 330–345. [Google Scholar]
- International Maritime Organization (IMO). ISM Code and Guidelines on Implementation; IMO: London, UK, 2018. Available online: https://www.imo.org (accessed on 28 February 2025).
- Zhang, Y.; Liu, Y.; Liu, Y. Data-driven condition-based maintenance for railway systems: A review. Transp. Res. Part C Emerg. Technol. 2020, 114, 322–345. [Google Scholar]
- Lee, J.; Bagheri, B.; Kao, H.-A. A cyber-physical systems architecture for industry 4.0-based manufacturing systems. Manuf. Lett. 2015, 3, 18–23. [Google Scholar] [CrossRef]
- Gao, Z.; Xu, Y.; Liu, W. Adaptive fuzzy modeling for ship fatigue risk under complex environments. Ocean Eng. 2020, 216, 107646. [Google Scholar]
- FMCSA. Large Truck Crash Causation Study (LTCCS); Federal Motor Carrier Safety Administration: Washington, DC, USA, 2022. Available online: https://www.fmcsa.dot.gov (accessed on 28 February 2025).
- ISO. ISO 31010: 2019 Risk Management—Risk Assessment Techniques; International Organization for Standardization: Geneva, Switzerland, 2019; Available online: https://www.iso.org/standard/73381.html (accessed on 28 February 2025).
- Hanley, J.A.; McNeil, B.J. The meaning and use of the area under a receiver operating characteristic (ROC) curve. Radiology 1982, 143, 29–36. [Google Scholar] [CrossRef]
- Gelman, A.; Carlin, J.B.; Stern, H.S.; Dunson, D.B.; Vehtari, A.; Rubin, D.B. Bayesian Data Analysis, 3rd ed.; CRC Press: Boca Raton, FL, USA, 2014. [Google Scholar]
- Li, Y.; Yu, H.; Yang, J.; Xu, X. A hybrid fuzzy Bayesian network approach for risk analysis of maritime transport system. Ocean Eng. 2019, 186, 106138. [Google Scholar] [CrossRef]
- Zhao, R.; Yan, X.; Soares, C.G.; Liu, J. Intelligent fault diagnosis of maritime systems using deep learning and fault trees. Reliab. Eng. Syst. Saf. 2021, 212, 107610. [Google Scholar] [CrossRef]
- Zhao, Y.; Liu, Z.; Xu, W.; Wang, Y. Deep learning in human fatigue detection: A review. IEEE Trans. Hum.-Mach. Syst. 2021, 51, 204–215. [Google Scholar]
- He, Z.; Navneet, K.; van Dam, W.; Van Mieghem, P. Robustness assessment of multimodal freight transport networks. Reliab. Eng. Syst. Saf. 2021, 207, 107315. [Google Scholar] [CrossRef]
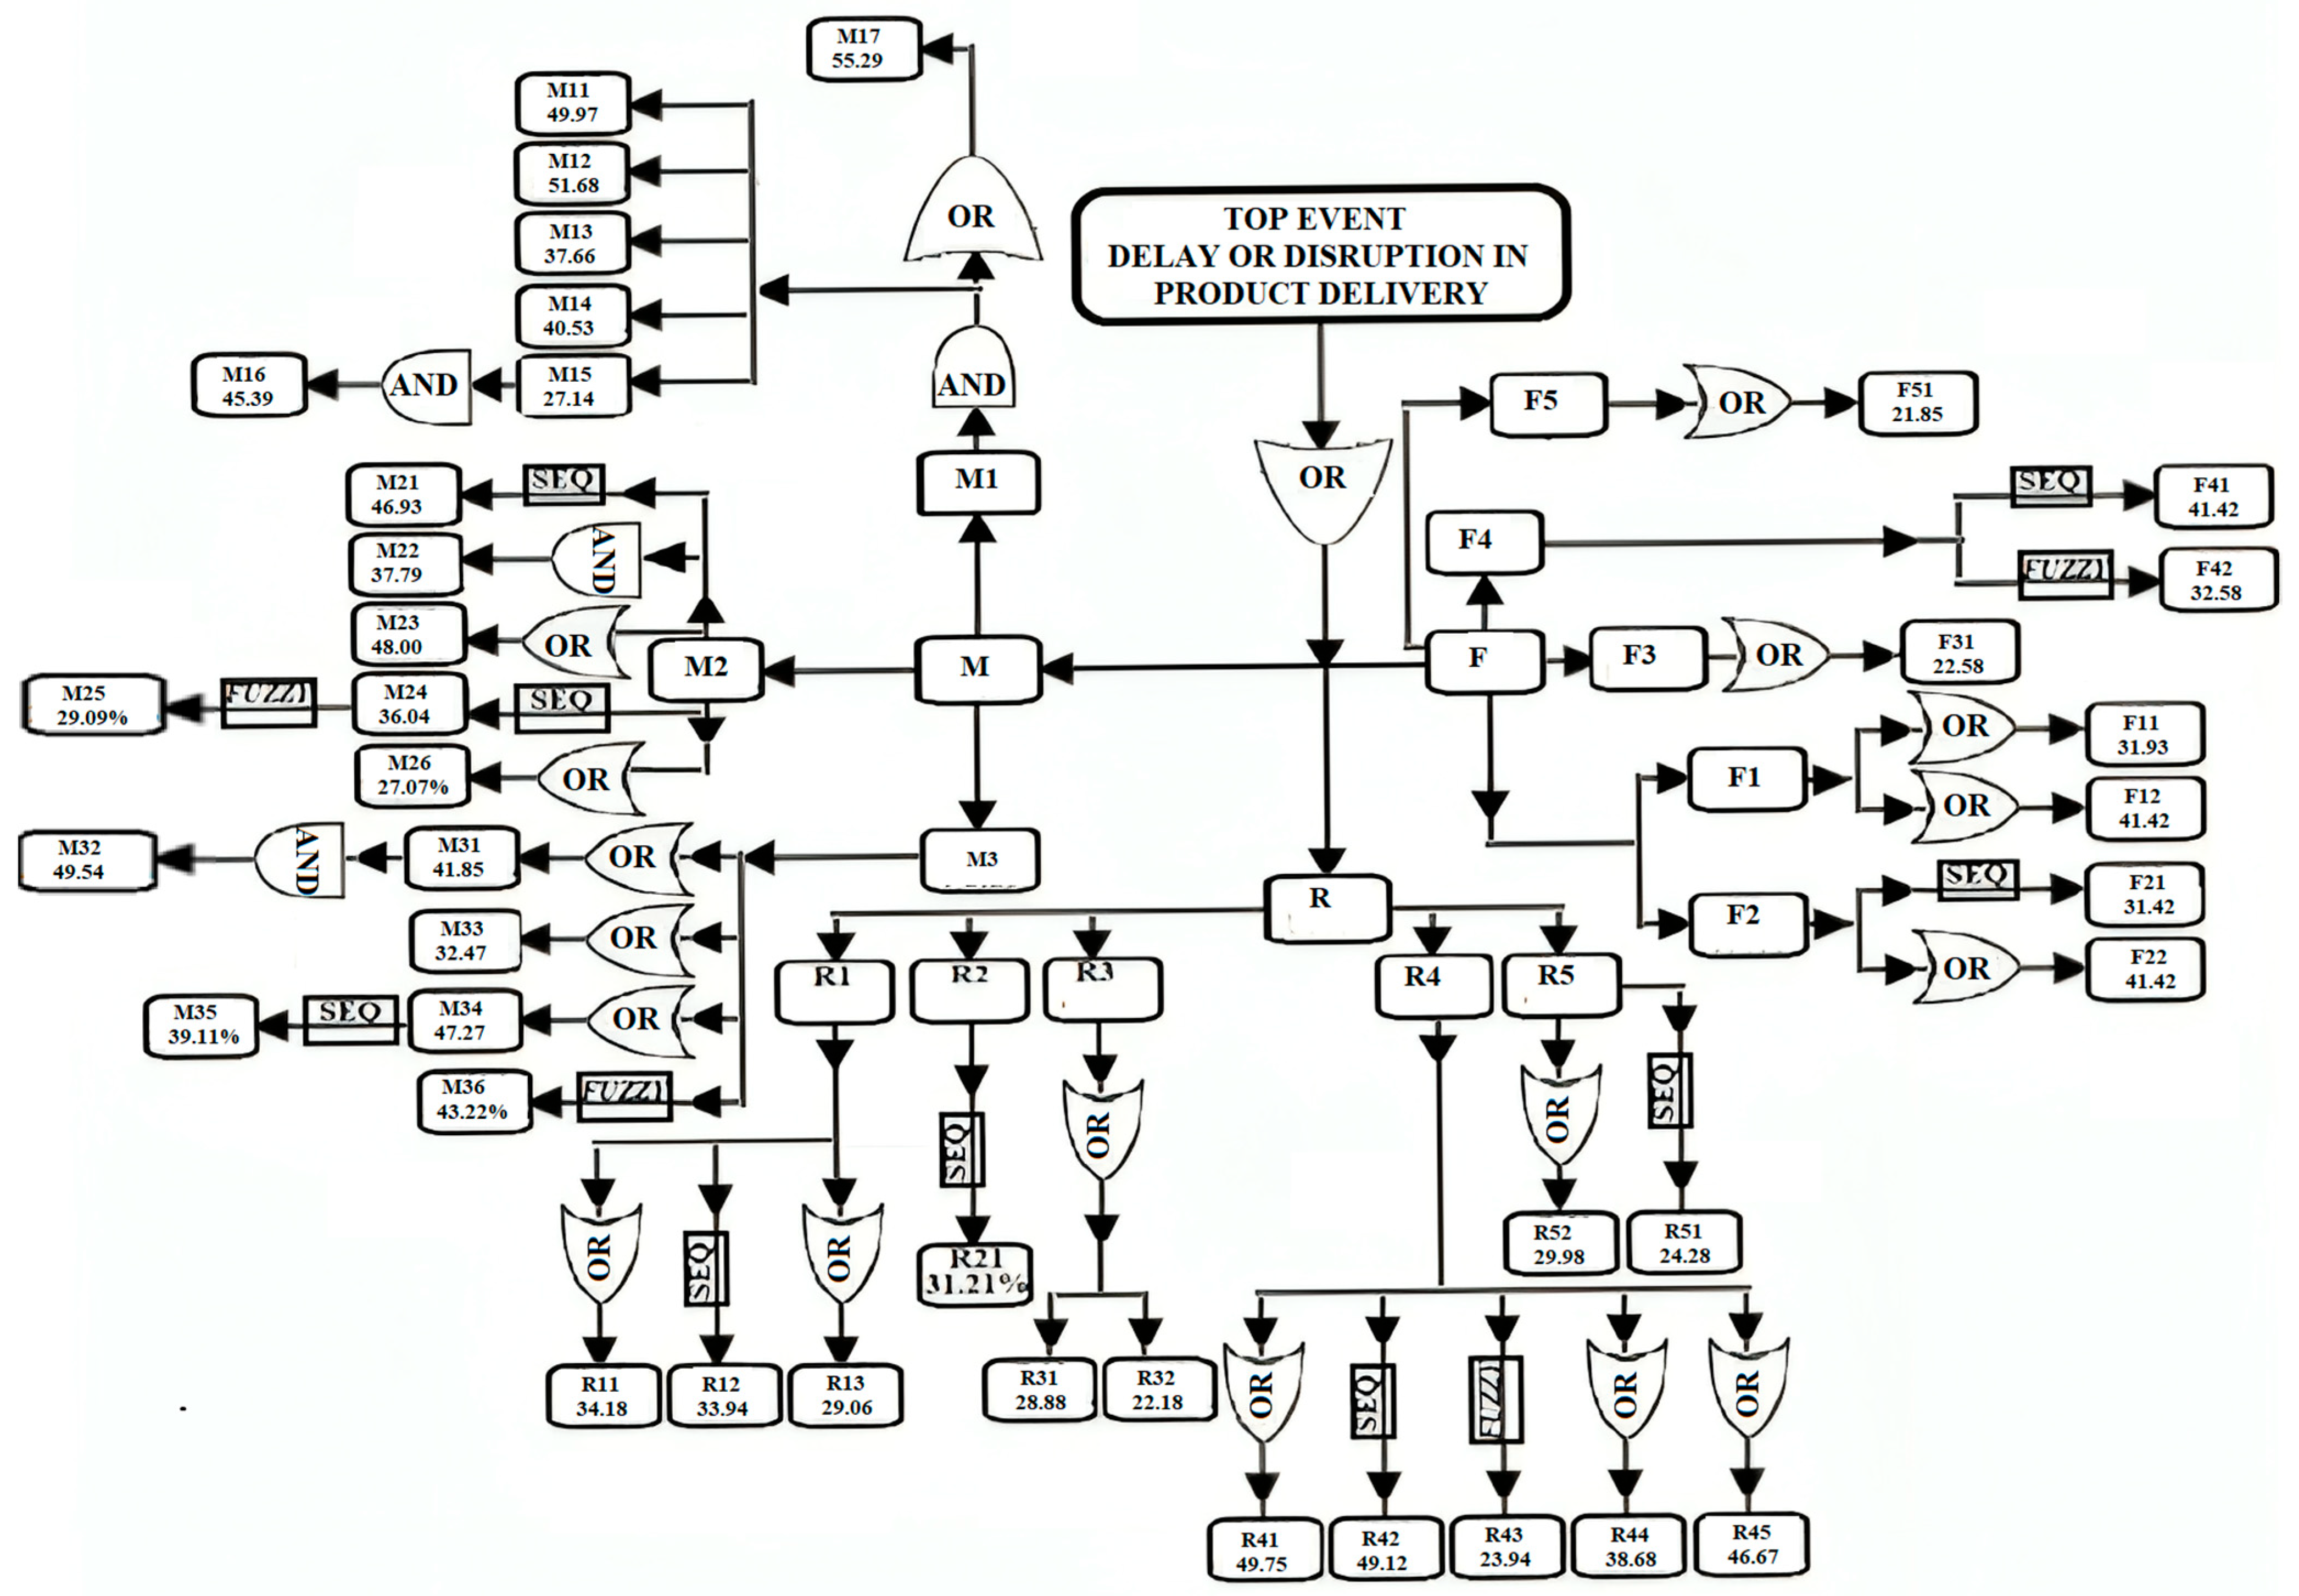


Disclaimer/Publisher’s Note: The statements, opinions and data contained in all publications are solely those of the individual author(s) and contributor(s) and not of MDPI and/or the editor(s). MDPI and/or the editor(s) disclaim responsibility for any injury to people or property resulting from any ideas, methods, instructions or products referred to in the content. |
© 2025 by the authors. Licensee MDPI, Basel, Switzerland. This article is an open access article distributed under the terms and conditions of the Creative Commons Attribution (CC BY) license (https://creativecommons.org/licenses/by/4.0/).