Article

An Evolutionary Game Analysis of Carbon Trading Mechanisms for Governments, Farmer Professional Cooperatives and Farmers

1
School of Economics and Management, Qingdao Agricultural University, Qingdao 266109, China
2
School of Agricultural Science and Practice, Royal Agricultural University, Cirencester GL7 6JS, Gloucestershire, UK
*
Author to whom correspondence should be addressed.
Systems 2025, 13(6), 413; https://doi.org/10.3390/systems13060413
Submission received: 17 April 2025 / Revised: 21 May 2025 / Accepted: 25 May 2025 / Published: 27 May 2025
(This article belongs to the Section Systems Practice in Social Science)

Abstract

:
Farmer professional cooperatives are the focus objects of agricultural carbon emission reduction; with the use of the advantages of scale economy and technology, one can promote the development of low-carbon agriculture. In order to study the influencing factors of agricultural carbon emission reduction on farmer professional cooperatives, we explore the interaction effects of carbon emission reduction behavior between farmer professional cooperatives and farmers under government interventions. This paper introduces a carbon transaction mechanism as well as reward and punishment polices into a tripartite evolutionary game model between farmer professional cooperatives, governments, and farmers. Based on the model, we identify a stable evolution strategy and perform simulation analysis. The results indicate that the carbon transaction mechanism can effectively suppress the negative effect of increased costs through higher revenues of the carbon transaction, and carbon prices above 60 CNY/ton enable cooperatives to reduce regional emissions. Higher revenues can promote positive carbon emission reduction behaviors of farmer professional cooperatives and farmers. The sharing ratio increases from 20% to 80%, and farmers gain additional benefits by cooperating in the farmer professional cooperative practices to reduce emissions. Rational regulation of carbon transaction price and quota can promote the participation of farmer professional cooperatives in carbon emission reduction practices and promote the farmers’ inclusion into farmer professional cooperatives.

1. Introduction

To achieve carbon neutrality, reducing carbon emissions from agriculture represents a key step and offers potential sequestration opportunities. Therefore, promoting low-carbon-emitting production techniques in this sector is a major area requiring academic research. In order to facilitate a low-carbon agricultural system transition, the carbon trading mechanism has emerged as an approach that encourages individuals and organizations to proactively evaluate their farming systems and helps lower energy consumption by reducing carbon emissions through valuation methods [1]. Consequently, the implementation of the carbon trading mechanism can greatly contribute to the successful realization of low-carbon agriculture development [2].
Currently, the Chinese carbon trading market is dominated by off-the-shelf quota transactions, with a subsidiary from China Certified Emission Reduction (CCER). Generally, agricultural carbon transactions fall under the CCER category. They require approval as projects with outputs of carbon emission reduction. This allows them to offset the insufficient quota which should be fulfilled [3,4]. For instance, the Hubei pilot carbon trading market facilitates agricultural carbon emission reductions by including them in a precision poverty alleviation project and introducing the farmers into the carbon trading market through counteracting mechanisms. The offset quota of this project under CCER reached 1.07 million tons, creating a revenue which exceeded RMB 16 million. However, due to the disadvantages of small-scale, outdated technology, and limited product diversity of farmers in China, it is difficult for many farmers to participate in CCER. This poses a challenge to the establishment of agricultural carbon trading mechanisms in China. Farmer professional cooperatives have the ability to involve more farmers through means such as scaling, intensification, marketization, and specialization [5,6]. Encouraged by government policies, the rapid emergence and growth of farmer professional cooperatives provides new opportunities for promoting agricultural carbon transactions. This allows for the efficient integration of agricultural resources, utilizing advanced technologies to increase agricultural carbon sequestration capacity and reduce carbon emissions in agricultural production [7,8]. This, in turn, supports CCER applications for farmer professional cooperatives. On the other hand, large-scale production and specialization increases the likelihood of approval for a CCER project [9].
With the development of rural markets and the progress of agricultural industrialization, farmer professional cooperatives, mainly characterized by large-scale land management and service, have emerged and expanded rapidly in China. They have become a significant force in guaranteeing stable income increases for farmers through the effective supply of agricultural products and the transformation and upgrading of agricultural production techniques. Farmer professional cooperatives (FPCs) not only have a higher production efficiency but also create many external benefits, such as reducing poverty [10,11], increasing non-agricultural employment [12,13], enhancing production technologies [14,15], promoting green development [16], and so on.
The existing literature on carbon emission reduction within farmer professional cooperatives primarily focuses on factors that influence it, as well as the measures and strategies related to it. Expanding the scale of these management entities is also an effective approach to achieving green agriculture. By implementing large-scale operations, farmer professional cooperatives can enhance mechanized processes, environmental conservation, and resource protection [17]. Various factors influence the engagement of farmer professional cooperatives in adopting and promoting green agricultural practices including the age and education level of the managers, as well as the scale of the operation [18]. Furthermore, government policies and decision-making mechanisms, such as government subsidies, preferences for green measures and control technology, pesticide taxes, and illegal punishment, also impact their participation in green agriculture [19]. It is crucial to investigate the design of government incentives and constraints to encourage the participation of farmer professional cooperatives in the development of low-carbon agriculture [20]. The literature discusses the positive role of farmer professional cooperatives in carbon emission reduction and how the scale of farmer professional cooperatives is continuously expanding [21]. Compared with traditional agricultural business entities, they have stronger technological application capabilities, resource integration opportunities, and market development options [4]. Farmer professional cooperatives can enhance the promotion of low-carbon agricultural technologies such as precision fertilization, water-saving irrigation, and integrated pest management options for pests and diseases, thereby improving agricultural production efficiency while reducing carbon emissions [22]. Farmer professional cooperatives faced some challenges in the process of carbon emission reduction [23]. For example, difficulties in expanding scale, raising funds, and introducing talents may all affect the investment and actions of farmer professional cooperatives in carbon emission reduction [24].
Research on agricultural carbon transactions primarily focuses on feasibility analysis and program design. Carbon transactions, as a novel policy system, have the potential to address the challenge of managing environment protection externalities that governments struggle to solve in impoverished regions. This approach involves specific measures such as sharing carbon poverty responsibility among ethnic regions [25]. Voluntary carbon emission reduction projects are an important supplement to mandatory carbon emission transaction systems, as they offer the potential for flexible performance that goes beyond the scope of mandatory coverage [26]. The level of local consensus plays a significant role in determining the willingness of scale-up pig farmers to participate in agricultural carbon transaction projects, as well as the expected carbon price. Interestingly, the younger generation, born after the reform opening up, tend to have lower expectations for carbon prices due to informal authority punishments. Conversely, they have higher expectations for carbon prices due to word-of-mouth punishments [27].
There is also research that evaluates the overview of the global carbon market [28,29] and discuss the opportunities and challenges of China’s agricultural carbon projects. Against the background of global warming, agricultural carbon emission reduction has become an important issue [30]. The development of agricultural carbon markets provides new opportunities for farmer professional cooperatives. They can obtain economic benefits by participating in carbon trading and at the same time achieve carbon emission reduction goals. However, there are still some problems in China’s agricultural carbon market, such as greater uncertainty in measuring and verifying the performance of soil carbon storage [31] and highly dispersed agricultural operations, which all bring challenges to the participation of new agricultural business entities in the carbon market.
In the field of agricultural carbon emissions, the application of evolutionary game theory provides an important perspective for understanding the decision-making behaviors of multiple agents and the impact of policies. By incorporating farmer professional cooperatives, the government can analyze the dynamic evolution of farmers and stable strategies during the diffusion of low-carbon agricultural innovation. The findings indicate that well-designed government subsidies and carbon tax policies can effectively boost the participation of farmer professional cooperatives and farmers participating in low-carbon agriculture [32]. Another tripartite model, grounded in government low-carbon policies and stakeholders’ green preferences, explored factors influencing green development. Appropriate subsidy measures and relatively high carbon prices were identified as conducive to promoting green agricultural product cultivation, and the green inclinations of all parties can heighten low carbon awareness [33]. Game models focusing on different combinations of stakeholders have also been established. The government–farmer professional cooperative–consumer model aimed to study the value realization of ecological agricultural products, clarifying the evolutionary process of equilibrium strategies and their determinants, thereby offering theoretical support for policy-making [34]. The government–farmer–consumer model analyzed the dynamic evolution of farmers’ low-carbon production behavior in food safety source governance. It was revealed that factors like the government subsidy coefficient are positively related to farmers’ adoption of low-carbon production, while the fraud penalty coefficient shows a negative correlation [35]. Additionally, a tripartite model involving farmer professional cooperatives, universities, and the government, from the perspective of innovation consortia, studied low-carbon technology innovation. The results demonstrated that factors such as collaborative innovation revenue can drive the game towards an optimal outcome [36]. Moreover, game theory has been applied to examine the impact of different government subsidies and sales efforts on the carbon abatement of agricultural manufacturers. The conclusion is that government subsidies do not always promote carbon abatement; different subsidy policies have distinct effects on the interests of each stakeholder and social welfare under a range of conditions [37].
In summary, while some classical research has explored the low-carbon problem of farmer professional cooperatives and the agricultural carbon transaction problem, there is a lack of research on behaviors of farmer professional cooperatives, farmers, and governments intervention strategies guided by the carbon transaction mechanism. Moreover, these studies did not take the agricultural carbon emission market into account. In this paper, we aim to address this gap by considering the inclusion of farmer professional cooperatives in the carbon trading market and analyzing their interaction with farmers. To achieve this, we employ a combination of evolutionary game theory and MATLAB R2012a simulation analysis to construct a three-way non-symmetric dynamic evolution game model involving the government, farmer professional cooperatives, and farmers. Our objective is to understand the evolutionary game trends in low-carbon decision-making behavior among these three subjects. Furthermore, we conduct data simulation analysis and examine the decision-making processes of each subject to identify the conditions that lead to the ideal state. This research not only provides a theoretical basis for the government to develop relevant agricultural low-carbon development policies but also can offer suggestions for the evolution of low-carbon operation modes in agriculture.
In this study, unlike prior studies focusing on dyadic interactions (e.g., government–enterprise), we propose a tripartite evolutionary game framework integrating government, cooperatives, and farmers, capturing asymmetric power dynamics and multi-scale feedback in agricultural carbon markets. Moreover, we integrate agricultural carbon emissions into carbon markets, an aspect rarely explored in prior studies. This pioneering approach addresses a critical gap in existing carbon trading frameworks which predominantly focus on industrial and energy sectors, thereby enabling a more holistic emission reduction strategy for agro-ecological systems.

2. Materials and Methods

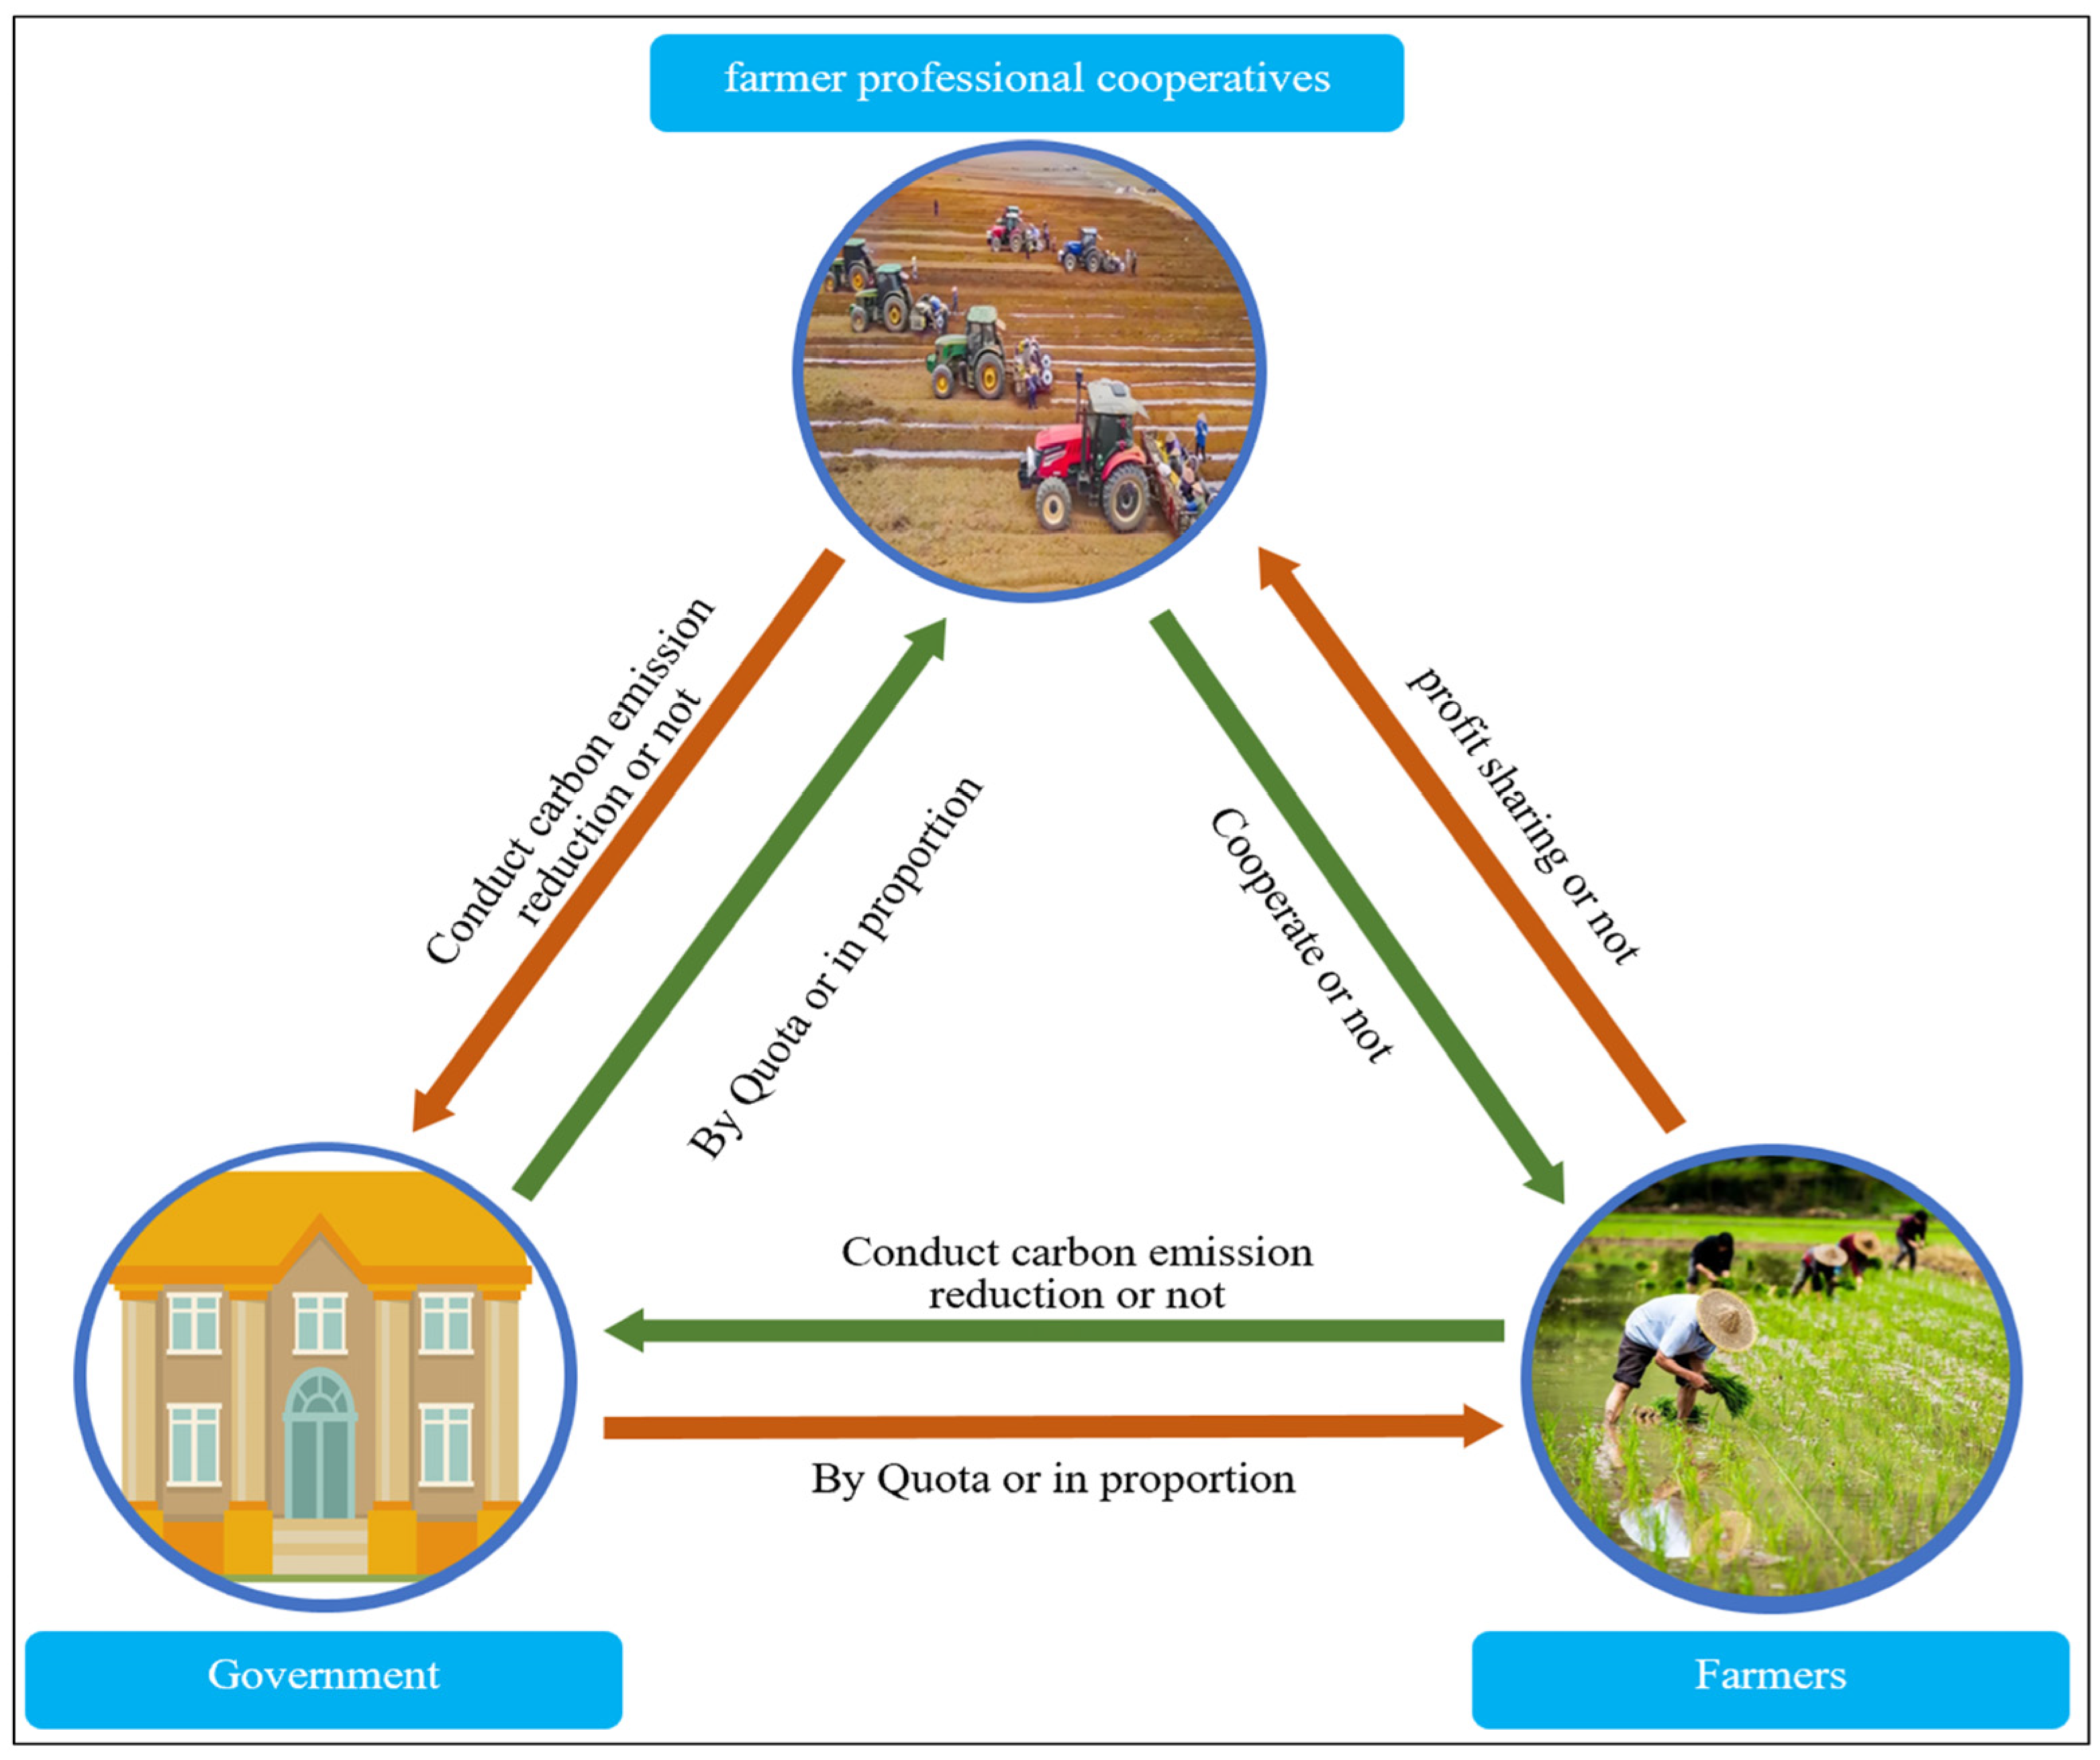
2.1. Problem Description

In this paper, the government plays an important role as a supporter of low-carbon polices, particularly in agricultural CCER transactions. They are responsible for formulating, implementing, and regulating policies related to this field. On one hand, the government allocates carbon emission quotas, and on the other hand, it promotes and encourages agricultural carbon reduction to meet carbon peaking and carbon neutrality goals. To achieve this, the government can choose from two strategies: fixed incentives and coefficient incentives. Under the fixed incentive approach, the government establishes a predetermined allowance for those actively engaged in carbon emission reduction activities. Conversely, a fixed penalty is imposed on those who do not actively participate in carbon emission reduction activities. Alternatively, the coefficient incentive mechanism involves the government determining a reward coefficient based on the volume of carbon emissions. It is important to note that when the government chooses the coefficient incentive strategy, resources and assets must be depleted.
The main objective of farmer professional cooperatives is to maximize the economic interest of their operators. Farmer professional cooperatives can engage in CCER transactions and choose active or passive carbon emission reduction options. FPCs act as intermediaries, coordinating collective actions (e.g., bulk sales, carbon credit aggregation), while individual farmers face structural barriers (e.g., lack of scale, technical capacity, or regulatory eligibility) that prevent direct carbon market participation. The government grants carbon quotas to FPCs, which then allocate these quotas to member farmers based on the government’s distribution framework. Under active carbon emission reduction option, surplus carbon emissions can be sold through CCER, while in cases of non-active carbon emission reduction options, excess emissions can be offset by purchasing CCERs. The range of benefits generated by carbon transactions include investment costs of carbon emission reduction, as well as rewards and various incentives from the government. Within carbon trading systems, farmer professional cooperatives can access carbon markets to generate revenue by trading carbon credits. A predefined percentage of this revenue is distributed to member farmers, incentivizing their participation. Furthermore, by joining FPCs, farmers benefit from the cooperatives’ intermediary role: centralized aggregation of agricultural outputs enhances their production scale and market competitiveness, thereby increasing their income.
The behavioral goals of farmers also include maximizing self-benefit. Although farmers are unable to directly participate in CCER, they have the option to form partnerships with farmer professional cooperatives. Considering financial assistance, sharing gains, technology advancements, and government policies, farmers can choose to cooperate or not cooperate with farmer professional cooperatives. If farmers choose to cooperate, farmer professional cooperatives’ operation revenue and management cost will be influenced, and when farmer professional cooperatives adopt low-carbon production, farmers can meet carbon emission reduction requirements through the sharing of low-cost upgraded technology while also benefiting from the distribution of shared CCER transaction gains. If farmers choose not to cooperate, they are unable to purchase CCER for excess carbon emissions through carbon offset transactions. Hence, farmers will have to independently make technical upgrades to meet carbon reduction requirements or face the consequences of rectification. The relationships between the three stakeholders and the rules of the game are described in Figure 1.
This section reframes the interests and strategies of governments, farmer professional cooperatives, and farmers through the lens of systems theory, emphasizing their roles as interdependent agents within a dynamic carbon market ecosystem:
Policy Implementation Feedback: Government subsidies reduce farmer adoption costs, increasing FPC membership rates, which amplifies carbon credit supply, incentivizing stricter quotas.
Carbon Market-Mediated Synergy: FPCs aggregate dispersed farmer emissions into tradable credits, creating economies of scale.

2.2. Basic Assumptions and Model Parameters

In order to deeply analyze the decision-making behavior and evolution process of various subjects in agricultural low-carbon production, the following assumptions are proposed:
Hypothesis 1. 
The game subjects are the government, farmer professional cooperatives, and farmers. All three parties are assumed to be limitedly rational, allowing their strategy choices to be adjusted indefinitely over time for the pursuit of benefit maximization. The government is modeled as a single player not because it is numerically comparable to farmers/cooperatives, but because it acts as a unified decision-maker in carbon policy design and enforcement [38,39,40,41].
Hypothesis 2. 
The probabilities of the farmer professional cooperatives choosing an active reduction versus an inactive carbon emission reduction strategy are denoted as x and 1−x, respectively. Similarly, the probabilities of farmers choosing cooperating and non-cooperating strategies are denoted as y and 1−y, respectively. The probability that the government chooses to implement the coefficient incentive versus the quota incentive policy is denoted as z and 1−z, respectively.
Hypothesis 3. 
Farmer professional cooperatives and farmers share similar carbon reduction technologies because farmer professional cooperatives produce the same crops as the farmers. They both face search and learning costs when adopting new technologies. However, the farmer professional cooperatives have stronger information acquisition and anti-risk ability, leading them to choose to adopt low-carbon agricultural technologies due to the relatively low marginal cost [33]. The cost of choosing an active carbon emission reduction strategy for the farmer professional cooperatives is denoted as C1, while the R&D cost of choosing not to actively abate is denoted as C2. It is assumed that C1 > C2. When a farmer does not cooperate with farmer professional cooperatives, high-cost technical upgrades are required due to their limitations in scale and technical level. At this point, the required cost is denoted as C3. If the farmer chooses to cooperate with farmer professional cooperatives, they receive the technology sharing of the farmer professional cooperatives. The cost of low-carbon generation at this point is denoted as C4, with C3 > C4.
Hypothesis 4. 
The subject of the farmer professional cooperatives may participate in a CCER trading market for transactions under the market price P as regulation (contractual negotiated transactions are not considered). If carbon emissions exceed the limit, CCER needs to be purchased on the trading market. If there is a surplus and it can be sold, the revenue obtained from the transaction is shared with the enrolled farmers with the proportion α.
Hypothesis 5. 
Farmers’ cooperation with farmer professional cooperatives brings agricultural resources into it, and the farmer professional cooperatives obtain an additional benefit (net benefit after subtracting management costs) through resource integration and reassignment. This benefit is shared with the farmers in proportion π.
Hypothesis 6. 
Governments allocate carbon quotas based on production scale. The fixed quotas of carbon emissions allocated to the farmer professional cooperatives and farmers are denoted as E0 and E01, respectively. The amount of farmer professional cooperatives that do not actively reduce carbon emissions is eh, and the amount they actively reduce carbon emissions is denoted as ej (eh > ej). The amount of carbon emissions from farmers that did not undergo technology upgrades is denoted as eh1, while the amount of carbon emissions after technology upgrades is denoted as ej1 (eh1 > ej1).
Hypothesis 7. 
Under the government quantum incentive policy, the farmer professional cooperatives and farmers with lower carbon emissions than the government’s given standards receive fixed subsidies I1 and I2, respectively, and vice versa, they receive fixed penalties F1 and F2, respectively.
Hypothesis 8. 
Under the government coefficient incentive policy, the government sets subsidy coefficients θ1 and θ2 for the farmer professional cooperatives and the farmers, along with penalty coefficients ε1 and ε2, respectively.
Hypothesis 9. 
The government cost of human and material resources in implementing incentives is C, and a fraction of fees paid for carbon transactions is denoted as γ.
Based on the above assumptions, the model parameters and corresponding symbols are summarized in Table 1.

2.3. Model Construction

According to the parameter settings, the farmer professional cooperative obtains CCER carbon transaction revenue p e 0 e h   and   p e 0 e j . When a farmer professional cooperative actively reduces carbon emissions, the government’s coefficient allowance θ 1 e 0 e j or a fixed allowance I1 is available. However, when a farmer professional cooperative does not actively reduce carbon emissions, the government imposes coefficient penalties ε 1 e h e 0   or fixed penalties F1. If farmers choose to cooperate with farmer professional cooperatives, the benefit of farmer professional cooperatives increases W and is assigned to farmers as πW. In this scenario, if farmer professional cooperatives actively reduce carbon emissions, the cost of the technical upgrade for the farmers is C4. Additionally, under the reward policy, the government provides grants θ 2 e 01 e j 1 or fixed allowances I2, while the farmers face penalties ε 2 e h 1 e 01   or fixed fines F2 if the farmer professional cooperatives do not actively reduce carbon emissions. The government’s incentive policy subsidizes I1 and I2, θ 1 e 0 e j and θ 2 e 01 e j 1 ,   or issues a penalty F1 and F2, ε 1 e h e 0 and ε 2 e h 1 e 01 , based on the carbon abatement effect. The payment matrix is presented in Table 2.

2.4. Replicative Dynamic Modeling of Subjects

For farmer professional cooperatives, E11 (Appendix A Formula (A1)) indicates the expected return when they choose an active carbon emission reduction strategy, E12 (Appendix A Formula (A2)) indicates the expected return when they choose an inactive carbon emission reduction strategy, and E ¯ 1 (Appendix A Formula (A3)) is the average expected return.
The replicator dynamics equation of the farmer professional cooperatives is F(x,y,z), and the expression is shown below.
F x , y , z = d x d t = x E 11 E ¯ 1 = x 1 x E 11 E 12
F x , y , z = d x d t = x E 11 E ¯ 1 = x 1 x E 11 E 12 = x 1 x z θ 1 + p e 0 e j ( z ε 1 + p ) ( e 0 e h ) + 1 α y p e h 1 e j 1 ( C 1 C 2 ) + ( 1 z ) ( I 1 + F 1 )
According to the stability theorem of the differential equation, the probability of active carbon emission reduction by farmer professional cooperatives must be in a stable state and the following condition must be met: F(x,y,z) = 0 and d F x , y , z d x < 0 .
When y = y * = z θ 1 + p e 0 e j z ε 1 + p e 0 e h ( C 1 C 2 ) + ( 1 z ) ( I 1 + F 1 ) 1 α p e h 1 e j 1 , d F x , y , z d x = 0 , farmer professional cooperatives cannot determine a stable strategy. When   y < y * , d F x , y , z d x < 0 , x = 0 is the stable evolutionary strategy of farmer professional cooperatives; when y > y * , x = 1 is the stable evolutionary strategy for farmer professional cooperatives.
For farmers, E21 (Appendix A Formula (A4)) represents the expected return when choosing to cooperate with farmer professional cooperatives, E22 (Appendix A Formula (A5)) represents the expected return when choosing not to cooperate with farmer professional cooperatives, and E ¯ 2 (Appendix A Formula (A6)) is the average expected return. The replicator dynamics equation of the farmer selection strategy is G(x,y,z), and the expression is shown below.
G x , y , z = d y d t = y E 21 E ¯ 2 = y 1 y E 21 E 22 = y 1 y [ 1 x α p + z ε 2 e 01 e h 1 + x α p + x z θ 2 z θ 2 e 01 e j 1 + π W x C 4 C 3 1 x 1 z F 2 + x 1 1 z I 2 ]
According to the stability theorem of differential equations, the probability of farmers choosing the strategy to cooperate with farmer professional cooperatives is in a stable state when the following conditions are satisfied: G(x,y,z) = 0 and d G x , y , z d y < 0 .
When z = z * = 1 x α p e 01 e h 1 + x α p e 01 e j 1 + π W x C 4 C 3 1 x F 2 + I 2 1 x ε 2 e 01 e h 1 θ 2 e 01 e j 1 + F 2 + I 2 ,   d G x , y , z d y = 0 , all y are in an evolutionary stable state. When z < z * , d G x , y , z d y < 0 and y = 0, the farmers’ evolution strategy is stable. When z > z * , y = 1 is the stable evolution strategy for farmers.
For the government, order E31 (Appendix A Formula (A7)) represents the expected return when the government chooses to implement the coefficient reward and punishment strategy, E32 (Appendix A Formula (A8)) represents the expected return when the government chooses to implement the fixed reward and punishment strategy, and E ¯ 3 (Appendix A Formula (A9)) is its average expected return. The replicator dynamics equation for the government strategy is F(z) and the expression is shown below.
H x , y , z = d z d t = z E 31 E ¯ 3 = z 1 z E 31 E 32 = z 1 z 1 x ε 1 e h e 0 1 y + x y θ 2 e 01 e j 1 + y 1 x ε 2 e h 1 e j 1 x θ 1 e 0 e j 1 x F 1 + 1 y + x y I 2 + x I 1 y 1 x F 2
According to the stability theorem of differential equations, the probability of the government choosing the coefficient policy is stable when H(x,y,z) = 0 and d H x , y , z d z < 0 .
When x = x * = ε 1 e h e 0 1 y θ 2 e 01 e j 1 + y ε 2 e h 1 e j 1 F 1 + 1 y I 2 y F 2 F 1 + I 1 + y F 2 + I 2 ε 1 e h e 0 y θ 2 e 01 e j 1 y ε 2 e h 1 e j 1 θ 1 e 0 e j , d H x , y , z d z = 0 , all y are in an evolutionary stable state. When x < x * , d F z d z < 0 and z = 0, the farmers’ evolution strategy is stable. When x > x * , z = 1 is the stable evolution strategy for farmers.
The replicator dynamics equations are as follows:
F x , y , z = x 1 x [ z θ 1 + p e 0 e j ( z ε 1 + p ) ( e 0 e h ) + 1 α y p e h 1 e j 1 ( C 1 C 2 ) + ( 1 z ) ( I 1 + F 1 ) ]
G x , y , z = y 1 y [ 1 x α p + z ε 2 e 01 e h 1 + x α p + x z θ 2 z θ 2 e 01 e j 1 + π W x C 4 C 3 1 x 1 z F 2 + I 2 ]    
H x , y , z = z 1 z 1 x ε 1 e h e 0 1 y + x y θ 2 e 01 e j 1     + y 1 x ε 2 e h 1 e j 1 x θ 1 e 0 e j 1 x F 1   + 1 y + x y I 2 + x I 1 y 1 x F 2
In the model, the differential strategy adjustment speeds between the government and farmers/farmer professional cooperatives are implemented through divergent time steps and implicit design of payoff differentials:
Farmers/farmer professional cooperatives: Their replicator dynamics (F(x,y,z) and G(x,y,z)) adopt a 1-year time step, reflecting rapid responses driven by direct market signals (e.g., carbon credit prices, crop yields).
Government: Its dynamics (H(x,y,z)) use a 5-year time step, aligned with China’s Five-Year Plan cycles, to capture institutional inertia. This separation arises because the government’s payoff differential   E 31 E ¯ 3 is smaller and delayed—emission reduction benefits accrue over decades, and policy shifts require cross-ministerial consensus—whereas farmers/farmer professional cooperatives experience frequent, significant payoff differentials E 11 E ¯ 1 or E 21 E ¯ 2 due to immediate market feedback.

3. Results

3.1. Equilibrium Points of the Game

The derivative of the replicator dynamics equations is as follows:
J = J 11 J 12 J 13 J 21 J 22 J 23 J 31 J 32 J 33 = d F x , y , z d x d F x , y , z d y d F x , y , z d z d G x , y , z d x d G x , y , z d y d G x , y , z d z d H x , y , z d x d H x , y , z d y d H x , y , z d z = a 11 a 12 a 13 a 21 a 22 a 23 a 31 a 32 a 33
a 11 = 1 2 x [ z θ 1 + p e 0 e j z ε 1 + p e 0 e h + 1 α y p e h 1 e j 1 ( C 1 C 2 ) + ( 1 z ) ( I 1 + F 1 ) ] a 12 = x 1 x 1 α p e h 1 e j 1 a 13 = x 1 x [ θ 1 e 0 e j ε 1 e 0 e h I 1 + F 1 ] a 21 = 1 y [ α p + z ε 2 e 01 e h 1 + α p + z θ 2 e 01 e j 1 C 4 + 1 z F 2 + I 2 ] a 22 = 1 2 y [ 1 x α p + z ε 2 e 01 e h 1 + x α p + x z θ 2 z θ 2 e 01 e j 1 + π W x C 4 C 3 1 x 1 z F 2 + I 2 ] a 23 = y 1 y [ ε 2 1 x e 01 e h 1 + x θ 2 θ 2 e 01 e j 1 + 1 x F 2 + I 2 ] a 31 = z 1 z ε 1 e h e 0 y θ 2 e 01 e j 1 y ε 2 e h 1 e j 1 θ 1 e 0 e j + I 1 + F 1 + y F 2 + I 2 a 32 = z 1 z [ 1 x θ 2 e 01 e j 1 + 1 x ε 2 e h 1 e j 1 + x 1 I 2 1 x F 2 ] a 33 = 1 2 z [ 1 x ε 1 e h e 0 1 y + x y θ 2 e 01 e j 1 + y 1 x ε 2 e h 1 e j 1 x θ 1 e 0 e j 1 x F 1 + 1 y + x y I 2 + x I 1 y 1 x F 2 ]
According to the stability principle of the differential equations proposed by Weinstein [42], when F(x,y,z) = 0, G(x,y,z) = 0, and H(x,y,z) = 0, all equilibrium solutions of the 3D replicator dynamics system are available, including eight groups of pure strategy solutions, E1(0,0,0), E2(1,0,0), E3(1,1,0), E4(1,0,1), E5(0,1,0), E6(0,1,1), E7(0,0,1), and E8(1,1,1).
By utilizing the Lyapunov indirect method, we can ascertain the stability of the equilibrium points [43,44,45,46]. When all eigenvalues of the Jacobian matrix are negative, the corresponding equilibrium point is the system’s evolutionary stability strategy (ESS). If some of the eigenvalues are positive and others are negative, the equilibrium point is unstable, which is also called a saddle point. The eigenvalues of the equilibrium points are conveniently presented in Table 3.

3.2. Stability Analysis

When all eigenvalues (λ) of the Jacobian matrix of the equilibrium solution are less than 0, this equilibrium solution exhibits progressive stability, known as the evolutionary stability point (ESS). The stability of the equilibrium points of the replicate dynamic systems under different parameter conditions is displayed in Table 4.
Proposition 1. 
Excellent stable state.
When conditions 1 to 3 and 5 are met, the equilibrium points E2 (1,0,0), E3 (1,1,0), E4 (1,0,1), and E8 (1,1,1) are stable, and the farmer professional cooperative chooses the active carbon emission reduction strategy, which is the optimal stable state.
The carbon trading price corresponding to conditions 1 and 3 is p < C 3 + C 4 W π α e 01 e j 1 ; at present, the price of carbon transactions is situated at the lower end of the range. The combined distribution derived from the benefits of carbon transactions and the farmer professional cooperatives is less than the inputs for farmers conducting carbon emission reduction by themselves. Consequently, farmers opt not to participate in the farmer professional cooperatives. In this condition, if the government’s fixed allowance is smaller than what is generated from the coefficient incentive, the government will choose a cost-effective strategy. Ultimately, the decision will trend towards (1,0,0). The evolution path is shown in Figure 2a for the following condition: if the farmer professional cooperatives choose to actively reduce carbon emissions and the government selects the fixed incentive policy. In cases where the research and development cost for carbon abatement by the farmers themselves exceeds the sum of the distributions obtained from their carbon transactions and the gains from the farmer professional cooperatives, the decision will ultimately converge towards (1, 0, 1). When the government’s fixed subsidies surpass those acquired through the coefficient incentives, the evolution path is as shown in Figure 2c.
The carbon trading prices corresponding to conditions 2 and 5 are p > C 3 + C 4 W π α e 01 e j 1 ; at these points, the price of carbon transactions is situated at the higher end of the range. The cumulative distributions from these transactions, along with the gains from the farmer professional cooperatives, exceed the inputs for farmers conducting carbon emission reduction by themselves. Consequently, the farmers opt to cooperate in the farmer professional cooperatives. If the government’s fixed allowance is smaller than the incentive resulting from the coefficient allowance, the government will adopt a low-cost strategy. Ultimately, the decision tends towards (1,1,0), wherein both the farmer professional cooperatives and the farmers actively participate in carbon emission abating, with the evolution path shown in Figure 2b. Likewise, if the government’s fixed allowance surpasses the gain obtained through the coefficient incentive allowance, the decision converges towards (1,1,1), with the evolution path shown in Figure 2e.
Proposition 2. 
Double stable state.
When conditions 4 and 2 are simultaneously met, there exist two equilibrium points: E3 (1,1,0) and E6 (0,1,1). The government assigns the farmer professional cooperative a carbon quota higher than its emission amount before, resulting in passive reduction behavior by the farmer professional cooperative. Conversely, if the carbon quota assigned by the government is lower than its emission amount before, the government will select a coefficient penalty. When the benefits from the farmer professional cooperative outweigh the farmers’ own upgrade costs, the farmers tend to choose to cooperate with the farmer professional cooperative. Ultimately, the decision trends towards (0,1,1), with the evolution path shown in Figure 2d. Also, if under the conditions W π + α e 01 e j 1 p > C 3 + C 4 and I 1 + I 2 < ( e 0 e j ) θ 1 + ( e 01 e j 1 ) θ 2 , E3(1,1,0) is also in a stable state, at this time, the model is in a double stable state. At this time, the carbon trading price range is   C 3 + C 4 W π α e 01 e j 1 < p < W π C 3 ( e 01 e j 1 ) θ 2 ( e h 1 e 01 ) ε 2 α ( e h 1 e 01 ) .
Through the analysis of the price of carbon transactions in proposition 1 and 2, we can see a positive correlation between the upper and lower bounds of the carbon price interval and the proportion of benefits shared by the farmer professional cooperatives, the cost of carbon abatement by the farmers, and the reduction in the amount of carbon emitted by the farmers. Meanwhile, there is a negative correlation between the upper and lower bounds of the carbon price interval and the reward coefficient of the government coefficient subsidy, the proportion of sharing of carbon benefits, the amount of farmer carbon emissions, and the degree of the carbon quota of the farmers.

4. Numerical Simulation

To further verify the evolution path of each player’s strategy evolution in the system when it reaches a stable state, as derived in the previous section, numerical simulations are carried out using soft R2012a software. Local governments provide a certain proportion of quota subsidies for physical products such as pesticides actually used by farmers. Referring to the physical subsidy standards in some provinces and based on the subsidy amount per mu limit, we set the status level of government subsidies (http://www.amic.agri.cn/subsidy/urlLinkMore, accessed on 1 January 2024). Taking into consideration the huge carbon price gap which has occurred in Chinese pilot carbon markets, the middle carbon price interval is set from 20 to 60 RMB. In accordance with the low-carbon policy implemented in different provinces, the environmental protection sector imposes a penalty of 2 to 5 times the price of carbon transactions for violating supernumerary emission firms. Under the coefficient rewards and penalties policy of government, the penalty starts at 90 RMB/ton for the farmer professional cooperatives and 30 RMB/ton for the farmers. The subsidy starts from 15 RMB/ton and 5 RMB/ton for the farmer professional cooperatives and farmers, respectively. Currently, a fixed reward and punishment policy has been implemented in some parts in China. In this paper, under the government’s fixed reward and punishment policy, the value of the reward for the farmer professional cooperatives is set at RMB 0.7 to 1.5 million, while the reward range for the farmers is set at RMB 0.2 to 0.5 million. The penalties for the farmer professional cooperatives and the farmers are RMB 2 and 0.5 million, respectively, leading to the assigned basic parameter value block in Table 5. The increase in carbon trading revenue is calculated by multiplying the carbon price, carbon trading volume, and share ratio, using the evolution of the system for different benefit sharing ratios of π = 0.2, π = 0.5, and π = 0.8. Median revenue increments from 120 Chinese agricultural cooperatives participating in carbon markets (2020–2023), have an interquartile range 800–1500 CNY (simulation parameters listed in Supplementary Table S1).

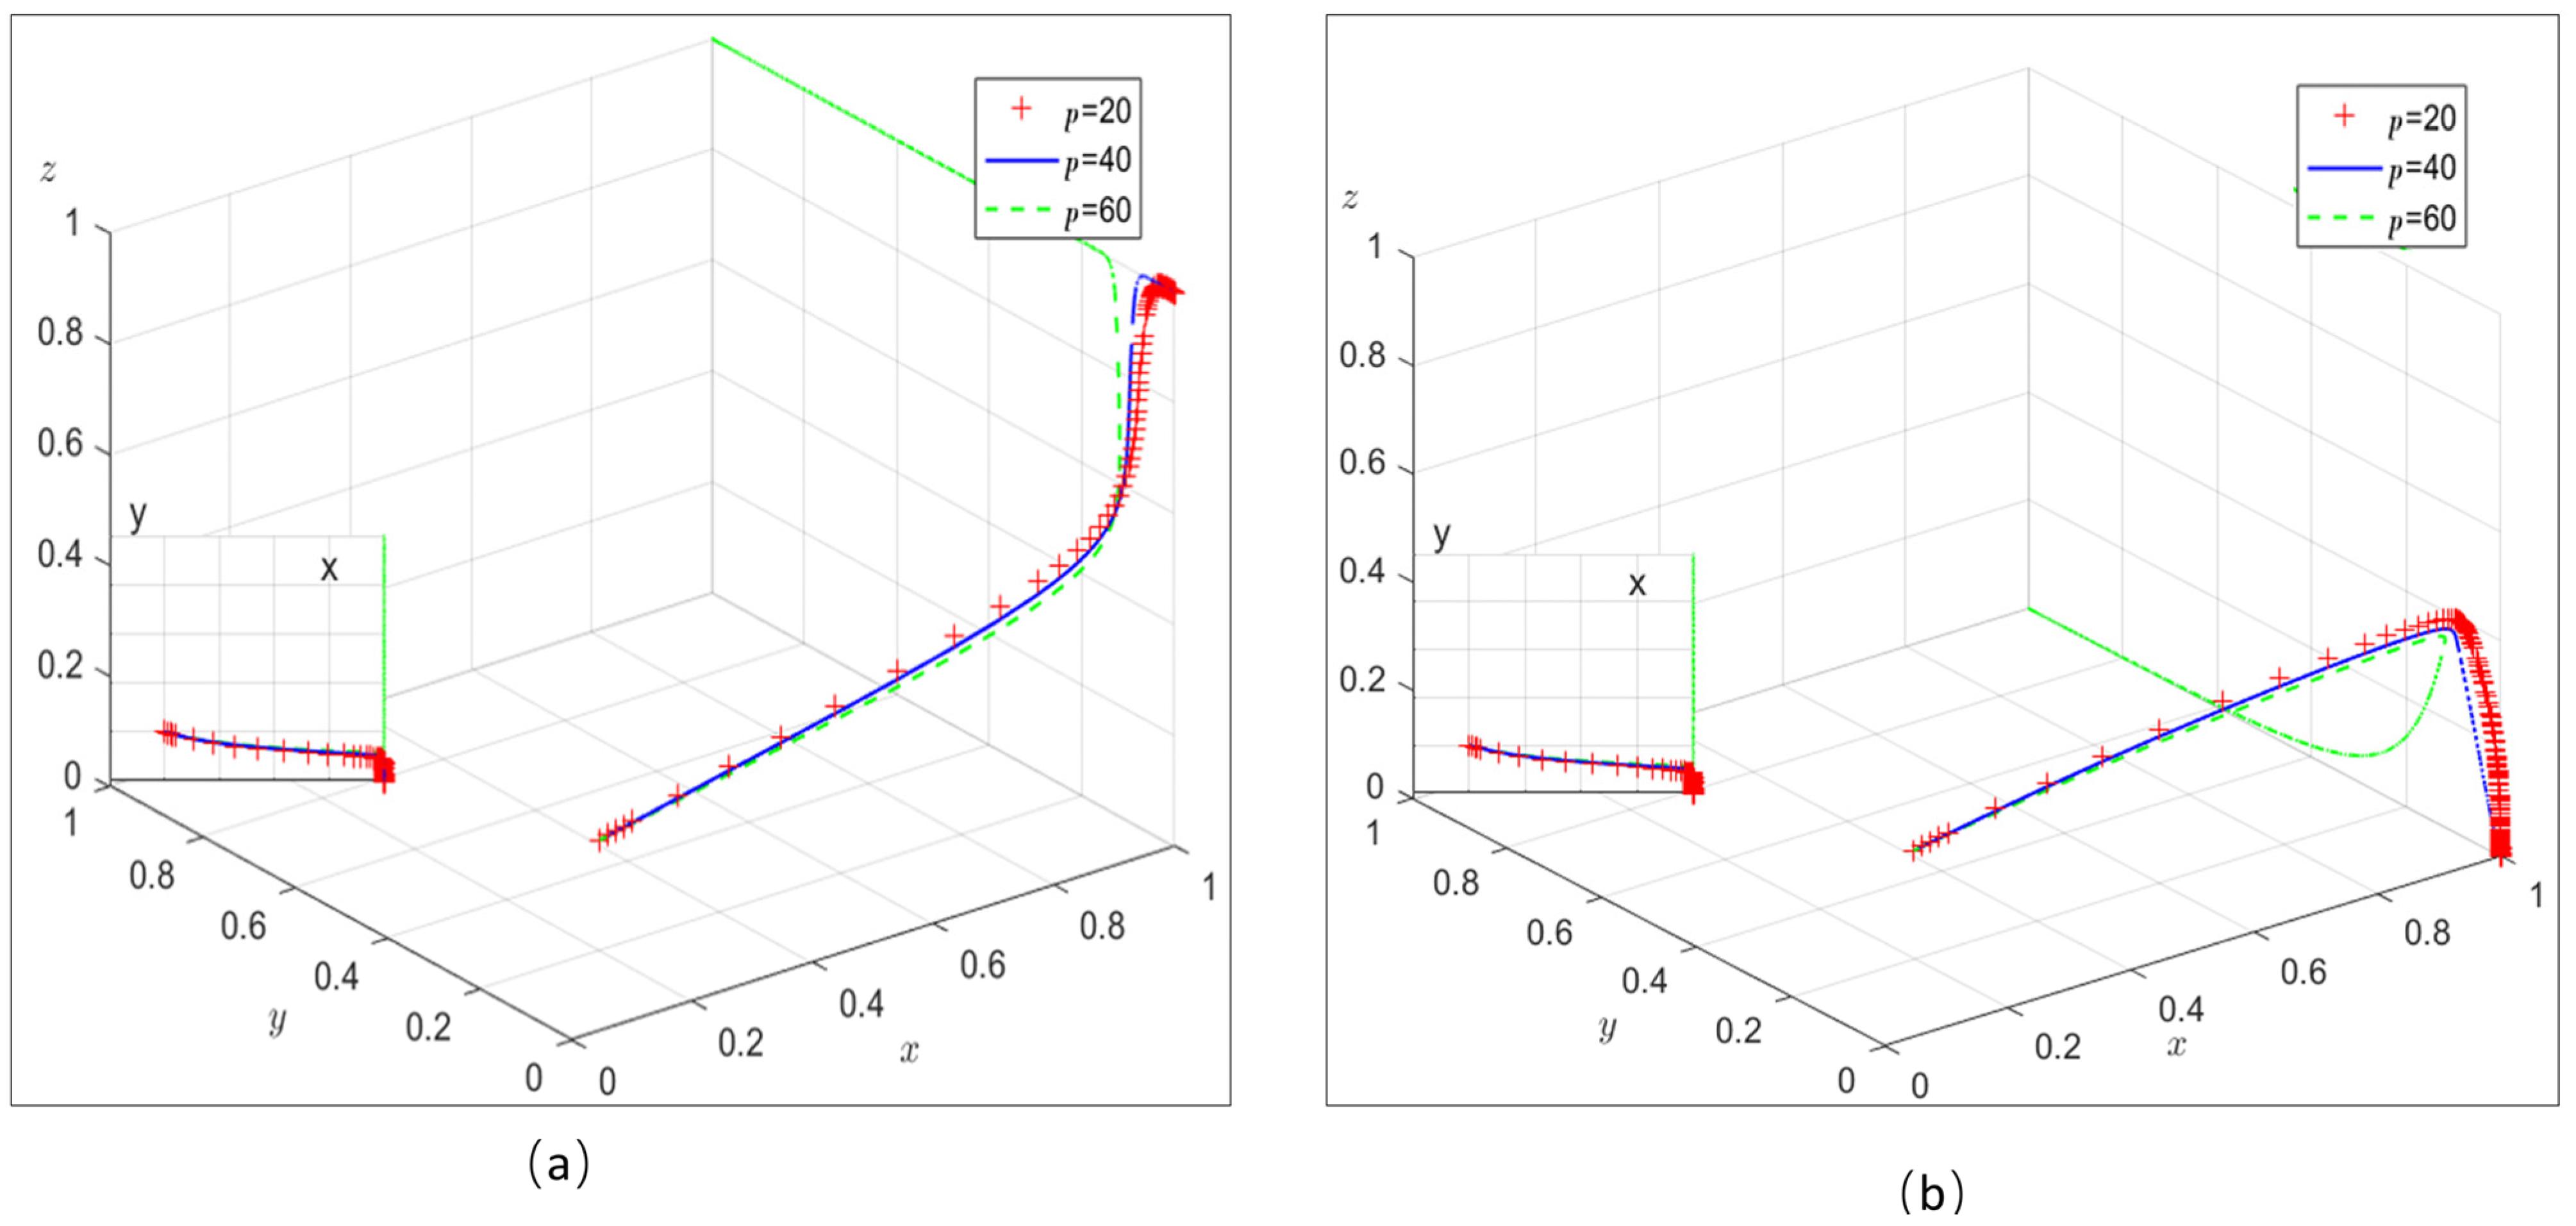
4.1. The Effect of the Carbon Trading Price p on the Evolutionary Outcome

The influences of carbon trading prices on the evolutionary results are shown in Figure 3.
In Figure 3a, when I1 = 150 and I2 = 50, the cost of the fixed incentive is higher than the coefficient incentive, so the government chooses the lower cost strategy: the coefficient incentive policy. As the carbon transaction price p increases, the system’s stability point moves from (1,0,1) to (1,1,1). When p is 20 or 40, both systems are stable at (1,0,0), with similar evolution paths. At this stage, the government chooses the coefficient reward and punishment strategy, while the farmer professional cooperative adopts active carbon emission reduction strategies and the farmers choose not to cooperate with the farmer professional cooperative. When p = 60, the system stabilizes at (1,1,1), the government selects the coefficient rewards and punishment strategy, and the farmer professional cooperative actively reduces their carbon emissions. The high carbon price influences the farmers as they can obtain a greater distribution of carbon transaction benefits when choosing to cooperate with the farmer professional cooperatives, leading them to choose to cooperate.
In Figure 3b, when I1 = 70 and I2 = 20, the cost of the fixed incentive is lower than the coefficient incentive, so the government chooses the lower cost strategy: the fixed incentive policy. As the carbon transaction price p increases, the system’s stability point moves from (1,0,0) to (1,1,0). When p is 20 or 40, both systems are stable at (1,0,0), with similar evolution paths. At this stage, the government chooses the fixed reward and punishment strategy, while the farmer professional cooperative adopts active carbon emission reduction strategies and the farmers choose not to cooperate with the farmer professional cooperative. When p = 60, the system stabilizes at (1,1,0). The government selects the fixed rewards and punishment strategy, and the farmer professional cooperative actively reduces their carbon emissions. As influenced by the high carbon price, the farmers can obtain a greater distribution of carbon transaction benefits when choosing to cooperate with the farmer professional cooperatives, leading them to choose to cooperate.
In conclusion, increasing the revenue of carbon transactions through a higher price of carbon transactions effectively mitigates the negative effect of cost. This can encourage farmer professional cooperatives and farmers to implement carbon emission reduction effectively.

4.2. The Effect of the Reward Coefficient θ on the Evolutionary Outcome

The effect of the reward coefficient (θ1 = 15 vs. θ2 = 5, θ1 = 30 vs. θ2 = 10, and θ1 = 90 vs. θ2 = 30) on the evolutionary results is shown in Figure 4. As the reward coefficient increases, the system’s stable points move from (1,0,1) to (1,1,0). At a lower reward coefficient, the system remains stable at (1,0,1). At this time, the government choose a low-cost strategy, the ratio reward strategy, and the farmer professional cooperative chooses an active carbon reduction strategy. The reward obtained by farmers for active reduction behavior is low, resulting in farmers choosing not to cooperate with the farmer professional cooperative. As the reward coefficient increases and farmers’ rewards for active carbon reduction also increase, considering cost constraints, they choose to cooperate with the farmer professional cooperative to obtain abatement technologies at a lower cost. When the reward coefficient reaches a certain threshold where the cost of the government implementing the coefficient reward is greater than the cost of the fixed reward, the government will decide to change the strategy and enforce fixed rewards. At this point, the system stabilizes at (1,1,0).

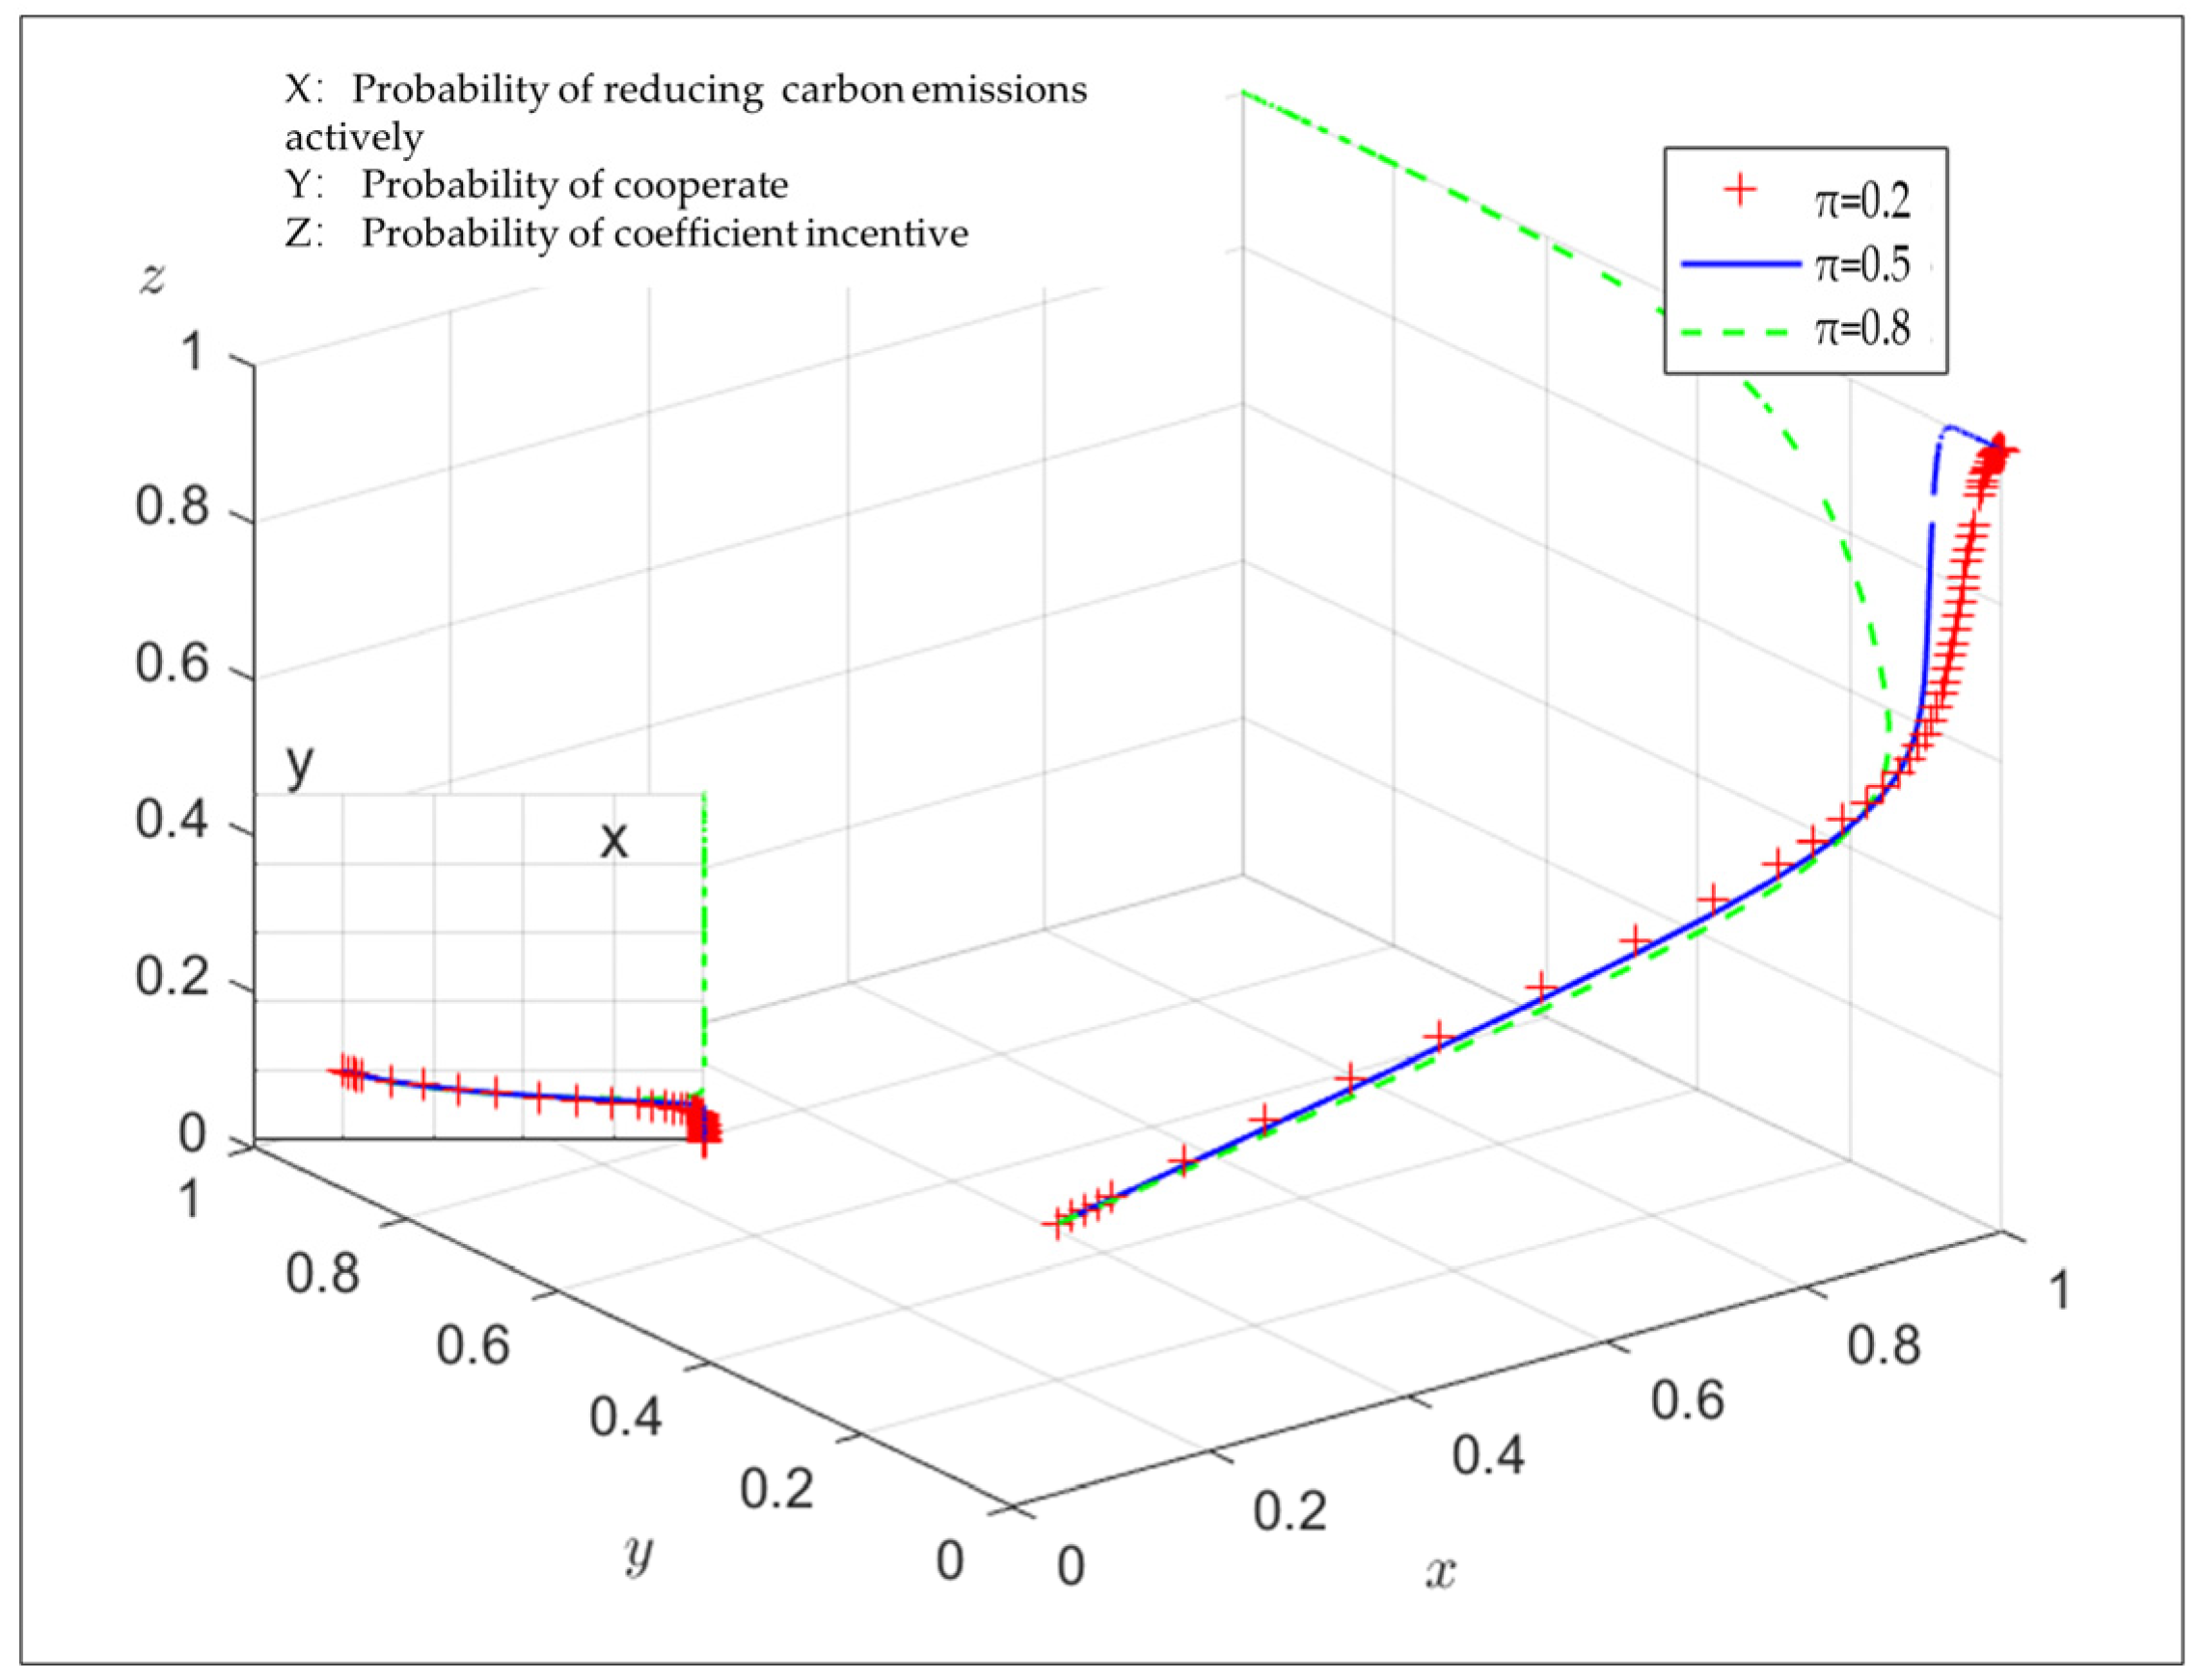
4.3. The Influence of the Income Sharing Ratio π of the Farmer Professional Cooperative on the Evolutionary Results

In Figure 5, the effect of the benefit sharing ratio (π) of the farmer professional cooperatives on evolutionary outcomes is shown. It illustrates the evolution of the system for different benefit sharing ratios of π = 0.2, π = 0.5, and π = 0.8. As the reward coefficient increases, the system’s stable point moves from (1,0,1) to (1,1,1). Under a low sharing proportion, the system remains stable at (1,0,1), and the government chooses the coefficient reward strategy, while the farmer professional cooperative chooses an active carbon abatement strategy. However, the sharing proportion is low, resulting in farmers choosing not to cooperate with the strategy. As the sharing ratio increases, farmers gain more additional benefits by cooperating with the farmer professional cooperative, leading to their participation in the entities. At this time, the system is stable at (1,1,1).

5. Discussion

The findings of this study elucidate the systemic mechanisms through which carbon trading policies incentivize emission reductions among farmer professional cooperatives (FPCs) and farmers, while also highlighting actionable levers for policy-makers. Below, we contextualize these results through the lens of systems theory.

5.1. Carbon Price Thresholds and Systemic Feedback

The identification of a carbon price threshold (60 CNY/ton) as a critical enabler for FPC-led emission reductions aligns with the nonlinear feedback mechanisms inherent in complex socio-ecological systems. Below this threshold, FPCs face insufficient revenue to offset the costs of low-carbon technologies (e.g., precision irrigation, biochar application), resulting in suboptimal participation rates.

5.2. Revenue Sharing as a Stabilizing Mechanism

The positive correlation between revenue sharing ratios (20–80%) and farmer cooperation underscores the role of FPCs as meso-level coordinators in balancing macro-level policies with micro-level incentives. At ratios below 40%, farmers prioritize short-term individual gains (e.g., traditional fertilizer use), destabilizing FPC operations. Above 60%, however, the following occurs:
Farmers’ additional income exceeds the opportunity costs of adopting low-carbon practices, fostering long-term collaboration.
FPCs achieve scale economies, reducing per-unit transaction costs compared to decentralized farmer participation.

5.3. Policy Levers for Systemic Resilience

To operationalize these findings, we propose a tiered carbon pricing and quota system:
Baseline Carbon Price: Maintain a floor price of 60 CNY/ton to ensure FPC viability, adjusted annually based on regional agricultural GDP.
Dynamic Quota Allocation: Tie government quotas to FPC performance metrics, incentivizing proactive emission monitoring.
Subsidy Sharing Linkage: Condition government subsidies on FPC revenue sharing ratios, coupling macro support with micro fairness.

5.4. Limitations and Future Directions

While our model captures key tripartite dynamics, two limitations warrant attention:
Spatial Heterogeneity: The simulation assumes uniform carbon prices across regions, neglecting disparities between high-income and agricultural provinces. Future work should incorporate spatially differentiated pricing.
Behavioral Complexity: Farmers’ decisions may involve cultural and risk perception factors beyond pure economic rationality. Integrating agent-based modeling with survey data could enhance realism. The model simplifies the government as a monolithic player with continuous strategy adjustments, which may not fully capture the bureaucratic inertia or multi-level governance complexities. Future work will incorporate delayed differential equations to explicitly model policy lags.

6. Conclusions and Policy Recommendations

6.1. Conclusions

This paper explores the inclusion of farmer professional cooperatives in the carbon trading market and constructs a tripartite evolution game model involving the government, farmers, and farmer professional cooperatives. It analyzes the stability of the three game participants’ strategy selection, system equilibrium, and the factors influencing the balance. The effectiveness of the analysis is verified through simulation analysis. The main conclusions are as follows:
  • The carbon trading mechanism effectively mitigates the negative effect of cost by providing carbon trading income.
  • Reasonable regulation of carbon trading prices can promote the participation of farmer professional cooperatives in carbon emission reduction. Carbon prices above 60 CNY/ton enable cooperatives to reduce regional emissions.
  • Farmer professional cooperatives play a pivotal role in agricultural carbon emission reduction. By utilizing the advantages of scale economy and technology, they can promote the development of low-carbon agriculture. When the sharing ratio increases from 20% to 80%, farmers gain additional benefits by cooperating with the farmer professional cooperative and adopting emission reduction strategies.

6.2. Policy Implication

Firstly, the carbon trading mechanism effectively mitigates the negative effect of cost by providing carbon trading income. It can encourage farmer professional cooperatives and farmers to actively reduce carbon emissions. When the carbon price is high, farmer professional cooperatives can benefit from positive carbon emissions through additional benefits of carbon trading. Farmers who cooperate with the farmer professional cooperative can also share a proportion of the carbon trading gains and the distribution of increased income from the farmer professional cooperative. When the value of carbon trading gains and the distribution of increased income is higher than the cost of upgrading technology of carbon reduction, whatever the type of the government’s incentive policy, the farmers’ decision is to cooperate with the farmer professional cooperative.
Secondly, reasonable regulation of carbon trading prices can promote the participation of farmer professional cooperatives in carbon emission reduction. When the carbon trading price is in the middle range, the government’s rewards and the costs of carbon reduction technology are essential factors in the decision of farmer professional cooperatives and farmers to actively reduce carbon emissions. The government’s reward and punishment policy also plays a crucial role in farmers’ decisions to cooperate with the farmer professional cooperative. Government departments should coordinate the interests of the three parties and formulate suitable emission reduction policies to promote the cooperation of all three parties to reduce carbon emissions. For the government, reasonable regulation of the carbon quota can promote the participation of farmer professional cooperatives in carbon emission reduction strategies. The government can adjust the carbon trading price by adjusting the carbon quota to coordinate the supply and demand situation in the carbon trading market.
Lastly, farmer professional cooperatives serve as critical enablers in mitigating agricultural carbon emissions. By leveraging economies of scale and technology diffusion, FPCs drive the transition to low-carbon agricultural practices through centralized resource management and innovation adoption.

Supplementary Materials

The following supporting information can be downloaded at https://www.mdpi.com/article/10.3390/systems13060413/s1: Table S1: Parameter assignment.

Author Contributions

Conceptualization: Q.C. and J.F.; formal analysis: H.L.; funding acquisition: Q.C. and J.F.; investigation: H.L. and J.F.; methodology: Q.C.; project administration: Q.C.; resources: H.L. and Nicola Cannon; software: Q.C.; supervision: J.F., X.C. and N.C.; validation: Q.C. and J.F.; visualization: H.L.; writing—original draft: Q.C. and J.F.; writing—review and editing: Nicola Cannon, Q.C. and X.C. All authors have read and agreed to the published version of the manuscript.

Funding

This research was funded by the Qingdao Agricultural University High-level Talent Research Fund Projects (Fund Number: 663-1120703, 663-1119726) and the Special Research Project of Shandong Provincial Social Science Planning (Fund Number: 23CSDJ21).

Data Availability Statement

The data presented in this study are available on request from the corresponding author.

Acknowledgments

We are very grateful for the valuable suggestions provided by the editors and reviewers.

Conflicts of Interest

The authors declare no conflicts of interest.

Appendix A

Detailed Replicator Dynamics Derivation

E 11 = 1 y 1 z p e 0 e j C 1 + I 1 + y 1 z p e 0 + e 01 e j e j 1 α p e 01 e j 1 C 1     + 1 π W + I 1 + 1 y z p e 0 e j C 1 + θ 1 e 0 e j     + y z [ p e 0 + e 01 e j e j 1 α p e 01 e j 1 C 1 + θ 1 e 0 e j + 1 π W ]  
= z θ 1 + p e 0 e j + 1 α y p e 01 e j 1 C 1 + y 1 π W + 1 z I 1
E 12 = 1 y 1 z p e 0 e h C 2 F 1       + y 1 z [ p e 0 + e 01 e h e h 1 α p e 01 e h 1 + 1 π W C 2 F 1 ]       + 1 y z p e 0 e h C 2 ε 1 ( e h e 0 )         + y z [ p e 0 + e 01 e h e h 1 α p e 01 e h 1 + 1 π W C 2         ε 1 ( e h e 0 ) ]    
= p + z ε 1 e 0 e h + 1 α y p e 01 e h 1 + y 1 π W C 2 1 z F 1
E ¯ 1 = x E 11 + 1 x E 12
E 21 = 1 x 1 z α p e 01 e h 1 F 2 + π W     + 1 x z α p e 01 e h 1 + π W ε 2 e h 1 e 01     + x 1 z α p e 01 e j 1 + π W + I 2 C 4     + x z α p e 01 e j 1 + π W + θ 2 e 01 e j 1 C 4
= 1 x α p + z ε 2 e 01 e h 1 + x α p + z θ 2 e 01 e j 1 + π W x C 4 1 x 1 z F 2 + x 1 z I 2
E 22 = x z θ 2 e 01 e j 1 C 3 + x 1 z I 2 C 3 + 1 x z θ 2 e 01 e j 1 C 3 + 1 x 1 z I 2 C 3
= z θ 2 e 01 e j 1 + 1 z I 2 C 3
E ¯ 2 = y E 21 + 1 y E 22
E 31 = 1 x 1 y γ p e h e 0 C + ε 1 e h e 0 θ 2 ( e 01 e j 1 )     + 1 x y [ γ p e h + e h 1 e 0 e 01 + ε 1 e h e 0 + ε 2 e h 1 e j 1     C ] + x 1 y γ p e 0 e j C θ 1 e 0 e j θ 2 ( e 01 e j 1 )     + x y γ p e 0 + e 01 e j e j 1 θ 1 e 0 e j θ 2 e 01 e j 1 C
= 1 x γ p + ε 1 e h e 0 + x y γ p 1 y + x y θ 2 e 01 e j 1   + y 1 x γ p e h 1 e 01 + y 1 x ε 2 e h 1 e j 1   + x γ p θ 1 e 0 e j C
E 32 = 1 x 1 y γ p e h e 0 C + F 1 I 2     + 1 x y γ p e h + e h 1 e 0 e 01 + F 1 + F 2 C     + x 1 y γ p e 0 e j I 1 I 2 C     + x y γ p e 0 + e 01 e j e j 1 I 1 I 2 C
= 1 x γ p e h e 0 + y 1 x γ p e h 1 e 01 + x γ p e 0 e j + x y γ p e 01 e j 1 C + 1 x F 1 1 y + x y I 2 x I 1 + y 1 x F 2
E ¯ 3 = z E 31 + 1 z E 32

References

  1. Black, H.; Reed, M.S.; Kendall, H.; Parkhurst, R.; Cannon, N.; Chapman, P.J.; Orman, M.; Phelps, J.; Rudman, H.; Whaley, S.; et al. What Makes an Operational Farm Soil Carbon Code? Insights from a Global Comparison of Existing Soil Carbon Codes Using a Structured Analytical Framework. Carbon Manag. 2022, 13, 554–580. [Google Scholar] [CrossRef]
  2. De Cara, S.; Vermont, B. Policy Considerations for Mandating Agriculture in a Greenhouse Gas Emissions Trading Scheme: A Comment. Appl. Econ. Perspect. Policy 2011, 33, 661–667. Available online: https://www.jstor.org/stable/41336229 (accessed on 20 March 2024). [CrossRef]
  3. Zhang, C.C.; Lin, B.Q. Impact of Introducing Chinese Certified Emission Reduction Scheme to the Carbon Market: Promoting Renewable Energy. Renew. Energy 2024, 222, 119887. [Google Scholar] [CrossRef]
  4. Zhang, Y.J.; Liu, J.Y.; Woodward, R.T. Has Chinese Certified Emission Reduction Trading Reduced Rural Poverty in China? Aust. J. Agric. Resour. Econ. 2023, 67, 438–458. [Google Scholar] [CrossRef]
  5. Ma, M.L.; Lin, J.; Sexton, R.J. The Transition from Small to Large Farms in Developing Economies: A Welfare Analysis. Am. J. Agric. Econ. 2021, 104, 111–133. [Google Scholar] [CrossRef]
  6. Liang, Q.; Hendrikse, G.; Huang, Z.; Xu, X.C. Governance Structure of Chinese Farmer Cooperatives: Evidence from Zhejiang Province. Agribusiness 2015, 31, 198–214. [Google Scholar] [CrossRef]
  7. Ji, C.; Jin, S.Q.; Wang, H.T.; Ye, C.H. Estimating Effects of Cooperative Membership on Farmers’ Safe Production Behaviors: Evidence from Pig Sector in China. Food Policy 2019, 83, 231–245. [Google Scholar] [CrossRef]
  8. Yu, L.; Chen, C.; Niu, Z.; Gao, Y.; Yang, H.; Xue, Z. Risk Aversion, Cooperative Membership and the Adoption of Green Control Techniques: Evidence from China. J. Clean. Prod. 2021, 279, 123288. [Google Scholar] [CrossRef]
  9. Sambuo, D. Co-operatology and the Science of Cooperative Societies: A Synthetic Review of Research on Cooperative Evolution. J. Coop. Organ. Manag. 2023, 11, 100190. [Google Scholar] [CrossRef]
  10. Verhofstadt, E.; Maertens, M. Can Agricultural Cooperatives Reduce Poverty? Heterogeneous Impact of Cooperative Membership on Farmers’ Welfare in Rwanda. Appl. Econ. Perspect. Policy 2015, 37, 86–106. [Google Scholar] [CrossRef]
  11. Liu, J.Z.; Yang, M.W.; Zhang, Z.Y. Can Rural Cooperatives Reduce Poverty Vulnerability of Smallholder Households? Evidence from Rural Western China. Front. Sustain. Food Syst. 2023, 7, 1222455. [Google Scholar] [CrossRef]
  12. Zheng, H.; Vatsa, P.; Ma, W.; Rahut, D.B. Does Agricultural Cooperative Membership Influence Off-Farm Work Decisions of Farm Couples? Ann. Public Coop. Econ. 2023, 94, 831–855. [Google Scholar] [CrossRef]
  13. Das, K.; Mahanta, A. Rural Non-Farm Employment Diversification in India: The Role of Gender, Education, Caste and Land Ownership. Int. J. Soc. Econ. 2023, 50, 741–765. [Google Scholar] [CrossRef]
  14. Liu, Y.Y.; Shi, K.Y.; Liu, Z.Q.; Qiu, L.; Wang, Y.; Liu, H.; Fu, X.H. The Effect of Technical Training Provided by Agricultural Cooperatives on Farmers’ Adoption of Organic Fertilizers in China: Based on the Mediation Role of Ability and Perception. Int. J. Environ. Res. Public Health 2022, 19, 14277. [Google Scholar] [CrossRef]
  15. Khan, N.; Ray, R.L.; Kassem, H.S.; Ihtisham, M.; Siddiqui, B.N.; Zhang, S. Can Cooperative Supports and Adoption of Improved Technologies Help Increase Agricultural Income? Evidence from a Recent Study. Land 2022, 11, 361. [Google Scholar] [CrossRef]
  16. Xin, Y.L.; Xu, Y.Q.; Zheng, Y. A Study on Green Agricultural Production Decision-Making by Agricultural Cooperatives under Government Subsidies. Sustainability 2024, 16, 1219. [Google Scholar] [CrossRef]
  17. Zhu, S.; Chen, Y.; Wang, W. Risk Assessment of Biological Asset Mortgage Loans of China’s New Agricultural Business Entities. Complexity 2020, 2020, 8865840. [Google Scholar] [CrossRef]
  18. Zhu, M.L.; Zhu, H. Efficiency of Decisions under Membership Heterogeneity and Government Regulations: Insights from Farmer Cooperatives in China. Econ. Dev. Cult. Change 2020, 68, 1009–1040. [Google Scholar] [CrossRef]
  19. Mei, L.; Zheng, Y.; Tian, M.; Wu, Y. Driven by the Policy or Bent by the Market? Cracking the Digital Transformation Code of Farmer Cooperatives. Technol. Forecast. Soc. Chang. 2024, 208, 123659. [Google Scholar] [CrossRef]
  20. Becot, F.A.; Inwood, S.; Contzen, S.; Budge, H.; Reusch, M.; Kroeplin, A. New Insights on the Role of the Farm Household-Farm Operation Interface in Family Farm Persistence and a Call for Future Research. J. Rural Stud. 2024, 112, 103449. [Google Scholar] [CrossRef]
  21. Wang, H.; Qiu, T. The Effects of Farmer Cooperatives on Agricultural Carbon Emissions Reduction: Evidence from Rural China. J. Clean. Prod. 2024, 450, 141881. [Google Scholar] [CrossRef]
  22. Zhang, S.; Sun, Z.; Ma, W.; Valentinov, V.J. The Effect of Cooperative Membership on Agricultural Technology Adoption in Sichuan, China. China Econ. Rev. 2020, 62, 101334. [Google Scholar] [CrossRef]
  23. Zhong, Z.; Jiang, W.Y.; Li, Y.H. Bridging the Gap Between Smallholders and Modern Agriculture: Full Insight into China’s Agricultural Cooperatives. J. Rural Stud. 2023, 101, 103037. [Google Scholar] [CrossRef]
  24. Abate, G.T. Drivers of Agricultural Cooperative Formation and Farmers’ Membership and Patronage Decisions in Ethiopia. J. Coop. Organ. Manag. 2018, 6, 53–63. [Google Scholar] [CrossRef]
  25. Gao, Y.; Zhang, M.; Wang, K.; Wen, F.; Liu, F. The Carbon Emissions Reduction Effect of Green Agricultural Subsidy Policy: A Quasi-Natural Experiment. Sustainability 2024, 16, 5210. [Google Scholar] [CrossRef]
  26. Yao, J. The Synergistic Effect of the Carbon Emission Trading Scheme on Pollution and Carbon Reduction in China’s Power Industry. Sustainability 2024, 16, 8681. [Google Scholar] [CrossRef]
  27. Li, H.; Liu, Y.; Zhao, X.; Zhang, L.; Yuan, K. Estimating Effects of Cooperative Membership on Farmers’ Safe Production Behaviors: Evidence from the Rice Sector in China. Environ. Sci. Pollut. Res. 2021, 28, 25400–25418. [Google Scholar] [CrossRef]
  28. Feng, J.; Yang, D. Optimal Operation of Agricultural Park Considering Carbon-Green Certificate Joint Trading and Demand Response. In Proceedings of the 2024 IEEE 7th International Electrical and Energy Conference (CIEEC), Harbin, China, 10–12 May 2024. [Google Scholar] [CrossRef]
  29. Zheng, Q.; Liu, J.; Sun, H. Economic and Carbon Emission Performance of Green Farming by Marketing Cooperatives. Heliyon 2023, 9, e15913. [Google Scholar] [CrossRef]
  30. Radov, D.; Klevnas, P.; Skurray, J. Market Mechanisms for Reducing GHG Emissions from Agriculture, Forestry and Land Management. 2007. Available online: https://www.semanticscholar.org/paper/Market-mechanisms-for-reducing-GHG-emissions-from-Radov-Klevnas/cfd84ead4c3864d6d5116bf67a3fca84825cec20 (accessed on 20 May 2024).
  31. Hou, S.; Chen, M.; Tao, S.; Li, P.; He, Y. Regional Heterogeneity of Agricultural Carbon Emission Reduction Potential in China. Environ. Eng. Res. 2024, 29, 230399. [Google Scholar] [CrossRef]
  32. Han, F.; Hu, W.; Zheng, J.; Feng, D.; Zhang, X. Estimating Soil Organic Carbon Storage and Distribution in a Catchment of Loess Plateau, China. Geoderma 2010, 154, 261–266. [Google Scholar] [CrossRef]
  33. Liu, L.; Zhu, Y.; Guo, S. The Evolutionary Game Analysis of Multiple Stakeholders in the Low-Carbon Agricultural Innovation Diffusion. Complexity 2020, 2020, 6309545. [Google Scholar] [CrossRef]
  34. Luo, J.; Huang, M.; Bai, Y. Promoting Green Development of Agriculture Based on Low-Carbon Policies and Green Preferences: An Evolutionary Game Analysis. Environ. Dev. Sustain. 2024, 26, 6443–6470. [Google Scholar] [CrossRef]
  35. Dong, J.; Chen, J.; Zhang, Y.; Cong, L.; Dean, D.; Wu, Q. Examining the Value Realization of Ecological Agricultural Products in China: A Tripartite Evolutionary Game Analysis. J. Environ. Manag. 2025, 374, 124134. [Google Scholar] [CrossRef] [PubMed]
  36. Xie, Y.; Su, Y.; Li, F. The Evolutionary Game Analysis of Low Carbon Production Behaviour of Farmers, Government and Consumers in Food Safety Source Governance. Int. J. Environ. Res. Public Health 2022, 19, 12211. [Google Scholar] [CrossRef]
  37. Luo, J.; Hu, M.; Huang, M.; Bai, Y. How Does Innovation Consortium Promote Low-Carbon Agricultural Technology Innovation: An Evolutionary Game Analysis. J. Clean. Prod. 2023, 384, 135564. [Google Scholar] [CrossRef]
  38. Zou, B.; Ju, C.; Bao, F.; Lai, Y.; Xu, C.; Zhu, Y. Exploring an efficient evolutionary game model for the government–Enterprise–Public during the double carbon policy in China. Int. J. Environ. Res. Public Health 2022, 19, 4607. [Google Scholar] [CrossRef] [PubMed]
  39. Chen, Y.; Zhang, J. The relationship among government, enterprise, and public in environmental governance from the perspective of multi-player evolutionary game. Int. J. Environ. Res. Public Health 2019, 16, 3351. [Google Scholar] [CrossRef]
  40. Zou, C.; Huang, Y.; Hu, S.; Huang, Z. Government participation in low—Carbon technology transfer: An evolutionary game study. Technol. Forecast. Soc. Chang. 2023, 188, 122320. [Google Scholar] [CrossRef]
  41. Sun, H.; Gao, G.; Li, Z. Evolutionary Game Analysis of Enterprise Carbon Emission Regulation Based on Prospect Theory. Soft Comput. 2022, 26, 13357–13368. [Google Scholar] [CrossRef]
  42. Wang, H.; Wang, C. Agricultural Manufacturers’ Carbon Abatement Oriented to Government Subsidy and Sales Efforts. Environ. Dev. Sustain. 2024, 26, 4335–4363. [Google Scholar] [CrossRef]
  43. Weinstein, M.I. Lyapunov Stability of Ground States of Nonlinear Dispersive Evolution Equations. Commun. Pure Appl. Math. 2010, 39, 51–67. [Google Scholar] [CrossRef]
  44. Cui, B.; Shui, Z.; Yang, S.; Lei, T. Evolutionary Game Analysis of Green Technology Innovation under the Carbon Emission Trading Mechanism. Front. Environ. Sci. 2022, 10, 997724. [Google Scholar] [CrossRef]
  45. Lu, Z.Y.; Huang, P.F.; Liu, Z.X. Predictive Approach for Sensorless Bimanual Teleoperation under Random Time Delays with Adaptive Fuzzy Control. IEEE Trans. Ind. Electron. 2018, 65, 2439–2448. [Google Scholar] [CrossRef]
  46. Zhao, D.Z.; Hao, J.Q.; Cao, C.J.; Han, H.S. Evolutionary Game Analysis of Three-Player for Low-Carbon Production Capacity Sharing. Sustainability 2019, 11, 2996. [Google Scholar] [CrossRef]
Figure 1. Stakeholder game framework.
Systems 13 00413 g001
Figure 2. The evolutionary trajectory of the tripartite game. (a) The evolution path of E2. (b) The evolution path of E3. (c) The evolution path of E4. (d) The evolution path of E6. (e) The evolution path of E8.
Systems 13 00413 g002
Figure 3. Carbon trading price’s effect on the evolutionary outcome. (a) I1 = 150 and I2 = 50. (b) I1 = 70 and I2 = 20.
Systems 13 00413 g003
Figure 4. The reward coefficient’s effect on the evolutionary outcome.
Systems 13 00413 g004
Figure 5. Benefit sharing ratio’s effect on the evolutionary outcome.
Systems 13 00413 g005
Table 1. Model parameters and corresponding symbols.
ParametersInstructions
CThe cost of the government choosing the incentive policy
F1The fine to the farmer professional cooperative when the government chooses the quota incentive policy
F2The fine to the farmers when the government chooses the quota incentive policy
I1The subsidy to the farmer professional cooperative when the government chooses the quota incentive policy
I2The subsidy to the farmers when the government chooses the quota incentive policy
ε1The fine coefficient of the government to the farmer professional cooperative under the coefficient incentive policy
ε2The fine coefficient of the government to the farmers under the coefficient incentive policy
θ1The subsidy coefficient of the government to the farmer professional cooperative under the coefficient incentive policy
θ2The subsidy coefficient of the government to farmers under the coefficient incentive policy
e0The fixed quota of carbon emissions which is given by the government to the farmer professional cooperative
e01The fixed quota of carbon emissions which is given by the government to farmers
ehThe carbon emission amount of the farmer professional cooperative that does not actively reduce carbon emissions
eh1The carbon emission amount of the farmers who do not actively reduce carbon emissions
ejThe carbon emission amount of the farmer professional cooperative that actively reduces carbon emissions
ej1The carbon emission amount of the farmers who actively reduce carbon emissions
C1Research and development funds needed by the farmer professional cooperative to actively reduce carbon emissions
C2Research and development funds needed by the farmer professional cooperative not to actively reduce carbon emissions
C3Funds needed for farmers to upgrade their own technologies for carbon emission reduction
C4Funds needed for farmers to cooperate with the farmer professional cooperative to upgrade their own technologies fpr carbon emission reduction
αThe proportion of carbon trading income the farmer professional cooperatives share with farmers
pThe CCER trading price
γThe coefficient of the government’s carbon trading fee
WThe increasing income of the farmer professional cooperative when the farmers cooperate
πThe proportion of the increasing benefits of the farmer professional cooperative shared with the farmers when they cooperate
Table 2. The triple game payoff matrix.
FarmersGovernment
Coefficient Incentive (z)Quota Incentive (1 − z)
Farmer professional cooperativesReducing carbon emissions actively (x)Cooperate (y) ( p ( e 0 + e 01 e j e j 1 ) α p ( e 01 e j 1 ) C 1 + θ 1 ( e 0 e j ) + ( 1 π ) W , α p ( e 01 e j 1 ) + π W + θ 2 e 01 e j 1 C 4 , γ p e 0 + e 01 e j e j 1 C θ 1 e 0 e j θ 2 e 01 e j 1 ) ( p e 0 + e 01 e j e j 1 α p e 01 e j 1 C 1 + 1 π W + I 1 , α p e 01 e j 1 + π W + I 2 C 4 , γ p e 0 + e 01 e j e j 1 C I 1 I 2 )
Non-cooperate (1 − y) ( p e 0 e j C 1 + θ 1 e 0 e j , θ 2 e 01 e j 1 C 3 , γ p e 0 e j C θ 1 e 0 e j θ 2 e 01 e j 1 ) ( p e 0 e j C 1 + I 1 , I 2 C 3 , γ p e 0 e j C I 1 I 2 )
Reducing carbon
emissions inactively
(1 − x)
Cooperate (y) ( p e 0 + e 01 e h e h 1 α p e 01 e h 1 + 1 π W C 2 ε 1 ( e h e 0 ) , α p e 01 e h 1 + π W ε 2 ( e h 1 e 01 ) , γ p e h + e h 1 e 0 e 01 C + ε 1 ( e h e 0 ) + ε 2 ( e h 1 e 01 ) ) ( p e 0 + e 01 e h e h 1 α p e 01 e h 1 + 1 π W C 2 F 1 ) ) , α p e 01 e h 1 F 2 + π W , γ p e h + e h 1 e 0 e 01 C + F 1 + F 2 )
Non-cooperate
(1 − y)
( p e 0 e h C 2 ε 1 ( e h e 0 ) , θ 2 e 01 e j 1 C 3 , γ p e h e 0 C + ε 1 ( e h e 0 ) θ 2 e 01 e j 1 ) ( ( p e 0 e h C 2 F 1 , I 2 C 3 , γ p e h e 0 C + F 1 I 2 )
Table 3. Characteristic roots and stability conditions of equilibrium points.
Equilibrium PointsEigenvalues
E1(0,0,0) e h p e j p , I 2 F 1 e 01 θ 2 + e j 1 θ 2 e 0 ε 1 + e h ε 1 ,
W π F 2 I 2 C 3 + α e 01 p α e h 1 p
E2(1,0,0) e j p e h p ,
W π C 4 C 3 + α e 01 p α e j 1 p ,
I 1 + I 2 e 0 θ 1 e 01 θ 2 + e j θ 1 + e j 1 θ 2
E3(1,1,0) C 3 + C 4 W π α e 01 p + α e j 1 p ,
e j p e h 1 p e h p + e j 1 p + α e h 1 p α e j 1 p ,
I 1 + I 2 e 0 θ 1 e 01 θ 2 + e j θ 1 + e j 1 θ 2
E4(1,0,1) W π C 4 C 3 + α e 01 p α e j 1 p ,
e 0 θ 1 I 2 I 1 + e 01 θ 2 e j θ 1 e j 1 θ 2 ,
e j θ 1 e 0 θ 1 + e 0 ε 1 e h ε 1 e h p + e j p
E5(0,1,0) e h p + e h 1 p e j p e j 1 p α e h 1 p + α e j 1 p ,
C 3 + F 2 + I 2 W π α e 01 p + α e h 1 p ,
e h ε 1 F 2 e 0 ε 1 F 1 + e h 1 ε 2 e j 1 ε 2
E6(0,1,1) F 1 + F 2 + e 0 ε 1 e h ε 1 e h 1 ε 2 + e j 1 ε 2 ,
C 3 W π + e 01 θ 2 e j 1 θ 2 e 01 ε 2 + e h 1 ε 2 α e 01 p + α e h 1 p ,
e 0 θ 1 e j θ 1 e 0 ε 1 + e h ε 1 + e h p + e h 1 p e j p e j 1 p α e h 1 p + α e j 1 p
E7(0,0,1) F 1 I 2 + e 01 θ 2 e j 1 θ 2 + e 0 ε 1 e h ε 1 ,
e 0 θ 1 e j θ 1 e 0 ε 1 + e h ε 1 + e h p e j p ,
W π C 3 e 01 θ 2 + e j 1 θ 2 + e 01 ε 2 e h 1 ε 2 + α e 01 p α e h 1 p
E8(1,1,1) C 3 + C 4 W π α e 01 p + α e j 1 p ,
e 0 θ 1 I 2 I 1 + e 01 θ 2 e j θ 1 e j 1 θ 2 ,
e j θ 1 e 0 θ 1 + e 0 ε 1 e h ε 1 e h p e h 1 p + e j p + e j 1 p + α e h 1 p α e j 1 p
Table 4. Local stability analysis of the equilibrium points.
Equilibrium PointsSymbolStabilityConditions
E1(0,0,0)(+, N, N)Saddle/UnstableNull
E2(1,0,0)(−, −, −)ESScondition1:
W π + α e 01 e j 1 p < C 3 + C 4
I 1 + I 2 < ( e 0 e j ) θ 1 + ( e 01 e j 1 ) θ 2
e j < e 0 , e j 1 < e 01
E3(1,1,0)(−, −, −)ESScondition2:
W π + α e 01 e j 1 p > C 3 + C 4
I 1 + I 2 < ( e 0 e j ) θ 1 + ( e 01 e j 1 ) θ 2
e j < e 0 , e j 1 < e 01
E4(1,0,1)(−, −, −)ESScondition3:
W π + α e 01 e j 1 p < C 3 + C 4
I 1 + I 2 > ( e 0 e j ) θ 1 + ( e 01 e j 1 ) θ 2
e j < e 0 < e h
E5(0,1,0)(+, N, N)UnstableNull
E6(0,1,1)(−, −, −)ESSCondition 4:
F 1 + F 2 < e h e 0 ε 1 + ( e h 1 e j 1 ) ε 2
C 3 + ( e 01 e j 1 ) θ 2 ( e 01 e h 1 ) ε 2 α ( e 01 e h 1 ) p < W π
e h 1 > e 01 > e j 1 , e 0 > e h > e j
E7(0,0,1)(N, +, N)UnstableNull
E8(1,1,1)(−, −, −)ESSCondition 5:
W π + α e 01 e j 1 p > C 3 + C 4
I 1 + I 2 > ( e 0 e j ) θ 1 + ( e 01 e j 1 ) θ 2
e j < e 0 < e h
Table 5. Parameter assignment.
ParameterF1
(CNY)
F2
(CNY)
ε1
(CNY)
ε2
(CNY)
θ1
(CNY)
θ2
(CNY)
e0
(tCO₂e)
e01
(tCO₂e)
eh
(tCO₂e)
numerical value200509030155251030
Parametereh1
(tCO₂e)
ej
(tCO₂e)
ej1
(tCO₂e)
C1
(CNY)
C2
(CNY)
C3
(CNY)
C4
(CNY)
A
(100%)
W
(CNY)
numerical value1520520050100200.51000
Disclaimer/Publisher’s Note: The statements, opinions and data contained in all publications are solely those of the individual author(s) and contributor(s) and not of MDPI and/or the editor(s). MDPI and/or the editor(s) disclaim responsibility for any injury to people or property resulting from any ideas, methods, instructions or products referred to in the content.

