Article

A Systems Approach to Carbon Emission Networks and Spatial Spillovers in China: Evidence from 31 Provinces Using the Spatial Durbin Model and Social Network Analysis

1
Tan Siu Lin Business School, Quanzhou Normal University, Quanzhou 362000, China
2
Department of International Trade, Konkuk Uiversity, Seoul 05029, Republic of Korea
*
Author to whom correspondence should be addressed.
Systems 2025, 13(6), 410; https://doi.org/10.3390/systems13060410
Submission received: 8 April 2025 / Revised: 13 May 2025 / Accepted: 20 May 2025 / Published: 26 May 2025
(This article belongs to the Section Systems Theory and Methodology)

Abstract

:
Amid China’s “dual carbon” goals of achieving carbon peaking and carbon neutrality, understanding the spatial dynamics of carbon emissions is essential for promoting coordinated regional decarbonization. This study takes a systems perspective to investigate the drivers and network structures of carbon emissions across 31 Chinese provinces from 2000 to 2022. Utilizing a Spatial Durbin Model (SDM) alongside social network analysis (SNA), it examines both the spatial spillover effects of key economic and innovation-related factors and the structural characteristics of interprovincial carbon transmission networks. The main findings include the following: (1) a significant spatial autocorrelation in provincial carbon emissions, indicating strong cross-regional spillover effects; (2) a nonlinear, inverted U-shaped relationship between green innovation and carbon emissions, where emissions initially rise before declining as innovation matures; (3) a dual impact of human capital, which increases local emissions but reduces emissions in neighboring regions through knowledge diffusion; and (4) the identification of key provinces such as Shaanxi, Henan and Hubei as central nodes within the carbon emission network, acting as influential hubs in the transmission of carbon emissions. This study highlights the importance of differentiated policy design based on regional network centrality and advocates for a systemic governance framework that promotes technology diffusion, talent mobility, and collaborative emission control across provinces. The integrated SDM-SNA approach provides a novel perspective for understanding the complexity of carbon governance in large economies and offers a flexible framework that can be adapted to other national or subnational settings.

1. Introduction

Against the backdrop of global climate change, carbon dioxide emission control has become a core issue for countries to achieve sustainable development. As the world’s largest carbon emitter, China faces dual challenges under the goals of carbon peak in 2030 and carbon neutrality in 2060 [1]. The continuous advancement of industrialization and urbanization has led to a continuous increase in energy demand [2], while the consumption structure dominated by traditional energy has further aggravated the difficulty of emission reduction [3]. In this context, how to balance economic development and carbon emissions has become a pressing issue of both academic concern and policy relevance. Meanwhile, the significant differences among provinces in economic development, technological innovation, and policy implementation [4] have made carbon emissions present complex spatial interaction characteristics. These regional disparities imply that carbon emissions are not randomly distributed but instead exhibit spatial clustering and diffusion, which necessitates more localized and targeted emission reduction policies. By analyzing the factors that affect carbon emissions and predicting the transmission trend and path of carbon emissions, we can formulate more targeted corresponding emission reduction policies for each district [5]. In recent years, China’s economic growth has been rapid, the urbanization level in various regions has gradually increased, and industrialization has continued to deepen through reforms. This has led to increased energy consumption and continued growth in carbon emissions in China. Therefore, it is important to achieve low-carbon transformation as soon as possible [6,7,8]. Hence, exploring the driving forces behind carbon emissions and their spatial characteristics is vital for implementing effective emission reduction strategies.
Traditional research mainly focuses on the impact of economic growth, industrial structure, energy efficiency and policy regulations on carbon emissions [9,10,11,12,13,14,15]. These studies often adopt panel regression, decomposition methods, or time series models to capture the temporal variation in emissions across regions. With the introduction of the concept of green development, green innovation and human capital have gradually attracted attention as important factors in promoting a low-carbon economy [16,17,18,19,20,21,22,23]. Green innovation refers to innovative technologies that can reduce environmental pollution and improve resource utilization efficiency [24,25]. In recent years, the government has encouraged and promoted the research and development of green technologies [26,27]. Human capital, as a carrier of educational accumulation and technological innovation, can effectively promote low-carbon transformation [28,29]. However, most existing studies on the role of green innovation and human capital are limited to the micro or firm level, and there is still a lack of systematic analysis from the provincial or inter-regional perspective.
At the same time, carbon emissions in China show clear spatial autocorrelation, which is an important area of current scholarly interest. As economic ties between regions become increasingly close, carbon emissions will not be limited to administrative boundaries but will have spatial spillover effects between regions through various channels such as energy trade, industrial transfer, and environmental policy diffusion [30,31,32]. This spatial spillover means that one province’s carbon emission behaviors may affect neighboring regions, further complicating emission reduction efforts. Although some studies have used spatial econometric methods to explore the spatial characteristics of carbon emissions, they mainly rely on static spatial models and lack a dynamic analysis of emission transmission processes. These traditional methods fail to fully consider the complex interdependencies and propagation paths embedded in the carbon emission system. Moreover, the core node provinces and transmission paths within the carbon emission network remain underexplored, limiting the effectiveness of coordinated regional emission reduction policies.
To address these gaps, this study uses carbon emission data from 31 provinces in China from 2000 to 2022 based on the Spatial Durbin Model (SDM) to analyze the spatial spillover effect of carbon emissions and focuses on the impact of green innovation and human capital on carbon emissions. In addition, in order to further reveal the inter-provincial transmission mechanism of carbon emissions, this study combines social network analysis (SNA) to measure the transmission network structure of carbon emissions and identify core transmission paths and key node provinces. Compared with traditional spatial econometric models, the integration of SNA offers a more dynamic and holistic view of emission propagation, capturing the structural relationships among provinces and enhancing the explanatory power of spatial effects.
The main contributions of this study are as follows: First, the spatial spillover effect of carbon emissions is verified from the perspective of spatial measurement, and its dynamic evolution characteristics are revealed. Second, the impact of green innovation and human capital on carbon emissions is examined in detail, and their direct effects and spatial spillover effects are clarified. Third, a social network analysis method is combined to construct an inter-provincial carbon emissions transmission network, identify core transmission paths and key nodes, and provide a theoretical basis for the formulation of regional collaborative governance policies. These contributions not only fill the methodological and empirical gaps in the existing literature but also offer practical guidance for achieving coordinated carbon governance in the context of China’s dual carbon goals. Unlike the existing literature, which mainly focuses on either spatial econometric models or network structure separately [33,34,35], this study integrates SDM and SNA to provide a more comprehensive analysis of carbon emission diffusion mechanisms, particularly focusing on the role of green innovation and human capital in shaping interprovincial transmission paths.
The paper is structured as follows: Section 2 proposes hypotheses based on the current research status, Section 3 introduces the method and variables, Section 4 is an empirical analysis, including the results of spatial effect analysis and social network analysis, and Section 5 summarizes the research conclusions and puts forward policy recommendations.

2. Theoretical Process and Research Hypotheses

2.1. Carbon Emission

In the context of the “dual carbon” goals, reducing carbon emissions has become a critical component of achieving sustainable development. As a result, the factors influencing carbon emissions have emerged as a central focus in academic research. Numerous studies have conducted empirical analyses to uncover the complex mechanisms through which economic, social, policy, institutional, environmental, and climatic factors drive carbon emissions. These studies frequently employ time series or panel data models to quantitatively assess the determinants of carbon emissions.
Among them, the main influencing factors include economic development level [36], industrial structure [37], urbanization level [38], population [39], technological innovation [40], transportation [41], environmental regulation, etc., [42]. In addition, some studies have also incorporated fiscal expenditure [43], international trade [44], and financial development [45] into the analytical framework to explore the indirect impact of macroeconomic policies and market mechanisms on carbon emissions [46]. Other scholars have deeply analyzed the factors affecting human daily activities’ impact on carbon emissions, including demographic factors, internal influences, and external influences through questionnaires, interviews, hypothesis testing, and multivariate analysis [47].
In terms of research methods, scholars often use time series or panel data to quantitatively test the factors affecting carbon emissions in time and space [48,49]. For example, VECM and ARDL were used to study the relationship between carbon emissions, GDP, energy, and population [50]. The two-step difference and two-step system GMM models were used to find that technological innovation increased renewable energy consumption and carbon dioxide emissions [51]. The SDM was used to prove the spatial effect of the digital economy on carbon emissions [52].
As the concept of green development continues to evolve, “soft power” factors such as green innovation and human capital have emerged as critical areas of focus in carbon emission research [53]. Recent studies have highlighted the heterogeneous effects of green technological innovation on carbon dioxide emissions, often employing spatial panel econometric models based on the STIRPAT (Stochastic Impacts by Regression on Population, Affluence, and Technology) framework to capture these dynamics [54]. Additionally, the Environmental Kuznets Curve (EKC) hypothesis for innovative human capital has been empirically confirmed using SYS-GMM (System Generalized Method of Moments), demonstrating that investments in human capital can significantly contribute to the long-term sustainability of economic systems [55].
Given these insights, there is a growing trend toward integrating green innovation and human capital perspectives with spatial spillover and network transmission mechanisms to better understand the complex, multi-layered impact pathways of carbon emissions [56].

2.2. Theory and Hypothesis of Carbon Emission Influencing Factors and Spatial Effects

According to the Environmental Kuznets Hypothesis (EKC), there may be an inverted “U” relationship between environmental pollution and economic growth, that is, pollution emissions increase in the early stages of economic development, but when the economy reaches a certain stage, pollution emissions begin to decline [57]. China encourages and vigorously promotes green innovation technologies to gradually achieve sustainable development goals [58,59,60]. Green innovation can improve energy efficiency, reduce environmental pollution, and promote sustainable development [61]. China has made significant progress in the field of green innovation, and the driving role of green innovation has become increasingly significant [62]. However, in the early stages, high input costs may lead to high energy consumption. In addition, there are green technology barriers and market adaptation periods in the early stages, which may lead to increased carbon emissions in the short term. Therefore, this paper proposes the following:
Hypothesis 1: 
China’s provincial carbon emissions show a trend of first rising and then falling, and green innovation and carbon emissions show an inverted “U” relationship.
Existing studies have shown that the impact of green innovation on carbon emissions is significantly heterogeneous. For example, Xu et al. (2021) pointed out that different types of green innovation have different effects on carbon emission reduction, among which technological green innovation has a particularly significant improvement in carbon emission performance [24]. In addition, the impact of green innovation may not only be limited to a single region but may also have an impact on surrounding areas through spillover effects [63]. However, with the continuous advancement of green innovation and the continuous improvement in technological maturity, its role in energy conservation and emission reduction has gradually emerged [64]. On the one hand, green innovation can improve energy efficiency, promote the use of clean energy, reduce dependence on fossil energy, and thus reduce carbon emissions [65]. On the other hand, green innovation can also drive regional environmental governance cooperation, so that green technologies in advanced regions can spread to backward regions and enhance the synergistic effect of overall carbon emission reduction [66,67,68,69]. Therefore, this paper proposes the following:
Hypothesis 2: 
The impact of green innovation on carbon emissions has a negative spatial spillover effect.
In recent years, China has continuously increased the cultivation and introduction of high-quality human capital, emphasizing the important role of education quality, skills training, and scientific and technological innovation talent reserves in sustainable development. High-level human capital has become an important supporting force for China’s low-carbon transformation by promoting technological innovation, optimizing industrial structure, and improving management efficiency [70,71,72]. At the same time, the concentration of human capital not only contributes to the development and application of local green technologies but also drives the surrounding areas to achieve green transformation and emission reduction synergy through mechanisms such as talent flow, knowledge dissemination, and industrial synergy [73,74,75]. Therefore, this paper proposes the following:
Hypothesis 3: 
Human capital has a significant negative spatial spillover effect on carbon emissions.
R&D is a key factor in promoting green technology progress and the diffusion of energy-saving and carbon-reducing technologies. With the advancement of the “dual carbon” strategy, governments and enterprises across China have increased their financial support for low-carbon technology research and development, and the number of green patents and high-tech enterprises has grown rapidly, providing innovative momentum for high-quality economic development [76]. Existing studies have pointed out that R&D investment can not only promote energy conservation and emission reduction within the region but also produce significant emission reduction externality effects between regions through channels such as knowledge spillover, technology transfer, and cooperative innovation, helping to reduce carbon emission intensity in neighboring regions [77,78]. Therefore, this paper proposes the following:
Hypothesis 4: 
R&D has a significant negative spatial spillover effect on carbon emissions.
Green innovation not only directly affects the level of regional carbon emissions but also forms a complex spatial correlation network through inter-regional technology diffusion, industrial chain coordination, and policy interaction [79]. In the modern economic system, green innovation and human capital often have strong spillovers. Green technology and emission reduction experience in high-innovation regions may spread to other regions through industrial cooperation, capital flow and policy coordination [80] Carbon emissions have spatial correlation, that is, the carbon emission level of a region may be affected by the emissions of neighboring regions, thus forming a spatial correlation network of carbon emissions [81]. However, differences in influencing factors such as green innovation, industrial structure, and policy support in different regions make the spatial transmission path of carbon emissions heterogeneous [82]. Social network analysis (SNA) provides an effective method to characterize the spatial network structure of carbon emissions and reveal the carbon emission transmission mechanism between different regions [83,84]. By constructing a spatial correlation network of carbon emissions, key node provinces in the network can be identified and the impact path can be analyzed [85]. In addition, using relevant indicators of the network can further reveal how the driving factors of carbon emissions act through regional synergy [86]. Therefore, this paper proposes the following:
Hypothesis 5: 
China’s carbon emissions have a complex spatial network structure, and green innovation can produce spillover effects through spatial correlation networks, affecting the spatial distribution of regional carbon emissions.

2.3. Innovation of This Study

In light of China’s dual carbon strategy, this study builds a comprehensive analytical framework that combines spatial econometrics with social network analysis to examine the spatial dynamics and systemic transmission paths of carbon emissions across 31 provinces. Unlike traditional studies that treat carbon emissions as regionally contained phenomena, this research highlights their interconnected, cross-regional nature and offers a systems-based interpretation of their evolution. This study provides three major innovations:
First, it applies the Spatial Durbin Model (SDM) to capture not only the direct impacts of key regional variables—such as green innovation, R&D intensity, human capital, and openness—but also their spatial spillover effects on neighboring provinces. This dual-level estimation uncovers how one region’s policy orientation or innovation capacity can affect emission outcomes beyond its own borders, offering a more realistic understanding of policy externalities.
Second, by incorporating social network analysis (SNA), the study further quantifies the structural configuration of interprovincial carbon emission linkages. Unlike conventional spatial weight matrices, SNA enables the identification of central provinces, bridging nodes, and marginal actors within the emission transmission network. This approach sheds light on which provinces play pivotal roles in carbon diffusion, thus facilitating targeted governance strategies.
Third, the study investigates regional heterogeneity by comparing the role of core versus peripheral provinces in the carbon emission network. The results indicate that the impacts of green innovation and human capital differ significantly depending on a province’s network position and spatial context. Such analysis provides a nuanced perspective for differentiated policy formulation and supports the development of coordinated, multi-level emission control mechanisms.
This paper develops a novel analytical path of “driving forces → spatial spillovers → emission networks”, presenting a system-of-systems view of carbon governance. Compared with existing literature, which either focuses on localized determinants or adopts static spatial models (e.g., [87,88]), this study reveals the dynamic interactions and systemic feedback embedded in China’s regional carbon structure. The integrated SDM–SNA approach not only enhances empirical accuracy but also provides a scientific foundation for promoting collaborative, data-driven, and regionally tailored carbon reduction policies.
This study combines SDM with SNA to systematically reveal the spatial spillover effects and propagation paths of carbon emissions. By introducing dual fixed effects of time and space in SDM, the dynamic changes and regional heterogeneity of carbon emissions are more accurately captured. Through SNA, this study not only identifies the central provinces, bridging nodes, and marginal actors in the carbon emission network, but also further explores how green innovation and human capital affect the propagation path of carbon emissions through spatial spillover effects, making the spillover and propagation paths of carbon emissions more explainable. Based on empirical analysis, differentiated regional emission reduction policy recommendations are proposed, which provides a scientific basis and practical path for China to achieve coordinated carbon governance under the background of the “dual carbon” goal.

3. Methodology

First, the SDM is used primarily to quantify and verify the spatial spillover effects of carbon emissions. This approach allows us to capture both the direct and indirect impacts of key influencing factors, such as green innovation and human capital, on carbon emissions across Chinese provinces. The SDM framework effectively decomposes these impacts into direct effects (local impacts within a province) and indirect effects (spillover impacts on neighboring regions) through spatially lagged variables. This is essential for understanding how local changes can propagate through spatial networks, leading to regional disparities in emission outcomes.
Second, SNA serves a distinct but complementary role by providing a structural perspective on inter-provincial carbon transmission networks. Unlike SDM, which quantifies spillover magnitudes, SNA is specifically designed to identify key transmission paths and central node provinces within the carbon emission network. This approach allows us to visualize and measure the direction and strength of carbon flows between regions, capturing complex spatial interactions that conventional econometric models may overlook.

3.1. Moran Index

Moran’s I is a widely used measurement indicator in spatial econometrics used to analyze the spatial correlation of variables [89]. The global Moran index is used to measure the overall spatial autocorrelation [90]. The theoretical formula of the global Moran index is as follows:
I = n i = 1 n j = 1 n w i j x i x ¯ x j x ¯ S 2 i = 1 n j i n w i j
where n represents the number of regions; x i and x j represent the carbon emission levels of the regions i and j , respectively; x ¯ is the mean of carbon emissions in all regions; S 2 is the variance of carbon emissions; and w i j is an element of the spatial weight matrix, which is used to measure the intensity of spatial correlation between regions i and j .
The value range of the global Moran index is [−1, 1]. When I > 0 , it indicates that carbon emissions are positively correlated in space, that is, regions with higher carbon emissions tend to cluster together, and regions with lower carbon emissions also concentrate on each other, indicating that green innovation may have a certain regional spillover effect. When I < 0 , it indicates that carbon emissions are negatively correlated in space, that is, high-emission and low-emission regions have a mixed distribution, which may indicate that green innovation is unevenly diffused or affected by other factors. When I = 0 , it indicates that carbon emissions are not correlated in space and the distribution is random.

3.2. Spatial Metrology Algorithm

The Environmental Kuznets Curve (EKC) is a classic theory in environmental economics that describes the relationship between economic growth and environmental pollution [91]. The theory holds that in the process of economic development, there is an “inverted U-shaped” relationship between environmental pollution and per capita income, that is, as economic growth occurs, pollution levels first rise and then fall. The EKC theory provides an important theoretical framework for studying how green innovation affects carbon emissions.
However, the traditional EKC model is mainly based on non-spatial regression analysis, which fails to consider the spatial spillover effect of carbon emissions between regions and the diffusion path of green innovation. In fact, green innovation can not only reduce carbon emissions in the region but also affects the carbon emission levels of surrounding areas through technology diffusion, industrial collaboration, and policy linkage. Therefore, introducing spatial econometric methods to improve the EKC model can more comprehensively reveal the dynamic impact mechanism of green innovation on carbon emissions.
The EKC theory assumes that the relationship between carbon emissions and the economic development level can be expressed by the following regression model [92]:
E = α + β 1 Y + β 2 Y 2 + ε
where E represents the level of environmental pollution, Y represents the level of economic development, Y 2 is the quadratic term of income, capturing the nonlinear relationship, α and β are the parameters to be estimated, and ε is the error term. The EKC theory believes that when β 1 > 0 and β 2 < 0 , environmental pollution and economic growth present an inverted U-shaped curve relationship, that is, the pollution level rises in the early stage of economic development and then decreases after a certain inflection point.
In order to characterize the spatial spillover effect of green innovation on carbon emissions, we use the Spatial Durbin Model (SDM) to expand the EKC model, whose general form is as follows:
y = α + ρ W y + β X + W X θ + ε
where y is the carbon emission level, X represents green innovation and other control variables, W is an N × N dimensional spatial weight matrix used to measure the spatial association between regions, W y and W X represent the spatial lag terms of carbon emissions and explanatory variables, ρ represents the spatial autoregression coefficient, θ represents the spatial effect of the explanatory variable, and ε is the error term.
This paper uses the adjacency matrix as W . Among them, adjacency is determined according to administrative boundaries, that is, if two regions share a boundary, they are adjacent.
W = w i j = 1 ,   i   a n d   j   a r e   a d j a c e n t ,   a n d   i j 0 ,   i   a n d   j   a r e   n o t   a d j a c e n t ,   o r   i = j
In order to further characterize how green innovation affects carbon emissions through spatial effects, we construct the following improved EKC spatial model based on Formula (2):
l n C O 2 i t = α + ρ j = 1 n w i j l n C O 2 j t + β 1 l n G r e e n i t + β 2 l n G r e e n i t 2 + β 3 l n R D + β 4 H C + β 5 U r b + β 6 W o r k + β 7 O p e n + θ 1 j = 1 n w i j l n G r e e n i t + θ 2 j = 1 n w i j l n G r e e n i t 2 + θ 3 j = 1 n w i j l n R D i t + θ 4 j = 1 n w i j H C i t + θ 5 j = 1 n w i j U r b i t + θ 6 j = 1 n w i j W o r k i t + θ 7 j = 1 n w i j O p e n i t + η i + δ t + ε i t
Among them, l n C O 2 i t is the carbon emission of the province in year t , and l n G r e e n i t , l n R D , H C , U r b , W o r k and O p e n represent the green innovation level, R&D funding, human capital level, urbanization level, employment rate, and trade openness, respectively. w i j is the element of the spatial weight matrix, η i and δ t are the regional fixed effects and time fixed effects, respectively, and ε i t is the error term. ρ reflects the spatial autocorrelation of carbon emissions. If ρ > 0 , it indicates that carbon emissions have a positive spatial spillover effect, that is, high-emission regions may drive emissions in surrounding areas to rise; if ρ < 0 , it indicates that there is a negative spatial effect, that is, the reduction of carbon emissions in a certain region may drive carbon emissions in surrounding areas to decrease through mechanisms such as green innovation.
The SDM is a generalized spatial econometric model. When some parameters take certain values, they can be degenerated into other models:
When θ = 0 , the SDM degenerates into SAR, which only considers the spatial lag effect of the dependent variable:
y = ρ W y + X β + ε
When θ + β ρ = 0 , the SDM degenerates into SAR, which only considers the spatial lag effect of the dependent variable:
y = X β + ε ,   ε = ρ W ϵ + u
When ρ = 0 and θ = 0 , the SDM degenerates into the ordinary least squares regression (OLS) model:
y = X β + ε
In the SDM, the spatial spillover effect can be decomposed into direct effect and indirect effect through the partial derivative matrix:
Y i t = ( I ρ W ) 1 X β + W X θ + η i + δ t + ε i t
The direct effect is the impact of the independent variable on the dependent variable of the region, which is X β ; the indirect effect is the impact of the change in the independent variable in a certain region on the dependent variable in other regions, which is reflected by W X θ ; the total effect is the sum of the direct effect and the indirect effect.
The partial derivative matrix can be expressed as follows:
y i x k = ( I ρ W ) 1 A

3.3. Social Network Analysis

Social network analysis (SNA) is widely used to study the relationship between different individuals. It can measure the importance of individuals and the relationship between individuals by calculating relevant indicators of the network, such as central connectivity or network density. This study uses the SNA method to analyze the correlation of carbon emissions between sample provinces, construct a spatial carbon emission network, and reveal the role of each province in the carbon emission transmission network. In order to integrate the influencing factors of carbon emissions and geographical factors, we introduce the gravity model under the SNA framework.
The gravity model is a classic model for analyzing the interaction between two regions. It is widely used in many fields such as international trade, economy, and pollution. The model draws on the theoretical ideas of Newton’s law of universal gravitation and believes that the interaction force between two regions is proportional to their economic scale and inversely proportional to the distance. Its basic formula is as follows:
F i j = G M i M j D i j β
where F i j represents the interaction between region i and region j (such as trade flow, population flow or carbon emission transfer); M i and M i represent the economic scale of region i and region j , respectively; D i j represents the distance between region i and region j ; G is the proportionality coefficient; and β is the distance attenuation coefficient, which is usually positive, indicating that the interaction decreases with increasing distance.
Based on this study, the improved gravity model is as follows:
I i j = G i j C O 2 i G r e e n i H C i 3 C O 2 j G r e e n j H C j 3 D i j 2
G i j = C O 2 i C O 2 i + C O 2 j
where I i j represents the carbon emission gravity of region i to region j , and G i j represents the carbon emission contribution coefficient of region i to region j . C O 2 i and C O 2 j represent the carbon emissions of region i and region j , G r e e n i and G r e e n j represent the green innovation level of region i and region j , and H C i and H C j represent the human resource level of region i and region j . D i j represents the spatial distance between region i and region j .

3.4. Variables and Data

Table 1 shows the definition of each variable. In this study, CO2 stands for carbon emissions, which are represented by the annual carbon dioxide emissions [93]. Green stands for the level of green innovation, which is measured by the number of green patents authorized each year. Green_r is the number of green patent applications each year, which is used for robustness testing [94]. RD stands for the level of R&D, which represents the annual R&D expenditure [95]. HC stands for human capital, which is measured by the ratio of the number of college students to the total population [96]. Urb stands for the level of urbanization, which is represented by the ratio of the urban population to the total population [97]. Work stands for the employment rate, which is represented by the ratio of the number of employed people to the total population [98]. Open stands for the degree of openness to the outside world, which is represented by the ratio of the total import and export volume to the regional GDP [99]. The provincial data of 31 regions in China from 2000 to 2022 were adopted and processed.
Source of original data: Carbon emission data come from the EU Global Atmospheric Emissions Database EDGAR, which is a detailed global emissions database published by the EU Joint Research Center (JRC). R&D funding, human capital, urbanization level, employment rate, and degree of openness are all from the “China Provincial Database 5.0” and local statistical yearbooks. Annual green patent authorization comes from the China Research Data Service Platform (CNRDS).

4. Empirical Analysis

4.1. Spatial Autocorrelation Analysis

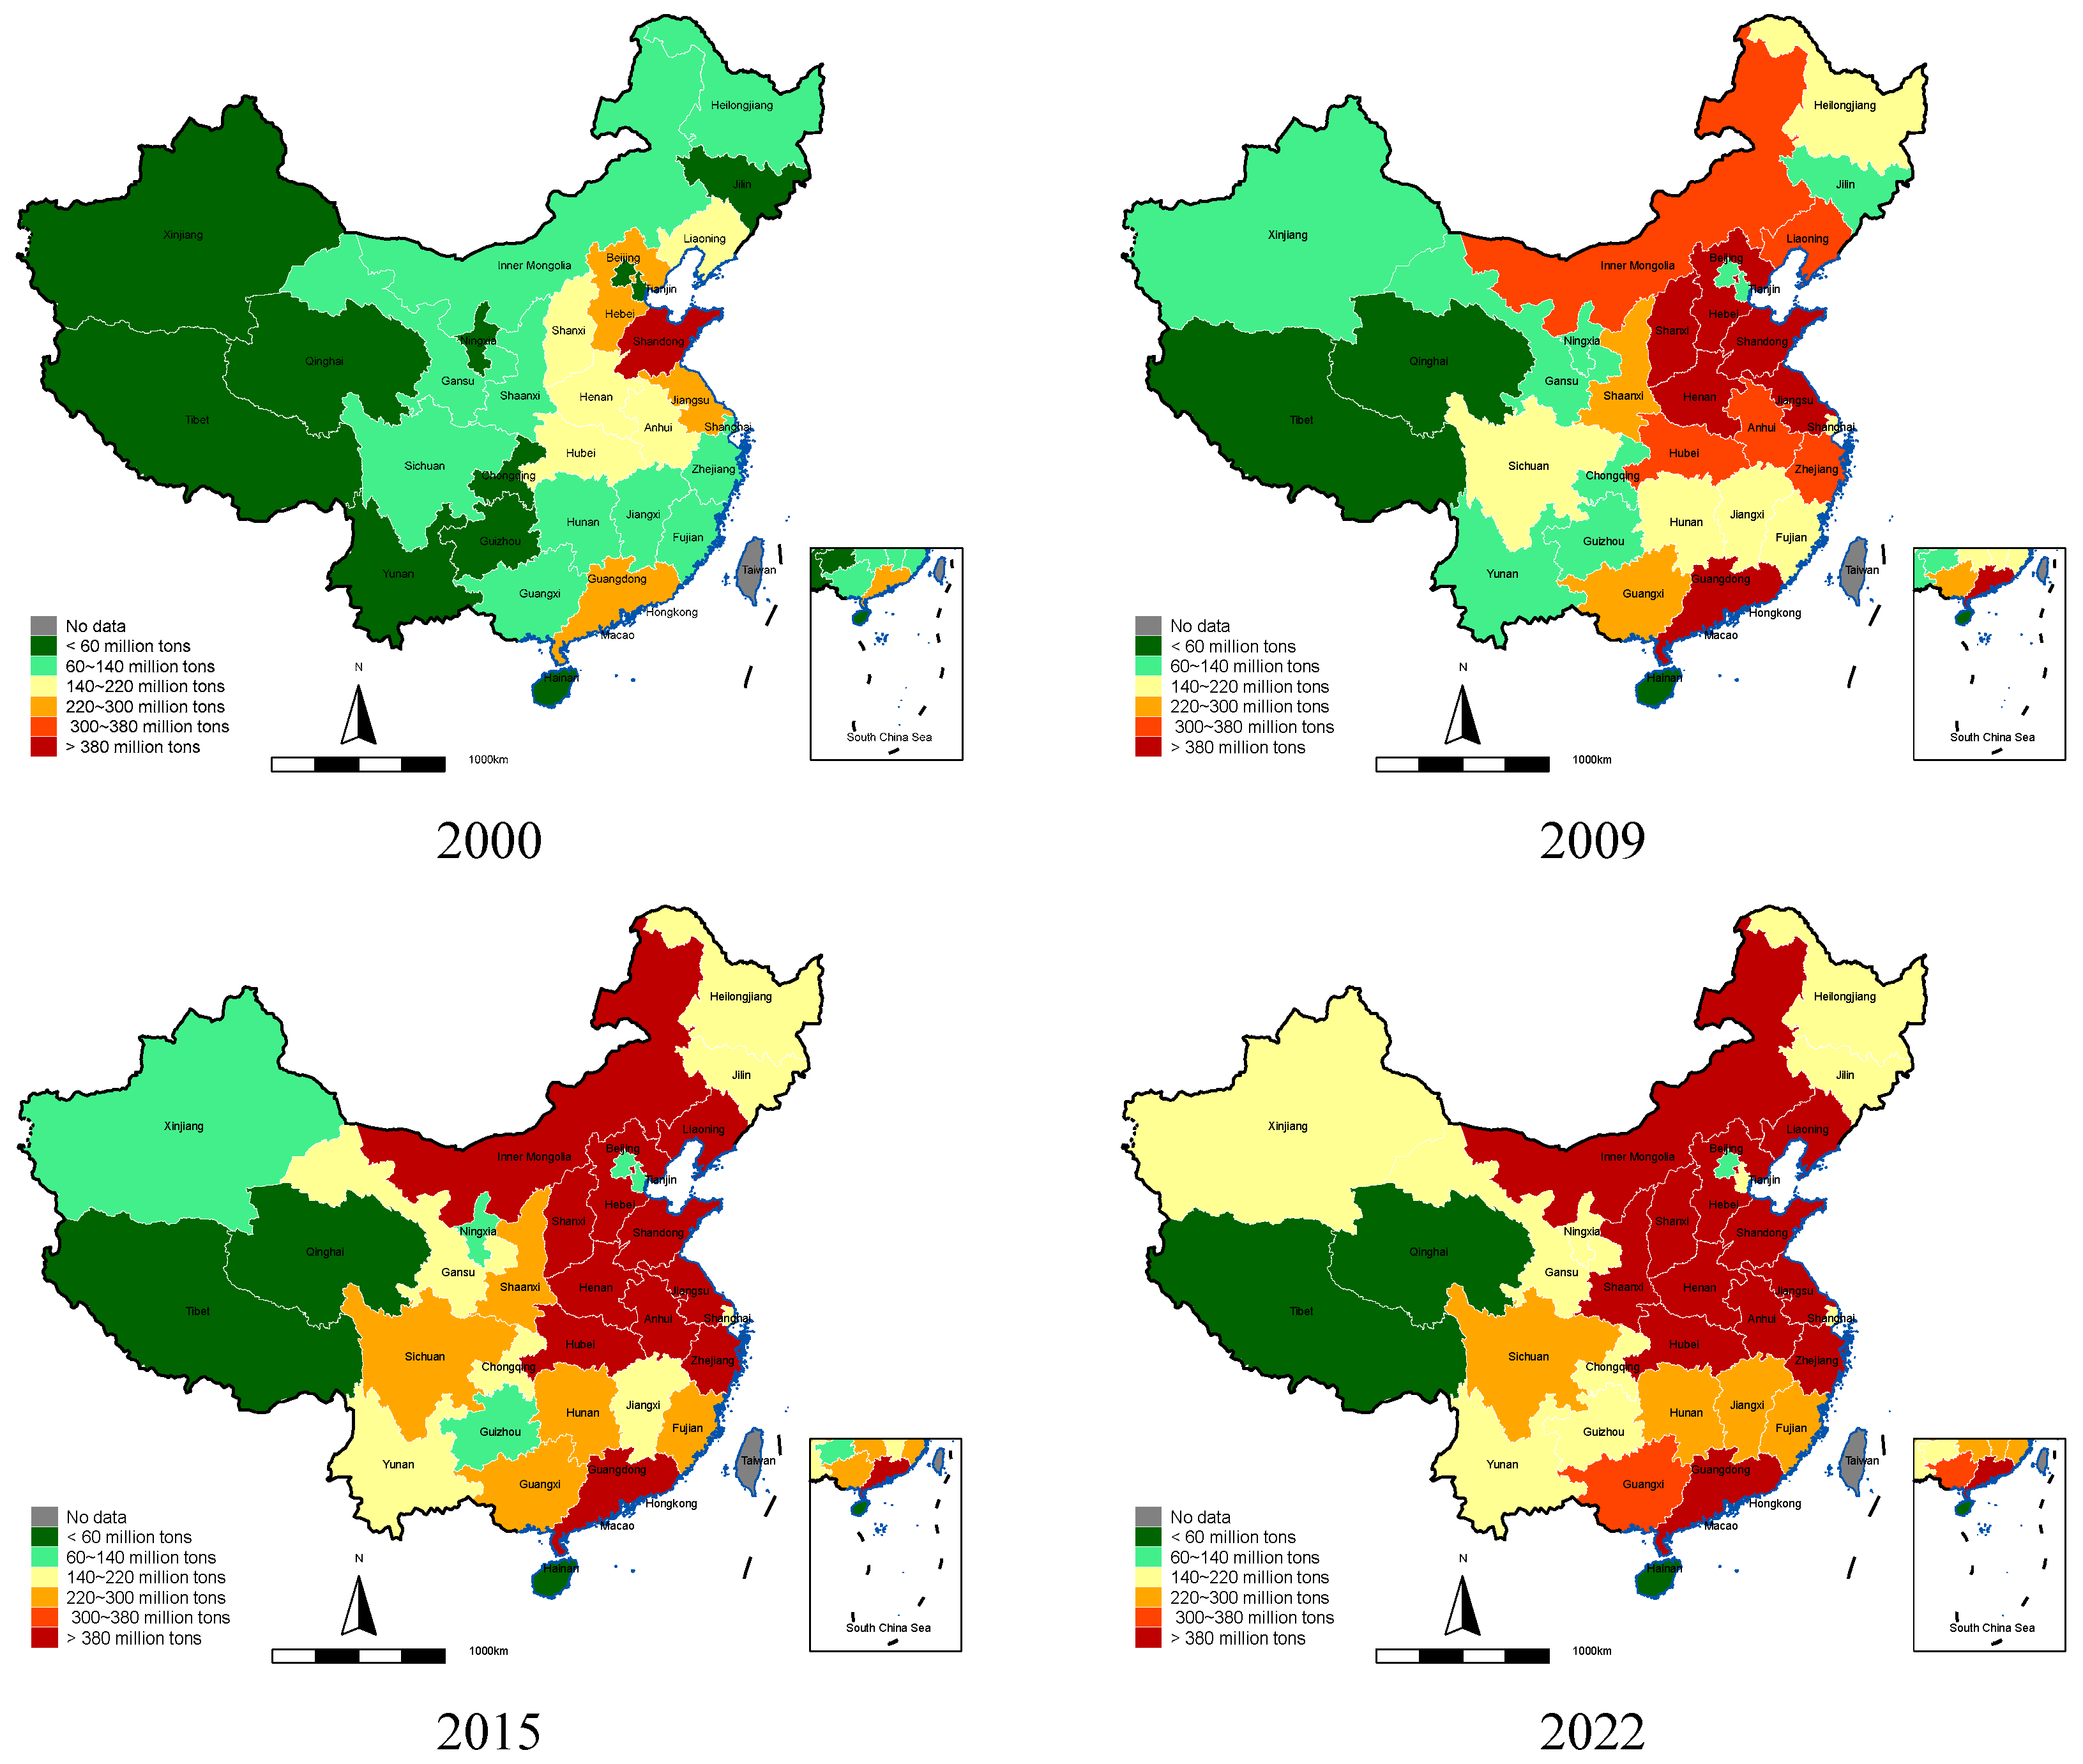
4.1.1. Spatial Distribution Map

Based on the spatial visualization of carbon emissions in four representative years, namely 2000, 2009, 2015, and 2022, it can be observed that carbon emissions in 31 provinces in China show obvious spatial agglomeration characteristics. Overall, provinces with higher carbon emissions are mainly concentrated in the central and eastern regions, among which Shaanxi, Henan, Hubei, Hunan, Shandong, and other provinces are at higher emission levels in the four time nodes. This may be related to the strong green innovation capabilities, higher human capital levels, and faster industrial upgrading process in these regions, which makes their role in the carbon emission network increasingly enhanced. In contrast, provinces with lower carbon emissions are mainly distributed in the west and parts of the northeast, such as Tibet, Jilin, Heilongjiang, Hainan, Qinghai, and other provinces. These provinces have relatively small connectivity in the carbon emission network due to their low-carbon industrial structure, relatively few green technology applications, and low economic outward orientation, and they are less affected by carbon emissions in other provinces. From the perspective of temporal changes, the spatial correlation of carbon emissions increased during the study period, and provinces with higher carbon emissions formed closer connections within the region, indicating that the transmission path of carbon emissions has gradually solidified (Figure 1).

4.1.2. Spatial Autocorrelation

Table 2 shows the global Moran’s I index of carbon emissions and green innovation in 31 provinces in China from 2000 to 2022. Under the 0–1 spatial weight matrix, Moran’s I index has passed the 1% level of significance test, which shows that there is a spatial aggregation effect between carbon emissions and green innovation among provinces, supporting the necessity of using spatial econometric models. The global Moran’s index has an overall upward trend, from 0.281 in 2000 to a peak of 0.350 in 2009, and then fluctuated slightly but always maintained a high level (0.331–0.348). This trend shows that the spatial aggregation of carbon emissions increased significantly from 2000 to 2009 and then entered a relatively stable high aggregation state.

4.1.3. U-Test

According to the U-test results in Table 3, the calculated extreme point is 7.163, and lngreen’s interval is [0, 10.722], rejecting the hypothesis at the 10% significance level. At the same time, slope has a negative sign in the calculated results, so it can be considered that the impact of green innovation on carbon emissions has an inverted U-shaped relationship. Hypothesis 1 is proven.

4.2. Results of SDM

4.2.1. LM, LR, and Wald Tests

The above analysis shows that there is obvious spatial correlation in carbon emissions in 31 provinces of China. This paper first conducts a spatial correlation test to identify a suitable spatial econometric model [100]. Specifically, the null hypothesis (H0) for the LM spatial lag, robust LM spatial lag, LM spatial error, and robust LM spatial error tests is formulated as “there is no spatial dependence” between variables. From Table 4, the statistics of LM spatial lag, robust LM spatial lag, LM spatial error, and robust LM spatial error are all significant at the 1% significance level, indicating that carbon emissions have both spatial lag effects and spatial error effects in space. Therefore, the spatial distribution characteristics of carbon emissions cannot be simplified to SEM (spatial error model) or SLM (spatial lag model) but need to further consider more complex spatial effects. In addition, the results of the Wald and LR tests show that the statistical values of Wald spatial lag, Wald spatial error, LR spatial lag, and LR spatial error are all significant at the 1% level, rejecting the null hypothesis of no spatial dependence. This further indicates that the SDM (Spatial Durbin Model) is the best choice. In terms of the selection of fixed effects, the results of the Hausman test and the LR test both show that the fixed effect model is more appropriate than the random effect model. At the same time, the LR test statistic of the time-space dual fixed effect model is 2730.69, which is significant at the 1% level, indicating that the time-space dual fixed effect of carbon emissions is better than the single time- or space-fixed effect. Therefore, when studying the influencing factors of inter-provincial carbon emissions in China, using SDM and introducing time and space dual fixed effects is the best choice.

4.2.2. Results of Regression

According to the regression results (Table 5), the carbon emissions of 31 provinces in China during 2000–2022 showed significant spatial spillover effects. First, lngreen and (lngreen)2 showed positive and negative effects at the 1% significance level, respectively, and their spatial lag term Wx: lngreen was also significant at the 1% significance level, indicating that the impact of green innovation on carbon emissions has nonlinear characteristics and that green innovation may promote a reduction in carbon emissions in the early stage; however, when the innovation level is further improved, it may trigger new carbon emission growth, forming an inverted U-shaped relationship. lnRD has a significant positive impact on carbon emissions at the local level (0.108 ***), while its spatial lag term Wx: lnRD shows a negative impact (−0.104 ***), indicating that regional R&D may promote the growth of carbon emissions in the region, but the technological spillover effect it brings can help surrounding provinces reduce carbon emissions, reflecting the cross-regional influence of innovation. The local impact of HC on carbon emissions is significantly positive (6.702 ***), but its spatial lag term Wx: HC is significantly negative (−16.918 ***), indicating that local human capital accumulation may promote carbon emissions but higher levels of human capital can help surrounding areas reduce carbon emissions through spillover effects. This may be because the mobility of highly skilled talents enhances the dissemination and sharing of energy-saving and emission-reduction technologies. For urb (urbanization level), the local impact is not significant, but its spatial lag term Wx: urb is significantly positive at the 1% level (0.242 ***), indicating that urbanization may mainly affect carbon emissions through the coordinated development of neighboring regions. The local impact of work (labor participation rate) is not significant, but its spatial lag term Wx: work is negative (−1.052 ***), indicating that high labor participation rates in surrounding areas may reduce carbon emissions in the local area, which may be related to industrial transfer or the diffusion of energy-saving technologies. The local effect of open (openness to the outside world) is not significant, but its spatial lag term Wx: open is significantly positive at the 1% level (0.273 ***), indicating that opening up to the outside world may lead to an increase in carbon emissions between regions, which may be related to trade activities and industrial chain associations.
Overall, ρ is 0.277 ***, indicating that the spatial correlation of carbon emissions is strong, and R2 is 0.241, indicating that the model has good explanatory power. In summary, carbon emissions have significant spillover effects in space, and regional economic, innovation and human capital factors all play an important role in the spatial evolution of carbon emissions.
Table 6 shows that at the 1% significance level, the direct effects of lnGreen and (lnGreen)2 on lnCO2 are positive and negative, respectively, indicating that there is an inverted U-shaped relationship between green innovation and carbon emissions. That is, in the initial stage, the promotion of green innovation may lead to a short-term increase in carbon emissions, but when green innovation reaches a certain level, carbon emissions will gradually decrease, verifying the Environmental Kuznets Curve (EKC) hypothesis 1 again.
At the same time, lnGreen and (lnGreen)2 also have a significant indirect effect on lnCO2 at the 1% significance level, indicating that green innovation activities in neighboring regions also affect local carbon emissions, further confirming the existence of regional spillover effects. The total effect is also significant at the 1% significance level, further indicating that the impact of green innovation on carbon emissions has an inverted U-shaped feature. lnRD has a significant positive direct effect on carbon emissions at the 1% significance level, indicating that an increase in lnRD may promote economic activities and increase carbon emissions in the short term. However, its indirect effect is negatively significant at the 1% significance level, indicating that the spillover effect of lnRD helps to reduce carbon emissions in neighboring provinces. The total effect is significant at the 10% significance level, indicating that lnRD also has an inhibitory effect on the whole carbon emissions. The direct effect of HC on carbon emissions is positively significant at the 1% significance level, indicating that human capital accumulation will increase carbon emissions in the province. However, its indirect effect is negatively significant at the 1% significance level, indicating that human capital can reduce carbon emissions in neighboring provinces through spillover effects. The total effect is also significant at the 1% significance level, indicating that from the overall perspective, the growth of human capital may have a certain inhibitory effect on carbon emissions. The direct effect of urb is not significant, but its indirect effect and total effect are significant and positive at the 10% significance level, indicating that the urbanization process may lead to an increase in carbon emissions in neighboring regions and the whole. This may be due to the increase in energy demand and the improvement in the industrialization level brought about by urban expansion. The direct effect of the labor level is not significant, but it has a negative indirect effect at the 1% significance level, indicating that the improvement of labor level can effectively reduce carbon emissions in neighboring provinces. The total effect is also significant at the 1% significance level, indicating that the adjustment of employment structure may play a role in reducing emissions at the regional level. open (openness to the outside world) did not pass the significance test in terms of direct effect, but its indirect effect is significant and positive at the 1% significance level, indicating that the increase in openness to the outside world may affect regional carbon emissions through trade and investment channels. The total effect is also significant at the 1% level, indicating that changes in regional openness to the outside world may affect the overall carbon emission level.
Overall, green innovation, human capital, and R&D play an important role in regional carbon emissions, and all have obvious negative spillover effects. Hypothesis 2, Hypothesis 3, and Hypothesis 4 are proven. This shows that when formulating carbon emission reduction policies, full consideration should be given to the interaction and coordination mechanism between regions to promote the sustainable development of a low-carbon economy.

4.2.3. Robustness Test

This paper uses the number of green patent applications green_r as the core explanatory variable to replace the number of green patent authorizations, green, and conducts a robustness test. Table 7 show that the coefficients of green_r and its square term are still significantly positive and negative at the levels of 1% and 10%, respectively, indicating that there is still a significant inverted “U” relationship between green innovation and carbon emissions. At the same time, the spatial lag term ρ is significantly positive, indicating that green innovation has spatial spillovers in the local low-carbon transformation. In addition, the direct effect of human capital is significantly positive, indicating that the concentration of local high-quality labor may be accompanied by higher carbon emissions, reflecting the intensity of industrial activities supported by high-level human capital. The indirect effect of HC is significantly negative, indicating that human capital has a significant inhibitory effect on carbon emissions in neighboring regions through mechanisms such as talent flow and technology diffusion, and there is a negative spatial spillover effect. For lnRD, its direct effect on local carbon emissions is positive, indicating that in the early stages of innovation, related inputs may promote industrial expansion and lead to increased emissions. However, its indirect effect is significantly negative, indicating that technological innovation has a significant role in driving emission reduction in surrounding areas. Overall, the total effect of lnRD is not significant, indicating that its carbon emission reduction effect is mainly reflected in the regional coordination level. Therefore, the robustness test further confirms the spillover effect of green innovation, human capital, and R&D activities on carbon emissions, supports the research hypothesis and mechanism explanation proposed in the previous article, and verifies the robustness of the model.

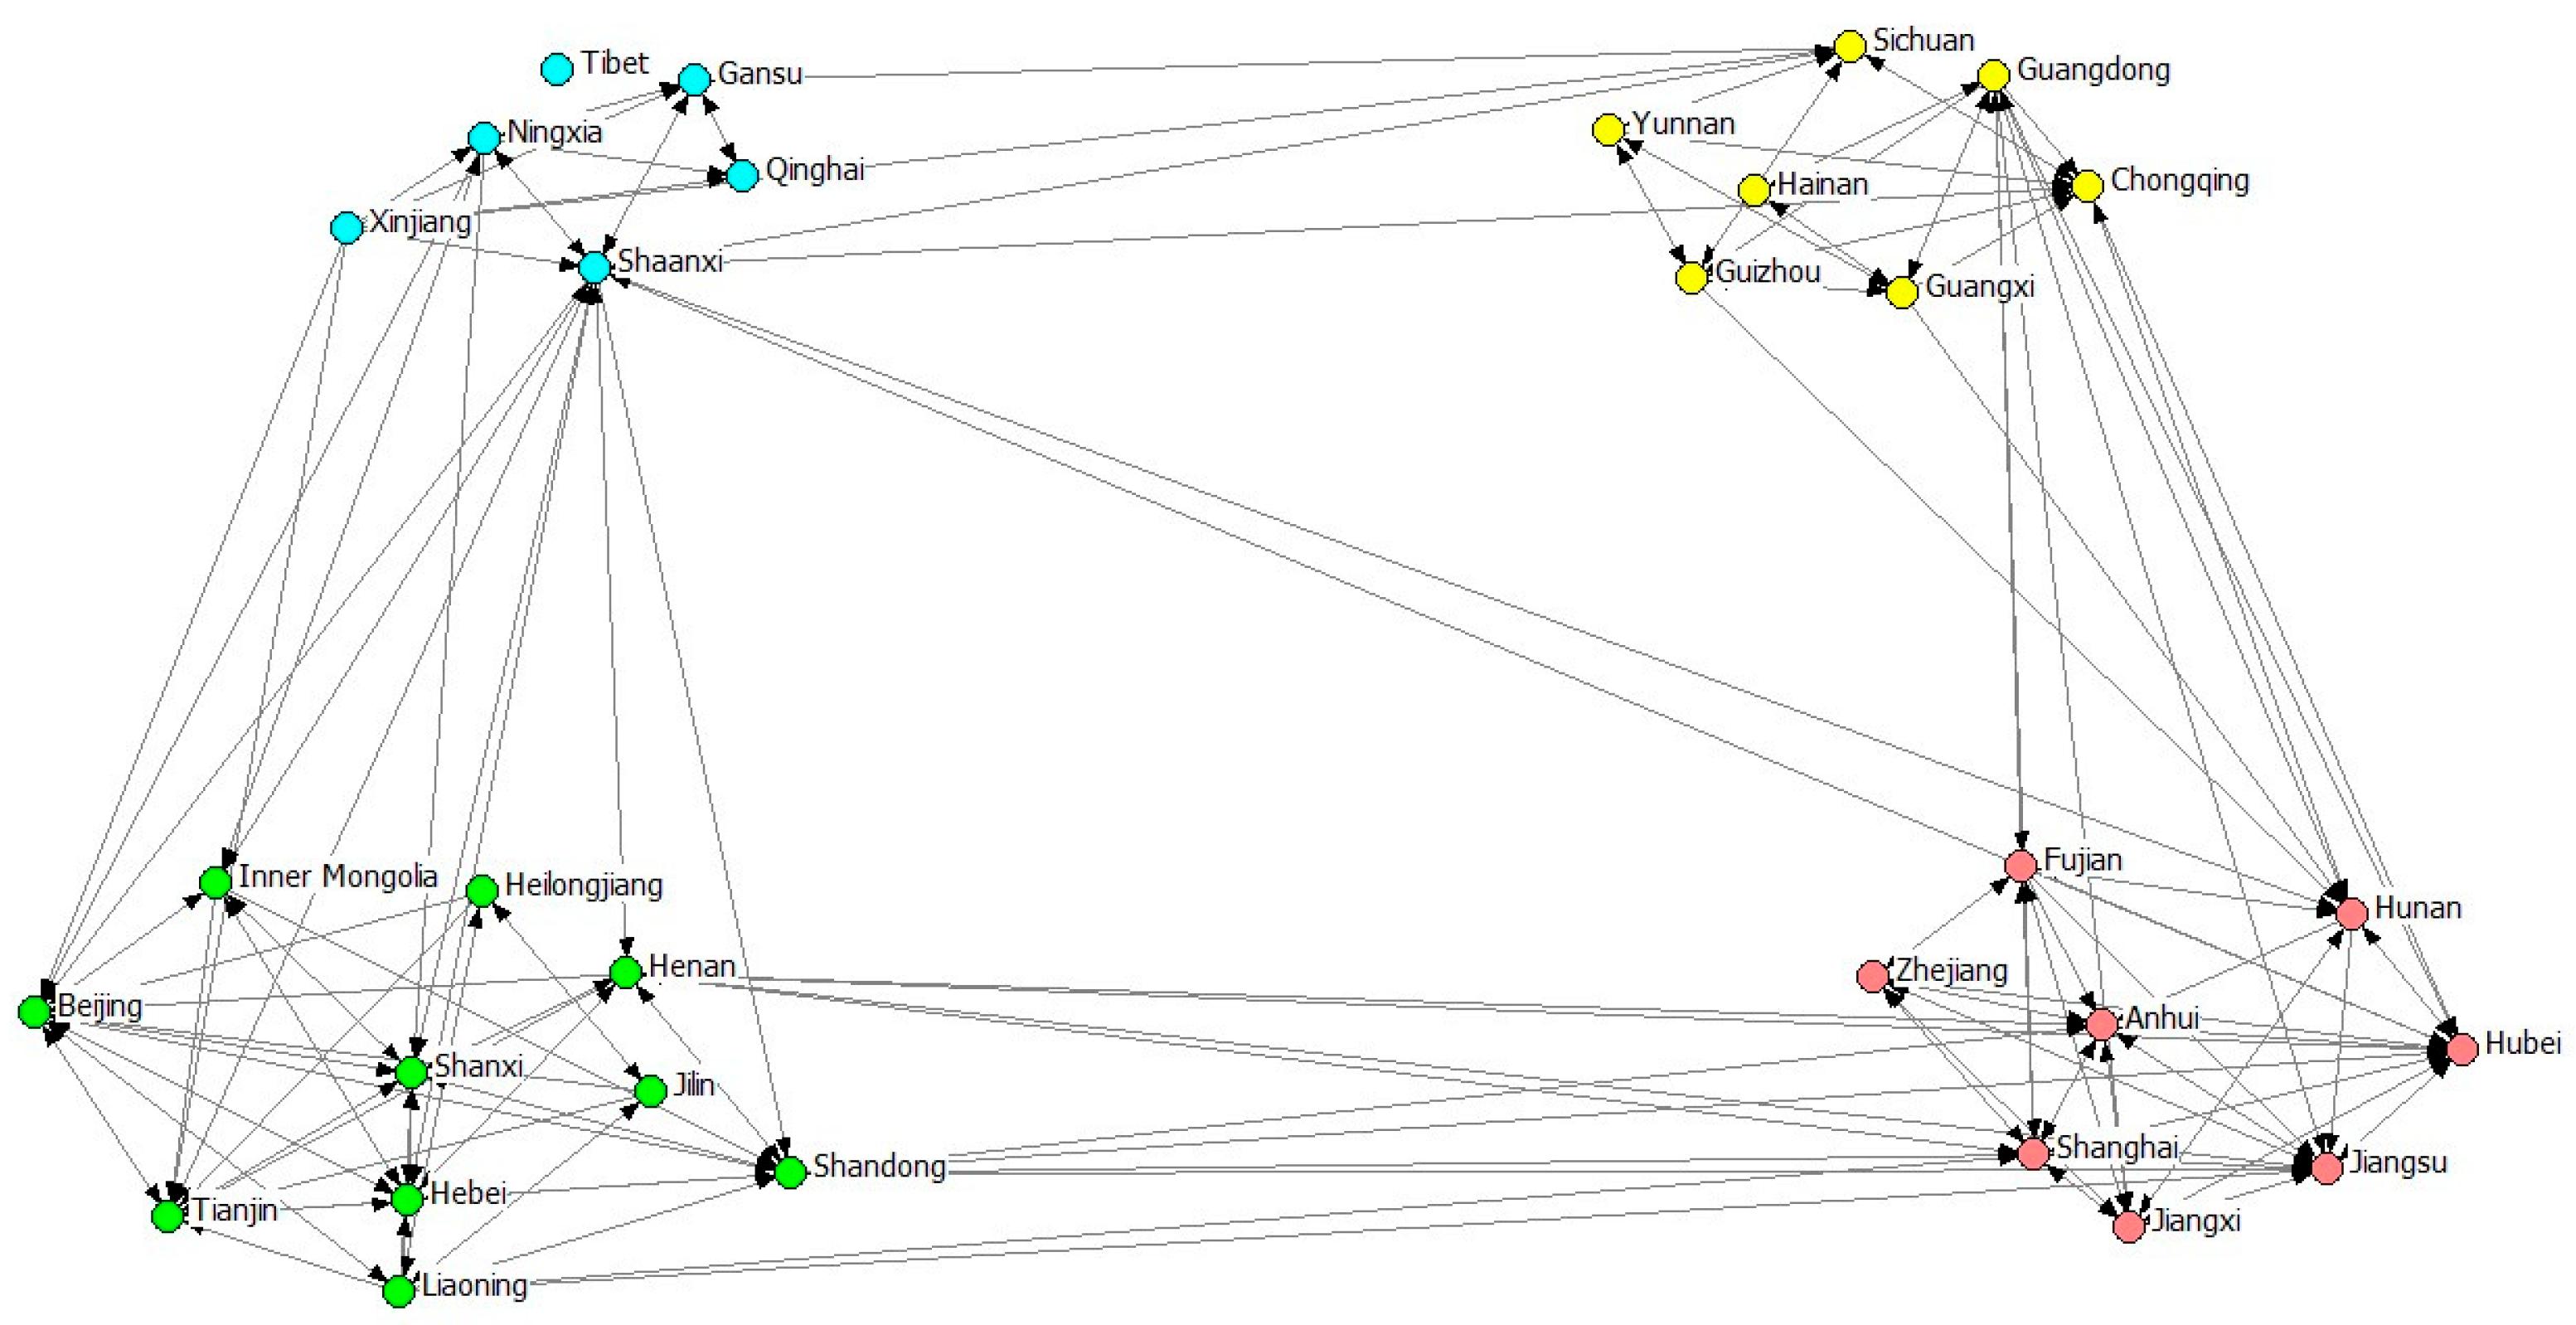
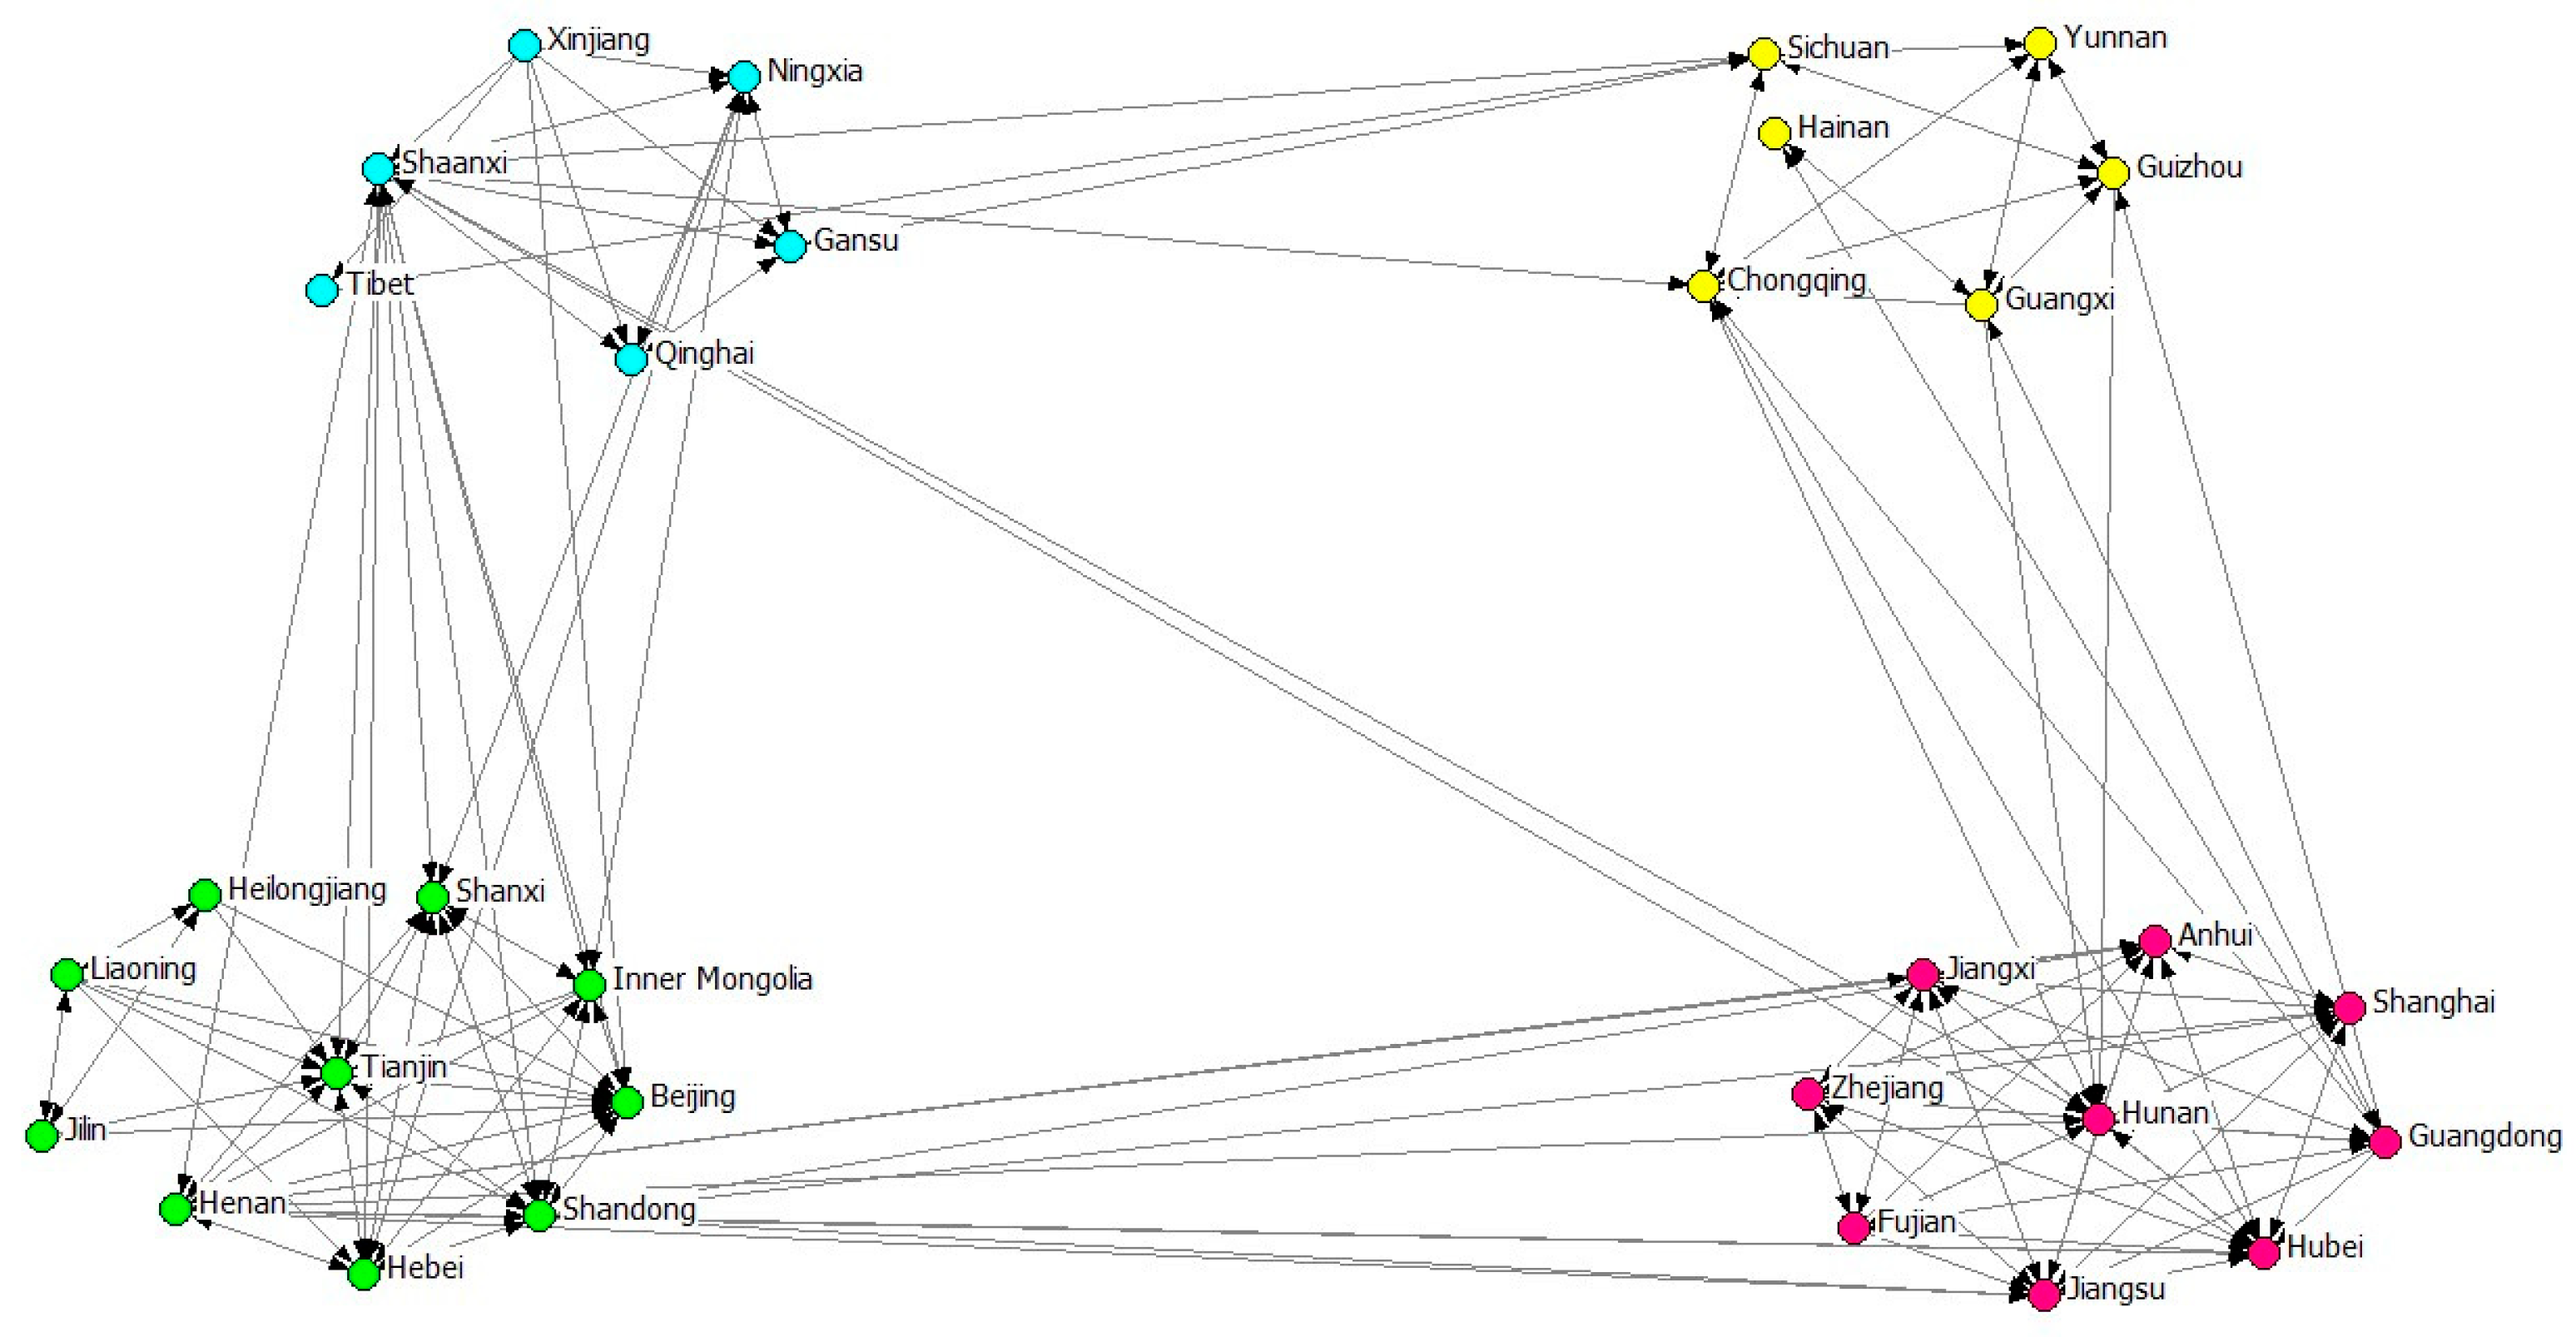
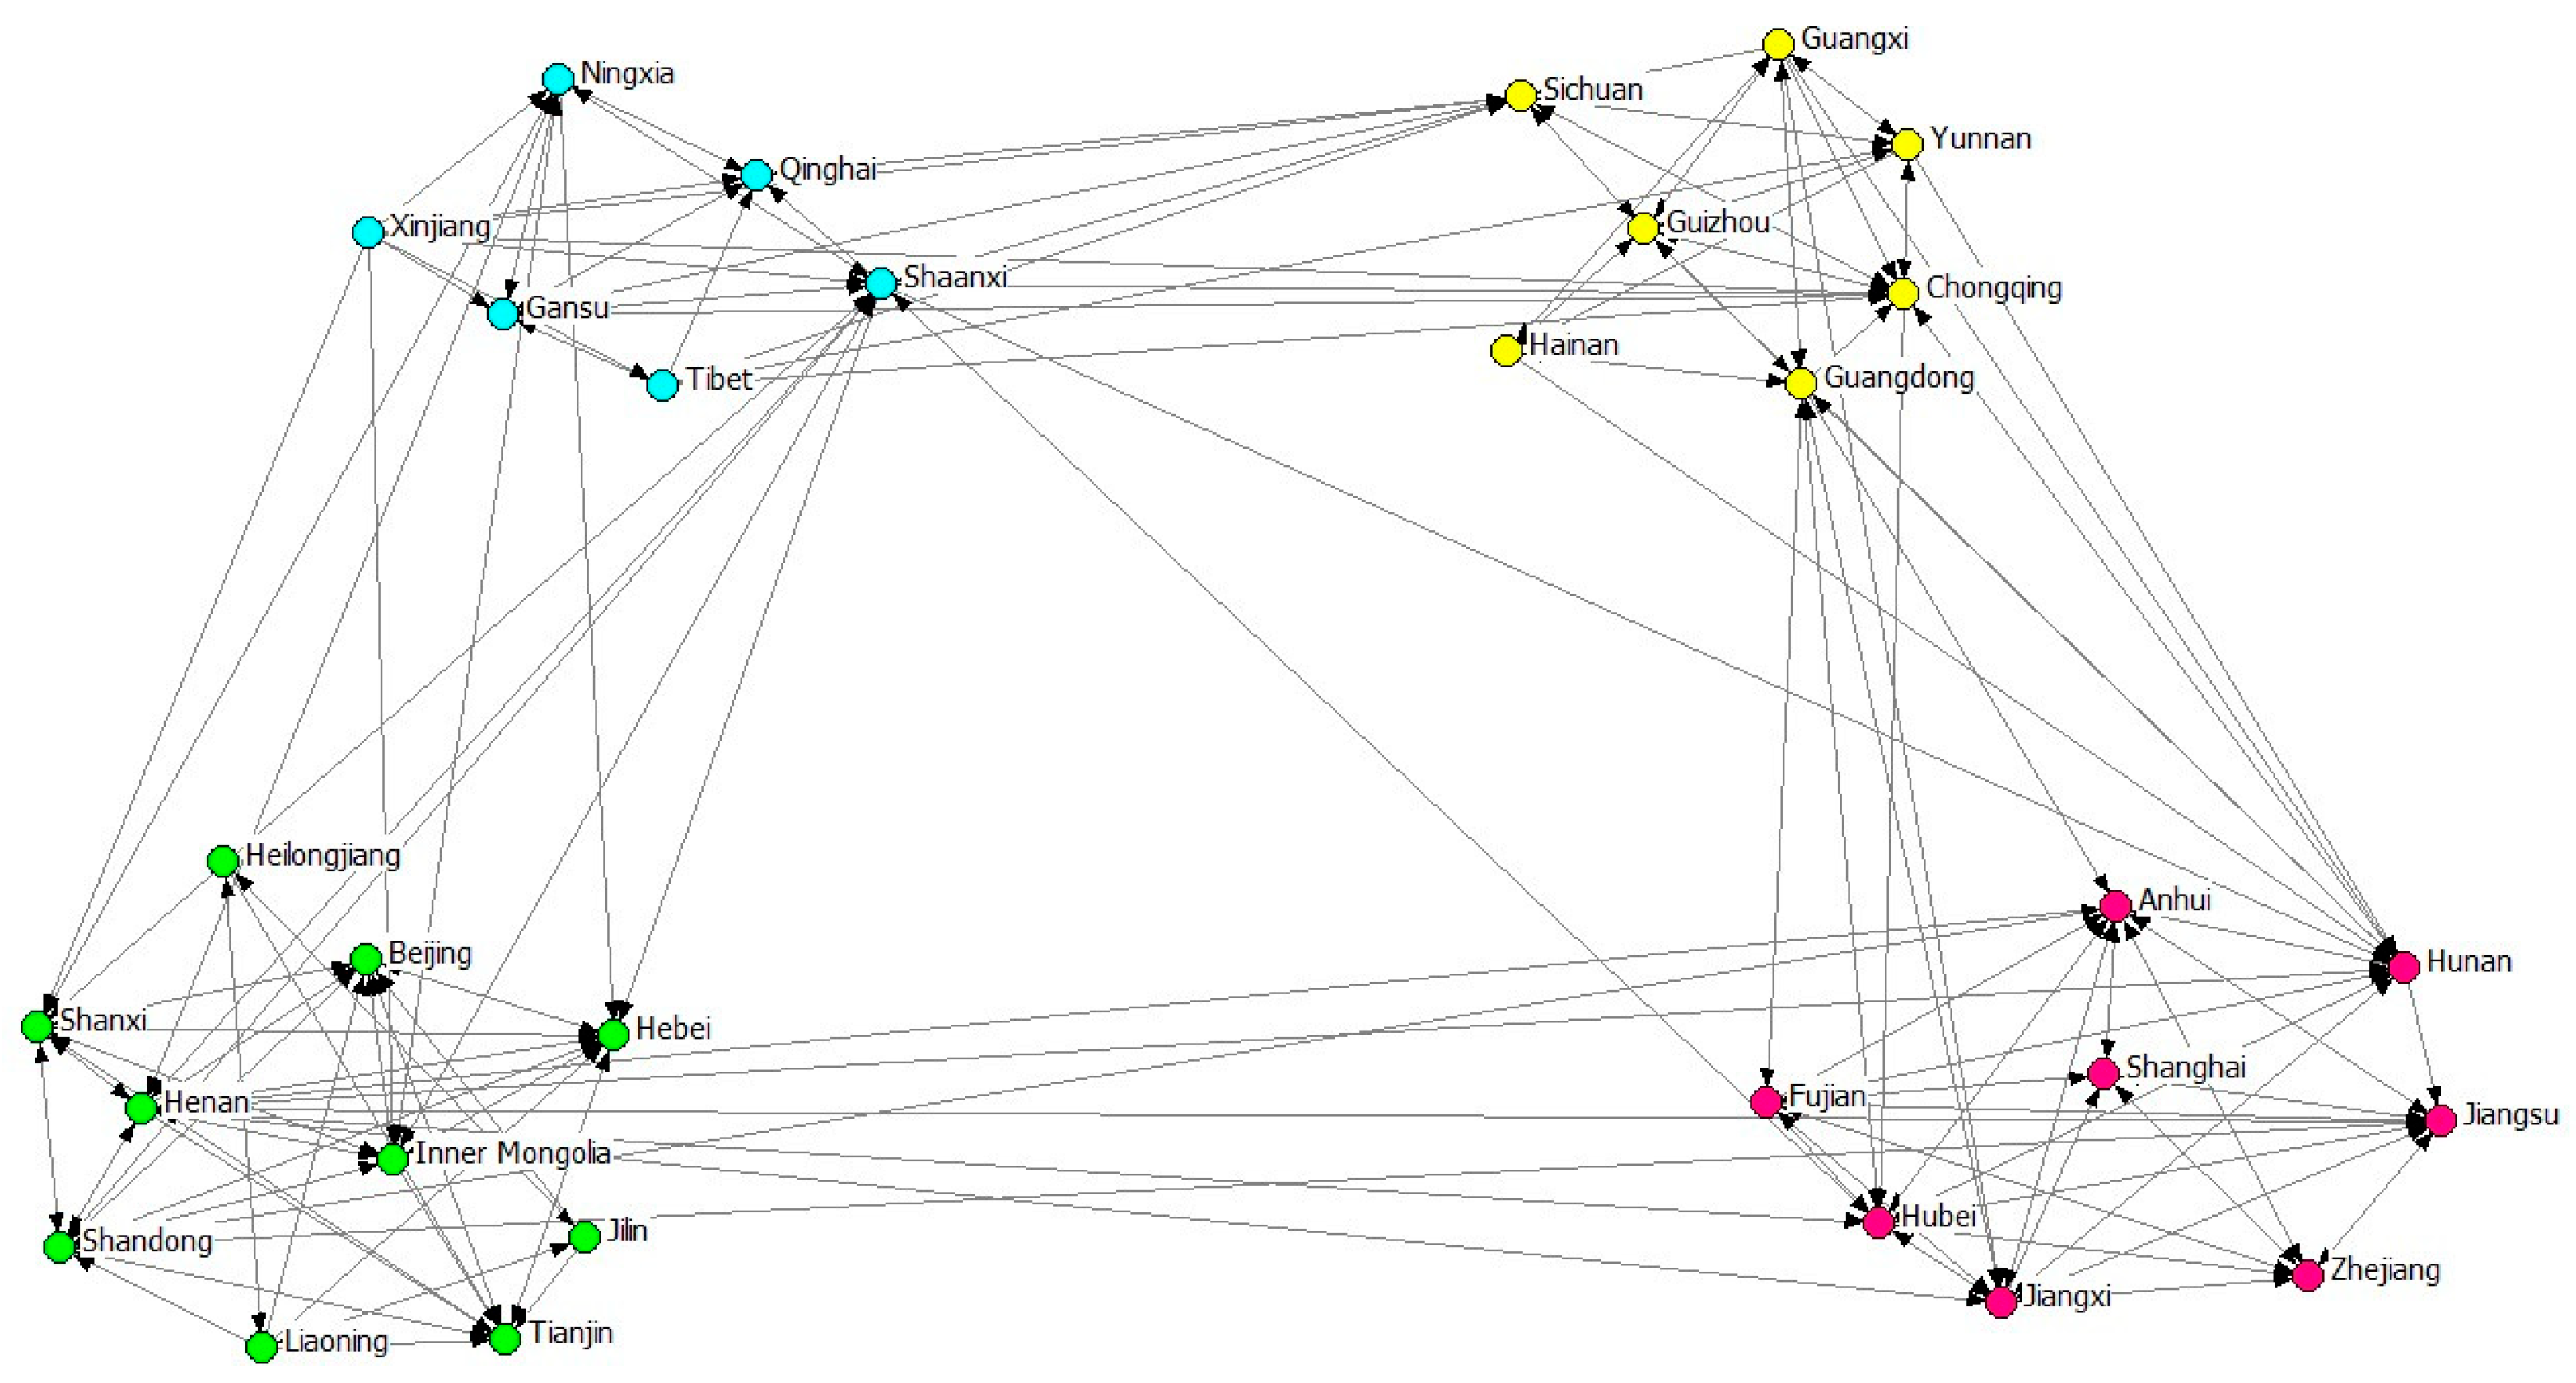
4.3. Result of Social Network Analysis

In the process of policy implementation, targeted carbon emission reduction policies should be formulated, and phased goals and differentiated measures should be set so that emission reduction strategies can effectively adapt to the economic development level and energy structure of each region [101]. This study measured the role of 31 provinces in China in the national carbon emission network, focusing on analyzing their spatial spillover effects and the transmission path of carbon emissions. Although total carbon emissions are an intuitive standard for measuring the carbon emission reduction pressure of each province, combining the position and transmission characteristics of each province in the carbon emission network is more conducive to formulating accurate and differentiated policies and improving emission reduction efficiency. Since traditional econometrics mainly analyzes carbon emissions from an overall perspective rather than focusing on spatial interactions between individuals, this study uses social network analysis (SNA) to evaluate the correlation of inter-provincial carbon emissions and further analyze the carbon emission transmission network of 31 provinces in China, so as to formulate more targeted policies and avoid the “one-size-fits-all” phenomenon.
This study uses the Spatial Durbin Model (SDM) to test the spatial correlation of carbon emissions and constructs a spatial weight matrix of carbon emissions. Figure 2, Figure 3, Figure 4 and Figure 5 show the spatial network structure of carbon emissions in 31 provinces of China in 2000, 2009, 2015, and 2022, respectively. The arrows in the figure only reflect spatial correlation and spillover effects and do not represent strict causal relationships. The direction of the arrows indicates the spatial spillover path of carbon emissions. They are clustered into four categories through CONCOR, each of which has a high degree of existence, that is, a province with obvious carbon emission spillover. The study found that the centrality and transmission path of different provinces in the carbon emission network have changed dynamically, and some high-emission provinces have played a core role to varying degrees in different periods. The study shows that the spatial network structure of carbon emissions shows a certain degree of stability during the study period.
Table 8 shows the network density of carbon emissions in 31 provinces in China from 2000 to 2022. The annual network density ranges from 0.200 to 0.223, with an average of 0.213. The overall network density shows a trend of first rising (2000–2016) and then fluctuating slightly (2016–2022). Between 2000 and 2016, the network density increased from 0.203 to 0.223, indicating that the spatial correlation of inter-provincial carbon emissions increased. From the overall trend, the network density of carbon emissions remains at a high level, indicating that there is significant spatial autocorrelation in carbon emissions among provinces in China. Therefore, the coordinated governance of carbon emissions is still crucial, especially for the core areas of carbon emissions, where the spillover effects of their emission reduction policies may have a profound impact on surrounding areas; therefore, Hypothesis 5 is proven.
Degree centrality reflects the degree of direct connection between a province and other provinces. In the time span from 2000 to 2022, Shaanxi, Henan, Hubei, Hunan, and other provinces have always been at the forefront of degree centrality. This shows that these provinces not only have high carbon emissions themselves but are also key nodes in the carbon emission network, and they may play an important role in green technology transfer and carbon emission policy coordination. The provinces with the lowest degree centrality, such as Tibet, Hainan, Jilin, and Heilongjiang, have low connectivity in the carbon emission network, which may be due to their low economic outward orientation and weak human capital mobility, making them play a smaller role in the spatial transmission of carbon emissions.
Provinces with higher closeness centrality, such as Shaanxi, Henan, Hunan, Hubei, and Shandong, have shorter transmission paths in the carbon emission network, can influence other provinces or be influenced by other provinces more quickly, can respond to carbon emission reduction policies more quickly, and present a demonstration effect on other provinces. Provinces with lower proximity centrality, such as Tibet, Jilin, Heilongjiang, Qinghai, and Xinjiang, have less influence on carbon emissions in the network due to their remote geographical location, low economic, human capital, and technological innovation levels.
Betweenness centrality measures the role of a province as a bridge in the flow of carbon emissions. Shaanxi, Hunan, Henan, Shandong, and other provinces have been at a high position in intermediary centrality for many years, indicating that they play a hub role in the spatial diffusion path of carbon emissions. Table 9 and Table 10 show that these provinces are important intermediaries for the transmission of carbon emissions to surrounding provinces. In contrast, Tibet, Jilin, Heilongjiang, Xinjiang, Hainan and other places have lower intermediary centrality, indicating that their carbon emissions have a weaker impact on the transmission path of other provinces.

5. Conclusions and Systemic Policy Implications

5.1. Conclusions

Building on the framework of spatial systems analysis, this study combines the Spatial Durbin Model (SDM) with social network analysis (SNA) to uncover the intricate interdependencies, transmission paths, and structural centralities that shape provincial carbon emissions in China. Using panel data from 31 provinces covering the period from 2000 to 2022, this approach provides a comprehensive, multi-layered perspective on how innovation capacity, human capital, and regional connectivity jointly influence carbon emission trajectories within a spatially interconnected system.
(1) 
Spatial spillovers and system coupling
The results validate that carbon emissions exhibit strong spatial spillover effects—an essential characteristic of a coupled regional system. Emission changes in one province are not independent but are systematically influenced by adjacent provinces through geographic proximity, industrial synergy, and policy alignment. These findings confirm that regional carbon emissions should be interpreted not as isolated outputs but as emergent properties of an interdependent spatial system.
(2) 
Green innovation as a nonlinear system input
Green innovation demonstrates a nonlinear (inverted U-shaped) influence on carbon emissions. In the early stages, emissions rise due to technological investment and transition costs. However, as innovation matures, emissions decline, revealing an S-shaped adjustment dynamic within the system. Importantly, the innovation process not only affects local outcomes but also acts as a system-level input, generating positive externalities through interprovincial diffusion pathways.
(3) 
Emission networks and structural asymmetries
The emission system exhibits distinct network characteristics, where core provinces—such as Shaanxi, Henan, and Hubei—occupy central transmission positions. These provinces serve as hubs within the carbon diffusion network, influencing multiple downstream regions. Meanwhile, innovation-driven provinces like Shanghai and Beijing function as upstream nodes in the green technology subsystem, indicating a two-layered spatial system: one dominated by emission intensity, and the other by innovation capacity and regulatory leverage.
The inverted U-shaped effect of green innovation is consistent with the framework of the Environmental Kuznets Curve (EKC), which verifies the previous research conclusion that the initial stage of technological development may have an “increase first and then decrease” effect on carbon emissions.
On this basis, this study combines the Spatial Durbin Model (SDM) with social network analysis (SNA), not only verifying the interdependence of carbon emissions between regions from the perspective of spatial spillover but also further revealing the structural asymmetry, core nodes, and diffusion paths in the inter-provincial emission network.
This network perspective makes up for the shortcomings of traditional spatial econometric models in structural identification and diffusion mechanism analysis, allowing us to more systematically understand how carbon emissions spread among different provinces as a product of regional linkage processes. The highlight of this study is that it provides a more targeted basis for regional identification and path regulation for carbon governance policies from a multi-level and multi-dimensional perspective.

5.2. Systemic Policy Implications

Based on the system-level findings, we propose a set of interlocking policy interventions designed to improve the structure, adaptability, and resilience of the regional carbon governance system:
(1) Promote technological spillovers from innovation centers and strengthen regional collaborative innovation mechanisms. The State Council’s notice on issuing the “2024–2025 Energy Conservation and Carbon Reduction Action Plan” emphasized that energy conservation and carbon reduction are important measures to actively and steadily promote carbon peak and carbon neutrality, comprehensively promote the construction of a beautiful China, and promote the comprehensive green transformation of economic and social development.
First, the positive spatial spillover effects of green innovation underscore the necessity of facilitating regionally integrated technological ecosystems. Provinces with strong innovation capacities—such as Beijing, Shanghai, Jiangsu, and Guangdong—should be strategically positioned as hubs for disseminating green technologies. National and provincial authorities should promote the establishment of cross-regional innovation consortia, interprovincial knowledge-sharing platforms, and open-access green patent databases.
These collaborative mechanisms can help bridge the technological divide between innovation-leading regions and carbon-intensive provinces such as Shaanxi, Henan, and Inner Mongolia, As proposed in the “Decision of the CPC Central Committee on Further Comprehensively Deepening Reform and Promoting Chinese-style Modernization”, this may improve the regional integrated development mechanism and build a new mechanism for cross-administrative region cooperation and development.
In addition, financial incentives—such as green subsidies, innovation vouchers, and performance-based tax relief—should be designed to encourage firms in high-emission areas to adopt low-carbon technologies developed in advanced regions. This multi-tiered approach would accelerate the spatial diffusion of green innovation and promote convergence in regional emission intensity.
(2) For provinces with high carbon emissions, strengthen industrial structure optimization and talent introduction. Second, provinces identified as structural cores in the carbon emission transmission network—those with high degree closeness and betweenness centrality—should be prioritized as leverage points in national carbon mitigation strategies. Regions such as Shaanxi, Henan, and Hubei, given their strategic positions in the interprovincial emission flow, exert disproportionate influence over the spatial propagation of carbon emissions.
The “Henan Province Pollution Reduction and Carbon Reduction Synergy Efficiency Action Plan” clearly points out that the industrial sector should be coordinated to promote pollution reduction and carbon reduction. In accordance with the national industrial structure adjustment guidance catalog and relevant industrial policies, the backward production capacity should be resolutely eliminated. The Shaanxi Provincial People’s Government’s notice on issuing the Carbon Peak Implementation Plan also pointed out that it is necessary to improve the mechanism for cultivating carbon peak scientific and technological talents, stimulate the innovative vitality of talents, and carry out joint research and talent training on green and low-carbon key technologies.
Targeted interventions in these provinces can thus generate cascading benefits for surrounding regions. Policy actions should include the following: (1) industrial upgrading with a focus on green manufacturing and low-carbon supply chains; (2) the creation of innovation zones dedicated to clean energy development; and (3) human capital enhancement programs to attract and retain talent in environmental engineering, digital energy systems, and green finance. Moreover, region-specific green investment funds, co-financed by central and local governments, could offer tailored financing solutions to support industrial transformation in these high-impact provinces.
(3) Low-carbon emission provinces (Xinjiang and Tibet) should play the role of ecological barriers and strengthen the low-carbon development model. Third, low-emission provinces such as Tibet, Xinjiang, Qinghai, and Hainan should be safeguarded as ecological frontier zones within the national carbon governance framework. These regions, characterized by relatively low economic density and fragile ecosystems, are susceptible to irreversible environmental degradation if the development pathways mirror those of resource-dependent provinces. The 2024 Autonomous Region National Economic and Social Development Plan points out that we should accelerate the green transformation of development mode and give full play to the advantages of clean energy such as green electricity. We should promote the development of tourism and service industries, enhance the radiation capacity of low-carbon development and industrial agglomeration, and strengthen cooperation with Xinjiang and neighboring provinces and regions.
Policymakers should adopt a precautionary approach by instituting ecological red lines, limiting carbon-intensive infrastructure, and enforcing strict environmental impact assessments for major development projects. Furthermore, these provinces hold substantial potential for renewable energy deployment—particularly solar and wind power—which could not only meet local energy demand sustainably but also supply clean electricity to more industrialized regions through interprovincial transmission lines. Supporting the growth of green tourism, ecological agriculture, and nature-based industries can also diversify local economies while preserving environmental integrity.
(4) Promote inter-regional cooperation on carbon emission reduction and establish a cross-regional carbon trading market. Fourth, the establishment of a unified, flexible, and transparent national carbon trading system is imperative for internalizing spatial emission externalities. This study’s findings on interprovincial spillovers suggest that regionally isolated emission reduction targets may be inefficient or counterproductive in the presence of strong spatial dependencies. Therefore, a market-oriented mechanism that allows for the inter-regional exchange of carbon allowances should be institutionalized. The “Interim Regulations on Carbon Emission Trading Management” can force the connection between the mandatory carbon market and the voluntary carbon market, better form policy synergy, further stimulate the momentum of green and low-carbon innovation, guide all sectors of society to jointly participate in carbon reduction, and promote the implementation of the national dual carbon goals.
Such a system would enable regions with low marginal abatement costs to sell surplus quotas to provinces facing higher reduction costs, thereby minimizing overall mitigation expenses. To enhance its effectiveness, the carbon market must be complemented by a robust Monitoring, Reporting, and Verification (MRV) framework, standardized trading rules, and real-time emissions data disclosure. Policymakers should also consider establishing “carbon linkages”—cross-regional partnerships that integrate emission reduction goals with joint R&D programs and shared investment in clean infrastructure—to deepen coordination between economically diverse regions.

5.3. Future Research Directions and Limitations

Although the current study provides robust empirical evidence of spatial spillover and network effects, several limitations present opportunities for future research. First, the static nature of the spatial econometric model limits the analysis of dynamic feedback loops between policy interventions and behavioral responses over time. Future work could apply system dynamics modeling or agent-based simulations to capture nonlinear adaptation processes, institutional learning, and the co-evolution of socio-technical systems. Second, this study does not explicitly consider sectoral heterogeneity—such as differences in industrial structure, energy mix, or regulatory enforcement—which may affect the transmission and mitigation of carbon emissions. Incorporating multi-sectoral input-output models or spatial computable general equilibrium (CGE) models could yield more granular policy insights. Third, institutional and governance factors—such as regional environmental policy stringency, fiscal decentralization, and administrative capacity—may mediate the strength and direction of spillover effects. Finally, extending this framework to international comparative settings could reveal how different institutional regimes and development stages shape spatial patterns of carbon emissions, offering valuable lessons for transnational carbon governance.

Author Contributions

Conceptualization, S.-D.P. and Y.-C.L.; methodology, Y.-C.L. and Y.-Y.W.; software, Y.-C.L.; validation, Y.-Y.W.; formal analysis, Y.-C.L. and Y.-Y.W.; investigation, S.-D.P.; data curation, Y.-C.L. and Y.-Y.W.; writing— original draft preparation, Y.-C.L. and Y.-Y.W.; writing—review and editing, S.-D.P.; visualization, Y.-C.L.; supervision, S.-D.P. All authors have read and agreed to the published version of the manuscript.

Funding

This research received no external funding.

Data Availability Statement

The data presented in this study are available on request from the corresponding author.

Conflicts of Interest

The authors declare no conflict of interest.

References

  1. Liu, Y.; Liu, S.; Shao, X.; He, Y. Policy spillover effect and action mechanism for environmental rights trading on green innovation: Evidence from China’s carbon emissions trading policy. Renew. Sustain. Energy Rev. 2022, 153, 111779. [Google Scholar] [CrossRef]
  2. Sun, H.; Edziah, B.K.; Sun, C.; Kporsu, A.K. Institutional quality, green innovation and energy efficiency. Energy Policy 2019, 135, 111002. [Google Scholar] [CrossRef]
  3. Liu, M.; Li, Y. Environmental regulation and green innovation: Evidence from China’s carbon emissions trading policy. Financ. Res. Lett. 2022, 48, 103051. [Google Scholar] [CrossRef]
  4. Yu, Z.; Khan, S.A.R.; Ponce, P.; de Sousa Jabbour, A.B.L.; Jabbour, C.J.C. Factors affecting carbon emissions in emerging economies in the context of a green recovery: Implications for sustainable development goals. Technol. Forecast. Soc. Change 2022, 176, 121417. [Google Scholar] [CrossRef]
  5. Zhou, K.; Yang, J.; Yang, T.; Ding, T. Spatial and temporal evolution characteristics and spillover effects of China’s regional carbon emissions. J. Environ. Manag. 2023, 325, 116423. [Google Scholar] [CrossRef]
  6. Semieniuk, G.; Campiglio, E.; Mercure, J.F.; Volz, U.; Edwards, N.R. Low-carbon transition risks for finance. Wiley Interdiscip. Rev. Clim. Change 2021, 12, e678. [Google Scholar] [CrossRef]
  7. Hanna, R.; Heptonstall, P.; Gross, R. Job creation in a low carbon transition to renewables and energy efficiency: A review of international evidence. Sustain. Sci. 2024, 19, 125–150. [Google Scholar] [CrossRef]
  8. Daumas, L. Financial stability, stranded assets and the low-carbon transition—A critical review of the theoretical and applied literatures. J. Econ. Surv. 2024, 38, 601–716. [Google Scholar] [CrossRef]
  9. Huang, C.; Gan, X.; Wan, Y.; Jin, L.; Teng, J.; Li, Z. China contributed to low-carbon development: Carbon emission increased but carbon intensity decreased. Front. Ecol. Evol. 2024, 12, 1338742. [Google Scholar] [CrossRef]
  10. Zhan, J.; Wang, C.; Wang, H.; Zhang, F.; Li, Z. Pathways to achieve carbon emission peak and carbon neutrality by 2060: A case study in the Beijing-Tianjin-Hebei region, China. Renew. Sustain. Energy Rev. 2024, 189, 113955. [Google Scholar] [CrossRef]
  11. Zhang, F.; Deng, X.; Phillips, F.; Fang, C.; Wang, C. Impacts of industrial structure and technical progress on carbon emission intensity: Evidence from 281 cities in China. Technol. Forecast. Soc. Change 2020, 154, 119949. [Google Scholar] [CrossRef]
  12. Zhou, X.; Ji, J. A multi-objective optimization approach for interprovincial carbon emission reduction in China: Considering industrial structure and ownership attributes. J. Environ. Manag. 2025, 373, 123646. [Google Scholar] [CrossRef] [PubMed]
  13. Ma, R.; Bu, S. Evaluation and mitigation of carbon emissions in energy industry. Renew. Sustain. Energy Rev. 2025, 212, 115329. [Google Scholar] [CrossRef]
  14. Xuan, D.; Ma, X.; Shang, Y. Can China’s policy of carbon emission trading promote carbon emission reduction? J. Clean. Prod. 2020, 270, 122383. [Google Scholar] [CrossRef]
  15. Gao, J.; Hua, G.; Huo, B. Turning “green” into “gold”: A study on the impact of green finance pilot zone policy on energy carbon emission efficiency. Sustain. Dev. 2025, 33, 129–143. [Google Scholar] [CrossRef]
  16. Li, Z.Z.; Li, R.Y.M.; Malik, M.Y.; Murshed, M.; Khan, Z.; Umar, M. Determinants of carbon emission in China: How good is green investment? Sustain. Prod. Consum. 2021, 27, 392–401. [Google Scholar] [CrossRef]
  17. Xiao, J.; Chen, S.; Han, J.; Tan, Z.; Mu, S.; Jiayi, W. The carbon emission reduction effect of renewable resource utilization: From the perspective of green innovation. Atmos. Pollut. Res. 2024, 15, 102121. [Google Scholar] [CrossRef]
  18. He, M.; Sun, Y.; Han, B. Green carbon science: Efficient carbon resource processing, utilization, and recycling towards carbon neutrality. Angew. Chem. 2022, 134, e202112835. [Google Scholar] [CrossRef]
  19. Wang, J.; Xue, Y.; Han, M. Impact of carbon emission price and natural resources development on the green economic recovery: Fresh insights from China. Resour. Policy 2023, 81, 103255. [Google Scholar] [CrossRef]
  20. Chen, Q.; Tsai, S.-B.; Zhai, Y.; Zhou, J.; Yu, J.; Chang, L.-C.; Li, G.; Zheng, Y.; Wang, J. An empirical study on low-carbon: Human capital performance evaluation. Int. J. Environ. Res. Public Health 2018, 15, 62. [Google Scholar] [CrossRef]
  21. Faeni, D.P.; Oktaviani, R.F.; Riyadh, H.A.; Faeni, R.P.; Beshr, B.A.H. Green Human Resource Management (GHRM) and Corporate Social Responsibility (CSR) in Reducing Carbon Emissions for Sustainable Practices. Environ. Qual. Manag. 2025, 34, e70048. [Google Scholar] [CrossRef]
  22. Lee, J.; Kim, S.; Kim, E. Voluntary disclosure of carbon emissions and sustainable existence of firms: With a focus on human capital of internal control system. Sustainability 2021, 13, 9955. [Google Scholar] [CrossRef]
  23. Andhella, S.; Djajadikerta, H.; Marjuka, M.Y. Behavioral Change Supporting Human Resource Management for Achieving Carbon Emission Reduction. Qual.-Access Success 2024, 25, 237. [Google Scholar]
  24. Xu, L.; Fan, M.; Yang, L.; Shao, S. Heterogeneous green innovations and carbon emission performance: Evidence at China’s city level. Energy Econ. 2021, 99, 105269. [Google Scholar] [CrossRef]
  25. Schiederig, T.; Tietze, F.; Herstatt, C. Green innovation in technology and innovation management—An exploratory literature review. R&D Manag. 2012, 42, 180–192. [Google Scholar]
  26. Zhao, Z.; Zhao, Y.; Shi, X.; Zheng, L.; Fan, S.; Zuo, S. Green innovation and carbon emission performance: The role of digital economy. Energy Policy 2024, 195, 114344. [Google Scholar] [CrossRef]
  27. Liu, Z.; Deng, Z.; He, G.; Wang, H.; Zhang, X.; Lin, J.; Qi, Y.; Liang, X. Challenges and opportunities for carbon neutrality in China. Nat. Rev. Earth Environ. 2022, 3, 141–155. [Google Scholar] [CrossRef]
  28. da Silva, L.B.P.; Soltovski, R.; Pontes, J.; Treinta, F.T.; Leitão, P.; Mosconi, E.; de Resende, L.M.M.; Yoshino, R.T. Human capital management 4.0: Literature review and trends. Comput. Ind. Eng. 2022, 168, 108111. [Google Scholar] [CrossRef]
  29. Sakarina, S.; Ena, Z.; Jenita; Cakranegara, P.A.; Surahman, S. Digital transformation in human resource management in the industrial age 4.0. Quant. Econ. Manag. Stud. 2022, 3, 750–756. [Google Scholar] [CrossRef]
  30. Zhou, X.; Niu, A.; Lin, C. Optimizing carbon emission forecast for modelling China’s 2030 provincial carbon emission quota allocation. J. Environ. Manag. 2023, 325, 116523. [Google Scholar] [CrossRef]
  31. Niu, X.; Ma, Z.; Ma, W.; Yang, J.; Mao, T. The spatial spillover effects and equity of carbon emissions of digital economy in China. J. Clean. Prod. 2024, 434, 139885. [Google Scholar] [CrossRef]
  32. Wang, Y.; Zhao, T.; Wang, J.; Guo, F.; Kan, X.; Yuan, R. Spatial analysis on carbon emission abatement capacity at provincial level in China from 1997 to 2014: An empirical study based on SDM model. Atmos. Pollut. Res. 2019, 10, 97–104. [Google Scholar] [CrossRef]
  33. Lv, K.; Feng, X.; Kelly, S.; Zhu, L.; Deng, M. A study on embodied carbon transfer at the provincial level of China from a social network perspective. J. Clean. Prod. 2019, 225, 1089–1104. [Google Scholar] [CrossRef]
  34. Wang, F.; Gao, M.; Liu, J.; Fan, W. The spatial network structure of China’s regional carbon emissions and its network effect. Energies 2018, 11, 2706. [Google Scholar] [CrossRef]
  35. Sun, L.; Qin, L.; Taghizadeh-Hesary, F.; Zhang, J.; Mohsin, M.; Chaudhry, I.S. Analyzing carbon emission transfer network structure among provinces in China: New evidence from social network analysis. Environ. Sci. Pollut. Res. 2020, 27, 23281–23300. [Google Scholar] [CrossRef] [PubMed]
  36. Yin, Z.; Jin, X. Recent advances in the relationship between economic development and carbon emissions. Manag. Environ. Qual. Int. J. 2022, 33, 141–165. [Google Scholar] [CrossRef]
  37. Zhu, B.; Zhang, T. The impact of cross-region industrial structure optimization on economy, carbon emissions and energy consumption: A case of the Yangtze River Delta. Sci. Total Environ. 2021, 778, 146089. [Google Scholar] [CrossRef]
  38. Qiao, R.; Liu, X.; Gao, S.; Liang, D.; GesangYangji, G.; Xia, L.; Zhou, S.; Ao, X.; Jiang, Q.; Wu, Z. Industrialization, urbanization, and innovation: Nonlinear drivers of carbon emissions in Chinese cities. Appl. Energy 2024, 358, 122598. [Google Scholar] [CrossRef]
  39. Pickson, R.B.; Gui, P.; Jian, L.; Boateng, E. Do population-related factors matter for carbon emissions? Lessons from different income groups of countries. Urban Clim. 2024, 55, 101934. [Google Scholar] [CrossRef]
  40. Liu, Y.; Zhang, X.; Shen, Y. Technology-driven carbon reduction: Analyzing the impact of digital technology on China’s carbon emission and its mechanism. Technol. Forecast. Soc. Change 2024, 200, 123124. [Google Scholar] [CrossRef]
  41. Li, J.; Wang, P.; Ma, S. The impact of different transportation infrastructures on urban carbon emissions: Evidence from China. Energy 2024, 295, 131041. [Google Scholar] [CrossRef]
  42. Cao, Y.; Ren, W.; Yue, L. Environmental regulation and carbon emissions: New mechanisms in game theory. Cities 2024, 149, 104945. [Google Scholar] [CrossRef]
  43. Xie, Z.; Teng, X.; Liu, F.-P.; Chiu, Y.-H. The impact of China’s financial expenditure on energy and carbon emission efficiency: Applying a meta-dynamic non-radial directional distance function. Energy Environ. 2023, 34, 155–175. [Google Scholar] [CrossRef]
  44. Jiang, S.; Chishti, M.Z.; Rjoub, H.; Rahim, S. Environmental R&D and trade-adjusted carbon emissions: Evaluating the role of international trade. Environ. Sci. Pollut. Res. 2022, 29, 63155–63170. [Google Scholar]
  45. Dong, K.; Wang, S.; Hu, H.; Guan, N.; Shi, X.; Song, Y. Financial development, carbon dioxide emissions, and sustainable development. Sustain. Dev. 2024, 32, 348–366. [Google Scholar] [CrossRef]
  46. Xiao, B.; Fan, Y.; Guo, X.; Voigt, S.; Cui, L. Effects of linking national carbon markets on international macroeconomics: An open-economy E-DSGE model. Comput. Ind. Eng. 2022, 169, 108166. [Google Scholar] [CrossRef]
  47. Wang, T.; Shen, B.; Springer, C.H.; Hou, J. What prevents us from taking low-carbon actions? A comprehensive review of influencing factors affecting low-carbon behaviors. Energy Res. Soc. Sci. 2021, 71, 101844. [Google Scholar] [CrossRef]
  48. Raihan, A. Toward sustainable and green development in Chile: Dynamic influences of carbon emission reduction variables. Innov. Green Dev. 2023, 2, 100038. [Google Scholar] [CrossRef]
  49. Chang, H.; Ding, Q.; Zhao, W.; Hou, N.; Liu, W. The digital economy, industrial structure upgrading, and carbon emission intensity—Empirical evidence from China’s provinces. Energy Strategy Rev. 2023, 50, 101218. [Google Scholar] [CrossRef]
  50. Pachiyappan, D.; Ansari, Y.; Alam, S.; Thoudam, P.; Alagirisamy, K.; Manigandan, P. Short and long-run causal effects of CO2 emissions, energy use, GDP and population growth: Evidence from India using the ARDL and VECM approaches. Energies 2021, 14, 8333. [Google Scholar] [CrossRef]
  51. Jiang, Y.; Khan, H. The relationship between renewable energy consumption, technological innovations, and carbon dioxide emission: Evidence from two-step system GMM. Environ. Sci. Pollut. Res. 2023, 30, 4187–4202. [Google Scholar] [CrossRef]
  52. Wang, T.; Song, Z.; Zhou, J.; Sun, H.; Liu, F. Low-carbon transition and green innovation: Evidence from pilot cities in China. Sustainability 2022, 14, 7264. [Google Scholar] [CrossRef]
  53. Nitza-Makowska, A.; Longhurst, K.; Skiert-Andrzejuk, K. Green Soft Power? Checking in on China as a Responsible Stakeholder. Pol. Political Sci. Yearb. 2024, 1, 17–33. [Google Scholar] [CrossRef]
  54. Cai, A.; Zheng, S.; Cai, L.; Yang, H.; Comite, U. How does green technology innovation affect carbon emissions? A spatial econometric analysis of China’s provincial panel data. Front. Environ. Sci. 2021, 9, 813811. [Google Scholar] [CrossRef]
  55. Lin, X.; Zhao, Y.; Ahmad, M.; Ahmed, Z.; Rjoub, H.; Adebayo, T.S. Linking innovative human capital, economic growth, and CO2 emissions: An empirical study based on Chinese provincial panel data. Int. J. Environ. Res. Public Health 2021, 18, 8503. [Google Scholar] [CrossRef] [PubMed]
  56. Hu, P.; Zhou, K.; Zhang, H.; Ma, Z.; Li, J. The cause and correlation network of air pollution from a spatial perspective: Evidence from the Beijing–Tianjin–Hebei region. Sustainability 2023, 15, 3626. [Google Scholar] [CrossRef]
  57. Grossman, G.M.; Krueger, A.B. Environmental Impacts of a North American Free Trade Agreement; National Bureau of Economic Research: Cambridge, MA, USA, 1991. [Google Scholar]
  58. Yang, H.C.; Feng, G.F.; Gong, Q.; Chang, C.P. The impact of political competition on green innovation: A new insight into sustainable development. Sustain. Dev. 2023, 31, 3692–3708. [Google Scholar] [CrossRef]
  59. Li, C.; Solangi, Y.A.; Ali, S. Evaluating the factors of green finance to achieve carbon peak and carbon neutrality targets in China: A delphi and fuzzy AHP approach. Sustainability 2023, 15, 2721. [Google Scholar] [CrossRef]
  60. He, X.; Xu, C. Is policy uncertainty always harmful?-Empirical evidence from China’s energy policy and city green transition. Energy 2024, 291, 130204. [Google Scholar] [CrossRef]
  61. Wang, J.; Luo, X.; Zhu, J. Does the digital economy contribute to carbon emissions reduction? A city-level spatial analysis in China. Chin. J. Popul. Resour. Environ. 2022, 20, 105–114. [Google Scholar] [CrossRef]
  62. Goodland, R. The concept of environmental sustainability. Annu. Rev. Ecol. Syst. 1995, 26, 1–24. [Google Scholar] [CrossRef]
  63. Shan, H.; Shao, S. Impact of green innovation on carbon reduction in China. Sci. Rep. 2024, 14, 14032. [Google Scholar] [CrossRef] [PubMed]
  64. Xie, P.; Jamaani, F. Does green innovation, energy productivity and environmental taxes limit carbon emissions in developed economies: Implications for sustainable development. Struct. Change Econ. Dyn. 2022, 63, 66–78. [Google Scholar] [CrossRef]
  65. Sun, Z.; Liu, Y.; Yu, Y. China’s carbon emission peak pre-2030: Exploring multi-scenario optimal low-carbon behaviors for China’s regions. J. Clean. Prod. 2019, 231, 963–979. [Google Scholar] [CrossRef]
  66. Kong, T.; Feng, T.; Ye, C. Advanced manufacturing technologies and green innovation: The role of internal environmental collaboration. Sustainability 2016, 8, 1056. [Google Scholar] [CrossRef]
  67. Chen, P.C.; Hung, S.W. Collaborative green innovation in emerging countries: A social capital perspective. Int. J. Oper. Prod. Manag. 2014, 34, 347–363. [Google Scholar] [CrossRef]
  68. Jiao, H.; Deng, H.; Hu, S. The Power of Collaboration: How Does Green Innovation Network Affect Urban Green Total Factor Productivity? Sustainability 2025, 17, 433. [Google Scholar] [CrossRef]
  69. Bai, D.; Li, M.; Wang, Y.; Mallek, S.; Shahzad, U. Impact mechanisms and spatial and temporal evolution of digital economy and green innovation: A perspective based on regional collaboration within urban agglomerations. Technol. Forecast. Soc. Change 2024, 207, 123613. [Google Scholar] [CrossRef]
  70. Castro, G.M.D.; Delgado-Verde, M.; Amores-Salvadó, J.; Navas-López, J.E. Linking human, technological, and relational assets to technological innovation: Exploring a new approach. Knowl. Manag. Res. Pract. 2013, 11, 123–132. [Google Scholar] [CrossRef]
  71. Ramadhani, W.; Khuzaini, K.; Shaddiq, S. Resistance to Change: Human capital Issues in the Implementation of Industry 4.0 Technology. In ATD; Islamic University of Kalimantan: South Kalimantan, Indonesia, 2024. [Google Scholar] [CrossRef]
  72. Maria, N.; Susan, M. Transformative Human capital: Mapping Future Directions for Innovation in Information Technology and Multidisciplinary Applications. In Proceedings of the 2024 2nd International Conference on Technology Innovation and Its Applications (ICTIIA), Medan, Indonesia, 12–13 September 2024; IEEE: Piscataway, NJ, USA, 2024; pp. 1–6. [Google Scholar]
  73. Aftab, J.; Abid, N.; Cucari, N.; Savastano, M. Green human resource management and environmental performance: The role of green innovation and environmental strategy in a developing country. Bus. Strategy Environ. 2023, 32, 1782–1798. [Google Scholar] [CrossRef]
  74. Adikari, A.P.; Liu, H.; Dissanayake, D.M.S.L.B.; Ranagalage, M. Human capital and carbon emissions: The way forward reducing environmental degradation. Sustainability 2023, 15, 2926. [Google Scholar] [CrossRef]
  75. Huang, C.; Zhang, X.; Liu, K. Effects of human capital structural evolution on carbon emissions intensity in China: A dual perspective of spatial heterogeneity and nonlinear linkages. Renew. Sustain. Energy Rev. 2021, 135, 110258. [Google Scholar] [CrossRef]
  76. Li, Y.; Wang, H. Environmental, Social and Governance Performance on Brand Value in the Context of “Dual Carbon”: The Mediating Effect of R&D Innovation. Sustainability 2024, 16, 10046. [Google Scholar] [CrossRef]
  77. Abbas, S.; Saqib, N.; Mohammed, K.S.; Sahore, N.; Shahzad, U. Pathways towards carbon neutrality in low carbon cities: The role of green patents, R&D and energy use for carbon emissions. Technol. Forecast. Soc. Change 2024, 200, 123109. [Google Scholar]
  78. Gu, G.; Wang, Z.; Wu, L. Carbon emission reductions under global low-carbon technology transfer and its policy mix with R&D improvement. Energy 2021, 216, 119300. [Google Scholar]
  79. Chen, H.; Zhu, S.; Sun, J.; Zhong, K.; Shen, M.; Wang, X. A study of the spatial structure and regional interaction of agricultural green total factor productivity in China based on SNA and VAR methods. Sustainability 2022, 14, 7508. [Google Scholar] [CrossRef]
  80. Di, K.; Liu, Z.; Chai, S.; Li, K.; Li, Y. Spatial correlation network structure of green innovation efficiency and its driving factors in the Bohai Rim region. Environ. Dev. Sustain. 2024, 26, 27227–27247. [Google Scholar] [CrossRef]
  81. Bai, R.; Lin, B. An in-depth analysis of green innovation efficiency: New evidence based on club convergence and spatial correlation network. Energy Econ. 2024, 132, 107424. [Google Scholar] [CrossRef]
  82. Xiao, J.; Guo, M.; Zhang, M.; Liu, Q.; Du, Y.; Zhang, L. A comparative analysis of Chinese green building policies from the central and local perspectives using LDA and SNA. Archit. Eng. Des. Manag. 2024, 20, 1037–1059. [Google Scholar] [CrossRef]
  83. Hewa Welege, N.M.; Pan, W.; Kumaraswamy, M. Social network analysis applications in sustainable construction and built environment management: A review. Built Environ. Proj. Asset Manag. 2021, 11, 511–528. [Google Scholar] [CrossRef]
  84. Yu, K.; Li, Z. Coupling coordination and spatial network characteristics of carbon emission efficiency and urban green innovation in the Yellow River Basin, China. Sci. Rep. 2024, 14, 27690. [Google Scholar] [CrossRef] [PubMed]
  85. Zhuang, H.; Lin, H.; Zhong, K. Spatial spillover effects and driving factors of regional green innovation efficiency in China from a network perspective. Front. Environ. Sci. 2022, 10, 997084. [Google Scholar] [CrossRef]
  86. Li, H.Y.; Liu, Q.; Ye, H.Z. Digital development influencing mechanism on green innovation performance: A perspective of green innovation network. IEEE Access 2023, 11, 22490–22504. [Google Scholar] [CrossRef]
  87. Wang, G.; Deng, X.; Wang, J.; Zhang, F.; Liang, S. Carbon emission efficiency in China: A spatial panel data analysis. China Econ. Rev. 2019, 56, 101313. [Google Scholar] [CrossRef]
  88. Yang, Y.; Zhou, Y.; Poon, J.; He, Z. China’s carbon dioxide emission and driving factors: A spatial analysis. J. Clean. Prod. 2019, 211, 640–651. [Google Scholar] [CrossRef]
  89. Moran, P.A.P. Notes on continuous stochastic phenomena. Biometrika 1950, 37, 17–23. [Google Scholar] [CrossRef]
  90. Wei, C.; Ni, J.; Du, L. Regional allocation of carbon dioxide abatement in China. China Econ. Rev. 2012, 23, 552–565. [Google Scholar] [CrossRef]
  91. Cherniwchan; Jevan; Najjar, N. Free trade and the formation of environmental policy: Evidence from US legislative votes. Am. Econ. J. Econ. Policy 2025, 17, 224–258. [Google Scholar] [CrossRef]
  92. Hufbauer, G.C.; Hogan, M. The birth of NAFTA in a neoliberal moment. In The Elgar Companion to North American Trade and Integration; Edward Elgar Publishing: Cheltenham, UK, 2025; pp. 15–24. [Google Scholar]
  93. Janssens-Maenhout, G.; Crippa, M.; Guizzardi, D.; Muntean, M.; Schaaf, E.; Dentener, F.; Bergamaschi, P.; Pagliari, V.; Olivier, J.G.; Peters, J.A.; et al. EDGAR v4.3.2 Global Atlas of the three major Greenhouse Gas Emissions for the period 1970–2012. Earth Syst. Sci. Data 2019, 11, 959–1002. [Google Scholar] [CrossRef]
  94. Lu, B. Expedited patent examination for green inventions: Developing countries’ policy choices. Energy Policy 2013, 61, 1529–1538. [Google Scholar] [CrossRef]
  95. Guo, Y.; Xia, X.; Zhang, S.; Zhang, D. Environmental regulation, government R&D funding and green technology innovation: Evidence from China provincial data. Sustainability 2018, 10, 940. [Google Scholar] [CrossRef]
  96. Wuttaphan, N. Human capital theory: The theory of human resource development, implications, and future. Life Sci. Environ. J. 2017, 18, 240–253. [Google Scholar]
  97. Chaolin, G.U.; Liya, W.U.; Cook, I. Progress in research on Chinese urbanization. Front. Archit. Res. 2012, 1, 101–149. [Google Scholar] [CrossRef]
  98. Bai, S.; Zhang, B.; Ning, Y.; Wang, Y. Comprehensive analysis of carbon emissions, economic growth, and employment from the perspective of industrial restructuring: A case study of China. Environ. Sci. Pollut. Res. 2021, 28, 50767–50789. [Google Scholar] [CrossRef]
  99. Wang, Q.; Wang, L. How does trade openness impact carbon intensity? J. Clean. Prod. 2021, 295, 126370. [Google Scholar] [CrossRef]
  100. Sun, A.; He, Q.; Xiao, C.; Hua, Y.; Zhang, J. The spatial spillover effects of regional integration on carbon emissions. Int. Rev. Econ. Financ. 2024, 95, 103447. [Google Scholar] [CrossRef]
  101. Zhang, Z.; Wang, F.; Shen, L.; Xie, Q. Multiscale time-lagged correlation networks for detecting air pollution interaction. Phys. A Stat. Mech. Its Applications 2022, 602, 127627. [Google Scholar] [CrossRef]
Figure 1. Spatial distribution characteristics of carbon emission intensity in 31 provinces of China.
Systems 13 00410 g001
Figure 2. Carbon emission correlation network of 31 sample provinces in 2000.
Systems 13 00410 g002
Figure 3. Carbon emission correlation network of 31 sample provinces in 2009.
Systems 13 00410 g003
Figure 4. Carbon emission correlation network of 31 sample provinces in 2015.
Systems 13 00410 g004
Figure 5. Carbon emission correlation network of 31 sample provinces in 2022.
Systems 13 00410 g005
Table 1. Descriptive statistics of main variables.
VariableObsMeanStd. Dev.MinMax
open7130.2970.3530.0081.711
lnCO271318.8981.12414.88320.887
lnedu71315.3321.15011.30918.041
lngreen7136.0362.1470.00010.722
lngreen_r7136.5182.1320.00010.933
lnRD71313.8031.8727.60417.602
urb7130.5150.16200.1400.900
HC7130.0160.0080.0020.044
work7130.5390.0540.3640.723
Table 2. Global Moran’s I index.
YearIE (I)Sd (I)Zp-Value
20000.281−0.0330.1152.7300.006
20010.291−0.0330.1152.8150.005
20020.303−0.0330.1152.9340.003
20030.297−0.0330.1132.9240.004
20040.299−0.0330.1142.9290.003
20050.312−0.0330.1153.0080.003
20060.317−0.0330.1153.0560.002
20070.326−0.0330.1153.1160.002
20080.346−0.0330.1163.2800.001
20090.350−0.0330.1163.3110.001
20100.348−0.0330.1163.2840.001
20110.337−0.0330.1173.1820.002
20120.340−0.0330.1173.2020.001
20130.338−0.0330.1163.1910.001
20140.338−0.0330.1163.1920.001
20150.344−0.0330.1163.2530.001
20160.336−0.0330.1163.1960.001
20170.336−0.0330.1163.1980.001
20180.342−0.0330.1163.2440.001
20190.344−0.0330.1163.2610.001
20200.335−0.0330.1163.1850.001
20210.331−0.0330.1163.1320.002
20220.331−0.0330.1173.1210.002
Table 3. U-test results.
Lower BoundUpper Bound
Interval0.00010.722
Slope0.051−0.0256
t-value4.165−1.585
p > |t|0.0000.057
Extreme point = 7.163
t-value = 1.590
p > |t| = 0.057
Table 4. LM, Wald, and LR tests.
StatisticValuep-ValueStatisticValuep-Value
LM-spatial lag75.2200.000Wald-spatial lag162.790.000
Robust LM-spatial lag68.4860.000Wald-spatial error146.460.000
LM-spatial error35.0080.000LR-spatial lag146.500.000
Robust LM-spatial error28.2740.000LR-spatial error132.900.000
LR test (spatial-fixed effects)126.660.000LR test (time-fixed effects)2730.690.000
Table 5. Regression results of SDM.
VariableslnCO2VariableslnCO2
lngreen0.042 ***
(0.011)
Wx: lngreen0.057 ***
(0.021)
(lngreen)2−0.003 ***
(0.001)
Wx: (lngreen)2−0.002 *
(0.001)
lnRD0.108 ***
(0.015)
Wx: lnRD−0.104 ***
(0.030)
HC6.702 ***
(1.411)
Wx: HC−16.918 ***
(2.916)
urb−0.069
(0.048)
Wx: urb0.242 **
(0.107)
work0.065
(0.093)
Wx: work−1.052 ***
(0.197)
open−0.051
(0.032)
Wx: open0.273 ***
(0.050)
ρ 0.277 ***
R2 0.241
Note: The symbols ***, **, and * indicate significance at the 1%, 5%, and 10% levels, respectively.
Table 6. Results on direct, indirect, and total effects.
VariablesDirect EffectIndirect EffectTotal Effect
lngreen0.047 ***
(0.011)
0.089 ***
(0.026)
0.137 ***
(0.028)
(lngreen)2−0.004 ***
(0.001)
−0.004 **
(0.002)
−0.008 ***
(0.002)
lnRD0.105 ***
(0.014)
−0.098 **
(0.040)
0.007 *
(0.044)
HC5.594 ***
(1.333)
−19.915 ***
(4.003)
−14.321 ***
(4.331)
urb−0.052
(0.049)
0.297 **
(0.151)
0.245
(0.178)
work−0.005
(0.096)
−1.362 ***
(0.269)
−1.367 ***
(0.322)
open−0.033
(0.033)
0.347 ***
(0.066)
0.314 ***
(0.077)
Note: The symbols ***, **, and * indicate significance at the 1%, 5%, and 10% levels, respectively.
Table 7. Results of robust test.
VariableslnCO2VariableslnCO2
lngreen_r0.054 ***
(0.012)
Wx: lngreen_r0.065 ***
(0.022)
(lngreen_r)2−0.003 ***
(0.001)
Wx: (lngreen_r)2−0.002 *
(0.001)
lnRD0.103 ***
(0.015)
Wx: lnRD−0.115 ***
(0.030)
HC6.862 ***
(1.405)
Wx: HC−15.825 ***
(2.911)
urb−0.070
(0.047)
Wx: urb0.228 **
(0.103)
work0.085
(0.092)
Wx: work−1.010 ***
(0.195)
open−0.053 *
(0.032)
Wx: open0.266 ***
(0.049)
ρ 0.273 ***
R2 0.269
VariablesDirect EffectIndirect EffectTotal Effect
lngreen_r0.060 ***
(0.012)
0.137 ***
(0.027)
0.164 ***
(0.029)
(lngreen_r)2−0.004 ***
(0.001)
−0.003 **
(0.002)
−0.007 ***
(0.002)
lnRD0.098 ***
(0.014)
−0.114 **
(0.039)
0.015
(0.044)
HC5.847 ***
(1.326)
−18.370 ***
(3.940)
−12.524 ***
(4.256)
urb−0.055
(0.048)
0.277 *
(0.146)
0.222
(0.172)
work0.020
(0.096)
−1.295 ***
(0.264)
−1.275 ***
(0.316)
open−0.036
(0.032)
0.335 ***
(0.063)
0.299 ***
(0.075)
Note: The symbols ***, **, and * indicate significance at the 1%, 5%, and 10% levels, respectively.
Table 8. Network density of CO2 concentration in the sampled 31 provinces.
YearDensityYearDensityYearDensityYearDensity
20000.20320060.20920120.21520180.223
20010.20020070.20820130.21620190.217
20020.20420080.21020140.21720200.223
20030.20020090.21020150.21620210.222
20040.20420100.21220160.22320220.220
20050.20220110.21520170.222
Table 9. Top five provinces of degree, closeness, and betweenness centrality results in 2000, 2009, 2015, and 2022.
Degree Centrality
year12345
2000ShaanxiHubeiShandongBeijingJiangsu
2009ShaanxiHubeiHenanShandongHunan
2015ShaanxiHenanHubeiHunanShandong
2022HenanShaanxiHunanJiangxiShanxi
Closeness Centrality
year12345
2000ShaanxiHubeiHunanShandongHenan
2009ShaanxiHubeiHenanHunanShandong
2015ShaanxiHenanHubeiHunanAnhui
2022HenanShaanxiHunanHubeiAnhui
Betweenness Centrality
year12345
2000ShaanxiBeijingHunanHubeiLiaoning
2009ShaanxiHunanHubeiShandongHenan
2015ShaanxiHunanHenanShandongHubei
2022HenanShaanxiHunanShandongShanxi
Table 10. Bottom five provinces of degree, closeness, and betweenness centrality results in 2000, 2009, 2015, and 2022.
Degree Centrality
year12345
2000TibetHainanQinghaiJilinHeilongjiang
2009TibetHainanJilinHeilongjiangQinghai
2015TibetJilinHeilongjiangXinjiangHainan
2022HeilongjiangJilinTibetLiaoningHainan
Closeness Centrality
year12345
2000TibetJilinHeilongjiangQinghaiXinjiang
2009TibetJilinHeilongjiangLiaoningXinjiang
2015TibetJilinHeilongjiangLiaoningXinjiang
2022HeilongjiangJilinLiaoningTibetXinjiang
Betweenness Centrality
year12345
2000TibetHainanQinghaiHeilongjiangXinjiang
2009JilinHainanQinghaiHeilongjiangXinjiang
2015TibetJilinHeilongjiangXinjiangQinghai
2022HeilongjiangXinjiangJilinHainanTibet
Disclaimer/Publisher’s Note: The statements, opinions and data contained in all publications are solely those of the individual author(s) and contributor(s) and not of MDPI and/or the editor(s). MDPI and/or the editor(s) disclaim responsibility for any injury to people or property resulting from any ideas, methods, instructions or products referred to in the content.

