Abstract
Under the growing threat of global warming, green bonds have become a pivotal financial instrument to deal with climate change and promote sustainable development. However, the research on the affecting factors of green bond issuance remains scarce in the existing literature, particularly regarding the external influencing factors. In order to study the impact of climate risks faced by enterprises on green bond issuance and its influence mechanism, this paper takes A-share listed companies issuing green bonds in China as samples from 1 January 2000 to 31 December 2022, adopting the Probit model to study how climate risk faced by enterprises influences green bond issuance. The key findings of the research are as follows: the climate risk positively enhances green bond issuance through green transformation and green innovation. In addition, ownership concentration positively moderates the relationship between climate risk and green bond issuance, while managerial overconfidence negatively moderates the relationship. The effect of climate risk on green bond issuance is greater for larger firms, labor-intensive firms and firms with better environmental performance. Moreover, our research enriches green bond issuance theory, further supports the signal theory of green bonds, and provides theoretical guidance for the development of green bonds in China and other emerging market countries.
1. Introduction
Climate change is having a profound impact on human life and the global economy. Under the threat of global warming, a number of countries signed the Paris Agreement, pledging to take joint actions to combat climate change, committing to controlling the global temperature rise. China signed the Paris Agreement and established clear carbon peaking and carbon neutrality goals, elevating sustainable development to a national strategic priority. This series of global and national policies provides clear guidance for companies to address climate change while simultaneously imposing heightened environmental responsibility requirements on businesses.
According to the definitions of climate risk by the researchers [1,2,3] and the Task Force on Climate-Related Financial Disclosure (TCFD) [4], there are two main components of climate risk for firms, including physical risk and transformation risk. The physical risk is the immediate impact of climate physical factors like climate warming, extreme weather and natural disasters on the production and business activities of companies, which may cause supply chain disruption, asset losses and profitability fluctuations. The second is the transformation risk, which is the potential challenges posed by changes in policy, technology and markets that enterprises face in the process of transformation to low carbon, such as excessive transformation costs, asset depreciation or failure of the transformation. The climate risk not only poses a threat to business operations and financial performance but also becomes a significant external factor affecting the enterprise’s sustainability.
Green bonds, as a green financing instrument that specifically serves environmental and climate-friendly projects, differ from conventional bonds in that the issuer commits to using the funds raised from green bonds for green projects or activities that mitigate climate change risks and promote sustainable development [5]. Driven by the Paris Agreement, the global green bond market has experienced rapid growth, and green bonds have become one of the important financial means to combat climate change. A series of studies have shown that after issuing green bonds, enterprises not only reduce carbon emissions [6] but also improve their environmental performance [7,8] and ESG performance [9]. Despite the growing importance of green bonds in combating climate change, theoretical studies on the factors influencing green bond issuance are still scattered and, in particular, lack a systematic exploration from the perspective of externalities (e.g., climate risk) [10]. Meanwhile, under the guidance of global carbon neutrality goals, China has emerged as a pivotal actor in worldwide carbon emissions. Since the implementation of the green bond policy in China in 2016, the green bond market in China has developed rapidly, and the scale of green bonds in China ranks among the top in the world [11]. However, China’s green bond policy has particularities. For example, it differs from other countries in aspects such as third-party certification and the scope of industries supported by green bonds [12]. Therefore, based on the huge issuance scale of China’s green bond market and the special policy background, research specifically targeting China’s green bond market is highly necessary.
Existing research on the determinants of green bond issuance has primarily focused on the impact of internal firm characteristics, such as corporate governance [13], eco-innovation [10], corporate brand reputation, ESG performance [14,15], etc. However, relatively few studies have examined external factors—particularly climate risks—which may exert significant influence on green financing decisions. Moreover, there is a lack of research exploring these external drivers in the Chinese context. The purpose of our study is to fill this gap by investigating how climate risk exposure affects green bond issuance by Chinese firms, as well as the underlying mechanisms. By comparing data of green bond issuers with ordinary bond issuers over the period from 1 January 2000 to 31 December 2022, we explore whether climate risk significantly affects green bond issuance and through what pathways climate risk affects this. This paper uses the Probit model to test whether climate risk affects green bond issuance and studies its influence mechanism from the two paths of green transformation and green innovation. This paper reveals the driving role of climate risk on corporate behaviors, analyzes the trade-off of enterprises in green financing decision-making, provides new perspectives for academia and offers references for policymakers and investors.
The contributions of this paper are reflected in the following aspects: Firstly, existing studies focus on the impact of corporate internal governance, financial characteristics or macro policies on green bond issuance, but rarely discuss the role of external environmental factors such as climate risk [10,13,14,15]. Based on the quantification of climate risk at the firm level, our research makes the first attempt to systematically explore the influences of climate risk on the possibility of green bond issuance and further reveals the impact path behind it. This provides an important supplement to the theoretical studies on green bond issuance and a new perspective for understanding how climate risk drives corporate behavior. Secondly, under the guidance of the global carbon neutrality target, China, as an important participant in global carbon emissions, has significant uniqueness in its market environment and policy system. Based on the Chinese market, this paper combines the perspectives of physical and transformation risks of climate risk to analyze how Chinese companies can use green bonds as a strategy to achieve a balance between the environment and the economy under climate pressure. These findings are not only important for the Chinese market but also for other emerging market countries. Finally, by analyzing the two main paths of climate risk on green bond issuance, including green transformation and green innovation, this paper reveals how firms’ internal behavioral adjustments (green transformation and green innovation) are driven by external pressures (climate risk), which ultimately influence green financing decisions. This mechanism analysis not only complements the studies on the effects of climate risk on firms’ behaviors but also provides policymakers with ideas for policy intervention.
2. Literature Review and Hypothesis Proposal
2.1. Climate Risk and Green Bond Issuance
According to the signal theory [16,17], when enterprises have high uncertainty in the external environment and there is information asymmetry between operators and shareholders, they can effectively alleviate the information asymmetry by transmitting positive signals to the outside world, thereby influencing investors’ decisions. Specifically in the field of green bonds, several scholars have found that the green bond issuance by enterprises has a signaling effect [7,9,11,18]. The green bond issuance outwardly conveys a strategy of sustainable development and is a signal that enterprises are actively engaged in green transformation—which means that they invest funds in green projects and green industries—and conveys to the capital market their determination to protect the environment. Meanwhile, in order to continuously maintain a good image and to ensure the authenticity of the signal transmission, enterprises will take practical actions to reduce pollution. Through the implementation of green projects, they will improve production technologies, optimize production processes, reduce pollutant emissions and enhance their environmental performance.
According to the definitions of climate risk, the climate risks faced by enterprises include physical risks and transformation risks. When the physical risk of climate risk is high, it means that the enterprise has a higher risk of loss due to climatic physical factors such as extreme weather and natural disasters, which may lead to investor concerns about the enterprise’s future operating ability and profitability prospects. At this time, the enterprise sends a positive signal to the outside world of its commitment to environmental protection by issuing green bonds. Green bond issuance can enhance investors’ recognition of corporate green transformation strategies and alleviate the trust crisis caused by climate risk. On the other hand, when the transformation risk is high, it means that the technical and policy risks faced by the enterprise in the process of green transformation are relatively high. According to previous research [7], through public disclosure of the use of funds raised through green bonds and environmental impact, green bonds can help investors better evaluate the specific measures taken by enterprises to deal with transformation risks, which helps enhance investors’ trust in enterprises and reduces information asymmetry. This enhanced trust not only facilitates routine corporate operations but also partially offsets equity market pessimism toward enterprises with high climate risk, consequently accelerating their green transformation. Meanwhile, after issuing green bonds, in order to ensure the authenticity of signals to the capital market, enterprises will take various measures to reduce the negative impact of climate risk through the implementation of green projects. Therefore, according to the signal theory, when enterprises are confronted with high climate risks, issuing green bonds becomes an important means to release environmental responsibility signals externally. Green bond issuance is an effective means of coping with climate risk.
According to the cost of capital theory [19], firms with higher climate risk often face greater financing constraints, which further motivates them to adopt green bonds in order to reduce their financing costs. Firstly, firms with a higher climate risk usually face higher operating costs [20], especially the direct impacts of physical risk (e.g., climate change, natural disasters) on production and business activities, which makes firms to take additional countermeasures, such as improving the adaptive capacity of infrastructures and optimizing supply chains. These measures can significantly increase operating costs. Secondly, firms with a higher climate risk typically face higher lending rates and stricter credit approvals in traditional financing channels (e.g., bank loans) [21,22], leading to greater difficulty in financing, which, in turn, increases the overall cost of capital.
Green bonds provide an effective financing alternative for high climate risk enterprises due to their unique financing advantages. Green bonds have higher disclosure requirements and stricter regulation of the use of funds, which enhances the transparency of the use of funds and the trust of investors. At the same time, green bond investors usually pay more attention to environmentally friendly projects, focusing on corporate social responsibility and environmental commitment, so the return requirement of green bonds is lower than that of ordinary bonds, which makes the capital cost of green bonds significantly lower than that of ordinary bonds [23,24,25,26]. This financing cost advantage provides effective financial support to enterprises with higher climate risk, helping them to alleviate financial pressure.
In summary, when enterprises face high climate risks, green bond issuance can not only transmit positive signals of green transformation and alleviate information asymmetry but also reduce financing costs and enhance the ability to cope with climate risk. Therefore, H1 is proposed:
H1.
The climate risk faced by enterprises will positively promote green bond issuance.
2.2. The Mediating Effect of Green Transformation and Green Innovation
Green transformation means that enterprises are oriented towards environmental friendliness and thus will integrate green concepts into all aspects of production by improving production technologies, optimizing production processes and innovating management methods so as to achieve intensive resource utilization, reduce pollutant emissions and improve economic and environmental benefits [27,28]. Unlike traditional industrial upgrading and technological transformation, the core of green transformation is green technological innovation and green management innovation [29]. Through green transformation, enterprises can effectively reduce resource consumption and greenhouse gas emissions in the industrial production process while improving their green performance, enhancing stakeholder confidence and alleviating information asymmetry [29].
Based on signal theory [16,17], faced with significant climate risk exposure, green transformation serves as a strategic response for enterprises to cope with climate risks. By implementing green transformation, enterprises not only improve their own environmental performance, but they also convey their green transformation strategy and determination of sustainable development to the outside world through the high-quality disclosure of environmental information in their annual reports [30]. This signal can alleviate investors’ concerns about high corporate climate risks, reduce information asymmetry and enhance corporate social reputation and stakeholder trust. Meanwhile, enterprises enhance their green innovation capacity by implementing green projects, developing green technologies and generating green patents in the process of green transformation. These innovative activities not only reduce wastewater and gas emissions from industrial production, but also significantly mitigate the threat of climate risk to enterprises.
As a key instrument of green finance, green bonds provide funds for corporate green transformation and green innovation. Previous studies demonstrate that green bonds can effectively address the financing gap in green technology innovation and fulfill the capital requirements of green projects in the process of green transformation [31]. Through green bonds, enterprises can raise funds dedicated to a low-carbon transition and green innovation, curb the flow of funds to carbon-intensive industries and provide a guarantee for the operation of green projects and sustainable development. This mechanism not only effectively reduces the financing constraints of enterprises in green transformation but also enhances the motivation to implement green strategies and promote the implementation of green technologies [32].
From the theory of sustainable development [33], green transformation and green innovation represent essential corporate strategies for achieving strong sustainable development. Strong sustainable development theory emphasizes that the total amount of resources and the environment should not decline while the economy develops, which is aligned with the target of green transformation and green innovation. Green finance significantly contributes to resource allocation efficiency by channeling financial capital to sustainability-oriented projects and balancing resource distribution across economic and environmental priorities [34]. Green bonds, a crucial instrument in green finance, have become a critical path to promote enterprises to mitigate climate risk threats and strengthen sustainable growth by offering dedicated financial backing for green transformation and green innovation. Therefore, H2 is proposed that:
H2.
Climate risk can improve green bond issuance through green transformation and green innovation of enterprises.
2.3. Moderating Effect of Ownership Concentration
Agency theory [35] suggests that there is a natural agency problem between shareholders and managers. Shareholders can usually diversify risk through their investment portfolios and are more inclined to take high risks in pursuit of long-term excess returns, whereas managers, whose returns and risks originate from the single firm they serve, are unable to hedge risks through diversification and are therefore more inclined to short-term gains [36]. When companies are exposed to climate risk, implementing green transformation strategies and green innovation activities, as well as financing green projects through green bond issuance, often involve high R&D investments, long-term capital recovery cycles and the potential risk of failure of the green transformation. Such high-risk and long-term investments may result in the loss of short-term returns, leading managers to be more inclined to avoid such risky projects when making decisions. However, an increase in ownership concentration can effectively mitigate this conflict. High ownership concentration usually means that major shareholders have stronger control and influence over the enterprise [37]. Major shareholders prioritize the long-term strategic objectives of companies over managers and tend to favor high-risk green projects such as green transformation and green innovation. This long-term perspective helps to push companies to adopt proactive green financing strategies under climate risk, thus positively promoting green bond issuance. Through green bond financing, enterprises can not only obtain the funds needed for green projects but also send environmentally friendly signals, enhance their social reputation and ultimately strengthen their sustainable development capability.
Drawing upon internal control theory, high ownership concentration demonstrates significant potential in enhancing corporate governance mechanisms. By strengthening control over management, major shareholders reduce information asymmetry and conflicts of interest due to agency problems, thus improving the overall governance efficiency of enterprises [38]. In enterprises with higher ownership concentration, the major shareholders take greater risks, so they have strong motivation to reduce the “free-riding” behaviors of the minority shareholders and the short-sighted behaviors of managers [39]. This monitoring ability not only mitigates managers’ resistance to high-risk green projects but also ensures that corporate resources are more efficiently invested in green R&D activities and innovation projects [36,40].
In addition, positive incentives from shareholders based on long-term strategic goals can enhance R&D investment and strengthen green innovation capabilities, thus optimizing the implementation of green transformation strategies. In this process, major shareholders of high ownership concentration enterprises prefer to provide exclusive financial support for green projects through green bonds to help enterprises cope with climate risks and achieve green development goals [41]. Based on this, H3 is proposed:
H3.
High ownership concentration acts as a positive moderator between climate risk and green bond issuance.
2.4. The Moderating Effect of Managerial Overconfidence
Managers are usually more concerned with their own interests and neglect the company’s long-term interests. Managers, under performance evaluation pressures, exhibit a strong bias toward projects with immediate returns while systematically neglecting far-sighted strategic investments with long payback cycles and uncertain earnings prospects. The managerial arrogance hypothesis [42] suggests that overconfident managers tend to overestimate their own ability and judgment, underestimate the impact of external risks and may make irrational decisions. This personal trait leads to the possibility that managers may overinvest in projects with higher short-term returns while ignoring the needs of long-term development and may even lack the willingness to invest in green projects [43]. In situations where firms face high climate risk, overconfident managers tend to overestimate the firm’s ability to resist risks [44,45] and underestimate the possible negative impacts of climate change or extreme weather on the firm’s production and operations. This tendency to underestimate causes them to fail to take timely measures to address the climate risk, further weakening the incentive for enterprises to implement eco-friendly transition plans and invest in green projects.
From a long-term strategic development perspective, green bond issuance contributes meaningfully to both climate risk mitigation and the enhancement of corporate green performance. However, overconfident managers who lack confidence in the long-term returns from green items may show a negative attitude towards green bond issuance. On the one hand, green projects require large upfront investments, but the return cycle is long, which cannot quickly meet the managers’ short-term performance objectives. On the other hand, overconfident managers may have insufficient understanding of the need for green transformation and the importance of green projects to enhance corporate resilience and competitiveness. Such psychological and behavioral biases not only inhibit the ability of companies to cope with climate risk but also further reduce the probability of companies raising funds through green bonds. Based on this, H4 is proposed:
H4.
Managerial overconfidence negatively moderates the association of climate risk with green bond issuance.
3. Samples, Variables and Models
3.1. Samples
Since China’s green bond policy was implemented in 2016, A-share listed companies that have issued green bonds between 1 January 2016 and 31 December 2023 were selected as the sample, containing 95 companies after excluding financial companies, such as the ST and *ST companies. ST represents stocks that have suffered consecutive losses, and *ST refers to the stocks subject to delisting risk warnings. Following the 2012 edition of industry categorization by the China Securities Regulatory Commission, listed companies issuing green bonds are concentrated within eight primary industries. Referring to the research of other scholars [10,13,14], the sample also adopts the listed companies belonging to the same eight primary industries, but that have not issued green bonds and have issued conventional bonds. Therefore, there are a total of 648 A-share listed companies that have issued conventional bonds without engaging in green bond financing after excluding the financial sector and ST/*ST enterprises. Therefore, the total sample size is 743 companies. Based on the research by other scholars [10,13], the time interval uses pre-issuance data for green bonds, and if the company issues green bonds multiple times, the first issuance time shall prevail. It contains a total of 7238 samples during the period between 1 January 2000 and 31 December 2022, and winsorization is applied to all continuous variables at the 1% and 99% levels. The green bond data are sourced from the Green Bond Environmental Benefit Information Database of the China Bond Information Network, and cross-verification is conducted with green bond data from the WIND and CSMAR databases. WIND refers to the WIND database, which is a financial data and analysis tool provided by Wind Information Co., LTD. CSMAR is the China Stock Market & Accounting Research Database. We utilized conventional bond data from the WIND database. The green patent data come from the CNRDS database, whose full name is Chinese Research Data Services. Other data are taken from the CSMAR database.
3.2. Variables
3.2.1. Explained Variable
The explained variable is a dummy variable, i.e., whether the enterprise has issued green bonds (GB). If the company has issued green bonds, then GB = 1; if not, then GB = 0.
3.2.2. Explanatory Variables
The explanatory variable is the climate risk of corporate (CR).
Climate risk is generally measured in two ways: (1) Using physical climate risk indicators, such as greenhouse gas emissions [46], the number of extreme weather events [47,48,49], energy consumption data [50] and climate-related disaster events [3]; and (2) using a text analysis approach, which is based on the number of articles on climate risks that appear in newspapers each month [51], constructing a climate risk index based on climate risk information disclosed by companies [20,52,53,54]. Since Chinese listed companies rarely disclose carbon emissions, energy consumption or other data, regional physical climate risk metrics cannot capture firm-level heterogeneity. Therefore, this paper adopts a text analysis approach to construct a climate risk index.
Based on the text analysis approach adopted by other scholars [20,52,53,54,55] for climate risk measurement, the disclosed information related to the climate risks of listed companies’ annual reports is collected. According to 98 keywords of climate risk proposed by Du Jian et al. [52], which are presented in Appendix A, the module “jieba” in Python (v0.40) is used to segment the annual report text and extract the aggregate count of the occurrence of climate risk keywords. Finally, the proportion of climate risk keywords in the total word frequency of the annual reports is calculated and then multiplied by 100 to obtain the climate risk index at the enterprise level. If the climate risk index is higher, it means that the enterprise is exposed to a higher climate risk. Since this study adopts the text analysis method to construct climate risks, the accuracy of the measure may be influenced by the quality of corporate disclosures. To address potential measurement errors, we adopted two alternative approaches for robustness testing. First, we utilized environmental research data from the CSMAR database, offering an externally assessed, multi-dimensional proxy for climate risk. Second, we constructed a physical climate risk index based on the annual frequency of extreme weather events in each firm’s provincial location. These alternative measures help to ensure the robustness and objectivity of our findings.
3.2.3. Mediating Variables
The mediating variables are the green transformation index (GTF) and green innovation (GI).
According to the method proposed by [29,56], the green transformation index (GTF) is constructed using a text analysis approach. The keywords of green transformation are proposed according to 113 keywords of Zhou Kuo et al. [29]. According to the disclosed contents of listed companies’ annual reports, the module “jieba” in Python is used to process the text of the annual reports to extract the frequency of green transformation words. Using the word frequency number plus 1 to take the natural logarithm, thus describes the green transformation level of the enterprise. The higher the green transformation index, the greater the influence of the enterprise’s green strategy concept within the enterprise, and the greater the intensity of green transformation.
Based on the methods of other scholars [8,57,58], green innovation (GI) is measured using the natural logarithm of the number of green patent applications plus one. Since the time period between the application and the granting of green patents is long, which may take 1–2 years, the number of green patent applications better reflects the green innovation level of an enterprise [59].
3.2.4. Moderator Variables
The moderator variables are ownership concentration (Top1) and managerial overconfidence (OC).
Referring to other scholars [60,61,62], ownership concentration (Top1) is measured by the proportion of shares held by the largest shareholder. When the largest shareholder’s proportion rises, it signifies heightened ownership concentration.
Adopting the research of other scholars [63,64,65], managerial overconfidence (OC) is scored from four aspects: gender, age, education and position. In terms of gender (SexScore), it is assigned a value of 1 for male managers and 0 otherwise. In order to normalize the variable between 0 and 1 while giving higher scores as age decreases, the age score (AgeScore) is calculated using Formula (1). “Age” is the age of the manager; max (Age) and min (Age) denote the oldest and youngest ages, respectively, among the managers in the sample. The younger the manager is, the higher the score. In terms of education (DegreeScore), if the manager’s education is above a bachelor’s degree, the value is 1; otherwise, it is 0. In terms of position (PosiScore), if the manager has a dual position of general manager and chairman, it is assigned a value of 1; otherwise, it is 0. Finally, the arithmetic average of the four dimensions is calculated as a result of managerial overconfidence (OC), which is shown as Formula (2).
AgeScore = [max (Age) − Age]/[max (Age) − min (Age)]
OC = (SexScore + AgeScore + DegreeScore + PosiScore)/4
3.2.5. Control Variables
Drawing on prior research by scholars [7,10,13,14], the control variables reflecting the operational and governance characteristics that may affect green bond issuance are adopted, including (1) the company size (SZ), calculated as the log of aggregate assets; (2) the ratio of fixed assets (FIX), which measures the net fixed assets as a proportion of the total assets; (3) debt-to-assets ratio (DR), defined as the proportion of total liabilities to total assets; (4) return on asset (ROA), which is the ratio of net profits to total assets; (5) total assets growth rate (AGR), computed as (current year total assets/previous year total assets) minus one; (6) company market value (TQ), defined as the ratio of a firm’s market value to total assets; (7) years since the company’s establishment (YE), computed by adding 1 to the company’s age and then taking the natural logarithm of the result; (8) board membership size (BD), measured as the natural logarithm of the total number of directors serving on the board; and (9) the institutional investor shareholding ratio (INSR), calculated as institutional investors’ shareholdings divided by the company’s total amount of equity. The definitions of all variables are shown in Table 1.

Table 1.
Definition of variables.
3.3. Model
3.3.1. Baseline Regression Model
Pr.(GBit = 1) = f (α0 + α1 Crit + α2Controlsit + δt + σi + εit)
To validate H1, referring to prior research [10,14,15], the baseline regression adopts the Probit model to investigate the factors affecting the probability of green bond issuance, as shown in Equation (3). Given that the dependent variable is binary—whether a firm issues green bonds—linear probability models are not appropriate due to inherent limitations such as heteroskedasticity and predicted values falling outside the [0, 1] range. We therefore adopt the Probit and Logit models, which are more suitable for binary outcomes. While both models are commonly used, the Probit model offers compatibility with instrumental variable techniques (e.g., IV-Probit), allowing us to address potential endogeneity. Accordingly, we use the Probit model as our baseline and perform robustness checks using both the Logit and IV-Probit models.
Pr.(GBit = 1) represents the probability that the i enterprise issues green bonds in the t year. CRit denotes the level of climate risk of the i enterprise in year t. Controlsit are control variables; δt is the industry fixed effect; σi is the year fixed effect; εit is the residual term; α0 is the constant term; and the model uses robust standard errors. Referring to the model of green bond issuance by previous scholars [10,13,14,15], the individual fixed effects are not included. If α1 is significantly positive, it means that the higher the climate risk, the greater the probability of issuing green bonds.
3.3.2. Mediating Effect Model
Mediatorit = Υ0 + Υ1CRit + Υ2Controlsit + δt + σi + εit
Pr.(GBit = 1) = f (θ0 + θ1CRit + θ2Mediatorit + θ3Controlsit + δt + σi + εit)
To validate H2, with reference to the mechanism validation method of other scholars [9,11,66], the three-step validation method is used, that is, Equation (3) verifies the effect of CRit on Pr.(GBit = 1), Equation (4) verifies the effect of CRit on Mediatorit, and Equation (5) verifies the effect of Mediatorit on Pr.(GBit = 1). Equation (4) uses the fixed-effects model. Mediatorit denotes the mediating variable for firm i in year t. Υ0 and θ0 are the constant terms, and robust standard errors are used. The other variables are defined in accordance with baseline regression. If Υ1, θ1, and θ2 are significantly positive, then there is a partial mediation effect.
3.3.3. Moderating Effect Model
Pr.(GBit = 1) = f(β0 + β1 CRit + β2 Moderatorit + β3 CRit × Moderatorit + β4 Controlsit + δt + σi + εit)
To verify H3 and H4, referring to prior research [14,67], we used a moderating effects model. In Formula (6), Moderatorit represents the moderating variable for firm i in year t, CRit× Moderatorit is the interaction term between climate risk and the moderating variable, β0 is the constant term, and robust standard errors are used. The other variables are defined in accordance with baseline regression. Different from the testing method of a linear model, the nonlinear model cannot be judged simply according to the sign and significance of the coefficient of the interaction term. According to the testing method of the moderating effect of the nonlinear model [68], the average marginal effect of the interaction term should be calculated. If the average marginal effect of the interaction term is greater than zero, then there is a positive moderating effect; if less than zero, then there is a negative moderating effect.
4. Results
4.1. Descriptive Statistics
Descriptive statistics for the variables are reported in Table 2. Climate risk averages 0.184, and the enterprises have certain differences in climate risk. ROA is found to have a mean value of 4.6%, demonstrating superior financial performance within the selected firms. The average total assets growth rate is 27.7%, revealing that the growth ability of enterprises is strong.
Table 2.
Descriptive statistics.
4.2. Results of Baseline Regression
Table 3 displays the baseline regression results, columns (1)–(3), without the control variables. The analyses in columns (1) and (4) do not include industry and year fixed effects. The results in columns (2) and (5) only account for industry fixed effects, while columns (3) and (6) account for both industry and year fixed effects. The estimated coefficients of CR are all positive and statistically significant at the 1% level, indicating that the climate risk faced by enterprises positively promotes green bond issuance.
Table 3.
Baseline regression results.
Table 4 shows the analysis of the average marginal effects of variables, including industry and year fixed effects. The average marginal effect of climate risk is 0.2499, and the result is significant (p < 0.01). The average increase of the enterprise climate risk level by one unit will increase the probability of green bond issuance by about 24.99%. This indicates that enterprises with higher climate risks are more inclined to pursue green bond issuance to convey their environmental responsibility signals to the market and stakeholders, enhance corporate reputation and reduce potential policy or market risks. Furthermore, enterprises with higher climate risk may be subject to stricter regulatory pressures, creating financial incentives for these entities to adopt green bond financing as a means of meeting environmental standards.
Table 4.
Results of the average marginal effect.
The average marginal effect of the firm’s size is about 0.0722, and the result is significant (p < 0.01); that is, when the average firm size increases by one unit, the probability of green bond issuance increases by about 7.22%. Larger companies are more likely to attract public attention and build up a favorable social responsibility image through issuing green bonds to meet market expectations for sustainable development. Moreover, large companies possess greater resources and capabilities to participate in the green bond market.
The average marginal effect of fixed asset ratio is about −0.2606, and the result is significant (p < 0.01); that is, when the average fixed asset ratio of enterprises increases by one unit, the probability of green bond issuance decreases by about 26.06%. This implies that firms with a high proportion of fixed assets may have less demand for green bonds because funds are more locked up in capital-intensive projects. In addition, these companies usually belong to asset-heavy industries and may prefer to meet their capital needs through traditional loans or internal funding.
The average marginal effect of the total asset growth rate is about −0.018, and the result is significant (p < 0.05); that is, an average increase of one unit in the total asset growth rate decreases the probability of a green bond issuance by about 1.8%. This suggests that high-growth companies may prioritize resources for business expansion over environment-related projects. Concurrently, such enterprises demonstrate a stronger propensity toward conventional financing instruments to support their growth objectives. It can be seen that climate risk and corporate characteristics (such as scale, fixed asset ratio, etc.) have significant impacts on the probability of green bond issuance.
4.3. Mediating Effects Results
Table 5 demonstrates the mediating effects. Columns (1)–(3) take the green transformation index GTF as the mediating variable, while columns (4), (5) and (6) take green innovation GI as the mediating variable. The coefficients of CR in columns (1)–(3) are positive and statistically significant at the 1% level, suggesting that the increase in climate risk significantly promotes firms to embark on green transformation activities. This indicates that in the face of external pressures (e.g., policy constraints, market concerns and stakeholder demands) brought by climate risk, firms tend to be proactive in implementing green transformation in order to mitigate risks. The estimated coefficient of GTF in column (3) is positive and statistically significant at the 10% level, suggesting that green transformation activities significantly enhance the likelihood of issuing green bonds, which reflects that green transformation, as one of the key paths for firms to cope with climate risk, not merely enhances the environmental performance, but also elevates their green reputation and attracts more green funds. Therefore, green transformation partially mediates the relationship between climate risk and green bond issuance.
Table 5.
Mediating effects results.
The coefficients of CR in columns (4)–(6) are all positive and statistically significant at the 1% level, suggesting that the increase in climate risk significantly promotes firms to implement green technology innovation behaviors. This implies that climate risk motivates firms to improve their environmental resilience through technological innovation to meet the high demand for environmental responsibility from external policies and markets. The coefficient of GI in column (6) is positive and statistically significant at the 1% level, suggesting that green innovation behaviors significantly enhance the likelihood of issuing green bonds. The findings demonstrate that green innovation activities not only enhance corporate environmental performance but also confer stronger market competitiveness and greater green financing appeal to firms. Therefore, green innovation also partially mediates the relationship between climate risk and green bond issuance.
In summary, through the path of green transformation and green innovation, the external environmental pressures faced by firms are alleviated, and climate risk increases the probability of issuing green bonds. Externally, climate risks drive firms to proactively seek transformation and innovation to adapt to external regulatory policies and stakeholders’ environmental demands. Internally, firms improve their environmental performance through green transformation and green innovation and alleviate their financing constraints by providing specialized financing for transformation and innovation with the help of green bonds. This finding not only reveals the important mechanism by which climate risk affects the behaviors of firms, but it also clarifies the essential role of green bonds in driving green transformation and technological innovation from a green finance perspective.
4.4. Moderating Effect Results
Table 6 demonstrates the moderating effects. Columns (1)–(3) take ownership concentration as a moderator, while columns (4)–(6) take managerial overconfidence as a moderator. Columns (1) and (4) do not account for the industry and year fixed effects; columns (2) and (5) account for the industry fixed effects, and columns (3) and (6) account for both the industry and year fixed effects.
Table 6.
Moderating effect results.
The coefficients of the interaction term in columns (1)–(3) are all positive and statistically significant at the 1% level, indicating that ownership concentration positively moderates the relationship between climate risk and green bond issuance. Based on the test for the moderating effect of nonlinear models [68], the average marginal effect of the interaction item is calculated to be greater than 0 (0.3690558). From Figure A1 in Appendix B, most of the points fall above 0, further supporting the positive moderating effect. High ownership concentration can effectively mitigate principal–agent conflicts when firms face greater climate risks. Controlling shareholders can exercise more efficient oversight over corporate management, incentivizing firms to adopt a long-term perspective in green investments, adjust business strategies in a timely manner and accelerate sustainability transitions. Enterprises with high ownership concentration are more inclined to use green bonds to convey environmental responsibility signals and attract social capital to support environmental projects through green financing, thus increasing the likelihood of green bond issuance.
The coefficients of the interaction item in columns (4)–(6) are all significantly negative, suggesting that managerial overconfidence negatively moderates the relationship between climate risk and green bond issuance. According to the test for the moderating effect of nonlinear models [68], the average marginal effect of the interaction term is calculated to be less than 0 (−0.4982917), and as seen in Figure A3 in Appendix B, most of the points fall below 0, which further supports the negative moderating effect. Managerial overconfidence tends to underestimate risks, resulting in their decision-making not being fully aware of the potential threat of climate risks. As a result, such managers are likely to delay critical actions like green transformation or green innovation to address climate risk. Overconfident executives tend to perceive existing business models as sufficient to cope with the risk, which, in turn, inhibits green transformation and green innovation activities and reduces the willingness to finance through green bonds. The estimated coefficients of both climate risk and managerial overconfidence in column (6) are significantly positive, but the coefficient of the interaction term is significantly negative, suggesting that the positive effect of climate risk on green bond issuance is more pronounced when the level of managerial overconfidence is low; however, as the level of managerial overconfidence gradually increases, this positive effect is weakened or even replaced.
4.5. Robustness Test
4.5.1. Replacing Explanatory Variable
Two methods are used to replace explanatory variables. Firstly, other variables are used to construct the corporate climate risk, which is represented by CR1 and obtained from environmental research data from the CSMAR database. A comprehensive measurement is made using the following dimensions: whether the company is a priority pollution monitoring unit, assign 1 if yes, 0 otherwise; whether the pollutant emission meets the standards, the value is 0 if yes, 1 otherwise; whether there are environmental accidents, the value is 1 if yes, 0 otherwise; whether there are environmental offences, the value is 1 if yes, 0 otherwise; whether there are environmental petition cases, the value is 1 if yes, 0 otherwise; whether it has ISO14001 certification, assign 0 if yes, 1 otherwise; whether it has ISO9001 certification, assign 0 if yes, 1 otherwise. Finally, the comprehensive scores of the enterprise’s climate risk are calculated and then by adding 1, taking the logarithm to represent the enterprise’s climate risk. Higher scores signal a greater climate risk to the company. Secondly, according to the construction method of the climate physical risk index [69], we construct climate risk indicators by using extreme weather events, CR2, which is the index after standardization of the number of days of extreme low temperature in the whole year in the province to which the enterprise belongs is used as a measure of climate risk.
The results are demonstrated in columns (1) and (2) of Table 7, including both the industry and year fixed effects. CR1 is significantly positive at the 5% level, and CR2 is significantly positive at the 1% level, revealing that the baseline regression results are reliable.
Table 7.
Comprehensive robustness of the test results.
4.5.2. Model Replacement
Baseline regression is replaced by the Logit model, and the results are demonstrated in column (3) of Table 7, which introduces the industry and year fixed effects at the same time. The coefficient of CR is positive and statistically significant at the 1% level, verifying that our results remain stable.
4.5.3. Changing the Time Interval of the Sample
The samples of baseline regression use the data of all years before green bond issuance, while we narrow the sample interval and use the samples of 10 years and 5 years before green bond issuance, respectively, for regression. The results are demonstrated in columns (4) and (5) of Table 7, introducing the industry and year fixed effects. The climate risk coefficients are all positive and statistically significant at the 1% level.
4.5.4. Expanding the Sample Size
Baseline regression uses a control sample of enterprises that have issued conventional bonds but not green bonds within the same eight industries as those that have issued green bonds (Pr = 0). A robustness test uses all listed companies within the same eight industries that have issued green bonds, regardless of whether they have issued conventional bonds. The sample size was increased from 6878 samples to 29,034 samples. Column (6) of Table 7 demonstrates the results, accounting for both the industry and year fixed effects. The climate risk coefficient is positive and statistically significant at the 1% level.
4.5.5. Adding Control Variable
The control variables used in the baseline model are all firm-specific characteristics, and the robustness test adds macro-level control variables that may affect climate risk, including provincial resident population (PP), provincial GDP growth rate (GDPGR) and provincial total exports (TE). “Controls” of Table 4 indicate the firm-level control variable for the baseline regression, whereas “Controls2” of Table 4 indicates the control variables for which the four macro variables are added. Among them, logarithms are taken for the province’s resident population and the province’s total exports, respectively, and the province of corporate registration is used for data matching. The regression result is demonstrated in column (7) of Table 7, accounting for both the industry and year fixed effects. The climate risk coefficient is positive and statistically significant at the 1% level.
4.5.6. PSM
In order to reduce the dependence on functional forms and alleviate the endogenous issues arising from observable variables, PSM is used to mitigate the endogenous problem between climate risk and green bond issuance. We take 1:20 nearest neighbor matching and implement a Logit model. The control variables of the baseline model serve as covariates.
As shown in Table 8, the vast majority of deviations from the standardized means of the covariates after matching are within 10%, and the p-values for the vast majority of covariates are not significant after matching, signaling a good match. Table 9 demonstrates the outcomes of regression using the matched samples, where specifications in columns (1)–(3) exclude the control variables. The climate risk coefficients of columns (1)–(6) are positive and statistically significant at the 1% level, verifying that our conclusions are reliable.
Table 8.
PSM matching results.
Table 9.
Regression results for PSM-matched data.
4.5.7. Instrumental Variable Method
To dispose of endogeneity that causes form omitted variables and measurement errors, the instrumental variable approach is conducted. (1) Referring to the studies of other researchers [70,71,72], the mean climate risk of other enterprises in the same industry is adopted as the instrumental variable IV1. Because the climate risk level of other enterprises in the same industry is an external factor, different enterprises face different physical and transformation risks due to their different geographic locations and business conditions. The climate risk of other enterprises within the same sector will not affect the green bond issuance behavior of individual enterprises, which satisfies the conditions of the instrumental variables. (2) According to previous research [73], the lagged one-period explanatory variable is used as an instrumental variable, IV2, because the lagged variable is correlated with the endogenous explanatory variable but may not be correlated with the current-period disturbance term since the lagged variable has already occurred. With reference to the previous study [74], IV-Probit was used to carry out instrumental variable regression.
Table 10 demonstrates the analysis of the instrumental variable approach. CR’ denotes the predicted value obtained from the regression of instrumental variables with endogenous explanatory variables. Columns (1) and (2) demonstrate the estimates using IV1 as the instrumental variable, while columns (3) and (4) demonstrate the results of IV2. The coefficients of IV1 in column (1) and IV2 in column (3) are positive and statistically significant at the 1% level, as well as the coefficients of CR’ in column (2) and column (4), supporting the baseline regression results. Both AR and Wald statistics are significant at the 1% level, portending that IV1 and IV2 are not weak instrumental variables. The results of the instrumental variables support the conclusion of baseline regression.
Table 10.
Instrumental variable approach results.
4.6. Heterogeneity Analysis
We come to the conclusion that the climate risk of enterprises will positively promote green bond issuance, but the strength of this relationship is contingent upon the characteristics of the enterprise. Consequently, it is essential to examine the heterogeneity in the effect of climate risk affecting green bond issuance.
4.6.1. Enterprise Scale
Large firms receive more social attention and pay more attention to corporate reputation [75], and issuing green bonds creates an environmentally friendly image for society when firms face the threat of climate risk, so larger firms are more likely to issue green bonds. We segmented the sample into two groups based on the median firm size, with firms exceeding the sample’s median firm size used as the large-scale group, and the remainder forming the small-scale group. It is found that the estimated coefficients of CR are all positive and statistically significant at the 1% level, but there are differences in coefficient sizes. The coefficient of the explanatory variable in the Probit model will affect the average marginal effect; it is necessary to take the between-group coefficient difference test. The Bootstrap method was used with 500 sampling times. Table 11 presents the large-sized enterprise estimates in column (1) and the small-sized results displayed in column (2). The p-value of the between-group coefficient difference test is 0.046, which portends that the climate risk of large-sized enterprises exerts a stronger influence on green bond issuance.
Table 11.
Heterogeneity analysis results.
4.6.2. Industry Type
Following the industry classification methodology [76], we categorized firms into labor-intensive and non-labor-intensive industries, while labor-intensive industries include coal mining, metal ore mining, most manufacturing industries, construction, transportation, real estate, scientific research and technical services, and public facility management. Following the 2012 edition of industry categorization by the China Securities Regulatory Commission, the industries supported by the government for green bonds include most labor-intensive industries. Therefore, compared with non-labor-intensive industries, labor-intensive industries are supported by green bond policies and demonstrate a greater probability of green bond issuance.
We segmented the sample into two groups based on industry types. Table 11 presents the labor-intensive industry estimates in column (3) and non-labor-intensive industry results displayed in column (4). The coefficients of CR of the two groups are all positive and statistically significant at the 1% level, and the between-group coefficient difference test is taken using the Bootstrap method with a sampling number of 500 times. The p-value of the between-group coefficient difference test is 0.004, suggesting that the climate risk of labor-intensive enterprises exerts a stronger influence on green bond issuance.
4.6.3. Environmental Performance
Firms with superior environmental performance demonstrate stronger commitments to ecological stewardship, adopting concrete and measurable initiatives to enhance their ESG performance [9,11]. Issuing green bonds serves as a strategic financing mechanism for enterprises to enhance their environmental performance by implementing green projects and to convey the idea of sustainable development externally. Therefore, when confronted with climate risk threats, the probability of green bond issuance is greater for enterprises with superior environmental performance. Environmental performance is scored using the environmental (E) dimension of the HuaZheng ESG scores, which are from the WIND database, with higher than the median being the better environmental performance group and lower than the median being the worse environmental performance group.
We segment the sample into two groups based on median environmental performance. Table 11 presents better group estimates in column (5) and worse group results displayed in column (6). The coefficients of CR for both groups are all positive and statistically significant at the 1% level, and the between-group coefficient difference test is conducted using the Bootstrap method with a sample size of 500. The p-value of the between-group coefficient difference test is 0.000, suggesting that the climate risk of enterprises with better environmental performance exerts a stronger influence on green bond issuance.
5. Conclusions
We investigate the relationship between the climate risk faced by enterprises and green bond issuance in the context of China’s rapidly growing green bond market. We come to the conclusion that climate risks faced by enterprises positively promote green bond issuance, and the findings remain robust after a series of robustness tests. The mechanism analysis show that the green transformation and green innovation of enterprises have a partially mediating effect; that is, an increase in climate risk will significantly promote enterprises to implement green transformation and green innovation activities, which will significantly increase the probability of green bond issuance. Regarding the moderating effect, ownership concentration plays a positive moderating role in the relationship between climate risk and green bond issuance. High ownership concentration is conducive to mitigating principal–agent conflicts, prompting strategic adaptation to climate risks and consequently fostering green bond issuance. Managerial overconfidence plays a negative moderating role by making myopic decisions focused on short-term returns, which creates substantial barriers to corporate green bond issuance. In addition, the impact of climate risk on green bond issuance is greater for large firms, labor-intensive firms, and firms with better environmental performance. These findings enrich the theory of green bond issuance and further validate and complement the signal theory of green bonds.
Green bond issuance serves as both a credible signal of corporate sustainability commitment and an effective financial instrument for climate risk mitigation. Therefore, we propose the following policy implications. Firstly, for enterprises, they should actively promote green transformation and green innovation activities. Specifically, they can carry out innovation in green management methods and models, increase investment in R&D, optimize production processes, upgrade cleaner production technologies, as well as increase green innovation technologies to cope with climate change risks and contribute to the Sustainable Development Goals. Secondly, to mitigate principal–agent problems and enhance organizational responsiveness, enterprises should streamline internal governance procedures while enhancing both the architecture and operational mechanisms of corporate governance. The training and selection of managers should be strengthened to avoid managerial overconfidence affecting investment decisions, as well as the implementation of long-term green strategies. Moreover, managers with an environmental background or high environmental awareness should be appointed to support green transformation strategies.
Thirdly, policymakers should actively implement policy measures to facilitate the issuance of green corporate bonds as a climate risk mitigation strategy, including further expanding the range of industries issuing green bonds and providing appropriate subsidies to green bond issuers. Meanwhile, the state should introduce unified policies to strengthen the supervision of green bonds, improve third-party certification, increase the disclosure requirements of green bonds, and strengthen the continuous tracking and evaluation of green projects. Fourthly, the government should promote and regulate corporate climate risk disclosures. Under the current framework, Chinese companies are not required to report climate-related risks in their annual reports, resulting in inconsistent and non-standardized voluntary disclosures across firms. Establishing climate risk reporting frameworks with quality benchmarks is conducive to stakeholders’ better understanding of the climate risk profile of enterprises and making reasonable investment decisions.
The theoretical contribution of this study is to fill the gap in the theory of green bond issuance, especially enriching the theory from the perspective of the external factor of climate risk and further verifying the signal theory of green bond issuance. The practical implications of this study are to reveal the impact of the climate risks faced by enterprises on their financing decisions for issuing green bonds and their influence mechanisms, which provides a theoretical basis and empirical evidence for the trade-offs of enterprises’ decisions on green bond issuance and offers certain suggestions for the development of China’s green bond market and other emerging market countries. Our study has the following limitations: Firstly, due to the availability of data, the explanatory variable climate risk is constructed by a text analysis approach, and the robustness test replaces the measurement method. However, if accurate enterprise-level physical and transformation climate risk indices can be obtained, the robustness of the conclusion will be enhanced. Secondly, the sample size is limited. Due to the relatively small number of listed companies issuing green bonds in China, our research only utilizes pre-issuance data, resulting in a constrained sample pool. As China’s green bond market continues to expand robustly, the sample size can be expanded for further research. While our study exclusively focuses on the Chinese market, limiting the generalizability of the conclusions, future research could expand to global markets with enhanced sample diversity and applicability. Thirdly, for the model’s setting, this paper adopts the Probit and the Logit models. In the future, other models, such as SEM-Logit, can be used to analyze the complex relationships among latent variables, control measurement errors and to improve the precision of estimation.
Author Contributions
Conceptualization, X.L. and C.L.; methodology, X.L. and C.L.; software, X.L.; validation, C.L.; formal analysis, X.L. and C.L.; data curation, X.L.; writing—original draft preparation, X.L.; writing—review and editing, C.L. All authors have read and agreed to the published version of the manuscript.
Funding
This research received no external funding.
Data Availability Statement
Data are contained within the article. If you need more information, please contact the author by email.
Conflicts of Interest
The authors declare no conflicts of interest.
Appendix A
The following key words are used for climate risk: climate risk disaster, earthquake, typhoon, tsunami, drought and flood, extreme, severe, waterlogging, wind, dust, hurricane, frost, flood, flood, storm, mudslide, landslide, freezing, snow, drought, flood, rain, rainstorm, tornado, hail, rain and snow, freeze, blizzard, freezing damage, drought, drought, heavy rainfall, flood, severe cold, wind and sand, climate, weather, humidity, water temperature, cooling, cold, air temperature, rainfall, temperature, rain, rainy season, rain situation, precipitation, rainy, rainy, extremely cold, winter, flood season, high humidity, water situation, water level, light, water shortage, high cold, cold wave, settlement, groundwater, flood situation, surface, water storage, energy saving, energy, clean, ecology, environment, transformation, solar energy, upgrading, recycling, utilization rate, nuclear power, wind power, natural gas, efficiency Fuel, efficiency, regeneration, emission reduction, environmental protection, green, low-carbon, consumption reduction, fuel, water saving, photovoltaic, high efficiency, transformation, fuel consumption, power consumption, energy consumption, wind power, photovoltaic, efficiency, and intensive.
Appendix B
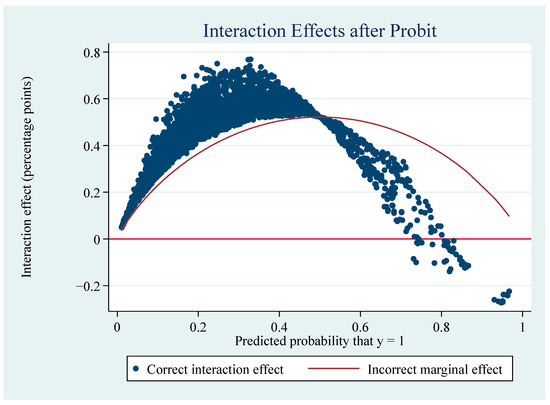
Figure A1.
Interaction effects with ownership concentration as the moderating variable.
Figure A1.
Interaction effects with ownership concentration as the moderating variable.
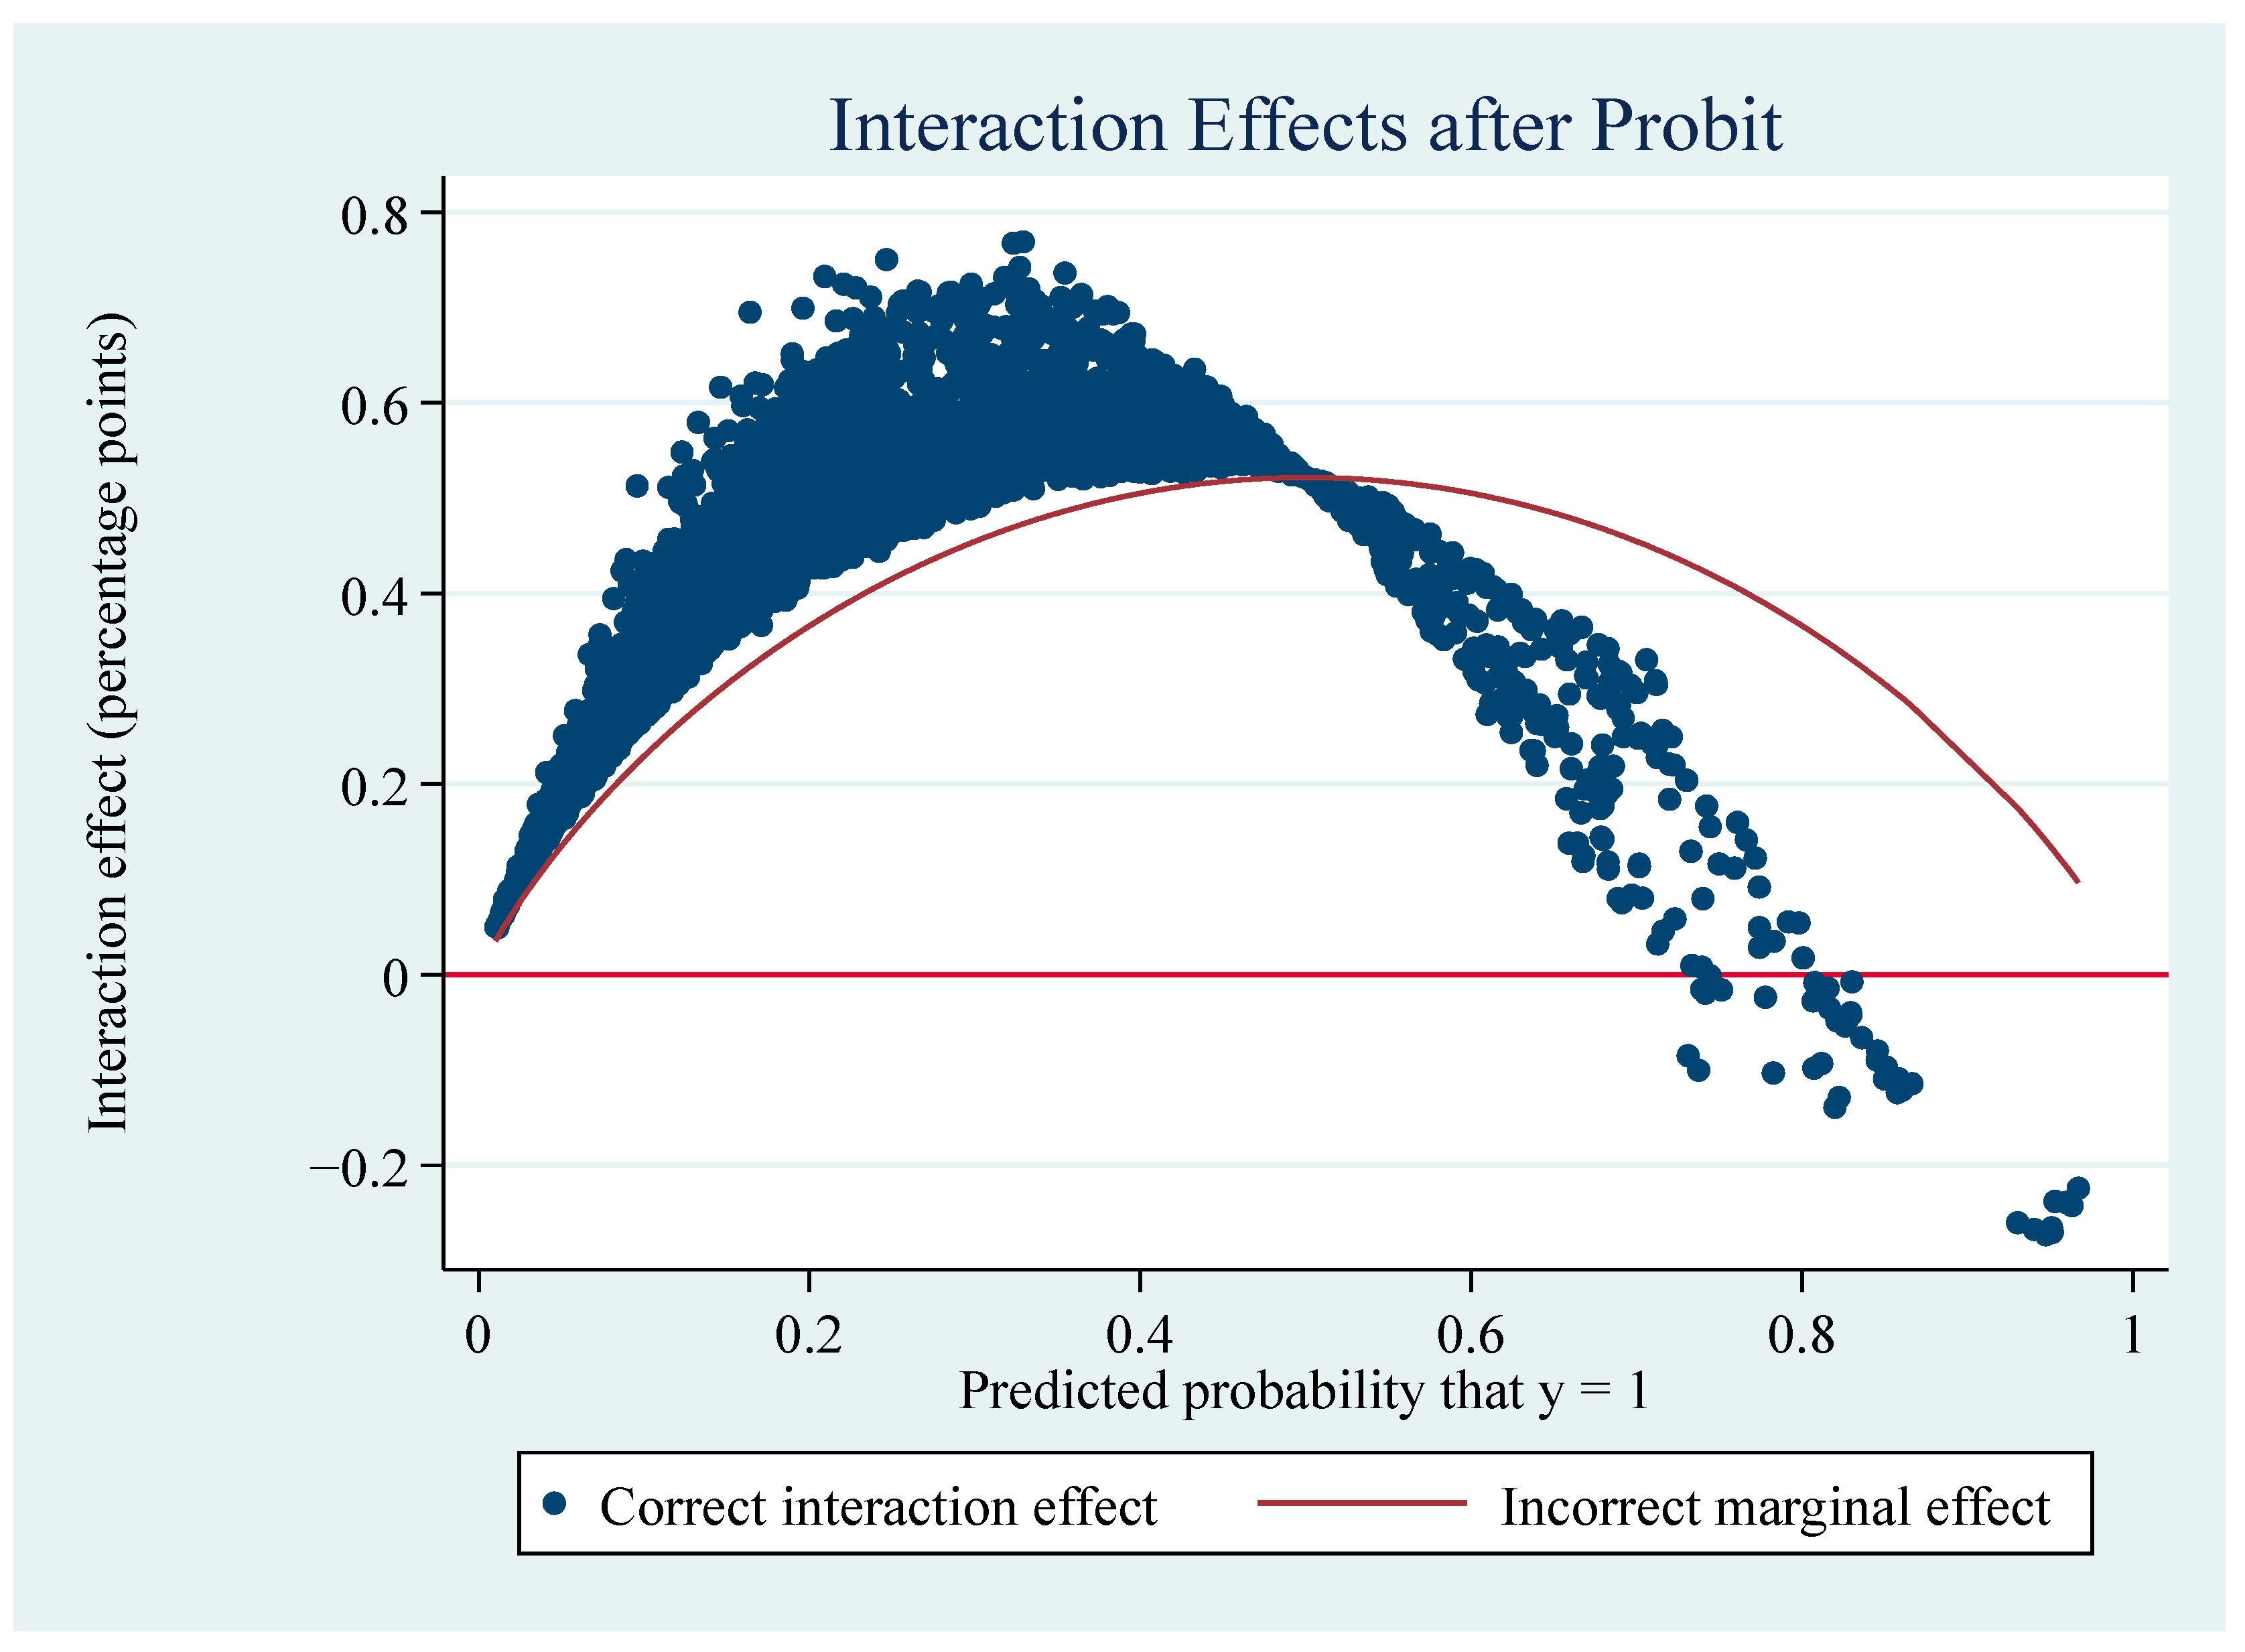
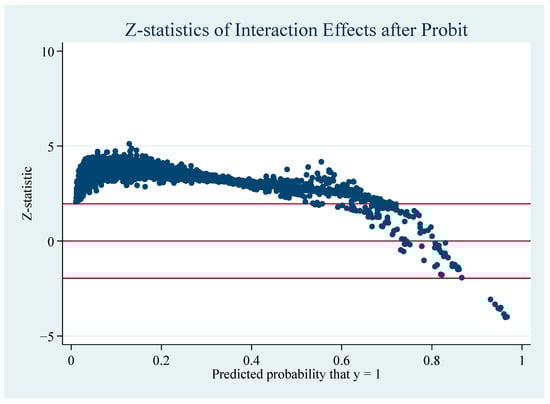
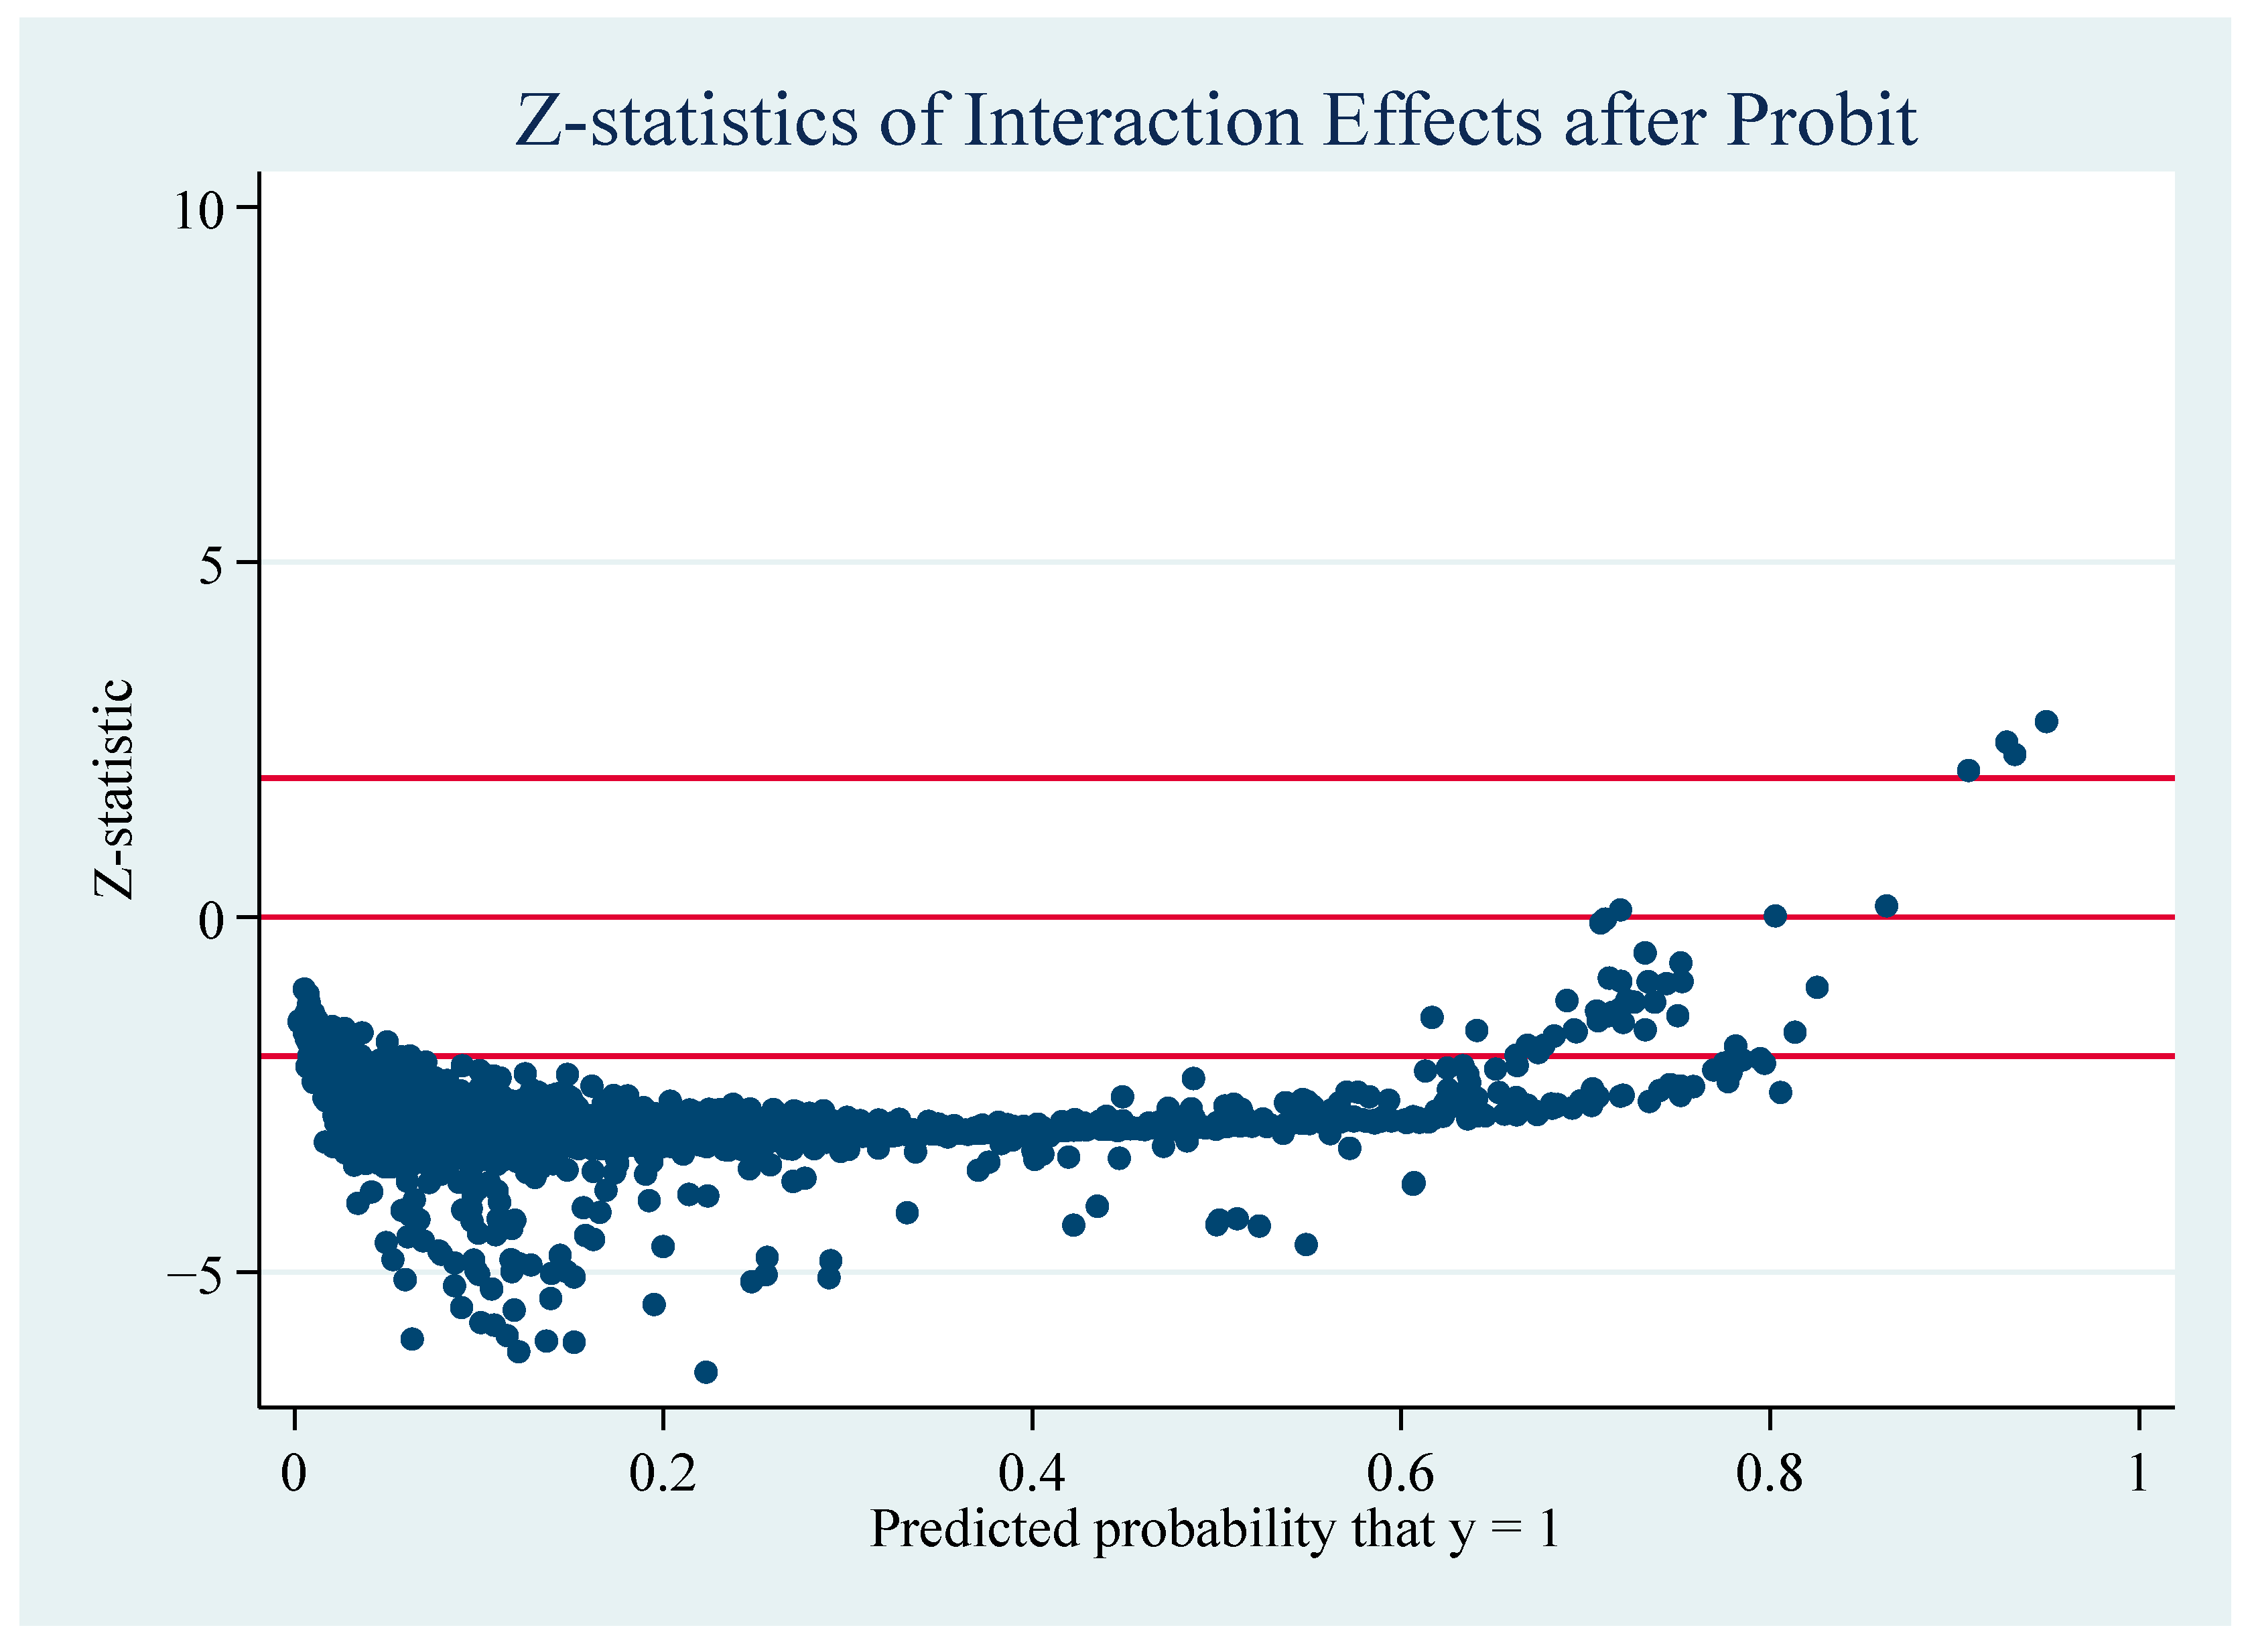
Figure A2.
Z-statistics for interaction terms with ownership concentration as the moderating variable.
Figure A2.
Z-statistics for interaction terms with ownership concentration as the moderating variable.

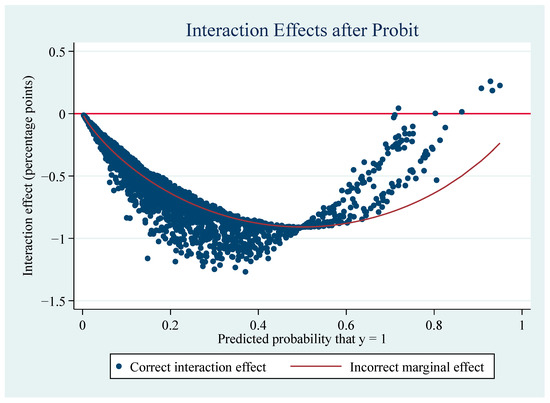
Figure A3.
Interaction effects with managerial overconfidence as the moderating variable.
Figure A3.
Interaction effects with managerial overconfidence as the moderating variable.
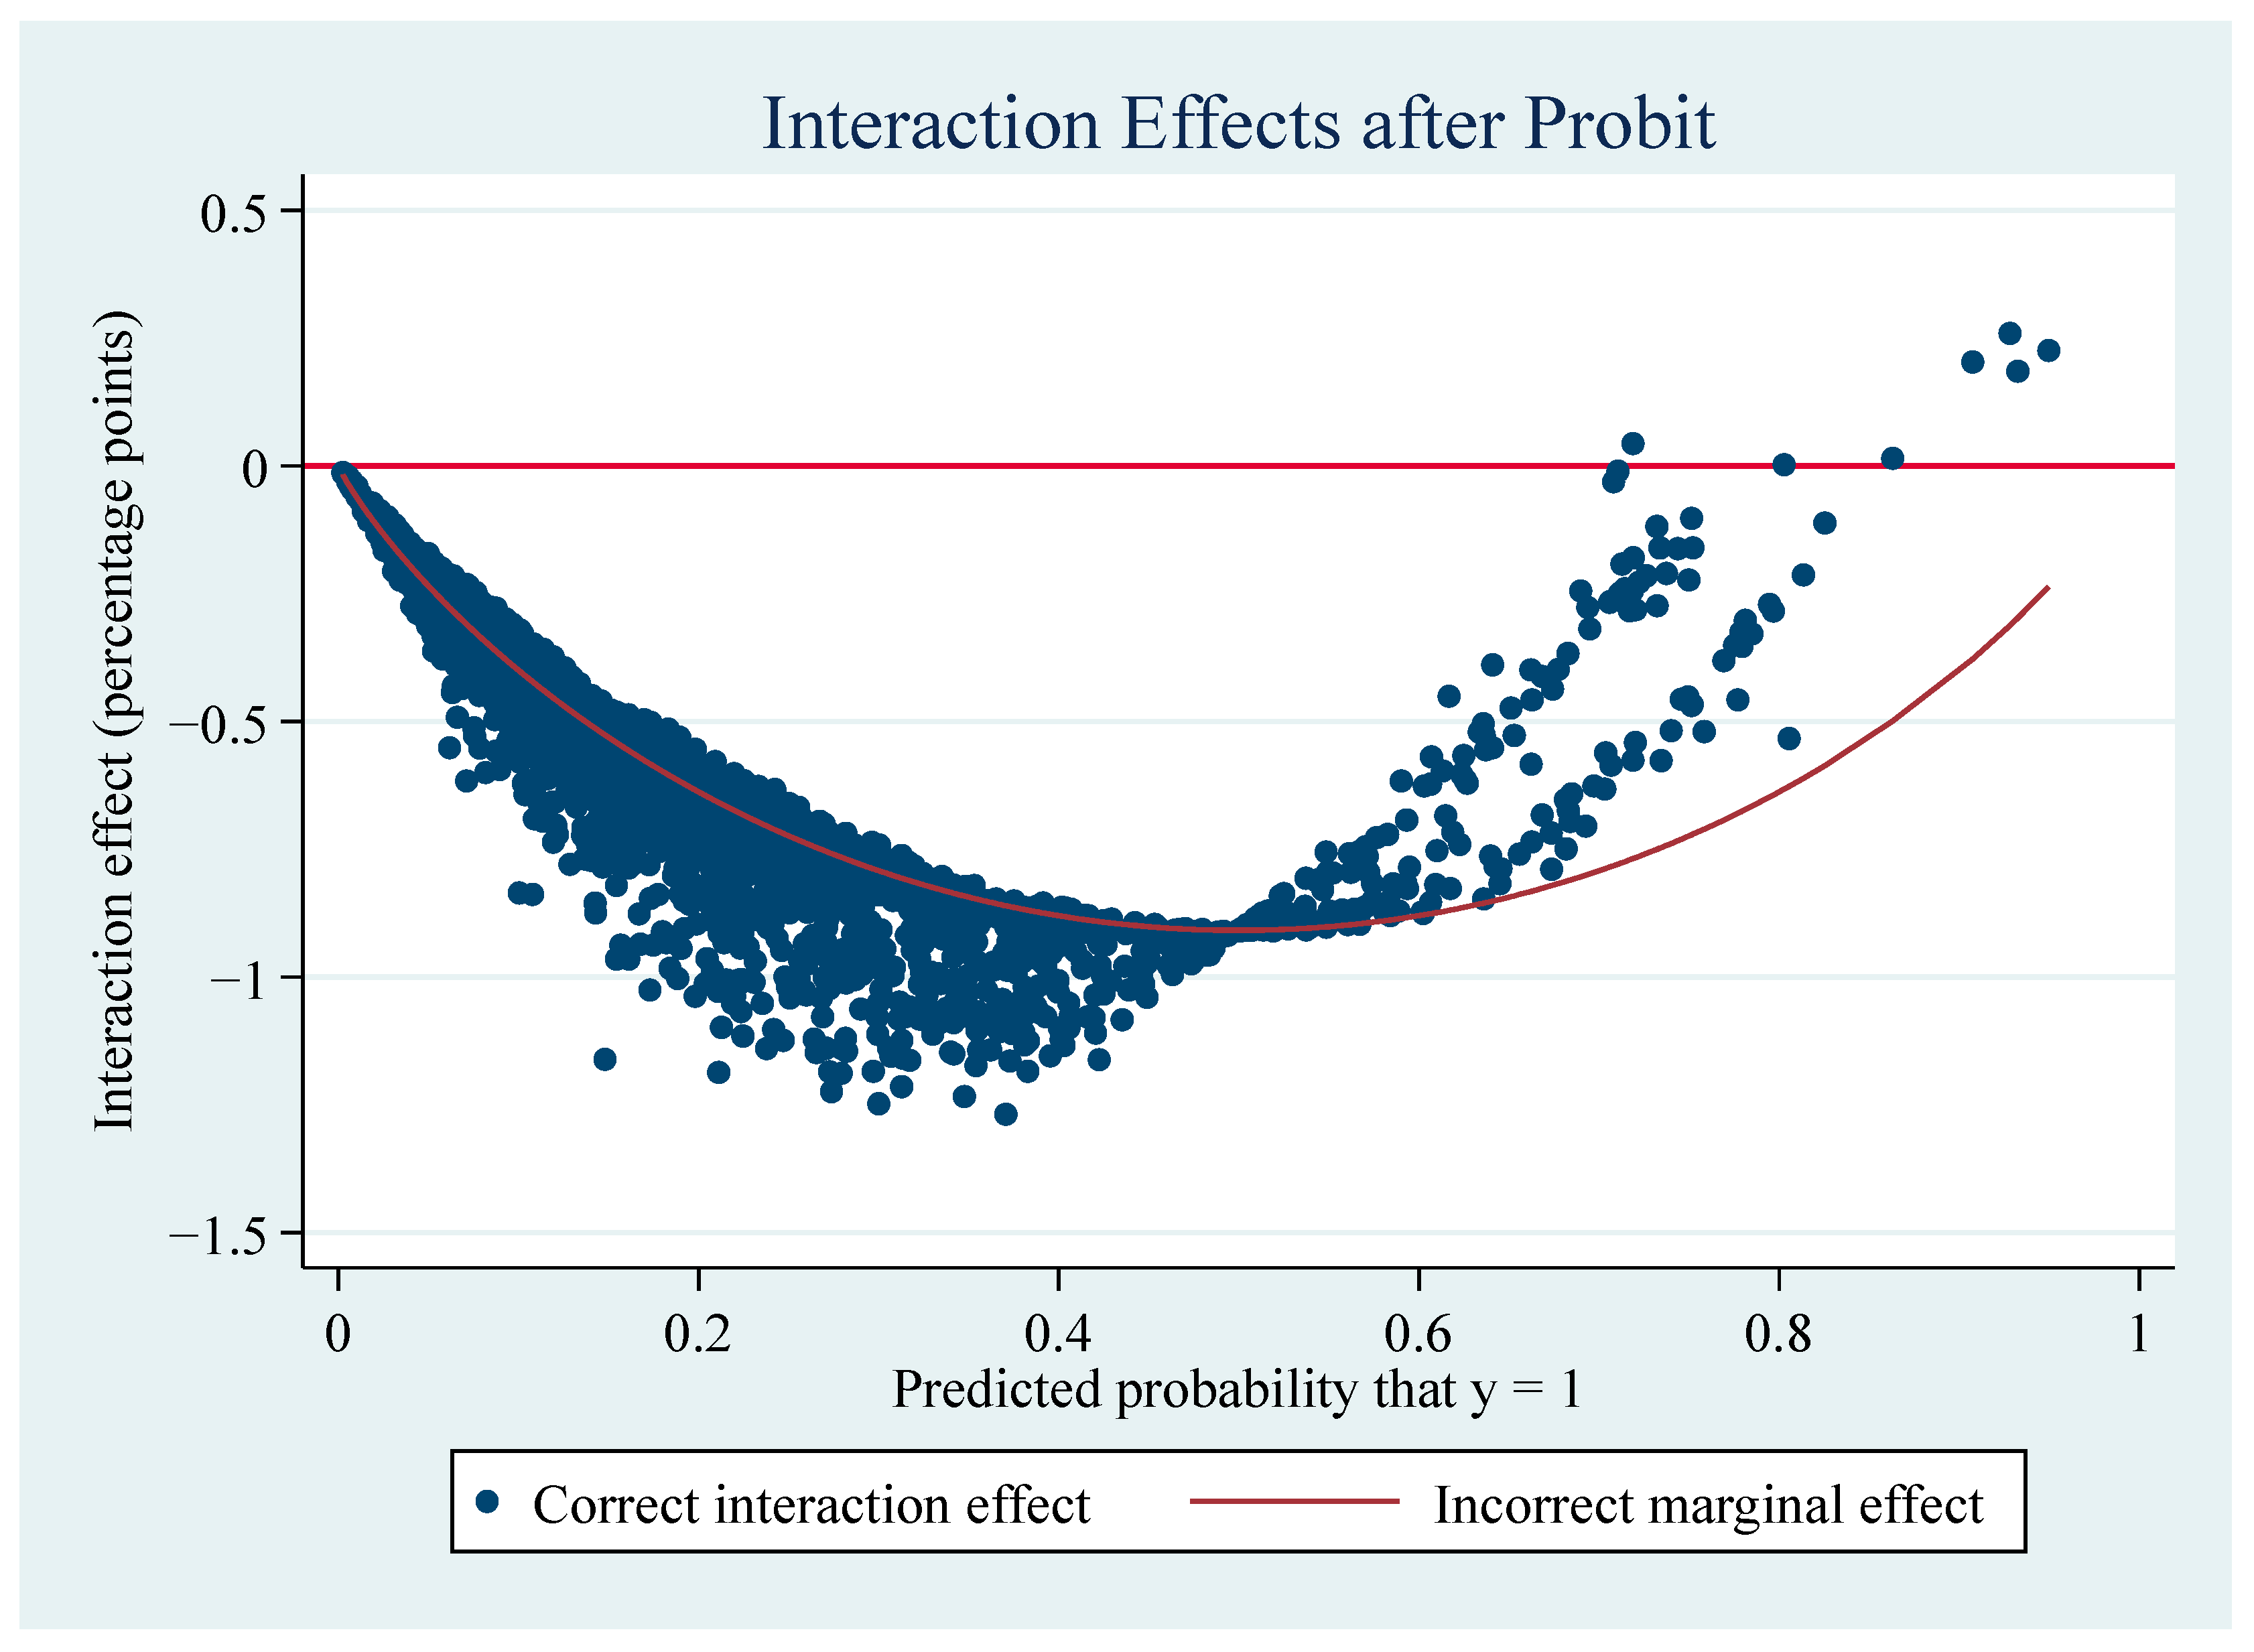
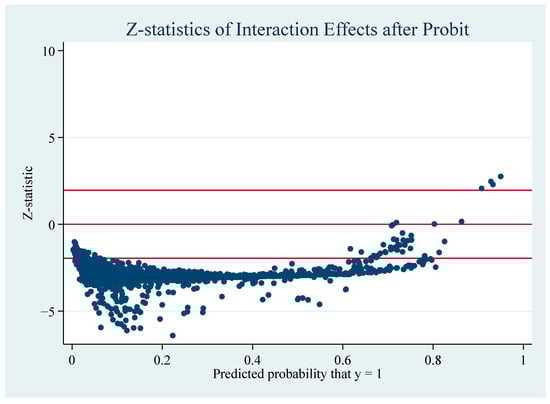
Figure A4.
Z-statistics for interaction terms with managerial overconfidence as the moderating variable.
Figure A4.
Z-statistics for interaction terms with managerial overconfidence as the moderating variable.
References
- Giglio, S.; Kelly, B.; Stroebel, J. Climate Finance. Annu. Rev. Financ. Econ. 2021, 13, 15–36. [Google Scholar] [CrossRef]
- Stroebel, J.; Wurgler, J. What Do You Think about Climate Finance? J. Financ. Econ. 2021, 142, 487–498. [Google Scholar] [CrossRef]
- Hu, X.; Zhu, B. Do Climate Risks Matter for Intersectoral Systemic Risk Spillovers? Evidence from China. Financ. Res. Lett. 2025, 75, 106873. [Google Scholar] [CrossRef]
- Task Force on Climate-Related Financial Disclosures|TCFD). Available online: https://www.fsb-tcfd.org/ (accessed on 3 December 2024).
- Azhgaliyeva, D.; Kapsalyamova, Z. Policy Support in Promoting Green Bonds in Asia: Empirical Evidence. Clim. Policy 2023, 23, 430–445. [Google Scholar] [CrossRef]
- Fatica, S.; Panzica, R. Green Bonds as a Tool against Climate Change? Bus. Strateg. Environ. 2021, 30, 2688–2701. [Google Scholar] [CrossRef]
- Flammer, C. Corporate Green Bonds. J. Financ. Econ. 2021, 142, 499–516. [Google Scholar] [CrossRef]
- Wu, S.; Zhou, Y.; Tang, G. Green bonds: Green technology innovation, environmental performance and firm value. J. Xiamen Univ. (A Q. Stud. Arts Soc. Sci.) 2022, 72, 71–84. [Google Scholar]
- Chen, Z.; Huang, L.; Wu, N. The Positive Impact of Green Bond Issuance on Corporate ESG Performance: From the Perspective of Environmental Behavior. Appl. Econ. Lett. 2024, 31, 1247–1252. [Google Scholar] [CrossRef]
- Dutordoir, M.; Li, S.; Neto, J.Q.F. Issuer Motivations for Corporate Green Bond Offerings. Br. J. Manag. 2024, 35, 952–973. [Google Scholar] [CrossRef]
- Chen, J.; Yang, Y.; Liu, R.; Geng, Y.; Ren, X. Green Bond Issuance and Corporate ESG Performance: The Perspective of Internal Attention and External Supervision. Humanit. Soc. Sci. Commun. 2023, 10, 437. [Google Scholar] [CrossRef]
- Yu, Q.; Hui, E.C.-M.; Shen, J. The Real Impacts of Third-Party Certification on Green Bond Issuances: Evidence from the Chinese Green Bond Market. J. Corp. Financ. 2024, 89, 102694. [Google Scholar] [CrossRef]
- García, C.J.; Herrero, B.; Miralles-Quirós, J.L.; Del Mar Mirallles-Quirós, M. Exploring the Determinants of Corporate Green Bond Issuance and Its Environmental Implication: The Role of Corporate Board. Technol. Forecast. Soc. Change 2023, 189, 122379. [Google Scholar] [CrossRef]
- Cheng, L.T.W.; Sharma, P.; Broadstock, D.C. Interactive Effects of Brand Reputation and ESG on Green Bond Issues: A Sustainable Development Perspective. Bus. Strateg. Environ. 2023, 32, 570–586. [Google Scholar] [CrossRef]
- Wang, S.; Chen, S.; Ali, M.H.; Tseng, M. Nexus of Environmental, Social, and Governance Performance in China-listed Companies: Disclosure and Green Bond Issuance. Bus. Strateg. Environ. 2024, 33, 1647–1660. [Google Scholar] [CrossRef]
- Riley, J. Informational equilibrium. Econometrica 1979, 47, 331–359. [Google Scholar] [CrossRef]
- Spence, M. Job Market Signaling*. Q. J. Econ. 1973, 87, 355–374. [Google Scholar] [CrossRef]
- Tan, X.; Dong, H.; Liu, Y.; Su, X.; Li, Z. Green Bonds and Corporate Performance: A Potential Way to Achieve Green Recovery. Renew. Energy 2022, 200, 59–68. [Google Scholar] [CrossRef]
- Fama, E.; French, K. Common Risk-Factors in the Returns on Stocks and Bonds. J. Financ. Econ. 1993, 33, 3–56. [Google Scholar] [CrossRef]
- Tao, R. Will climate risk intensify corporate tax avoidance? Financ. Econ. 2024, 1, 91–102. [Google Scholar]
- Dyreng, S.D.; Hanlon, M.; Maydew, E.L. The Effects of Executives on Corporate Tax Avoidance. Account. Rev. 2010, 85, 1163–1189. [Google Scholar] [CrossRef]
- Pankratz, N. Climate Change, Firm Performance, and Investor Surprises. Manag. Sci. 2023, 69, 7352–7398. [Google Scholar] [CrossRef]
- Chava, S. Environmental Externalities and Cost of Capital. Manag. Sci. 2014, 60, 2223–2247. [Google Scholar] [CrossRef]
- Zerbib, O. The Effect of Pro-Environmental Preferences on Bond Prices: Evidence from Green Bonds. J. Bank. Financ. 2019, 98, 39–60. [Google Scholar] [CrossRef]
- Wu, Y.; Tian, Y.; Chen, Y.; Xu, Q. Spillover effect, mechanism and performance of green bond issuance. Manag. World 2022, 38, 176–193. [Google Scholar] [CrossRef]
- Ruan, Q.; Li, C.; Lv, D.; Wei, X. Going Green: Effect of Green Bond Issuance on Corporate Debt Financing Costs. N. Am. J. Econ. Financ. 2025, 75, 102299. [Google Scholar] [CrossRef]
- Xie, X.; Han, Y. How can local manufacturing enterprises achieve “gorgeous transformation” in green innovation?—Multiple case studies based on the basic view of attention. Manag. World 2022, 38, 76–106. [Google Scholar] [CrossRef]
- Research Group of Institute of Industrial Economics of Cass; Li, P. Research on China’s industrial green transformation. China Ind. Econ. 2011, 4, 5–14. [Google Scholar] [CrossRef]
- Zhou, K.; Wang, R.; Tao, Y.; Zheng, Y. Corporate green transformation and stock price crash risk. J. Manag. Sci. 2022, 35, 56–69. [Google Scholar]
- Shen, H.; Huang, Z.; Guo, X. Confession or justification: A study on the relationship between corporate environmental performance and environmental information disclosure. Nankai Bus. Rev. 2014, 17, 56–63, 73. [Google Scholar]
- Liu, S.; Ma, L. The impact of green finance on the green transformation of manufacturing enterprises. Resour. Sci. 2023, 45, 1992–2008. [Google Scholar] [CrossRef]
- Zhang, K.; Xiong, Z.; Huang, X. Green bonds, carbon reduction effect and high-quality economic development. J. Financ. Econ. 2023, 49, 64–78. [Google Scholar] [CrossRef]
- Li, Z.; Huang, C.; Ma, Y. Regional differences and dynamics of ecological environment measurement in the Yellow River Basin: An empirical analysis based on the theory of strong sustainable development. J. Henan Norm. Univ. (Philos. Soc. Sci. Ed.) 2024, 51, 39–45. [Google Scholar] [CrossRef]
- Ba, S.; Cong, Y.; Zhu, W. Green bond theory and Chinese market development. J. Hangzhou Norm. Univ. (Soc. Sci. Ed.) 2019, 41, 91–106. [Google Scholar]
- Jensen, M.C.; Meckling, W.H. Theory of the Firm: Managerial Behavior, Agency Costs and Ownership Structure. J. Financ. Econ. 1976, 3, 305–360. [Google Scholar] [CrossRef]
- Munari, F.; Oriani, R.; Sobrero, M. The Effects of Owner Identity and External Governance Systems on R&D Investments: A Study of Western European Firms. Res. Policy 2010, 39, 1093–1104. [Google Scholar] [CrossRef]
- Xu, L.; Xin, Y.; Chen, G. Ownership concentration and equity balance and their impact on corporate performance. Econ. Res. J. 2006, 1, 90–100. [Google Scholar]
- Shleifer, A.; Vishny, R.W. Large Shareholders and Corporate Control. J. Polit. Econ. 1986, 94, 461–488. [Google Scholar] [CrossRef]
- He, Y.; Zhang, Y.; Mo, J. The impact of ownership concentration on corporate performance under different regional governance environments. J. Financ. Res. 2014, 12, 148–163. [Google Scholar]
- Zhao, H.; Chen, X.; Xia, H. An empirical study on corporate independent innovation input and gov-ernance structure characteristics. China Soft Sci. 2008, 7, 145–149. [Google Scholar]
- Xu, X.; Wang, Y. Ownership Structure and Corporate Governance in Chinese Stock Companies. China Econ. Rev. 1999, 10, 75–98. [Google Scholar] [CrossRef]
- Roll, R. The Hubris Hypothesis of Corporate Takeovers. J. Bus. 1986, 59, 197–216. [Google Scholar] [CrossRef]
- Pikulina, E.; Renneboog, L.; Tobler, P.N. Overconfidence and Investment: An Experimental Approach. J. Corp. Financ. 2017, 43, 175–192. [Google Scholar] [CrossRef]
- Ahmed, A.S.; Duellman, S. Managerial Overconfidence and Accounting Conservatism. J. Account. Res. 2013, 51, 1–30. [Google Scholar] [CrossRef]
- Landier, A.; Thesmar, D. Financial Contracting with Optimistic Entrepreneurs. Rev. Financ. Stud. 2009, 22, 117–150. [Google Scholar] [CrossRef]
- Park, J.H.; Noh, J.H. Relationship between Climate Change Risk and Cost of Capital. Glob. Bus. Financ. Rev. 2018, 23, 66–81. [Google Scholar] [CrossRef]
- Hong, H.; Li, F.W.; Xu, J. Climate Risks and Market Efficiency. J. Econom. 2019, 208, 265–281. [Google Scholar] [CrossRef]
- He, F.; Ren, X.; Wang, Y.; Lei, X. Climate Risk and Corporate Bond Credit Spreads. J. Int. Money Financ. 2025, 154, 103297. [Google Scholar] [CrossRef]
- Jiang, C.; Li, Y.; Zhang, X.; Zhao, Y. Climate Risk and Corporate Debt Decision. J. Int. Money Financ. 2025, 151, 103261. [Google Scholar] [CrossRef]
- Golosov, M.; Hassler, J.; Krusell, P.; Tsyvinski, A. Optimal Taxes on Fossil Fuel in General Equilibrium. Econometrica 2014, 82, 41–88. [Google Scholar]
- Zhu, W.; Li, S.; Su, H.; Yang, S. Identification of Systemic Financial Risks: The Role of Climate Risks. Financ. Res. Lett. 2025, 74, 106727. [Google Scholar] [CrossRef]
- Du, J.; Xu, X.; Yang, Y. Does climate risk affect the cost of equity capital? -- Empirical evidence from text analysis of Chinese listed companies’ annual reports. Chin. Rev. Financ. Stud. 2023, 15, 19–46+125. [Google Scholar]
- Xia, H.; Chen, X.; Wen, Y. Impact of transformation climate risk on carbon emission efficiency of energy enterprises from a policy perspective. China Soft Sci. 2024, S1, 118–124. [Google Scholar]
- Berkman, H.; Jona, J.; Soderstrom, N. Firm-Specific Climate Risk and Market Valuation. Account. Organ. Soc. 2024, 112, 101547. [Google Scholar] [CrossRef]
- Wang, C.-W.; Wu, Y.-C.; Hsieh, H.-Y.; Huang, P.-H.; Lin, M.-C. Does Green Bond Issuance Have an Impact on Climate Risk Concerns? Energy Econ. 2022, 111, 106066. [Google Scholar] [CrossRef]
- Loughran, T.; Mcdonald, B. When Is a Liability Not a Liability? Textual Analysis, Dictionaries, and 10-Ks. J. Financ. 2011, 66, 35–65. [Google Scholar] [CrossRef]
- Luo, Y.; Xiong, G.; Mardani, A. Environmental Information Disclosure and Corporate Innovation: The “Inverted U-Shaped” Regulating Effect of Media Attention. J. Bus. Res. 2022, 146, 453–463. [Google Scholar] [CrossRef]
- Xu, P.; Ye, P.; Jahanger, A.; Huang, S.; Zhao, F. Can Green Credit Policy Reduce Corporate Carbon Emission Intensity: Evidence from China’s Listed Firms. Corp. Soc. Resp. Env. Ma. 2023, 30, 2623–2638. [Google Scholar] [CrossRef]
- Xu, W.; Jiang, L. Research on micro-effects of green bond policy: From the perspective of corporate green Inno-vation. Wuhan Financ. Mon. 2023, 6, 22–30. [Google Scholar]
- Fan, B.; Sun, H. R&D investment, ownership concentration and company growth. J. Harbin Univ. Commer. (Soc. Sci. Ed.) 2023, 3, 35–46. [Google Scholar]
- Wu, S.; Qu, D.; Guo, Y.; Dong, J. Ownership concentration, management shareholding and enterprise green technology innovation. Financ. Res. 2023, 6, 80–89. [Google Scholar] [CrossRef]
- Zhang, F.; Jin, T.; Yang, C.; Zhang, W. Ownership concentration of listed companies and domestic green bond issuance scale. Rev. Invest. Stud. 2022, 41, 144–159. [Google Scholar]
- Wei, Z. Managerial overconfidence, Capital structure and firm performance. Ind. Tech. Econ. 2018, 37, 3–12. [Google Scholar]
- Pan, A.; Liu, W.; Wang, X. Managerial overconfidence, debt capacity and merger premium. Nankai Bus. Rev. 2018, 21, 35–45. [Google Scholar] [CrossRef]
- Wang, F.; Wang, Y.; Liu, S. Influence of media attention and managerial overconfidence on earnings management. Chin. J. Manag. 2022, 19, 832–840. [Google Scholar]
- Wen, Z.; Zhang, L.; Hou, J.; Liu, H. Mediating effect test program and its application. Acta Psychol. Sin. 2004, 5, 614–620. [Google Scholar]
- Baron, R.M.; Kenny, D.A. The Moderator–Mediator Variable Distinction in Social Psychological Research: Conceptual, Strategic, and Statistical Considerations. J. Personal. Soc. Psychol. 1986, 51, 1173–1182. [Google Scholar] [CrossRef]
- Ai, C.; Norton, E.C. Interaction Terms in Logit and Probit Models. Econ. Lett. 2003, 80, 123–129. [Google Scholar] [CrossRef]
- Guo, K.; Ji, Q.; Zhang, D. A Dataset to Measure Global Climate Physical Risk. Data Brief 2024, 54, 110502. [Google Scholar] [CrossRef]
- Fisman, R.; Svensson, J. Are Corruption and Taxation Really Harmful to Growth? Firm Level Evidence. J. Dev. Econ. 2007, 83, 63–75. [Google Scholar] [CrossRef]
- Xu, J.; Liao, H.; Yang, J. Government subsidies and corporate emissions: An empirical study based on micro-enterprises. Ind. Econ. Res. 2022, 4, 30–45. [Google Scholar] [CrossRef]
- Larcker, D.F.; Rusticus, T.O. On the Use of Instrumental Variables in Accounting Research. J. Account. Econ. 2010, 49, 186–205. [Google Scholar] [CrossRef]
- Bellemare, M.F.; Masaki, T.; Pepinsky, T.B. Lagged Explanatory Variables and the Estimation of Causal Effect. J. Politics 2017, 79, 949–963. [Google Scholar] [CrossRef]
- Yuan, W. Endogeneity test method, procedure and Stata application of binary selection model. Stat. Decis. 2018, 34, 15–20. [Google Scholar] [CrossRef]
- Adams, C.A.; Hill, W.-Y.; Roberts, C.B. Corporate social reporting practices in western europe: Legitimating corporate behaviour? Br. Account. Rev. 1998, 30, 1–21. [Google Scholar] [CrossRef]
- Yin, M.; Sheng, L.; Li, W. Executive motivation, innovation input and firm performance: An empirical study based on endogenous perspective. Nankai Bus. Rev. 2018, 21, 109–117. [Google Scholar]
Disclaimer/Publisher’s Note: The statements, opinions and data contained in all publications are solely those of the individual author(s) and contributor(s) and not of MDPI and/or the editor(s). MDPI and/or the editor(s) disclaim responsibility for any injury to people or property resulting from any ideas, methods, instructions or products referred to in the content. |
© 2025 by the authors. Licensee MDPI, Basel, Switzerland. This article is an open access article distributed under the terms and conditions of the Creative Commons Attribution (CC BY) license (https://creativecommons.org/licenses/by/4.0/).