Abstract
Industrial Internet Platforms (IIPs) provide critical value for supply chain management. The motivation for value creation and capture by supplier firms increasingly depends on acquiring and processing customer-oriented information, with geographical distance to customers being a key factor in assessing costs and benefits. This study investigates whether firms’ IIP adoption increases or decreases the geographical distance to their customers, utilizing supply chain data and digital transformation metrics from China’s A-share listed firms in the new energy vehicle industry. The study finds that an increased adoption level of IIPs by focal firms leads to a greater average geographical distance to their customers. This conclusion remains valid after addressing endogeneity concerns and performing several robustness checks. Moreover, the effect of IIP adoption on expanding the geographic scope of sales is significant when the focal firm is more specialized in the supply chain, more socially embedded, located in China’s eastern region, or acts as an upstream/downstream complement to complete vehicle manufacturers. No significant difference in the impact of IIP adoption is observed between private and state-owned enterprises. This study combines platform innovation and transaction cost theories, offering new insights and policy implications regarding the spatial impact of digital technology adoption in advanced manufacturing and related service industries.
1. Introduction
As globally competitive manufacturing industries increasingly shift towards high-end, intellectualized, and service-oriented development, Industrial Internet Platforms (IIPs) have been widely adopted across these industries and their related sectors [1,2]. IIPs refer to the integrated application of platform-centered digital tools [3,4]. The adoption of IIPs by enterprises is of critical importance for supply chain management, as these platforms transform massive data generated across the supply chain into valuable resources [5]. The concept of the IIP can be deconstructed into two components: the “industrial internet” or ”Internet of Things (IoT)” and the “platform”. First, consistent with the concept of Industry 4.0, the industrial internet enables the creation of cyber-physical systems with connectivity and intelligent analytics capabilities [6]. This facilitates the collection, systematic recording, and end-to-end transmission of real-time data and analytical results from dispersed endpoints across various locations [1]. Second, a platform serves as a mechanism that leverages network effects to bind participants together [7,8], integrating information and competencies from various supply chain stakeholders [9]. IIPs establish data-driven supply chain management models [10], which are expected to alter the intensity, modalities, and diversity of firms’ interactions with distant customers. While existing studies emphasize the technical capacities of IIPs, their spatial implications remain underspecified.
Due to increased product complexity and diverse customer demand patterns, suppliers’ ability to capture value has become increasingly dependent on acquiring and leveraging customer-end information [11,12]. Manufacturing firms focus on accurately forecasting volatile market demands, developing supply plans, optimizing logistics processes, and providing tailored services such as predictive maintenance [13]. Both manufacturers and information technology (IT) service providers must enhance their capabilities to deliver new, smarter products and services, thereby improving their reputations and expanding market share [14,15]. Geographical distance to customers is a critical factor for suppliers when evaluating costs and benefits, and it remains a paradoxical factor in supply chain governance [16]. Traditional frameworks posit that proximity reduces transaction costs [17,18], yet contemporary evidence reveals the value of distant relationships for knowledge diversification [19,20]. Given the critical role of geographical distance in shaping supplier–customer relationships, an important yet underexplored question arises: whether the adoption of IIPs by firms expands the physical space within which customer relationships are established.
The digital transformation literature reveals a fundamental contradiction regarding the impacts of platform-centered digital technologies on geographical distance to customers. One school, which values the enabling nature of digital technology across territories, stresses its capacity to mitigate information asymmetries caused by geographical distance [21], to establish multi-location supply networks [22,23,24], and to expand the geographic scope of business models [25]. In contrast, several studies suggest that intraregional knowledge spillovers and spatially concentrated digital infrastructures reinforce the geographic path dependence of supply chain distributions [26,27,28,29,30]. It can be inferred that, on the one hand, by adopting IIPs, firms broaden their information search across supply chains, enhancing their ability to perceive and monitor downstream market information and to assess opportunities and risks in distant markets. On the other hand, supply chain decisions based on IIP logic are also shaped by collective actions and knowledge bases influenced by historical and institutional contexts, resulting in supply chain structures that rely more on geographic agglomeration or proximity effects. Although existing studies have preliminarily revealed the spatial implications of digital transformation, few have explicitly measured the adoption levels of IIPs. Moreover, empirical analyses have largely relied on qualitative case studies, often lacking micro-level transaction data across large spatial scales. Hence, the dichotomy between the increasing and decreasing effects of IIPs on geographical distance to customers remains undertheorized, particularly within the context of a territory’s industrial sector as a whole and its innovation practices.
Does the adoption of IIPs increase or decrease the geographical distance to customers? To address this question, our study focuses on China’s new energy vehicle (NEV) industry as a case study, utilizing econometric modeling and micro-level operational data to examine the impact of IIP adoption by firms on their geographical proximity to customers. According to statistics from the Ministry of Industry and Information Technology (MIIT) of China, by the end of 2023, the number of IIPs in China exceeded 340, with more than 96 million industrial devices connected. IIPs have been deeply integrated into nearly all categories of manufacturing industries, generating extensive application data across R&D, production, and sales stages. This provides a reliable empirical setting for our study. China ranks first globally in NEV production, sales, and export volume. The functionalities, manufacturing technologies, and business models of NEVs are rapidly evolving. In NEV production organization, the hierarchical geographic structure based on modular subcontracting, characteristic of traditional fuel vehicle production, still plays a significant role [31,32]. This is primarily because a significant proportion of domestic NEV business is driven by joint ventures involving traditional automotive enterprises. However, with the widespread adoption of IIPs, the supply chain structure of the NEV industry has become more decentralized and is being reshaped by electronic and electrical companies, information and communication technology (ICT) firms, and emerging digital technology and internet enterprises. In addition, a national standard requires NEV manufacturers to collect electromechanical and navigational data and transmit it to a local server [33]. This “platform”, established to support official policy implementation, also serves as a foundation for studying how IIPs stimulate innovation and economies of scope within the NEV industry. In this study, A-share listed firms in the NEV industry were selected as the focal firms. Transaction data between these firms and their customers were aggregated from multiple data sources. The level of IIP adoption was measured using business information disclosed in the annual reports of the focal firms. The results of the econometric analysis confirm that higher levels of IIP adoption in NEV firms significantly increase the average geographical distance to their customers.
This study contributes to the existing literature in two key aspects. First, it examines the impact of IIPs on the geographical distance between firms and their customers, as well as the heterogeneity of this impact, thereby advancing our understanding of the factors shaping the spatial configuration of supply chains. Second, it connects platform innovation with transaction cost theory, suggesting a possible path for IIPs to influence the geography of production in advanced manufacturing and related service industries. This contributes to expanding the analytical framework for understanding the economic implications of digital technology adoption. Additionally, our research provides theoretical insights for policy-oriented practices. The Chinese government aims to promote the efficient domestic circulation of production and innovation factors while guiding the spatially rational distribution of strategic emerging industries. Within the context of integrating digital and physical dimensions, the NEV industry presents a compelling case for fostering industrial spaces that combine innovative vitality with resilience and security.
The structure of this paper is as follows. Section 2 introduces the related theories, the key characteristics of the NEV supply chain utilizing IIPs, and presents the core hypotheses of this study. Section 3 outlines the data and econometric methodology. Section 4 presents the analysis of results, including baseline results, robustness checks, and heterogeneity analysis. Section 5 concludes the paper and provides relevant policy implications.
2. Theoretical Foundations and Hypotheses
2.1. Theoretical Perspectives Relevant to IIP Adoption
2.1.1. Resource- and Capacity-Based View
The resource- and capacity-based view of the firm suggests that a company’s competitive advantage is grounded in its heterogeneity—resources and/or capabilities that are challenging for competitors to replicate [34,35]. This view is widely recognized as a fundamental lens through which digital technologies and the process of informatization shape a firm’s value and dominant logic [36]. In the context of rapidly changing market competition and the constant risk of supply chain disruptions, effective supply chain decision-making strongly depends on the ability to receive and process dynamic information [37]. As crucial organizational resources, digital technologies and data empower manufacturing or productive service firms to control and coordinate the resources they possess. To build a sustained competitive advantage, firms boost investments in both hardware and software related to information technology infrastructure and continuously improve production planning in alignment with their digital strategies [38,39].
2.1.2. Open Innovation Theory
Open innovation theory is another key framework for explaining the importance of IIPs within supply chains. The search for external information, technologies, and knowledge, and their integration into a firm’s capabilities, has become a primary pathway for fostering innovation [40]. A firm’s core competitiveness does not lie in digital devices or data themselves, but in its ability to extract value from vast amounts of data that can assist in achieving its supply chain business objectives [15]. Therefore, this involves platforms that integrate the interests of various supply chain stakeholders. The literature on platforms commonly identifies network effects as the key mechanism for linking participants [41]. In contrast to platform business models that emphasize transactions between consumer groups and final product sellers, the perspective of platform innovation, which emphasizes value co-creation, is more applicable to explaining the mechanisms of manufacturing supply chain platforms [42]. Specifically, the operation of supply chains is based on complementary components that make up the final product [43]. The network effects generated by supply chain platforms refer to the way changes in market demand for one complementary product lead to changes in others [44]. When changes in the production cost, efficiency, and innovation of one product are reflected in the market, other parties will rationally adjust their production plans to collaborate with the complementary party and jointly generate profits [45].
2.2. IIP System in the NEV Industry
In general, a platform is a type of technological architecture consisting of a sustainable core and flexible, modular components that can coordinate and unite innovative entities, enabling economies of scale and scope [46,47]. Modular product platforms are a common production organization method in the automotive industry. For a specific vehicle model, after determining the overall body structure, the automaker defines the chassis, structure, powertrain, electrical system, and other components along with their sub-modules, and designs standardized interfaces and assembly methods between the modules. Manufacturers along the supply chain adjust and develop corresponding products based on the unified modular rules [48]. This production method allows for mass production of standardized components, thereby amortizing fixed costs, while also meeting the needs of different market segments for various vehicle models [49].
In the NEV industry, the modular platform production model persists. However, a more significant observation is that IIPs have emerged as the central vector of the data-driven innovation process [50]. The physical architecture of an IIP system in the NEV industry is illustrated in Figure 1. At the edge layer, digital terminals collect data from manufacturing and distribution processes of automotive products, vehicle driving and usage scenarios, as well as road and environmental facility data, which are then uploaded to the cloud platform for information storage. At the platform layer, heterogeneous data from the entire manufacturing system and product lifecycle are integrated and processed. Industrial technologies, knowledge, experience, models, and other industrial principles are encapsulated within service function modules. At the application layer, participants across the supply chain access highly reusable data or invoke industrial software via application programming interfaces, thereby optimizing and adjusting production organization decisions.
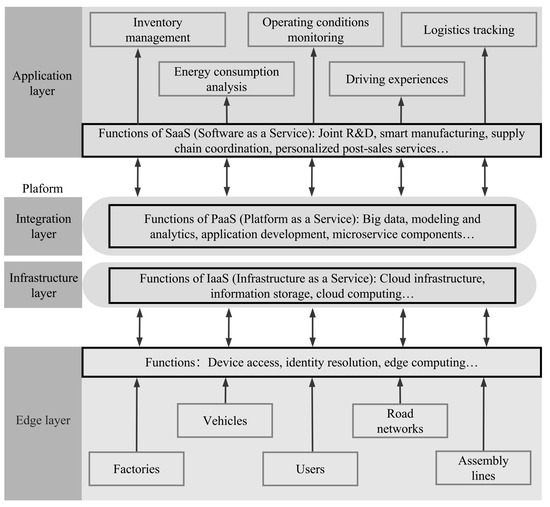
Figure 1.
The physical architecture of an IIP system in the NEV industry, adapted from reports by the Alliance for Industrial Internet (AII) [50,51].
According to the China–Germany White Paper for Industry 4.0 [52], Figure 2 illustrates the value creation logic across the NEV supply chain under the IIP framework, including three segments of the NEV supply chain that optimally represent the trend in automotive development [53]. The first segment is the electric drive system1. The second segment is the centralized electric control system. The third segment involves the aftermarket services related to energy and vehicle networking. From the perspective of the relationship between the focal firm and its customers, the firm located upstream in the supply chain is connected to its downstream customers through data or services facilitated by the IIP. Beyond the trade relationship between suppliers and customers, the operator of the IIP (the platform organization) charges certain fees to the suppliers or customers. Third-party complementary ICT firms or emerging digital technology companies may serve as outsourcing providers for platform services. The industry experience of platform organizations (or digital technology outsourcing providers), suppliers, and customers is deeply integrated and complementary, collectively contributing to the creation of customized supply chain solutions. Take the BYD DiLink Platform (the vehicle networking platform) as an example. Under the distributed arithmetic architecture facilitated by Huawei Cloud (the IIP operator), the Huawei HiCar operating system (the supplier) and BYD’s cabin system (the customer) are deeply integrated, enabling cross-terminal expansion of the cabin ecosystem. Huawei Cloud encapsulates core capabilities such as voice interaction from the intelligent cabin and deploys them as microservices to the DiLink system. This allows BYD to efficiently access Huawei’s AI resources, thereby reducing its reliance on traditional Tier 1 software providers.

Figure 2.
The value creation logic across the NEV supply chain under the IIP system, adapted from the joint report on “Industry 4.0 x Industrial Internet” published by Deutsche Gesellschaft für Internationale Zusammenarbeit (GIZ) and China Academy of Information and Communication Technology (CAICT) [52].
2.3. Impact of NEV Firms’ IIP Adoption on the Geographical Distance to Their Customers
This section explores the causal mechanisms underlying the impact of IIP adoption on changes in geographical distance, considering both increasing and decreasing effects. In each hypothesis derivation, economies of scale and knowledge sharing are identified as key factors influencing the geography of trade among NEV firms. Firstly, manufacturing supply chain interactions are more likely to occur when parties are geographically close [54]. Geographical proximity reduces logistics and communication costs, enhancing trust and operability in supply chain relationships. To capture sustained economies of scale around particular products, suppliers and customers in the capital- and asset-intensive automotive industry develop tight production networks. Additionally, localized cooperation facilitates market information circulating and technological collaboration among firms, increasing the potential to build innovation capabilities within the supply chain. The NEV innovation process, dominated by technology diffusion, urgently requires proximate forms of collaboration. IIP adoption influences both the economy of scale and knowledge sharing factors within NEV supply chains, subsequently affecting the geographical distance between suppliers and customers.
2.3.1. IIP Adoption Increases Geographical Distance to Customers
The cost of interacting with distant supply chain partners, a key factor of economies of scale, impedes the increase of geographical distance between trading parties. In the NEV industry, the need for electric drive functionality and driving experience results in a wide variety of electronic and electrical products. Accordingly, electrical and electronic control systems incorporate a variety of chips, sensors, and actuators [55]. Key components and integrated manufacturing of entire vehicles involve multiple stages, with parts sourced from various locations. The challenge for suppliers lies in consolidating information on sourcing, transportation, inventory, and product functionality. According to transaction cost theory, a firm’s selection of customers or the maintenance of customer relationships largely depends on the cost trade-offs associated with tasks such as matching requirements, signing contracts, delivering products, and monitoring after-sales [56]. Supply chain interactions over long geographical distances imply challenges in transportation and communication [17,57]. Due to information asymmetry, monitoring demand from distant customers becomes costly. If a firm allocates limited resources to distant markets, its operational flexibility is constrained, increasing the risk to supply chain resilience [58].
IIPs provide enterprises with enhanced visibility and flexibility in supply chain operations, potentially reducing the costs associated with interacting with distant clients. First, digital tools effectively reduce internal operational costs, enabling market expansion to distant locations [30]. The Internet of Things (IoT) is widely applied to monitor manufacturing processes and track logistics and warehouse operations [59], thereby enhancing the controllability and efficiency of internal operations. Second, by utilizing IIPs, focal companies can effectively identify and address opportunities and risks in distant markets. The platform provides real-time updates on order information, long-distance transportation conditions, and distribution processes, allowing enterprises to quickly adjust inventory plans [60]. Furthermore, big data analysis and artificial intelligence technologies support suppliers in forecasting future demand [61,62], facilitating timely formulation of new plans [6]. Therefore, IIP adoption by suppliers may increase the geographical distance to their customers (Figure 3).
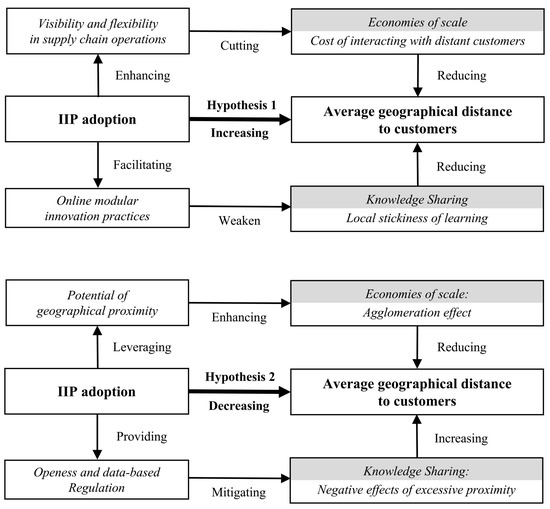
Figure 3.
Rationales of research hypotheses.
Local stickiness within knowledge sharing factors hinders the increase of geographical distance between trading parties. In the NEV industry, automakers’ platform-based vehicle architectures typically adopt a modular approach, such as Volkswagen’s MEB platform. Modular production theory posits that modular division of labor involves decomposing complex systems into relatively independent and interchangeable modules [63]. Modularity reduces firms’ reliance on highly coordinated production, enabling geographically dispersed suppliers to maintain trade relationships with complex product integrators [64]. However, the integration requirements for core components in electric power systems—namely batteries, motors, and electronic controls—are high, which conflicts with the low-coupling nature of modularity in the traditional sense [65]. Moreover, the development of autonomous driving technology necessitates deep interactions and iterations among sensors, algorithms, and data flows. Consequently, emerging automotive technology R&D increasingly integrates automakers, component suppliers, and digital technology firms through more tightly coupled interfaces. These knowledge-intensive processes continue to require geographical proximity to ensure effective collaborative innovation [66].
IIPs facilitate enterprises’ participation in online modular innovation practices, thereby fostering knowledge collaboration relationships with remote customers. Digital platforms establish the foundation for data exchange and sharing. Due to data homogeneity and reprogrammable functionality [67], the details of R&D tasks, experimental conditions, and technical parameters for digital products or services can be standardized within a highly visible data framework. This ensures that innovation-related information across the supply chain is accurately understood and repeatedly utilized. For instance, digital twin technology enables the creation of virtual models of products or algorithms and efficient simulation and optimization based on adjustable parameters, thereby reducing the costs associated with physical materials and face-to-face communication [68]. By aggregating diverse data sources and potential partners, IIPs allow suppliers to acquire third-party services that complement their capabilities. For example, cloud computing and other digital technologies integrated into industrial software can generate tailored manufacturing solutions [69]. Moreover, the openness and interoperability of platform data facilitate the integration of feedback of real-world applications and consumer scenarios into the R&D process, accelerating the dynamic evolution of NEV products toward sustainability [70]. For example, automakers can optimize power output modes based on users’ energy consumption patterns, while battery recycling firms can develop targeted recovery strategies by analyzing historical data on battery usage, failures, maintenance, and replacements [51]. On one hand, supplier firms leverage IIPs to directly collaborate with customers in developing innovative products or services. On the other hand, IIPs provide suppliers with greater access to innovation resources and third-party customization services, enabling them to engage more effectively in outsourced collaborations with geographically distant clients. Therefore, IIP adoption by suppliers may increase the geographical distance to their customers (Figure 3).
Hypothesis 1.
For the NEV industry, an increase in the adoption level of IIPs in the focal firm will increase the average geographical distance to its customers.
2.3.2. IIP Adoption Reduces Geographical Distance to Customers
The agglomeration effect, as a factor within economies of scale, contributes to the reduction of geographical distance between trading parties. From the perspective of industrial clusters, the forward and backward linkages within a region, the shared labor market, and the technological spillovers that foster innovation are the foundations for achieving innovation [71]. Shared physical spaces and infrastructure reduce transportation and information transmission costs [72]. Through “face-to-face” interactions, both codified knowledge and tacit knowledge about markets and technologies are effectively transmitted and absorbed [73]. The value and trust relationships formed between upstream and downstream products serve as the foundation for production networks across various manufacturing industries [74]. Additionally, these relationships are closely related to trade barriers and market segmentation resulting from regional policies [32].
IIPs unlock the potential of geographical proximity within supply chains, thereby enhancing regional agglomeration effects. First, the cognitive proximity advantage within the region is leveraged by IIPs. Compared to external supply chain partners, local partners have a better understanding of the region’s infrastructure, natural geography, user driving habits, and consumer demographics, thus making it easier to reach business consensus. The data exchange and management efficiency of the platform allow firms to quickly find high-quality local supply chain partners [75]. Second, the learning effect based on tacit knowledge exchange is reinforced by IIPs. Tacit knowledge developed at production sites and within supply chain operations is transmitted through socialization and experiential processes [76]. The platform provides external “channels” based on standardized interrelated relationships, supporting the dissemination of this knowledge in a more formal and visualized manner. Lastly, IIPs strengthen localized institutional arrangements based on interpersonal relationships. In local, small-scale exchanges, short-term training sessions, trade fairs, and similar events, suppliers root their industry experience and interpersonal relationships into the processes of order receipt, logistics, and after-sales services [77]. In regions with high digital accessibility, the prevalence of IIPs across the supply chain will increase, fostering more immediate and sustained online communication mechanisms [28]. Consequently, IIP adoption by suppliers may decrease the geographical distance to their customers (Figure 3).
Too much proximity in interactive learning hinders the reduction of geographical distance between trading parties. The proximity theory suggests that geographical proximity does not function in isolation. Rather, it is the deepening of other forms of proximity—such as cognitive, organizational, social, and institutional proximity—that serves as the key condition for knowledge flow and sharing within localized economies [74,78]. Furthermore, these proximities must remain within a moderate range to ensure the effectiveness of interactive learning. When proximity is excessively high, mediated relationships and environments become locked in and distort the firm’s ability to access, absorb, and process external information [79].
IIPs mitigate the constraints arising from excessive similarity in knowledge bases, organizational structures, or institutional cultures, thereby helping to alleviate the “lock-in” of spatial clustering. IIPs establish clear access standards, connection protocols, and interaction interfaces [75]. By increasing the frequency and precision of supplier–client interactions, it reduces the inertia associated with long-term contractual relationships in transaction selection [28,80]. The high traceability of data within IIPs facilitate accountability in product quality issues, minimizing opportunistic behaviors such as blame-shifting and free-riding [81]. Moreover, platform access control, selective encryption, and internal encoding mechanisms help prevent the leakage of proprietary data, thus reducing the risk of opportunism [82]. By forming virtual communities that connect platform participants beyond regional boundaries, IIPs enable the introduction of new intelligent technologies and business concepts [25], mitigating the risk of path dependency caused by product and cognitive homogeneity among geographically proximate firms [83]. Hence, IIP adoption by suppliers may decrease the geographical distance to their customers (Figure 3).
Hypothesis 2.
For the NEV industry, an increase in the adoption level of IIP in the focal firm will reduce the average geographical distance to its customers.
3. Methods and Data
3.1. Sample
This paper delineates the industrial chain segments and identifies representative companies based on the upstream and downstream relationships of core components in the NEV industry. The first step involved constructing a directory of NEV firms. Manufacturers of electric vehicle components were primarily selected from the industry chain maps provided by Zhongtou Consulting and Tianfeng Securities. Manufacturers of intelligent components and interconnected car service companies were mainly sourced from the Energy-saving and New Energy Vehicle Yearbook 2023 compiled by the MIIT. Complete vehicle manufacturers were selected from the Recommended Directory of New Energy Vehicles 2022 issued by the MIIT. The specific industry chain segments and companies are listed in Table 1. The second step involved filtering A-share listed companies from the China Stock Market & Accounting Research Database (CSMAR). A-share listed companies disclose relatively complete financial information and governance data. Additionally, their annual reports contain data suitable for calculating digital transformation, a method that is widely used in research on corporate performance and behavior [84,85]. The third step was to select 169 A-share listed companies from 2011 to 2022 as the final sample, which we referred to as “focal enterprises”. Since companies may go public or delist during the studied period, the sample is a non-balanced panel. The adoption of industrial internet platforms represents the transformation of traditional production systems through digital technologies, such as industrial internet technology, and is part of the broader digital transformation. Therefore, the observation period aligns with the starting point of the digital transformation database provided by CSMAR.

Table 1.
NEV industry chain segments and their corresponding representative enterprises.
3.2. Baseline Regression Model and Variables
3.2.1. Construction of Supply Chain Database
Existing supply chain partner data in research on listed companies are mostly based on the top five suppliers or customers disclosed in firms’ annual reports [11,86,87]. Directly transplanting this approach into this study may lead to significant data omissions and distortions. First, some companies do not disclose the specific names of their top five customers, making it impossible to obtain geographic locations. Second, this method may overlook clients with lower transaction volumes who nonetheless hold critical positions within the industry chain. Therefore, in addition to the top five customers, this study obtained sales information from buyer and seller announcements, bidding notices, prospectuses, and semi-annual reports of the focal enterprises, sourced through the Qichacha website2.
Additionally, companies do not always disclose all transactions. Transactions with related parties—entities closely connected to the companies (e.g., parent companies, subsidiaries, those with shared major investors or investment targets, or those with common management staff)—are often not conducted through public agreements or bidding processes. To address this, we supplemented the data with related-party transactions sourced from the CSMAR database.
The constructed database includes indicators such as focal firms, customer names, transaction dates, and transaction amounts. We further excluded natural clients, overseas clients, unidentified clients, and clients with unclear addresses to ensure data accuracy and consistency. Discrepancies in the timing of disclosures across data sources may lead to the same “Enterprise–Supplier–Amount” entries being erroneously interpreted as distinct transaction records due to differences in transaction dates. To address this, we established the following criterion: if two observations with the same “Enterprise–Supplier–Amount” are disclosed within a two-year window, they are considered identical transactions, and only the observation with the earlier disclosure date is retained. Conversely, observations with disclosure dates more than two years apart are treated as separate transactions. This pairwise comparison process is repeated iteratively until no duplicate observations remain. Ultimately, this process resulted in a dataset titled “Enterprise–Supplier–Year–Amount” comprising a total of 52,454 entries.
3.2.2. Baseline Regression Model
The model for the baseline regression is specified as follows:
Disti,t = α0 + α1IIPi,t + ∑αkControlsi,t + αhYear + μi + εi,t,
Disti,t represents the logarithmic value of the average geographical distance between the focal firm i and its customers in year t. IIPi,t denotes the adoption level of IIPs by the focal firm i in year t. Controlsi,t represents the control variables. Year is the year in which the transaction takes place. μi represents unobservable individual characteristics that remain constant over time for each firm. εi,t is the error term capturing all other unobserved factors affecting the dependent variable. All econometric models in this paper were performed by Stata 16.0.
3.2.3. Explained Variable: Average Geographical Distance to Customers
For focal firms and their customers, the geocoding function from the Baidu Maps Open Platform Web was used to obtain the longitude and latitude coordinates. The spherical geographical distance between the focal firm and the customer for each entry was then calculated, with the logarithm of this distance used as the dependent variable. The distance calculation formulas are derived using latitude and longitude coordinates, based on the spherical law of cosines. The distance calculation formulas are given below:
Disti,t = ln(1 + ∑Disti,c,t)
Disti,c,t = R × cos−1 [cosωi × cosωc × cos(φi − φc) + sinωi × sinωc]
Disti,t represents the logarithmic value of the average geographical distance between the focal firm i and its customer in year t. Disti,c,t denotes the geographical distance between the focal firm i and customer c in year t. R represents the Earth’s radius (approximately 6371 km). φi and ωi are the latitude and longitude of the focal firm i, while φc and ωc are the latitude and longitude of customer c.
3.2.4. Explanatory Variable: Frequency of IIP-Related Terms in Annual Reports
The adoption level of IIPs is reflected in the language used in the annual reports of publicly listed firms, which encapsulate the company’s business philosophy influenced by digital technologies, as well as the production processes and development paths guided by this philosophy. From the perspective of IIPs enabling the supply of NEV products, we categorized IIP applications in the industry into three levels: “Electrically powered drive systems”, “Information interconnected ecosystems”, and “Intelligent assisted driving” [88], and developed an IIP adoption guideline, which outlines key commodities or production capabilities at each application level.
Subsequently, based on the descriptions of IIP applications in the automotive industry from relevant reports and literature [51,53,88], we matched the vocabulary from CSMAR’s digital transformation database for listed firms with the IIP adoption guideline to create an IIP lexicon. The IIP adoption guideline and lexicon are presented in Table A1 of Appendix A. Following the approach of Wang et al. [89] for measuring artificial intelligence applications, the logarithmic frequency of terms from the IIP lexicon appearing in the focal enterprise’s annual report is used as the measure of the enterprise’s adoption level of IIPs.
3.2.5. Control Variables
The control variables include operational indicators at the firm level, such as the logarithm of the number of employees (Staff), liquidity as a percentage of total funds (Mobility), revenue growth rate (Growth), return on equity (ROE), and research and development investment intensity (RD) [24]. The digital infrastructure conditions in the region where the focal firm is located also influence supply chain distribution decisions [30]. The industrial data center system supports the application scenarios of IIPs at the foundational level. As users are closer to the data center hosting the cloud server, network latency decreases, making it more likely for them to follow the proximity principle to access cost-effective data services. Following Li et al. [90], we obtained the geographic coordinates of data centers in mainland China from the 451 Research Datacenter Knowledge Base. We then calculated the logarithmic average of the geographical distance between each focal enterprise and the data centers established in the same province or municipality. The reciprocal of this value is included as a control variable. Considering that the concentration of the supply chain may bias the calculation of average geographical distance, the logarithms of the supplier concentration (Concent_Sup) and customer concentration (Concent_Cus), calculated using the Herfindahl Index, are also added as control variables. Observations with missing records or anomalous positive/negative values were treated as missing values. These missing values were then imputed using multidimensional linear interpolation, with the correlation coefficients between variables serving as weights.
3.2.6. Variables for Heterogeneity Analysis
This study analyzes the heterogeneous effects of IIP application levels on customer geographical distance from the perspectives of specialization, social embedding, region, industry chain role, and ownership structure.
To measure the level of specialization, we established a cross-reference table between industry classification and NEV industry chain segments. We mapped the “Qichacha” industry classification to the NEV industry chain segments. Compared to the national economic industry classification, the “Qichacha” industry classification is more focused on specific product and service categories, offering a more intuitive display of the company’s business activities. For example, industries such as “Energy Storage Equipment”, “Power Generation Equipment”, “Electronic Terminals and Components”, “Special Equipment”, and “Chemical Products” correspond to the “Battery” segment in the NEV industry chain. We calculated the proportion of transaction frequencies between each focal firm and its NEV industry chain customers relative to the total number of sales transactions as a proxy for the level of specialization (SZ). To measure the degree of social embedding, we adopted the same concept used for related parties of listed companies, calculating the proportion of transactions with related customers relative to the total sales transactions of the focal firm (SE). The transaction data for related parties were sourced from the CSMAR.
Regional differences were categorized into two groups: the eastern region and non-eastern regions (i.e., central, western, and northeastern regions). The roles in the industry chain were categorized into two types: complete vehicle manufacturers and upstream/downstream enterprises. Ownership was categorized into state-owned enterprises (SOEs) and private enterprises. According to the definition of the A-share market, the Main Board firms are mature and well-financed, whereas those listed on the Growth Enterprises Market (GEM) or the Science and Technology Innovation Board (STAR) are mostly innovative small- and medium-sized enterprise (SMEs). Two-sample t-tests were conducted on the sample, revealing that companies on the STAR or GEM boards have smaller mean values for total assets and number of employees compared to those on the Main Board. However, they exhibit higher mean values for the level of digital supply (proportion of sales to digital information technology firms) and R&D investment intensity than Main Board companies. The distinction between listings on the GEM/STAR boards and the Main Board corresponds to markedly different innovation dynamics in terms of firm size, propensity for R&D, and level of digital supply.
Descriptive statistics of variables are presented in Table 2.
Table 2.
Descriptive statistics for variables.
4. Results
We adopt an empirical framework consisting of three stages: baseline regression results, robustness checks, and heterogeneity analysis, to present the study’s findings. The first two steps are designed to examine the main effect, while the third step represents an extended analysis building upon the established main effect. The specific navigation diagram is presented in Figure 4.
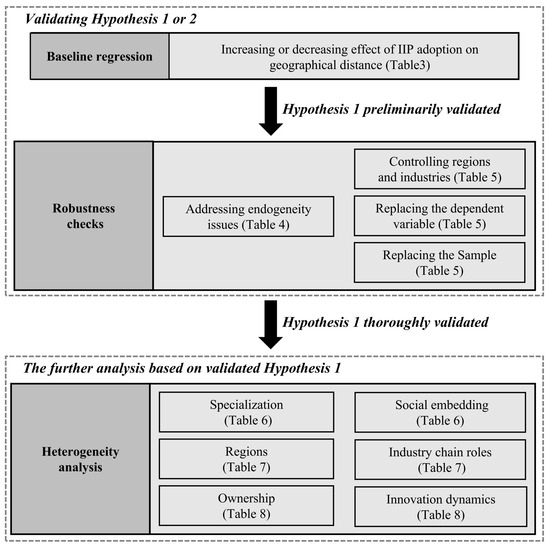
Figure 4.
Navigation diagram of empirical framework.
4.1. Analysis of Baseline Results
Based on the results of the two-way fixed effects models presented in Table 3, we can preliminarily determine the impact of IIP adoption by focal firms on the geographic distribution of their customers. Prior to introducing the explanatory variables, we performed a regression with only the dependent variable and control variables. Column (2) shows that for listed firms in the NEV industry, the adoption of the IIP shortens the average of geographic distances (p = 0.007) between them and their customers, after controlling for firm-level factors, inherent traits of individual firms, and time effects. Hypothesis 1 of this paper is basically confirmed. This indicates a likely trend of expanding the geographic structure of listed companies’ trade with clients as adoption levels of the IIP increase.
Table 3.
Results of baseline regressions.
4.2. Robustness Checks
4.2.1. Addressing Endogeneity Issues
The relationship between a firm’s adoption level of IIPs and its perceived geographic connection to its customers is somewhat endogenous, which impacts the reliability of causal inferences. For instance, if a firm’s customers are located far away from it, the firm may be naturally driven to adopt or increase the use of IIPs to maintain trade links via the virtual space enabled by communication technologies. Alternatively, there may be unobserved confounding factors. To address this, we use the instrumental variable method to avoid bias due to reverse causality and omitted variables.
This study employs two instrumental variables. The first instrumental variable is the five-year change in the number of data centers in the province where the focal firm is located, reflecting the growth of digital infrastructure. The second instrumental variable is the three-year lagged number of international internet users in the city where the firm is located, which indicates the level of digital service usage by residents. Digital infrastructure improves information transparency and online communication convenience. As a result, digital infrastructure development in a region increases the likelihood of local firms adopting digital technologies [12,91], meeting the requirement for correlation with the endogenous variable. Furthermore, we refer to data centers that primarily store and process data related to online activities such as surfing, social media, entertainment, e-commerce, and telecommunications, which do not directly influence the supply chain decisions of automotive manufacturing firms. This satisfies the exogeneity requirement for the instrumental variable, at least in theory. Similarly, the number of residents with internet access serves as a proxy for the extent of digital service utilization and the intensity of digital expenditure, which is closely related to the foundation for local firms’ digital transformation, but not directly tied to the incentives of firms serving downstream customers. First, we collected data on the inventory of data centers in each province over all years, then calculated the change in data center inventory compared to five years prior (Incre_DC). Next, we gathered data on the number of international internet users (IU) in each city for all years from the China City Statistical Yearbooks. The estimation was performed using the 2SLS method and the results are shown in Table 4.
Table 4.
Results for the instrumental variables approach.
The results of the second-stage regression provide several statistics on the reliability of the instrumental variables. The Kleibergen–Paap rk LM test rejects the “unidentifiable” null hypothesis, confirming that all model parameters are determined by the instrumental variables. The Kleibergen–Paap rk Wald F statistic exceeds the critical value from the Stock–Yogo weak ID test at the 10% level, confirming that the selected instrumental variables are not “weak” and are sufficiently correlated with the endogenous explanatory variable. The Hansen J test’s p-value exceeds 0.100, indicating no over-identification issues, meaning the instrumental variables are exogenous and uncorrelated with the model’s residuals. The first-stage regression result shows both the increase in data centers within the provinces where firms are located and the number of international internet users in their cities are correlated with IIP adoption. Column (2) shows that the result, corrected for endogeneity bias, indicates that increasing the adoption level of IIP by focal firms reduces the average physical distance to their customers. The coefficients on the explanatory variables are significantly larger than those in the main effects shown in Table 3. For each 10% increase in IIP-related terms, the mean distance to customers grows by approximately 4.29% on average. This effect is economically significant, given that the average annual growth rate of IIP-related terms in the sample firms’ annual reports from 2011 to 2022 is about 15.43%.
4.2.2. Controlling Regions and Industries
The region and industry to which a focal firm belongs may influence the estimated causal relationship. During the studied period, some enterprises changed their registration locations and industries. The baseline regression does not account for potential regional and industrial effects that could be omitted. Building on the baseline regression model, we introduce dummy variables to control for the province (or municipality directly under the central government) of the focal firm’s registered address and its corresponding national economic industry. Column (1) in Table 5 shows that, after controlling for region and industry, the effect of IIPs on the expansion of the supply chain’s geographical scope remains significant.
Table 5.
Results of robustness checks.
4.2.3. Replacing the Dependent Variable
To ensure the robustness of the estimates, we modify the interpretation of the dependent variable. In the regression model of Column (2) in Table 5, the dependent variable is replaced with the logarithm of the proportion of purchases made by distant customers in the focal firm’s total sales. To calculate this, we first excluded observations with only one transaction in a given year. We then used the median of the geographical distances between the focal firm and all its customers that year as the threshold. Customers whose geographical distance is greater than or equal to this median are classified as “distant customers”. Next, we calculate the proportion of the total transaction volume from distant customers relative to the firm’s total sales. Since the concentration of suppliers and customers is also calculated based on transaction volume, which may cause multicollinearity, we exclude these variables from the control variables in the alternative model. The regression results show that IIP adoption significantly increases the importance of distant customers, providing evidence of the effect of IIPs on expanding the geographical reach of the supply chain, particularly from the perspective of sales distribution.
4.2.4. Replacing the Sample
We use a balanced panel consisting of NEV firms that remained listed between 2013 and 2022. This sample highlights the stability of firms under the industrial policy and securities regulatory environment. First, in 2013, the State Council issued the “Several Opinions on Promoting the Deep Integration of Informationization and Industrialization”, marking the official launch of the strategic layout of the industrial Internet. In addition, leading companies such as Huawei, Alibaba, and Haier gradually began to deploy industrial internet and conducted pilot projects and applications starting from 2013. Second, we exclude the exogenous shocks related to the disclosure of operational data required by the China Securities Regulatory Commission, which occurred when focal firms were listed or delisted during the studied period. Column (3) in Table 5 shows that the impact of IIPs on the geographical distance remains significant.
4.3. Heterogeneity Analysis
Enterprises at various levels—organizational, industrial, and regional—differ in terms of access to external knowledge sources, diversity of industrial support, and the maturity of market development. These factors result in variations in how IIP application affects the geographical distance to customers. The heterogeneity effects of focal firms’ specialization and social embedding in downstream supply chains are shown in Table 6. The heterogeneity effects of regions and roles in the industry chain are displayed in Table 7. And the heterogeneity effects of ownerships and innovation dynamics are displayed in Table 8.
Table 6.
Results of heterogeneity analysis by specialization and social embedding.
Table 7.
Results of heterogeneity analysis by region and role in the industry chain.
Table 8.
Results of heterogeneity analysis by ownership and innovation dynamic.
4.3.1. Specialization
We group the samples based on the median value of SZ across all samples in the same year, distinguishing them by degree of specialization. It is assumed that when a focal company operates in a context of higher specialization, it has fewer cross-industry connections downstream, making it more reliant on IIPs to provide diverse market information and technical knowledge. In Table 6, column (1) shows that for NEV enterprises with higher specialization, the effect of IIPs on increasing geographical distance is significant. In contrast, column (2) shows that when they establish more relationships with clients outside the NEV industry, IIPs do not contribute to the expansion of their geographical sales range. This supports the heterogeneity effect of specialization on the extension of customer geographical distance via IIPs.
4.3.2. Social Embedding
The median value of SE across all samples within the same year is used as the threshold to define social embedding. We argue that clients with closer equity or managerial ties to the focal firms share similar cognitive foundations, decision-making habits, and technological capabilities. Therefore, enterprises whose sales are more dependent on affiliated parties are more likely to experience the “lock-in” effect of social embeddedness. Such firms require the openness provided by IIPs to enhance technical knowledge and seize market opportunities. The results in columns (3) and (4) of Table 6 support our hypothesis. When firms in the NEV industry are more embedded in socially networked relationships based on business ties, the effect of IIPs on geographical distance expansion is significant. No such effect of IIPs on geographical distance is observed when buyers are more distantly related to the firm.
4.3.3. Regions
Most NEV industry clusters are concentrated in the eastern region, due to its superior infrastructure, industrial support, and business environment compared to other regions. This study suggests that more developed regions are better positioned to leverage the positive impact of IIPs on geographical distance. On the one hand, the automotive supply network spans multiple clusters, with trade interactions and cooperative innovation ties between them being closely interconnected [92]. A reliable institutional foundation facilitates the establishment of standardized connections between geographically distant locations via IIPs. On the other hand, NEV enterprises in the eastern region need to explore larger market potentials to sustain ongoing investment in R&D and new product advancements, particularly in the context of the Chinese government’s commitment to building a unified national market. The central, western, and northeastern regions offer market potential for industrial gradient overflow and labor cost advantages, along with unique endowments in certain digital infrastructure and raw materials [93], such as data centers and key minerals in the western region. Regional advantages drive firms in the eastern region to establish long-distance trade links. Columns (1) and (2) in Table 7 display the regional differences, revealing that IIPs significantly increase the geographical distance to customers for enterprises located in the eastern region, while no such effect is observed in non-eastern regions.
4.3.4. Roles in the Industry Chain
The profitability of the NEV extends to both upstream and downstream segments of vehicle manufacturing, which means that the iteration speed of product performance, manufacturing technology, and business models is faster in these segments. Complete vehicle manufacturers are primarily responsible for integrating different modules to form a complete vehicle, and they follow relatively fixed technological paths and sales channels. In contrast, upstream and downstream manufacturers are engaged in the R&D and manufacturing of components for smart products and vehicle networking systems, requiring them to build strong information and innovation networks to access diverse knowledge. Columns (3) and (4) in Table 7 highlight the differences between roles in the industry chain, revealing that for upstream/downstream firms, the effect of IIPs on expanding the geographical distance to customers is significant, while no such effect is observed for complete vehicle manufacturers.
4.3.5. Ownership
Private enterprises, compared to SOEs, tend to have flatter internal organizational structures and employ more flexible approaches to market competition [94,95]. Thus, IIP adoption is assumed to play a crucial and effective role in helping private enterprises acquire complementary innovation capabilities. In contrast, the digital transformation dynamics and effectiveness of SOEs may be more limited [96]. Columns (1) and (2) in Table 8 show that, for both private enterprises and SOEs, IIPs significantly increase the geographical distance to customers, with the effect being even more pronounced for SOEs. Therefore, we cannot conclude that SOEs in the NEV industry lag behind private enterprises in utilizing IIPs to optimize the geographic distribution of their supply chains.
4.3.6. Innovation Dynamics
Innovative SMEs are vulnerable to digital transformation policies and market demand fluctuations, necessitating the urgent adoption of digital tools for supply chain integration [97]. As a result, innovative SMEs may excel in expanding the geographic distribution of their supply chains via IIPs compared to their larger counterparts. However, as shown in columns (3) and (4) of Table 8, the impact of IIPs on geographical distance is negligible for smaller GEM/STAR firms with higher levels of digitized supply, whereas it remains significant for Main Board firms. A plausible explanation is that, despite the relevance of their digital product offerings, innovative SMEs lack the dynamic capabilities and organizational resources necessary for market engagement [98]. These deficiencies hinder their ability to leverage digital capabilities effectively through IIPs, limiting their perceived value to geographically distant customers.
5. Conclusions and Discussion
In a product supply system characterized by time compression and spatial extension, IIP adoption plays a crucial role in supply chain management. This study addresses the paradox of the impact of IIPs on geographical distance to customers within the context of digital transformation, exploring the relationship between the adoption level of IIPs by listed companies in China’s NEV industry and the geographical distance to their customers. The model results confirm that an increase in the adoption level of IIPs by focal firms leads to a greater average geographical distance between them and their clients. This finding remains robust even after addressing endogeneity concerns and performing various robustness tests. Additionally, the effect of IIP adoption on geographical distance to customers exhibits heterogeneity. The effect of IIPs in expanding the geographic scope of sales holds only when the focal firm has a higher degree of specialization or social embedding within its supply chain. Furthermore, IIP adoption significantly increases the geographical distance to customers when the focal firm is located in China’s eastern region or acts as an upstream/downstream firm in the industry chain. Interestingly, no significant difference was found in the impact of IIP adoption between private enterprises and SOEs. Regardless of ownership type, IIPs help expand the geographical scale of downstream trading relationships. However, the impact of IIPs on increasing geographical distance to customers does not extend to innovative SMEs.
A study on the supply chain network of a large automotive group reveals that the production spatial layout of China’s automotive industry is highly dependent on the modular production model [32]. Due to reduced transportation costs and increased knowledge sharing, supply chains now favor cross-regional division of labor over local suppliers [32]. The development of NEV has contributed to a more geographically open industrial landscape, as suppliers of core components (batteries, motors, electric control systems) gain greater bargaining power, reducing the imperative to establish branches near downstream vehicle assembly plants [53]. The findings of this paper support the assertion that the information transparency and common data infrastructure provided by IIPs will further enhance the geographical decentralization at both ends of the product stream. Conversely, suppliers with diverse offerings foster flexibility in digital products and services, enabling them to reach geographically dispersed clients and maintain knowledge links that are not confined to specific regions. Consequently, the “beyond-locality” supply chain configuration has not created pronounced regional agglomeration effects and excessive geographic proximity that might be influenced by IIP adoption. The decreasing effect of IIPs on geographical distance was not confirmed.
In the context of China’s strategy to promote national economic circulation and create a unified national market, this study offers the following policy implications. First, there must be a clear understanding of the impact of new digital technologies on inter-organizational labor division, highlighting the potential spatial reconfiguration resulting from the integration of “digital” and “physical” elements in manufacturing and the transformation of services within the supply chain. Second, to better harness regional industrial advantages, it is crucial to build industrial internet infrastructure and establish appropriate institutional arrangements for IIPs. IIPs can attract external resource flows, complementing diverse knowledge assets. By fostering a diverse creative environment and establishing decentralized governance models, geographically proximate clusters can be revitalized. Third, to enhance the spatial flexibility of the supply chain, enterprises must align their business development strategies with digital production factors and leverage IIPs to broaden market opportunities and partnership options. Fourth, the government should design and implement heterogeneous IIP application promotion policies tailored to the specific characteristics of enterprises, including their varying degrees of specialization, levels of social embeddedness, geographic regions, positions within the industrial chain, and intensity of digital innovation. For entities demonstrating significant IIP effects, priority should be given to establishing pilot programs. Conversely, for those with less pronounced effects, a phased promotion strategy combined with differentiated subsidy schemes should be adopted.
The research limitations of this paper and the corresponding future research avenues regarding this topic are as follows. Firstly, this study focuses on the context of China’s NEV industry; thus, the generalizability of the conclusions regarding the effect of IIP adoption on supply chain geography may be limited. Across different industries, the relevance and impact of industrial specialization and collaborative innovation on supply chain geography vary significantly, potentially leading to differences in the geographic effects of IIPs. Furthermore, across countries, beyond industry-level factors, variations in economic and socio-institutional contexts may further shape the effect of IIPs through other elements within national innovation systems. In light of these considerations, we call for additional complementary evidence or perspectives from cross-industry and cross-country comparative studies to deepen our understanding of the relationship between IIPs and geographic proximity to customers. Secondly, it is observed that the applicability of IIP effects may not extend to innovative SMEs. Nonetheless, these firms often possess favorable resources for digital transformation. To broaden the research scope and include “grassroots” firms—those less driven by capital markets—future research should shift its focus to non-listed companies. This represents an important and promising avenue for investigation. Thirdly, while this study validates the main effects of IIP adoption, the mechanism through which IIP adoption influences the geographical distribution of supply chains remains unclear. Future research employing large-scale surveys with econometric methods, complemented by case studies focusing on specific firms or their production processes, could provide valuable insights into this topic.
Author Contributions
Conceptualization, J.L.; methodology, J.L. and X.L.; validation, J.L. and W.M.; formal analysis, J.L.; resources, J.L.; data curation, J.L. and X.L.; writing—original draft preparation, J.L.; writing—review and editing, J.L.; visualization, J.L., X.L. and W.M.; project administration, J.L. and W.M. All authors have read and agreed to the published version of the manuscript.
Funding
This research was funded by the National Natural Science Foundation of China, grant number 42171179, and the National Social Science Fund of China, grant number 20BJL109.
Data Availability Statement
The data presented in this study are available on request from the corresponding author due to the fact that the data involves access to databases purchased by the authors’ affiliated research organizations.
Acknowledgments
The authors appreciate the assistance of Xue Lan, a student at the School of Geographic Sciences, East China Normal University, in the programming work for data collection and curation.
Conflicts of Interest
The authors declare no conflicts of interest.
Abbreviations
| IIPs | Industrial Internet Platforms |
| NEV | new energy vehicle |
| IoT | Internet of Things |
| MIIT | the Ministry of Industry and Information Technology of China |
| M | state-owned enterprise |
| ICT | information and communication technology |
| CSMAR | China Stock Market & Accounting Research Database |
| SMEs | small- and medium-sized enterprise |
Appendix A
The IIP adoption guidelines and lexicon are presented in Table A1.
Table A1.
IIP adoption guidelines and lexicon in NEV industry.
Table A1.
IIP adoption guidelines and lexicon in NEV industry.
| Layers | Guideline | Lexicon |
|---|---|---|
| Electrically powered drive systems | Vehicle manufacturability Production capacity Joint R&D of battery and powertrain Intelligent manufacturing Charging and switching facility operation Electricity grid management | Intelligent Data Analytics/Distributed Computing/Decentralized/Internet of Things/Edge Computing/Multi-Party Secure Computing/Converged Architecture/Mobile Computing/Data Visualization/Heterogeneous Data/Intelligent Terminals/Intelligent Information Systems/Cloud Platforms/Cloud Systems/Cloud Devices/Cloud Facilities/Cloud Terminals/Big Data Platforms/Big Data Devices/Big Data Information Systems/Industrial Internet/Digital Technology/5G Technology/Smart Manufacturing/Smart Power Grid/Smart Energy |
| Information interconnected ecosystems | Electrical and electronic architecture Semiconductors Smart cockpit Center console Smart chassis Internet infrastructure Internet-enabled service content User experiences regarding connected automobiles B2B data services | Artificial Intelligence/Intelligent Data Analytics/Machine Learning/Semantic Search/Face Recognition/Speech Recognition/Identity Verification/Intelligent Q&A/Distributed Computing/Decentralized/Internet of Things/Edge Computing/Multi-Party Secure Computing/Converged Architecture/Mobile Computing/Big Data/Data Mining/Augmented Reality/Mixed Reality/Virtual Reality/Intelligent Terminals/Intelligent Information Systems/Cloud Platforms/Cloud Systems/Cloud Equipment/Cloud Facilities/Cloud Terminal/Big Data Platform/Big Data Facility/Big Data Equipment/Big Data Information System/Artificial Intelligence Platform/Artificial Intelligence Infrastructure/Artificial Intelligence Equipment/Artificial Intelligence System/Mobile Internet/Industrial Internet/Digital Technology/Human–Computer Interaction/Intelligent Planning/Intelligent Optimization/Intelligent Environmental Protection/Smart Grid/Smart Transportation/Internet+ |
| Intelligent assisted driving | Complete vehicle manufacturing | Artificial Intelligence/Image Understanding/Supervised Learning/Deep Learning/Computer Vision/Unmanned Driving/Data Mining/Learning Algorithms/Autonomous Driving/Intelligent Terminal/Intelligent Information System/Cloud Platform/Cloud System/Cloud Devices/Cloud Facilities/Cloud Terminal/Big Data Platform/Big Data Facilities/Big Data Equipment/Big Data Information System/Artificial Intelligence Platform/Artificial Intelligence Infrastructure/Artificial Intelligence Equipment/Artificial Intelligence System/Mobile Internet/Digital Technology/Human–Computer Interaction/Intelligent Planning/Intelligent Optimization/Intelligent Transportation/Internet+ |
Notes
| 1 | In this paper, NEV is defined as a vehicle that relies entirely or mainly on new types of sources of energy, including pure electric vehicles (EV), plug-in hybrid electric vehicles (PHEV), and fuel cell vehicles (FCEV), which is in line with MIIT. |
| 2 | Qichacha (https://www.qcc.com/) is a commercial database focused on enterprises, drawing data from the national enterprise credit information public system and various public databases, including business registration information and other publicly available records. |
References
- Wollschlaeger, M.; Sauter, T.; Jasperneite, J. The future of industrial communication: Automation networks in the era of the internet of things and industry 4.0. IEEE Ind. Electron. Mag. 2017, 11, 17–27. [Google Scholar]
- Lu, Y.; Xu, X.; Wang, L. Smart manufacturing process and system automation–A critical review of the standards and envisioned scenarios. J. Manuf. Syst. 2020, 56, 312–325. [Google Scholar]
- Mayer, S.; Hodges, J.; Yu, D.; Kritzler, M.; Michahelles, F. An open semantic framework for the industrial internet of things. IEEE Intell. Syst. 2017, 32, 96–101. [Google Scholar] [CrossRef]
- Yang, C.; Shen, W.; Wang, X. The internet of things in manufacturing: Key issues and potential applications. IEEE Syst. Man Cybern. Mag. 2018, 4, 6–15. [Google Scholar] [CrossRef]
- Büyüközkan, G.; Göçer, F. Digital supply chain: Literature review and a proposed framework for future research. Comput. Ind. 2018, 97, 157–177. [Google Scholar]
- Yang, M.; Fu, M.; Zhang, Z. The adoption of digital technologies in supply chains: Drivers, process and impact. Technol. Forecast. Soc. Chang. 2021, 169, 120795. [Google Scholar]
- Jacobides, M.G.; Cennamo, C.; Gawer, A. Towards a theory of ecosystems. Strateg. Manag. J. 2018, 39, 2255–2276. [Google Scholar] [CrossRef]
- Li, Z.; Chen, J.; Li, Z.; Zhang, Y. Strengthen or weaken? How industrial internet platform affects the core competitiveness of manufacturing companies. Oper. Manag. Res. 2024, 17, 220–232. [Google Scholar]
- Roßmann, B.; Canzaniello, A.; von der Gracht, H.; Hartmann, E. The future and social impact of Big Data Analytics in Supply Chain Management: Results from a Delphi study. Technol. Forecast. Soc. Chang. 2018, 130, 135–149. [Google Scholar]
- Waller, M.A.; Fawcett, S.E. Data science, predictive analytics, and big data: A revolution that will transform supply chain design and management. J. Bus. Logist. 2013, 34, 77–84. [Google Scholar] [CrossRef]
- Gu, J.; Shi, X.; Wang, P.; Xu, X. Examining the impact of upstream and downstream relationship stability and concentration on firms’ financial performance. J. Bus. Res. 2022, 141, 229–242. [Google Scholar] [CrossRef]
- Guo, C.; Ke, Y.; Zhang, J. Digital transformation along the supply chain. Pac.-Basin Finance J. 2023, 80, 102088. [Google Scholar] [CrossRef]
- Arunachalam, D.; Kumar, N.; Kawalek, J.P. Understanding big data analytics capabilities in supply chain management: Unravelling the issues, challenges and implications for practice. Transp. Res. Part E Logist. Transp. Rev. 2018, 114, 416–436. [Google Scholar]
- Seethamraju, R. Enterprise systems and demand chain management: A cross-sectional field study. Inf. Technol. Manag. 2014, 15, 151–161. [Google Scholar] [CrossRef]
- Porter, M.E.; Heppelmann, J.E. How smart, connected products are transforming competition. Harv. Bus. Rev. 2014, 92, 64–88. [Google Scholar]
- Wei, S.; Sheng, S. Does geographic distance to customers improve or inhibit supplier innovation? A moderated inverted-U relationship. Ind. Mark. Manag. 2023, 108, 134–148. [Google Scholar] [CrossRef]
- Bode, C.; Wagner, S.M.; Petersen, K.J.; Ellram, L.M. Understanding responses to supply chain disruptions: Insights from information processing and resource dependence perspectives. Acad. Manag. J. 2011, 54, 833–856. [Google Scholar] [CrossRef]
- Baldwin, R.E. Global Supply Chains: Why They Emerged, Why They Matter, and Where They are Going; CEPR Discussion Paper; Fung Global Institute: Hong Kong, China, 2012. [Google Scholar]
- Letaifa, S.B.; Rabeau, Y. Too close to collaborate? How geographic proximity could impede entrepreneurship and innovation. J. Bus. Res. 2013, 66, 2071–2078. [Google Scholar] [CrossRef]
- Gao, J.; Huang, F. Major-customer geographic proximity and supplier trade credit: Empirical evidence from China. Appl. Econ. 2024, 56, 4289–4314. [Google Scholar]
- Goldfarb, A.; Tucker, C. Digital economics. J. Econ. Lit. 2019, 57, 3–43. [Google Scholar] [CrossRef]
- Strange, R.; Zucchella, A. Industry 4.0, global value chains and international business. Multinatl. Bus. Rev. 2017, 25, 174–184. [Google Scholar] [CrossRef]
- Bernard, A.B.; Moxnes, A.; Saito, Y.U. Production networks, geography, and firm performance. J. Political Econ. 2019, 127, 639–688. [Google Scholar] [CrossRef]
- Li, W.; Liu, H.; Long, Z.; Tang, X. Enterprise Digital Transformation and the Geographic Distribution of Supply Chain. Quant. Technol. Econ. 2023, 40, 90–110. [Google Scholar]
- Nambisan, S. Digital entrepreneurship: Toward a digital technology perspective of entrepreneurship. Entrep. Theory Pract. 2017, 41, 1029–1055. [Google Scholar] [CrossRef]
- Akerman, A.; Leuven, E.; Mogstad, M. Information frictions, internet, and the relationship between distance and trade. Am. Econ. J. Appl. Econ. 2022, 14, 133–163. [Google Scholar] [CrossRef]
- Attaran, M. Digital technology enablers and their implications for supply chain management. Supply Chain Forum Int. J. 2020, 21, 158–172. [Google Scholar] [CrossRef]
- Autio, E.; Nambisan, S.; Thomas, L.D.; Wright, M. Digital affordances, spatial affordances, and the genesis of entrepreneurial ecosystems. Strateg. Entrep. J. 2018, 12, 72–95. [Google Scholar] [CrossRef]
- Forman, C.; Goldfarb, A.; Greenstein, S. The Internet and local wages: A puzzle. Am. Econ. Rev. 2012, 102, 556–575. [Google Scholar]
- Ji, J.; Wang, Y. The impact of digital infrastructure on the geographical supply chain layout of firms—Evidence from Chinese microdata. China Econ. Rev. 2024, 87, 102249. [Google Scholar] [CrossRef]
- Lüthje, B. China’s industrial internet: Platform-based manufacturing and restructuring of value chains. In China’s New Development Strategies: Upgrading from Above and from Below in Global Value Chains; Gereffi, G., Bamber, P., Fernandez-Stark, K., Eds.; Springer: Singapore, 2022; pp. 33–59. [Google Scholar]
- Zhao, Z.; Wang, S.; Chen, X. Beyond locality in restructuring the spatial organization of China’s automobile industry clusters under modular production: A case study of FAW-Volkswagen. Acta Geogr. Sin. 2021, 76, 1848–1864. [Google Scholar]
- Martens, B.; Zhao, B. Data access and regime competition: A case study of car data sharing in China. Big Data Soc. 2021, 8, 20539517211046374. [Google Scholar] [CrossRef]
- Penrose, E.T. The Theory of the Growth of the Firm; Oxford University Press: Oxford, UK, 2009. [Google Scholar]
- Barney, J. Firm resources and sustained competitive advantage. J. Manag. 1991, 17, 99–120. [Google Scholar] [CrossRef]
- Shibin, K.; Dubey, R.; Gunasekaran, A.; Hazen, B.; Roubaud, D.; Gupta, S.; Foropon, C. Examining sustainable supply chain management of SMEs using resource based view and institutional theory. Ann. Oper. Res. 2020, 290, 301–326. [Google Scholar] [CrossRef]
- Trujillo-Gallego, M.; Sarache, W.; de Sousa Jabbour, A.B.L. Digital technologies and green human resource management: Capabilities for GSCM adoption and enhanced performance. Int. J. Prod. Econ. 2022, 249, 108531. [Google Scholar] [CrossRef]
- Zhang, Y.; Li, R.; Xie, Q. Does digital transformation promote the volatility of firms’ innovation investment? Manag. Decis. Econ. 2023, 44, 4350–4362. [Google Scholar] [CrossRef]
- Chae, H.-C.; Koh, C.E.; Park, K.O. Information technology capability and firm performance: Role of industry. Inf. Manag. 2018, 55, 525–546. [Google Scholar] [CrossRef]
- Laursen, K.; Salter, A. Open for innovation: The role of openness in explaining innovation performance among UK manufacturing firms. Strateg. Manag. J. 2006, 27, 131–150. [Google Scholar] [CrossRef]
- Rochet, J.-C.; Tirole, J. Platform competition in two-sided markets. J. Eur. Econ. Assoc. 2003, 1, 990–1029. [Google Scholar] [CrossRef]
- Gawer, A.; Cusumano, M.A. Industry platforms and ecosystem innovation. J. Prod. Innov. Manag. 2014, 31, 417–433. [Google Scholar] [CrossRef]
- Jacobides, M.G.; Winter, S.G. The co-evolution of capabilities and transaction costs: Explaining the institutional structure of production. Strateg. Manag. J. 2005, 26, 395–413. [Google Scholar] [CrossRef]
- Economides, N. The economics of networks. Int. J. Ind. Organ. 1996, 14, 673–699. [Google Scholar]
- Kapoor, R.; Lee, J.M. Coordinating and competing in ecosystems: How organizational forms shape new technology investments. Strateg. Manag. J. 2013, 34, 274–296. [Google Scholar] [CrossRef]
- Gawer, A. Bridging differing perspectives on technological platforms: Toward an integrative framework. Res. Policy 2014, 43, 1239–1249. [Google Scholar]
- Baldwin, C.Y.; Woodard, C.J. The architecture of platforms: A unified view. In Platforms, Markets and Innovation; Gawer, A., Ed.; Edward Elgar Publishing Limited: Camberley, UK, 2009; pp. 19–44. [Google Scholar]
- Habib, T.; Kristiansen, J.N.; Rana, M.B.; Ritala, P. Revisiting the role of modular innovation in technological radicalness and architectural change of products: The case of Tesla X and Roomba. Technovation 2020, 98, 102163. [Google Scholar] [CrossRef]
- Muniz, S.T.G.; Belzowski, B.M. Platforms to enhance electric vehicles’ competitiveness. Int. J. Automot. Technol. Manag. 2017, 17, 151–168. [Google Scholar]
- Alliance for Industrial Internet. Industrial Internet Platform White Paper; Ministry of Industry and Information Technology: Beijing, China, 2017. [Google Scholar]
- Alliance for Industrial Internet. Application Guidelines for Industrial Internet Identity Resolution (Automotive Industry); Alliance of Industrial Internet: Beijing, China, 2021. [Google Scholar]
- Deutsche Gesellschaft für Internationale Zusammenarbeit (GIZ); China Academy of Information and Communication Technology. Industry 4.0 x Industrial Internet: Practices and Insights; Ministry of Industry and Information Technology: Beijing, China, 2020. [Google Scholar]
- Miao, X. Changing Lanes: China’s Road to New Energy Vehicles; People’s Post and Telecommunications Press: Beijing, China, 2023. [Google Scholar]
- Schmitt, A.; Van Biesebroeck, J. Proximity strategies in outsourcing relations: The role of geographical, cultural and relational proximity in the European automotive industry. J. Int. Bus. Stud. 2013, 44, 475–503. [Google Scholar]
- Jagani, S.; Marsillac, E.; Hong, P. The Electric Vehicle Supply Chain Ecosystem: Changing Roles of Automotive Suppliers. Sustainability 2024, 16, 1570. [Google Scholar] [CrossRef]
- Williamson, O.E. The economics of organization: The transaction cost approach. Am. J. Sociol. 1981, 87, 548–577. [Google Scholar]
- Anderson, J.E.; Van Wincoop, E. Trade costs. J. Econ. Lit. 2004, 42, 691–751. [Google Scholar]
- Wagner, S.M.; Bode, C. An empirical examination of supply chain performance along several dimensions of risk. J. Bus. Logist. 2008, 29, 307–325. [Google Scholar] [CrossRef]
- Hopkins, J.; Hawking, P. Big data analytics and IoT in logistics: A case study. Int. J. Logist. Manag. 2018, 29, 575–591. [Google Scholar] [CrossRef]
- Yerpude, S.; Singhal, T.K. Enhancing new product development effectiveness with internet of things origin real time data. J. Cases Inf. Technol. (JCIT) 2018, 20, 21–35. [Google Scholar] [CrossRef]
- Min, H. Artificial intelligence in supply chain management: Theory and applications. Int. J. Logist. Res. Appl. 2010, 13, 13–39. [Google Scholar] [CrossRef]
- Tiwari, S.; Wee, H.-M.; Daryanto, Y. Big data analytics in supply chain management between 2010 and 2016: Insights to industries. Comput. Ind. Eng. 2018, 115, 319–330. [Google Scholar] [CrossRef]
- Baldwin, C.; Clark, K. Design Rules: The Power of Modularity; MIT Press: Cambridge, MA, USA, 1999. [Google Scholar]
- Sturgeon, T.; Van Biesebroeck, J.; Gereffi, G. Value chains, networks and clusters: Reframing the global automotive industry. J. Econ. Geogr. 2008, 8, 297–321. [Google Scholar] [CrossRef]
- Wells, P.; Nieuwenhuis, P. Transition failure: Understanding continuity in the automotive industry. Technol. Forecast. Soc. Chang. 2012, 79, 1681–1692. [Google Scholar] [CrossRef]
- Frenken, K.; Boschma, R.A. A theoretical framework for evolutionary economic geography: Industrial dynamics and urban growth as a branching process. J. Econ. Geogr. 2007, 7, 635–649. [Google Scholar] [CrossRef]
- Yoo, Y.; Henfridsson, O.; Lyytinen, K. Research commentary—The new organizing logic of digital innovation: An agenda for information systems research. Inf. Syst. Res. 2010, 21, 724–735. [Google Scholar] [CrossRef]
- Tao, F.; Cheng, J.; Qi, Q.; Zhang, M.; Zhang, H.; Sui, F. Digital twin-driven product design, manufacturing and service with big data. Int. J. Adv. Manuf. Technol. 2018, 94, 3563–3576. [Google Scholar] [CrossRef]
- Cozmiuc, D.; Petrisor, I. Industrie 4.0 by siemens: Steps made next. J. Cases Inf. Technol. (JCIT) 2018, 20, 31–45. [Google Scholar] [CrossRef]
- Müller, J.M.; Buliga, O.; Voigt, K.-I. Fortune favors the prepared: How SMEs approach business model innovations in Industry 4.0. Technol. Forecast. Soc. Chang. 2018, 132, 2–17. [Google Scholar]
- Marshall, A. Principles of Economics; Springer: Berlin, Germany, 2013. [Google Scholar]
- Duranton, G.; Puga, D. Micro-Foundations of Urban Agglomeration Economies. In Handbook of Regional and Urban Economics; Henderson, J., Thisse, J.-F., Eds.; Elsevier: Amsterdam, The Netherlands, 2004; Volume 4, pp. 2063–2117. [Google Scholar]
- Gertler, M.S. Tacit knowledge and the economic geography of context, or the undefinable tacitness of being (there). J. Econ. Geogr. 2003, 3, 75–99. [Google Scholar] [CrossRef]
- Maskell, P.; Malmberg, A. Localised learning and industrial competitiveness. Camb. J. Econ. 1999, 23, 167–185. [Google Scholar]
- Tiwana, A.; Konsynski, B.; Bush, A. Platform evolution: Coevolution of platform architecture, governance, and environmental dynamics. Inf. Syst. Res. 2010, 21, 675–687. [Google Scholar]
- Asheim, B.; Coenen, L.; Vang, J. Face-to-face, buzz, and knowledge bases: Sociospatial implications for learning, innovation, and innovation policy. Environ. Plan C Gov. Policy 2007, 25, 655–670. [Google Scholar]
- Storper, M.; Venables, A.J. Buzz: Face-to-face contact and the urban economy. J. Econ. Geogr. 2004, 4, 351–370. [Google Scholar]
- Balland, P.-A.; Boschma, R.; Frenken, K. Proximity and innovation: From statics to dynamics. Reg. Stud. 2015, 49, 907–920. [Google Scholar] [CrossRef]
- Boschma, R. Proximity and innovation: A critical assessment. Reg. Stud. 2005, 39, 61–74. [Google Scholar] [CrossRef]
- Frank, A.G.; Dalenogare, L.S.; Ayala, N.F. Industry 4.0 technologies: Implementation patterns in manufacturing companies. Int. J. Prod. Econ. 2019, 210, 15–26. [Google Scholar]
- Gao, L.; Bai, X. A unified perspective on the factors influencing consumer acceptance of internet of things technology. Asia Pac. J. Mark. Logist. 2014, 26, 211–231. [Google Scholar]
- Xu, L.D.; Xu, E.L.; Li, L. Industry 4.0: State of the art and future trends. Int. J. Prod. Res. 2018, 56, 2941–2962. [Google Scholar] [CrossRef]
- Holmström, J.; Holweg, M.; Lawson, B.; Pil, F.K.; Wagner, S.M. The digitalization of operations and supply chain management: Theoretical and methodological implications. J. Oper. Manag. 2019, 65, 728–734. [Google Scholar] [CrossRef]
- Chang, Q.; Kong, C.; Jin, S. Exploring the Impact of Digital Transformation on Corporate Violations in China’s A-Share Market. Systems 2024, 12, 322. [Google Scholar] [CrossRef]
- Lu, Y.; Xu, C.; Zhu, B.; Sun, Y. Digitalization transformation and ESG performance: Evidence from China. Bus. Strategy Environ. 2024, 33, 352–368. [Google Scholar] [CrossRef]
- Jiang, S.; Yeung, A.C.; Han, Z.; Huo, B. The effect of customer and supplier concentrations on firm resilience during the COVID-19 pandemic: Resource dependence and power balancing. J. Oper. Manag. 2023, 69, 497–518. [Google Scholar] [CrossRef]
- Wang, Y.B.; Liu, B.; Chan, H.K.; Zhang, T.T. Who pays buyers for not disclosing supplier lists? Unlocking the relationship between supply chain transparency and trade credit. J. Bus. Res. 2023, 155, 113404. [Google Scholar] [CrossRef]
- PwC. Digital Vehicles Report; PwC: Bristol, UK, 2023. [Google Scholar]
- Wang, J.; Wang, X.; Sun, F.; Li, X. The Functional Mechanisms through Which Artificial Intelligence Influences the Innovation of Green Processes of Enterprises. Systems 2024, 12, 378. [Google Scholar] [CrossRef]
- Li, Y.; Liu, C.; Mao, W.; Xie, Y. Spatial characteristics and location selection of global data center expansion. Acta Geogr. Sin. 2023, 78, 1936–1954. [Google Scholar]
- Liu, Y.; Chi, G. Does digital transformation promote supply chain efficiency? Evidence from China. Manag. Decis. Econ. 2024, 45, 5562–5576. [Google Scholar] [CrossRef]
- Zhang, K.; Qian, Q. Characteristics and proximities mechanism of China’s new energy vehicle industry innovation network. Geogr. Res. 2021, 40, 2170–2187. [Google Scholar]
- Zhang, N.; Duan, H.; Guan, Y.; Mao, R.; Song, G.; Yang, J.; Shan, Y. The “Eastern Data and Western Computing” initiative in China contributes to its net-zero target. Engineering, 2024; in press. [Google Scholar]
- Song, J.; Wang, R.; Cavusgil, S.T. State ownership and market orientation in China’s public firms: An agency theory perspective. Int. Bus. Rev. 2015, 24, 690–699. [Google Scholar] [CrossRef]
- Johansson, A.C.; Feng, X. The state advances, the private sector retreats? Firm effects of China’s great stimulus programme. Camb. J. Econ. 2016, 40, 1635–1668. [Google Scholar] [CrossRef]
- Wang, D.; Shao, X. Research on the impact of digital transformation on the production efficiency of manufacturing enterprises: Institution-based analysis of the threshold effect. Int. Rev. Econ. Financ. 2024, 91, 883–897. [Google Scholar] [CrossRef]
- Jing, H.; Fan, Y.W. Digital Transformation, Supply Chain Integration and Supply Chain Performance: Evidence From Chinese Manufacturing Listed Firms. Sage Open 2024, 14, 21582440241281616. [Google Scholar] [CrossRef]
- Li, H.; Yang, Z.; Jin, C.; Wang, J. How an industrial internet platform empowers the digital transformation of SMEs: Theoretical mechanism and business model. J. Knowl. Manag. 2023, 27, 105–120. [Google Scholar] [CrossRef]

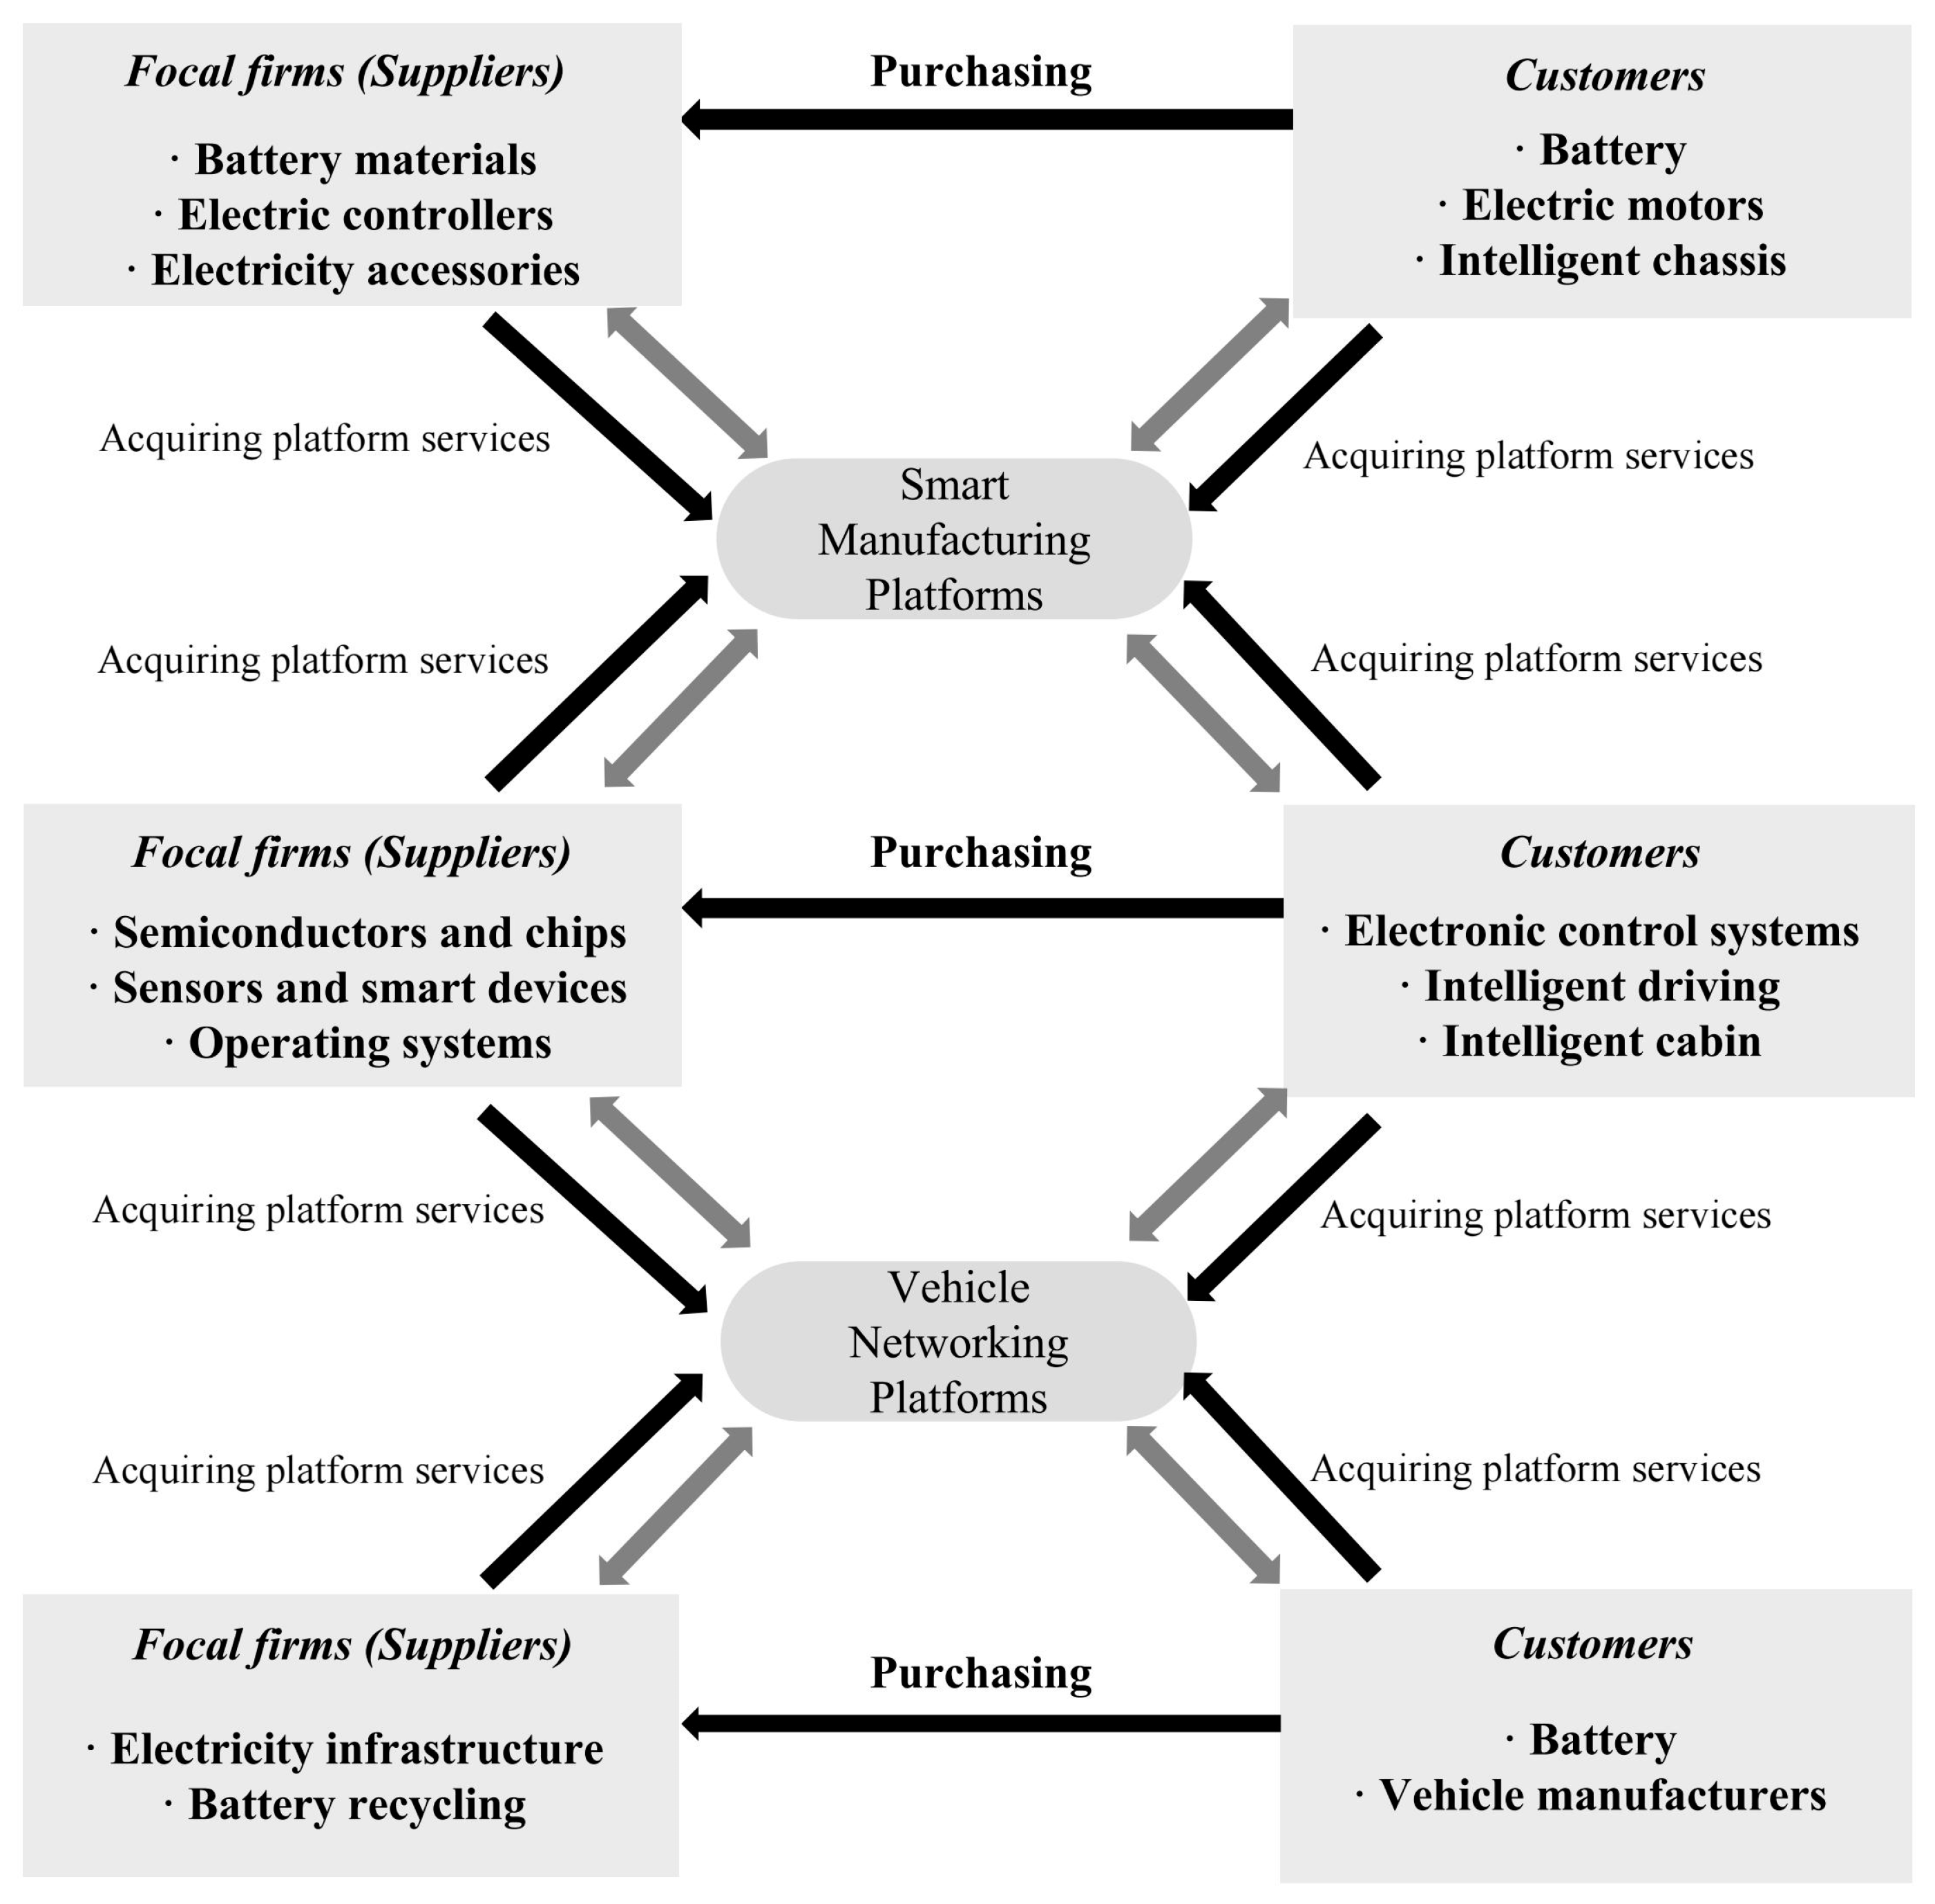
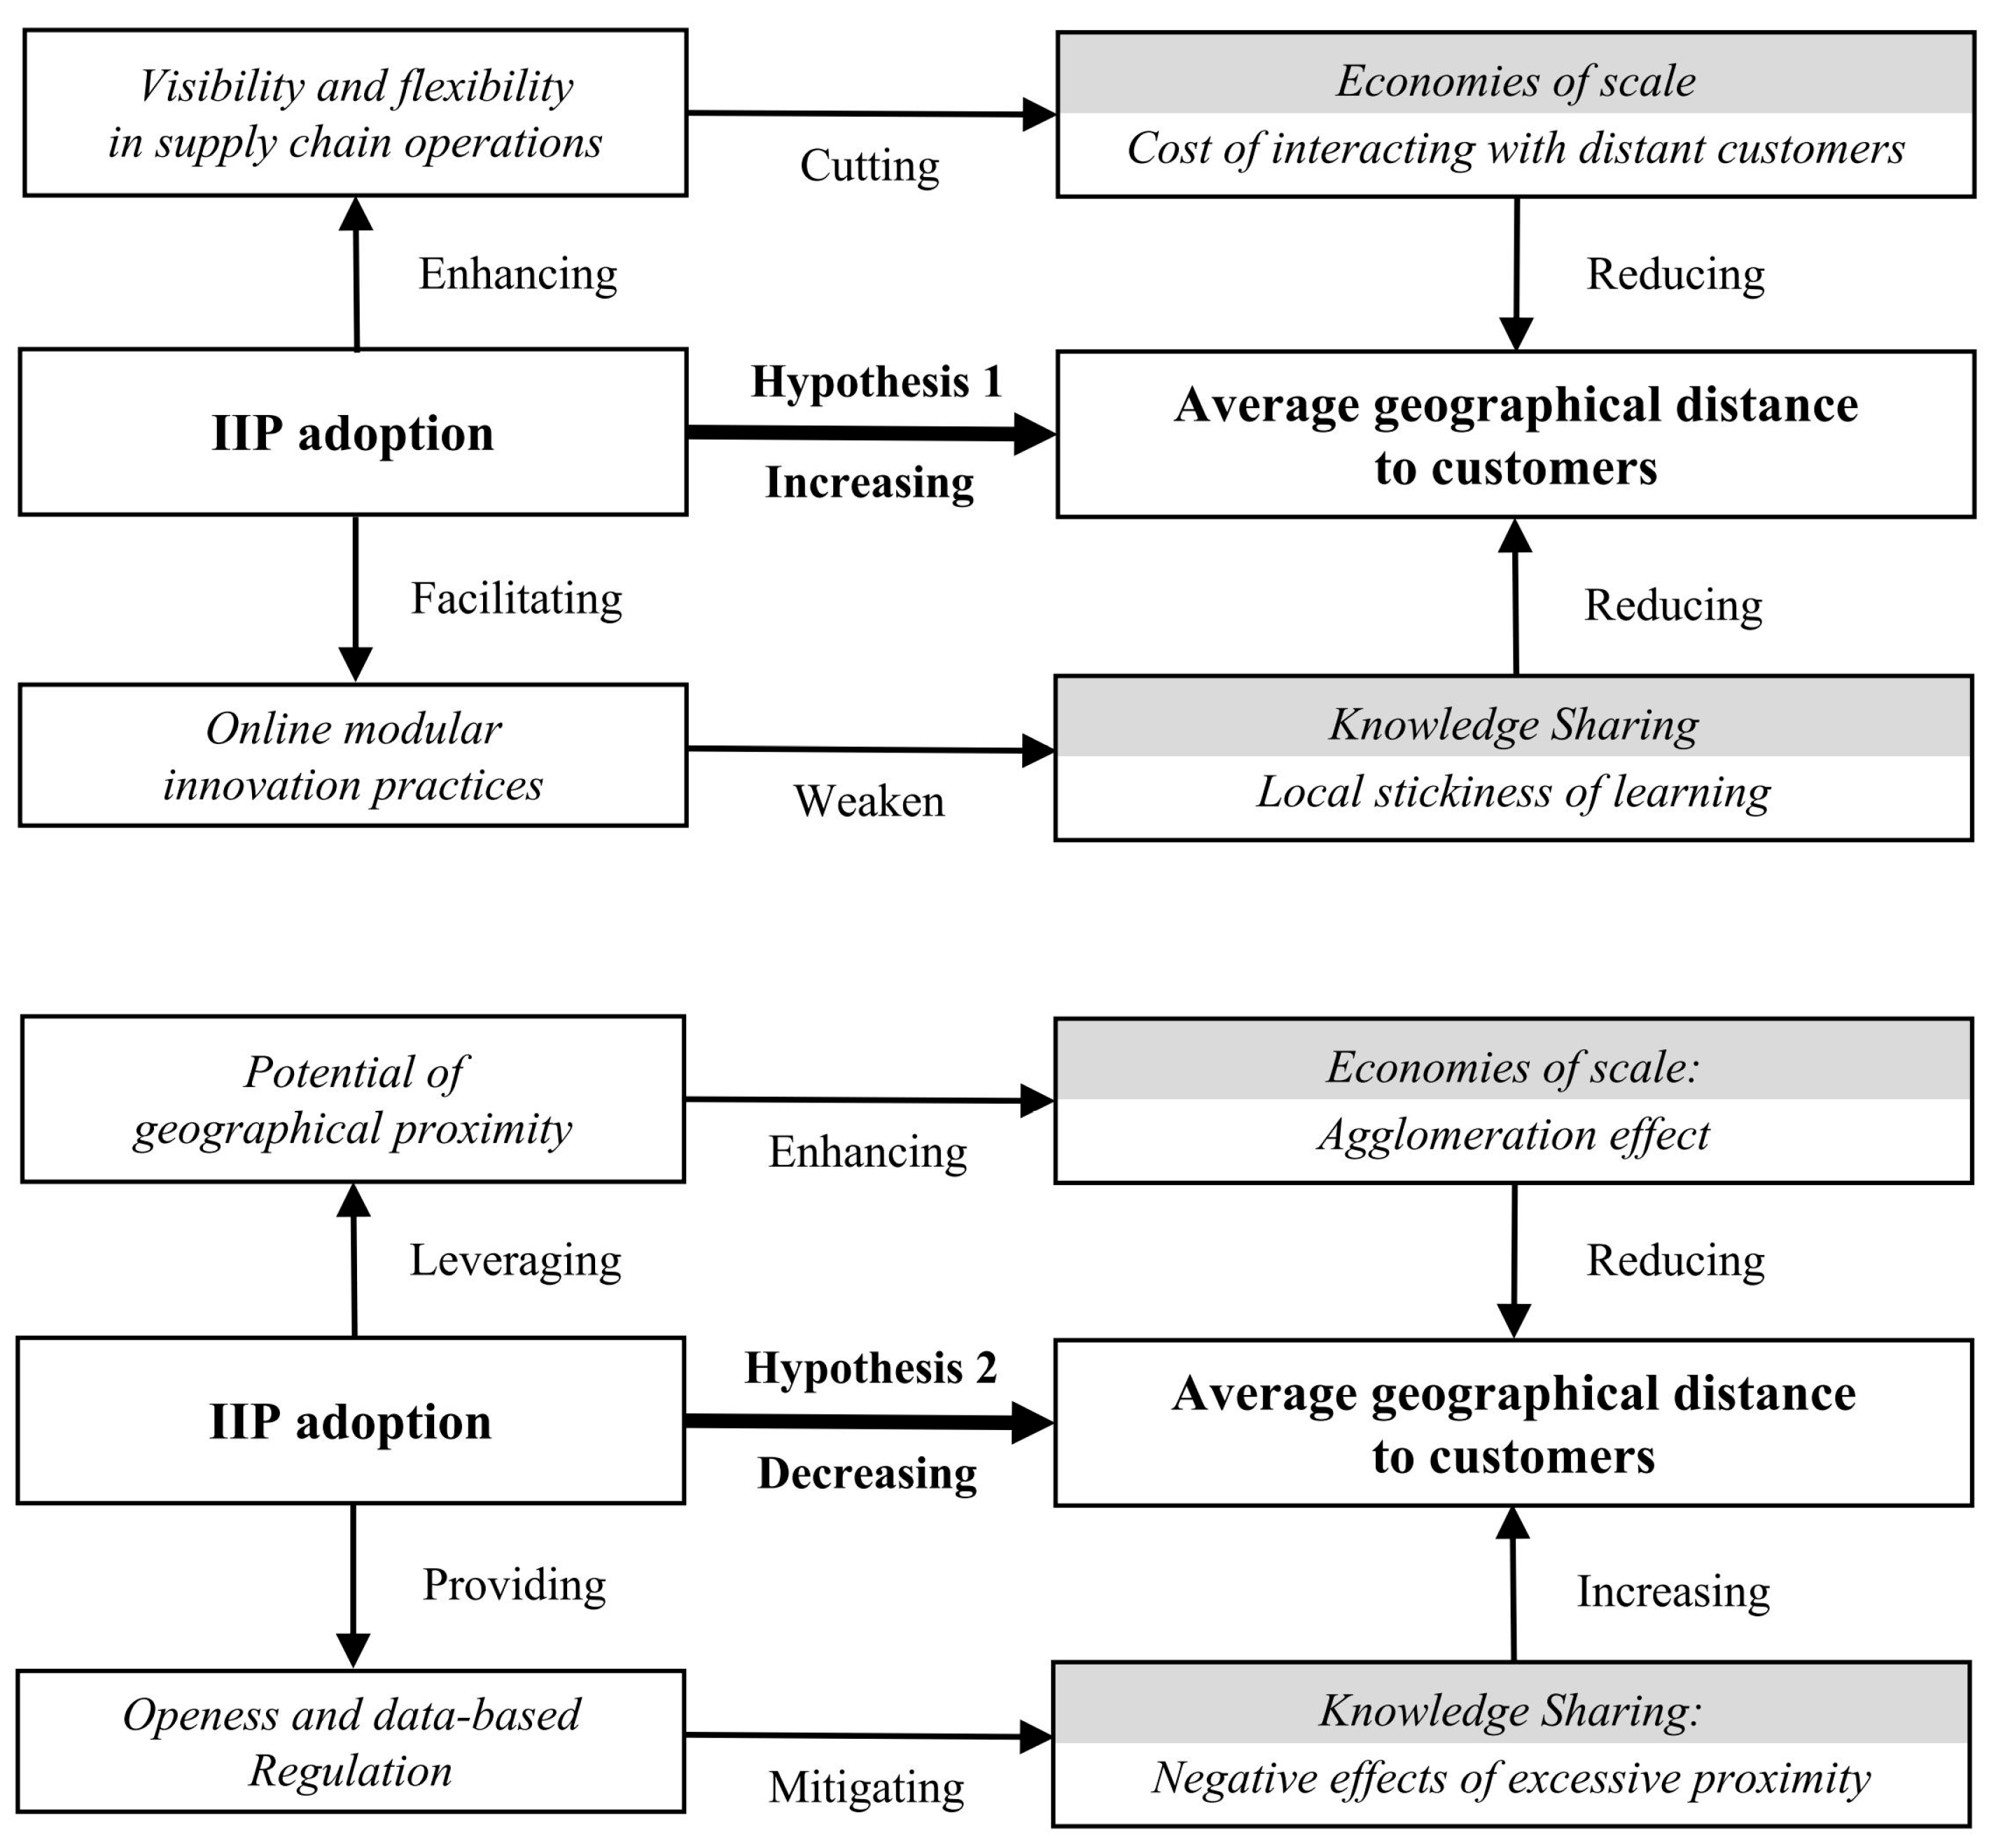

Disclaimer/Publisher’s Note: The statements, opinions and data contained in all publications are solely those of the individual author(s) and contributor(s) and not of MDPI and/or the editor(s). MDPI and/or the editor(s) disclaim responsibility for any injury to people or property resulting from any ideas, methods, instructions or products referred to in the content. |
© 2025 by the authors. Licensee MDPI, Basel, Switzerland. This article is an open access article distributed under the terms and conditions of the Creative Commons Attribution (CC BY) license (https://creativecommons.org/licenses/by/4.0/).