Abstract
Existing research on the vulnerability of knowledge innovation networks (KINs) primarily falls into two categories: random attacks and deliberate attacks. This study introduces a novel centrality-based attack framework for the deliberate attack group and systematically examines the impact of different attack mechanisms (such as loss of connectivity, propagation delays, and structural fragmentation) on KINs. Using SCI/SSCI co-authorship data across 286 Chinese cities, this research evaluated network resilience through six key metrics, average clustering coefficient, average degree, average path length, global efficiency, isolated nodes ratio, and largest connected component ratio, thus revealing three key conclusions: First, network density and regional integration surged after 2015, peaking in localized clustering during 2021–2022; yet, post-2022, structural fragmentation and efficiency declines exposed critical vulnerabilities. Second, network disruption simulations revealed that attacks based on structural fragmentation mechanisms have the most significant impact, demonstrating the need to promote polycentric development to reduce core dependency risks and highlighting the importance of protecting high-centrality nodes such as Beijing, Shanghai, and Shenzhen. Third, the inhibitory effect of economic proximity weakened significantly by 2024, suggesting reduced economic disparity barriers to collaboration. Notably, emerging synergies between geographic and economic proximity enhanced innovation cooperation potential, emphasizing spatial–economic coordination as a crucial factor in development-stage planning. By integrating spatiotemporal dynamics with attack taxonomy, our framework advances network theory and equips policymakers with actionable strategies to optimize knowledge flows and mitigate systemic risks. Bridging structural resilience with innovation-driven development, this study offers new insights into China’s urban knowledge networks.
1. Introduction
The spatial organization of knowledge and innovation networks has become a key determinant of regional competitiveness in the era of globalization. While the existing literature has extensively explored innovation networks in developed economies, significant gaps remain in understanding the evolutionary dynamics and structural resilience of such networks in emerging economies like China, a country undergoing rapid urbanization and innovation-driven transformation with unique spatial–economic disparities [1,2,3]. Traditional studies focusing on static network structures or unidimensional proximity mechanisms (e.g., geographic or institutional) have systematically neglected two critical aspects: (1) dynamic interactions among multiple proximity dimensions, and (2) systemic vulnerabilities arising from China’s distinct “core-periphery” polarization observed in innovation ecosystems. This oversight limits our understanding of network adaptation mechanisms in transitional economies.
Recent advances in network science methodology have revealed new complexities in the analysis of innovation systems. While traditional QAP methods are effective in detecting patterns of correlation, they are unable to account for multivariate interactions during network evolution, a critical limitation that is addressed by our application of the Multivariate Regression Quadratic Assignment Procedure (MRQAP) [4,5]. Building on the analysis from this, we develop a novel four-dimensional framework integrating the following: (1) the spatio-temporal dynamics of knowledge diffusion, (2) topological evolution patterns, (3) structural resilience assessment, and (4) proximity mechanism interactions. This integrated approach overcomes three persistent research limitations: the temporal nonlinearity blind spot in network integration, inadequate vulnerability assessment under targeted attacks, and oversimplified proximity interaction models [6].
Our analysis of SCI/SSCI co-authorship networks (2014–2024) reveals three transformative trends reshaping China’s innovation geography. First, the post-2015 surge in network density and localized clustering (peaking in 2021–2022) initially reinforced the observed core–periphery integration, but subsequent structural divergence (post-2022) exposed previously underestimated vulnerabilities in knowledge flow sustainability. Second, interdegree centrality emerges as both the most critical and vulnerable network attribute, highlighting the urgent need for polycentric resilience strategies to mitigate overdependence on megacity hubs like Beijing and Shanghai. Third, our temporal analysis reveals a paradigm shift in proximity effects: while economic proximity’s inhibiting effect significantly weakens by 2024, new synergies emerge between geographic and economic proximity dimensions, suggesting evolving spatial–economic coordination mechanisms.
In recent years, the dynamic evolution of China’s urban knowledge and innovation network and its profound impact on the economy and society have garnered significant academic attention. This network’s development has been driven by innovation-driven policies and industrial upgrading strategies [7], as well as by the accelerated flow of knowledge, talent, and technology, which has reshaped regional collaborative development patterns [8,9]. The rise of large urban agglomerations and regional central cities has further facilitated the construction of a multi-level knowledge-sharing system. This system is characterized by enhanced connectivity strength, network density, and node centrality, offering rich research scenarios for social network analysis and geospatial studies [10].
While these structural analyses provide important insights, recent methodological innovations have begun quantifying policy intervention effects through computational modeling. Specifically, some scholar developed an agent-based model to simulate how Smart Specialization policies can optimize inter-regional knowledge network formation, addressing critical prioritization challenges in regional development [11]. This computational approach complements our MRQAP-based framework by enabling counterfactual policy evaluation—a crucial capacity for evidence-based policymaking in transitional economies.
The integration of social network analysis and geographic information systems provides a robust methodological framework for examining interactions among urban nodes. Research indicates that core cities, leveraging their resource agglomeration advantages, play a pivotal role in knowledge integration and diffusion [12]. However, this centrality often exacerbates network asymmetries [13]. To address this, second-tier cities and emerging innovation hubs are actively engaging with core nodes to increase their network connection weight. Such collaborations have not only spurred cross-regional projects but also fostered the development of polycentric network structures. Some regions exhibit characteristics of small-world networks [14], where local high-density connectivity coexists with efficient cross-regional information transfer. This structure is believed to balance innovation collaboration costs with network stability [15].
Network resilience to external shocks and internal node failures has emerged as a critical indicator of sustainability. Studies reveal that a center-edge structure, overly reliant on a few core nodes, is susceptible to systemic risks. In contrast, redundant connections and decentralized layouts significantly enhance network resilience [16,17,18]. For instance, the COVID-19 pandemic and supply chain crises highlighted the vulnerabilities of single-connectivity models, while cities with multi-channel connectivity and local innovation capabilities demonstrated greater resilience [19,20,21,22]. Consequently, fostering multiple regional innovation centers and enhancing functional substitutability among nodes have become key strategies for optimizing network resilience. This approach must balance the functional relief of core cities with the innovation empowerment of small and medium-sized cities to prevent resource concentration-induced path dependence [23].
The topology of China’s urban knowledge and innovation network is characterized by the complexity of core-edge and multi-layer nesting structures. On the one hand, high-centrality nodes dominate knowledge flows, creating a hierarchical distribution. On the other hand, small-world networks and scale-free networks within certain regions maintain local collaboration efficiency while achieving global resource integration through cross-layer connections. However, this structure may also lead to knowledge locking effects, hindering cross-regional transfer. To address this, scholars have proposed introducing bridging nodes to activate weak connections and constructing cross-layer knowledge reuse mechanisms. These strategies aim to enhance the flexibility and adaptability of the network structure, thereby breaking through innovation path dependency [24,25].
The evolution of knowledge networks is underpinned by geographic, cultural, institutional, and economic proximity. Traditionally, geographic proximity has facilitated cooperation by reducing transaction costs. However, with the proliferation of digital infrastructure, soft proximity factors such as cultural identity, institutional compatibility, and economic complementarity are becoming increasing importance [26,27]. For instance, the Guangdong–Hong Kong–Macao Greater Bay Area has achieved a high level of integration between Shenzhen and Hong Kong through institutional synergy and industrial complementarity. Additionally, the educational environment exerts a long-term influence on city network dynamics: high-level universities and research platforms not only enhance local knowledge output but also attract external talent, thereby strengthening node connectivity [28]. Furthermore, changes in the external environment such as international scientific competition and value chain restructuring require the upgrading of the network’s internal synergistic mechanisms, fostering the development of independent innovation capacity.
This study makes four key theoretical contributions: (1) advancing networked geo-economy theory through dynamic proximity analysis in emerging economies, (2) developing a resilience assessment framework for innovation systems under disruption scenarios, (3) demonstrating polycentric governance’s potential for simultaneous efficiency–sustainability optimization, and (4) establishing a transferable methodological framework that can be readily applied to analyze similar knowledge networks in other contexts, particularly offering new analytical tools for European and Latin American innovation system studies.
The methodological framework developed in this study holds significant potential for application in European and Latin American contexts, where knowledge networks face similar challenges of balancing efficiency and resilience amid regional disparities. Our center-based modeling approach, combined with dynamic proximity analysis, provides a robust tool for examining how different governance structures and spatial configurations influence innovation system performance across varying institutional environments. Particularly for Europe’s highly integrated but unevenly developed innovation networks and Latin America’s emerging yet fragmented knowledge systems, our resilience assessment metrics offer comparable indicators to evaluate network vulnerabilities to targeted disruptions. The polycentric governance insights derived from China’s experience may inform policy discussions in these regions, especially regarding inter-regional knowledge diffusion and adaptive capacity building. By applying this framework to comparative studies, researchers could uncover both universal principles of innovation network resilience and context-specific adaptation strategies, thereby enriching the global understanding of how geographical and institutional factors interact to shape knowledge creation and diffusion patterns.
Practically, our findings provide policymakers with actionable strategies to optimize China’s “East Cluster, West Sparse” innovation pattern through the following: inter-regional knowledge corridor development, adaptive proximity mechanism utilization, and polycentric node cultivation. These insights offer valuable references for countries in the Global South pursuing similar innovation-driven development trajectories.
This study proposes two hypotheses:
H1:
Geographic proximity and economic proximity have complementary effects on KINs.
H2:
The interaction effect between geographic and economic proximity has intensified over the past decade.
2. Research Design
The specific research flow of this study is shown in Figure 1 below.
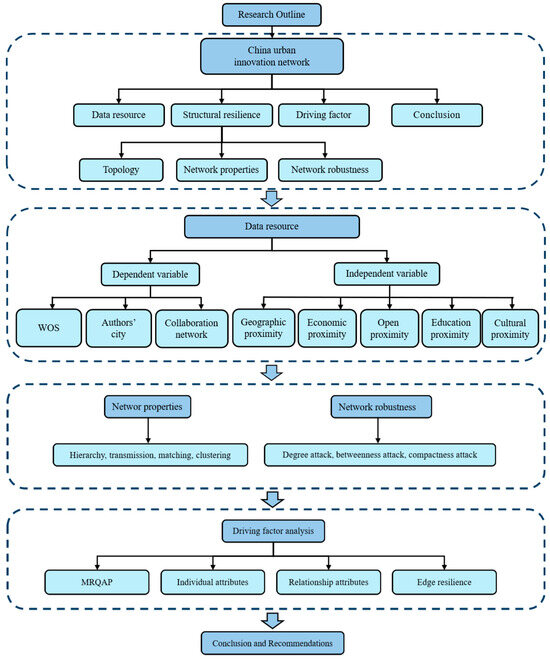
Figure 1.
Flow chart of the proposed research method.
2.1. Network Structural Resilience Measurement System
2.1.1. Network Topology
Network topology refers to the arrangement of nodes and edges in a network, which dictates its connectivity properties and dynamic behavior [29]. Network topology analysis is extensively applied in the study of complex networks, including social networks, transportation systems, information dissemination networks, and urban networks. Broadly, network topologies can be categorized as follows:
Random network: Based on the Erdős–Rényi model, where edges are randomly assigned, and any two nodes connect with probability . The degree distribution of a random network approximately follows a Poisson distribution.
Small-World Network (SWN): Introduced by Watts and Strogatz, it is characterized by a short average path length and a high clustering coefficient. This structure is commonly observed in real-world networks such as social and transportation networks [30].
Scale-Free Network: Introduced by Barabási and Albert, this topology follows a power-law degree distribution, meaning that a small number of nodes, known as hubs, possess a disproportionately large number of connections, while most nodes have relatively few [31]. This structure is prevalent in systems such as the Internet, aviation networks, and academic collaboration networks.
Hierarchical Network (HN): Characterized by a distinct hierarchical structure, in which local sub-networks may exhibit scale-free or small-world properties, collectively forming a multi-tiered organizational framework [32].
The four common network topologies are illustrated in Figure 2.

Figure 2.
Four common network topologies.
In complex network research, network topology refers to the arrangement of nodes and edges in relation to one another. Utilizing multi-year network data, this study examines the evolutionary characteristics of network topology and calculates key metrics, including the average clustering coefficient, to assess local connectivity. Key structural properties in network topology analysis include degree distribution, which quantifies the distribution of node connections (degree ) across the network; average path length, which represents the mean shortest path between any two nodes and is a metric for assessing network reachability; network clustering, which reflects the likelihood of nodes forming triangular structures, indicative of local tightness; and connected components, which refer to independent subgraphs within a network. This study specifically examines the topology of the largest connected subgraphs.
Building on these characteristics, this study investigates the topology of multiple annual networks, with a particular emphasis on unweighted and weighted clustering coefficients to evaluate local connectivity. The formula is as follows (1):
where is the total number of nodes in the network and is the local clustering coefficient of node , which is calculated as (2) in the weighted case:
where denotes the weighted degree of node , i.e., the sum of the weights of all edges connected to node , shows the weights of the edges between nodes and , is the element of the adjacency matrix ( if there is an edge between and , otherwise, ), and reflects the degree of weighted local clustering of node . In the weighted case, it is calculated as (3)
To examine the evolutionary characteristics of inter-city network density across various flow types (economic, educational, knowledge, and foreign business), this study constructs an inter-city relational network using connecting edge data for each flow type and computes its overall network density. Network density quantifies the closeness of connections between nodes in a network and is defined as follows (4):
where denotes the actual number of edges in the network, and represents the number of nodes (cities) in the network. The density value ranges from 0 to 1, with higher values indicating stronger inter-city connections. Given the substantial variation in connection strength (i.e., contribution) within the original data, directly computing density may result in extreme values. Unlike traditional binarization methods, this study, given its large sample size and significant data variability, innovatively employs trinarization for network construction. The specific procedure is as follows: First, compute the annual average contribution, , for each flow type using the following equation, Equation (5):
where represents the contribution of each connected edge and is the total number of edges in that year. Next, set the binarization threshold: For the general network, retain edges with contribution and remove weak connections. For the core network, retain edges with contribution , highlighting relationships between strongly connected cities. In this study, densities are computed separately for the ordinary network and the core network to observe the structural changes in the different layers of the network
2.1.2. Indicators of Network Structural Resilience Evolution
Network structural resilience serves as a crucial tool for examining the evolution of regional spatial structures, with a particular emphasis on network topology stability, physical connectivity, and the maintenance of spatial coherence and ecosystem stability through the arrangement of nodes and edges [33]. Grounded in evolutionary resilience theory, a four-dimensional framework for network structural resilience can be established, comprising the following: vulnerability, resilience, recovery, and evolution.
When subjected to external shocks [18,34], the network exhibits varying responses across these four dimensions: vulnerability represents the loss incurred due to the network structure’s inability to effectively resist risks; destruction resistance reflects its capacity to maintain stability and withstand disruptions; resilience describes the network’s ability to absorb shocks rapidly and restore its original state; and evolvability denotes its ability to continuously develop, surpass its prior connectivity state, and attain a more stable equilibrium.
Within the innovation network framework, the theory highlights the intricate interplay of innovation elements and the linkage effects among innovation entities. Evolutionary resilience theory emphasizes shock resistance, structural optimization, and functional enhancement in complex systems.
To further clarify the resilience of the KIN structure, we define it as follows: when confronted with external shocks and perturbations, the KIN relies on knowledge flows between nodes and collaborative, complementary relationships to stimulate self-organization and adaptive capacity. This enables the system to respond swiftly to external disturbances, maintain structural stability, restore its original state, and evolve toward greater robustness.
Integrating the theoretical foundations of innovation networks and evolutionary resilience, this study adopts a framework comprising vulnerability, resilience, recovery, and evolution. It selects four key indicators to assess the resilience of the KIN structure—hierarchy, transmission, matching, and clustering. The detailed characterization system is presented in Table 1, while Figure 3 illustrates their inter-relations.

Table 1.
KIN structure resilience measurement system.
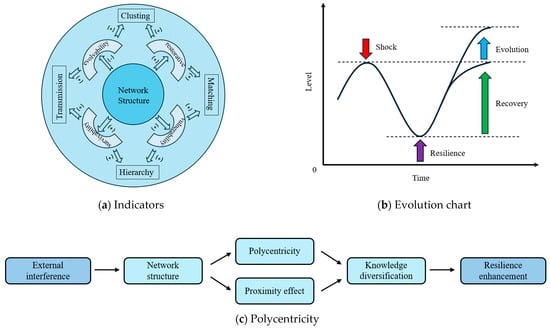
Figure 3.
Schematic diagram of network structural resilience. (a) Indicators. (b) Evolution chart. (c) Polycentricity.
2.1.3. Formulas of Network Structural Resilience Evolution
In a knowledge network, nodes typically represent specific innovation entities (universities, research institutions, or enterprises), while edges denote collaborative relationships or knowledge transfer pathways among these entities. When a key node fails, all directly connected edges are simultaneously disrupted, potentially causing network fragmentation, knowledge flow blockages, and even the disintegration of the innovation ecosystem.
Thus, node resilience can be defined as the extent to which a node failure impacts the overall network structure. To quantify node resilience, we employ a disruption simulation approach to evaluate the significance of individual nodes by modeling changes in network connectivity following their failure. Specifically, when a single node fails, all its associated edges simultaneously collapse, subsequently altering the overall network connectivity structure.
In this study, the network connectivity coefficient is utilized to assess node resilience, computed as follows (6):
where is the connectivity coefficient of the KIN, is the number of connected sub-networks in the knowledge network, is the number of all city nodes in the network, is the number of city nodes in the ith connected sub-network, and is the average shortest path of the ith connected sub-network. When the whole network is fully connected (), takes the maximum value of 1, indicating that the network has the highest connectivity and knowledge dissemination efficiency is in the optimal state. On the contrary, when node failure leads to severe network fragmentation, tends to 0, indicating that the knowledge network connectivity decreases dramatically and the regional innovation capability is impaired. Further, let be the connectivity coefficient of the complete network and be the connectivity coefficient after removing node . The resilience contribution of node i can be defined as (7):
If tends to 0, it means that the failure of node i has less impact on the network structure, and if tends to 1, it means that it indicates that the failure of node causes severe network splitting and is a critical node. If the effect of network hierarchy is further considered and the network topology is normalized, the normalized network connectivity coefficient can be defined as follows (8)
where and are the minimum and maximum connectivity coefficients in the sample network, respectively. Through normalization, the numerical scale differences between networks of different sizes can be eliminated, making the indicators better comparable. The connectivity toughness measures the strength of cooperation between two cities, i.e., the weights of the edges. For a pair of cities (, their connectivity toughness is defined as (9):
where represents the toughness of the connecting edges between cities and , and denotes the value in the adjacency matrix, i.e., the strength of cooperation between the two cities. If is larger, it means that the cooperation between the city pairs is very close and they are very strongly connected in the knowledge network. If is small or zero, it indicates that there is less or no cooperation between the city pair. When calculating the toughness of connected edges, this study line normalizes the process so that the toughness values of all edges fall between 0 and 1 to enhance comparability. The specific formula is as follows (10):
2.1.4. Network Destruction Simulation Experiment
Network destruction resistance refers to a network’s ability to preserve its core functional and structural characteristics under extreme conditions, such as external attacks or random failures. In other words, a network is considered highly resistant to destruction if the removal of certain nodes or edges does not significantly degrade overall accessibility, information transmission efficiency, or other key metrics. Building on methodological and theoretical frameworks established in network robustness studies, this study conducts a comprehensive analysis of various centrality indices (e.g., degree centrality, betweenness centrality, and closeness centrality) and network topological features (e.g., proportion of maximally connected subgraphs, average clustering coefficient, average degree, proportion of isolated nodes, global efficiency, and average path length). Furthermore, it explores network vulnerabilities and their evolutionary patterns under different attack strategies.
It is widely recognized that attacks targeting hub nodes (i.e., high-centrality nodes) most effectively weaken network functionality. Meanwhile, random or localized attacks may induce localized structural failures in large-scale networks, subsequently impacting the propagation and collaboration capacities of the entire network. Thus, through systematic index measurement and attack simulation, this study examines network destruction resistance and potential defense strategies under extreme conditions, providing theoretical insights and practical guidance for designing and optimizing real-world networks.
In this study, the degree attack, closeness attack, and betweenness attack are set based on the mechanisms of loss of connectivity, propagation delay, and structure splitting.
Among these, the average clustering coefficient is defined as the agglomeration metric in Table 1, while the average path length is given by the following (11):
is the shortest distance from city node to , and is the number of nodes in the network; global efficiency, defined as Table 1 above, deals with transmissibility; and the average degree is defined as follows (12):
where denotes the degree of node v. The maximal connected subgraph is the connected component of the undirected graph that contains the most nodes. If the notation denotes the set of nodes of the maximal connected subgraph and denotes the set of all nodes of the whole graph, then the maximal connected subgraph scale is defined as in (13) below:
Isolated nodes are those with a degree of 0, meaning they are not connected to any other node. The isolated node ratio quantifies the proportion of isolated nodes that emerge in the network following an attack or failure. Let denote the number of isolated nodes in the network; the isolated node ratio is then defined as follows (14):
Attack strategies that prioritize the removal of highly connected nodes often rapidly result in the isolation of other nodes due to the loss of critical connecting edges. The specific algorithm employed in this study is shown in Algorithm 1 as follows:
| Algorithm 1: Network Destruction Resistance Simulation Experimental Framework |
| Input |
| : undirected graph containing nodes and edges. |
| Attack strategy : used to select the way to remove nodes, including degree attack , proximity centrality attack , and meso-centrality attack . |
| Output |
| Changes in network structure metrics during an attack, including the average clustering coefficient global efficiency average degree , and proportion of the largest connected component . |
| Main loop |
| while , do |
| 1. Compute initial network metrics, . |
| 2. Choose attack strategy A and establish the sequence of node removals. |
| 3. For do Remove nodes update , recalculate network structure . |
| end for |
| 4. Log changes in network properties throughout the attack process. |
| 5. Visualize the impact of different attack strategies on the network and plot key metric variations as a function of the number of nodes removed: and . |
| 6. Output the final network structure along with its destruction resistance analysis results. end while |
2.2. Driving Factors of Network Structural Resilience
2.2.1. Modeling Approach
When variables are represented as symmetric adjacency matrices, sample interdependence arises due to network correlations, violating the fundamental assumption of ordinary least squares (OLS) that samples are independently and identically distributed (i.i.d.). Consequently, traditional regression analysis methods become inapplicable in such scenarios. Instead, network measurement models such as the quadratic assignment procedure (QAP) and the exponential random graph model (ERGM) effectively address this issue.
However, since network edge resilience is influenced by multiple internal and external drivers, ERGM has functional limitations in capturing exogenous dynamics, while QAP is restricted to analyzing bivariate relationships between matrices. Therefore, this study employs the multiple regression quadratic assignment procedure (MRQAP) to examine the driving mechanisms of urban network edge resilience. MRQAP allows for the simultaneous inclusion of multiple independent variable matrices while controlling for potential confounding factors, thereby enhancing model robustness and explanatory power and mitigating the risk of omitted variable bias.
In this study, the UCINET software (6.186) is used to obtain MRQAP regression results through 2000 random permutation operations with a random seed of 474. The analysis begins with an introduction to QAP.
The QAP method first defines A and B as two n×n matrices, representing the adjacency matrices of the two networks, respectively. The goal of QAP is to assess the correlation between A and B. It is assumed that this relationship can be represented by the following linear model (15):
where is the intercept term, is the regression coefficient, and is the error term that satisfies but satisfies the network autocorrelation as follows (16):
The fundamental principle of QAP is to disrupt the original correlation between matrices and through random permutation while preserving the network structure.
The procedure is as follows: First, the original correlation between matrices and is computed. Commonly used correlation measures include Pearson’s correlation coefficient, Spearman’s correlation coefficient, and the matrix inner product. An example of Pearson’s correlation coefficient is provided below (17):
where and are the mean values of matrices and . A random permutation matrix is generated and the matrix is permuted to obtain the permuted matrix as follows (18)
where is a random permutation matrix satisfying and is the unit matrix. The above replacement process is repeated M = 2000 times, and each time, the correlation is calculated after the replacement to construct the replacement distribution. The standard error of the replacement distribution is calculated as follows (19):
where is the mean value of the correlation in the replacement distribution. The permutation test p-value is shown in (20) below:
where is an indicator function that takes the value of 1 when the condition is valid and 0 otherwise. MRQAP breaks the original correlation between the independent variables and the dependent variable by randomly replacing ranks, while keeping the network structure unchanged, so that the replacement distribution conforms to the original assumption H0: . The generalized MRQAP model is set as follows (21):
where is the matrix of dependent variables (network contiguity toughness), is the matrix of the kth explanatory variable, is the matrix of control variables, but satisfies network autocorrelation, and in terms of stochastic replacement mechanisms, the standard osols are estimated as follows (22):
The replacement matrix is then generated, keeping unchanged, as follows (23)
where is a random permutation matrix such that the original structure between and is destroyed. The replacement operation is repeated 2000 times to calculate the regression coefficient and construct the replacement distribution as follows (24)
The replacement test p-value is calculated as shown in (25) below:
2.2.2. Variable Selection
The dependent variable in this study is the symmetric adjacency matrix of the urban technological innovation network, constructed based on network edge resilience. The independent variables are categorized into two dimensions: node-level attributes and network relationship attributes. Variable selection is grounded in theoretical support while also considering data accessibility to ensure this study’s feasibility and robustness.
Regarding node-level attributes, network topology evolution is significantly influenced by the homophily and agglomeration effects. The homophily effect suggests that nodes with similar attributes are more likely to establish connections, a mechanism particularly prominent in city-cluster KINs. Cities with comparable levels of economic development typically exhibit greater similarity in innovation demands, industrial trajectories, and technological reserves, fostering knowledge cooperation [35]. Therefore, this study selects economic proximity as a key variable to assess the resilience of inter-city knowledge cooperation and examine its assortment effect.
Although industrial proximity may influence innovation cooperation, it is excluded from this study due to challenges in data acquisition arising from varying industrial classification systems across cities. Additionally, economic proximity serves as a partial proxy for industrial structural similarity [36].
In summary, this study integrates theoretical support from the existing literature while ensuring data accessibility to enhance the scientific rigor and measurability of variables. Specific variables are described in Table 2 below.
Table 2.
Proximity as independent variables.
Model 1 assesses the independent effect of individual properties on the robustness of the network structure. Model 2 assesses the combined effect of individual and relational properties on the robustness of the network structure. Model 3 investigates the interaction effects between geographic proximity and economic proximity. If the coefficient of the interaction term is positive, this indicates a complementary effect between the variables; if negative, it suggests a substitution effect. The specific models are presented in (26)–(28):
2.3. Data Sources and Processing
This study is based on 286 administrative units at the prefecture level and above in China, covering the period from 2014 to 2024. The dataset used in this study is categorized into two types.
KIN data: This dataset is utilized to analyze network structural resilience. In constructing the urban knowledge and innovation network, cities are represented as nodes, which are connected through scientific research partnerships based on co-authored papers. When a paper’s authors are affiliated with different cities, the paper is split into multiple pairwise combinations according to the authors’ cities, thereby forming an inter-city knowledge innovation cooperation network. If the authors of a paper are from different cities, the paper contributes inter-city collaborations. The sub-networks formed by each paper are aggregated across nnn cities, resulting in an undirected weighted matrix representing the inter-city knowledge innovation network.
In this study, we utilize the Web of Science (WOS) database as the data source for selecting joint papers authored by two or more domestic scholars to construct the inter-city knowledge cooperation network. The dataset includes publications from the SCI and SSCI journal databases in WOS, which are globally recognized authoritative sources. These databases include high-impact journals and provide comprehensive coverage of high-quality knowledge innovations and cutting-edge scientific research. The existing literature frequently employs WOS data to analyze regional knowledge development and scientific research cooperation at multiple spatial scales, including urban clusters, national levels, and global networks.
The second type of data are statistical data: This dataset is used to analyze the driving factors behind network structural resilience. Data sources include the China Urban Statistical Yearbook, city-level statistical yearbooks, and statistical bulletins. Information related to dialects is obtained from the Chinese Language Atlas. Any missing data are addressed using linear interpolation.
3. Empirical Analysis
3.1. KIN Analysis
The hierarchical transformation of China’s KIN between 2015 and 2024, as visualized in Figure 4a,b, vividly demonstrates the network’s journey through the resilience phases shown in Figure 3b. The 2015 configuration’s fragmented structure, with its weak core–periphery connections, exemplified the vulnerability stage in the resilience curve, corresponding to low clustering and transmission metrics in Figure 3a. By 2024, the network’s evolution into a stable hierarchy with strengthened Tier 1 hubs and robust inter-tier connections marked its successful transition through recovery to the evolution phase, evidenced by improved matching and hierarchy indicators.
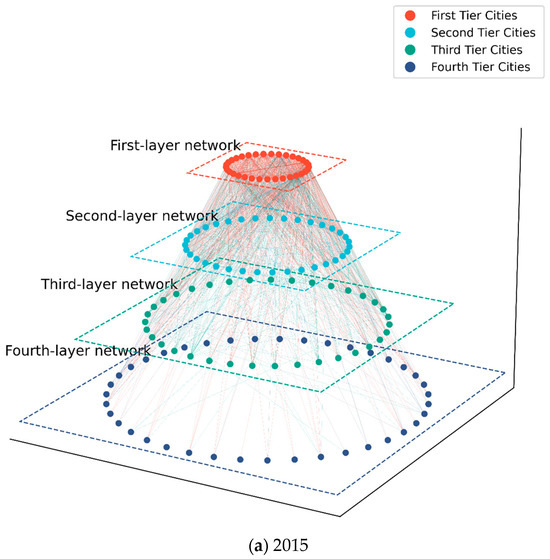
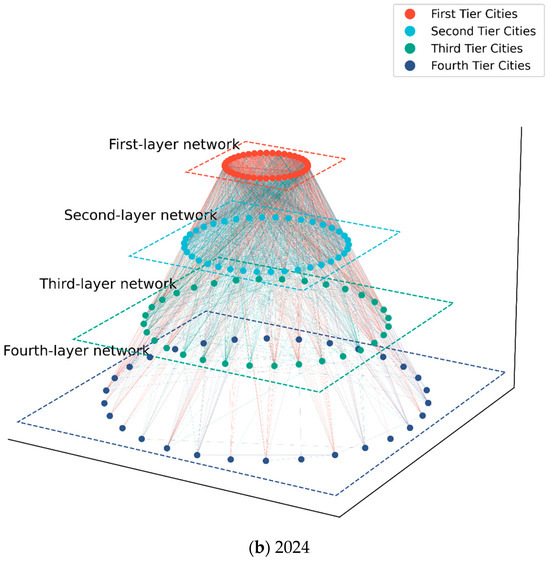
Figure 4.
Node resilience layering diagram. (a) 2015. (b) 2024.
This structural progression perfectly mirrors the theoretical resilience framework, where the network’s ability to reorganize beyond its initial state is demonstrated through enhanced transmission pathways and clustering patterns. The visual contrast between the early vulnerable configuration and the later evolved structure provides empirical validation for the system’s capacity to absorb shocks and achieve greater stability, as predicted by the network structure characteristics mapped in Figure 3a and the phase transitions diagrammed in Figure 3b.
Figure 5 illustrates the temporal evolution of node and edge resilience. In 2014, the network exhibited a core–periphery structure with low density and fragmented links, heavily reliant on a few core cities like Beijing, Shanghai, and Guangzhou. Over the next decade, connectivity improved significantly, transforming the network into a multi-center, multi-level system. This shift was driven by national policies such as the National New Urbanization Plan and the 13th Five-Year Plan for Scientific and Technological Innovation, which promoted balanced regional development and inter-city knowledge sharing. Infrastructure projects like the high-speed rail expansion and initiatives such as the Beijing–Tianjin–Hebei Coordinated Development Strategy further strengthened edge resilience by facilitating faster and more frequent collaboration between core and peripheral cities.
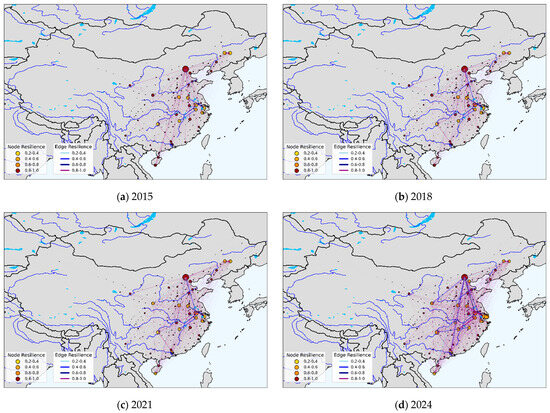
Figure 5.
Time-series evolution of node resilience and edge resilience. (a) 2015. (b) 2018. (c) 2021. (d) 2024.
Despite these advancements, regional disparities persist. While eastern hubs like the Yangtze River Delta and Greater Bay Area benefit from well-established policies like the Regional Integration Development Plans, western and northeastern cities face slower progress due to weaker institutional support and fewer resource-sharing mechanisms. Recent strategies such as the Western Development Revitalization Plan and the 14th Five-Year Plan’s emphasis on multi-polar innovation nodes aim to address these gaps by fostering emerging hubs like Chengdu, Wuhan, and Xi’an. However, the network’s edge resilience remains uneven, highlighting the need for more targeted policy interventions to ensure long-term stability and equitable knowledge diffusion across all regions.
These resilience patterns align with recent findings on organizational adaptation to external disruptions. As some scholar demonstrated through a longitudinal analysis of U.S. knowledge-intensive organizations, when entities fail to meet historical or social aspiration levels (e.g., during COVID-19 disruptions), they actively diversify technological knowledge repositories—a behavior moderated by their existing knowledge footprint [37]. This mechanism provides a micro-foundational explanation for our observed macro-level network transformations: (1) the declining hierarchy reflects decentralized knowledge diversification strategies, (2) stable clustering suggests path-dependent adaptation constrained by regional knowledge footprints, and (3) emerging cities’ edge strength growth manifests as collective responses to unmet innovation aspirations.
The kernel density estimation (KDE) plots in Figure 6 were generated using a Gaussian kernel smoothing technique to visualize the probability density distribution of resilience contribution values. The implementation utilizes Python’s Seaborn library with key parameters including a bandwidth adjustment factor (bw_adjust = 0.5) to control the smoothness of the density curves. The x-axis represents normalized contribution values ranging from 0 to 1, where higher values indicate greater resilience contributions from network elements. The y-axis shows the estimated probability density, with the area under each curve integrating to unity. The plots employ a fill transparency (alpha = 0.8) to enhance visual clarity while maintaining the visibility of grid lines and background elements. For temporal comparison, identical axis scales and plot dimensions were maintained across all years (2015–2024), with node resilience shown in gray (#808080) and edge resilience in teal (#5F9EA0) to facilitate immediate visual distinction between the two network components. The density curves effectively capture both the central tendencies and dispersion characteristics of resilience contributions for each year.
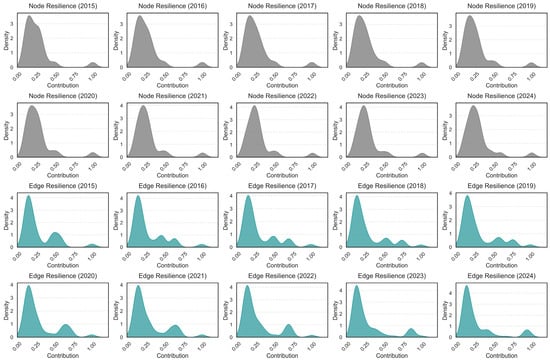
Figure 6.
Kernel density.
The kernel density plots reveal distinct patterns in the evolution of network resilience characteristics from 2015 to 2024. For node resilience, the gray-colored distributions consistently exhibit a right-skewed unimodal shape across all years, with peak densities concentrated in the lower contribution range (0.2–0.4) and gradually tapering off towards higher values. This persistent pattern suggests that most nodes in the network consistently provide moderate resilience contributions, with relatively few nodes offering either very low or very high contributions. The stability of these distributions over time indicates that the fundamental role distribution of nodes in maintaining network resilience remained largely unchanged throughout the decade, despite potential changes in network size or structure.
The teal-colored edge resilience distributions show more pronounced temporal variations while maintaining their characteristic single-peaked form. The early years (2015–2017) displayed broader distributions with flatter peaks, suggesting greater variability in edge contributions during this period. As time progressed, the distributions became progressively more concentrated, with the later years (2020–2024) showing sharper peaks and narrower ranges. This evolution implies that the network’s edge resilience mechanisms became more standardized and efficient over time, with edges increasingly clustered around optimal contribution levels. The leftward shift in peak positions indicates that the network gradually adapted to achieve sufficient resilience with lower individual edge contributions.
3.2. Network Resilience
In this study, we calculate the overall network density of China’s urban networks and examine the structural changes in four network types, business flow, knowledge flow, education flow, and economy flow, across different time dimensions (2014–2024). To more accurately capture the characteristics of urban networks, this study departs from traditional binary classifications and instead adopts an innovative three-valued classification method. Given the significant variation in data sources, we differentiate between the core network and general network to distinguish urban connections of varying strengths. The results are presented in Table 3 below.
Table 3.
Network density statistics.
Based on multi-dimensional data from China’s urban KIN, this study examines changes in the network density of different innovation elements, including business flows, knowledge flows, education flows, and economy flows, among cities between 2014 and 2024. Overall, the network density of each type of flow exhibits an upward trend; however, significant differences exist in the diffusion patterns of various innovation factors, reflecting the heterogeneity among cities in terms of foreign capital inflows, knowledge spillovers, science and education collaboration, and economic linkages.
The core network density of business flows fluctuates within a narrow range of 0.140 to 0.147, indicating that multinational investment remains concentrated in a few core cities. Meanwhile, the rising density of general networks suggests that foreign investment is gradually diffusing to a broader range of cities. The steady increase in the core network density of knowledge flows implies that innovative knowledge is becoming more interconnected among core cities, while the rising density of general networks reflects the expansion of knowledge spillover effects, contributing to the overall enhancement of regional innovation capacity.
The core network density of education flows declines in certain years, indicating that higher education and research cooperation still primarily depend on a few core cities. In contrast, the relatively stable general network density suggests that the distribution pattern of science and education resources has not undergone significant changes. Conversely, the core network density of economy flows has increased from 0.059 to 0.081, signifying stronger economic linkages among innovation core cities. However, the limited change in general network density suggests that economic factor flows still heavily rely on core nodes and have yet to form extensive network synergies.
Overall, China’s urban KIN continues to develop, with more pronounced diffusion effects in foreign capital and knowledge flows, whereas science and education resources and economic linkages remain largely concentrated in core cities. This indicates that the agglomeration effect of the innovation network remains significant. Further optimization of resource allocation and the promotion of a more balanced flow of innovation factors will be essential for fostering the synergistic development of regional innovation.
Table 4 and Figure 7 below illustrate the evolutionary characteristics of the network structure metrics. Both hierarchy and matching show the slope term. The primary coordinates of Figure 7 are bar graphs and the secondary coordinates are line graphs.
Table 4.
Temporal evolution diagram.
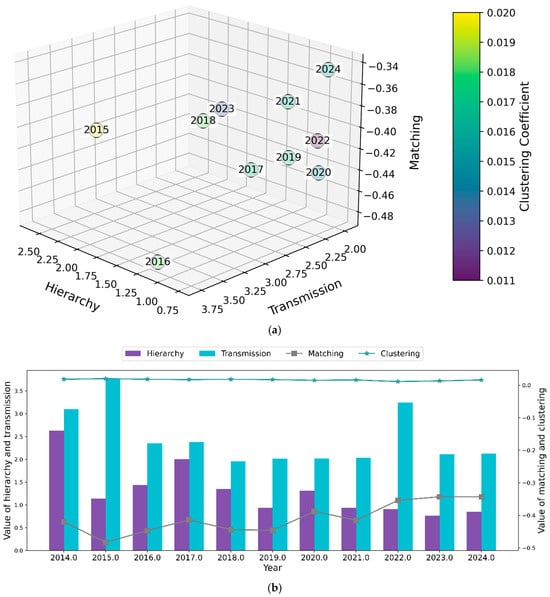
Figure 7.
(a) Three-dimensional evolution diagram. (b) Evolution of network properties.
The 3D scatter plot in Figure 7a systematically visualizes the temporal evolution of three network metrics—hierarchy, transmission, and matching—from 2015 to 2024. Each data point, labeled with its respective year, occupies a position in the 3D space defined by these axes, while its color intensity (gradient: deep purple to bright yellow) quantitatively represents the clustering value, with darker hues indicating lower coefficients (e.g., 2022 at 0.011) and lighter tones denoting higher values (e.g., 2015 at 0.020).
The temporal evolution of the network metrics in Table 4 reveals critical insights into China’s knowledge cooperation dynamics under external disruptions. The steady decline in hierarchy (from 2.627 in 2014 to 0.851 in 2024) signifies a structural shift toward polycentric governance, where knowledge authority becomes increasingly decentralized—a pattern corroborated by our conceptual model (Figure 5c) showing how external shocks trigger network restructuring through polycentric adaptation. This aligns with some scholar’s micro-level findings that organizations diversify knowledge repositories when facing unmet innovation aspirations, as the flattening hierarchy reflects collective efforts to mitigate systemic vulnerabilities through broader participation.
Notably, the persistent negative matching coefficients (−0.420 to −0.343) and stable clustering (0.018–0.011) demonstrate path-dependent adaptation constrained by regional knowledge footprints, echoing the proximity effects in our model. While transmission efficiency fluctuates (peaking at 3.762 in 2015), its overall growth (2.125 in 2024 vs. 3.101 in 2014) suggests strengthened inter-city linkages—consistent with the knowledge diversification to resilience enhancement pathway visualized in Figure 5c. These metrics collectively validate that China’s network resilience emerges from polycentric reorganization (reducing hierarchy) and localized learning (maintaining clustering), while spatial disparities in matching reflect uneven knowledge footprint effects.
This study identifies the following evolutionary characteristics based on the analysis of data from 2014 to 2024:
Declining hierarchy: The knowledge network has experienced a reduction in hierarchical structure. The hierarchy metric decreased from around 2.627 in 2014 to approximately 0.851 in 2024, suggesting a shift toward a more balanced and less centralized structure. Despite fluctuations in 2015 and 2017, the overall trend has remained downward, likely due to the decentralization of innovation resources and changes in the structure of knowledge dissemination.
Decline in transmission: The efficiency of knowledge flow has steadily declined. The transmission value decreased from 3.762 in 2015 to 2.125 in 2024, reflecting reduced accessibility and efficiency in knowledge dissemination.
Relatively stable matching: The alignment between innovation entities in the network has remained largely unchanged. The matching value slightly decreased from −0.420 in 2014 to −0.343 in 2024, suggesting only minor changes in the trend toward network homogenization. Despite this slight decline, network heterogeneity remains relatively stable, indicating that collaborative relationships among innovation entities have not undergone significant changes and that the network has maintained a balanced state.
Stable clustering: Regional innovation collaboration has remained largely stable. The clustering value decreased slightly from 0.018 in 2014 to 0.016 in 2024. While clustering showed slight increases in 2015 and 2021, the overall trend remained stable. This suggests that the existing infrastructure and policy support for regional collaborative innovation have remained effective. However, the future improvement of agglomeration effects may face new challenges, requiring sustained diversification and openness in innovation resources.
3.3. Network Vulnerability
In this study, we conducted the simulation using Python (3.11.7) and its NetworkX library. After 20 min of computation, the results of 2024 were obtained, as summarized in Figure 8 below. Degree attacks represent connectivity loss, closeness attacks represent propagation delays, and betweenness attacks represent structural splitting.
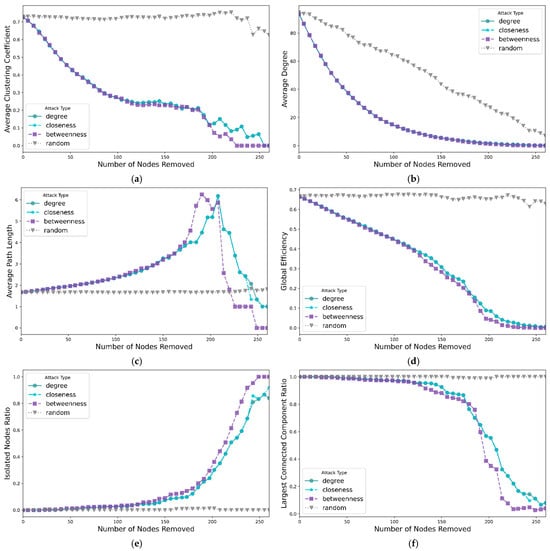
Figure 8.
Network destruction resistance simulation. (a) Average clustering coefficient. (b) Average degree. (c) Average path length. (d) Global efficiency. (e) Isolated nodes ratio. (f) Largest connected component ratio.
Average clustering coefficient analysis: It can be observed that betweenness attack, closeness attack, and degree attack lead to a sharp decline in clustering, whereas random attack has a relatively minor effect. This suggests that nodes with high betweenness centrality or high closeness centrality play a crucial role in maintaining local structural cohesion. Since nodes with high betweenness centrality often act as bridges between multiple sub-networks, their removal disrupts local clustering, thereby reducing the network’s overall modularity. The closeness attack, however, follows a slightly different mechanism—by removing nodes with short average paths (which are typically located at the network core), the stability of local connectivity diminishes, leading to a weaker clustering structure. These findings highlight the importance of strengthening local clustering structures to enhance network resilience, ensuring that local connectivity remains robust even if core nodes are compromised.
Average degree analysis: Our findings indicate that all attack strategies lead to a decline in the network’s average degree, though the magnitude of impact varies by strategy. Degree attack, closeness attack, and betweenness attack cause a rapid decline in the average degree, as these strategies preferentially remove nodes with high connectivity or high betweenness centrality, significantly reducing the number of connections of the remaining nodes. In contrast, random attack has the least impact on the average degree, suggesting that randomly removing nodes fails to effectively disrupt key connectivity points, allowing the network to maintain a certain level of topology.
Average path length: As the number of node removals increases, attacks based on betweenness centrality cause a dramatic rise in the path length, suggesting that the removal of critical nodes has the most significant impact on network connectivity. Degree attacks also lead to a notable increase in path length, although the effect is somewhat less pronounced. In contrast, random attacks cause the smallest change, resulting in a more moderate increase in path length. These findings emphasize that node centrality is crucial for maintaining network efficiency.
Global efficiency analysis: Our results demonstrate that all attack strategies reduce global efficiency, with the betweenness attack having the most severe impact. Global efficiency measures the overall capability of information transfer within the network, and its decline signifies increased communication inefficiencies and reduced system responsiveness. In our experiments, the betweenness attack caused a rapid decay in global efficiency, while the degree attack had a slightly smaller but still significant effect on network communication. In contrast, random attacks exhibited the least impact, indicating that random node removal does not severely disrupt critical path structures. The closeness attack has a more complex influence, primarily fragmenting the core region, making the previously efficient communication network more decentralized. This result underscores the importance of identifying and protecting high betweenness centrality nodes as a defense strategy to maintain network efficiency and resilience against targeted attacks.
Maximum connectivity subgraph ratio: The proportion of the maximally connected subgraph provides further insights into network connectivity degradation under different attack strategies. Our analysis reveals that betweenness and closeness attacks rapidly reduce this ratio, while random attacks have the least effect. This suggests that nodes with high betweenness centrality serve as critical communication hubs, essential for maintaining the overall connectivity of the network. When these nodes are removed, the network fragments quickly into multiple smaller subgraphs, leading to significant connectivity loss. Degree attacks also weaken connectivity, particularly in networks with a high concentration of highly connected nodes. In contrast, the random attack causes a more gradual decline, implying that the network retains some adaptive capacity when faced with non-targeted disruptions. These findings highlight the importance of introducing redundant connections in network design to enhance structural robustness, ensuring the network remains stable even when critical nodes are removed.
Proportion of isolated nodes: As the number of removed nodes increases, the proportion of isolated nodes in the network gradually rises, with the most pronounced effects observed in betweenness attack and closeness attack. These two attack strategies prioritize the removal of nodes with high global or local centrality, causing a substantial number of dependent nodes to lose connectivity and become isolated. In contrast, degree attacks initially exhibit a slower impact on the growth of isolated nodes, as the removed high-degree nodes may still allow some low-degree nodes to remain connected via alternative paths. However, as the degree-based attack progresses, the growth rate of isolated nodes accelerates. On the other hand, random attacks, which do not specifically target critical nodes, result in a slower increase in isolated nodes, indicating that the network can maintain some level of connectivity under non-targeted attacks. This phenomenon further underscores the necessity of strengthening redundant connections in network design to ensure that even when critical nodes are removed, the remaining nodes retain a certain level of accessibility, thereby mitigating isolation and enhancing overall network resilience.
The results indicate that betweenness attacks are the most destructive, leading to the rapid deterioration of multiple network metrics. Through quantitative analysis, we identify that nodes with high degree centrality play a critical role in maintaining network stability, while closeness centrality also significantly impacts network connectivity in certain cases. The analytical results presented in this study provide a valuable reference for network optimization and defense strategy formulation. In particular, when designing defense mechanisms against targeted attacks, priority should be given to protecting these critical nodes to maintain network functionality and accessibility.
3.4. Driving Factors
Figure 9 presents the evolution of node resilience and edge resilience under different contextual factors; specifically, (a) and (b) represent the economic proximity, (c) and (d) correspond to the educational proximity, and (e) and (f) illustrate the opening proximity. Additionally, Table 5 reports the MRQAP regression results obtained using UCINET 6.186 with 2000 permutations, a random number seed of 474, and significance values calculated using the permutation test.
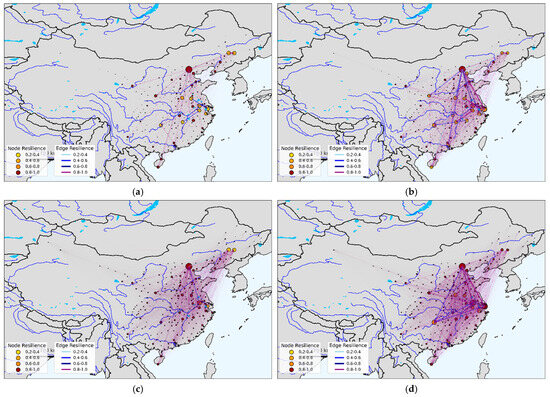
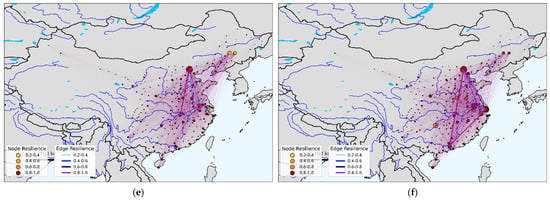
Figure 9.
Network of independent variables. (a) Eco-2014. (b) Eco-2024. (c) Edu-2014. (d) Edu-2024. (e) Ope-2014. (f) Ope-2024.
Table 5.
Result of MRQAP.
Based on Table 5, the economic proximity (eco), the educational proximity (edu), and the opening proximity (ope) exhibit significant changes in the structure of innovation cooperation networks between 2014 and 2024. While economic proximity exhibited a sparse network in 2014, with only a few core cities (e.g., Beijing and Shanghai) maintaining strong ties with other cities and an overall loose structure, the network density increased substantially in 2024, particularly in the eastern coastal region, indicating that the convergence of economic development has mitigated the barrier posed by economic disparity to innovation cooperation. The educational proximity exhibited a smaller-scale innovation cooperation network in 2014, with nodes and edges more decentralized; however, by 2024, the network expanded significantly, with closer ties established between cities with stronger higher education resources. This trend suggests that the increased influence of the educational environment on innovation cooperation may be linked to enhanced talent mobility, strengthened academic collaboration, and the greater sharing of research resources. In contrast, the opening proximity continued to play a facilitating role in 2014, but its influence was relatively limited and primarily concentrated in a few core cities. By 2024, its influence had diminished, with links weakening or even disappearing in certain regions, which may be attributed to policy adjustments, reduced reliance on foreign investment, or shifts in the international environment. Overall, these findings suggest that while economic and educational factors are increasingly driving innovation cooperation, external factors have become less influential over time.
From the regression analysis of Table 5, the educational proximity and cultural proximity have consistently demonstrated a significantly positive effect on urban innovation cooperation, indicating that these two factors are crucial for facilitating knowledge exchange and collaboration. Meanwhile, the influence of geographical proximity has remained stable, suggesting that physical distance continues to be one of the key determinants of inter-city innovation cooperation. In contrast, the opening proximity played a more pronounced facilitating role in 2019; however, its influence diminished and even turned negative in some models by 2024, which may be attributed to policy adjustments or a declining reliance on foreign investment. Similarly, economic proximity exerted an inhibitory effect on KIN in the earlier years, but its negative influence began to weaken by 2024, suggesting that the obstructive effect of economic disparities on innovation collaboration is gradually easing. In addition, the geography–economy interaction term exhibited a significant positive effect in 2024, indicating that geographic proximity strengthens the facilitation of innovation collaboration as economic development levels converge. This trend offers valuable insights for optimizing urban KIN structures and developing more effective regional cooperation policies. Future research may further investigate how spatial and economic factors collectively influence the formation of innovation ecosystems across different stages of development. Thus, H1 and H2 are accepted.
4. Conclusions and Recommendations
4.1. Conclusions
Hierarchical control in KIN evolution: The hierarchical structure of China’s knowledge innovation network (KIN) has shifted from a fragmented, weakly connected system in 2015 to a more stable, multi-tiered framework by 2024. Core cities (Tier 1) solidified their dominance as innovation hubs, while lower-tier cities strengthened intra-layer connections, particularly Tier 2–Tier 4 linkages. However, persistent centralization risks emerged, as evidenced by the skewed kernel density of node resilience, where Beijing, Shanghai, and Shenzhen accounted for disproportionate stability contributions.
Temporal evolution of node and edge resilience: Node and edge resilience exhibited divergent trajectories from 2015 to 2024. Core cities maintained high resilience through dense innovation ecosystems, while peripheral cities stagnated or declined, amplifying polarization. Kernel density estimation revealed a long-tail distribution, with a few city pairs (e.g., Beijing–Shanghai) anchoring network robustness, whereas most edges remained fragile. The rise of regional hubs like Chengdu and Xi’an signaled incremental diversification, yet their resilience contributions paled against core cities. This duality highlights the tension between agglomeration benefits and equitable network integration, with eastern regions sustaining superior edge strength due to entrenched economic and institutional advantages [38,39].
Kernel density and resilience disparities: The kernel density analysis of resilience metrics underscored extreme spatial concentration. Over 80% of nodes contributed minimally to network stability, while core cities’ resilience scores formed distinct high-density peaks. Edge resilience mirrored this pattern, with high-weight connections clustered among Tier 1 cities, creating a resilient backbone but leaving lower-tier linkages vulnerable. The persistent long-tail effect implies that disruptions to core nodes or edges—such as betweenness attacks—could trigger cascading failures. Addressing these disparities requires policies to elevate secondary cities’ innovation capacities and foster redundant connections, thereby flattening the resilience density curve [40].
Declining hierarchy, transmission, and stabilized clustering: Network metrics from 2014 to 2024 revealed critical structural shifts: hierarchy declined sharply (2.627 to 0.851), signaling reduced centralization, while transmission efficiency dropped (3.101 to 2.125), indicating slower knowledge diffusion despite improved connectivity. Matching values remained stable (−0.420 to −0.343), reflecting consistent collaboration patterns among heterogeneous nodes. Clustering stabilized at 0.016, suggesting sustained regional collaboration but limited expansion of innovation triangles. These trends imply that while polycentric development progressed, network homogenization and transmission bottlenecks emerged as unintended consequences, urging strategies to enhance cross-tier knowledge flows and cluster interoperability.
Network vulnerability to targeted attacks: Simulation results demonstrated that betweenness attacks caused the most severe degradation, rapidly fragmenting the network by disrupting critical bridges. Degree and closeness attacks also impaired connectivity and propagation efficiency, respectively, but with lesser magnitude. The average path length surged under betweenness attacks, while global efficiency plummeted, exposing a reliance on hub nodes. Conversely, random attacks had marginal impacts, emphasizing the network’s resilience to non-targeted disruptions. These findings mandate prioritizing the protection of high-betweenness nodes (e.g., inter-regional gateways) and investing in decentralized, small-world structures to mitigate systemic risks.
Driving factors and policy implications: MRQAP regression identified educational proximity and cultural proximity as stable positive drivers of innovation ties, while opening proximity’s influence turned negative by 2024, reflecting reduced reliance on foreign capital. Economic proximity’s inhibitory effect weakened post-2020, coinciding with regional convergence policies. Notably, the geography–economy interaction term gained significance, suggesting that co-location amplifies collaboration when economic disparities diminish. Policymakers must leverage these dynamics by fostering educational alliances, inter-city talent mobility, and equitable economic integration to sustain network evolution.
4.2. Recommendations
Strengthening core cities and emerging tech hubs: Core cities like Beijing, Shanghai, and Guangzhou must enhance their leading roles in knowledge networks, optimizing innovation resource allocation and fostering technology diffusion to neighboring regions. Emerging tech hubs such as Chengdu, Wuhan, and Xi’an should be elevated through policy support and strategic partnerships, promoting cross-regional R&D collaboration and improving commercialization efficiency. Increased investment in high-tech sectors like AI, biomedicine, and new energy will attract global companies and enhance these cities’ competitiveness in national and global innovation networks.
Enhancing synergy in city clusters: Innovation collaboration within major city clusters like Beijing–Tianjin–Hebei and the Yangtze River Delta needs further strengthening. Governments should promote cross-regional R&D systems among universities, research institutions, and enterprises, supported by improved transportation and digital infrastructure. Establishing cross-regional R&D funds and optimizing incentive mechanisms will enhance knowledge sharing, accelerate tech transformation, and build a more resilient, integrated innovation system.
Balancing regional development and global integration: To reduce regional disparities, innovation resources should be directed toward underdeveloped areas through targeted policies and collaborative innovation subsidies. Marginal cities with weaker innovation capacities need differentiated support to better integrate into the national knowledge network. Globally, China should adapt foreign investment policies to foster innovation consortia between foreign and domestic entities while strengthening international R&D cooperation to enhance its position in the global knowledge network.
Mitigating network vulnerability through decentralized resilience strategies: Given the disproportionate reliance on core nodes revealed by kernel density analysis, structural reforms must prioritize redundancy in inter-city connections. Secondary innovation hubs like Changsha and Hefei should be developed as alternative gateways, creating parallel knowledge pathways that bypass traditional core cities. This involves incentivizing multinational corporations to establish R&D centers in Tier 2 cities and mandating cross-regional collaboration clauses in national megaprojects. Simultaneously, digital twin technologies could simulate cascading failure scenarios to identify and reinforce vulnerable edges, particularly those linking emerging regional clusters. Such measures would flatten the resilience density curve while preserving agglomeration benefits.
Revitalizing knowledge transmission through institutional innovation: The declining transmission efficiency metrics call for novel mechanisms to accelerate cross-tier knowledge diffusion. A national innovation voucher system could be implemented, allowing SMEs in peripheral cities to access core cities’ research facilities and intellectual property pools. Concurrently, the establishment of mobile “innovation caravans”—temporary co-working spaces staffed by rotating experts from top-tier universities—would circulate cutting-edge knowledge to lower-tier cities. To overcome cultural and administrative barriers, these efforts should be coupled with standardized IP arbitration frameworks across provinces, reducing transaction costs in inter-city collaborations. Such interventions would address the observed stagnation in clustering metrics while preventing network homogenization.
Cultivating proximity-driven innovation ecosystems: Building on MRQAP findings about educational and cultural proximity, place-based policies should create micro-clusters that leverage geographic co-location. Special economic zones could be redesigned as “innovation watersheds,” where adjacent cities jointly govern shared R&D infrastructure based on comparative advantages—for instance, pairing Xi’an’s aerospace strengths with Lanzhou’s materials science capabilities through integrated testing facilities. Additionally, a national innovation census should map latent cultural and educational complementarities between cities, informing the design of targeted sister-city programs. This approach would operationalize the geography–economy interaction effect, transforming passive proximity into active collaboration drivers while mitigating the negative spillovers from opening proximity observed post-2024.
4.3. Limitations and Future Research Directions
This study has several limitations that should be acknowledged. First, while we focused on network structural characteristics, we did not account for several key proximity dimensions that may influence inter-city innovation collaboration patterns. Specifically, we excluded the following: (1) organizational proximity refers to the tendency for innovation actors to collaborate within shared administrative boundaries, where cities within the same Chinese province (administered by common provincial institutions) typically exhibit stronger collaborative ties; (2) institutional proximity reflects the degree of similarity in market-oriented institutional environments between cities, measurable through the China Marketization Index, where cities with comparable marketization levels tend to facilitate smoother innovation resource flows; (3) cognitive proximity indicates the similarity in knowledge bases between cities, operationalized through innovation indices derived from patent value models; and (4) technological proximity represents the similarity in technological specializations, measurable through the consistency of cities’ patent portfolios. These exclusions were necessary due to significant data constraints, including the lack of standardized city-level measurements across China’s 300 prefecture-level cities and the difficulty in obtaining consistent longitudinal data for these indicators. Additionally, incorporating these factors would substantially increase model complexity while potentially introducing measurement errors given current data limitations.
Future research should address these limitations through several approaches. First, developing comprehensive urban innovation databases with standardized proximity indicators would enable more robust analyses. Second, adopting comparative case study methods could help examine how different proximity dimensions interact in specific regional contexts. Third, exploring alternative data sources such as enterprise surveys or patent co-application networks may provide more direct measures of these proximity dimensions. These methodological improvements would allow future studies to better understand the complex interplay between network structure and various proximity factors in shaping China’s innovation geography.
Author Contributions
Conceptualization, T.Z., J.L., and C.S.; methodology, T.Z.; software, T.Z.; validation, T.Z., J.L., and C.S; formal analysis, T.Z., J.L.; investigation, T.Z., J.L.; resources, T.Z.; data curation, T.Z.; writing—original draft preparation, T.Z.; writing—review and editing, T.Z., J.L., X.M., and S.Z.; visualization, T.Z., J.L., C.S., and S.Z.; supervision, J.L., C.S., and S.Z.; project administration, J.L., C.S., and S.Z.; funding acquisition, J.L., C.S., and S.Z. All authors have read and agreed to the published version of the manuscript.
Funding
Our research is supported by grants from the National Social Science Fund of China, 11BTJ007 and 19XSH017.
Data Availability Statement
Dataset available on request from the authors.
Acknowledgments
During the preparation of this work, the authors used ChatGPT 4o in order to refine, edit, and condense sections of the paper. After using this tool/service, the authors reviewed and edited the content as needed and take full responsibility for the content of the publication. All individuals acknowledged in this section have provided explicit consent for their inclusion.
Conflicts of Interest
Authors are required to disclose financial or non-financial interests that are directly or indirectly related to the work submitted for publication.
References
- Du, Y.; Wang, Q.; Song, Y.; Xin, Y. How cross-regional collaborative innovation networks affect regional economic resilience: Evidence from 283 cities in China. Technol. Forecast. Soc. Change 2025, 215, 124057. [Google Scholar] [CrossRef]
- Zhang, S.; Wang, X. Does innovative city construction improve the industry–university–research knowledge flow in urban China? Technol. Forecast. Soc. Change 2022, 174, 121200. [Google Scholar] [CrossRef]
- Liu, H.; Li, X.; Tian, S.; Guan, Y. Research on the evaluation of resilience and influencing factors of the urban network structure in the three provinces of Northeast China based on multiple flows. Buildings 2022, 12, 945. [Google Scholar] [CrossRef]
- Dekker, D.; Krackhardt, D.; Snijders, T.A. Sensitivity of MRQAP tests to collinearity and autocorrelation conditions. Psychometrika 2007, 72, 563–581. [Google Scholar] [CrossRef]
- Capone, F.; Lazzeretti, L.; Innocenti, N. Innovation and diversity: The role of knowledge networks in the inventive capacity of cities. Small Bus. Econ. 2021, 56, 773–788. [Google Scholar] [CrossRef]
- Sebestyén, H.; Li, P. Processes of building cross-border knowledge pipelines. Res. Policy 2020, 49, 103928. [Google Scholar] [CrossRef]
- Zhao, C.; Wang, K.; Dong, K. How does innovative city policy break carbon lock-in? A spatial difference-in-differences analysis for China. Cities 2023, 136, 104249. [Google Scholar] [CrossRef]
- Chen, H.; Song, X.; Jin, Q.; Wang, X. Network dynamics in university-industry collaboration: A collaboration-knowledge dual-layer network perspective. Scientometrics 2022, 127, 6637–6660. [Google Scholar] [CrossRef]
- Wang, C.; Hu, Q. Knowledge sharing in supply chain networks: Effects of collaborative innovation activities and capability on innovation performance. Technovation 2020, 94, 102010. [Google Scholar] [CrossRef]
- Raco, M.; Street, E. Resilience planning, economic change and the politics of post-recession development in London and Hong Kong. Urban Stud. 2012, 49, 1065–1087. [Google Scholar] [CrossRef]
- Sebestyén, T.; Varga, A. Knowledge networks in regional development: An agent-based model its application. Reg. Study 2019, 53, 1333–1343. [Google Scholar] [CrossRef]
- Chen, X.; Mao, J.; Ma, Y.; Li, G. The knowledge linkage between science and technology influences corporate technological innovation: Evidence from scientific publications and patents. Technol. Forecast. Soc. Change 2024, 198, 122985. [Google Scholar] [CrossRef]
- Shi, J.; Wang, X.; Wang, C.; Liu, H.; Miao, Y.; Ci, F. Evaluation and influencing factors of network resilience in Guangdong-Hong Kong-Macao Greater Bay Area: A structural perspective. Sustainability 2022, 14, 8005. [Google Scholar] [CrossRef]
- Hu, S.; Chen, G.; Miao, C. Understanding the structural evolution and driving mechanisms of urban network using firm-level big data and TERGM modeling. Cities 2025, 161, 105869. [Google Scholar] [CrossRef]
- Shi, W.; Wang, Q. The framework for analyzing the mechanism of the evolution of inter-city relationship networks on regional economic resilience. PLoS ONE 2024, 19, e0308280. [Google Scholar] [CrossRef]
- Martin, R.; Gardiner, B. The resilience of cities to economic shocks: A tale of four recessions (and the challenge of Brexit). Pap. Reg. Sci. 2019, 98, 1801–1833. [Google Scholar] [CrossRef]
- Kou, L.; Zhao, H. Regional resilience assessment based on city network risk propagation and cooperative recovery. Cities 2024, 147, 104856. [Google Scholar] [CrossRef]
- Wei, S.; Pan, J. Resilience of urban network structure in China: The perspective of disruption. ISPRS Int. J. Geo-Inf. 2021, 10, 796. [Google Scholar] [CrossRef]
- Zhang, X.; Huang, Y. What factors affect the structural resilience of urban networks during COVID-19 epidemic? A comparative analysis in China. Int. J. Sustain. Dev. World Ecol. 2022, 29, 858–874. [Google Scholar] [CrossRef]
- Gong, H.; Hassink, R.; Tan, J.; Huang, D. Regional resilience in times of a pandemic crisis: The case of COVID-19 in China. Tijdschr. Voor Econ. Soc. Geogr. 2020, 111, 497–512. [Google Scholar] [CrossRef]
- Al-Omoush, K.S.; Ribeiro-Navarrete, S.; Lassala, C.; Skare, M. Networking and knowledge creation: Social capital and collaborative innovation in responding to the COVID-19 crisis. J. Innov. Knowl. 2022, 7, 100181. [Google Scholar] [CrossRef]
- Belhadi, A.; Kamble, S.; Jabbour, C.J.C.; Gunasekaran, A.; Ndubisi, N.O.; Venkatesh, M. Manufacturing and service supply chain resilience to the COVID-19 outbreak: Lessons learned from the automobile and airline industries. Technol. Forecast. Soc. Change 2021, 163, 120447. [Google Scholar] [CrossRef]
- Li, Y.; Zobel, C.W.; Seref, O.; Chatfield, D. Network characteristics and supply chain resilience under conditions of risk propagation. Int. J. Prod. Econ. 2020, 223, 107529. [Google Scholar] [CrossRef]
- Liu, Q.; Chen, R.; Yu, Q. Improving sustainable performance of China’s new energy industry through collaborative innovation network resilience. Renew. Sustain. Energy Rev. 2024, 201, 114625. [Google Scholar] [CrossRef]
- Feng, X.; Xu, M.; Li, J.; Gao, Z. Analysis of China’s industrial network structure and its resilience from the sectoral perspective. Habitat. Int. 2024, 153, 103192. [Google Scholar] [CrossRef]
- Ye, S.; Qian, Z. The economic network resilience of the Guanzhong plain city cluster, China: A network analysis from the evolutionary perspective. Growth Change 2021, 52, 2391–2411. [Google Scholar] [CrossRef]
- Balland, P.A.; Boschma, R.; Frenken, K. Proximity and Innovation: From Statics to Dynamics. Reg. Stud. 2014, 49, 907–920. [Google Scholar] [CrossRef]
- Dalmarco, G.; Hulsink, W.; Zawislak, P.A. New perspectives on university-industry relations: An analysis of the knowledge flow within two sectors and two countries. Technol. Anal. Strateg. Manag. 2019, 31, 1314–1326. [Google Scholar] [CrossRef]
- Salavisa, I.; Sousa, C.; Fontes, M. Topologies of innovation networks in knowledge-intensive sectors: Sectoral differences in the access to knowledge and complementary assets through formal and informal ties. Technovation 2012, 32, 380–399. [Google Scholar] [CrossRef]
- Maier, B.F. Generalization of the small-world effect on a model approaching the Erdős–Rényi random graph. Sci. Rep. 2019, 9, 9268. [Google Scholar] [CrossRef]
- Barabási, A.L.; Bonabeau, E. Scale-free networks. Sci. Am. 2003, 288, 50–59. [Google Scholar] [CrossRef] [PubMed]
- Xu, G.; Gong, L.; Yang, Z.; Liu, X.Y. What makes spider silk fibers so strong? From molecular-crystallite network to hierarchical network structures. Soft Matter 2014, 10, 2116–2123. [Google Scholar] [CrossRef]
- Wang, D.; Ren, X.; Wang, X. Assessing multilayer network robustness under asymmetric coupling using motif entropy. Chaos Solitons Fractals 2025, 194, 116238. [Google Scholar] [CrossRef]
- Huang, Y.; Hong, T.; Ma, T. Urban network externalities, agglomeration economies and urban economic growth. Cities 2020, 107, 102882. [Google Scholar] [CrossRef]
- Boschma, R. Proximity and Innovation: A Critical Assessment. Reg. Stud. 2005, 39, 61–74. [Google Scholar] [CrossRef]
- Knoben, J.; Oerlemans, L.A.G. Proximity and inter-organizational collaboration: A literature review. Int. J. Manag. Rev. 2006, 8, 71–89. [Google Scholar] [CrossRef]
- Vlas, C.O.; Vlas, R.E.; Robinson, W.N.; Masoud, Y. How do external disruptions affect technological knowledge repository diversification? The role of repositories’ historical and social aspiration levels and knowledge footprint. Knowl. Process Manag. 2023, 30, 110–121. [Google Scholar] [CrossRef]
- Che, L.; Xu, J.; Chen, H.; Sun, D.; Wang, B.; Zheng, Y.; Peng, Z. Evaluation of the spatial effect of network resilience in the Yangtze river delta: An integrated framework for regional collaboration and governance under disruption. Land 2022, 11, 1359. [Google Scholar] [CrossRef]
- Ma, T.; Hong, W.; Cao, Z.; Zhang, L.; Yang, X. Connection patterns and resilience simulation of innovation network in the context of technology transfer: A case study of strategic emerging industries in the Guangdong-Hong Kong-Macao Greater Bay Area. Sustain. Cities Soc. 2024, 106, 105396. [Google Scholar] [CrossRef]
- Cheng, K.; Wang, X.; Liu, S.; Zhuang, Y. Spatial differences and dynamic evolution of economic resilience: From the perspective of China’s eight comprehensive economic zones. Econ. Change Restruct. 2024, 57, 73. [Google Scholar] [CrossRef]

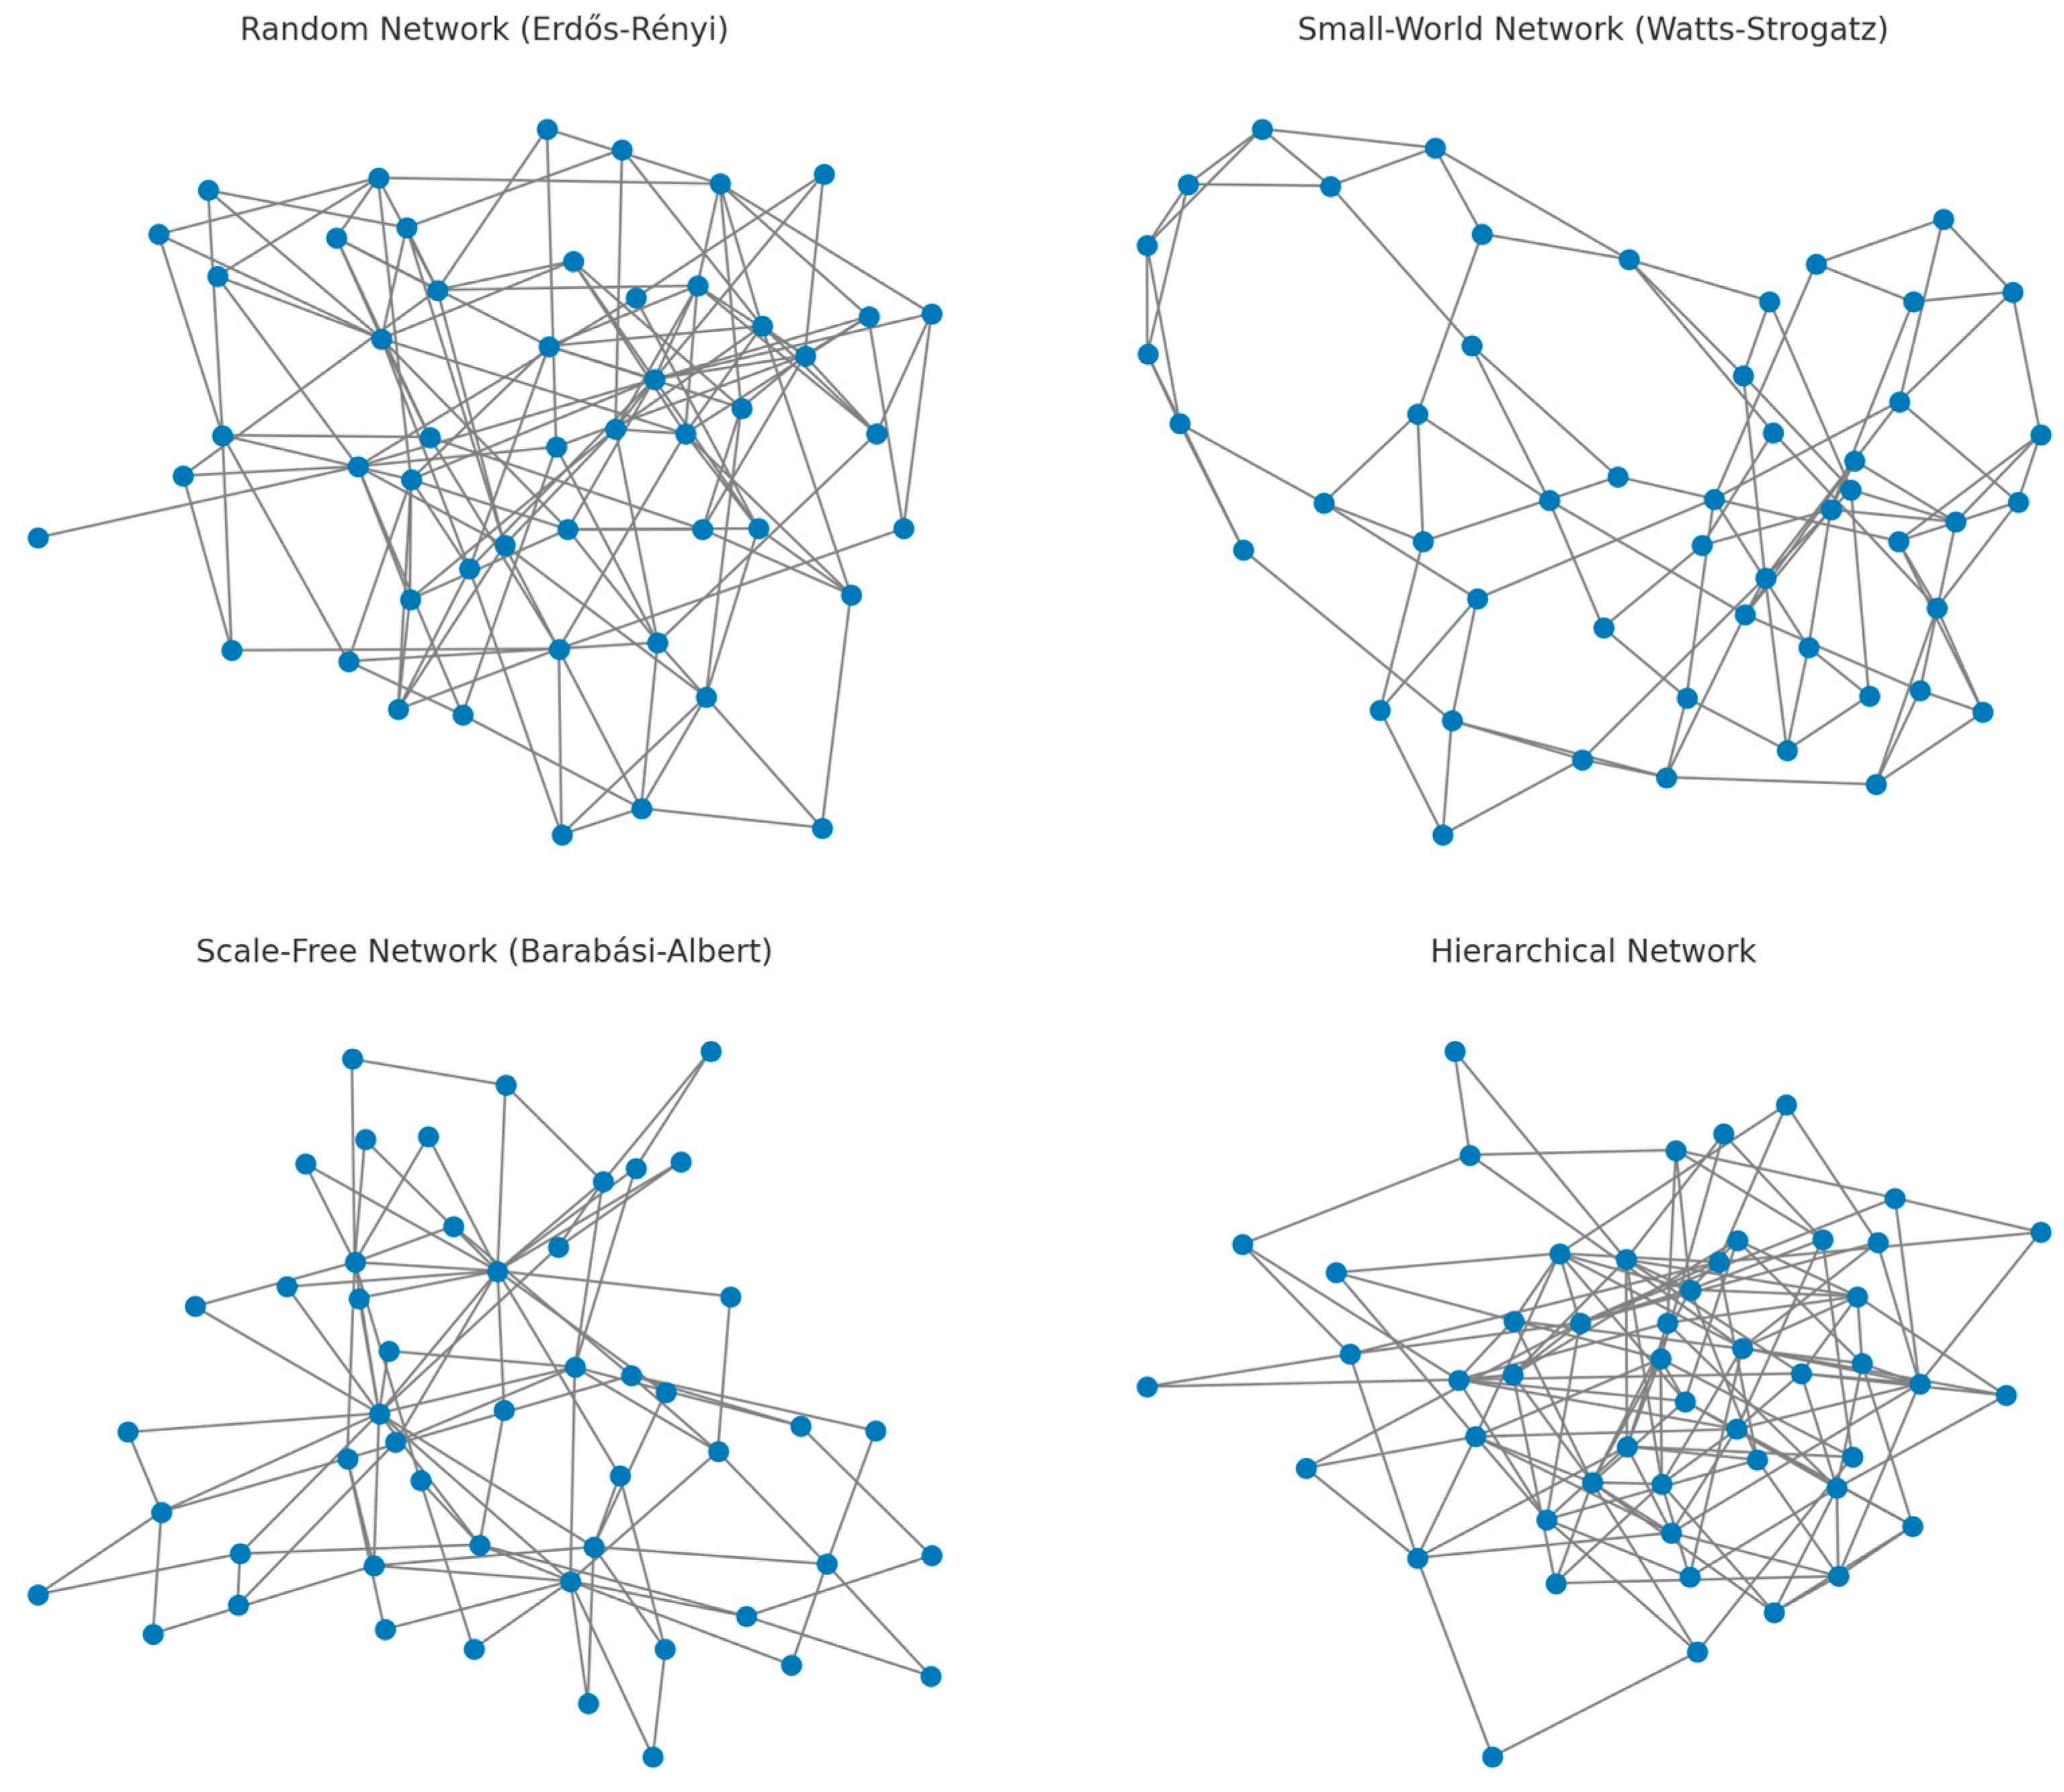
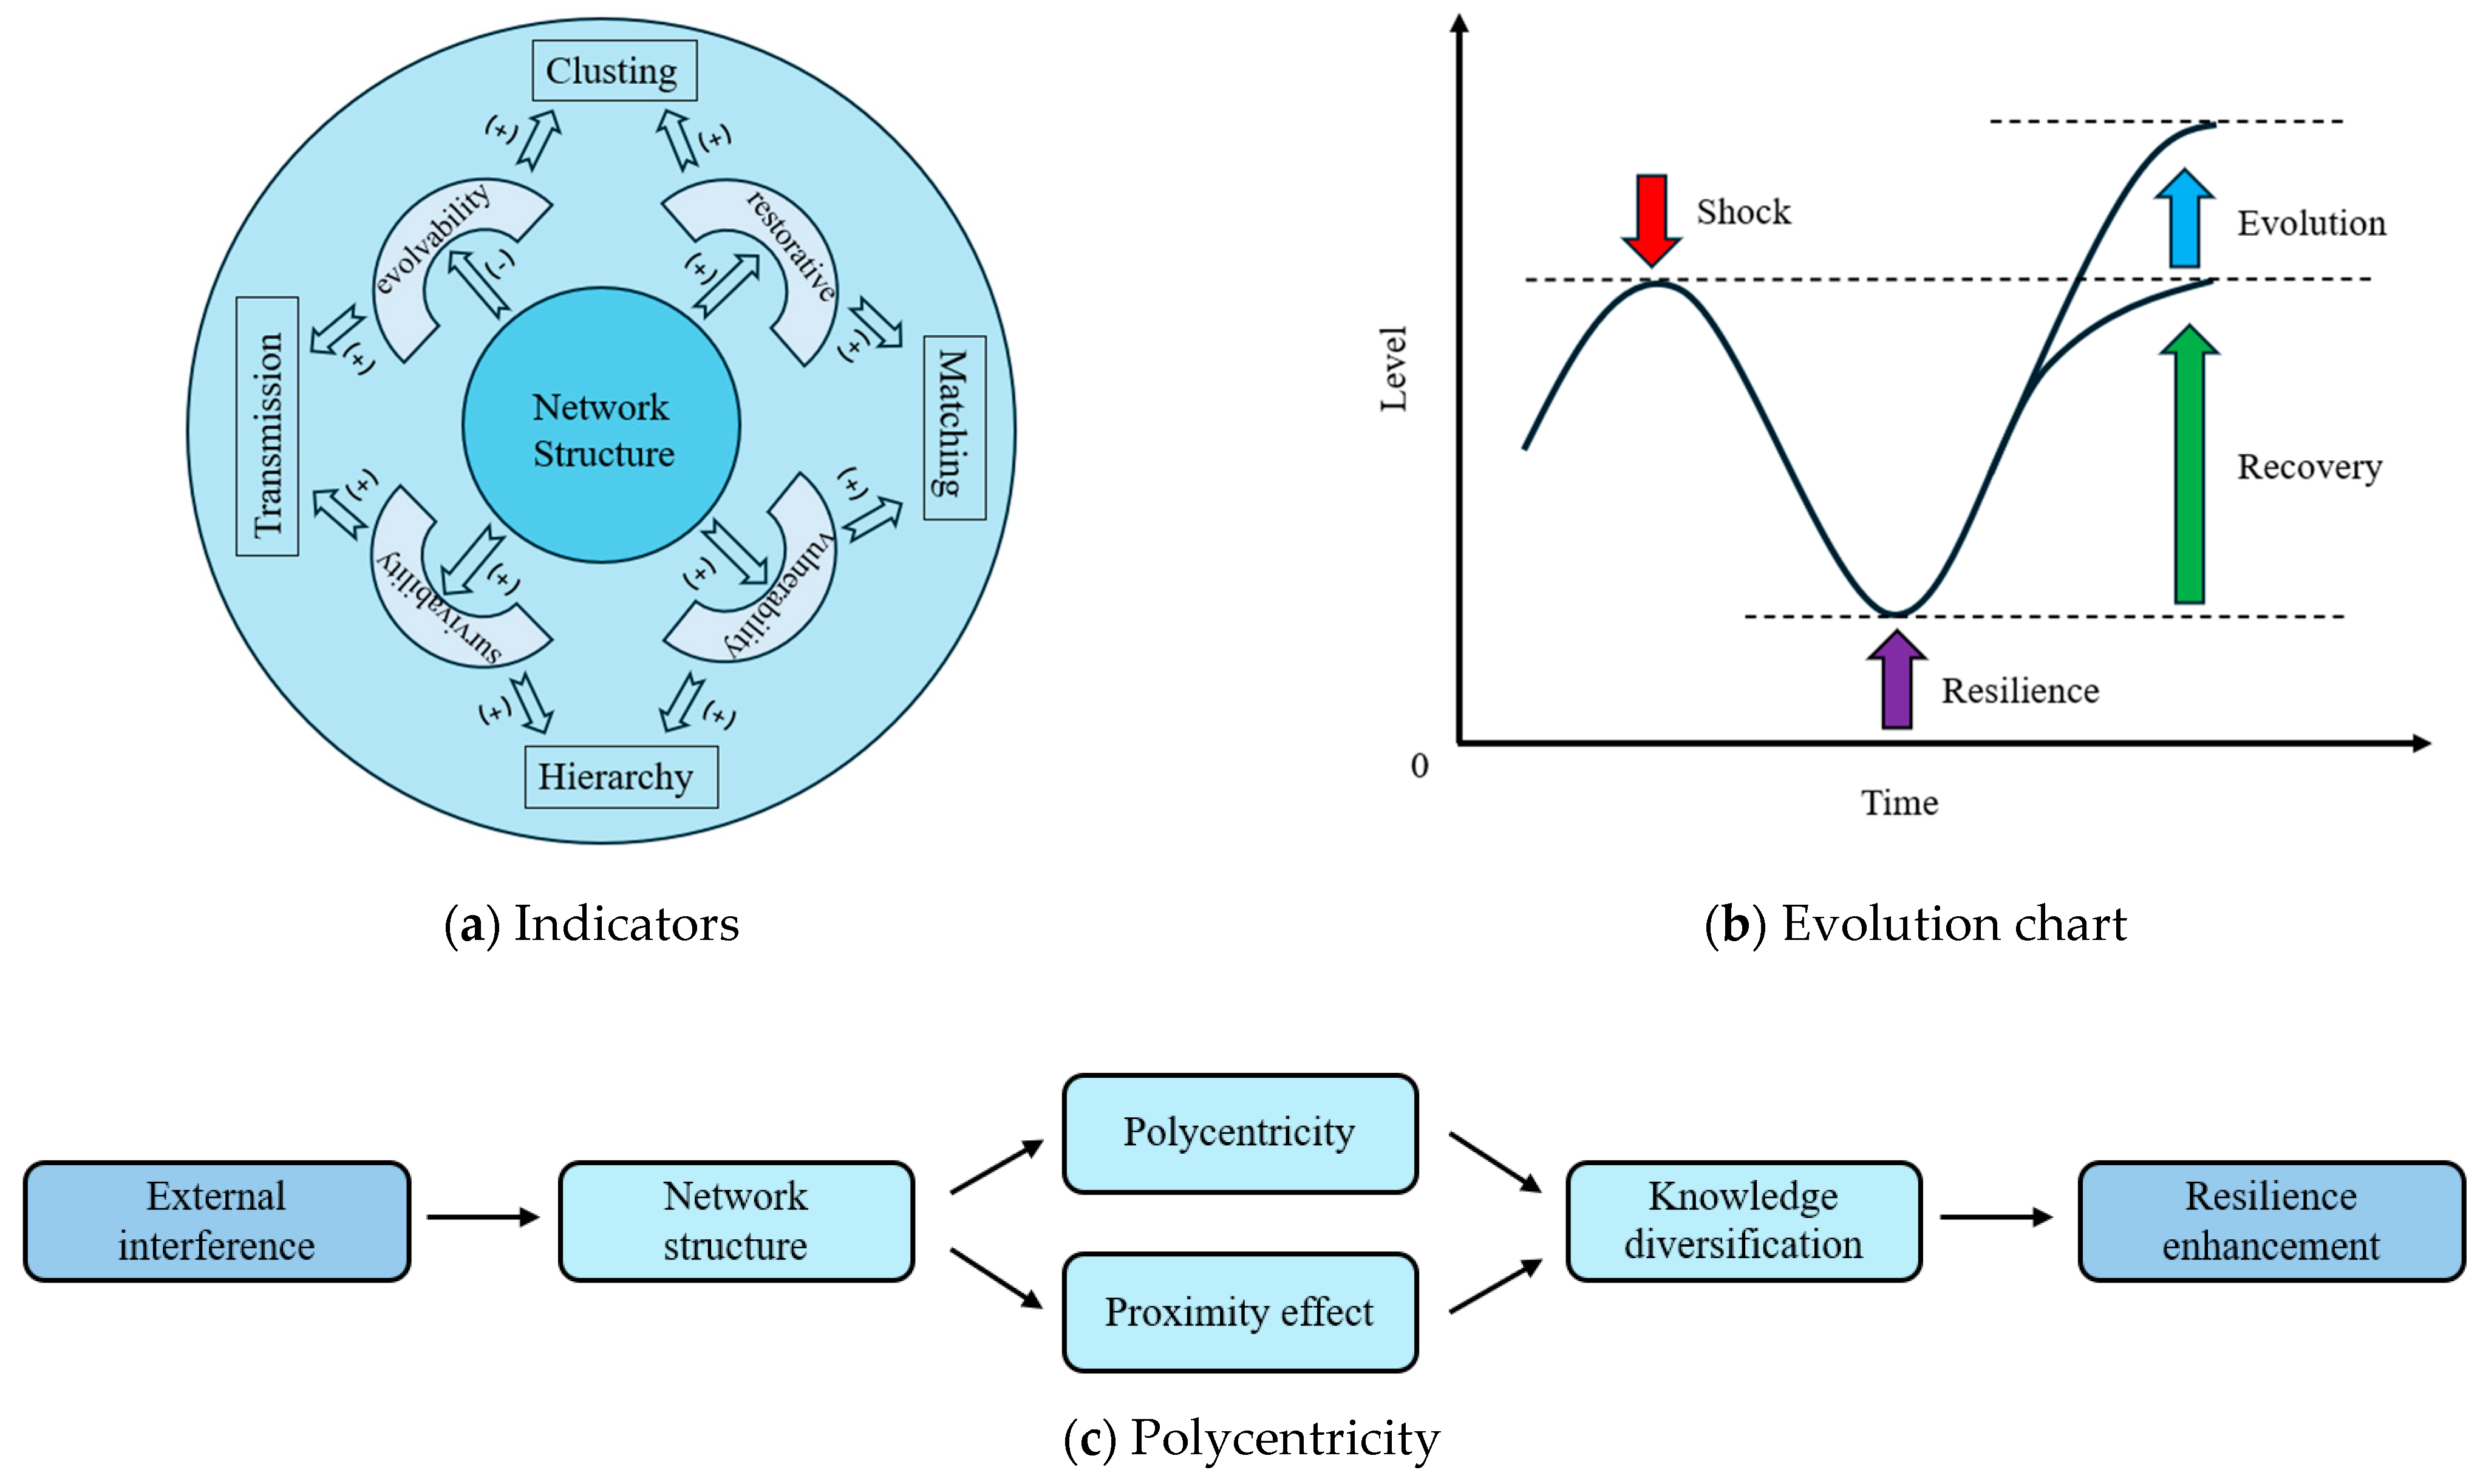
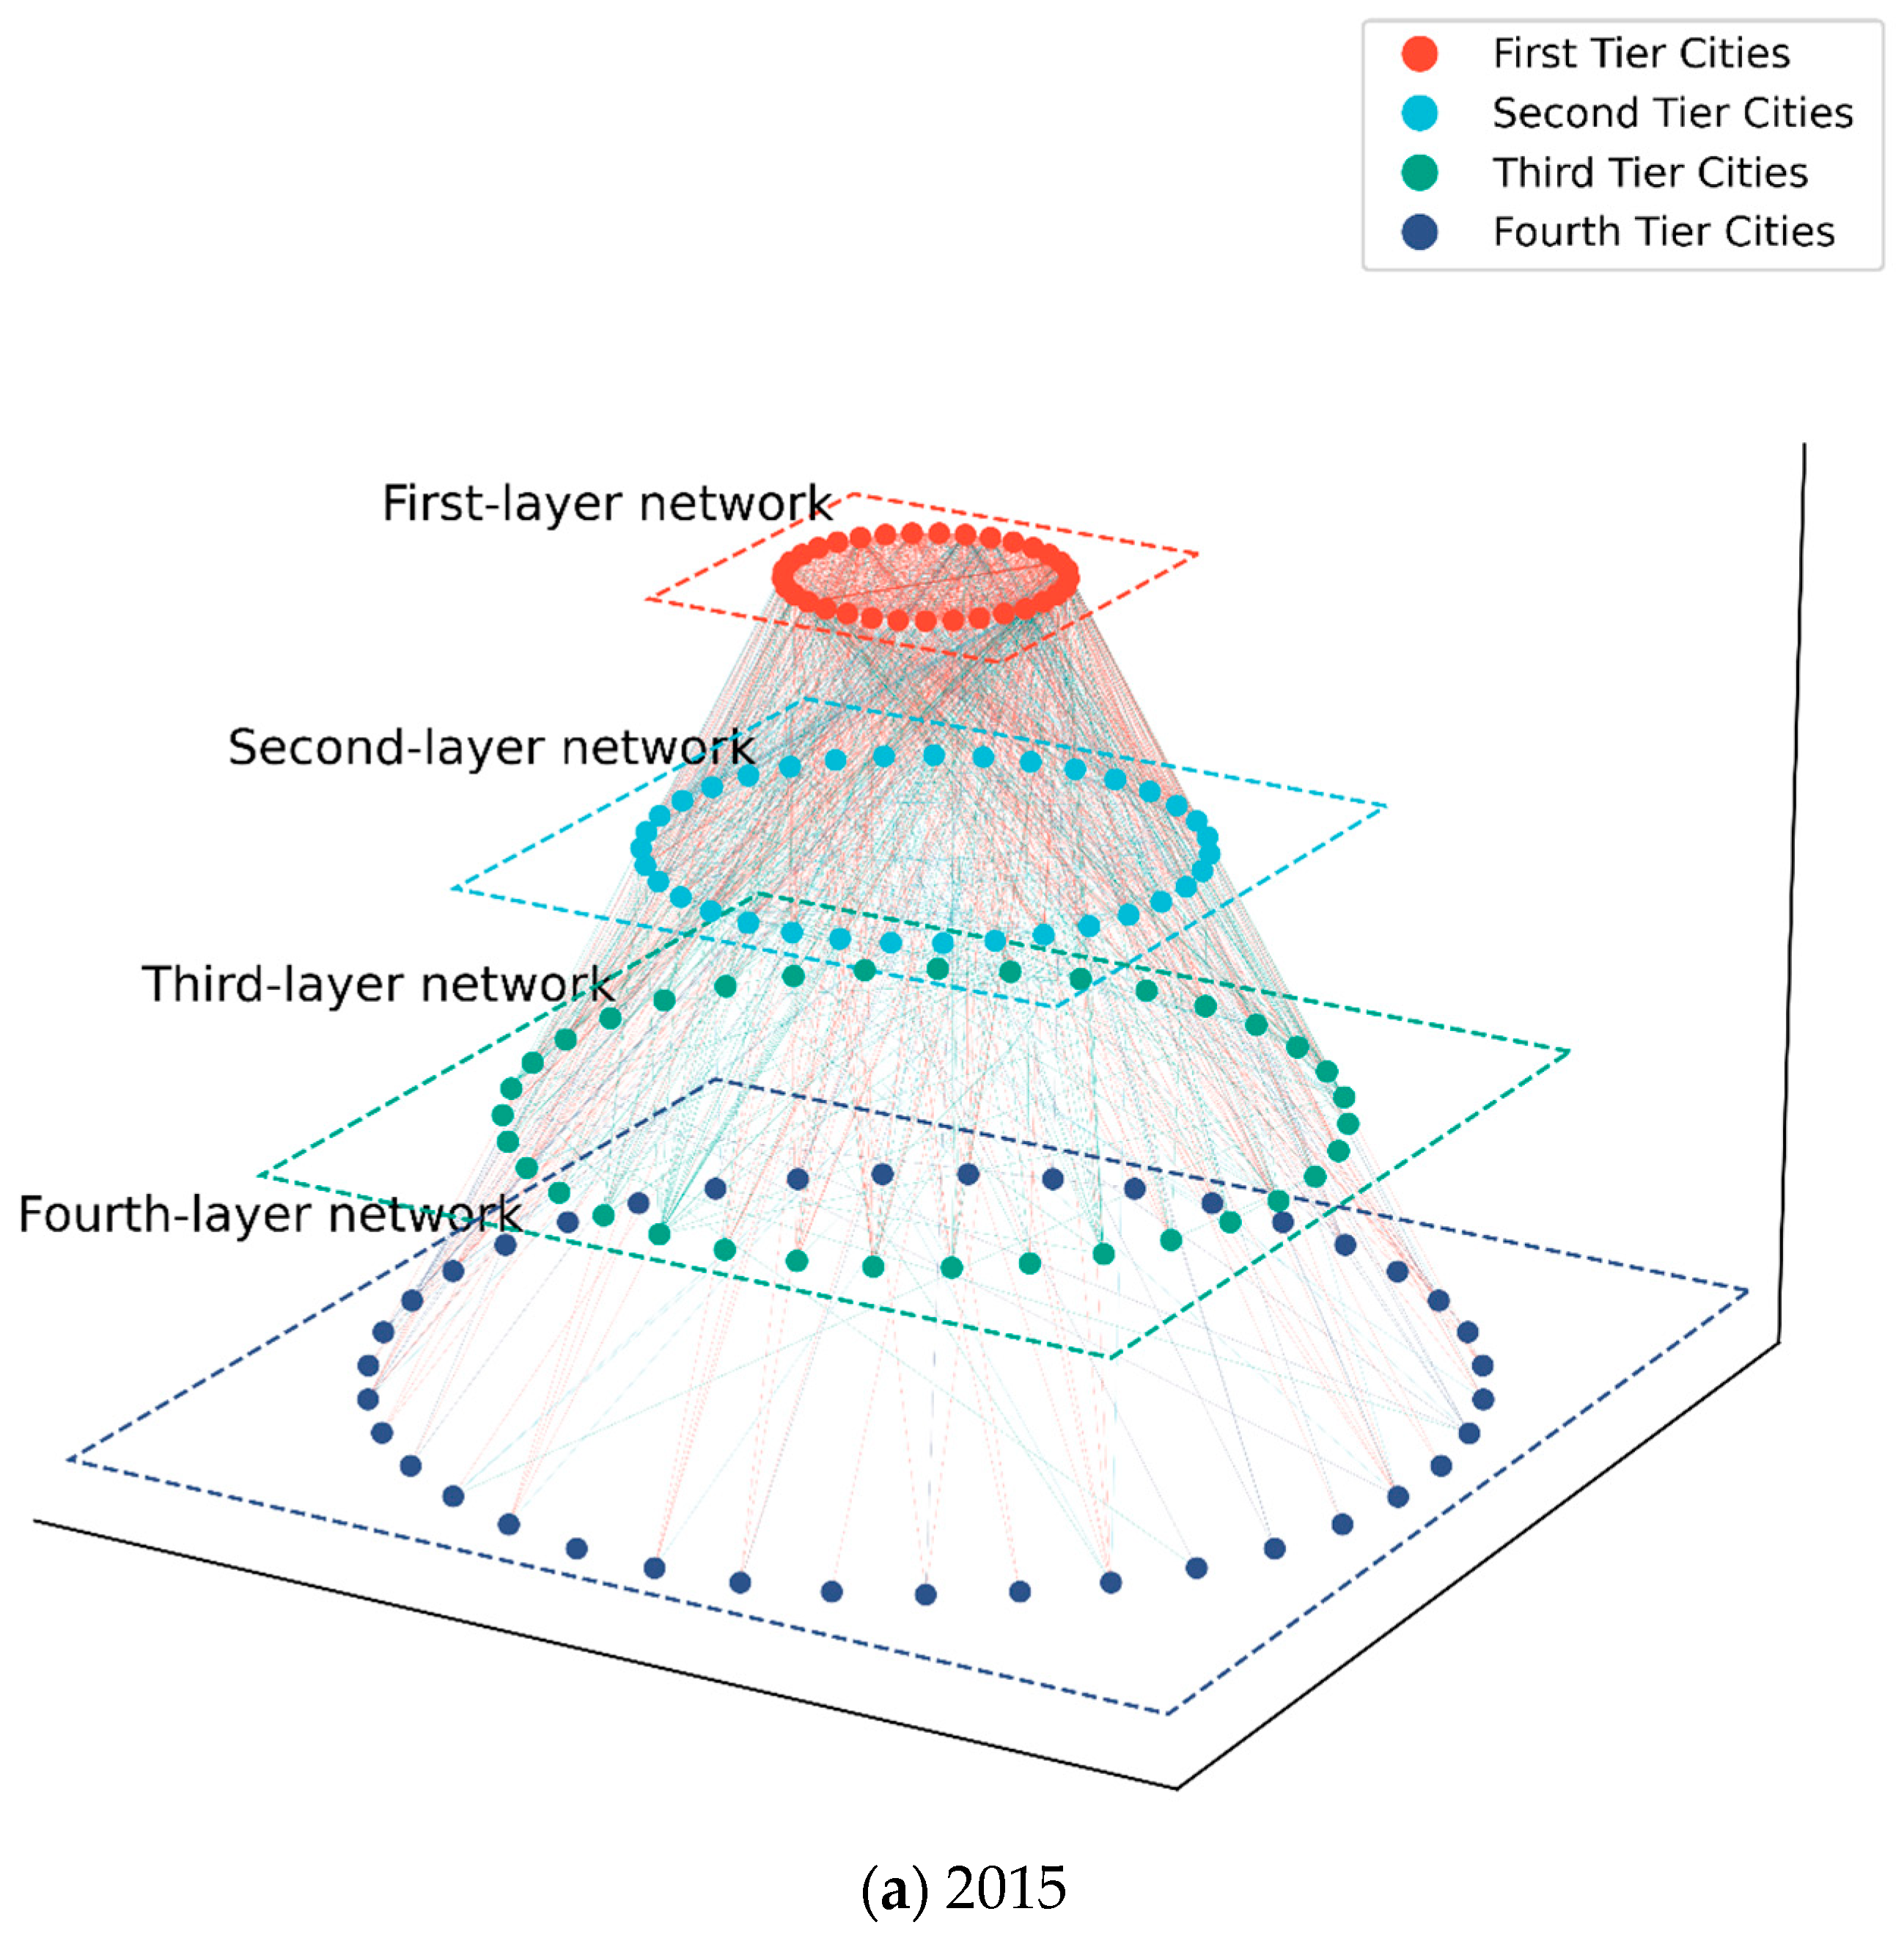
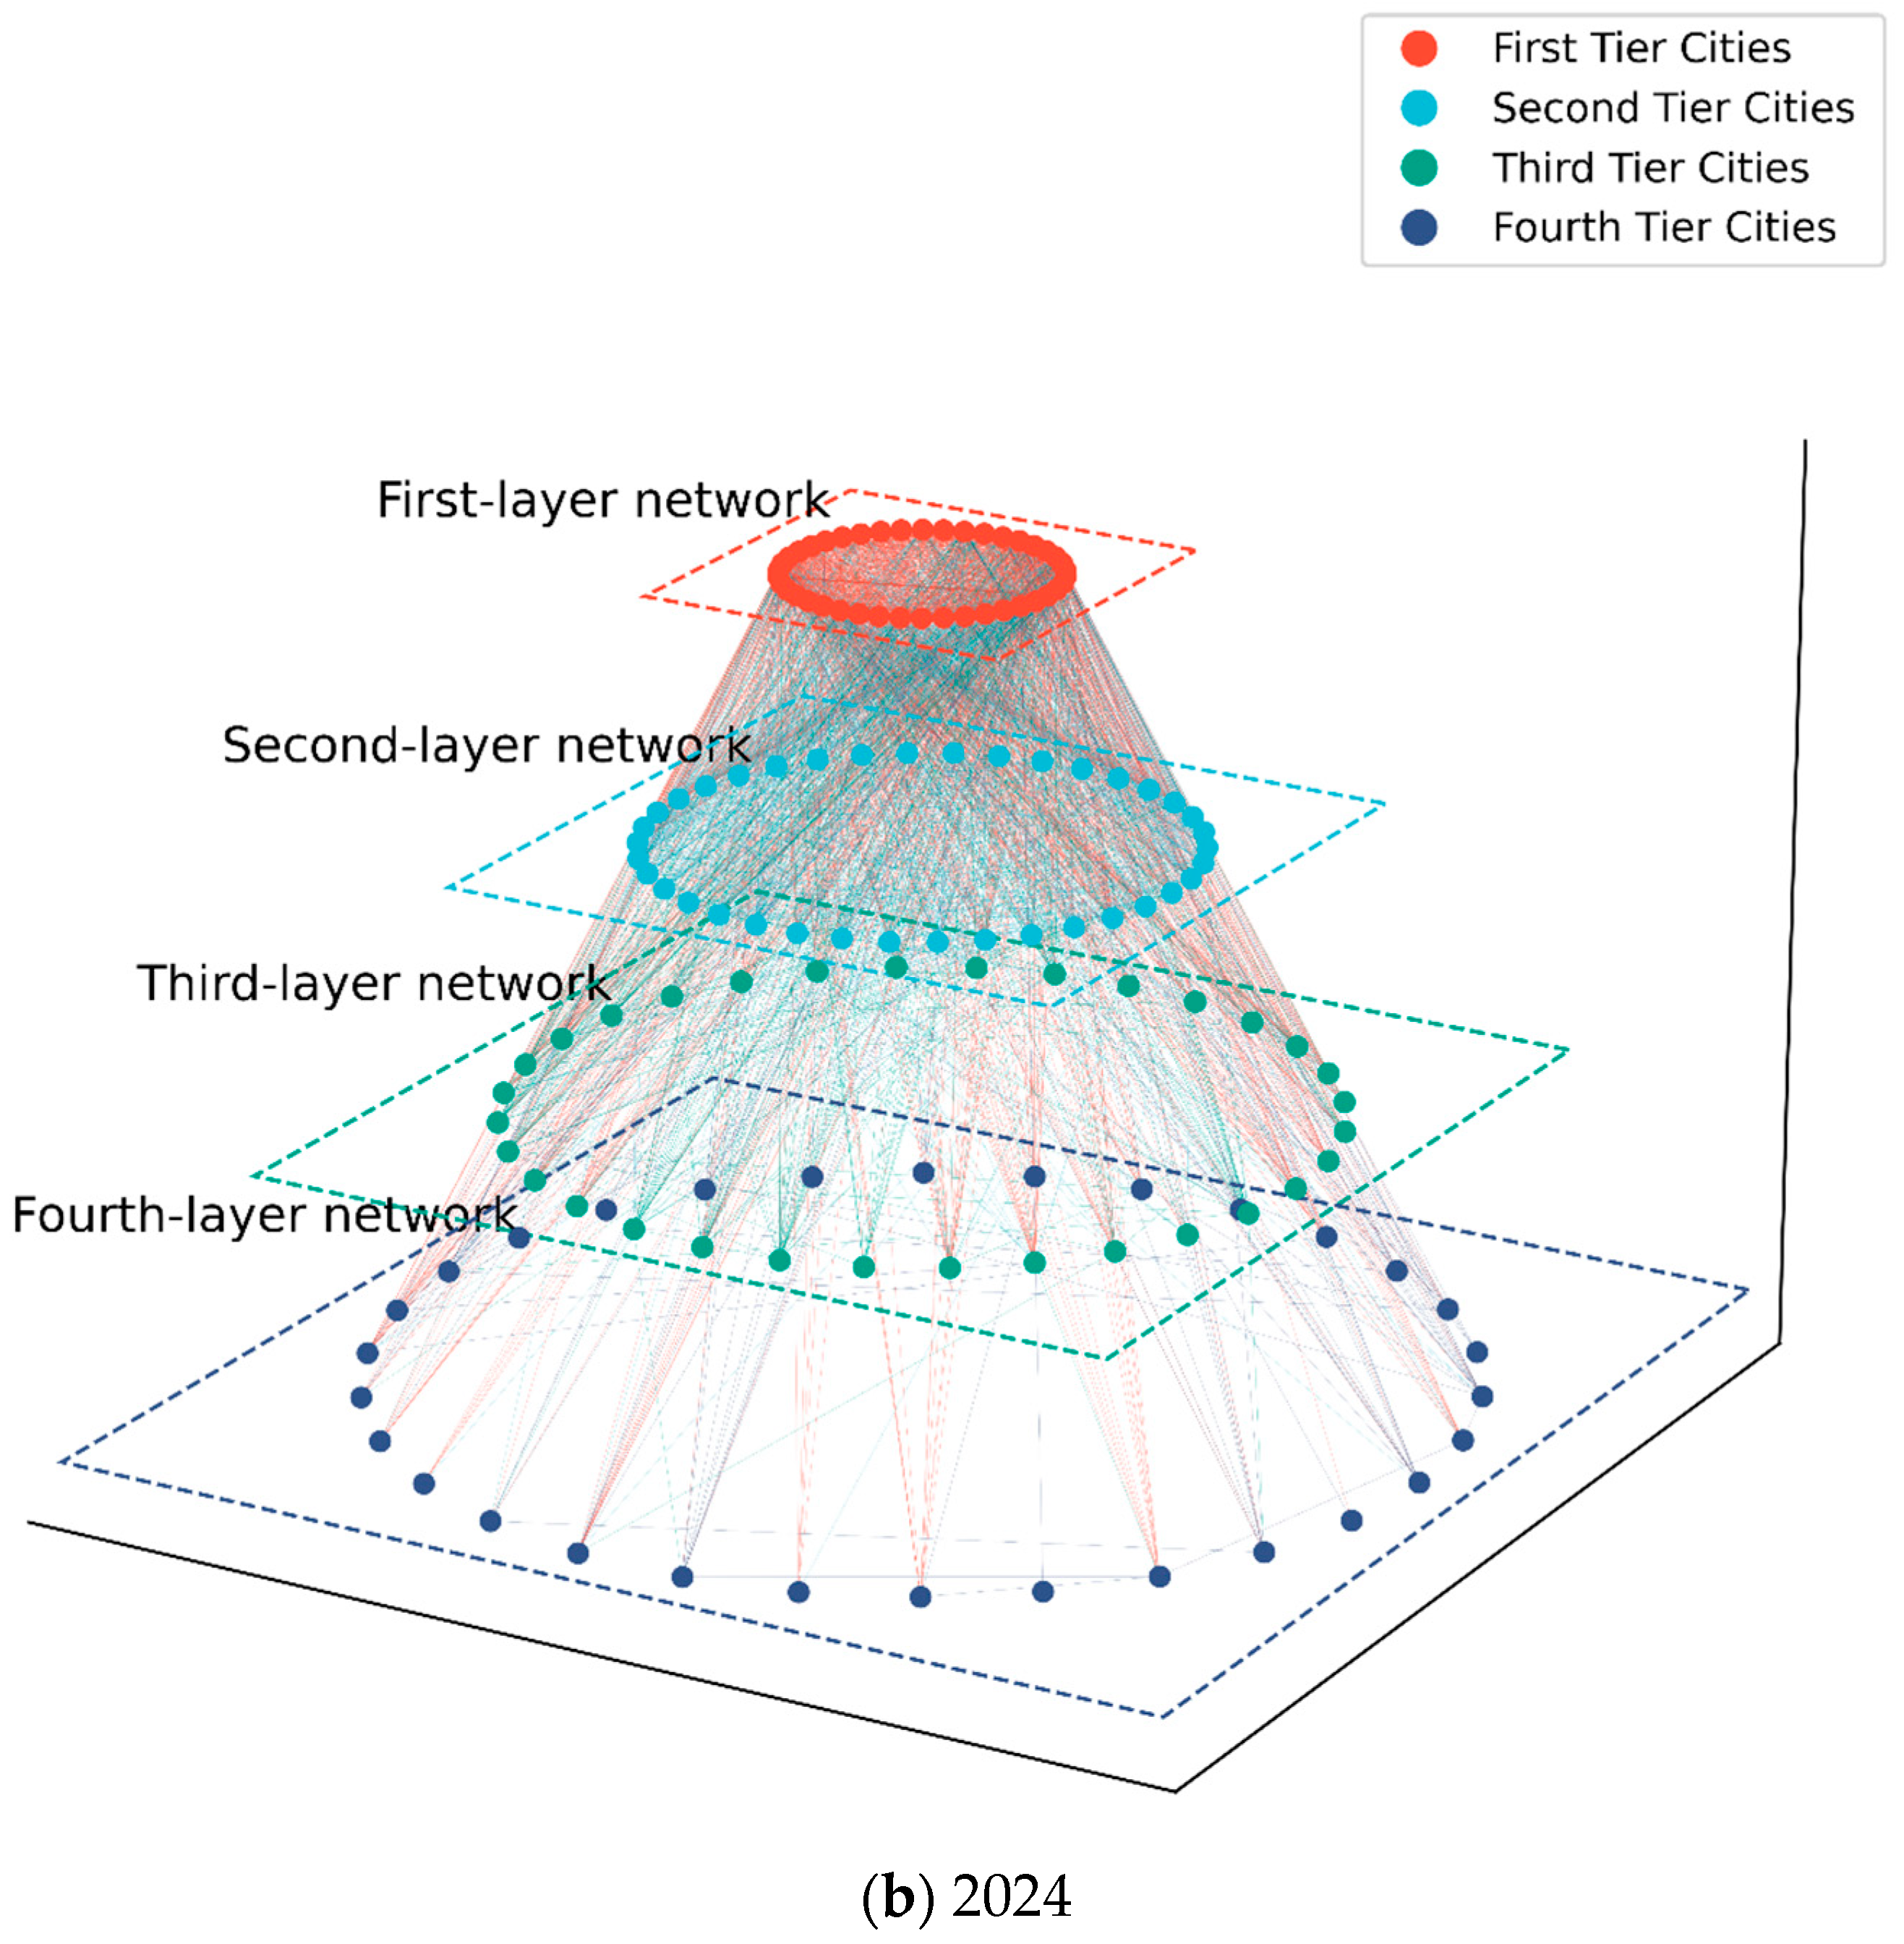
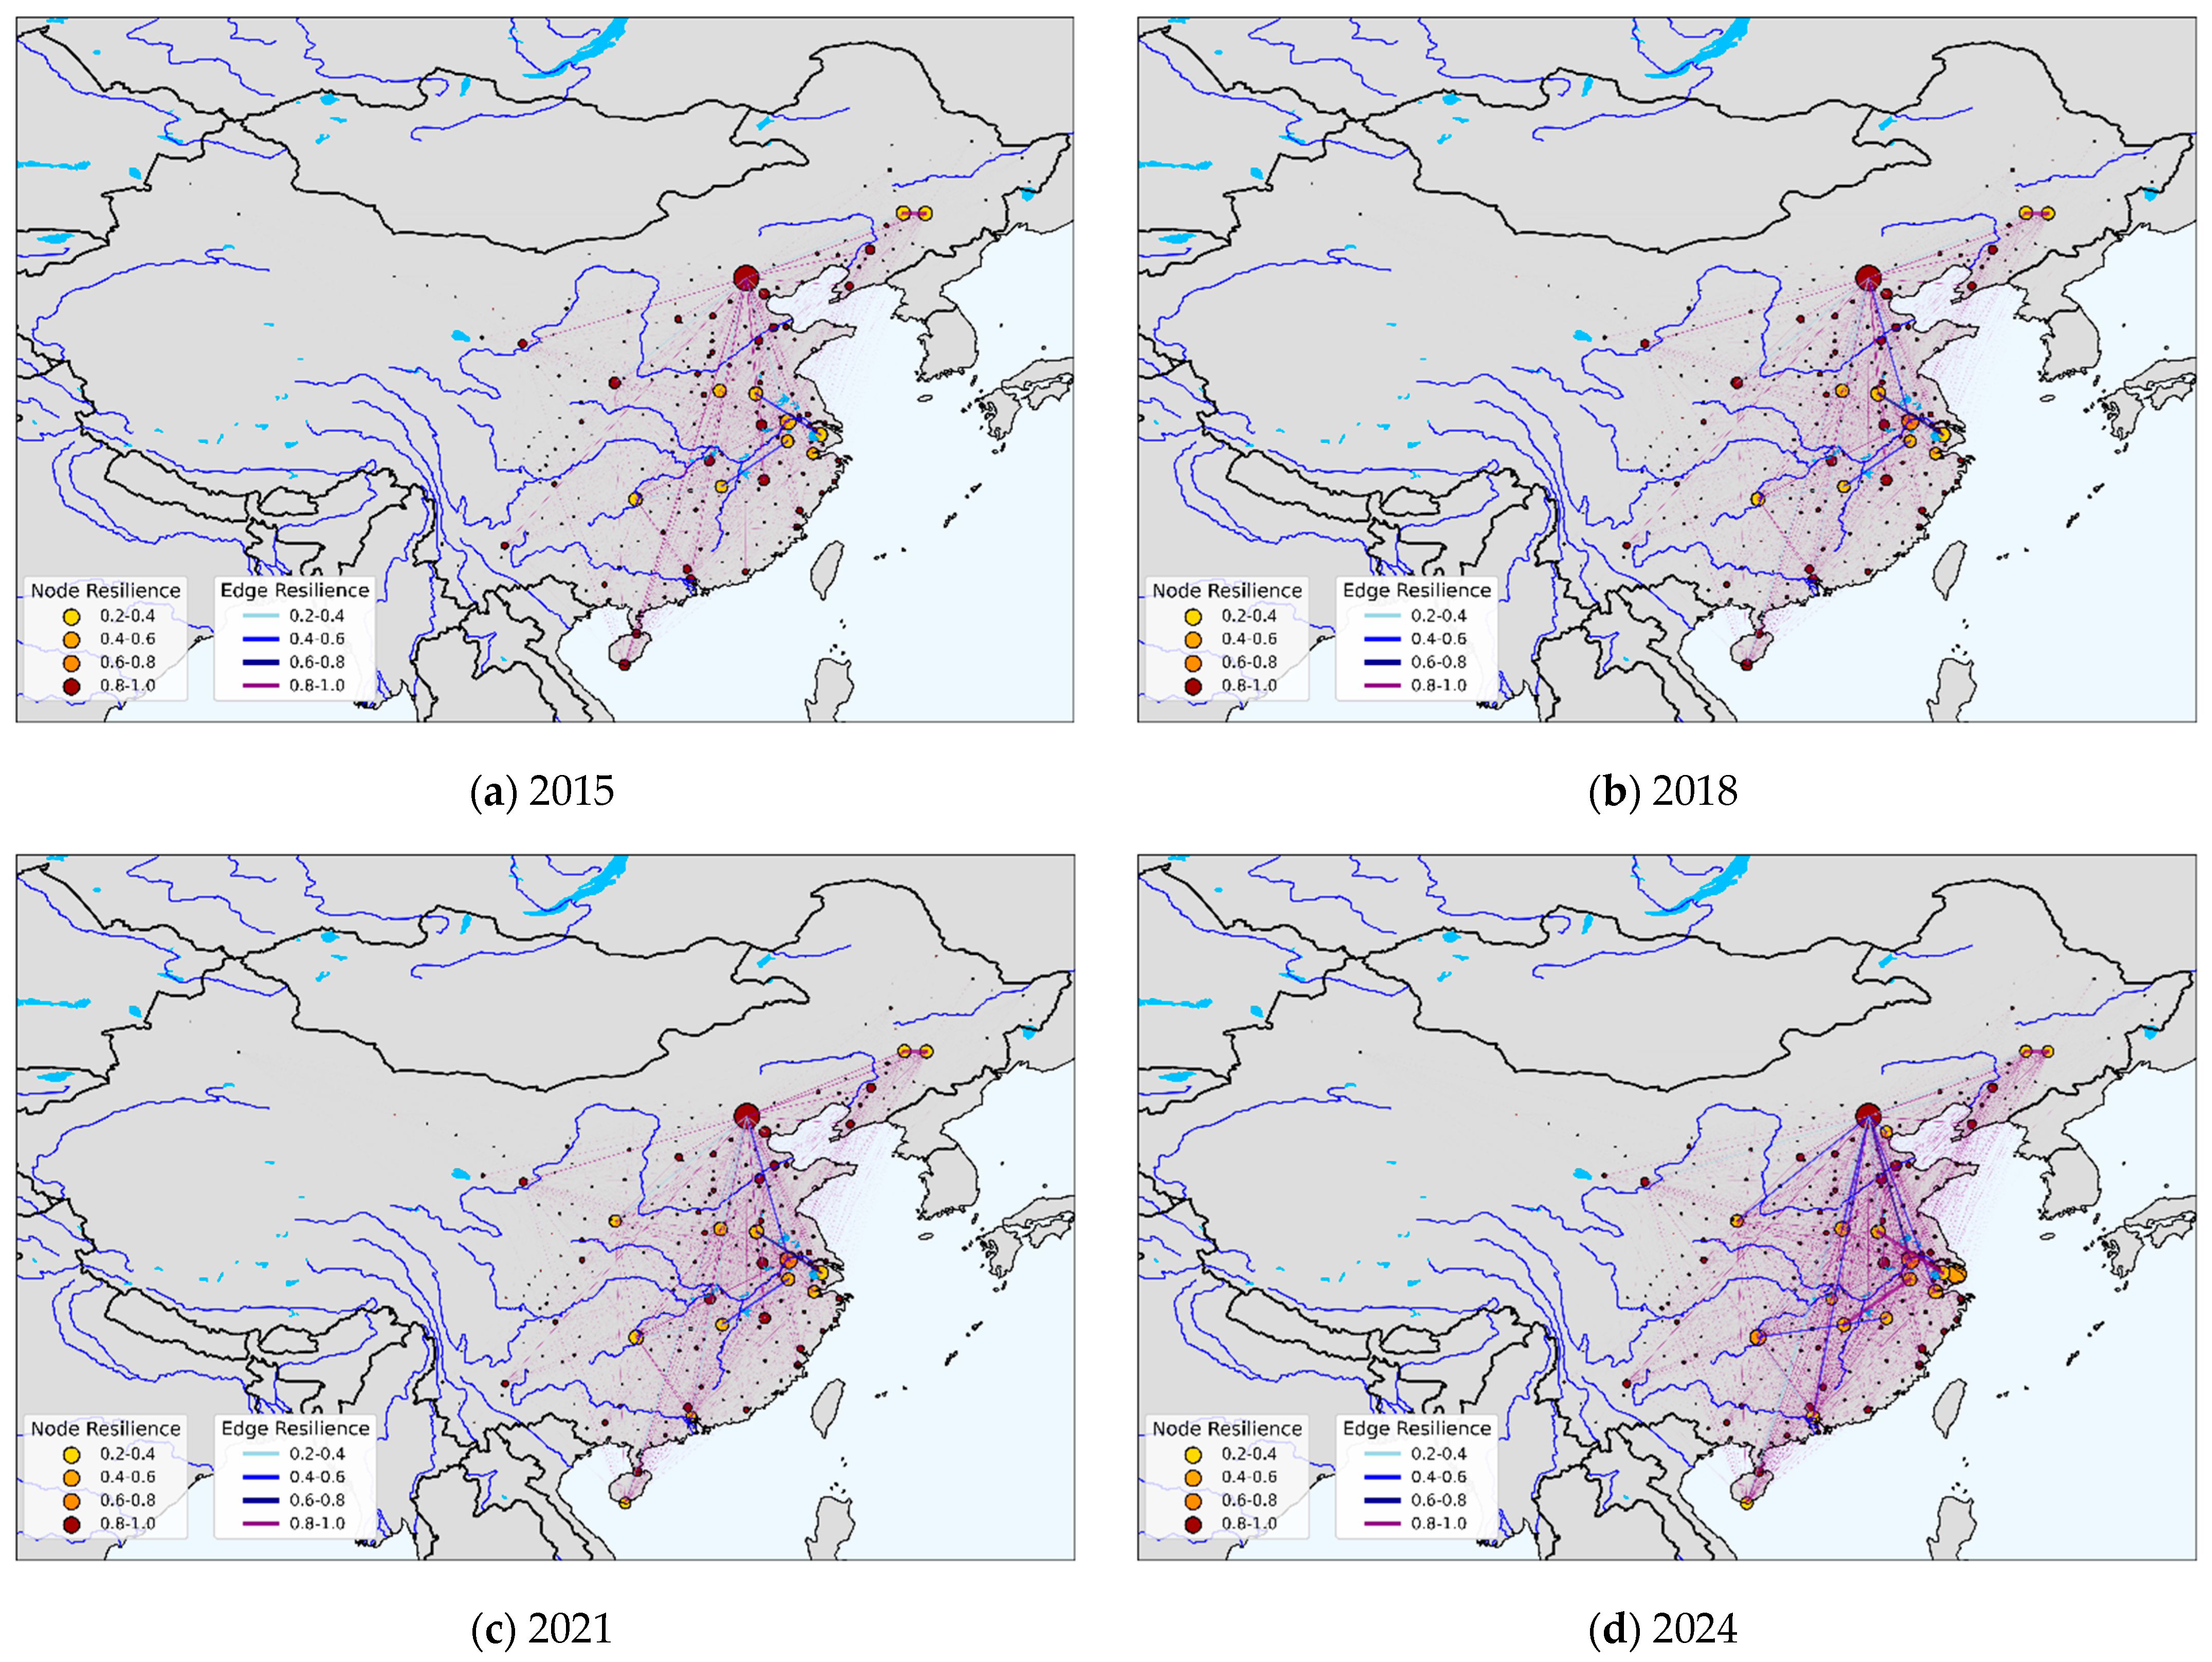
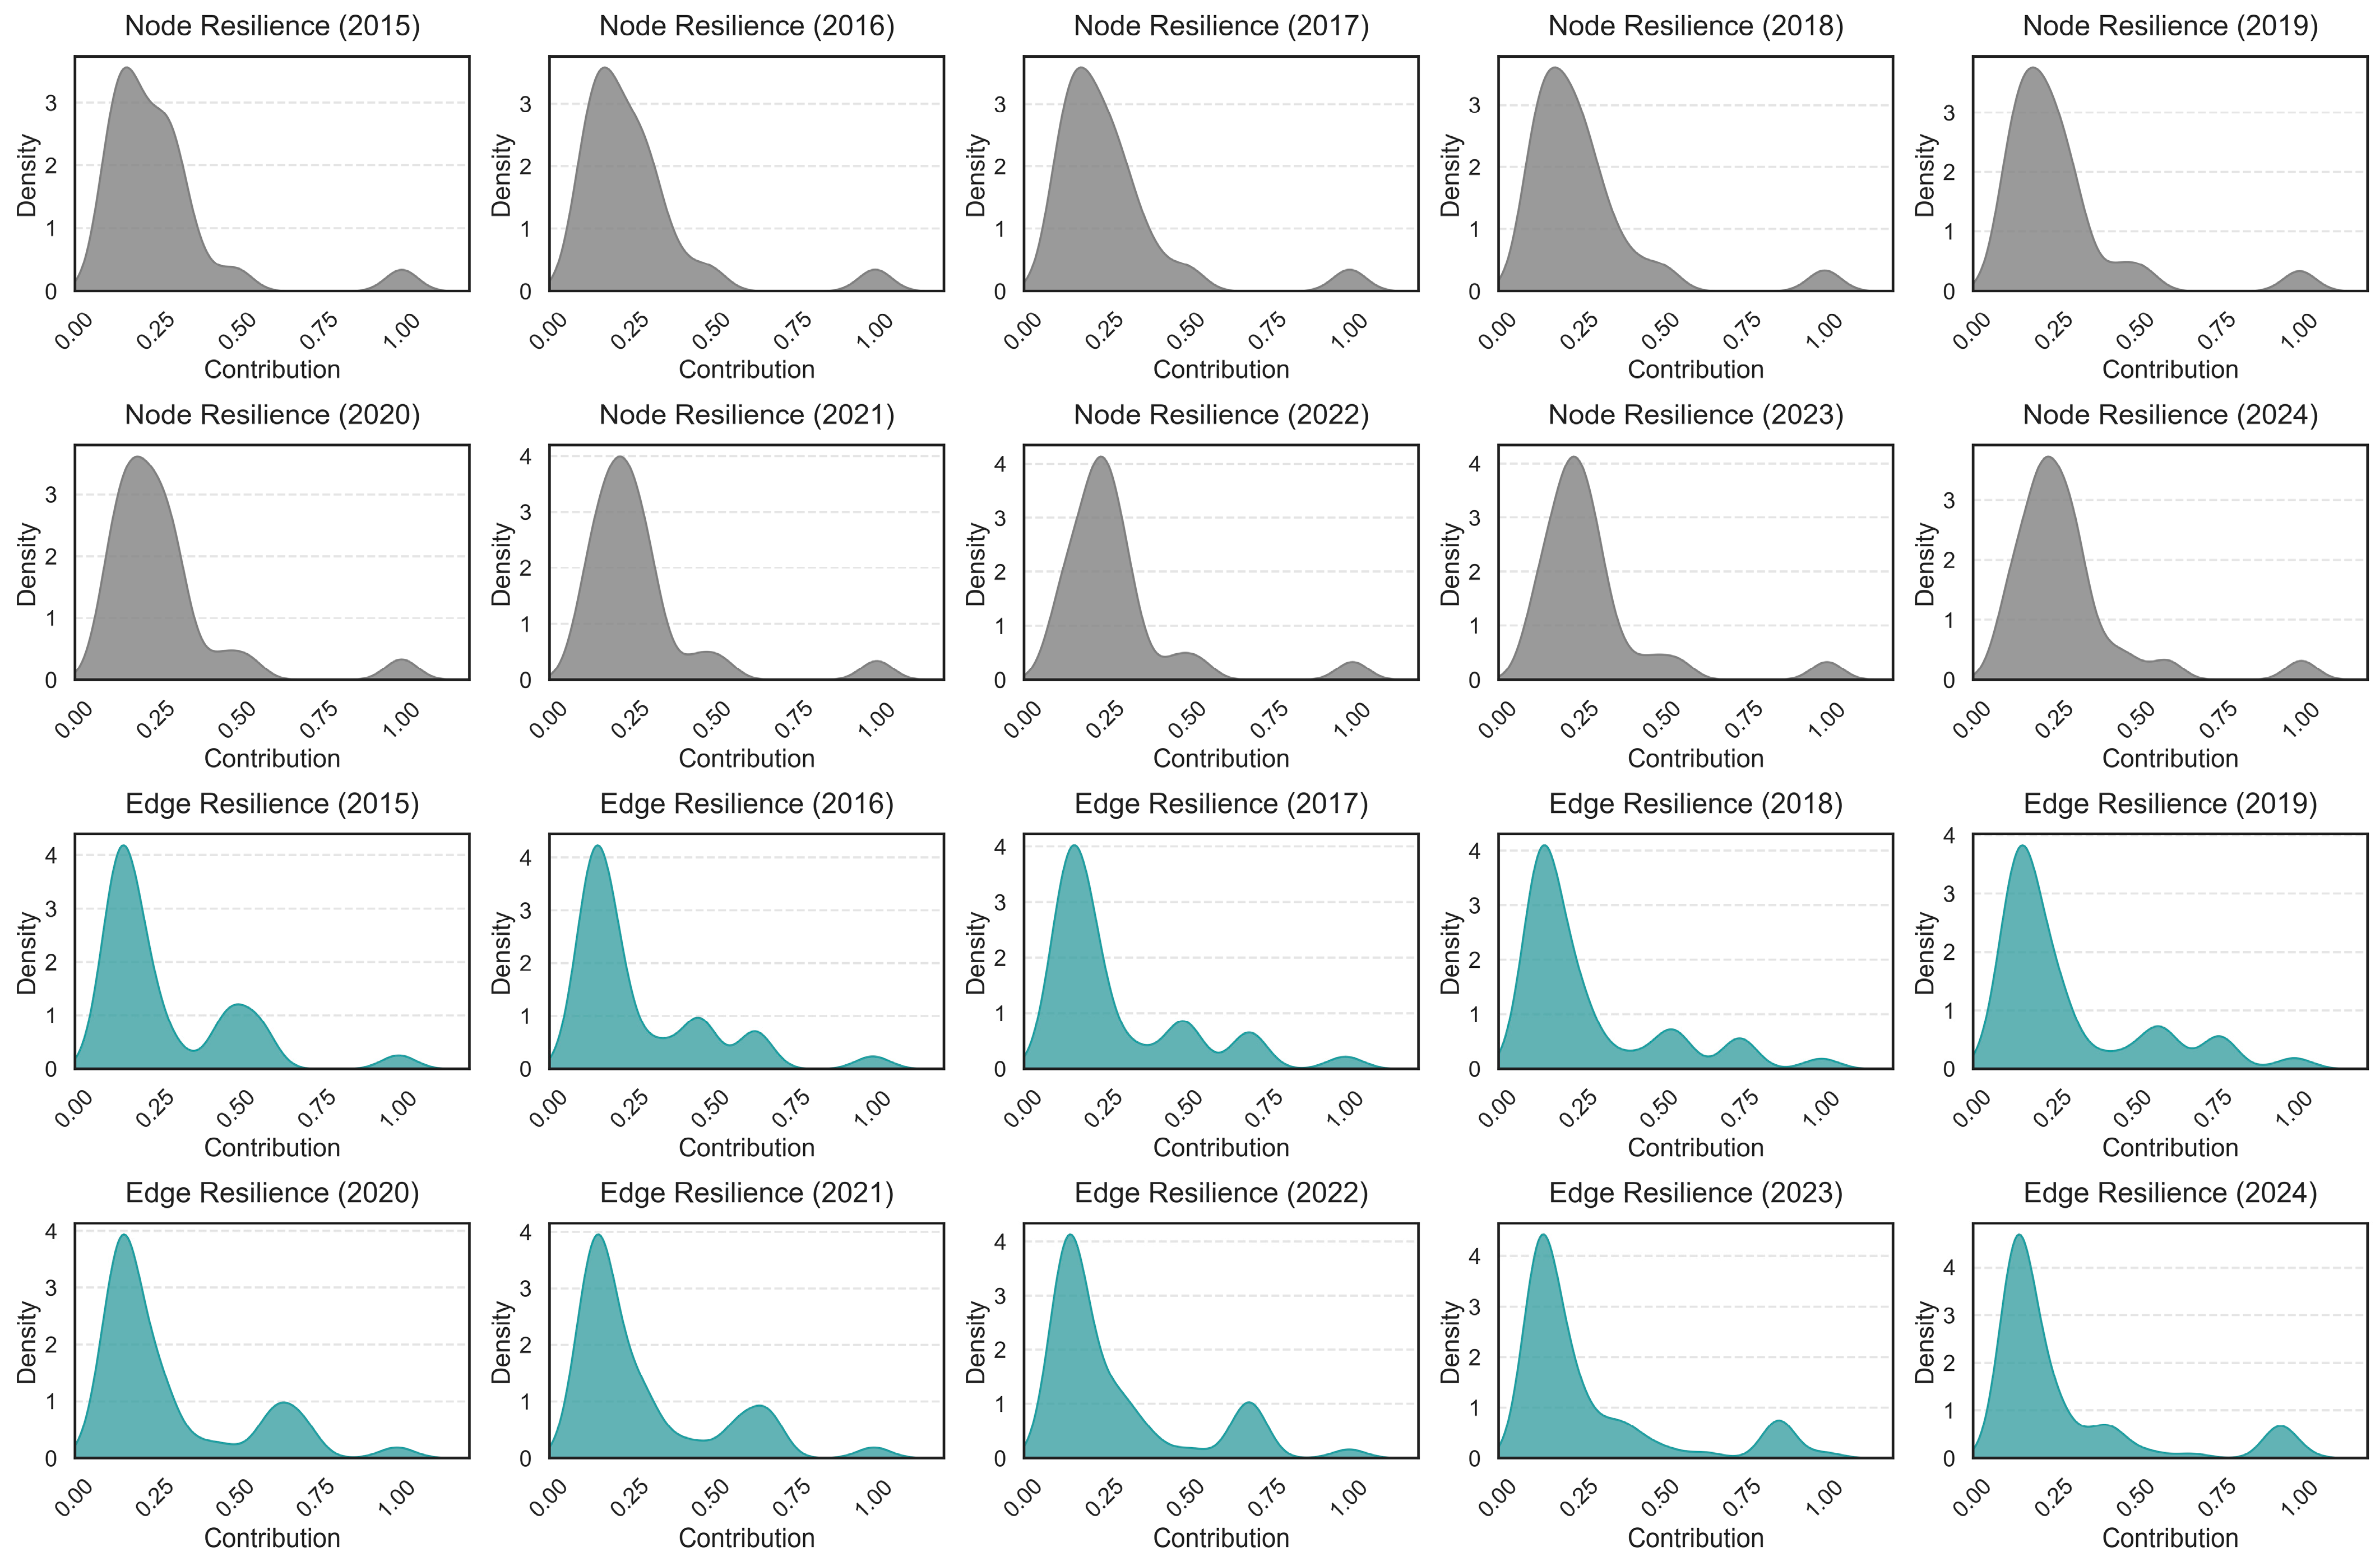
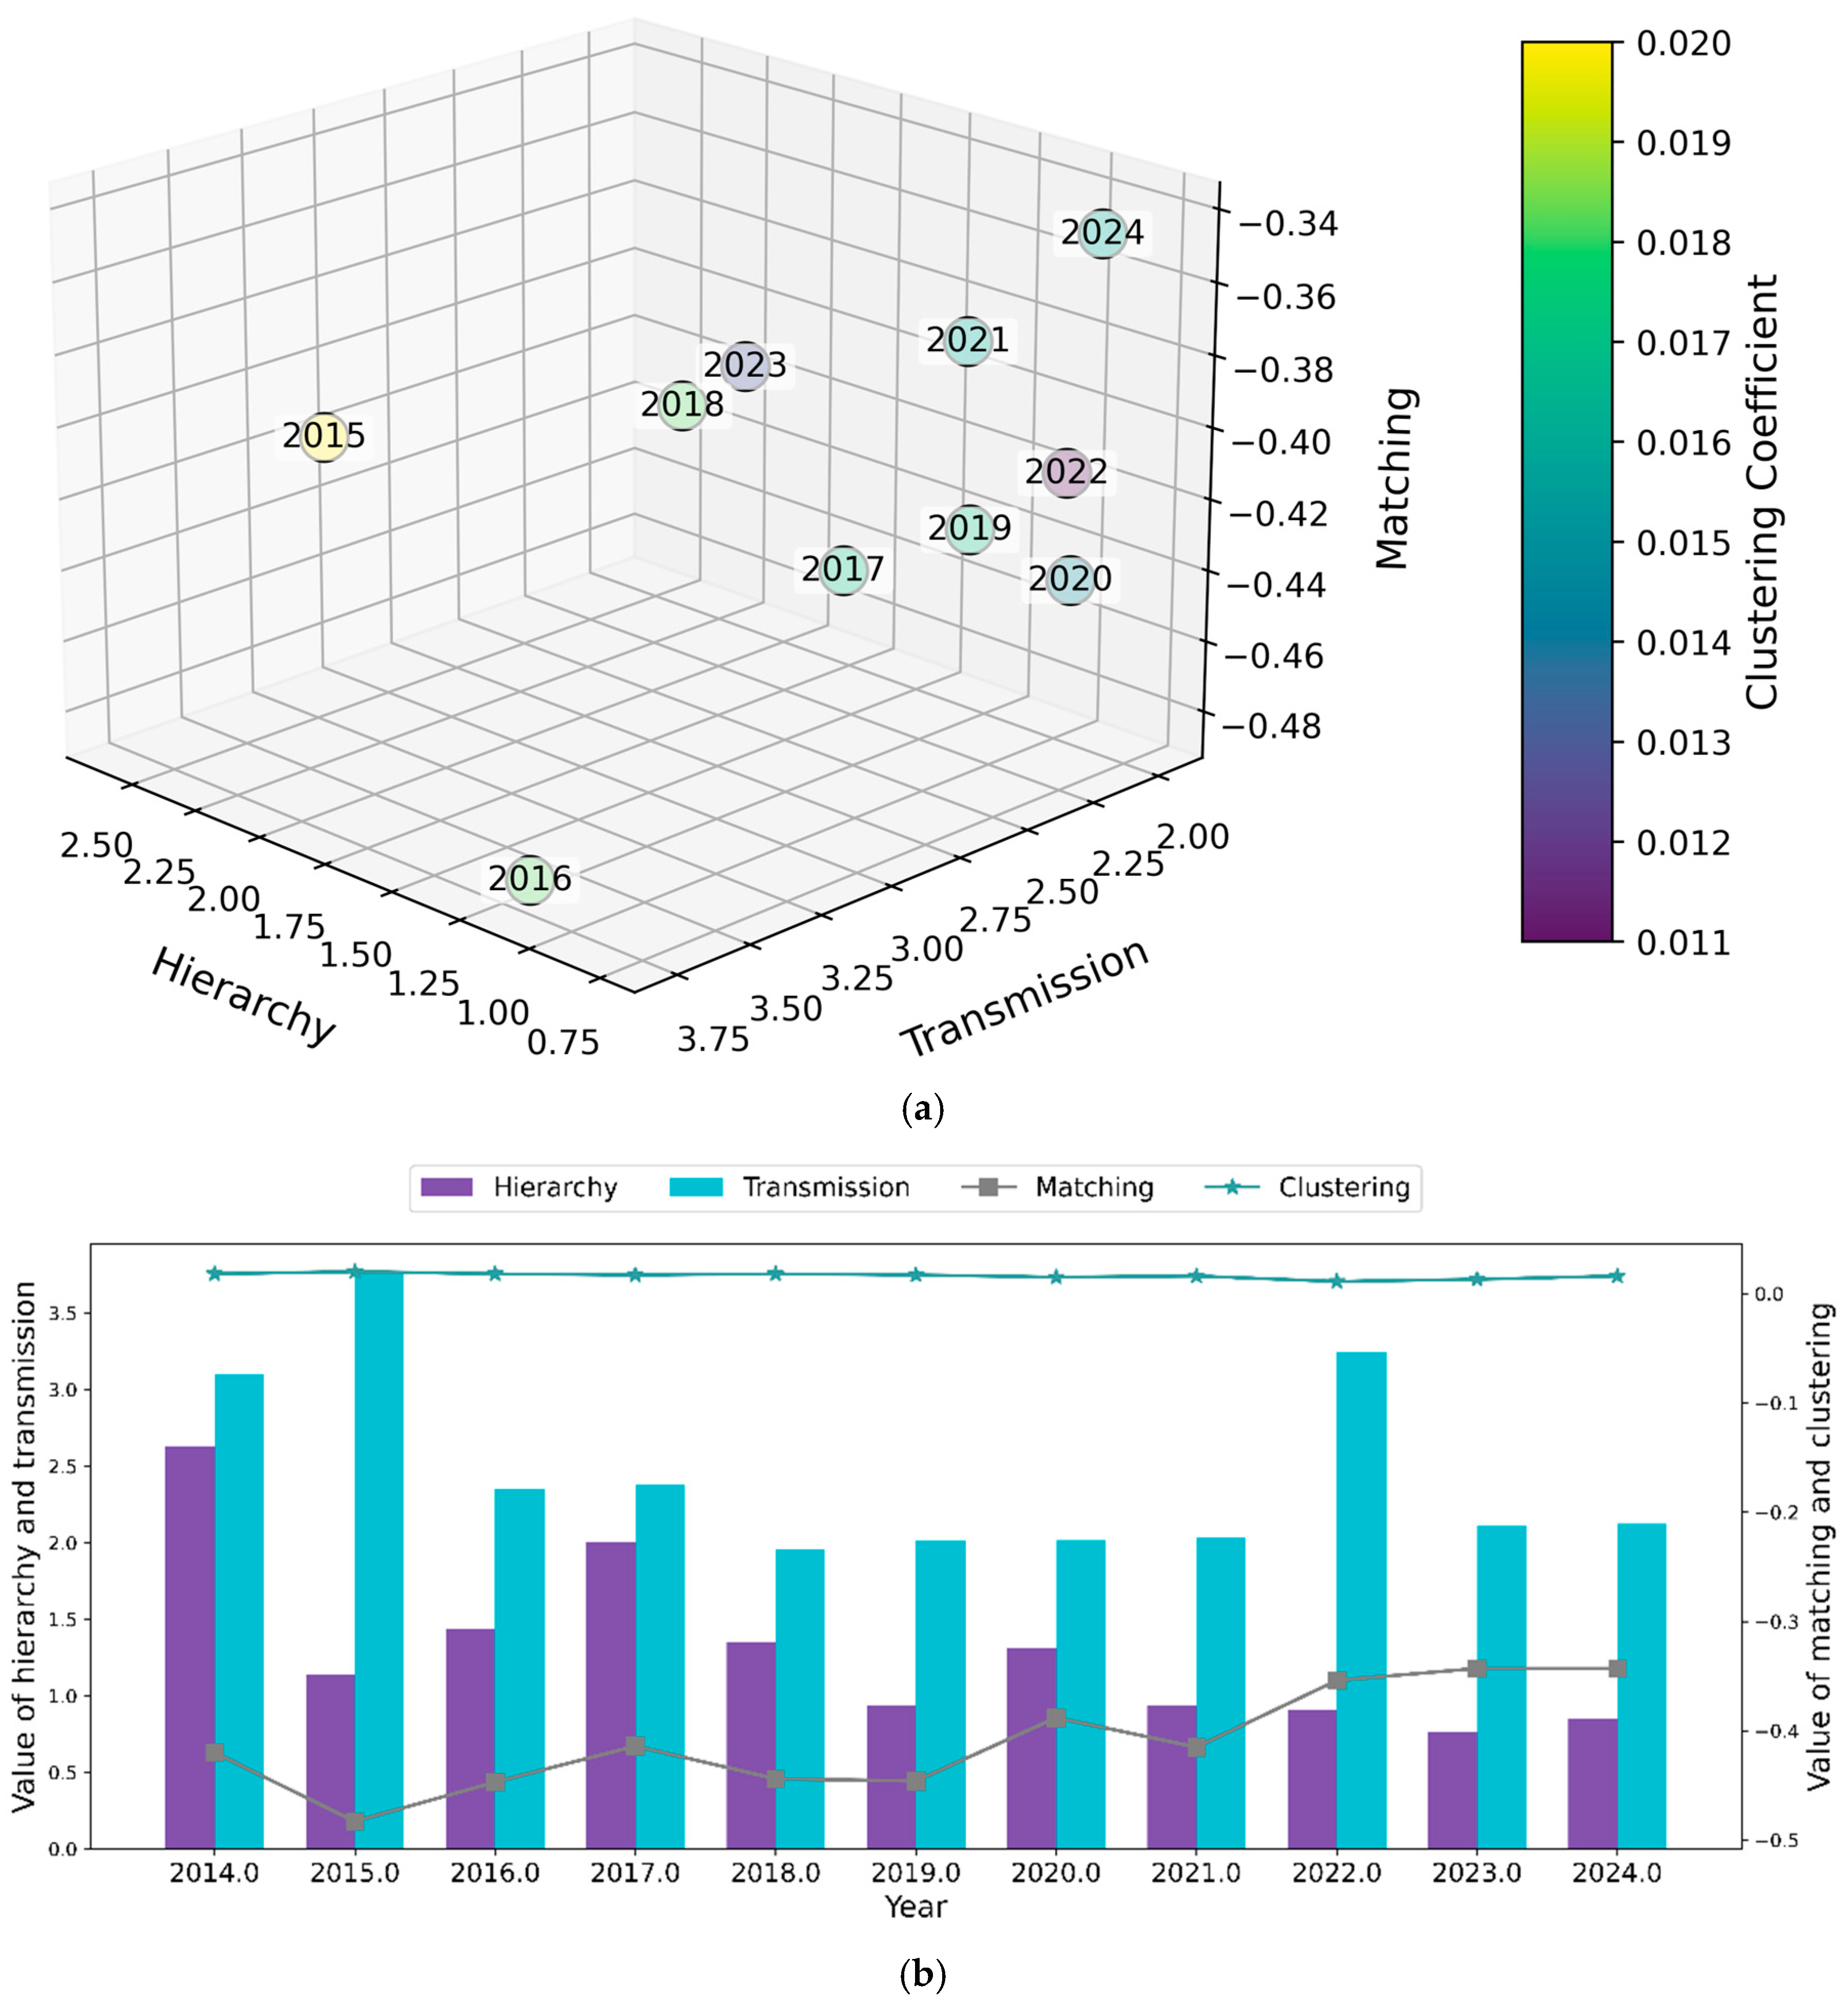
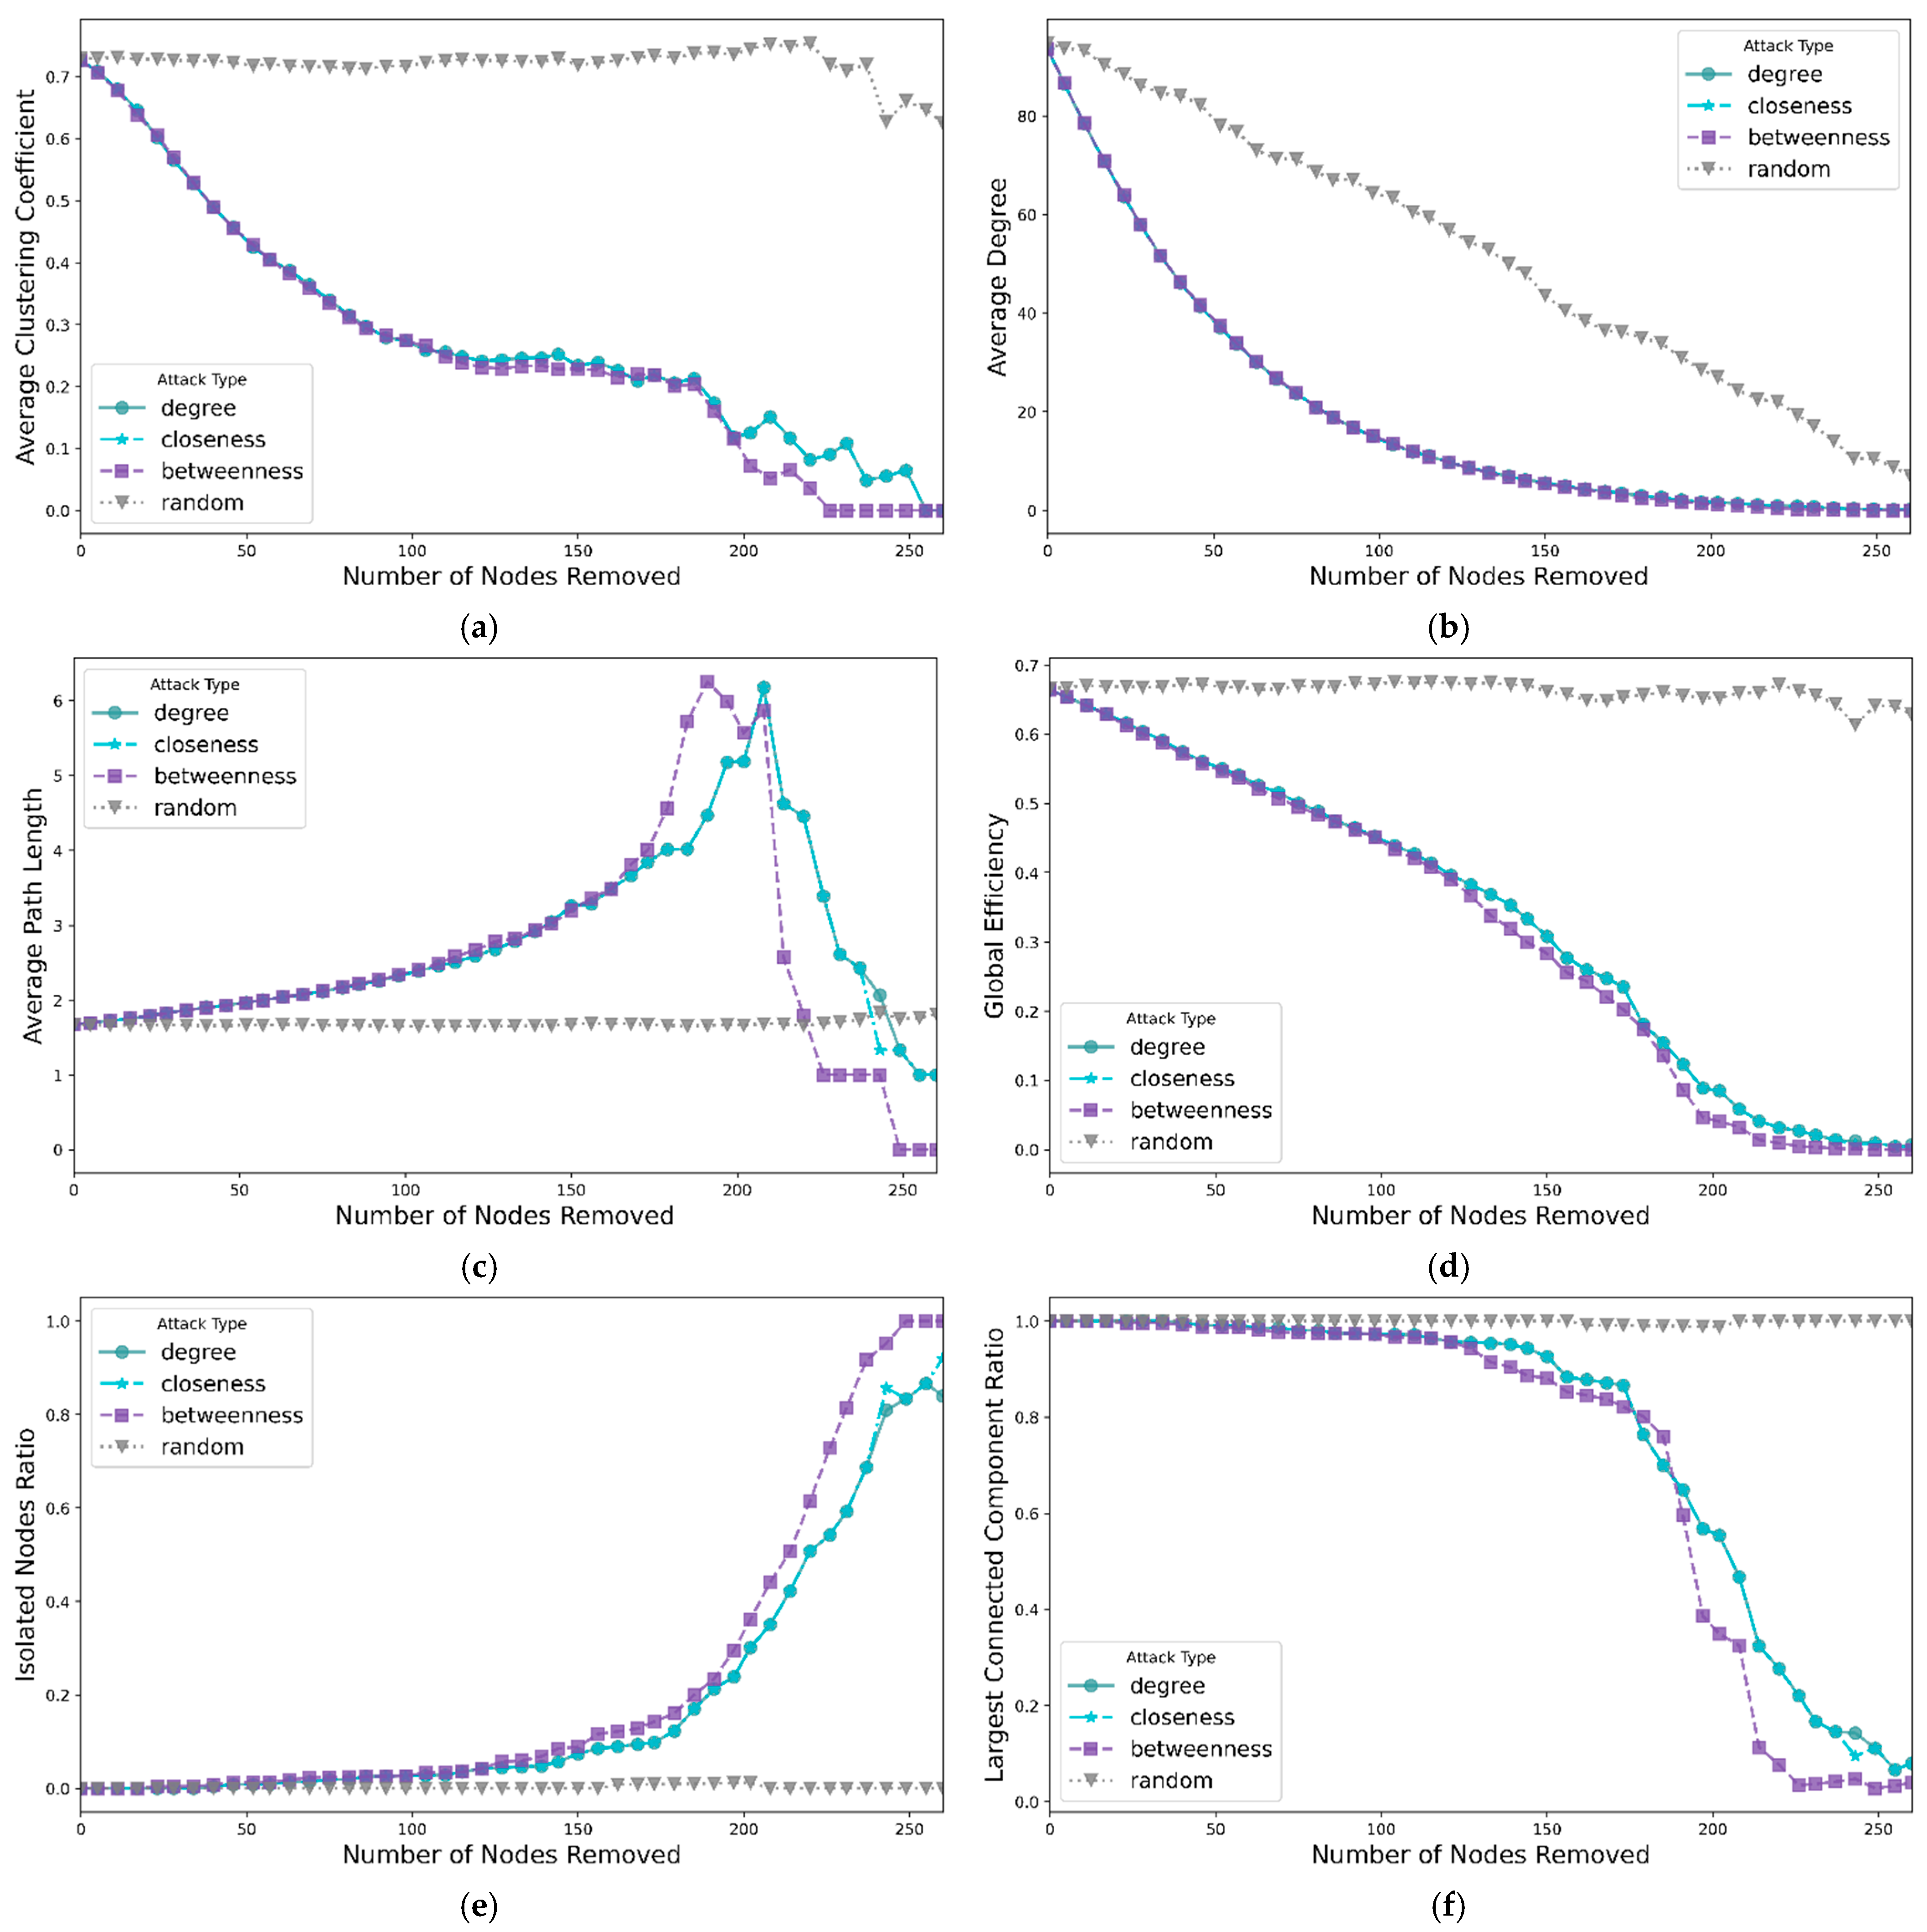
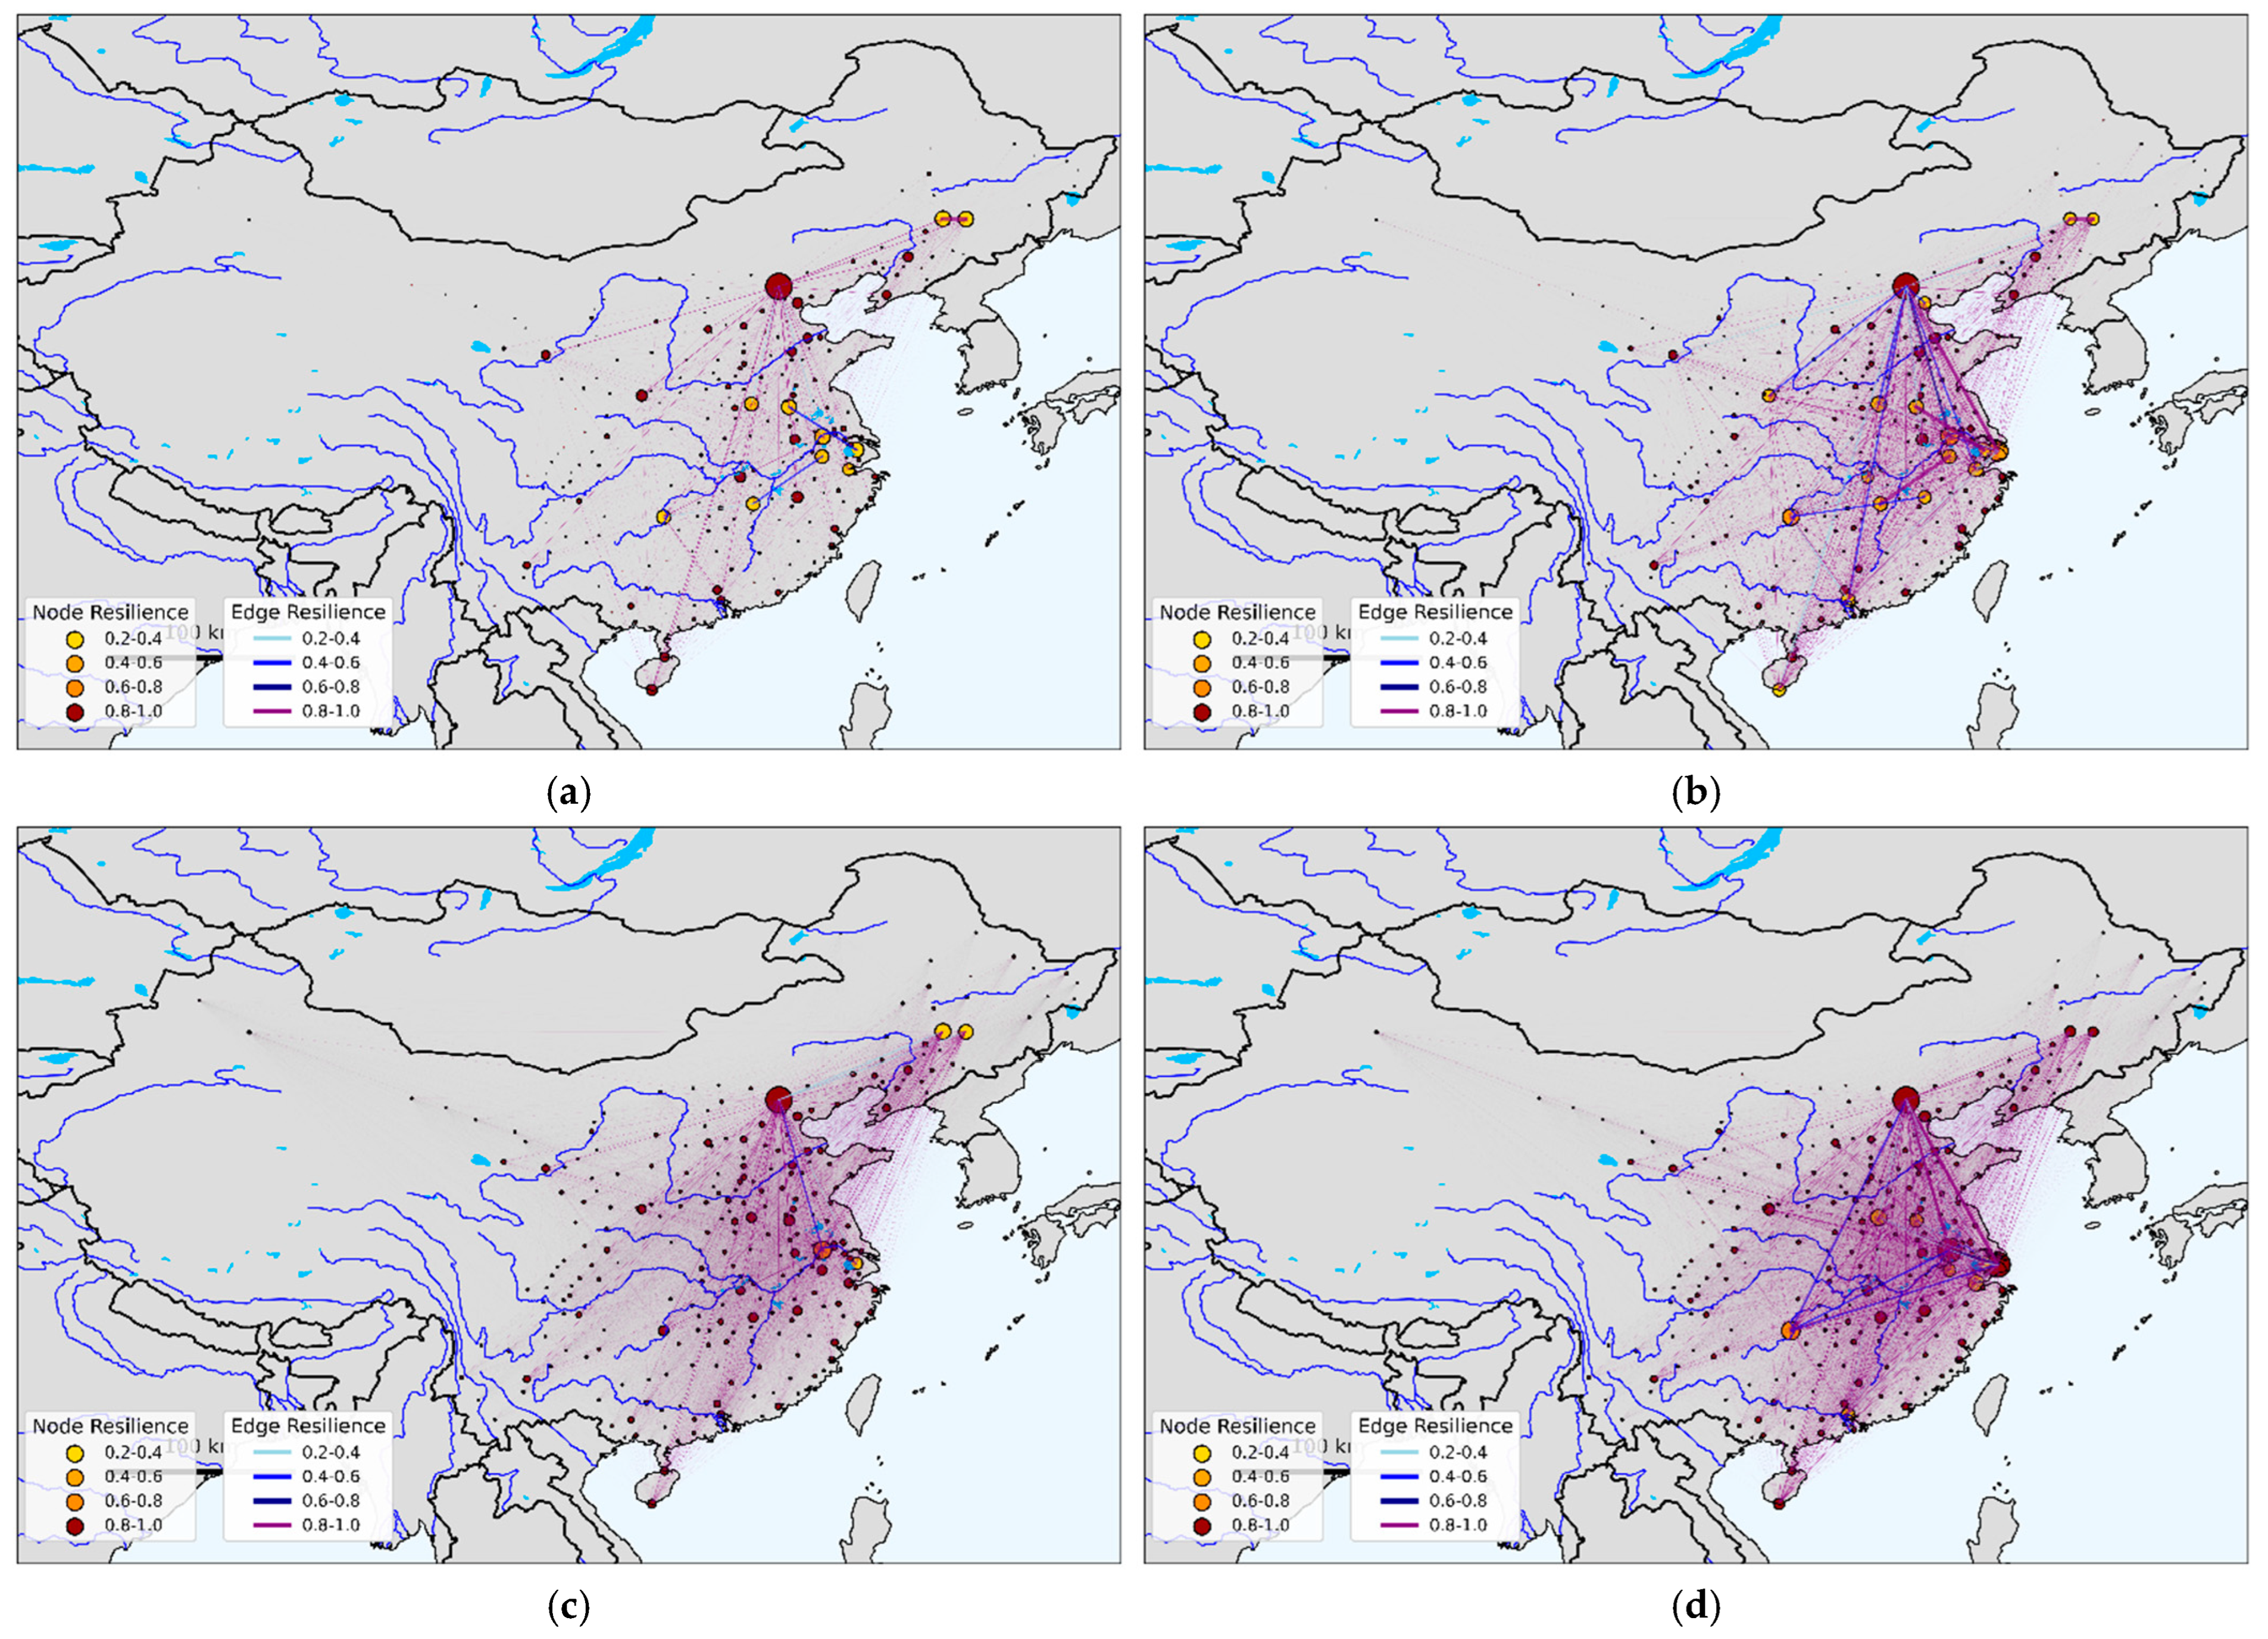

Disclaimer/Publisher’s Note: The statements, opinions and data contained in all publications are solely those of the individual author(s) and contributor(s) and not of MDPI and/or the editor(s). MDPI and/or the editor(s) disclaim responsibility for any injury to people or property resulting from any ideas, methods, instructions or products referred to in the content. |
© 2025 by the authors. Licensee MDPI, Basel, Switzerland. This article is an open access article distributed under the terms and conditions of the Creative Commons Attribution (CC BY) license (https://creativecommons.org/licenses/by/4.0/).