Abstract
Utilizing nearly 80,000 patent records and over 540,000 patent references from within China’s banking industry, spanning from 2000 to July 2021, this paper employs network analysis and the main path method to examine the technological evolution of both Chinese and global banks. The contributions of this study encompass the comprehensive collection of 21 years of patent data, the introduction of a distinctive analytical framework for networks, and addressing a research gap in Chinese banking innovation. The research delves into the sources of innovation of China’s banking industry, maps its development, and identifies cutting-edge technologies of the global banking system, with a specific emphasis on the burgeoning role of blockchain. Additionally, this paper presents a valuable list of recent global patents identified by the main path algorithm, serving as a valuable reference for governments and regulatory bodies worldwide.
1. Introduction
Banks are central to the financial system and have long propelled global economic development through technological innovation. Banks have traditionally been the main provider of credit [1]. The monetary and financial services offered by banks hold a dominant position within the financial industry. Specifically, the value added by the banking sector accounts for 80% of the entire financial industry in China, 50% in the UK and U.S., and 60% in Germany. Historically, technological change has driven the digitalization of banking, leading to significant improvements in credit provision, risk management, and financial services [2,3,4,5], which, in turn, support industries worldwide [6]. Looking ahead, technological innovation will continue to be a critical force in shaping the future of banking, enhancing the quality of service and operational efficiency [7,8]. Understanding the technological evolution of banking is therefore crucial for improving the sector’s efficiency, guiding investments, and fostering economic impetus.
The banking sector has become a key driver of emerging technologies through sustained technological investment. In the past decade, fintech firms have accelerated banks’ digital transformation, intensifying competition and fostering innovation spillovers [8,9]. In response, banks have significantly increased their technology investments and internal R&D efforts; in 2023 alone, JPMorgan and Bank of America invested $15.3 billion and $12 billion in technology, respectively, with the former investment marking a 7% annual increase and the latter bank holding over 6100 patents.
Thus, understanding the evolution of banking technology from a technical perspective is crucial. Analyzing past innovations and revealing how external technological advancements have shaped the sector can provide valuable insights for policymakers, bank executives, and developers.
Despite growing interest, the current research on banking technology contains several gaps. First, the studies that directly examine technological innovation within banks themselves are insufficient. The existing literature relies on patents, annual reports, and other textual data to extract technological variables, applying empirical methods to assess the impacts of innovations on the performance of banks and broader economic development [10,11,12,13,14,15]. Second, while some research does examine the integration of emerging technologies through case studies or theoretical models [13,16,17,18,19,20,21], these qualitative approaches can limit the generalizability and rigor of the findings [22]. Furthermore, data scarcity remains a fundamental challenge, as the sources of technological change in banking are rarely directly identified [7].
Another challenge in assessing banking innovation is the misconception that banks primarily adopt, rather than develop, technology. In reality, however, banks are significant innovators in their own right. For example, in 2023, the Chinese banking sector allocated CNY 69.296 billion to external IT solutions, while the six major state-owned banks alone invested CNY 122.822 billion in developing internal technology. This stark contrast highlights that, although banks purchase external services, they focus more on privatizing core innovations.
Accordingly, this study seeks to address the following three questions:
- ⮚
- What are the sources of technological innovation in the banking sector, and what core technologies are being utilized?
- ⮚
- What is the developmental trajectory of global banking technology?
- ⮚
- Which technologies currently constitute the primary focus of the global banking industry?
By answering these questions, this study aims to enhance understanding of the past, present, and future of banking technology by:
- ⮚
- Summarizing the defining features of global banking technology development;
- ⮚
- Identifying the core technologies and innovation pathways shaping the industry;
- ⮚
- Conducting comparative and frontier analyses of technological innovation in both global and Chinese banking contexts.
Specifically, we first construct a comprehensive dataset of global banking patents, encompassing nearly 80,000 patents filed by banks and over 540,000 associated citations. This yields a comprehensive picture of the patent ecosystem of the sector. Then, through extensive database matching, we assemble what is, to our knowledge, the first systematic and accurate dataset focused specifically on the global banking system.
Patent data offer two advantages. On one hand, patents represent over 90% of the recorded organizational innovation. On the other hand, patent citations serve as reliable indicators of technological significance, provide standardized comparability across countries and institutions, and mitigate the risk of exaggeration from financial disclosures.
Then, we develop an analytical framework that integrates quantitative algorithms with case studies. Our analysis reveals that the Chinese patent network features a shorter main path than those of other countries, but that it has several distinct branches. To address the limitations of a narrow main path, we propose a dual-path analysis approach that includes both main and branching trajectories, expanding our case coverage from 9 to 25 and enhancing the interpretive depth of our study.
Finally, this is the first study to trace the source of the technological innovation of China’s financial industry. We identify key patent clusters, representative innovations, and major contributing institutions, and assess how technologies support banking development. These findings offer robust empirical evidence for digital finance research, and provide further insights for regulators in monitoring global and domestic technological trajectories.
Our contributions are three-fold. First, we present a comprehensive dataset covering patent information from over a 21-year period. Second, we adopt a technological perspective and use industry-focused patent collection to offer an overall view of the banking sector’s innovation ecosystem. Third, we employ quantitative methods to reduce subjectivity, and further propose an integrated framework that incorporates both main and branching paths, offering a novel approach to analyzing sparse patent networks.
As a result, we present three major findings. First, the studied early-stage innovations heavily referenced patents from American firms, while the more recent ones increasingly stem from domestic joint-stock and private banks. Second, the technological trajectory of Chinese banking follows three phases: financial infrastructure development, the adoption of foreign technologies, and integrated innovation across banking, institutional, and business scenarios. Third, since 2016, core patents along the main path have focused on blockchain and DLT, covering encryption, secure data transfer, smart contracts, and transaction privacy.
The remainder of this paper is structured as follows. Section 2 reviews the relevant literature and theoretical foundations. Section 3 outlines the research methodology, including the data collection and analytical approaches. Section 4 presents key findings and discussions. Finally, Section 5 concludes the paper by summarizing the main insights and contributions while suggesting directions for future research.
2. Literature Review
2.1. Banking Technology Innovation
Early studies of bank technology examined the impact of IT on banking business models and performance. Berger examined the relationship between IT investment and bank efficiency, finding that technology innovation improves the operational efficiency of banks and reduces their transaction costs [23]. Arner et al. proposed the “FinTech 1.0, 2.0, and 3.0” framework, analyzing the shift from traditional IT to digital finance [24].
Recent research has shifted toward the digital transformation of banking with emerging technologies. Fuster et al. studied AI in credit evaluation and found that its adoption significantly reduces loan defaults [25]. Other studies have explored blockchain’s role in banking, such as that by Guo & Liang, who highlighted its potential in payments, settlements, and anti-fraud technology [26].
However, much of the existing research either focuses on case studies of a single technology or relies on qualitative research, lacking a comprehensive understanding of technological innovation at the industry level. In particular, quantitative research based on patent data is still scarce, which provides an opportunity for our study. Additionally, many studies focus on how banks acquire technological capabilities through mergers or purchases, with less attention given to their own innovation processes. Finally, although some studies have used patent data to analyze the trend of fintech, most of them have adopted short-term word-frequency statistics from reports or patents, which risks limited representativeness and ambiguous interpretation.
2.2. Patent Network Analysis and Main Path Method
Patent data are a key indicator of technological innovation. Compared to traditional financial data, patent data has higher objectivity and comparability, and is thus widely used in technological evolution studies [27,28]. Although it is still limited in the area of banking research, some studies have begun applying patent analysis to identify fintech trends.
Among the patent analysis methods, main path analysis (MPA) is particularly effective for tracing technological evolution. Based on patent citation networks, MPA identifies the main development path of innovation and outlines its core trajectory. Hummon & Doreian introduced this method, proposing three main algorithms: search path link count (SPLC), search path node pair (SPNP), and search path count (SPC) [29].
The SPC algorithm measures the importance of a path by counting how often it appears across all information dissemination routes. A key feature of the SPC algorithm is that it traverses the highest out-degree edge at each node in a directed acyclic network (DAN) to identify the most significant path from source to destination [30,31]. Compared to the SPLC and SPNP algorithms, the SPC algorithm produces longer paths with more patents, offering a fuller picture of technological evolution. Its use of global path weights also makes it more efficient and economical for identifying core routes in complex networks [32].
Studies show that the SPC algorithm is well-suited for analyzing technological innovation. Verspagen used the SPC algorithm to track the evolution of technology in patent networks [30]. In the field of artificial intelligence, Jiang and Zhuge used the SPC algorithm to uncover key technological nodes and their development paths [33]. Although the SPC algorithm is well-established in high-tech industries, its application in financial research is still limited.
2.3. Methodology’s Adaptability to Research Questions
Based on our aim of identifying the sources, development paths, and key technologies in global banking, the SPC method is suitable for our research goal for three reasons. First, the SPC method models technology diffusion from a global perspective [30,31]. It assesses each path’s influence by traversing the entire network, and the “path flow” logic that it uses makes it ideal for revealing how technology evolves within an industry [34]. Second, the SPC algorithm’s objectivity and reproducibility help overcome common biases in banking technology research. We use the SPC method with a 20-year patent network to establish an objective, scientific, and reusable framework for bank innovation assessment. Third, the SPC method’s output is naturally well-suited for case analysis [28,30]. The representativeness of SPC-identified nodes ensures typical and effective case selection.
3. Materials and Methods
The period from 2000 to 2021 witnessed the emergence of and a boom in technology introduction in Chinese banks, indicated by a quick rise in the number of patent applications. We included the patent data for all applicants that contained “bank” in their name during the study period, and this sample interval is as long as possible to achieve more comprehensive coverage of major technologies.
3.1. Data Collection and Dataset Matching
We began by collecting patent data from the CNIPA Patent Publication Announcement website (hereafter referred to as CNIPA) using a crawler method. These data included patent claims, classification numbers, inventors, addresses, abstracts, applicants, and other related details. After data cleansing, we obtained a total of 19,600 Chinese patents.
Meanwhile, we gathered 59,900 global patents for applicants with “bank” in their name from the Derwent Innovation platform (DI platform). After merging these patents based on applicant names, we obtained 37,500 patents. We further expanded the dataset by including forward and backward citation relationships using the DI platform, resulting in a total of over 540,800 patent-citation data points.
The CNIPA includes accurate Chinese patents and the DI platform is a market-leading patent research platform. The DI platform enhances data quality through manual review and standardization of patent information. Compared to the DI Index (DII), which is commonly cited in patent analysis research, the DI platform offers more accurate data.
In terms of coverage, for China, our dataset covers all legal persons on the list of banking financial institutions issued by the China Banking and Insurance Regulatory Commission (CBIRC). For international companies, only 212 of the existing 4827 banks in the US do not contain the word “bank” in their name, accounting for 4.39% of all banks in the country. In Japan, South Korea, and Europe, this number is slightly higher due to the larger number of large financial groups.
In terms of regulatory authorities, the sample covers all legal entities listed as banking financial institutions by the China Banking and Insurance Regulatory Commission (CBIRC). Additionally, it includes the major regulators of China’s banking industry, namely the People’s Bank of China (PBoC) and the CBIRC. We also conducted a separate search of patents related to other relevant regulatory bodies, such as the China Securities Regulatory Commission (CSRC) and the State Administration for Market Regulation (SAMR), but found only a few dozen patents disclosed by these agencies, with the exception of the PBoC system, which holds 453 patents. Therefore, regulatory authorities are not further considered in this paper.
In summary, the search method designed herein can potentially cover the patents of the major firms engaged in banking business worldwide.
3.2. Network Modelling and Main Path Analysis
Network analysis is usually considered a powerful tool for processing large-scale datasets and multivariable systems, as it can intuitively describe the complex relationships between variables, that is, the nodes and the edges connecting them. To date, academia has developed various network-building techniques, including the connectivity [35,36,37], Granger causality [38], entropy [39], and keyword co-occurrence and citation [40] techniques.
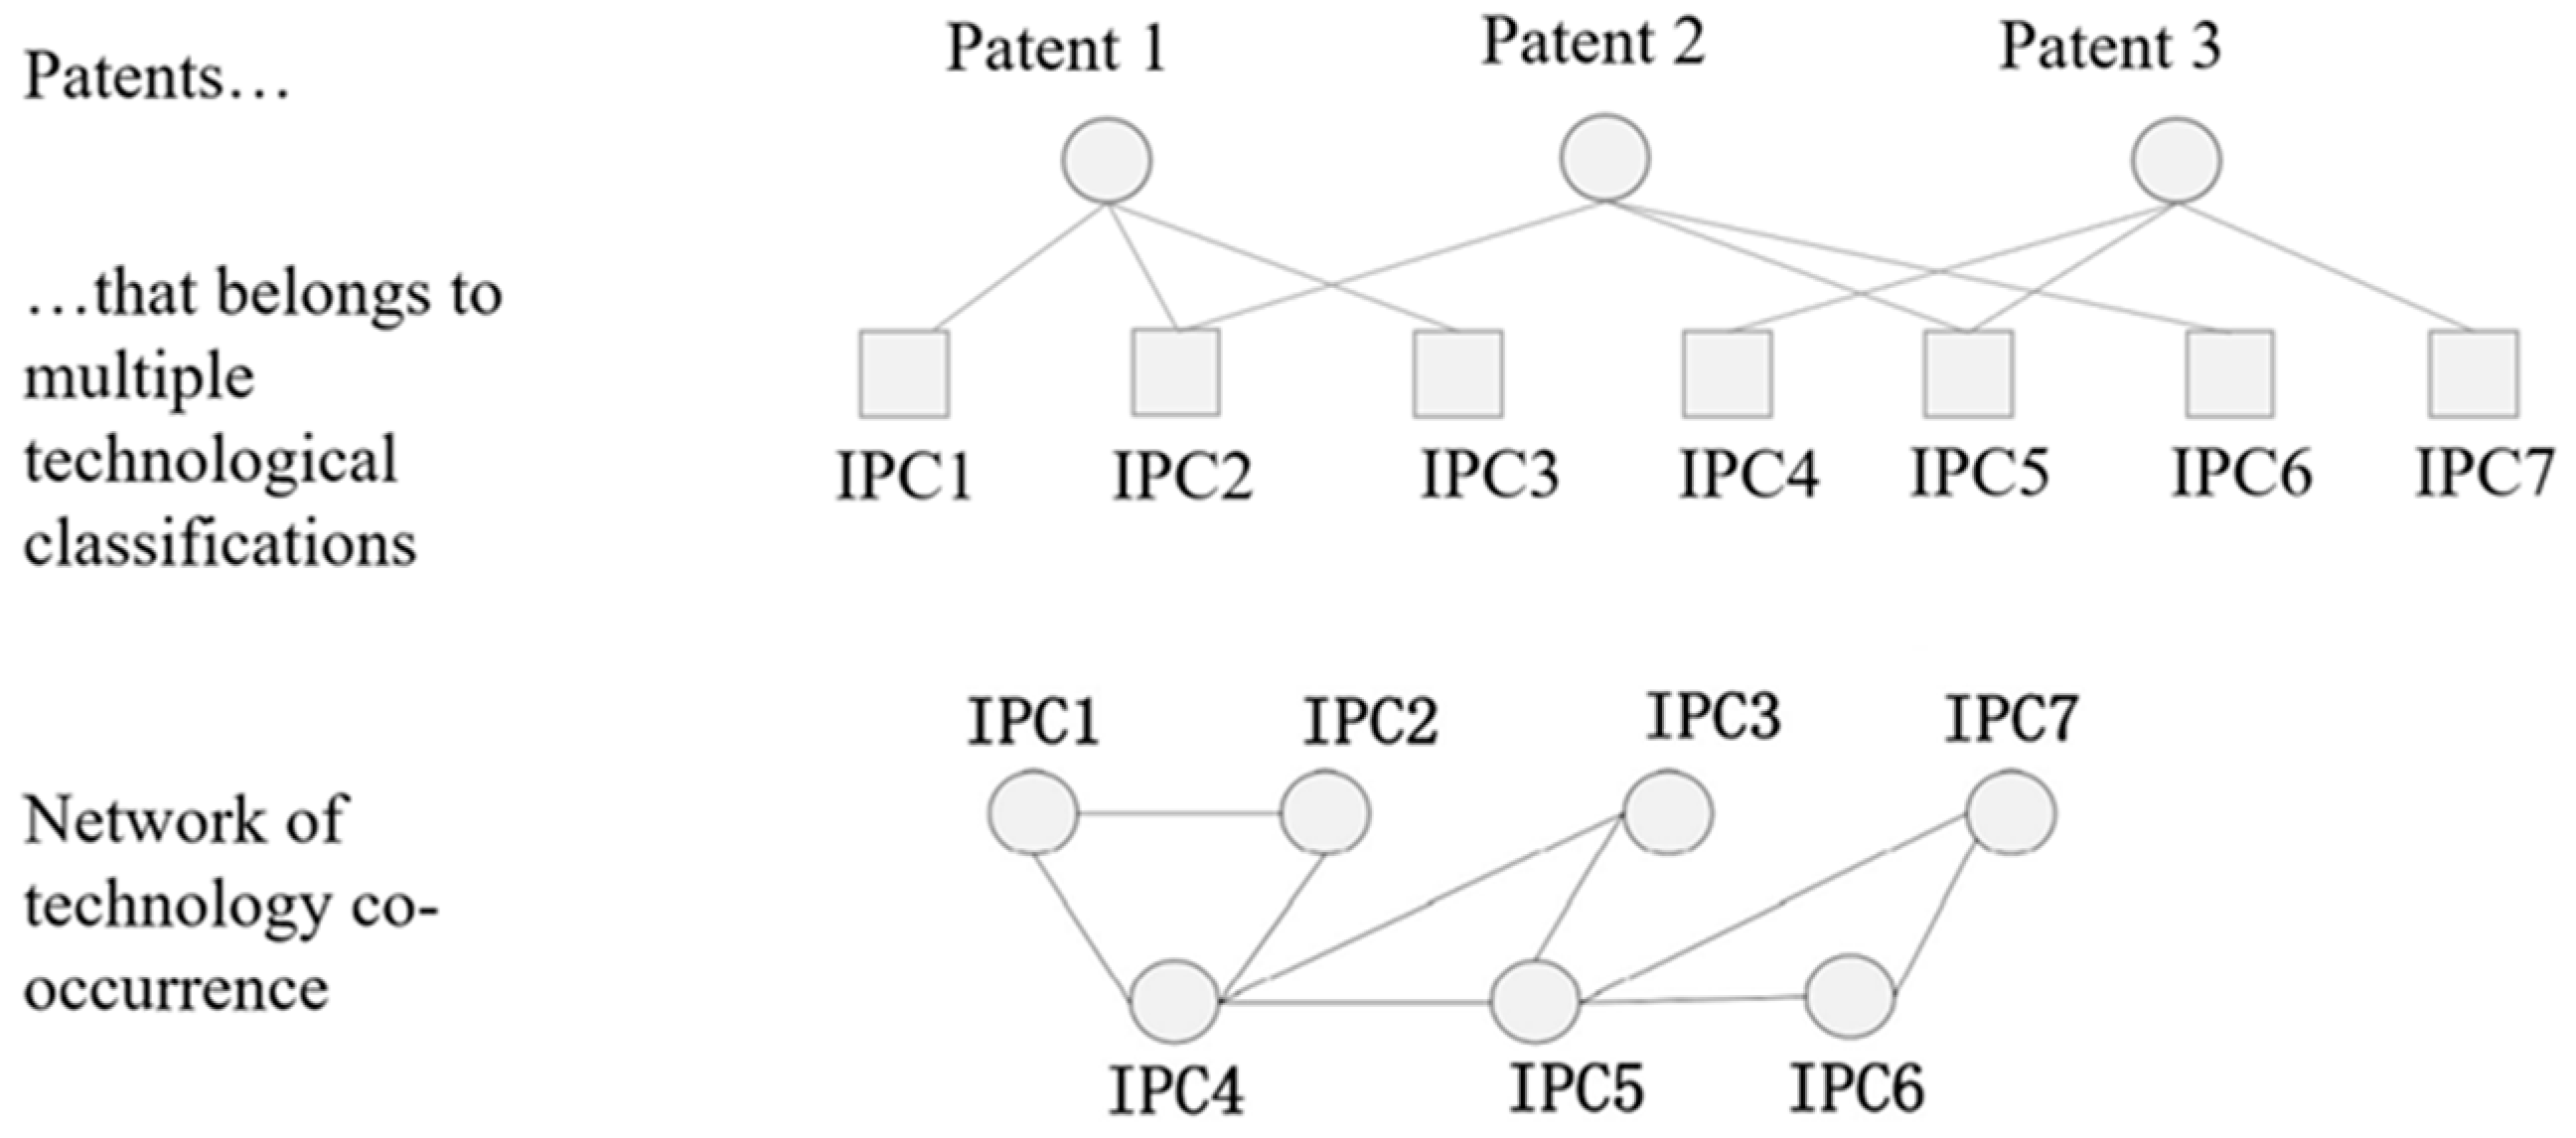
In this study, we first construct a technology co-occurrence network with a component period based on the technology classification of the patents, which were sorted by the first four digits of their International Patent Classification (IPC) code to characterize the degree of cooperation among various technology categories in China’s banking industry and its evolution over time. The principles behind this construction are shown in Figure 1.

Figure 1.
Principles of the construction of technology co-occurrence networks.
Moreover, since the modeling of categories fails to present the details of individual patents, we utilize patent citation relationships to establish networks, revealing the inheritance and progressive relationships between specific patent technologies [41]. The recognition algorithm based on search path count (SPC) has been widely used [30,31,41] for this type of research, and is presented as follows. Let N−(v) represent path s→v from source node s to node t in the network and N+(v) represent path v→t from source node v to sink point t; then, any path π that passes through the edge (u,v) from s to t can be expressed as follows:
where σ represents all the paths from s to u, denoted as N−(u), and τ represents all the paths from v to t, denoted as N+(v). The weight of edge (u,v), denoted as N(u,v), is calculated as follows:
π = σ·(u, v)·τ
N(u, v) =·N−(u) × N+(v)
The calculation for the normalized SPC weight of edge (u,v) is expressed as follows:
ω(u, v) =·N(u, v)/N(s, t), 0 ≤ ω(u, v) ≤ 1
Finally, for network topological analysis, in addition to classic degree centrality, betweenness centrality, and harmonic closeness centrality, we also calculate the network density and average clustering coefficient to measure the degree of technology interaction and use the average path length and network diameter to measure the degrees of interactivity and efficiency of the technical network.
3.3. Enhancing SPC with a Branch-Integrated Framework
To advance the main path analysis, we introduce a novel analytical framework that combines one main path with multiple branches, aiming to address the limitations of conventional single-path analysis. While the traditional SPC approach extracts a dominant trajectory within a densely connected citation network, we observe that China’s banking patent network is relatively sparse and fragmented, reflecting its late start and diverse development directions. As a result, the main path alone—consisting of only nine patents—is weak in capturing the complexity of technological progress in the sector.
We apply a gravity-based layout and use hierarchical network analysis to directly identify multiple paths within the largest connected subnetwork. This approach allows us to extract not just a central path but also key branch paths that, together, offer a more complete representation of the innovation landscape.
This methodological enhancement is both empirically grounded—based on the observed structural features of China’s patent network—and theoretically informed, as it reflects the modular and path-dependent nature of technological development in emerging industries [42,43]. In this way, we extend the SPC method from single-trajectory tracing to a multi-path framework, which is better suited for analyzing sector-wide innovation systems like banking.
In sum, the overall research roadmap is summarized in Figure 2.
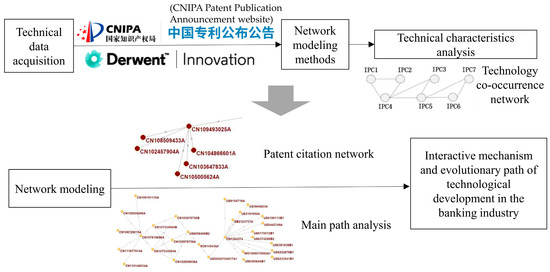
Figure 2.
Summary of the research roadmap.
4. Results and Discussion
Based on CNIPA data, this paper summarizes the characteristics of banking patent technologies in China from four perspectives: international comparison, heterogeneous descriptive statistics, industry interaction, and technological content.
4.1. Technical Characteristics of Chinese Banking Patents
4.1.1. International Comparison
In terms of quantity, China’s position in global banking patent activity has improved over the past three decades. Figure 3 and Figure 4 present the number of banking patent documents from China, the US, and global sources, including the WIPO and EPO, filed during the study period. We find that China has gradually increased its number of banking patents and begun to establish influence in this field. In contrast, the top global applicants—mainly from the US, South Korea, and Japan, as well as international organizations like WIPO and EPO—saw their patent filings rise until 2012, after which they began to decline.
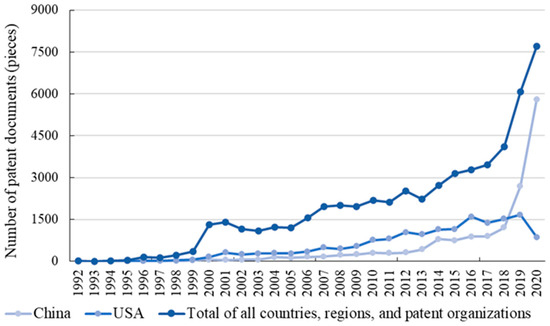
Figure 3.
Number of patent documents from China, the US, and the global banking industry (1992–2020).
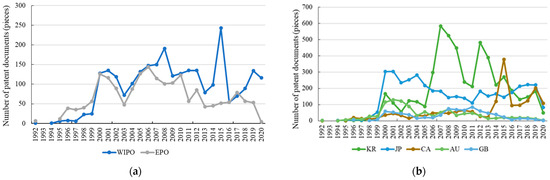
Figure 4.
Number of patent documents in the banking industry from major patent organizations (a) and contributing countries (b) (1992–2020).
This may be because China began filing banking patents later than other developed countries. The first banking patent in the US was filed in 1968, while China’s first appeared nearly 20 years later, in 1985. In recent years, the number of banking patent applications in developed countries has declined by half, with filings now primarily coming from major international banks rather than smaller institutions. By contrast, China’s large market size and numerous banks have allowed it to demonstrate certain late-mover advantages in terms of its patent application volume.
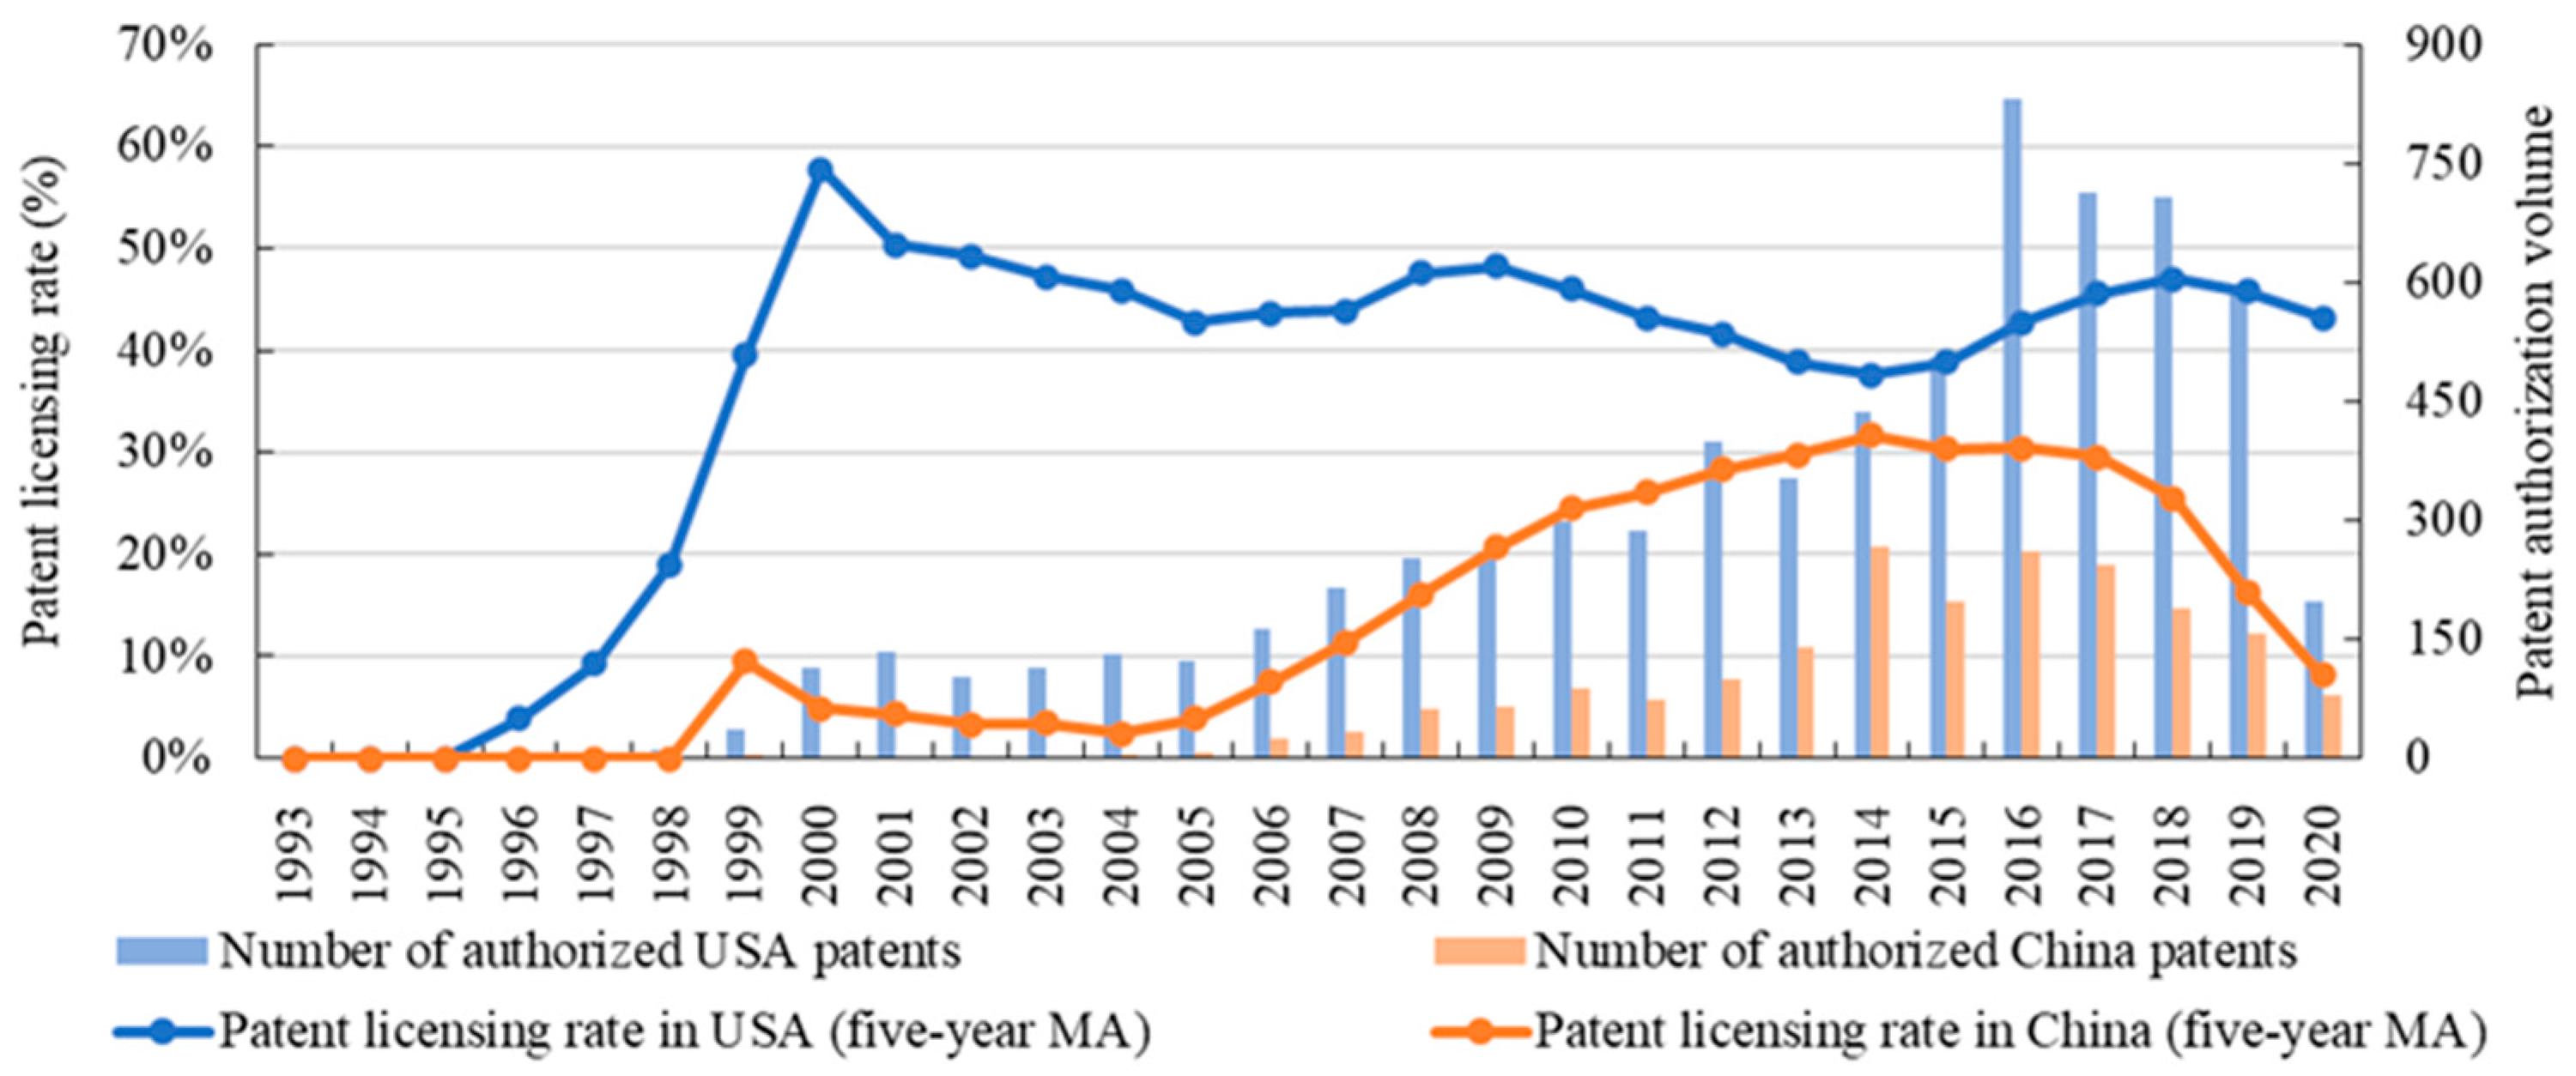
However, as shown in Figure 5, from 2000 to 2020, the average annual number of invention patents granted in the banking sector was 105 in China, compared to the 330 in the US. Although the number of invention applications in China has surged in recent years, both the grant rate and the actual number of granted patents have declined, indicating significant room for improvement in patent quality.
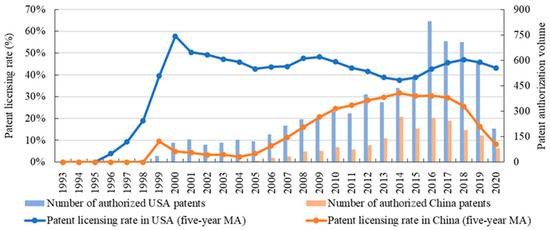
Figure 5.
Licensing rate of banking patents in China and the US (1993–2020).
In terms of influence, Table 1 presents citation data for the top five countries based on their comprehensive patent impact as determined using the DI platform. The results show notable differences in the distribution of banking innovation across countries during the sample period. Technologies patented through organizations like the WIPO and EPO tend to receive more recognition from applicants than those filed under national patent systems. On average, each Chinese banking patent cites only 9.1 other patents—significantly fewer than those from other countries. Additionally, each Chinese patent receives just 14.4 citations on average, which is 73.7% below the global mean.

Table 1.
Patent indexes of countries ranked by the Comprehensive Patent Impact Index (CPII).
4.1.2. Institutional and Regional Heterogeneity in China’s Banking Patents
Table 2 summarizes the fundamental characteristics of China’s banking patent data over the sample period1. First, the technological innovation in China’s banking sector is highly concentrated among a few institutions. The top five patent holders account for 76.9% of all banking patents in China. Second, the overall invention patent grant rate in China was 6.5% during the sample period. The PBoC system had the highest grant rate at 27.1%, followed by urban commercial banks (11.1%), private banks (8.4%), state-owned banks (5.6%), and joint-stock commercial banks (3.9%).
Table 2.
Statistics on the number of patents grouped by bank type (pieces).
We then analyzed the regional distribution of patents filed during 2000–2010 and 2011–2021. During the first decade, the patent applicants were primarily located in Beijing and the eastern coastal regions. Beijing-based institutions filed 465 patents, representing 86.6% of the national total, followed by those based in Guangdong (5.6%) and Shanghai (3.5%). The major applicants included research institutes and branches affiliated with the central bank and large state-owned commercial banks, along with foreign banks and equipment manufacturers.
In the following decade, the banking innovation expanded to coastal and central regions, with the private sector emerging as an increasingly active contributor, supported by a series of national policies.
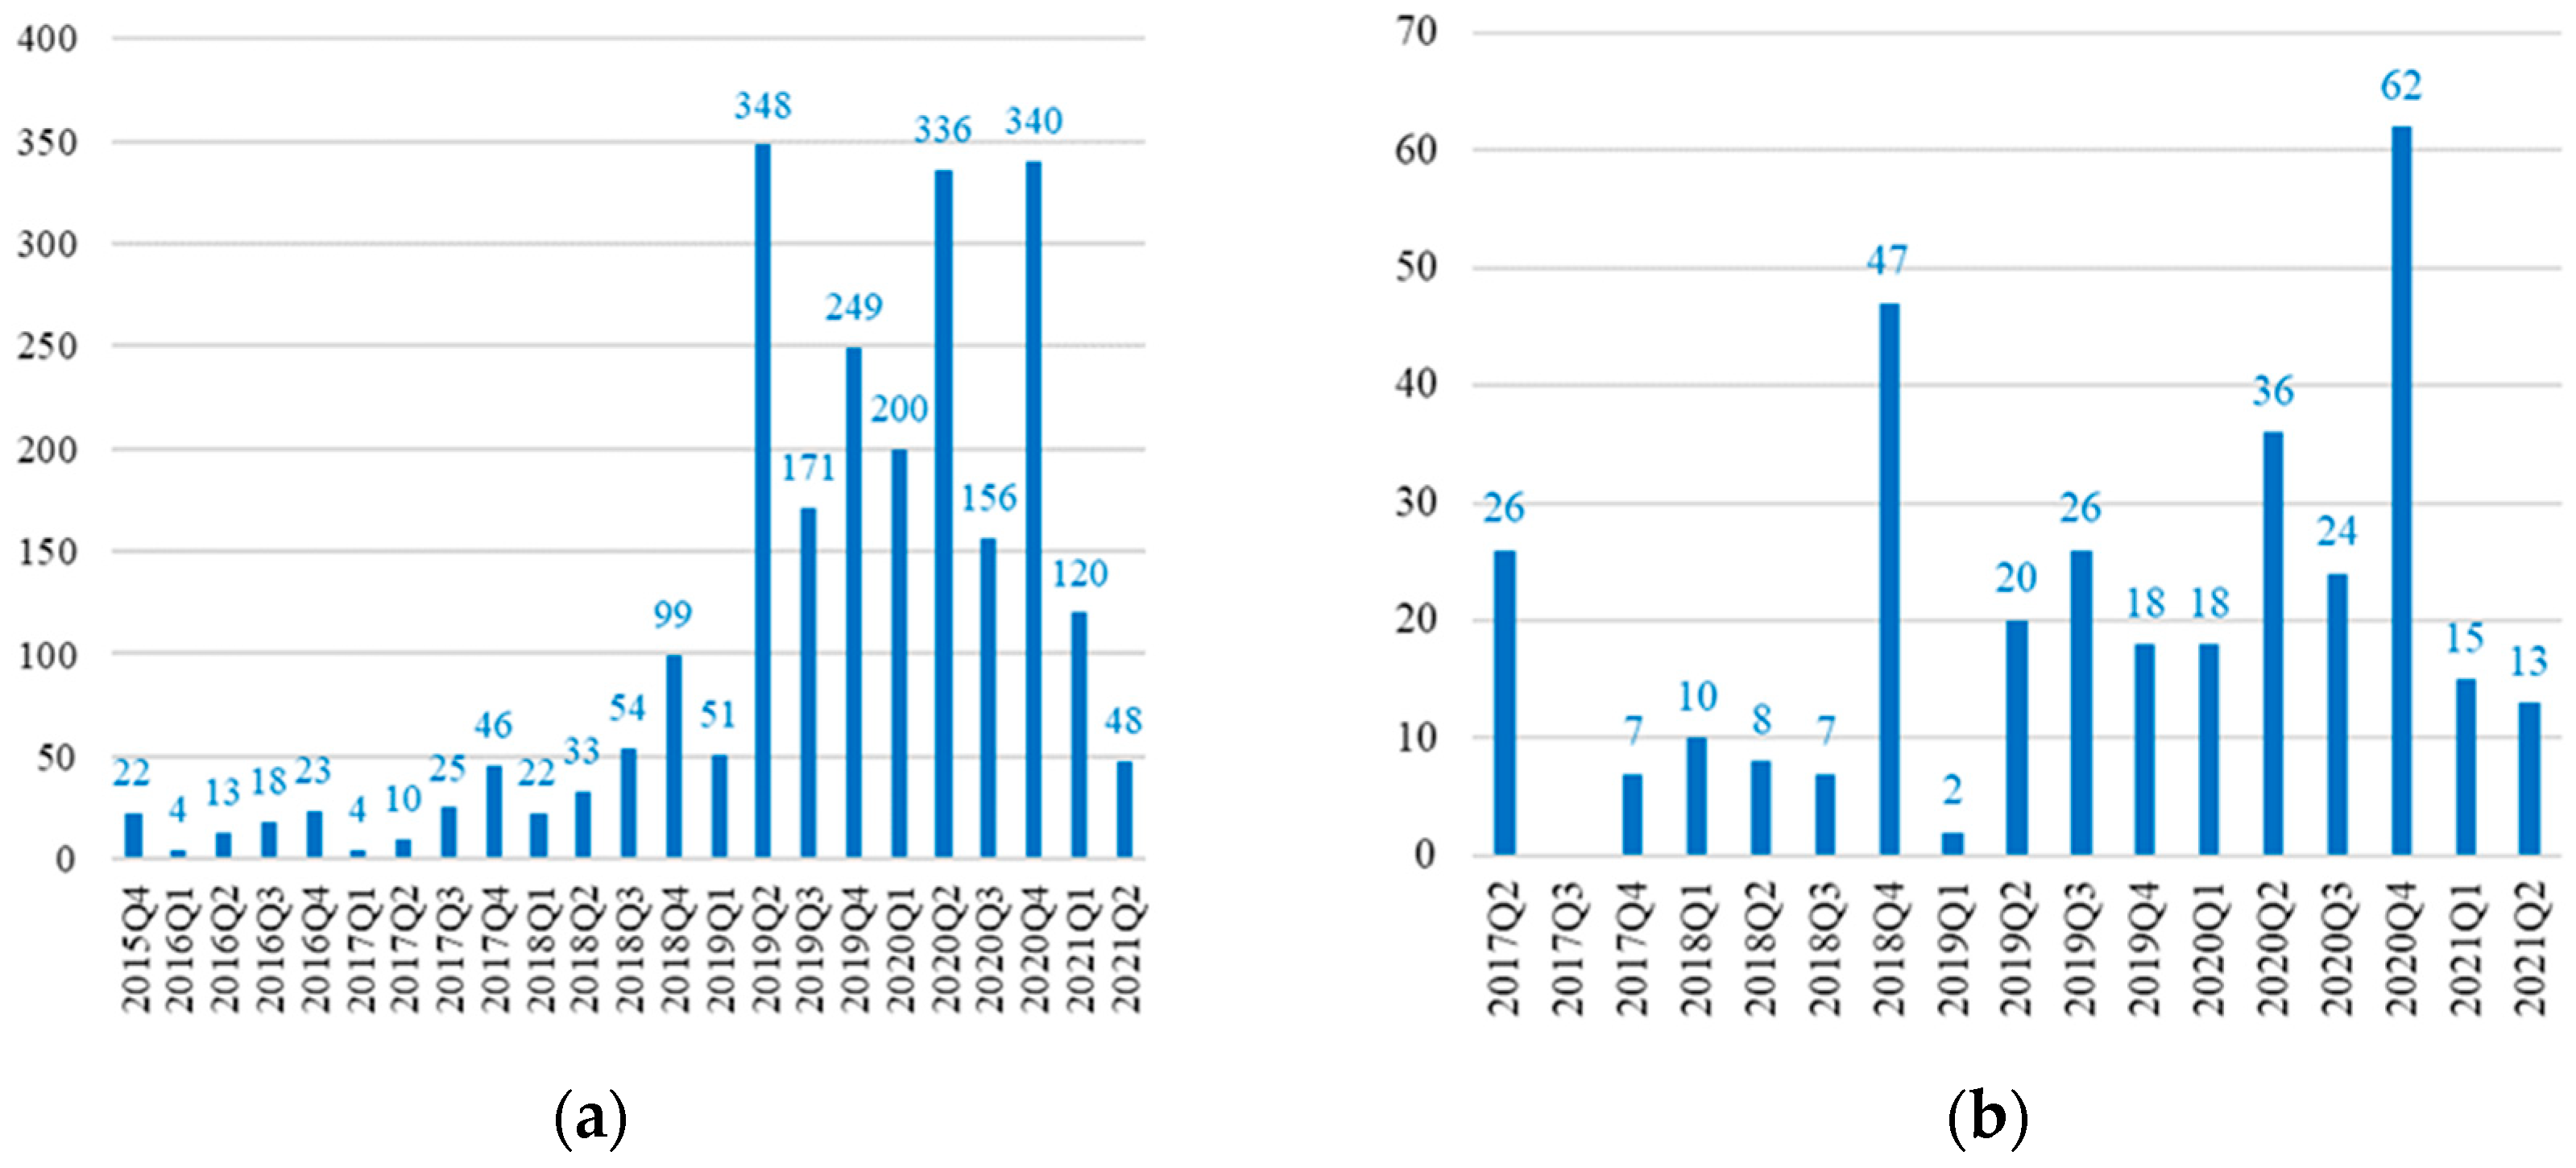
First, private banks have demonstrated strong innovation capabilities. WeBank and XW Bank, among the first two batches of approved private banks in China, filed numerous patents within a year of their founding (see Figure 6). Between 2000 and 2021, WeBank emerged as the innovation leader in Guangdong’s banking sector, filing 2392 patents—73.9% of the provincial total. Of these, 147 were granted invention patents, representing 87.0% of such grants in the province. Similarly, XW Bank contributed 85.0% of Sichuan’s total banking patents during the same period, with 54 being granted invention patents, making up 94.7% of the provincial total.
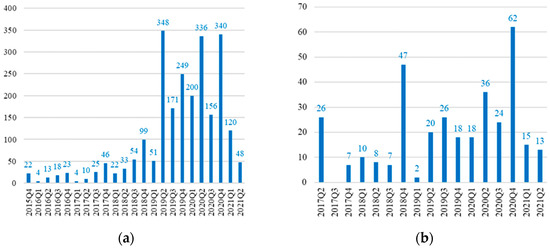
Figure 6.
Patent applications of WeBank and Sichuan XW Bank. Subfigure (a) represents the number of patents filed by WeBank since its establishment up to the second quarter of 2021, while subfigure (b) represents those filed by Sichuan XWBank.
Second, China’s financial innovation policy has played a catalytic role in the development of patents. Given China’s significant regional disparities, its large number of financial institutions, and the iterative nature of fintech development, the Chinese program aimed to develop regulatory tools that were suited to China’s national conditions while aligning with international standards.
By mid-2022, 156 pilot projects had been launched across 29 provinces, involving 121 banks and covering technologies such as optical character recognition (OCR), the Internet of Things, multiparty security computing, application programming interfaces (APIs), cloud computing, natural language processing (NLP), and knowledge graphs. These technologies were applied in diverse scenarios, including credit financing, risk control, business process optimization, supply chain collaboration, and identity verification.
For instance, in August 2020, the Chengdu Branch of the PBoC launched six pilot projects in Sichuan Province. In addition, XW Bank applied to start a program of smart financial services for small and micro enterprises based on multiparty security computing, and later filed related patents in early 2021. This practice illustrates the important role of policy guidance and regulatory oversight in driving banking innovation in a developing economy.
Finally, China’s banking patents span 252 IPC technology categories (Table 3), with 18 categories being represented by more than 50 patents each. The high concentration of banking technology observed herein is consistent with the conclusions of the previous literature [42].
Table 3.
Frequency of the technical categories of bank patents (pieces).
4.1.3. Time-Phase Description
Drawing on the strategic and institutional development of China’s banking industry [43,44] and the evolution of the Fourth Industrial Revolution [45,46], we divide the sample period into three representative stages: the computer era (2000–2008), the mobile internet era (2009–2015), and the digital technology era (2016–2021). For each stage, we construct a technology co-occurrence network to analyze the relationships and interactions between key technology types.
Figure 7 and Table 4 describe the main characteristics of the technology co-occurrence network for the computer era. During this period, the innovations focused on tools and equipment to support core banking operations, and were primarily aimed at process optimization, currency verification, and machine design improvements. These patents can be broadly categorized into four business scenarios.
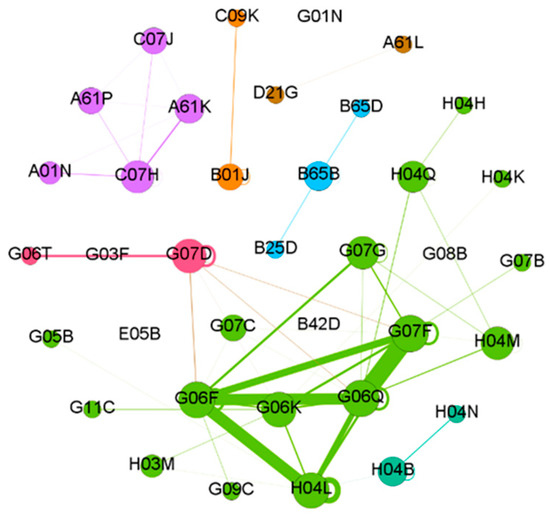
Figure 7.
Technology co-occurrence network in the computer era.
Table 4.
Important network nodes and their topological indicators in the computer era.
The first scenario is business management and payment systems, including bank card transaction platforms, online guarantee evaluation, contract verification tools, electronic vouchers, and digital mortgage systems. The second is investment-related technologies, such as portfolio management and financial transaction systems. The third is currency identification and sorting technologies (G07F, G07D), typically filed by U.S. investment banks, Japanese manufacturers, Zhejiang- and Jiangsu-based equipment firms, and Shanghai’s banknote printing institutions. Last is physical security systems, including virtual lock boxes, password scramblers, automated control devices, and digital monitoring systems.
With the launch of 3G networks in 2008, the mobile internet era began. Tech companies and internet platforms reshaped the financial landscape by leveraging communication infrastructure, digital ecosystems, and social media. The co-occurrence network in Figure 8 and Table 5 reveals three core clusters: purple, blue, and green.
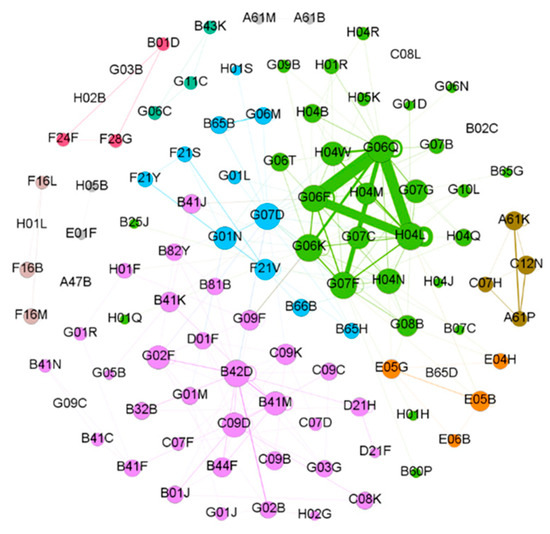
Figure 8.
Technology co-occurrence network in the mobile internet era.
Table 5.
Important network nodes and their topological indicators in the mobile internet era.
The key nodes in the purple and blue clusters are dominated by note printing and anti-counterfeiting technologies, which were developed by the PBoC’s research institutes, regional branches, and a few state-owned banks. The purple cluster features B42D (security printing), C09D (coating/inks), and B41M (printing methods), and the blue cluster includes G01N (material analysis), G07D (coin/banknote handling), and auxiliary technologies such as elevator controls (B66B) and lighting systems (F21V).
The green cluster represents banking business’s innovation during the mobile internet era. It consists primarily of patents filed by state-owned and urban commercial banks that focus on software-driven solutions and information systems. The key nodes include G06F (electric digital data processing), G06K (recognition of data, presentation of data, record carriers, and handling record carriers), and G06Q (systems or methods specially adapted for administrative, commercial, financial, managerial, supervisory, or forecasting purposes, not involving significant data processing). The interactions among the four categories have formed more than 1600 patents in the areas of security authentication, secure communication, encryption methods, and data processing systems, accounting for 69.3% of the industry’s patents during this period.
In addition, the presence of smaller peripheral clusters reflects an expanding diversity in technological directions. However, compared to the computer era, measures of closeness, centrality, and clustering coefficients declined slightly for this era—indicating that, while the range of technologies broadened, their internal connectivity became relatively weaker.
Fintech in China began to take shape around 2016, driven by the explosion of data and the rise of next-generation digital technologies such as artificial intelligence (AI) and blockchain [47]. Facing increasing pressure from both peers and cross-sector competitors, traditional banks have responded with new models like virtual banking, open banking, and social banking [48,49,50,51].
The patent applicants became more diverse in this period. The share of patents from state-owned banks fell from 74.1% to 56.5%, while private, joint-stock, urban, and rural commercial banks together accounted for 26.7%, with individual shares of 16.2%, 8.3%, 1.3%, and 0.9%, respectively.
Figure 9 shows a stronger linkage between technology clusters, with both the median centrality and closeness centrality reaching their highest levels across all stages. The dense connections reflect the growing maturity of China’s banking technology system and indicate more active interactions across technology categories. Notably, G06F (digital data processing) and G06Q (business data processing) have emerged as central nodes in the network. Table 6 presents the key network nodes and their topological indicators in the digital technology era.
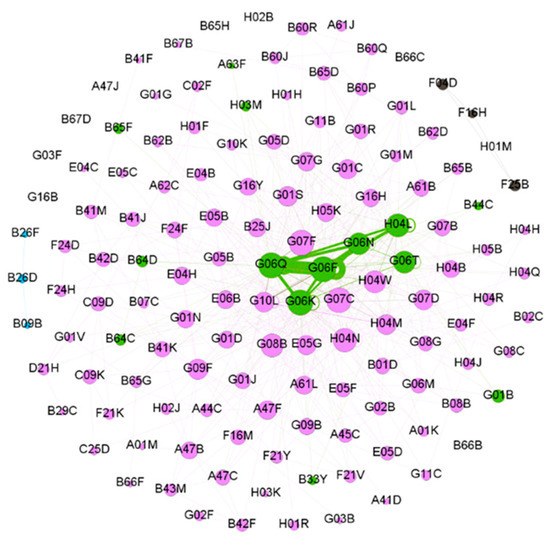
Figure 9.
Technology co-occurrence network in the digital technology era.
Table 6.
Important network nodes and their topological indicators in the digital technology era.
Figure 10 presents the technology co-occurrence network over the entire sample period, and Table 7 summarizes the topological properties of the four co-occurrence networks discussed. The banking industry's mainstream technologies have shifted from being quantity focused to being quality focused, and the development of key technologies has shown obvious network effects. Initially, from the electronic computer era to the mobile internet era, the banking industry focused on adopting and developing a wide range of technologies. Throughout these three stages, the network density and diameter first declined and then increased, reflecting the reduced interaction between technologies due to the rapid expansion of technology types during the quantity-focused period from 2008 to 2015.

Figure 10.
Technology co-occurrence network in the sample period of 2000–2021.
Table 7.
Topological properties of technology co-occurrence networks.
With the onset of the digital technology era, the average node degree has doubled, and the number of network connections has significantly increased. However, the growth rate of new nodes has slowed down in the post-internet era. While the number of technology nodes in the mobile internet era was twice that of the previous era, the increase in the digital technology era has only been 30%. Furthermore, the centrality of core technology nodes has risen exponentially, demonstrating that their importance has grown with the expansion of the network and providing clear evidence of the network effect.
4.1.4. Industry Interaction
To explore the interaction between China’s banking industry and other sectors, we refer to the “Concept of a Technology Classification for Country Comparisons” report issued by the WIPO [52]. We map technology classifications to industries, track the technical exchanges between them, and construct a timeline that shows when different industries contributed to the banking sector, as depicted in Figure 11.

Figure 11.
Timeline of the embedding of China’s banking industry into other industries (2000–2021).
Each cell in the timeline represents the number of new patents in relevant technologies for that industry in a given year. Our analysis reveals that electrical engineering and instruments have been the most interacted-with fields over the past two decades, particularly in the areas of computer technology, data processing, and digital communication. These technical exchanges have enabled the banking industry to develop secure communication systems based on the internet, while banks’ adoption of various control processing technologies has enhanced their capabilities in administration, commerce, finance, management, supervision, and forecasting.
4.2. Network Modeling
We refer to the literature and consider the size of the network and the degree of processing efficiency to model as much patent reference information as possible. The features of the sample range =are outlined in Table 8. By using all patents applied by Chinese banks and their citation data, we obtained 60,300 forward and backward citations, 99,700 citation relationships, and patents with global influence indicators above 20 points, which accounted for 3.65% of the global total. Based on these data, we modelled the patent citation networks of both the Chinese and global banking industries.
Table 8.
Characteristics of patent citation network samples.
Rows 1 and 3 of Table 9 present the basic topological indicators of the patent citation networks for China and the global banking system. China’s citation network exhibits three key characteristics. First, it is large in scale. The node scale of China’s patent citation network is comparable to that of the citation network formed by the frontier patents with global influence, representing 20.2% of global patent citations.
Table 9.
Basic topological indicators of patent citation networks in China and the world.
Second, the Chinese patents are less connected and less synergistic than the global patents across different technology types or even within the same technology type. Despite having a similar network scale, China’s network has 48.3 times more subnetworks compared to the global frontier patent subnetworks, and the average number of edges per patent is 41.8% lower in China. This indicates that the density of connections among patents in the global network is much higher, reflecting China’s relatively weaker interactivity at this stage.
Third, both the Chinese and global networks consist of a largest subnetwork and numerous smaller subnetworks. In China’s citation network, the largest subnetwork accounts for 66.98% of the total number of nodes, while the global network’s largest subnetwork accounts for 78.09%. This may be due to the more advanced and continuous development of mainstream technologies globally.
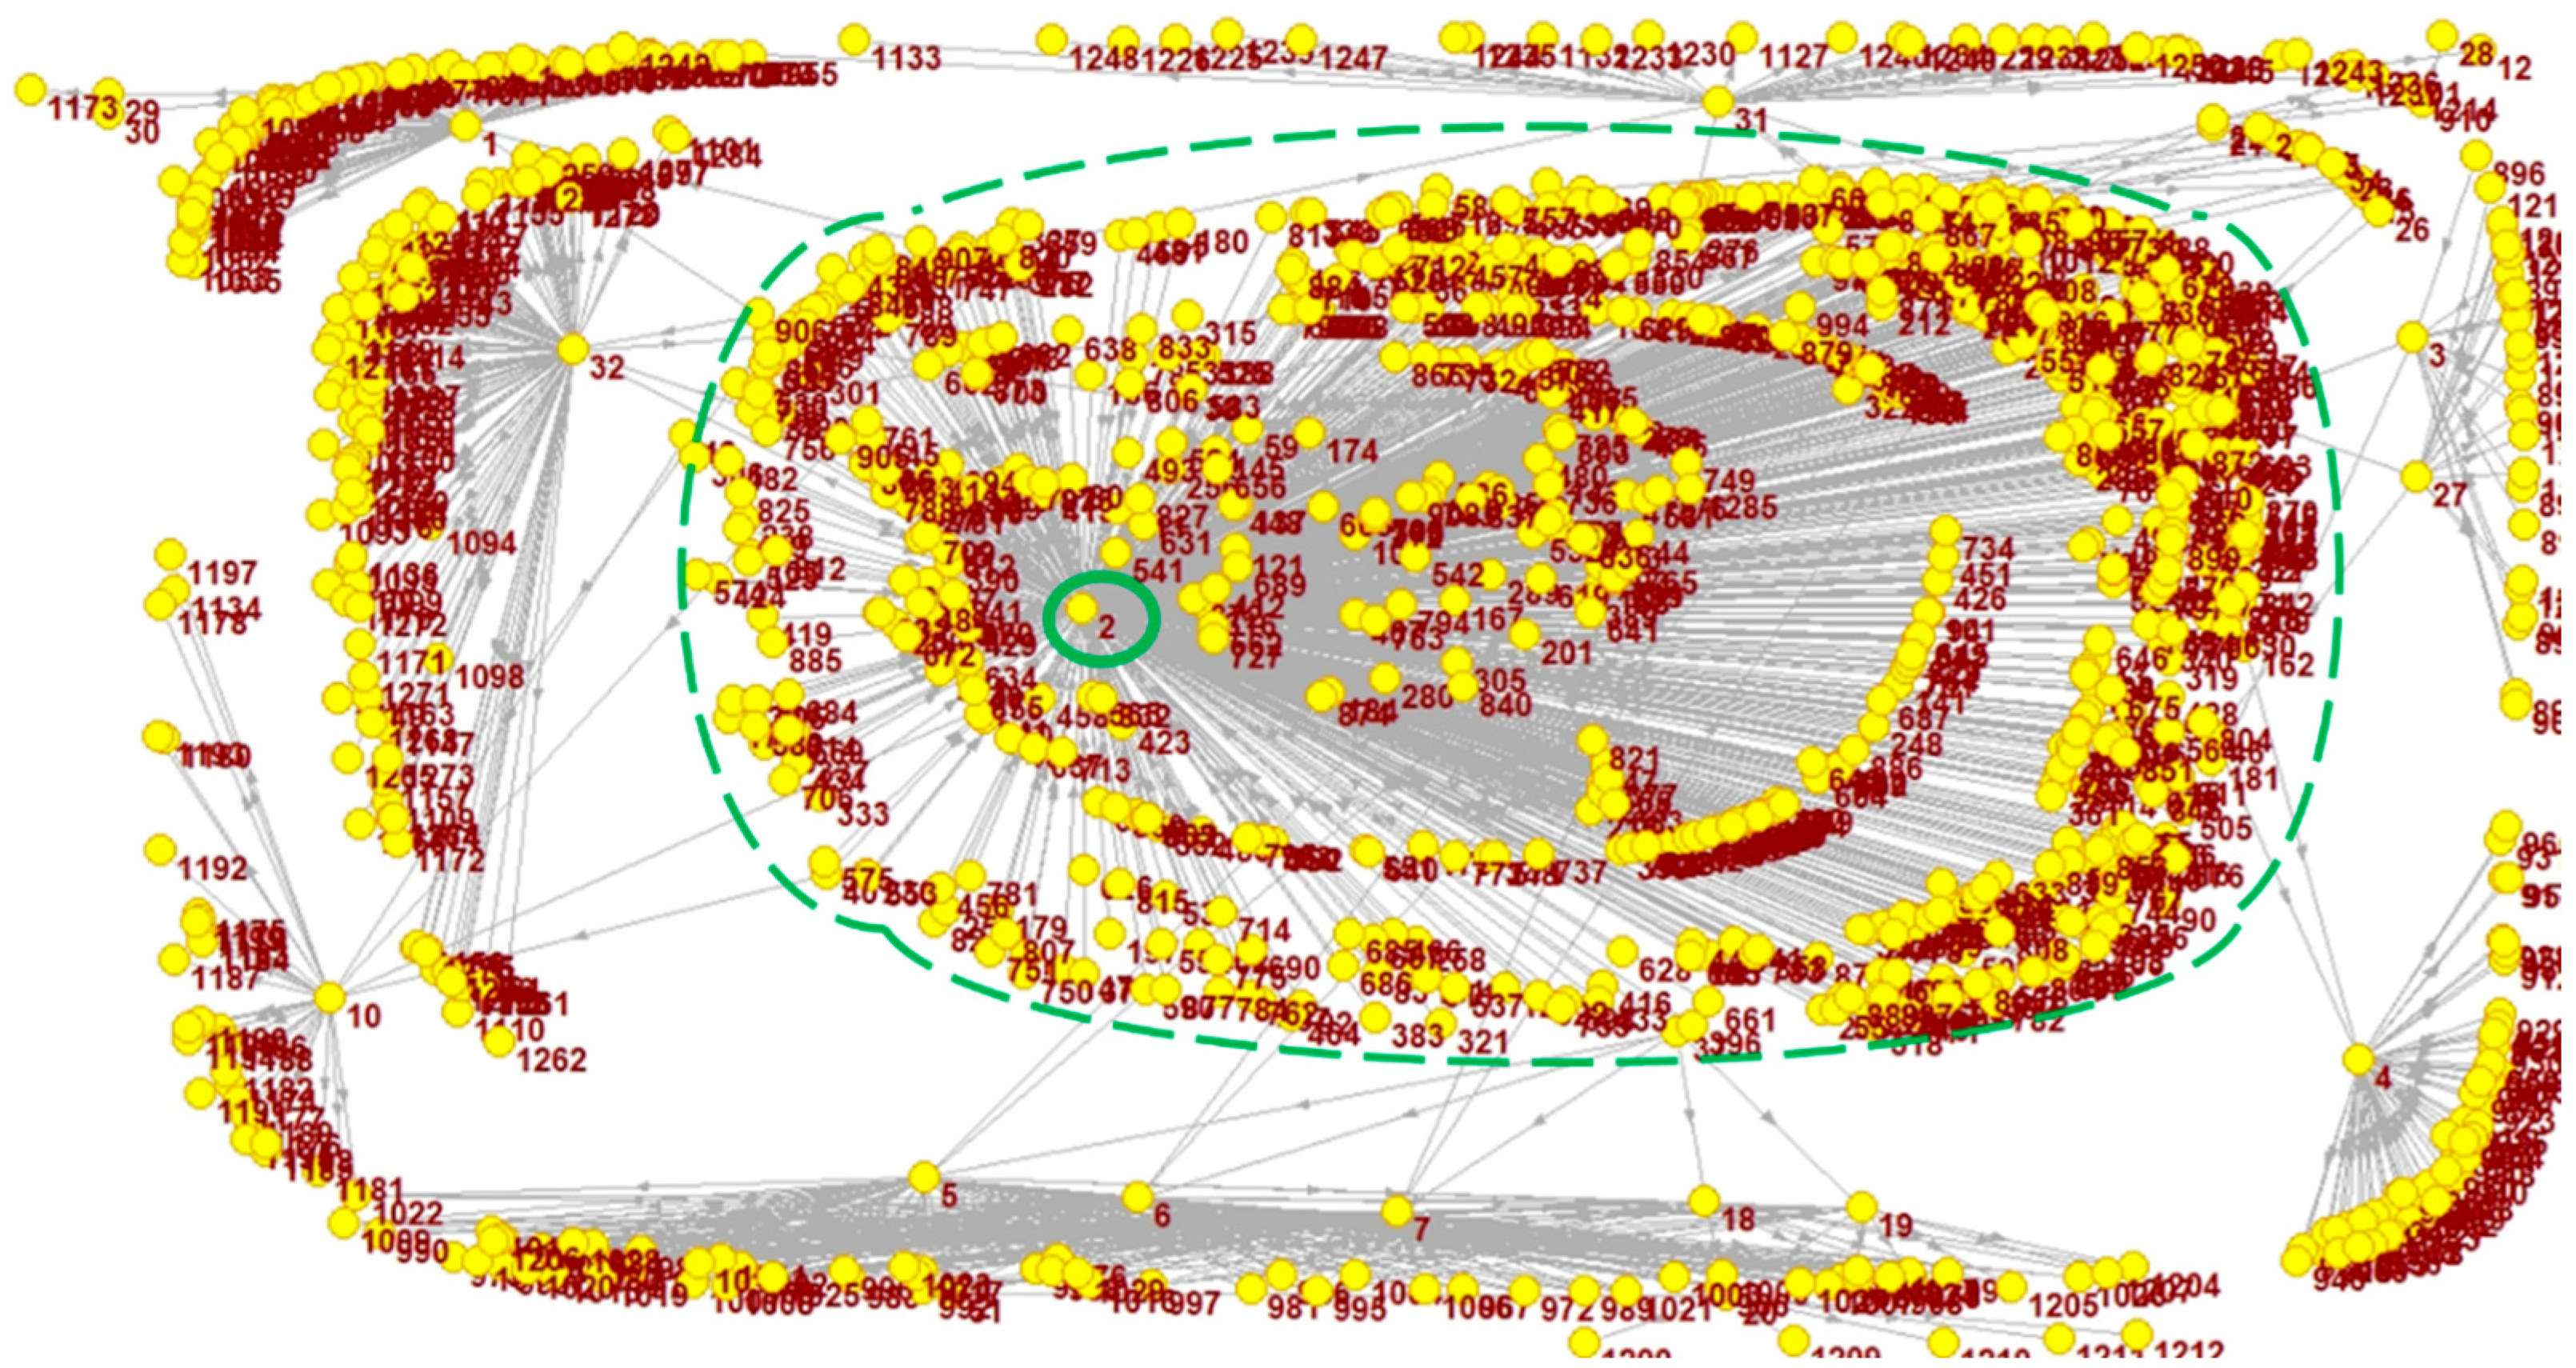
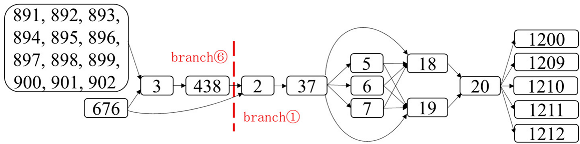
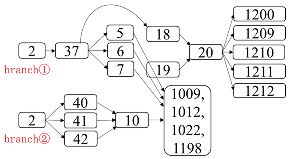
Figure 12 displays the largest connected subnetwork of China’s citation network, which has three main features. First, the subnetwork is clearly divided into two layers, as suggested in Figure 13, with the inner layer focused around patent No. 2 (CN1454364A). This patent has received many citations, which form a dense cluster of patents around it. Second, the outer patents and other key patents evolve from the inner patent cluster, forming eight distinct patent branches, as shown in Figure 12 (numbered 1–8). These branches are characterized by short step sizes, with each consisting of a core patent node and a cluster of patents diffusing around it. For example, branch 5 consists of patent No. 1 (CN101268485) and a fan-shaped cluster of patents that reference it, forming a patent path (1 → 161 → 29/30 → 1173) with relatively long steps outside the outer dotted line.
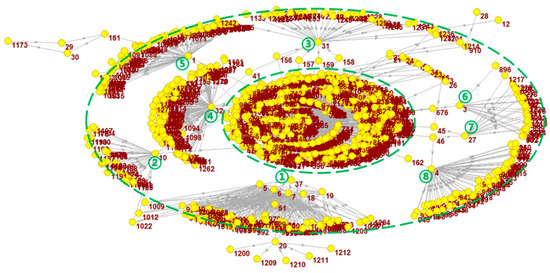
Figure 12.
Largest connected subnetwork of China’s banking system patent citation network.
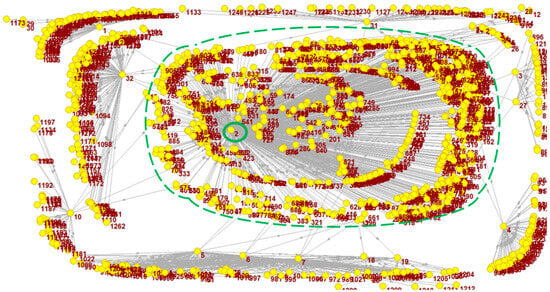
Figure 13.
Inner-layer structure of the largest connected subnetwork in China’s banking system patent citation network.
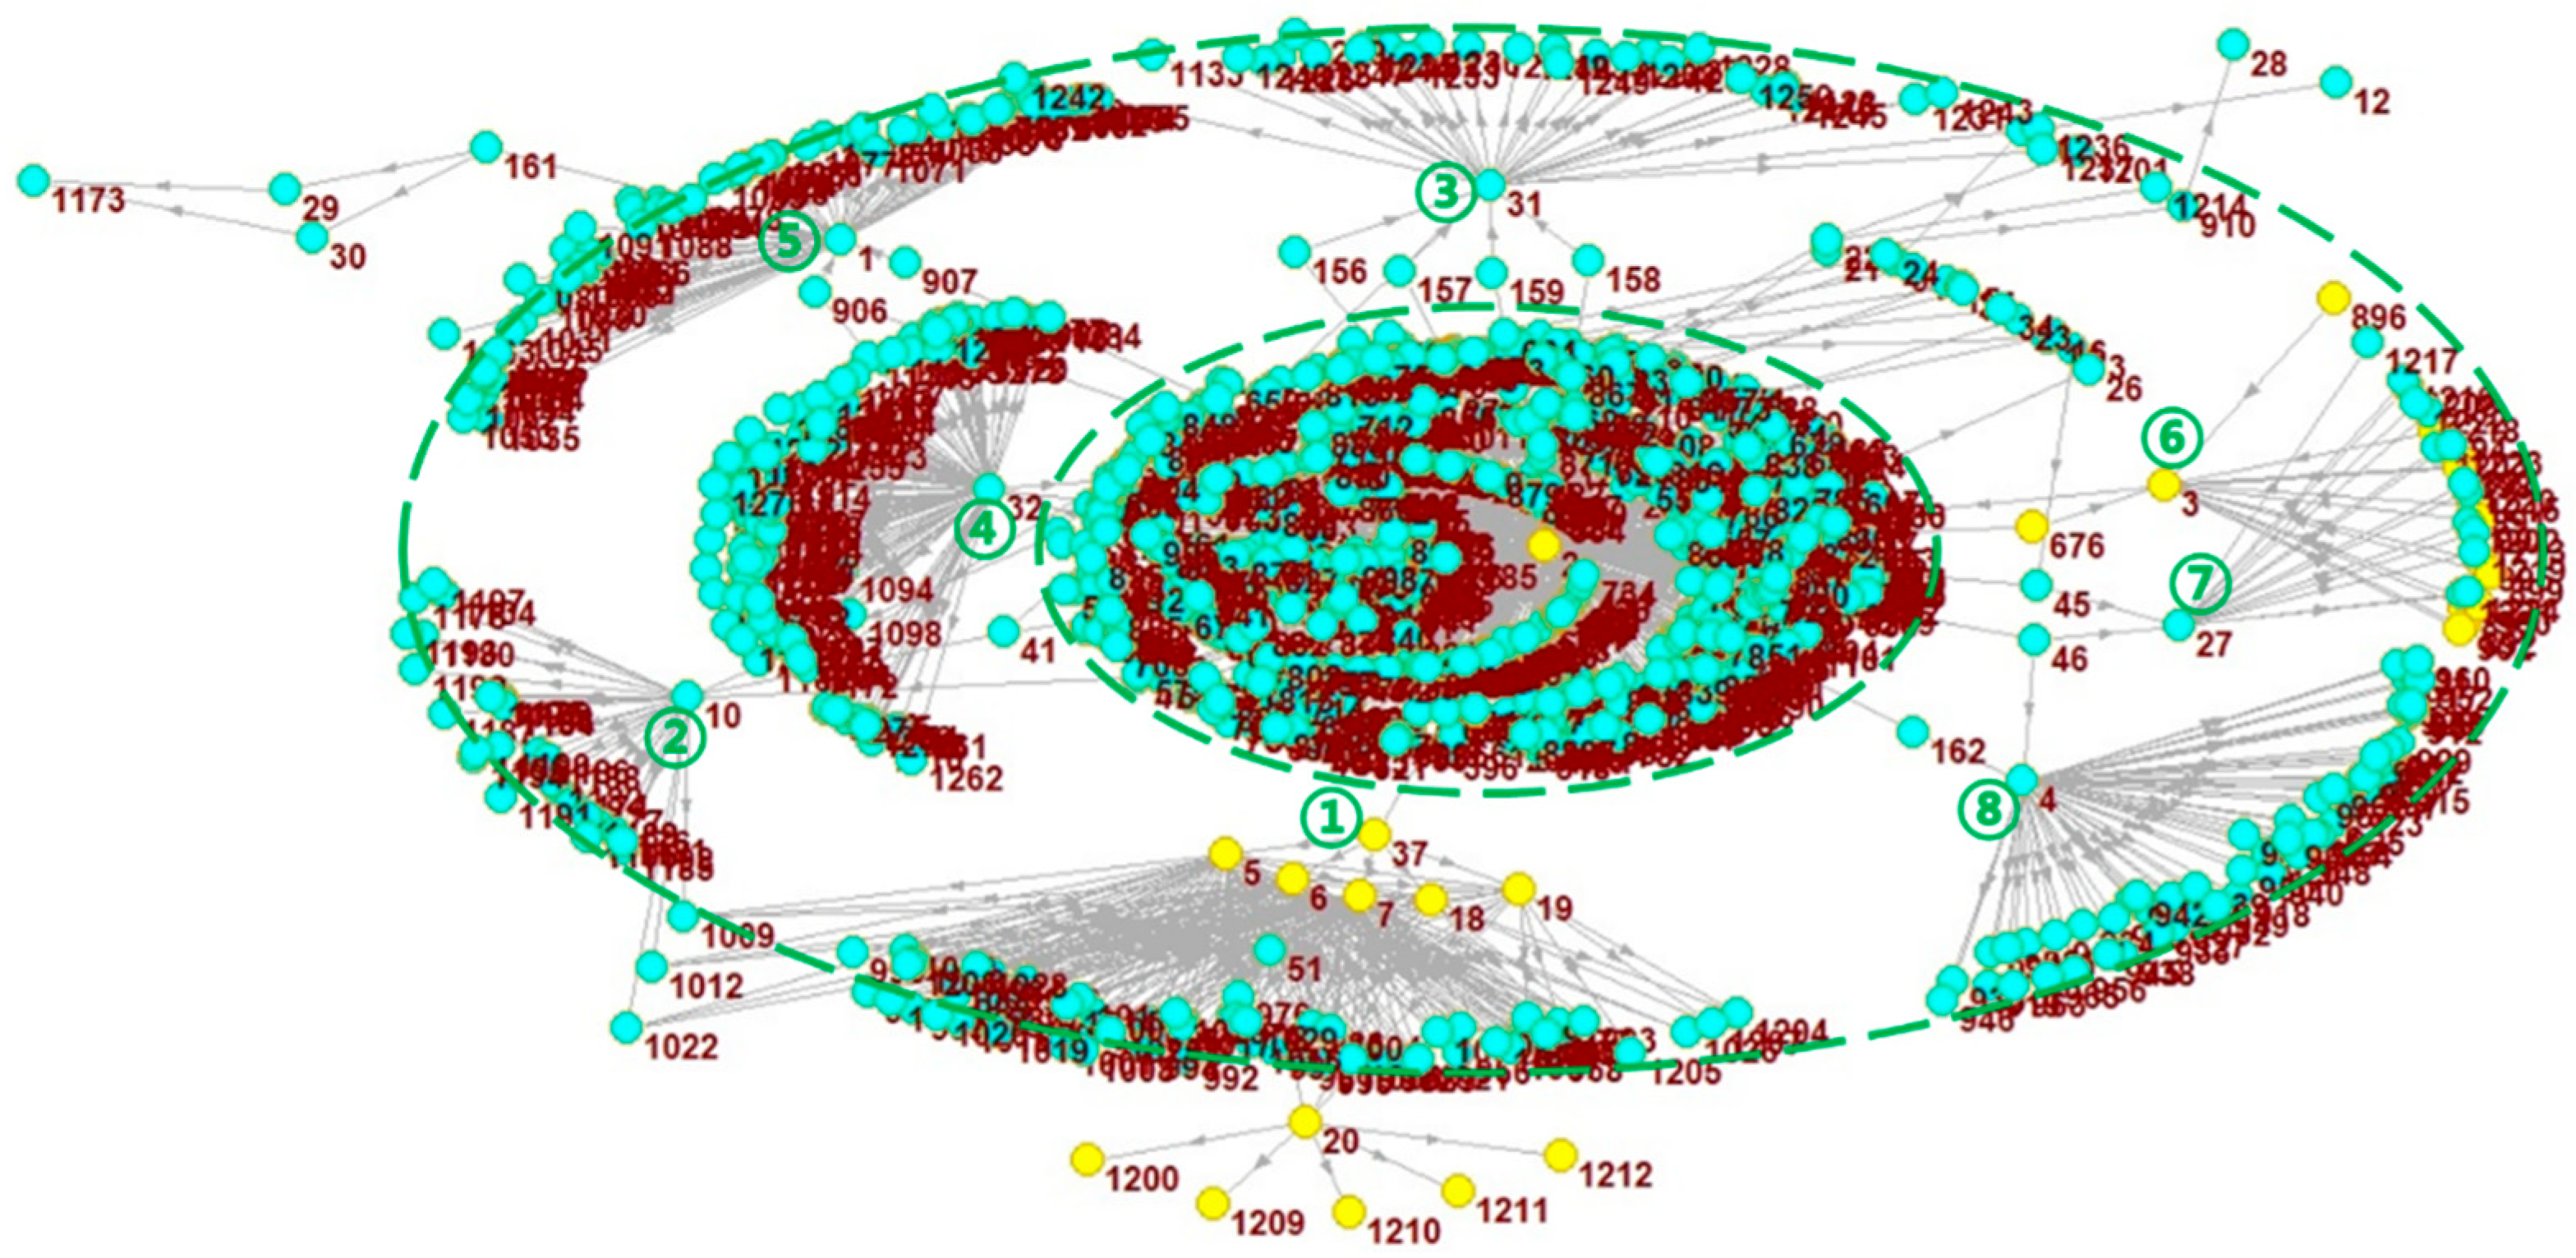
Third, the yellow vertex in Figure 14 indicates the main development path of China’s banking patents. The most important technological development path in China’s banking industry over the past 20 years is contained within patent branches 1 and 6, spanning nine steps. In comparison, the global main path involves 16 steps. This shows that China’s banking patent citation network has a main path that is more than 40% shorter than the global path, possibly due to China’s later entry into technological development or slower technology iteration compared to global progress.
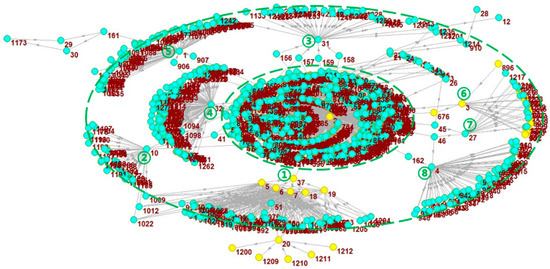
Figure 14.
Main path of the patent citation network in China’s banking system (shown in yellow vertex). Note: the non-main path vertices in the figure are displayed in blue, and other content remains unchanged compared to that in Figure 12.
In conclusion, the analysis of China’s patent network reveals that the development of China’s banking industry started later. Compared to the most connected subnetworks globally, China’s network has a larger number of branches and sparser connections between them. As a result, the nine patents in the main path provide only limited information. To comprehensively understand the technological development of China’s banking system, this paper introduces a novel analytical framework that combines the main path with multiple patent branches. Based on this, we conduct a parallel analysis of the main path (comprising branches 1 and 6) and five patent branches (2, 3, 4, 5, 7, and 8), as summarized in Table 10, which collectively offer a comprehensive overview of China’s banking industry.
Table 10.
Summary of patent branch references in China’s banking system.
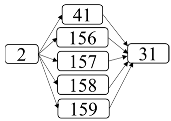
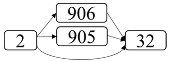
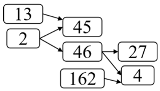
Note: for simplified representation and ease of understanding, the numbers in the boxes represent different patents, and the arrows represent patent citation relationships.
4.3. Main Path Analysis
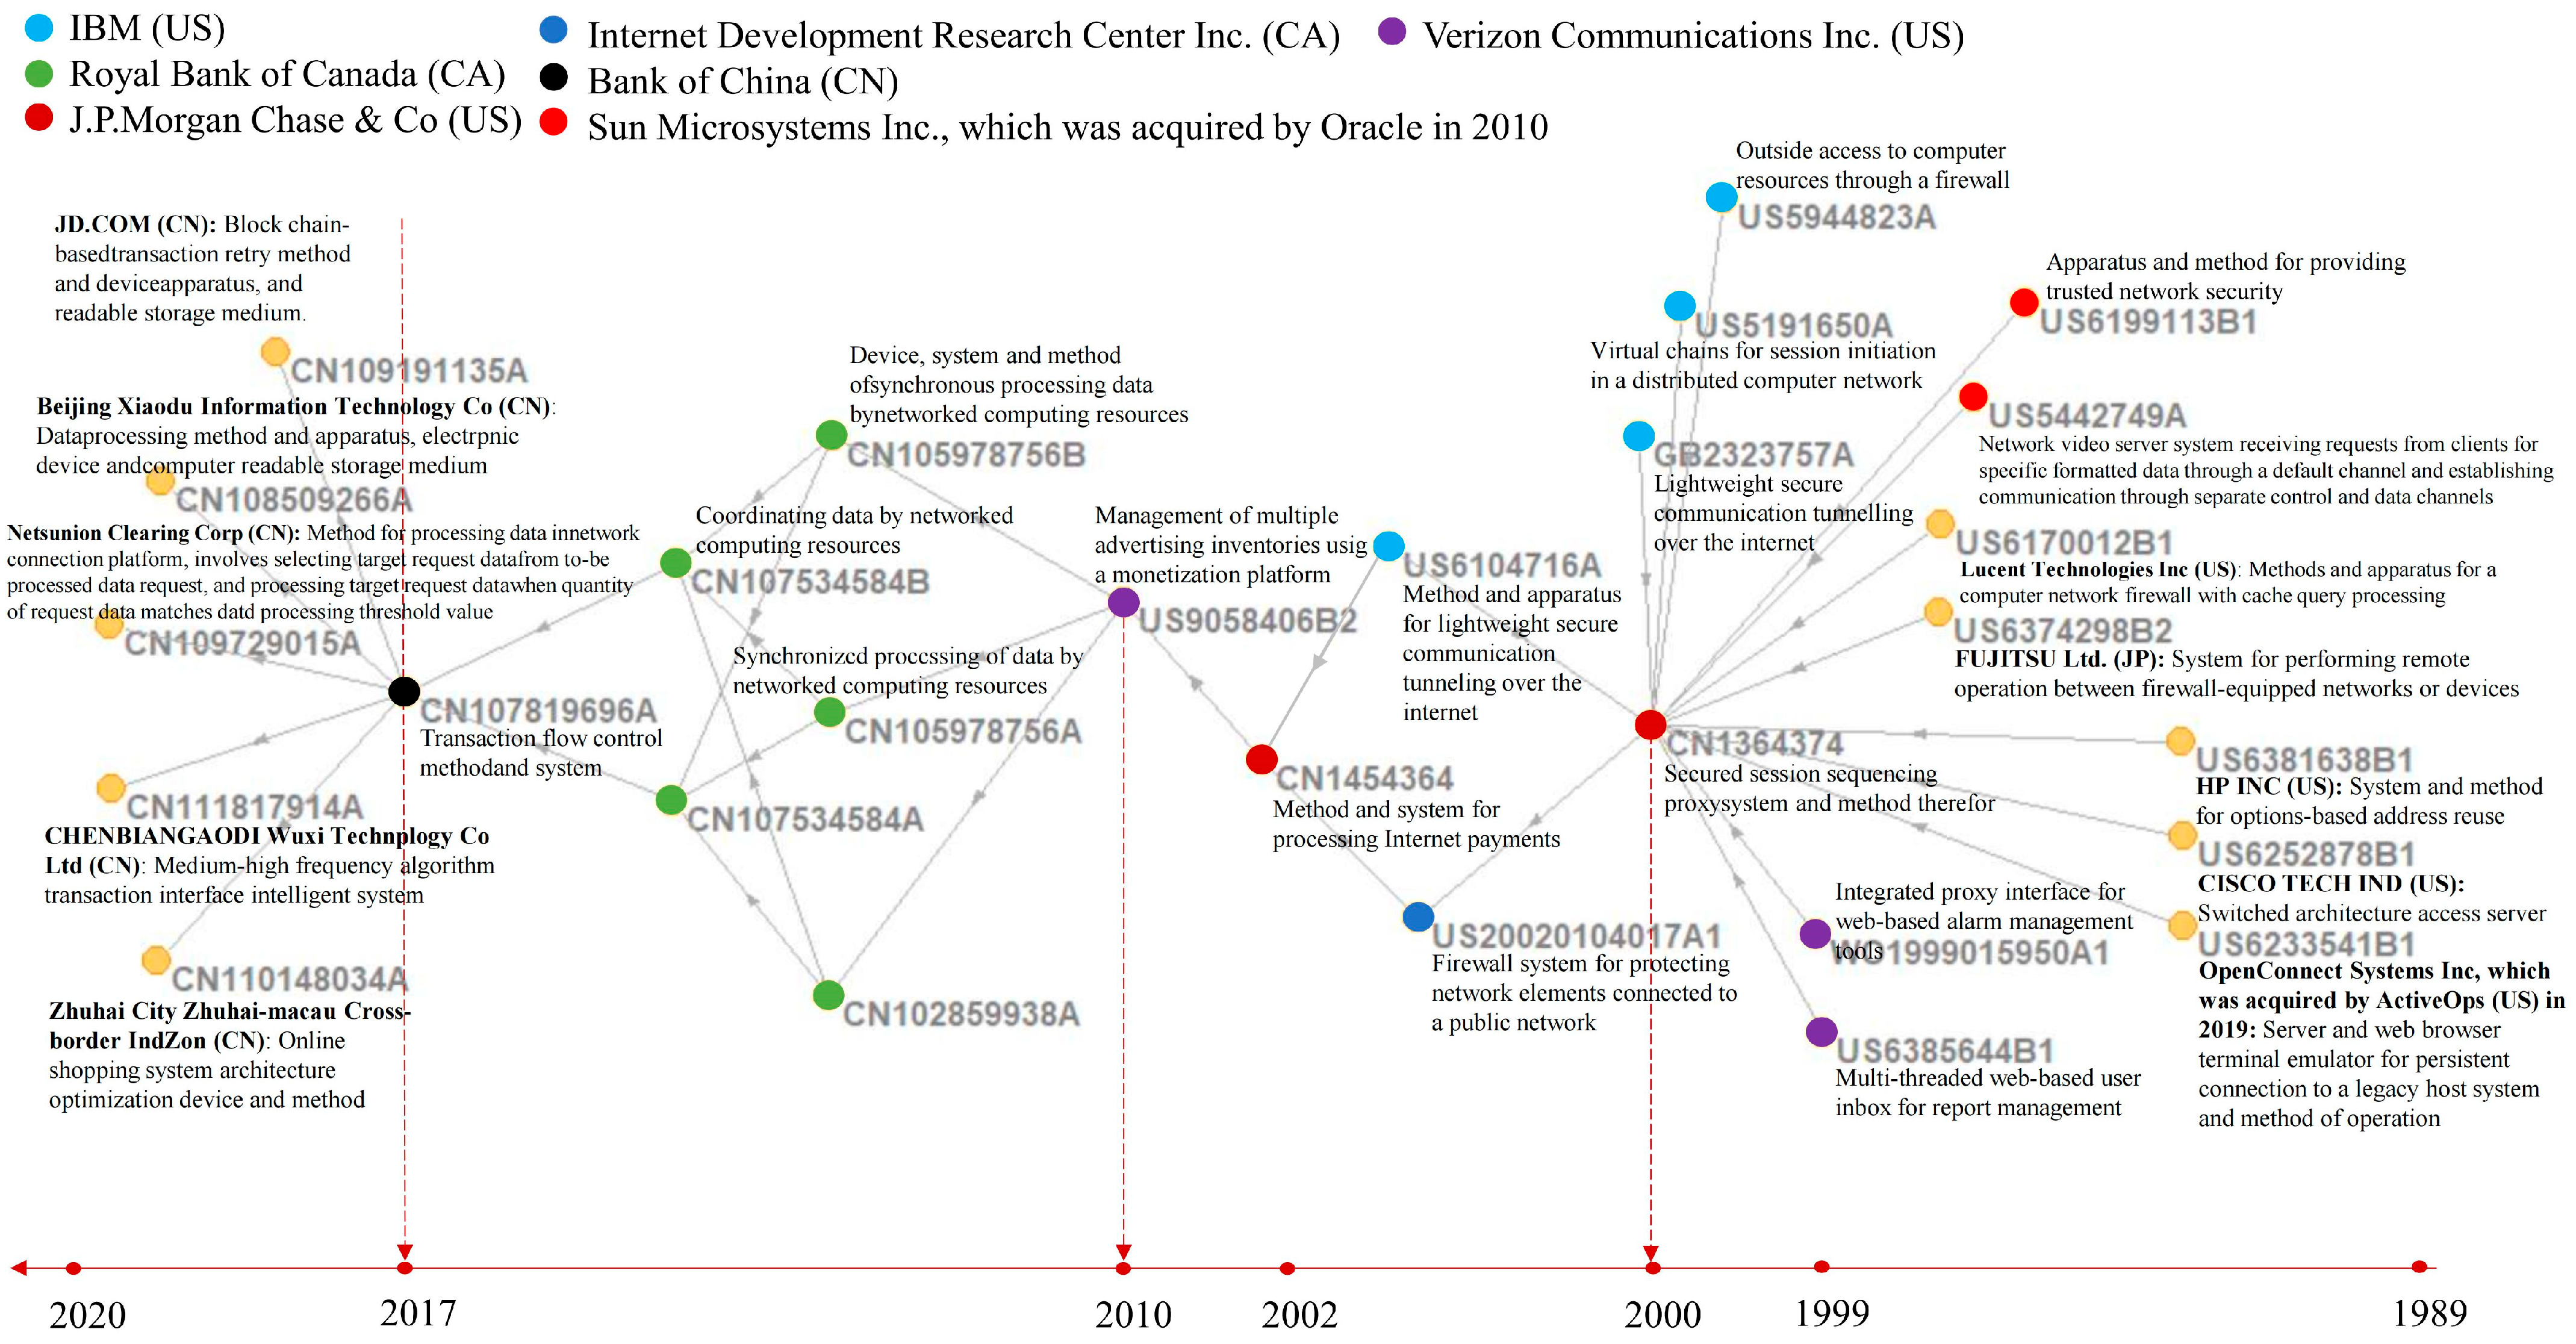
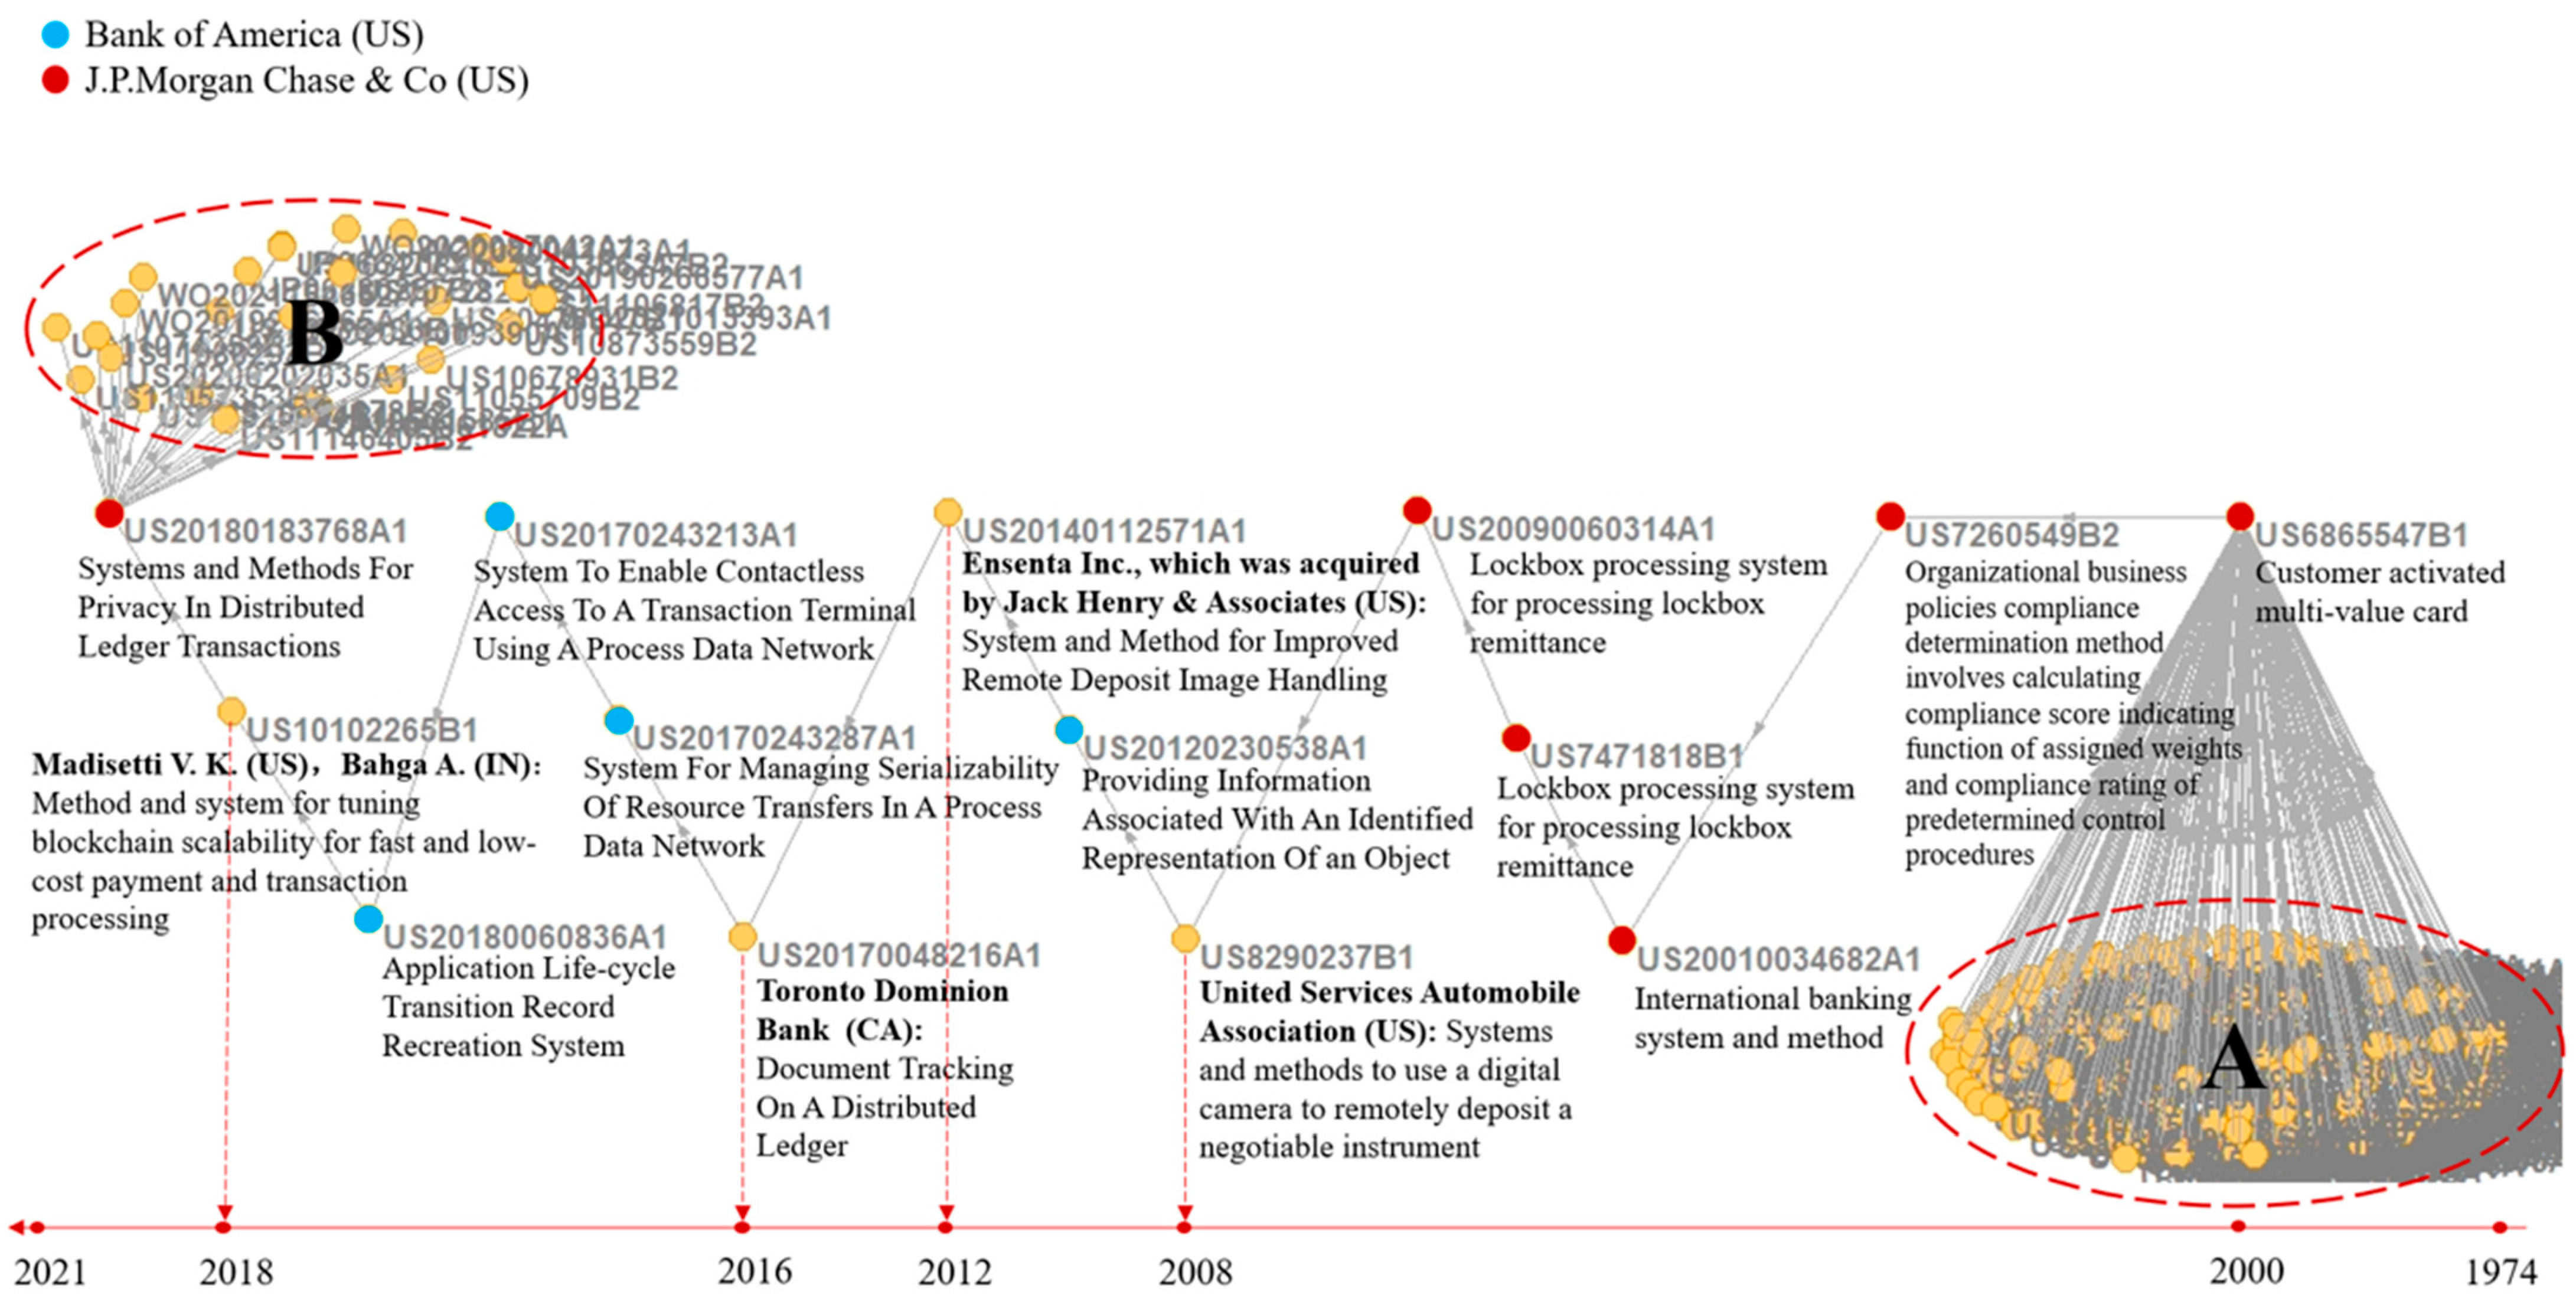
To conduct an in-depth analysis of banking technology development, we perform a main path analysis of the obtained patent citation network. The basic patent content, applicants, and timeline of the main paths in China’s banking patent citation network are shown in Figure 15, with the global one depicted in Figure 16. The global main path consists of 250 patents and spans 16 steps, while the Chinese main path includes 28 patents and spans 9 steps. When combined with other patent branches, the total number of patents is 55.
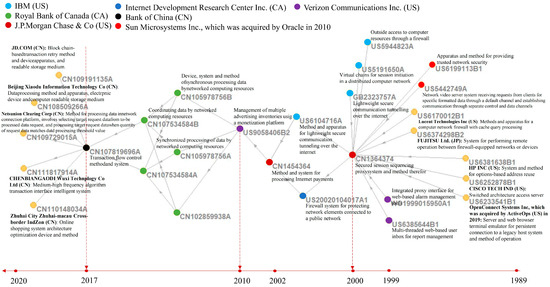
Figure 15.
Main path of the Chinese patent citation network: Applicants, patent content, and timeline. Each dot in the figure represents a patent document, with yellow as the default color. Distinct colors other than yellow are used to represent different companies. The correspondence between each color and the company name is shown at the top of the figure. For example, green indicates patents filed by the Royal Bank of Canada.
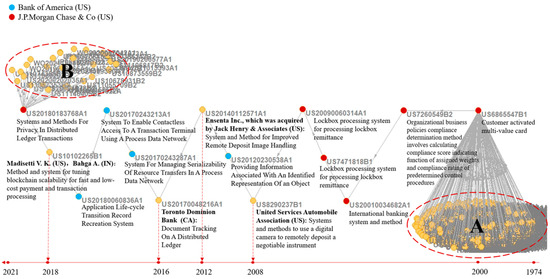
Figure 16.
Main path of the global patent citation network: applicants, patent content, and timeline.
4.3.1. Main Path of China’s Banking Patent Citation Network
Before 2017, along China’s main path, the applicants were banks and communication and electronic technology firms from the US and Canada, including IBM, Verizon Communications, JPMorgan Chase Bank, HP, and Cisco. After 2017, Chinese firms gradually emerged, including internet companies represented by Baidu and JD, state-owned enterprises and institutions represented by the Nets Union Clearing Corporation, and private technology firms in Wuxi and firms based in new trade parks.
Regarding content, these patents focus on four areas: blockchain-based transaction retry and payment security, advanced data processing and coordination across networked systems, intelligent trading and shopping system optimization, and internet-based secure communication and firewall technologies. Collectively, they enhance the transaction reliability, system efficiency, and cybersecurity of digital and financial platforms.
4.3.2. Main Path of the Global Banking Patent Citation Network
Then, we explored the global main path in Figure 16. These patents center around five key themes: privacy protection and scalability in distributed ledger (blockchain) transactions, secure and contactless transaction systems, advanced image processing and remote deposit technologies, secure communication and identity verification protocols, and risk assessment and financial system optimization. Together, they aim to improve the privacy, efficiency, and trust in financial ecosystems.
In Figure 16, the two groups of patents outlined with red dashed circles and labeled as A and B represent the most recent and the earliest patent families in the main path, respectively. Except for groups A and B, the applicants are mostly Bank of America and JPMorgan Chase Bank. In terms of patent content, 2012 is a watershed year. Before 2012, stored-value cards, image processing, and banking systems were the focus of the studied patents. After 2012, blockchain and distributed ledger technology (DLT) became the core patent technology. Especially after 2016, all patents in group B are related to blockchain and DLT.
The assignees and technical classifications of group A and B from Figure 16 are further broken down in Table 11 and Table 12. The group A applicants are mostly large financial and manufacturing firms, while the group B applicants are large internet firms, technology firms, and data analysis firms in the financial sector. Some small startups may be involved at first, but they typically are acquired by tech giants later. Regarding the country distribution, US companies account for 56.3%, while Alibaba is the only Chinese firm, accounting for 12.5% of the patents.
Table 11.
Statistics of the top 10 applicants of patent group A (early 21st century patents) in the global main path.
Table 12.
Statistics of all applicants of patent group B (latest patent) in the global main path.
Therefore, from the perspective of empiricism, if China’s banking industry can keep in line with the patent applications of global internet firms, technology firms, electronic communication firms, or acquired startups, then it is more likely to obtain important technology development information.
5. Conclusions
This paper focuses on the technological dynamics of the world’s largest banking system using network modeling to analyze the technological development of the Chinese banking industry from 2000 to 2021.
The contributions of this paper are multifaceted. First, in financial technology research, direct studies on technological innovation are scarce. Thus, this paper innovates by approaching the topic from a technological perspective and collecting industry-wide patent data, offering a novel viewpoint. As for the analytical framework used herein, the combination of main path and branch paths deepens the applicability of the MPA to analyzing specialized networks. Regarding data, this paper offers a crucial foundation for bank innovation research by utilizing 21 years of global patents. Last, in terms of methodology, it adopts a mixed quantitative and qualitative approach, using a multi-dimensional, long-span dataset to overcome the limitations of short-term technological progress estimation that relies on word frequency analysis in prior studies.
Building upon previous contributions, this paper addresses three questions and draws rich conclusions that are applicable industry, academia, and government. First, this work explores the sources of innovation in the Chinese banking industry and its connections to existing technologies. It finds that, prior to 2017, significant patent technologies in the Chinese banking sector originated from banks and communication and electronic technology companies in the US and Canada, such as IBM (US), Verizon Communications (US), JPMorgan Chase (US), HP (US), and Cisco (US). The analyzed patents cover a wide range of areas, from firewall system optimization to internet-based secure communication, and have evolved to include electronic payment technologies.
Second, this paper investigates the development path of Chinese banking technology, identifying key phases. We find that there has been a shift in the primary contributors to the research and development of China’s bank technology over the past two decades. Initially, entities and research institutions under China’s central bank and large state-owned commercial banks pioneered these efforts. In recent years, however, joint-stock banks and private banks have played an increasingly prominent role in driving innovation. Despite the prevailing Matthew effect, where larger commercial banks file more patents than smaller ones, the emergence of internet banks like WeBank and XW Bank, which are based on new business models, presents a potential challenge to industry leaders in terms of technological innovation.
As for the developmental path of banking technology in China, it includes the following stages: (1) financial infrastructure development, which includes improving banking operations, currency printing, and anticounterfeiting methods; (2) the adoption of foreign technologies such as firewalls and secure communication to build a modern electronic payment system; and (3) integrated development that involves multiple entities, including financial institutions, banks, and businesses, across various scenarios such as high-frequency trading, digital banking, and shopping systems. During the timeframe analyzed in this study, banks have interacted primarily with the field of electrical engineering and instrumentation, focusing on learning from computer technology, data processing, and digital communication.
Third, this paper identifies the cutting-edge technologies that have gained prominence in the banking industry. Since 2012, blockchain and distributed ledger technology (DLT) have gained considerable traction. Notably, all patents in the main path since 2016 are related to these two technologies. These patents cover various aspects of blockchain, including message encryption, secure data transfer, database optimization, transaction privacy management, etc.
In addition, this work reveals that, despite the multitude of patents filed by Chinese banks, there is less connectivity and weaker collaboration between technology categories compared to the global system. China’s patent citation network, although similar in size to the global network, has 48.3 times more subnetworks and 41.8% lower edge density. Additionally, Chinese patents are cited only 14.4 times on average, which represents 73.7% fewer average citations than global patents. This suggests that text-based analyses of financial reports and patents may overestimate China’s banking technology capabilities.
Moving on, future research can elaborate on this work in the following ways: First, extending the analysis to compare the technological evolution of banking sectors in other major economies, such as the U.S., the EU, and emerging markets, investigating cross-country differences in patent networks, innovation drivers, and collaboration patterns to provide a more comprehensive global perspective on banking technology development. Second, with blockchain and DLT being identified as prominent technologies in banks, future studies could assess their impact on banking operations, regulatory challenges, and potential risks. Third, as we highlight the fragmented nature of China’s banking patent network compared to the global industry, further research could explore strategies to strengthen collaboration among banks, fintech companies, and research institutions. This would help to improve innovation efficiency and build an interconnected technology ecosystem.
Author Contributions
C.Z. was responsible for conceptualization, methodology, data curation, formal analysis, writing the original draft, and validation. X.L. was responsible for funding acquisition, formal analysis, methodology, project administration, as well as reviewing and editing the draft. All authors have read and agreed to the published version of the manuscript.
Funding
The study is funded by the National Natural Science Foundation of China (grant numbers 72334006 and 71974180).
Data Availability Statement
The datasets presented in this article are not readily available because of copyright limitations. Requests to access the datasets should be directed to https://www.cnipa.gov.cn/, accessed on 11 October 2021, and https://derwentinnovation.clarivate.com.cn/login/, accessed on 11 October 2021.
Conflicts of Interest
The authors declare no conflicts of interest.
Note
| 1 | Applicants from the same banking group were consolidated and categorized by organization type. |
References
- Cai, G.; Chen, X.; Xiao, Z. The roles of bank and trade credits: Theoretical analysis and empirical evidence. Prod. Oper. Manag. 2014, 23, 583–598. [Google Scholar] [CrossRef]
- Beccalli, E. Does IT investment improve bank performance? Evidence from Europe. J. Bank. Financ. 2007, 31, 2205–2230. [Google Scholar] [CrossRef]
- Su, Q.; Meng, N.N. The Practical Operation of County Inclusive Financial Development: Taking Lankao County in Henan Province as an Example. Reform 2018, 1, 149–159. [Google Scholar]
- Hua, J.; Shi, M.; Wang, Y. Technology Finance, Industrial Structure Optimization and Regional Ecological Efficiency: Empirical Analysis Based on Spatial Econometric Model. J. Technol. Econ. 2021, 40, 16–26. [Google Scholar]
- Chen, Y.L. Industrial Revolution, Financial Revolution, and Systemic Risk Governance. J. Financ. Res. 2021, 1, 1–12. [Google Scholar]
- Bank for International Settlements Monetary and Economic Department. The monetary and regulatory implications of changes in the banking industry. In BIS Working Paper; BIS: Basel, Switzerland, 1999; p. 7. [Google Scholar]
- European Commission. Communication from the Commission to The European Parliament, The Council, The European Economic and Social Committee and The Committee of The Regions on a Digital Finance Strategy for the EU; European Commission: Brussels, Belgium, 2020. [Google Scholar]
- Humphrey, D.; Willesson, M.; Bergendahl, G.; Lindblom, T. Benefits from a changing payment technology in European banking. J. Bank. Financ. 2006, 30, 1631–1652. [Google Scholar] [CrossRef]
- Gikandi, J.W.; Bloor, C. Adoption and effectiveness of electronic banking in Kenya. Electron. Commer. Res. Appl. 2010, 9, 277–282. [Google Scholar] [CrossRef]
- Shen, Y.; Guo, P. Internet Finance, Technology Spillover and Commercial Banks TFP. J. Financ. Res. 2015, 3, 160–175. [Google Scholar]
- Guo, F.; Wang, J.; Wang, F.; Kong, T.; Zhang, X.; Cheng, Z. Measuring China’s Digital Financial Inclusion: Index Compilation and Spatial Characteristics. China Econ. Q. 2020, 19, 1401–1418. [Google Scholar]
- Banna, H.; Hassan, M.K.; Rashid, M. Fintech-based financial inclusion and bank risk-taking: Evidence from OIC countries. J. Int. Financ. Mark. Inst. Money 2021, 75, 101447. [Google Scholar] [CrossRef]
- Cheng, M.; Qu, Y. Does Bank FinTech Reduce Credit Risk? Evidence from China. Pac.-Basin Financ. J. 2020, 63, 101398. [Google Scholar] [CrossRef]
- Chen, Z.; Li, Y.; Wu, Y.; Luo, J. The transition from traditional banking to mobile internet finance: An organizational innovation perspective—A comparative study of Citibank and ICBC. Financ. Innov. 2017, 3, 16. [Google Scholar] [CrossRef]
- Bai, P.; Yu, L. Digital Economy Development and Firms’ Markup: Theoretical Mechanisms and Empirical Facts. China Ind. Econ. 2021, 11, 59–77. [Google Scholar]
- Xie, X.; Wang, S. Digital Transformation of Commercial Banks in China: Measurement, Progress and Impact. China Econ. Q. 2022, 22, 1937–1956. [Google Scholar] [CrossRef]
- Lee, I.; Shin, Y. Fintech: Ecosystem, business models, investment decisions, and challenges. Bus. Horiz. 2018, 61, 35–46. [Google Scholar] [CrossRef]
- Macartney, H.; Wood, J.; Dubrova, K. Collaboration, Adaptation, or Disruption? Wall Street, Fintech and Corporate Bond Trading. New Polit. Econ. 2022, 27, 257–276. [Google Scholar] [CrossRef]
- Hodson, D. The politics of FinTech: Technology, regulation, and disruption in UK and German retail banking. Public Admin. 2021, 99, 859–872. [Google Scholar] [CrossRef]
- Boot, A.; Hoffmann, P.; Laeven, L.; Ratnovski, L. Fintech: What’s old, what’s new? J. Financ. Stab. 2021, 53, 100865. [Google Scholar] [CrossRef]
- Ayadi, R.; Naceur, S.B.; Casu, B.; Quinn, B. Does Basel Compliance Matter for Bank Performance? J. Financ. Stab. 2016, 23, 15–32. [Google Scholar] [CrossRef]
- Takeda, A.; Ito, Y. A review of FinTech research. Int. J. Technol. Manag. 2021, 86, 67–88. [Google Scholar] [CrossRef]
- Berger, A.N. The economic effects of technological progress: Evidence from the banking industry. J. Money Credit. Bank. 2023, 35, 141–176. [Google Scholar] [CrossRef]
- Arner, D.W.; Barberis, J.; Buckley, R.P. The evolution of Fintech: A new post-crisis paradigm. Geo. J. Int’l L. 2015, 47, 1271. [Google Scholar] [CrossRef]
- Fuster, A.; Plosser, M.; Schnabl, P.; Vickery, J. The role of technology in mortgage lending. Rev. Financ. Stud. 2019, 32, 1854–1899. [Google Scholar] [CrossRef]
- Guo, Y.; Liang, C. Blockchain application and outlook in the banking industry. Financ. Innov. 2016, 2, 24. [Google Scholar] [CrossRef]
- Jaffe, A.B.; Trajtenberg, M. Patents, Citations, and Innovations: A Window on the Knowledge Economy; MIT Press: Cambridge, MA, USA, 2002. [Google Scholar]
- Choi, J.; Hwang, Y.S. Patent keyword network analysis for improving technology development efficiency. Technol. Forecast. Soc. Change 2014, 83, 170–182. [Google Scholar] [CrossRef]
- Doreian, P. Network autocorrelation models: Problems and prospects. In Spatial Statistics: Past, Present, Future; Institute of Mathematical Geography: Berlin, Germany, 1989; pp. 369–389. [Google Scholar]
- Verspagen, B. Mapping technological trajectories as patent citation networks: A study on the history of fuel cell research. Adv. Complex Syst. 2007, 10, 93–115. [Google Scholar] [CrossRef]
- Lucio-Arias, D.; Leydesdorff, L. Main-path analysis and path-dependent transitions in HistCite (TM)-based historiograms. J. Am. Soc. Inf. Sci. Technol. 2008, 59, 1948–1962. [Google Scholar] [CrossRef]
- Zhang, X.; Fang, S. Research Review on the Main Path Analysis of Patent Citation Networks. Libr. Inf. Serv. 2016, 60, 140–148. [Google Scholar]
- Jiang, X.; Zhuge, H. Forward search path count as an alternative indirect citation impact indicator. J. Informetr. 2019, 13, 100977. [Google Scholar] [CrossRef]
- Kontolaimou, A.; Kounetas, K.; Mourtos, I.; Tsekouras, K. Technology Gaps in European Banking: Put the Blame on Inputs or Outputs? Econ. Model. 2012, 29, 1798–1808. [Google Scholar] [CrossRef]
- Diebold, F.X.; Yilmaz, K. On the network topology of variance decompositions: Measuring the connectedness of financial firms. J. Econom. 2014, 182, 119–134. [Google Scholar] [CrossRef]
- Hummon, N.P.; Dereian, P. Connectivity in a citation network: The development of DNA theory. Soc. Netw. 1989, 11, 39–63. [Google Scholar] [CrossRef]
- Song, Y.; Ji, Q.; Du, Y.; Geng, J. The dynamic dependence of fossil energy, investor sentiment and renewable energy stock markets. Energy Econ. 2019, 84, 15. [Google Scholar] [CrossRef]
- Billio, M.; Getmansky, M.; Lo, A.W.; Pelizzon, L. Econometric measures of connectedness and systemic risk in the finance and insurance sectors. J. Financ. Econ. 2012, 104, 535–559. [Google Scholar] [CrossRef]
- Bekiros, S.; Nguyen, D.K.; Junior, L.S.; Uddin, G.S. Information diffusion, cluster formation and entropy-based network dynamics in equity and commodity markets. Eur. J. Oper. Res. 2017, 256, 945–961. [Google Scholar] [CrossRef]
- Mariani, M.S.; Medo, M.; Lafond, F. Early identification of important patents: Design and validation of citation network metrics. Technol. Forecast. Soc. Change 2019, 146, 644–654. [Google Scholar] [CrossRef]
- Mrvar, A.; Batagelj, V. Analysis and visualization of large networks with program package Pajek. Complex Adapt. Syst. Model. 2016, 4, 8. [Google Scholar] [CrossRef]
- Liu, J.; Lu, L. An integrated approach for main path analysis: Development of the Hirsch index as an example. J. Am. Soc. Inf. Sci. Technol. 2012, 63, 528–542. [Google Scholar] [CrossRef]
- Gao, W.; Hatcher, W.G.; Yu, W. A survey of blockchain: Techniques, applications, and challenges. In Proceedings of the 2018 27th International Conference on Computer Communication and Networks (ICCCN), Hangzhou, China, 30 July–2 August 2018; pp. 1–11. [Google Scholar]
- Ding, K.; Qu, Z.; Zhang, C. The petrometric analysis of Chinese and American banks’ patents and study on technology innovation strategy under the comparative perspective. Sci. Res. Manag. 2014, 35, 138–146. [Google Scholar]
- Xin, Y. New China’s 70-Year Banking System Construction: Ideology Evolution and Theory Innovation. J. Financ. Econ. 2019, 45, 73–85. [Google Scholar]
- Wang, G. The 70 Years of China Banking Industry: Brief History, Main Features and Historical Experience. J. Manag. World 2019, 35, 15–25. [Google Scholar]
- Schwab, K. The Fourth Industrial Revolution; World Economic Forum: Geneva, Switzerland, 2016. [Google Scholar]
- European Patent Office. Patents and the Fourth Industrial Revolution: The Inventions Behind Digital Transformation; EPO: Munich, Germany, 2017. [Google Scholar]
- International Monetary Fund. Fintech: The Experience So Far; IMF Policy Papers; International Monetary Fund: Washington, DC, USA, 2019. [Google Scholar]
- Yang, M.; Wu, S. Technological Innovation and Banking Industry Development: Evolution Course and Future Prospects. New Financ. 2020, 12, 33–37. [Google Scholar]
- Jiao, T.; Zhang, J. The operation, impact, and inspiration of the first batch of virtual banks in Hong Kong, China. Int. Financ. 2021, 1, 76–80. [Google Scholar]
- Schmoch, U. Concept of a Technology Classification for Country Comparisons: Final Report to the World Intellectual Property Organisation (WIPO); Fraunhofer Institute for Systems and Innovation Research: Karlsruhe, Germany, 2008. [Google Scholar]
- Fontana, R.; Nuvolari, A.; Verspagen, B. Mapping technological trajectories as patent citation networks: An application to data communication standards. Econ. Innov. New Tech. 2009, 18, 311–336. [Google Scholar] [CrossRef]
- Martinelli, A. An emerging paradigm or just another trajectory? Understanding the nature of technological changes using engineering heuristics in the telecommunications switching industry. Res. Policy. 2012, 41, 414–429. [Google Scholar] [CrossRef]
- Yang, Z.; Liu, J. Research on identification of technological evolution path based on patent citation network: Taking solar photovoltaic panels technology as an example. Studies Sci. Sci. 2011, 29, 1311–1317. [Google Scholar]


Disclaimer/Publisher’s Note: The statements, opinions and data contained in all publications are solely those of the individual author(s) and contributor(s) and not of MDPI and/or the editor(s). MDPI and/or the editor(s) disclaim responsibility for any injury to people or property resulting from any ideas, methods, instructions or products referred to in the content. |
© 2025 by the authors. Licensee MDPI, Basel, Switzerland. This article is an open access article distributed under the terms and conditions of the Creative Commons Attribution (CC BY) license (https://creativecommons.org/licenses/by/4.0/).