Article

Big-Data-Assisted Urban Governance: A Machine-Learning-Based Data Record Standard Scoring Method

Department of Computer Science & Technology, Nanjing University of Posts and Telecommunications, Nanjing 210049, China
*
Author to whom correspondence should be addressed.
Systems 2025, 13(5), 320; https://doi.org/10.3390/systems13050320
Submission received: 26 February 2025 / Revised: 10 April 2025 / Accepted: 24 April 2025 / Published: 26 April 2025
(This article belongs to the Topic Data Science and Intelligent Management)

Abstract

:
With the increasing adoption of digital governance and big data analytics, the quality of government hotline data significantly affects urban governance and public service efficiency. However, existing methods for assessing data record standards focus predominantly on structured data, exhibiting notable inadequacies in handling the complexities inherent in unstructured or semi-structured textual hotline records. To address these shortcomings, this study develops a comprehensive scoring method tailored for evaluating multi-dimensional data record standards in government hotline data. By integrating advanced deep learning models, we systematically analyze six evaluation indicators: classification predictability, dispatch accuracy, record correctness, address accuracy, adjacent sentence similarity, and full-text similarity. Empirical analysis reveals a significant positive correlation between improved data record standards and higher work order completion rates, particularly highlighting the crucial role of semantic-related indicators (classification predictability and adjacent sentence similarity). Furthermore, the results indicate that the work order field strengthens the positive impact of data standards on completion rates, whereas variations in departmental data-handling capabilities weaken this relationship. This study addresses existing inadequacies by proposing a novel scoring method emphasizing semantic measures and provides practical recommendations—including standardized language usage, intelligent analytic support, and targeted staff training—to effectively enhance urban governance.

1. Introduction

With the rapid advancement of information technology, enhancing national modern governance capabilities has become a top priority. Establishing robust communication channels between the government and the public is fundamental to achieving this goal [1]. Government hotlines, through both telephone and internet channels, serve as crucial platforms for collecting public complaints, suggestions, and feedback on public affairs. These hotlines help address public concerns in a timely manner, improve administrative transparency, and enhance the quality of public services [2].
In China, the State Council’s guidelines on optimizing public service mechanisms explicitly call for strengthening public feedback systems and improving the responsiveness and accuracy of government services through data-driven means [3]. Furthermore, government hotline data have been officially recognized as a core part of digital government construction, with the National Development and Reform Commission and the Ministry of Industry and Information Technology issuing documents that emphasize the importance of high-quality data management in public service systems [4].
A recent survey shows that 63% of cities have established clear development goals for their government hotline departments, aiming to create unified and accessible service platforms. However, these strategies primarily emphasize departmental growth while lacking targeted plans for data governance. This gap underscores the pressing need to enhance the quality of hotline data to ensure accurate issue handling and improve the effectiveness of public service delivery [5]. More broadly, the quality of government data plays a pivotal role in enabling effective social governance through big data. Without sufficient quality, even large volumes of data become difficult to utilize or analyze, providing limited value for policy-making and public administration. Therefore, evaluating and improving data quality remains a core challenge for governments and a critical factor in the success of digital governance systems [6].
In recent years, scholars have conducted extensive research on government hotlines. Wang et al. [7] proposed a classification model to optimize the routing of hotline issues to relevant departments. Li et al. [8] developed a multi-view deep learning framework to improve dispatch accuracy, while Zhang et al. [9] used text features to predict dispatch results. Other studies have explored multi-label classification methods [10], topic analysis of public concerns [11], and citizen satisfaction during crisis periods such as the COVID-19 pandemic [12].
However, current research predominantly focuses on improving the accuracy of issue classification and dispatch, with limited attention to the quality assessment of hotline records themselves. As Zhang et al. [9] pointed out, the effectiveness of classification and dispatch is heavily dependent on the completeness, consistency, and clarity of the original data input. Karkošková [13] emphasized that data quality assessments are foundational for ensuring reliability in policy analysis and service design, particularly in complex and multi-sectoral governance systems.
Commercial call centers often employ standardized tools such as Service-Level Agreements (SLAs) and Customer Satisfaction Indices (CSIs) to evaluate service effectiveness [14,15]. However, these frameworks focus on response speed or satisfaction metrics and are not well suited to evaluating the semantic and structural quality of records in the public sector. Government hotline data involve sensitive, multi-departmental issues that must meet regulatory, compliance, and ethical standards [16].
Moreover, as shown in Figure 1, the typical government hotline workflow—from call reception and information entry to issue dispatch and resolution—demands strict adherence to data recording protocols. Any deviation from these standards can disrupt task assignment and reduce system effectiveness. Ensuring standardization and consistency in data entry is not only essential for accurate issue handling but also for maintaining public trust in government responsiveness.
Government hotline data are characterized by their unstructured nature, containing rich semantic information that complicates traditional data governance methods. Unlike structured public data, such as census data [17], hotline records are composed of text that includes complaints, suggestions, and feedback, often involving multiple domains like public administration, legal issues, and social governance [18]. This makes the data complex and challenging to process, as they contain informal, ambiguous, and emotionally charged language, which cannot be easily quantified using standard techniques. Given the complexity and richness of the data, traditional quantitative methods are insufficient for capturing the nuances inherent in these textual records. To address this, a more advanced, text-based quantification method is necessary—one that not only processes the data but also captures their underlying semantic meaning. This approach stands in contrast to simpler forms of public data governance, where data are typically more structured and easier to quantify. The necessity for a specialized method to quantify and evaluate the quality of government hotline data—particularly using a semantic-based approach—forms the core contribution of this study.
The objective of this study is to develop and implement a standardized scoring system for evaluating the quality of government hotline data, addressing the shortcomings in current research, where data quality assessment has been largely overlooked. Low-quality data records can lead to biased decision-making and negatively impact service quality [19]. Specifically, this study focuses on the methodology for automating the evaluation of hotline data quality using a customized scoring system. This system is designed to assess the completeness, consistency, and accuracy of hotline records, ensuring that they adhere to established standards. By implementing this system, this paper aims to enhance the effectiveness of government decision-making, improve public service delivery, and strengthen public trust in government responsiveness.

2. Literature Review

2.1. Current Research Status

Existing methods for the assessment of data quality typically focus on several key dimensions, including completeness, consistency, accuracy, timeliness, and reliability of data [20,21]. These dimensions are foundational in evaluating data quality across various fields, but there is a need for a more systematic approach to categorizing and assessing data quality frameworks. Schmidt et al. [22] proposed a data quality assessment framework specifically for the health research field. This framework emphasizes completeness, consistency, and accuracy as the core dimensions for ensuring the reliability and validity of medical data. It adopts a multi-level, multi-dimensional analysis that enables thorough evaluation across different layers of data.
In the industrial domain, Song et al. [23] introduced the Industrial Multivariate Time Series Data Quality Assessment (IMTSDQA) method, which builds upon traditional data quality evaluations by introducing fine-grained sub-dimensions within key categories such as completeness, normativeness, and accuracy. This fine-grained approach allows for a more detailed, objective, and comprehensive assessment of data quality, extending its applicability to complex industrial datasets.
Meanwhile, Vetro et al. [24] focused on open government data and identified key dimensions such as completeness, traceability, timeliness, and accuracy. They argue that open data must go beyond meeting technical standards to include considerations for usability and transparency. These elements are essential for enhancing public trust and engagement, and they provide a useful framework for assessing data quality in the context of public governance.
While there has been substantial research on data quality assessment frameworks across various domains such as transportation [25], healthcare [26], and construction [27], there remains a notable gap in the standardized scoring of government hotline data records. These data records represent a critical communication channel between the government and the public, and the quality of these data plays a pivotal role in the effectiveness of government services.
Government hotline data have specific characteristics and challenges that set them apart from other data types. For instance, they often contain large volumes of unstructured textual data, making their quality assessment particularly complex. Given these challenges, this study proposes a comprehensive data record standard evaluation system for government hotline data, focusing on dimensions such as reliability, correctness, and consistency. This system seeks to address the unique features of government hotline data and ensure that these records comply with standards, thereby enhancing government service efficiency and improving public satisfaction.
The process of evaluating government hotline data compliance involves several key steps, including topic identification, entity recognition, and text classification. Topic identification is crucial for extracting meaningful thematic information from large volumes of text. Traditional methods such as part-of-speech tagging (POS) and TF-IDF have been employed to identify topics within text [28]. However, models like Latent Dirichlet Allocation (LDA), though useful for long texts, often struggle with short texts due to limited context awareness [29,30]. To address these limitations, more recent approaches, such as the Adaptive Online Biterm Topic Model (AOBTM) [31], and the application of pre-trained models like BERT for topic classification [32], have shown promise in improving topic identification accuracy, especially in dynamic environments. The BERTopic model further refines BERT’s capabilities for domain-specific topic recognition [33].
Entity recognition, another essential component of this evaluation system, involves identifying and categorizing named entities within text. Early methods were based on rule-based and dictionary-based approaches [34,35,36,37,38], but more recent advancements have leveraged machine learning [39,40] and deep learning models [41] such as LSTM and BERT to enhance the accuracy of entity recognition, especially in large and complex datasets.
Finally, text classification is a critical step in categorizing government hotline data into predefined categories. Common classification techniques include k-nearest neighbors, naive Bayes, support vector machines (SVMs), and, more recently, graph neural networks [42,43,44]. These methods contribute to the structured analysis of unstructured textual data, enabling more efficient processing and interpretation.
Quantitative methods for data quality assessment are essential for ensuring the reliability and validity of datasets across various domains. These methods use defined metrics to measure specific dimensions of data quality, enabling organizations to assess and enhance their data’s fitness for use. Typically, quantitative assessments focus on several key dimensions, such as accuracy, completeness, consistency, timeliness, and uniqueness, each evaluated using specific metrics [45].
Accuracy involves comparing data to a known standard or ground truth. It ensures that data reflect the real-world phenomena they are supposed to represent. Completeness measures the proportion of available versus missing data entries, indicating whether data are sufficiently detailed and comprehensive. Consistency ensures uniformity and the absence of contradictions within or across datasets, ensuring that data align with established rules or standards. Timeliness evaluates whether data are current and available when needed, which is crucial for time-sensitive applications such as decision-making in government services. Uniqueness identifies and eliminates duplicate records, which is especially important in maintaining clean and reliable datasets.
The diversity of proposed dimensions—more than 50 distinct dimensions in total—demonstrates the complexity and multifaceted nature of data quality assessment [45]. For example, Lewis et al. [46] systematically reviewed the factors affecting electronic health record data and proposed five core dimensions—completeness, correctness, consistency, reasonableness, and timeliness—as a foundational framework for structured and semi-structured data.
Building upon this, Song et al. [47] introduced a fine-grained data quality assessment framework, emphasizing sub-dimensions such as completeness, normativeness, consistency, uniqueness, and accuracy, offering more granular diagnostic capabilities for data quality analysis. However, these frameworks are often generalized, and they may not fully capture the unique challenges of textual and semi-structured data in government hotline work orders, which often contain free-text entries, inconsistent formats, and variable reporting standards.
Various frameworks have been developed to systematically assess data quality. Hierarchical data quality frameworks, for example, organize dimensions from general to specific, facilitating comprehensive evaluations. These are particularly suited for complex scenarios such as big data environments [48]. Systematic literature reviews (SLRs) have summarized practices and challenges in data quality assessment, highlighting the need for standardized methodologies and the integration of quality management into data processes [49]. Domain-specific frameworks, such as those used in public health, emphasize sector-specific data quality needs [50]. Despite the progress, challenges remain, particularly in managing the vast volume, velocity, and variety inherent in big data, the lack of universally accepted standards for data quality dimensions, and the critical need for high-quality data in machine learning applications [51].
However, while the literature has provided useful frameworks, government hotline data evaluation has mostly involved theoretical framework-based analyses, often lacking empirical studies to validate these models. These studies primarily focus on macro-level indicators like accuracy, completeness, consistency, and timeliness, but they seldom incorporate detailed or semantic indicators derived from text content. This is where our study innovates by focusing specifically on Chinese government hotline data, employing advanced methods such as BERT for precise text processing and text classification prediction, which significantly enhances the classification accuracy.
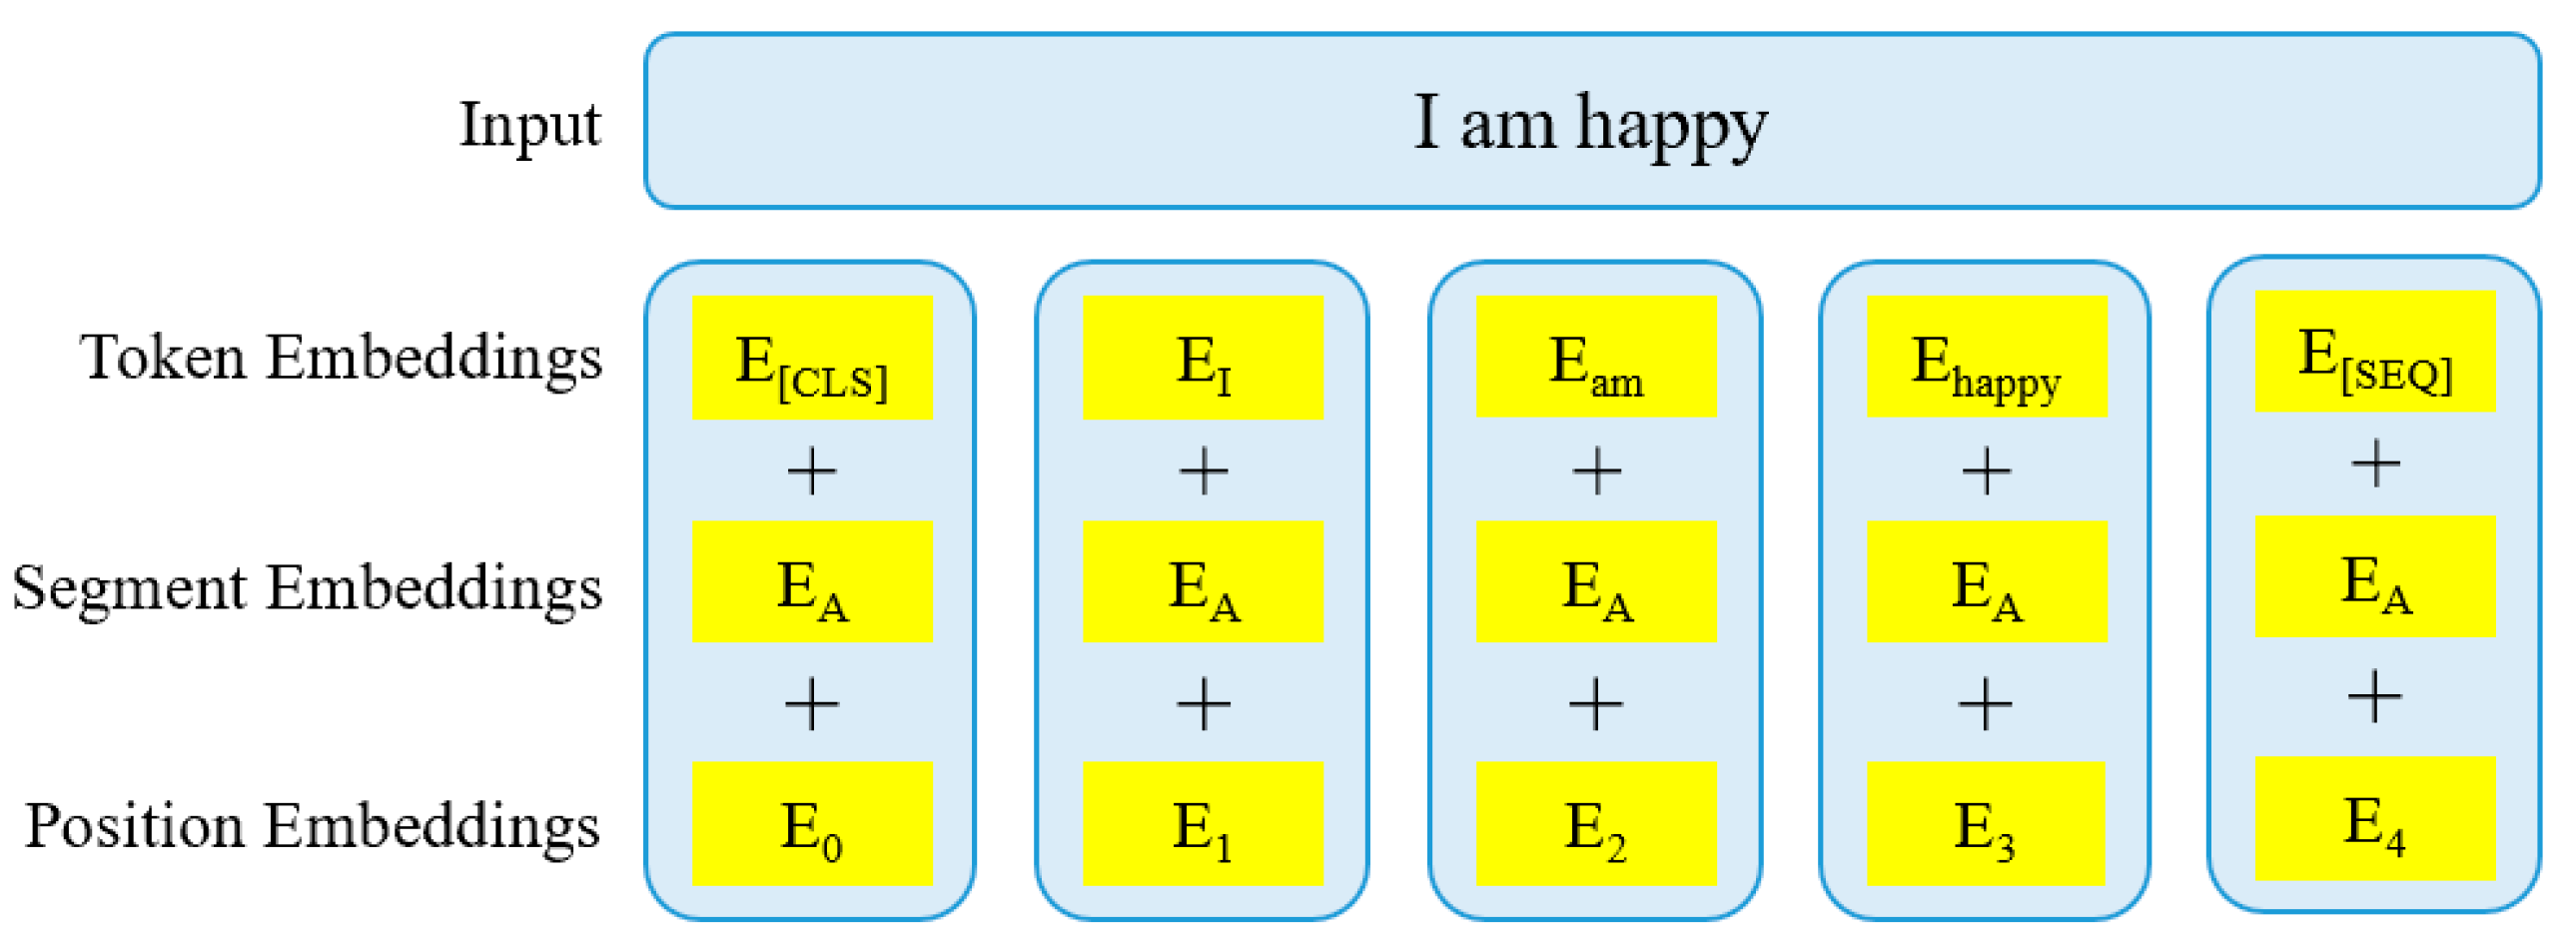
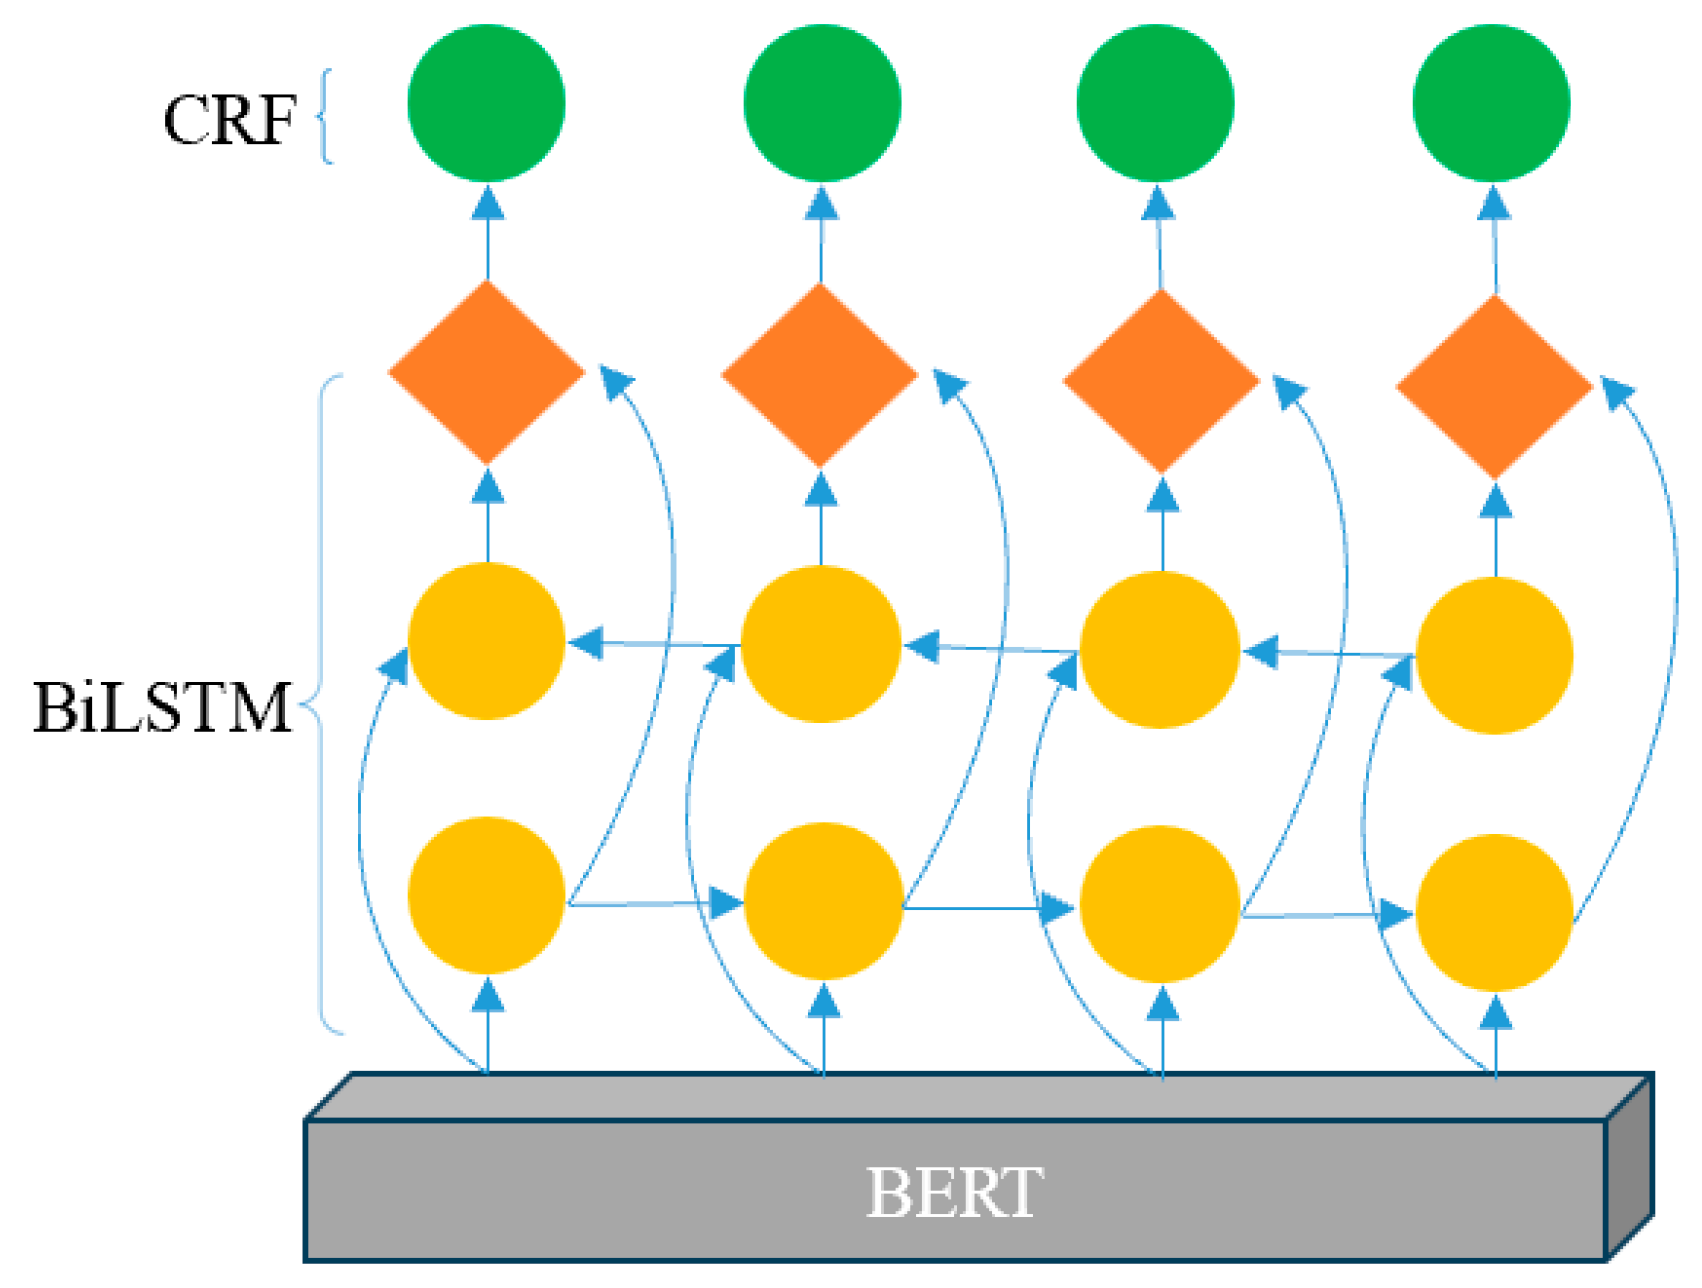
BERT (Bidirectional Encoder Representations from Transformers) has emerged as a leading method for natural language processing (NLP) tasks, particularly for handling unstructured text data. Its key advantage lies in its ability to capture the contextual relationships in text, allowing it to understand the nuances of language, which is crucial for processing government hotline work orders containing complex and varied textual data. Traditional NLP methods, such as rule-based or shallow machine learning models, often fail to grasp the deeper context or subtle patterns in the language, making BERT a more appropriate choice for this task.
The hybrid model BERT-BiLSTM-CRF integrates the strengths of BERT’s contextualized embeddings with the BiLSTM (Bidirectional Long Short-Term Memory) network’s ability to model sequential dependencies and CRF’s (Conditional Random Field) capacity to enforce structured prediction constraints. This combination is particularly effective for named entity recognition (NER), which is essential for extracting critical semantic information such as addresses, names, dates, and contact details from government hotline work orders.
The advantages of BERT-BiLSTM-CRF over traditional methods are as follows:
Contextual Understanding: BERT’s pre-trained models enable deeper contextual understanding compared to traditional models like TF-IDF or Word2Vec, which treat words independently and fail to capture the context. For government hotline data, which often contain short, context-dependent phrases, BERT’s ability to understand words in relation to their surrounding context ensures a higher level of precision and recall in extracting meaning from text.
Improved Classification Accuracy: Traditional methods like SVM (support vector machine) or naive Bayes focus on vectorizing text and using shallow models for classification. However, BERT integrates language understanding directly into the model, improving the classification performance significantly. In our study, incorporating BERT’s language understanding improves the precision and recall for categorizing hotline data, leading to more accurate assessments of data compliance with predefined standards.
Enhanced Entity Recognition: Entity recognition is a critical task in government hotline work order texts, which often contain unstructured, free-text entries. Models like CRF or BiLSTM have been used for entity extraction but often struggle with semantic nuances in large datasets. By combining BiLSTM for sequential learning with CRF for structured prediction, our model is able to recognize locations, names, addresses, and other key entities with significantly higher accuracy compared to conventional methods, such as rule-based approaches or standalone machine learning techniques.
Adaptability and Fine-tuning: BERT offers a unique advantage in its adaptability. It can be fine-tuned for specific domains, such as government hotline data, using transfer learning. This approach allows for better performance on domain-specific tasks compared to traditional models, which would require extensive retraining for each new task or dataset. Our study demonstrates this advantage by fine-tuning BERT specifically on Chinese government hotline data, optimizing its performance for the task at hand.
While BERT has demonstrated clear advantages in this study, it is important to acknowledge the limitations of alternative methods. Traditional NLP methods like TF-IDF and naive Bayes focus on bag-of-words representations and often fail to capture the contextual meaning of words in short or ambiguous texts. SVM and Logistic Regression may perform well on structured datasets but struggle with unstructured text data like those found in government hotline work orders, which often contain inconsistent formats and varied vocabulary. Moreover, LSTM-based models, though capable of capturing sequential dependencies, do not have the sophisticated understanding of language that BERT provides, making them less effective in tasks involving complex textual content.
In contrast, BERT, by leveraging its transformer architecture, has revolutionized the processing of unstructured text by considering the entire context of a sentence rather than just individual words. This makes BERT particularly well suited for understanding the context-specific terminology and phrasing in government hotline work orders. The incorporation of BiLSTM-CRF further enhances the model by ensuring that the recognized entities maintain the correct sequential order, which is critical in the structured data extraction tasks required for evaluating government hotline data compliance.

2.2. Research Hypothesis

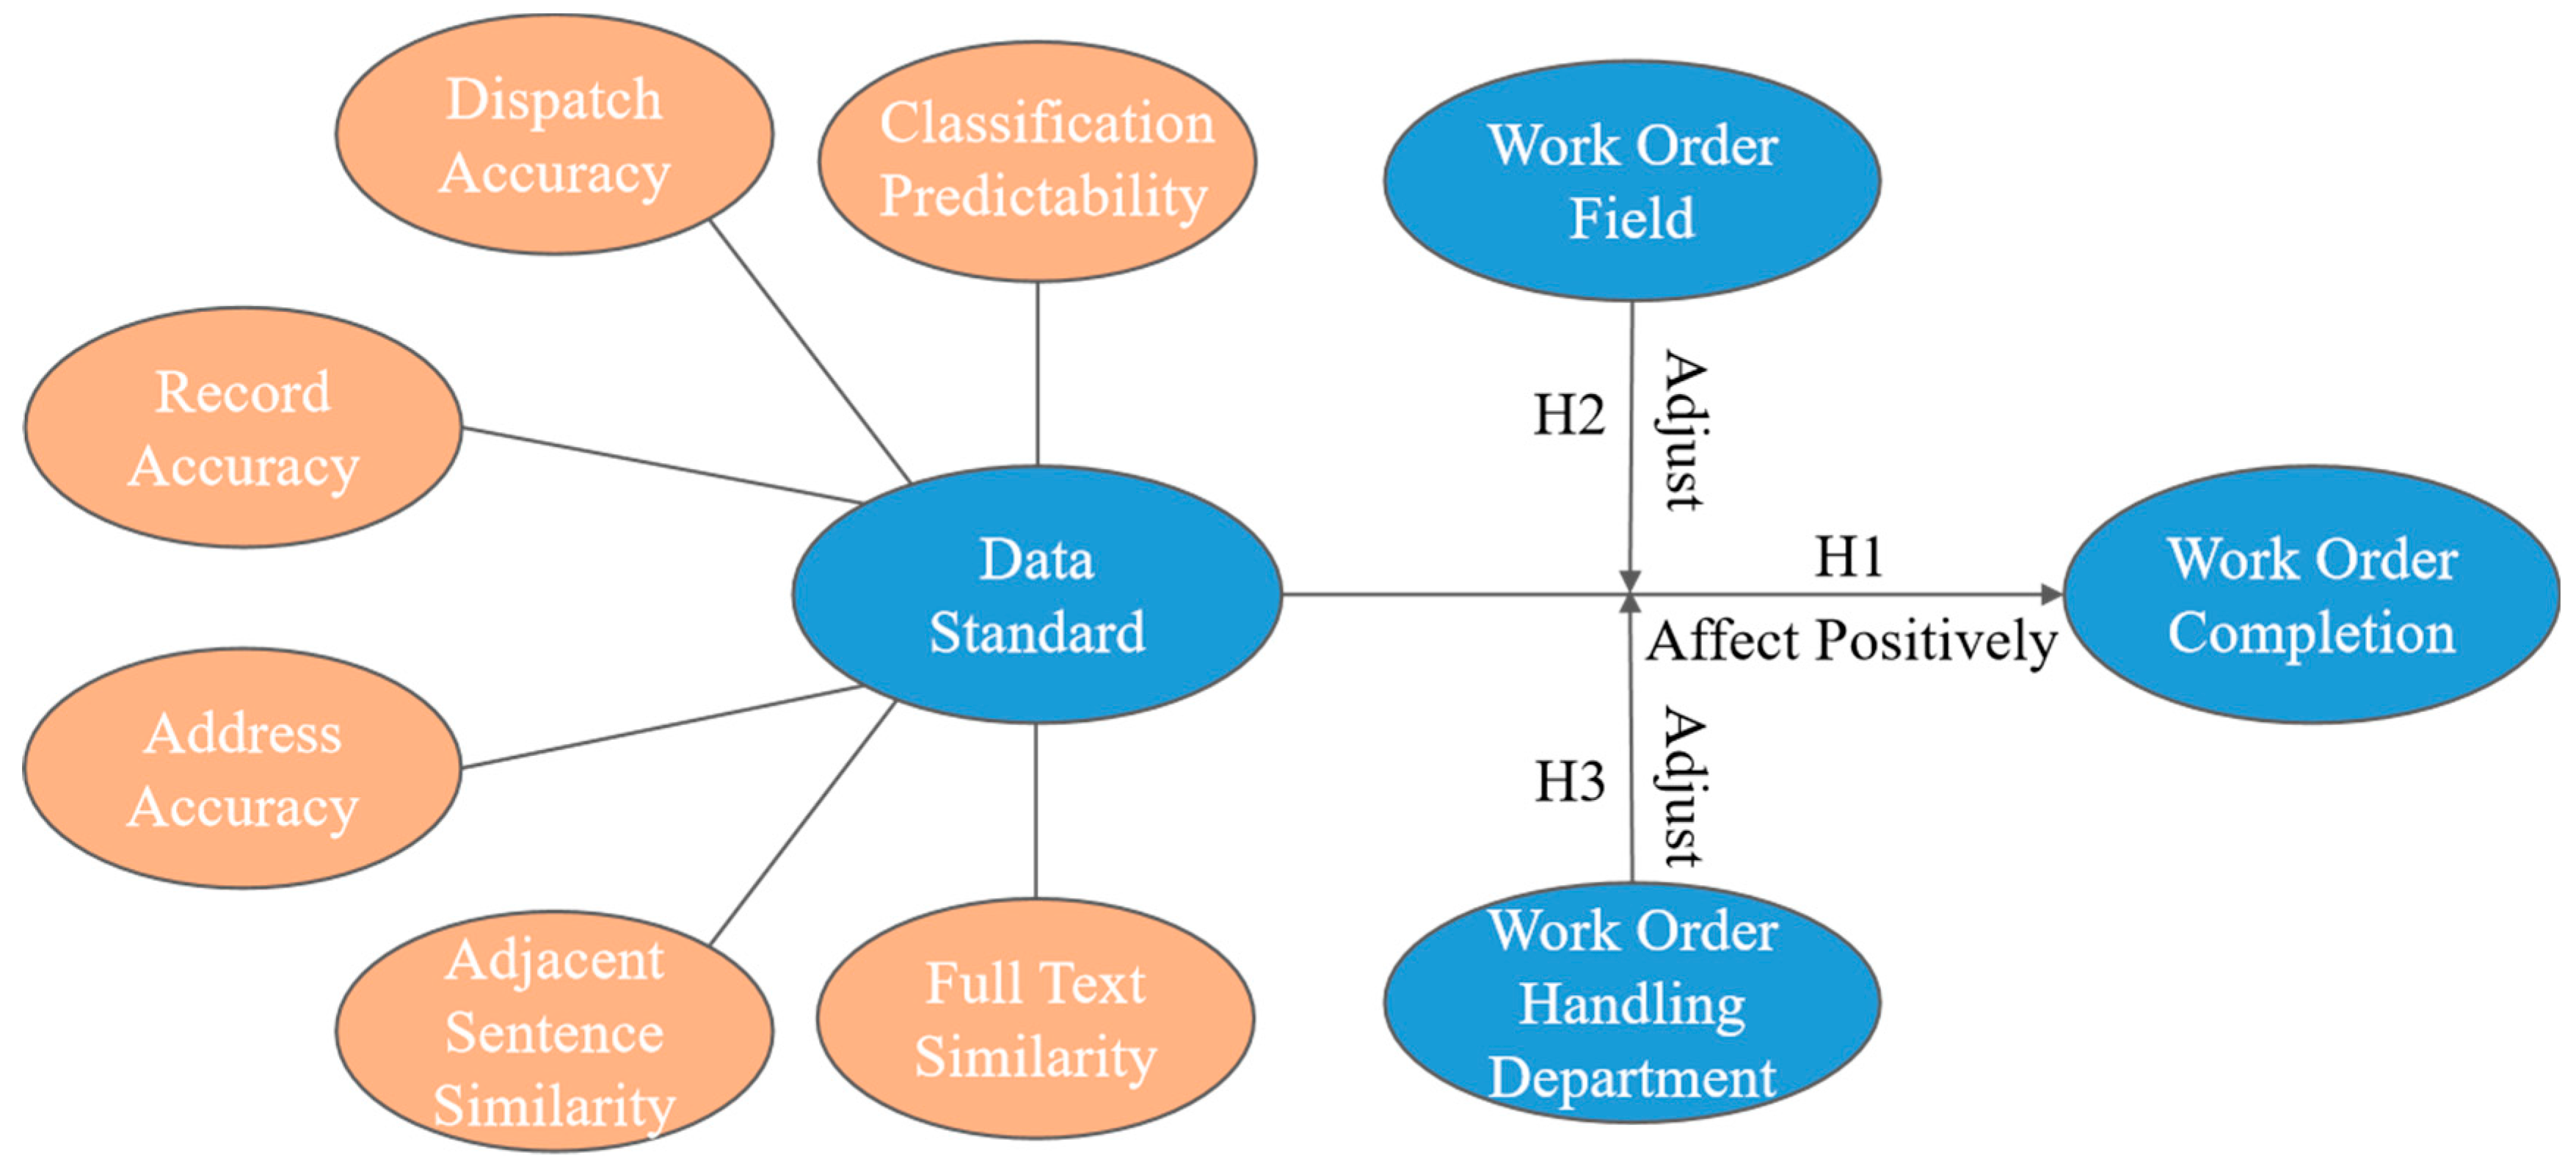
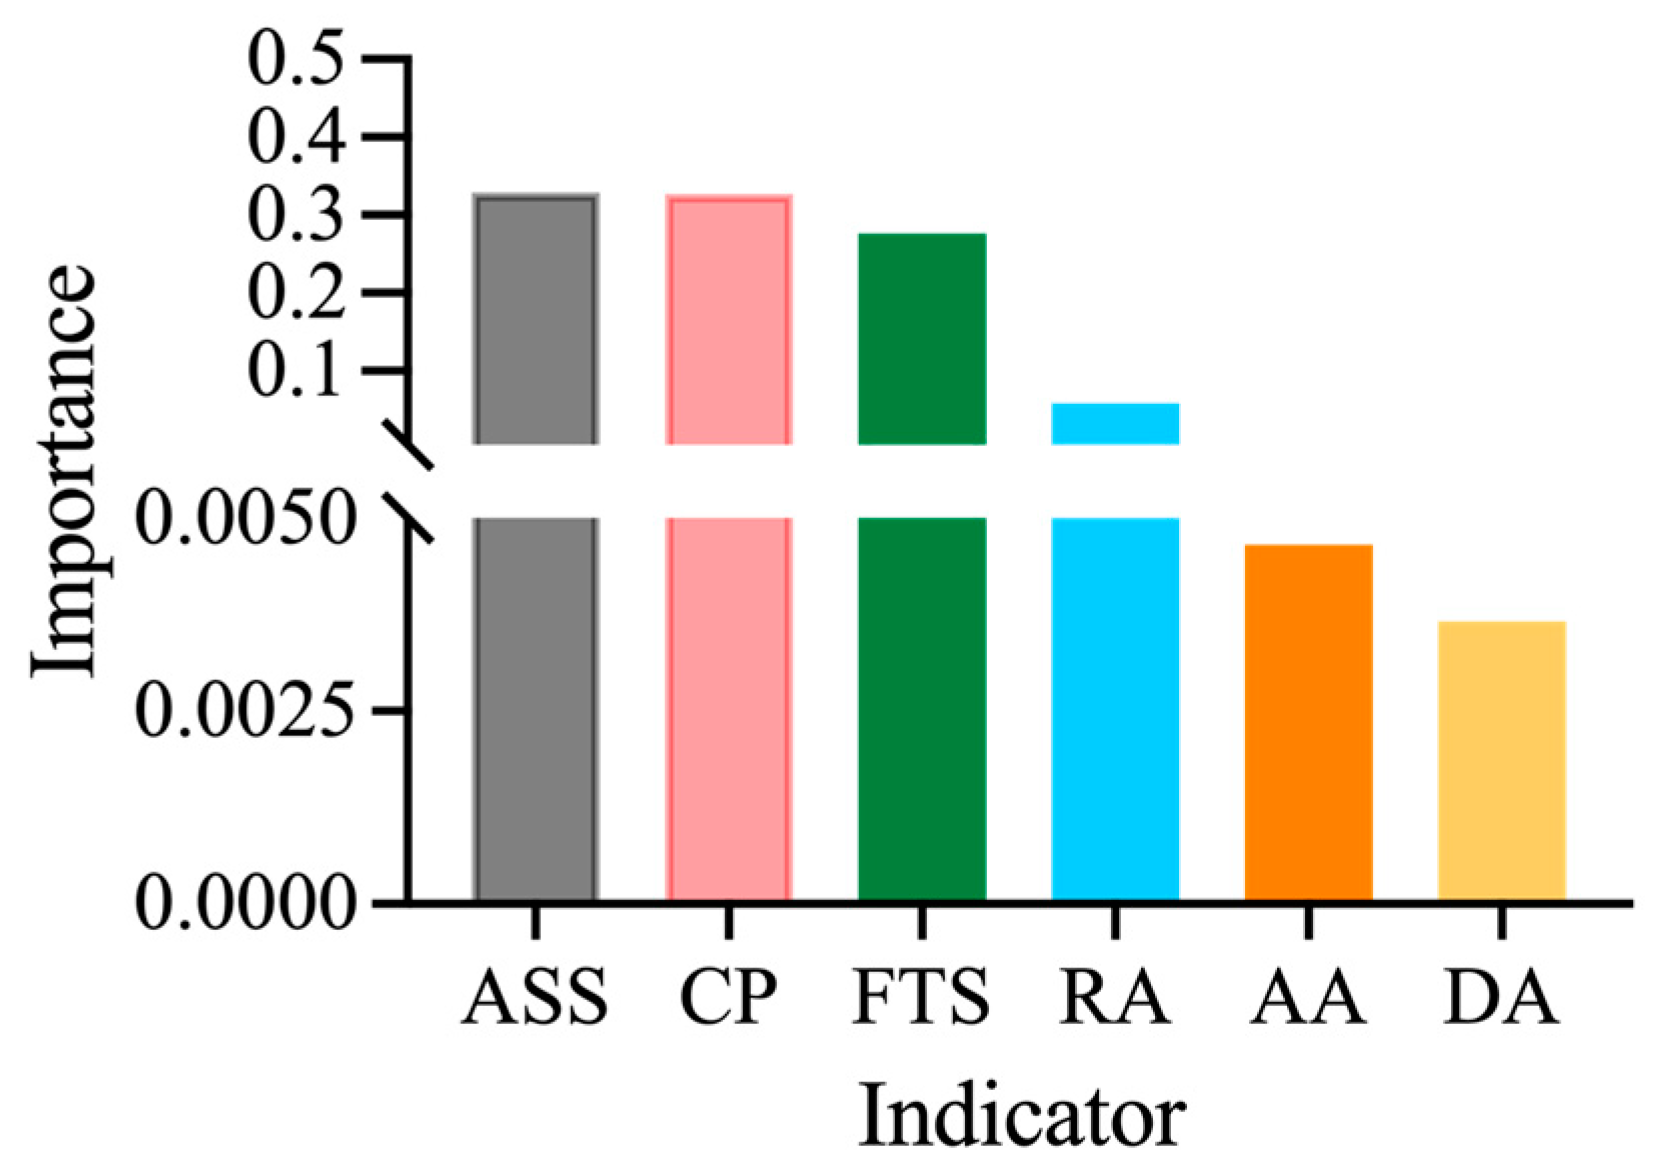
This study proposes a tailored data record standard evaluation system specifically designed for government hotline data. Drawing from the authoritative literature and the distinct characteristics of government work order systems, we define three core evaluation dimensions—reliability, correctness, and consistency—each supported by sub-indicators with robust theoretical and empirical foundations.
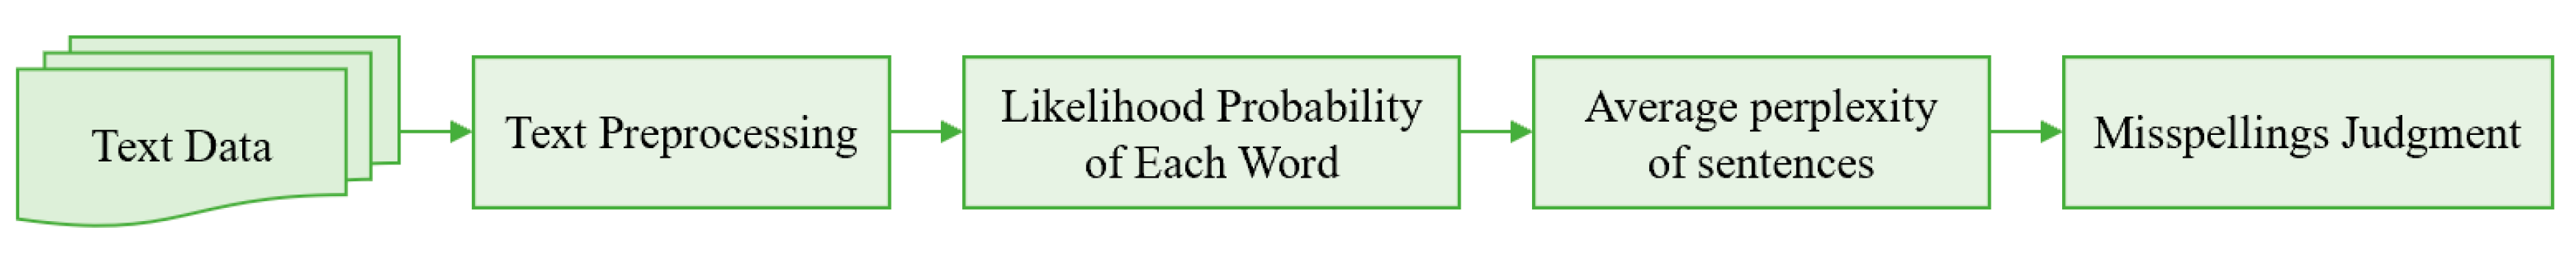
Reliability assesses whether the data effectively support accurate decision-making and task routing. According to Batini et al. [52], data reliability is essential for ensuring that information can be effectively utilized for intended business operations. Similarly, Pipino et al. [45] emphasize that reliable data should consistently meet user expectations for decision-making tasks, which validates our inclusion of classification predictability (the clarity and accuracy of assigning problem categories) and dispatch accuracy (the precise routing of problems to appropriate departments) as key sub-indicators.
Correctness pertains to factual accuracy and compliance with data standards. Wang and Strong [53] highlight accuracy as a fundamental dimension reflecting the degree to which data correctly represent real-world conditions. Hamdy et al. [54] empirically confirm that record accuracy is directly correlated with overall data usability and quality, reinforcing our choice of record accuracy as a key sub-indicator. Additionally, Tian et al. [55] demonstrated that address accuracy directly impacts downstream logistics operations, further validating our inclusion of address accuracy as critical for government service delivery.
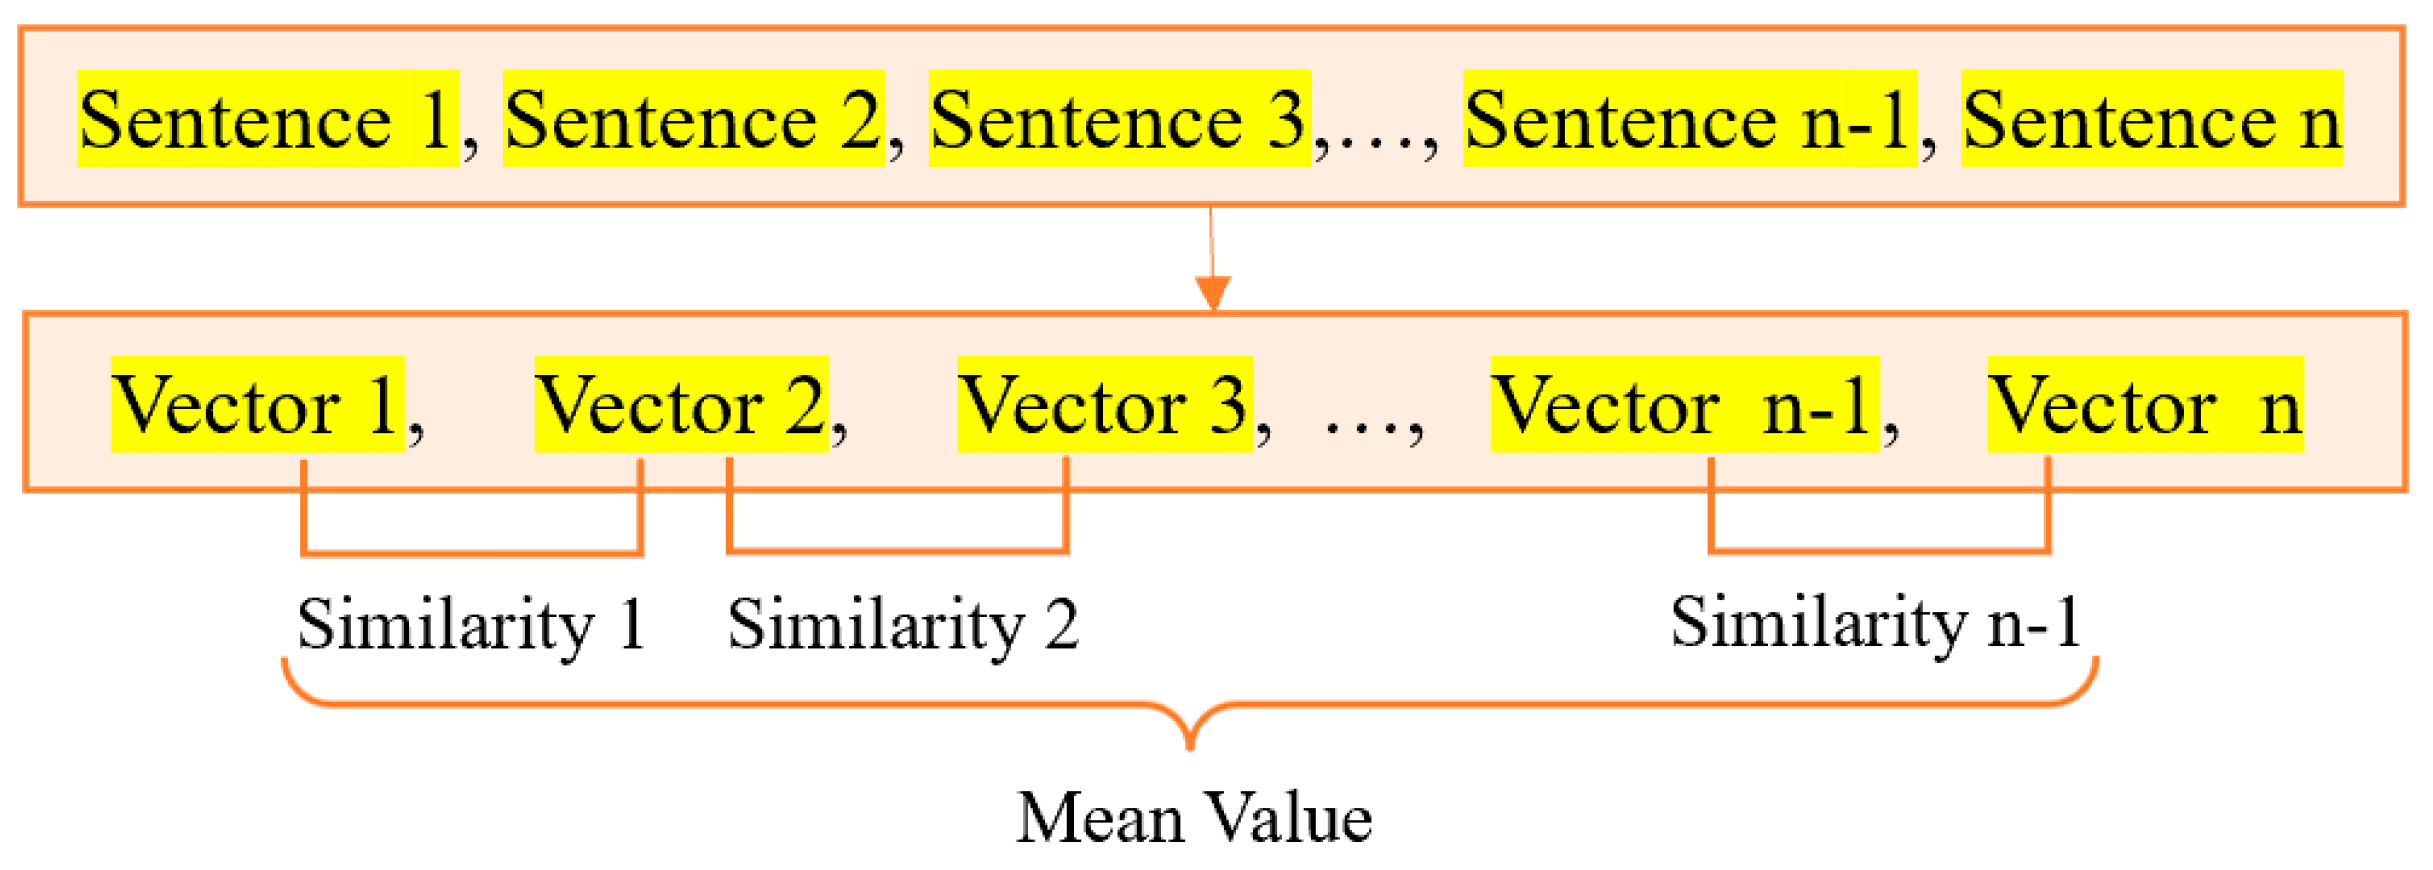
Consistency ensures internal coherence and logical integrity within textual records. Redman [56] established consistency as a critical dimension of data quality, referring to the uniformity and coherence of data within and across records. Building upon Gharehchopogh and Khalifelu’s [57] work on evaluating topic relevance in textual data, we include adjacent sentence similarity and full-text similarity as indicators of logical consistency and minimal redundancy within hotline work orders, improving semantic integrity and operational efficiency.
Compared to previous studies primarily focused on structured data or general metrics, our framework uniquely addresses the challenges posed by unstructured or semi-structured textual records, thus providing a nuanced and operationally relevant evaluation system for government hotline data.
Numerous studies affirm the critical role of rigorous data quality standards in improving governmental performance. Li and Shang [58] showed that robust data standards significantly enhance administrative efficiency, while Cheng and Liu [59] demonstrated that improved data governance substantially enhances policy effectiveness. Consequently, we propose the following hypotheses:
H1: 
Data record standards positively affect work order completion.
Furthermore, the impact of data quality standards may vary across different work order fields. Studies indicate that sectors with structured workflows, like transportation and healthcare, typically exhibit greater sensitivity to enhanced data accuracy and standardization [60,61]. Hence, we hypothesize the following:
H2: 
The work order field moderates the relationship between data record standards and work order completion.
Similarly, organizational capabilities also influence how effectively data standards are utilized. Strong organizational competencies in data management significantly enhance data quality implementation and operational outcomes [62]. Departments with better training and clearer processes are more effective in utilizing standardized data, while those with limited capacities may struggle to realize these benefits. Thus, we propose the following:
H3: 
The work order handling department moderates the relationship between data record standards and work order completion.
These hypotheses form the basis of our proposed framework, as illustrated in 
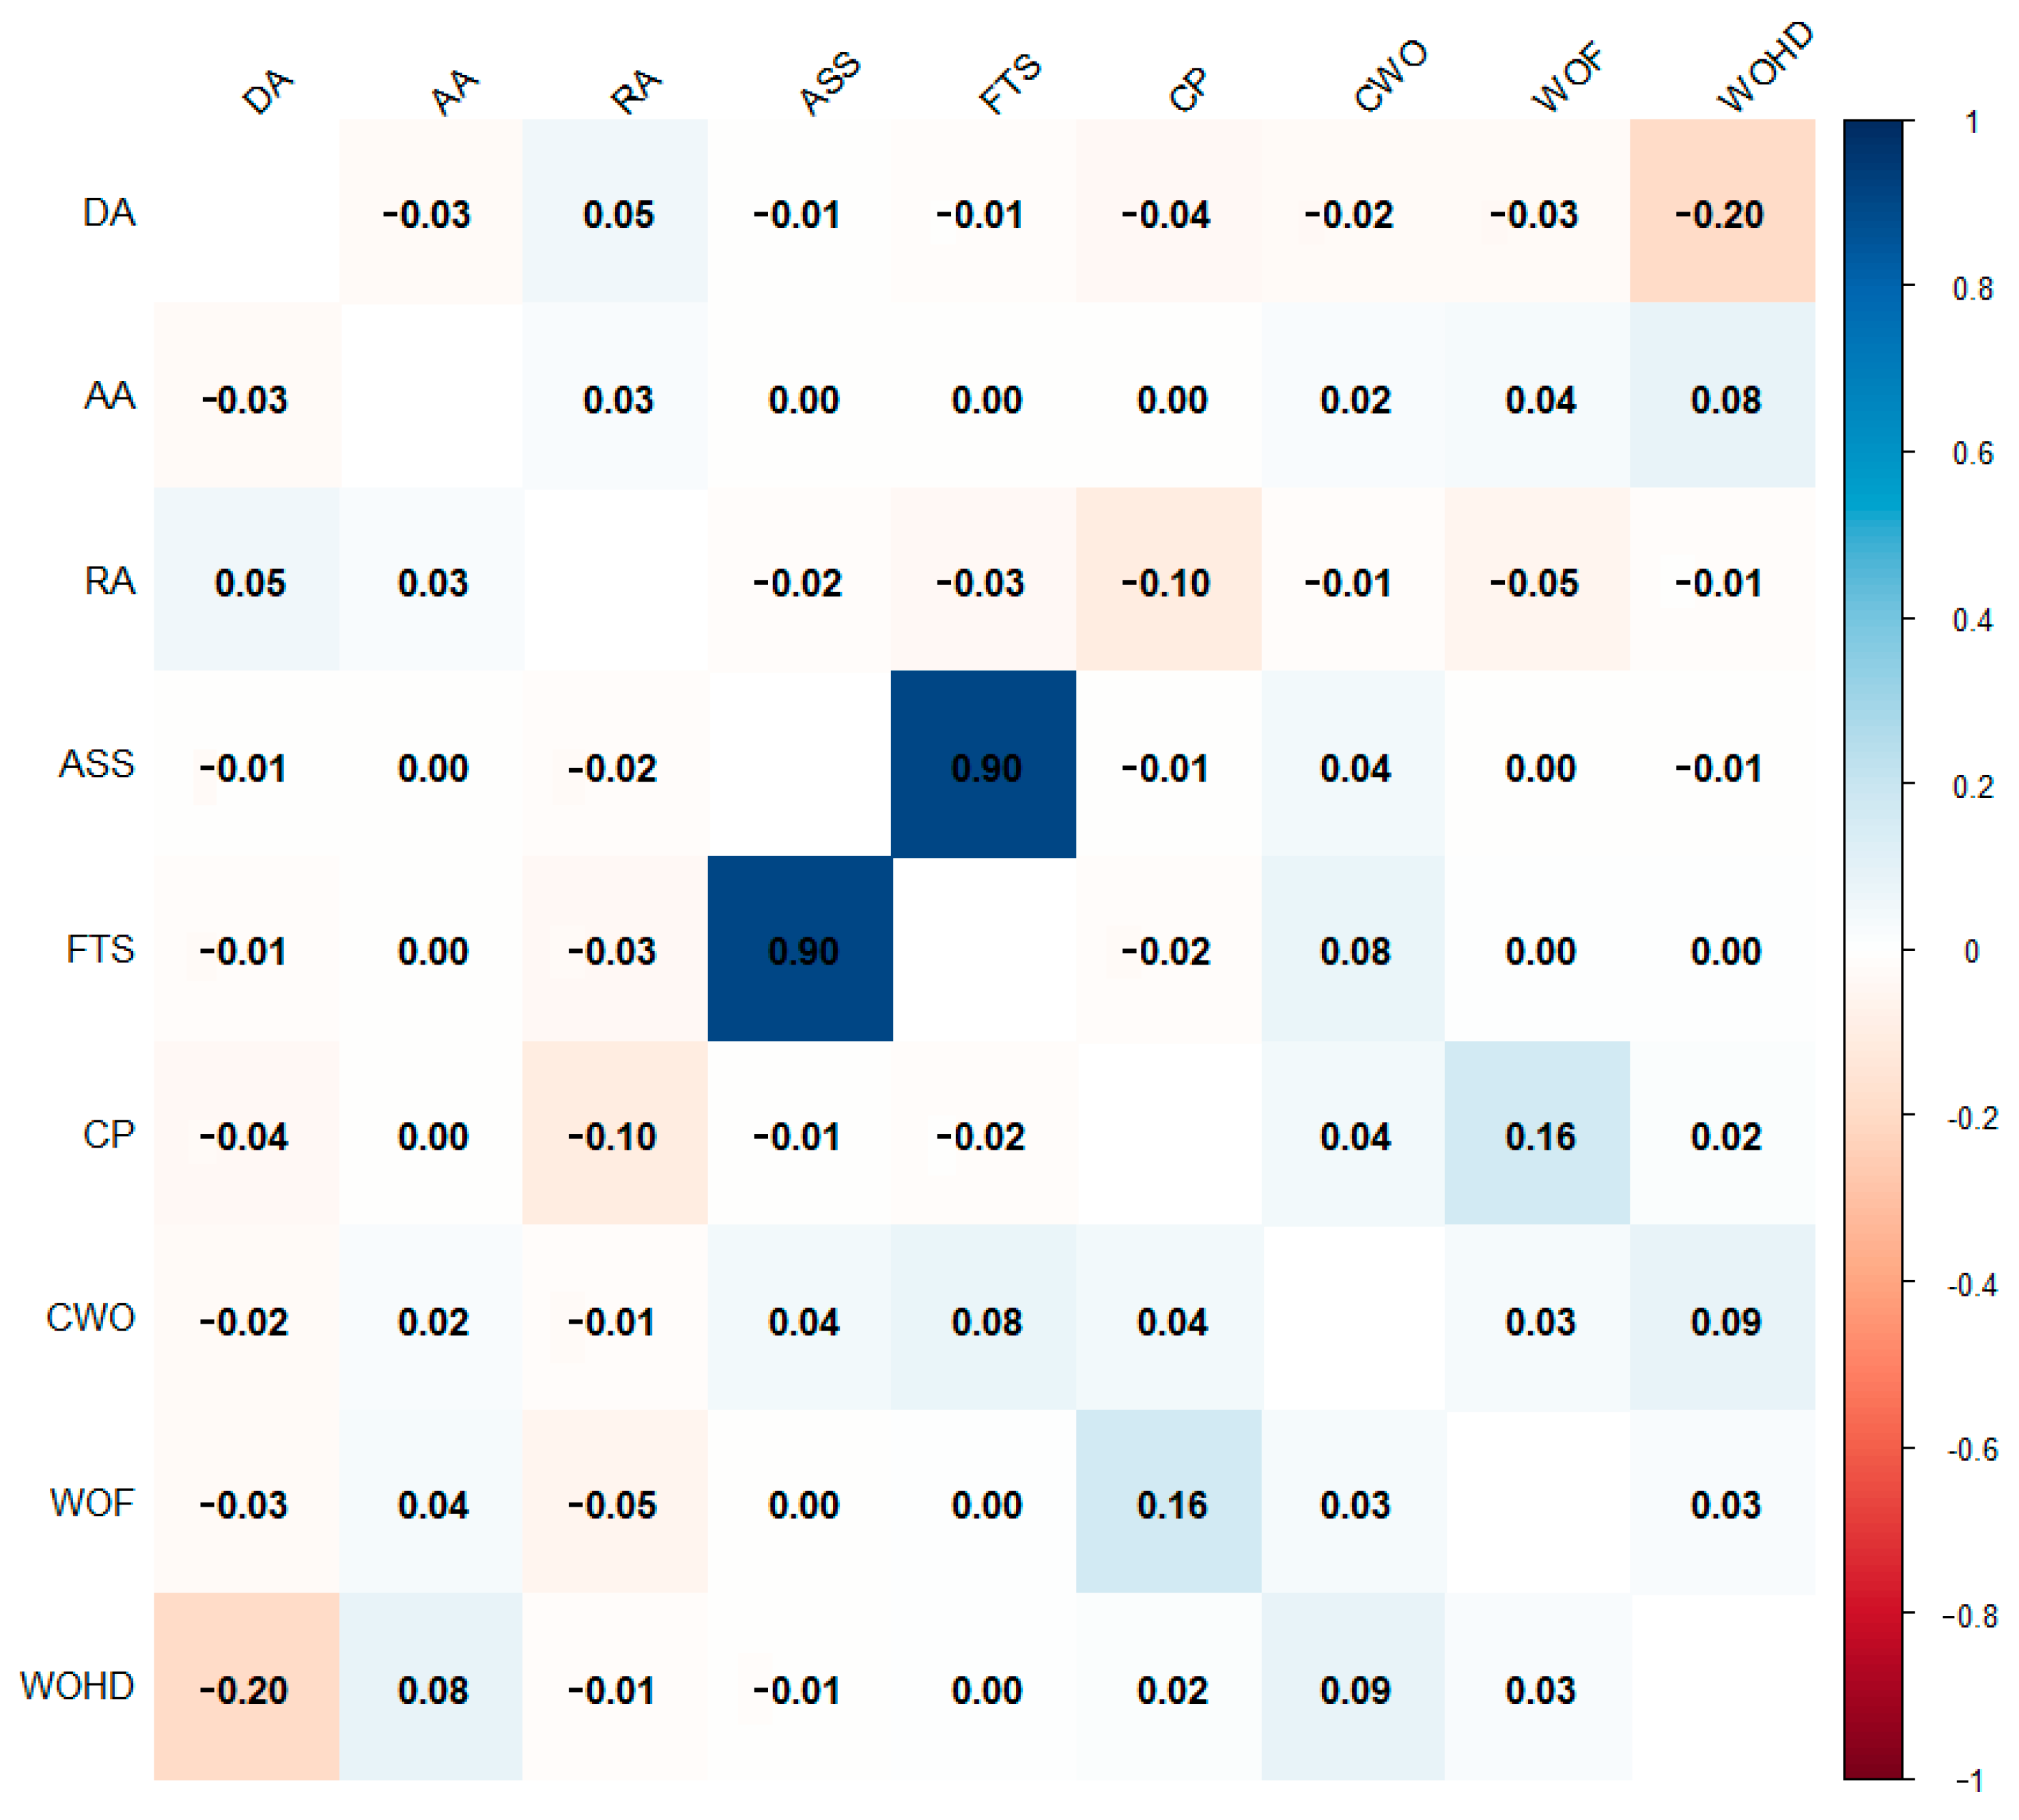
Figure 2. This figure illustrates the evaluation framework for government hotline data record standards. In particular, six secondary indicators—including dispatch accuracy, classification predictability, record accuracy, address accuracy, adjacent sentence similarity, and full-text similarity—are employed to assess data standards. The evaluation results are further linked to key work order attributes, such as the work order field and handling department, in order to analyze their influence on work order completion.

3. Research Design

3.1. Data Collection

The data for this study were sourced from a government hotline system, spanning from January 2019 to July 2021. After data cleaning and de-duplication, a total of 266,850 records were obtained.

3.2. Research Methods

To systematically analyze the government hotline data record standards, this study employed a series of computational methods and techniques. Specifically, six evaluation indicators were established to comprehensively assess the data quality in different dimensions, including classification predictability, dispatch accuracy, record correctness, address accuracy, adjacent sentence similarity, and full-text similarity. The data sources, calculation logic, and potential sources of error for each indicator were carefully considered in the analysis. Among these indicators, dispatch accuracy and address accuracy are defined as binary variables, serving as deterministic indicators with clear evaluation criteria. In contrast, classification predictability is measured using the output probability of a deep learning classification model, which helps to reduce uncertainty and provides a probabilistic recommendation of correctness. For the text similarity dimensions, including adjacent sentence similarity and full-text similarity, this study utilized a BERT-based semantic similarity model, which offers relatively high accuracy in capturing semantic relationships [63]. Furthermore, to mitigate potential deviations in the similarity calculations, both the average similarity and maximum similarity scores were adopted as evaluation metrics. The overall analytical framework, along with the implementation steps of the proposed approach, is illustrated in Figure 3.

3.2.1. Data Pre-Processing

For natural language processing classification algorithms—particularly BERT-based models—the input length is constrained to 512 characters, necessitating thorough pre-processing of the hotline texts. Given that the average length of government hotline texts is approximately 112 characters, we selected 128 characters as the maximum input length for the BERT model. The detailed data pre-processing steps were as follows:
  • Duplicate and Empty Entry Removal: We identified and removed duplicate records by comparing the textual content. Empty or missing entries were also systematically detected and excluded to ensure data integrity.
  • Missing Values and Outlier Handling: Entries containing missing textual fields or irrelevant special characters (such as random symbols or clearly erroneous input) were filtered out. Outliers—texts significantly deviating from normal hotline contents—were identified using statistical measures (e.g., text length distributions) and manually reviewed before exclusion.
  • Chinese Text Segmentation and Stopword Removal: The Jieba segmentation tool was employed for effective Chinese text segmentation, converting texts into token sequences. Subsequently, standard Chinese stopword lists were applied to remove frequently occurring but semantically irrelevant terms (e.g., auxiliary verbs, pronouns, common connectors).
  • Keyword Extraction and Text Length Adjustment: For texts exceeding the 128-character limit, we utilized the TF-IDF algorithm to rank terms based on their relevance and importance. High-ranking keywords were then selected to reconstruct concise texts that complied with the 128-character constraint, ensuring critical semantic content was preserved.
  • Denoising and Data Quality Enhancement: To enhance data quality, we implemented additional denoising techniques, including removing noisy patterns such as repetitive text fragments, overly frequent boilerplate sentences, and irrelevant numerical strings. These steps significantly improved the accuracy and reliability of subsequent classification and analysis tasks.
No specialized pre-processing was required for the named entity recognition (NER) or semantic similarity calculation algorithms. Specifically, NER involves annotation of the entire original text, while semantic similarity calculations segment texts into individual sentences, each typically shorter than 128 characters.

3.2.2. Calculation Method for Classification Predictability

The secondary indicator for reliability that determines the category of work orders is classification predictability. This indicator is primarily determined based on the BERT model for classification. BERT (Bidirectional Encoder Representations from Transformers) is a pre-trained deep learning model that captures contextual information through a bidirectional transformer architecture, improving accuracy in natural language processing tasks. The principle of text classification using the BERT model is shown in Figure 4.
It should be noted that due to the significant population and service disparities across different regions and departments, the volume of government hotline data is highly imbalanced. For instance, by the end of 2022, District M of City B had a resident population of approximately 980,000, whereas District N had only 320,000. Similarly, the scope of services provided by different government departments varies significantly. The urban management department handles issues such as street cleaning, noise pollution, and illegal construction, while the education department deals with school admissions and education resource allocation. Additionally, citizens’ demands may shift based on specific events, such as the surge in hotline calls to the health department during the COVID-19 pandemic. This results in considerable data volume disparities across regions and departments, with some having very few work orders. Figure 5 illustrates the number of work orders closed by various districts and departments in City A in 2023.
Given this imbalance, a method was adopted to address the issue of misclassification due to insufficient data. For categories with fewer than 100 work orders, data augmentation was used to increase the number to 100. This augmentation was achieved using the Qwen-7B-Chat model, which was selected for the following reasons:
In August 2023, Alibaba Cloud announced the open-sourcing of two models from its Qwen series—Qwen-7B and Qwen-7B-Chat—available on both ModelScope and Hugging Face. Both models have a parameter scale of 7 billion. Qwen-7B, a decoder-only language model based on a transformer architecture, is similar to the LLaMA series. It was pre-trained on over 2.2 trillion tokens and supports a context length of up to 2048. In various benchmarks tested by Alibaba Cloud, Qwen-7B outperformed most existing models of similar size. Table 1 compares the accuracy of Qwen-7B and other pre-trained language models on the C-Eval validation set.
The Qwen-7B model outperformed other models of similar size and even surpassed larger models in several cases. Its performance on the C-Eval test set compared to other models is shown in Table 2.
As can be seen from the table, Qwen-7B outperformed similar models and even exceeded some larger models. Therefore, in this study, we utilized Qwen-7B to enhance the data by generating additional work orders for categories with fewer than 100 cases. This was achieved by constructing prompt templates and invoking Qwen-7B’s API, which reformulated the work order text using different vocabulary and structures while maintaining the original meaning. The prompt used for this process was “Use the Qwen model to rewrite this sentence with different vocabulary and structure while strictly preserving the original meaning”.
The specific calculation process for classification predictability involves tokenizing and vectorizing the text data using a fine-tuned pre-trained BERT model and then inputting the processed text into the BERT model to obtain classification results. The formula is as follows:
R c = P ( y i | x i ) = s o f t m a x ( B E R T ( x i ) )
where R c represents the classification predictability and P ( y i | x i ) denotes the predicted classification probability of the input text x i .

3.2.3. Calculation Method for Dispatch Accuracy

The secondary indicator for reliability in evaluating whether the dispatched department for a government work order is accurate is dispatch accuracy, which is calculated by comparing the department recommended by the classification model to the final handling department. The calculation process is illustrated in Figure 6.
The formula for calculating this indicator is as follows:
R d = i = 1 n 1 ( y i = y ^ i ) n
where R d represents the accuracy of dispatching, y i is the actual handling department, y ^ i is the department predicted by the model, 1 ( y i = y ^ i ) is an indicator function that is equal to 1 if y i = y ^ i and 0 otherwise, and n is the total number of work orders.

3.2.4. Calculation Method for Record Accuracy

Record accuracy is a secondary indicator under the primary indicator of correctness. This indicator measures whether the textual records in each work order are accurate and whether there are spelling or grammatical errors. Spelling error detection in work order texts is performed using the ‘pycorrector’ package in Python3.11, which uses language model perplexity (PPL) to determine the correctness of a character. The spelling error detection process is shown in Figure 7.
The record accuracy indicator is finally assessed by calculating the proportion of non-spelling errors relative to the total number of characters. The formula is as follows:
C w = 1 E W
where C w represents the accuracy of records, E denotes the number of spelling errors, and W is the total number of characters.

3.2.5. Calculation Method for Address Accuracy

Another secondary indicator under the correctness dimension is address accuracy, which is designed to evaluate the correctness and consistency of address information recorded in government hotline work orders. Specifically, this indicator measures whether the address information extracted from the textual description of a work order matches the structured address field provided in the dataset. To achieve this, a named entity recognition (NER) method was applied to automatically extract address entities from the unstructured text content of each work order. The NER process is based on a BERT-BiLSTM-CRF model, which effectively integrates three advanced techniques: (1) the BERT model is used to capture rich contextual semantic features of the input text; (2) the BiLSTM (Bidirectional Long Short-Term Memory) network is employed to learn sequential dependencies in both the forward and backward directions; and (3) the CRF (Conditional Random Field) layer is utilized to optimize the sequence labeling results and ensure the accuracy and integrity of address entity recognition. The workflow and principle of this address extraction model are illustrated in Figure 8. After extraction of the address entity, the identified address is further standardized and verified by querying the Baidu Maps API to determine its administrative region or geographic location. The obtained address information is then compared with the structured address field in the original work order dataset. If the two address sources correspond to the same administrative region or location, the address accuracy is recorded as 1 (correct); otherwise, it is recorded as 0 (incorrect). This binary evaluation criterion ensures the precision of the address accuracy indicator and enables quantitative assessment of the correctness of address information in the hotline data records.

3.2.6. Calculation Method for Theme Similarity

The primary indicator for consistency in the evaluation of hotline data record normativity mainly refers to thematic consistency, including the similarity between adjacent sentences (adjacent sentence similarity) and the similarity of each sentence to the entire text (full-text similarity). The calculation of these indicators is based on a BERT-based semantic similarity model, which leverages the deep contextual understanding capabilities of BERT to measure the semantic closeness between sentences.
The calculation process is carried out as follows: First, each pair of sentences to be compared is input into a pre-trained BERT model, which encodes the sentences into dense vector representations within a high-dimensional semantic space. The BERT model captures both the syntactic structure and contextual semantics of the sentences, ensuring that the generated vectors accurately reflect their meanings. Subsequently, the cosine similarity between the two sentence vectors is computed to quantify their semantic similarity. The cosine similarity score ranges from 0 to 1, where a higher score indicates a higher degree of semantic consistency between sentences.
  • Adjacent Sentence Similarity: This secondary indicator uses BERT to convert sentences into vectors, calculates the similarity between adjacent sentence vectors, and then takes the average of all similarities. The formula is as follows:
S a = 1 n 1 i = 1 n 1 cos ( V s i , V s i + 1 )
where V s i represents the vector of the i th sentence, cos is the cosine similarity measure, and n is the total number of sentences. The calculation method for adjacent sentence similarity is further illustrated in Figure 9.
2.
Full-Text Similarity: This secondary indicator first converts sentences into vectors using BERT, then calculates the maximum similarity between each sentence and all other sentences, and finally averages these maximum similarities. The formula is as follows:
S o = 1 n i = 1 n max j i cos ( V s i , V s j )
where V s i represents the vector of the i th sentence, cos is the cosine similarity measure, and n is the total number of sentences. The full-text similarity calculation differs from that for adjacent sentence similarity in that it calculates the maximum similarity of each sentence with respect to the other n − 1 sentences and then averages these maximum similarities. The calculation process is illustrated in Figure 10.

4. Experimental Results

4.1. Descriptive Statistics

To facilitate quantitative analysis, we encoded the work order fields and handling departments. The work order fields were coded from 0 to 19, covering various areas such as transportation and housing (Table 3), while the handling departments were categorized into district-level departments (0), municipal-level departments (1), and state-owned enterprises (2).
This study analyzed hotline data record standards using six research indicators: classification predictability, dispatch accuracy, record accuracy, address accuracy, adjacent sentence similarity, and full-text similarity. Table 4 presents the minimum, maximum, variance, mean, and number of observations for each indicator.
From Table 3, it can be seen that the average values and variances of the indicators reflect the performance of the data in various aspects. Classification predictability and dispatch accuracy had relatively high average values, indicating that most work orders had good classification and dispatch accuracy. The average value of record accuracy was close to 1, suggesting that there were few spelling errors in the work order records. The variance value of address accuracy was larger, indicating some fluctuation in address records. The average values for adjacent sentence similarity and full-text similarity were high, indicating a high level of consistency in adjacent sentences and overall semantics in the work order texts. For cases where the similarity is 0, we need to provide a separate explanation; this occurs when the sentence is too short to calculate its similarity with other sentences, and such brief descriptions often result in reduced completeness due to insufficient information.

4.2. Experimental Results of Deep Learning Models

Table 5 outlines the hyperparameters and dataset sizes for both text classification and named entity recognition (NER) tasks. Specifically, for text classification, the dataset sizes (train, test, and dev) represent the number of individual text samples. In contrast, for the named entity recognition task, the dataset sizes indicate the total number of characters processed. Additionally, the maximum sequence length (max_seq_length) for text classification was set to 128, while that for named entity recognition was set to 256, reflecting the differing requirements of these two deep learning tasks. Other parameters (e.g., batch size, learning rate, and epochs) are also task-specific and were optimized accordingly.
Table 6 presents the evaluation results of the proposed models in two natural language processing tasks: text classification and named entity recognition (NER). For the text classification task, the model achieved consistently high performance across all metrics, with an accuracy of 0.9219, precision of 0.9446, recall of 0.9219, and F1-score of 0.9234, demonstrating its effectiveness in distinguishing text categories. For the NER task, the model obtained an accuracy of 0.9548, with a precision of 0.7048, a recall of 0.7500, and an F1-score of 0.7267. These results indicate that the model is capable of accurately identifying named entities while maintaining a balanced performance between precision and recall.

4.3. Data Standardization

To ensure that the indicators are comparable and compute the data record normativity score, we standardized the data using the ‘StandardScaler’ method from the sklearn package in Python. ‘StandardScaler’ removes the mean of each feature and scales it to unit variance, allowing data from different features to be compared on the same scale. The standardized data follow a standard normal distribution, with a mean of 0 and a standard deviation of 1.
Using this method, we standardized the six research indicators, enabling their comparison on the same scale. Standardized data provide a more accurate reflection of each indicator’s contribution to the hotline data record normativity score.

4.4. Calculation of Total Score

To comprehensively evaluate the data record standard of each work order, we calculated the total score through summation of the six standardized indicators. The specific formula is as follows:
S = S R c + S R d + S C w + S C a + S S a + S S o
where S is the score of data record standard, S R c is the classification predictability after standardization, S R d is the accuracy of dispatch after standardization, S C w is the correctness of records after standardization, S C a is the correctness of addresses after standardization, S S a is the similarity of adjacent sentences after standardization, and S S o is the similarity of the entire text after standardization.

4.5. Linear Regression and Moderating Effects

In this study, we utilized a multiple linear regression model to explore the relationships between data record scores and work order completion rates, and we further examined the moderating effects of the work order field and the department handling the work order. The completion of work orders was considered as the dependent variable (Y), while the data record score, work order field, and handling department were considered as independent variables (X); furthermore, b represents the effect of each independent variable on the outcome, while u captures the error or variation in the outcome not explained by the model. In the moderating effect analysis, the work order field and handling department were treated as moderating variables interacting with the data record score in order to assess their influence on the completion rate.
y = b 0 + b 1 x 1 + b 2 x 2 + , . . . , + b n x n + u
The moderating effects were assessed by analyzing the significance and direction of the interaction terms relative to the main effects. These effects can be categorized into four scenarios based on the significance and sign of the interaction term, as summarized in Table 7.

4.6. Empirical Analysis

A correlation analysis was conducted using the cor() function in R, the results of which are presented in Figure 11, showing the correlation matrix of the key variables. As illustrated in the matrix, there was a strong linear correlation (coefficient = 0.90) between “adjacent sentence similarity” (ASS) and “full-text similarity” (FTS). Considering the risk of multicollinearity due to this high correlation, the variable “adjacent sentence similarity” was removed from the subsequent multiple linear regression analysis, thus ensuring the robustness and reliability of the model results.
From Table 8, it can be observed that dispatch accuracy and record accuracy were negatively correlated with work order completion, but the correlation between record accuracy and work order completion was not statistically significant (0.08). The statistical description of the data shows that the mean value of record accuracy was very close to 1, and the variance was very small, indicating that the accuracy of the textual descriptions in the work order data was very high. As a result, its effect on work order completion was not significant. Similarly, the mean value of dispatch accuracy was also very close to 1, suggesting that there were too many positive samples in the data, potentially affecting its correlation with work order completion. Intuitively, it would be expected that as dispatch accuracy increases, work order completion should also increase.
The remaining three indicators—address accuracy, full-text similarity, and classification predictability—showed significant positive correlations with work order completion, aligning well with our expectations. However, dispatch accuracy and record accuracy exhibited exceptionally high average values (0.95 and 0.997, respectively), indicating substantial data imbalance. Such an imbalance can introduce counterintuitive correlations, which underscores the necessity and appropriateness of using the integrated data quality scoring model discussed previously. Additionally, considering the high collinearity between adjacent sentence similarity and full-text similarity, we included both indicators within the integrated score, which helps to mitigate uncertainties arising from imbalanced data.
In the regression analysis, we examined the direct effect of integrated data record scores on work order completion rates. As shown in Table 9, there was a significant positive association between data record scores and work order completion (p < 0.001). This result aligns with previous findings emphasizing the importance of data standards in enhancing government governance; for instance, Huang [64] identified a significant moderating effect of data standards on government performance, while Niu et al. [65] similarly demonstrated a positive influence of data standards on environmental governance. Additionally, our regression analysis indicated that the work order field and handling department significantly affected work order completion rates.
To assess the robustness of the regression results, this study applied heteroskedasticity-robust standard errors. Specifically, Table 8 reports the baseline regression results obtained using the ordinary least squares (OLS) method, while Table 10 presents the results after adjusting the standard errors using the heteroskedasticity-consistent covariance matrix estimator (HC1). As can be seen from the two tables, the estimated coefficients and their significance levels remained largely consistent before and after the adjustment. This indicates that the presence of heteroskedasticity does not materially affect the estimation results, and the model exhibits a high degree of robustness.
Next, we analyzed the moderating effect of the work order field (Table 11). The results showed that when the work order field was treated as a moderating variable, it significantly enhanced the positive effect of the data record score on the completion rate (Pr < 0.001). This suggests that, in certain fields, higher data quality leads to better work order completion rates, especially for specific types of work orders where the impact is more pronounced.
Conversely, the results regarding the moderating effect of the handling department (Table 12) showed that it weakened the positive impact of the data record score on the completion rate (Pr < 0.001). This implies that, in certain departments, the positive influence of data record scores on completion rates is reduced, possibly due to issues in their processes or data standardization practices that prevent the quality of data from fully enhancing the completion rate.
These analyses indicate that data record scores have a significant impact on work order completion rates, with the work order field enhancing this effect and the handling department somewhat diminishing it. Based on these findings, we further analyzed the average data record scores across different work order fields. Figure 12 shows the average scores for different work order fields.
As shown in the figure, there were significant differences in the average data record scores across different fields. Certain fields (e.g., fields 4, 16, and 19) had higher scores, indicating that work orders in these fields exhibit a higher degree of standardization and compliance with data record norms. In contrast, fields 5 and 17 had lower scores, suggesting that work order data quality in these areas needs improvement. These findings provide empirical evidence for the optimization of data record standards and allow for recommendations to be provided to government departments in order to improve their operations.
To further evaluate the importance of specific indicators affecting work order completion, a random forest algorithm was applied. The importance of various indicators was assessed, and the results are shown in Figure 13.
The results presented in Figure 12 indicate considerable variability in the importance of individual indicators, as assessed by the random forest algorithm. It is crucial to note that the importance derived from this algorithm serves as a reference rather than an absolute measure, as random forest node splits tend to attribute higher predictive importance to indicators with greater data diversity and continuity. Specifically, semantic-related indicators such as adjacent sentence similarity (0.329), classification predictability (0.327), and full-text similarity (0.277), all of which are continuous data types, naturally exhibited higher importance due to their broader variability. Conversely, accuracy-related indicators, including address accuracy (0.005) and dispatch accuracy (0.004), are binary discrete data types and consequently yielded lower predictive significance within the random forest framework. Although our integrated scoring model employed equal weights to mitigate potential biases due to imbalanced data distributions, these findings highlight intrinsic differences in the predictive capabilities of the indicators. Therefore, future strategies for data quality enhancement should carefully consider these characteristics, potentially adopting weighted integration methods informed by the relative predictive importance and nature (e.g., data type) of each indicator.

4.7. Case Analysis

To further illustrate the significance of data record standardization, we analyzed specific cases. Examples of work orders, their corresponding scores, and an analysis of the key issues that contributed to their respective scores are presented in Table 13.
In Case 1, the data record standard score was −7.47, which was relatively low due to the caller’s failure to provide clear regional information, resulting in dispatch errors and delayed completion of the work order. This case represents a typical scenario where insufficient address details lead directly to incorrect dispatching. Given that approximately 50% of work orders are processed by regional jurisdictions, address accuracy emerges as a critical indicator that is significantly correlated with work order completion rates. Although address accuracy—being discrete data—exhibited relatively low predictive importance within the random forest model, its substantial impact observed in real-world analyses validates its practical importance. This underscores the appropriateness and validity of the indicators selected in this study.
In Case 2, the standardization score was −14.96, the lowest among the examples presented. The critical issue was the misspelling of the key term “illegal parking” as “false parking”, severely impacting the processing efficiency of the work order. This case underscores the significance of accurate recording in data standardization, as spelling errors prevent machine learning algorithms from accurately classifying issues, directly impairing the efficiency and accuracy of work order handling. Furthermore, as the semantic similarity calculations employed BERT-based sentence embeddings, even minor errors in individual words significantly affected the semantic representation of the entire sentence. Consequently, the observed spelling error notably reduced the semantic similarity score, contributing to an overall decline in the standardization score and ultimately leading to the work order’s incomplete status.
Based on the above analyses, this study provides practical insights into hotline work order management within China’s specific context. Given the complexity and variability inherent in government hotline data, indicators such as address accuracy and record accuracy play critical roles despite their lower predictive significance in random forest models. Address accuracy remains pivotal due to China’s administrative structure, where around 50% of work orders are typically handled at the local jurisdiction level, emphasizing the necessity of accurate regional information. Additionally, the prevalence of manual data entry and linguistic nuances, exemplified by issues such as misspellings, directly impact semantic clarity and subsequent automated classification using advanced NLP techniques like BERT embeddings. Therefore, to enhance the effectiveness of hotline operations, Chinese government departments should prioritize improving address details and textual accuracy, supplementing machine learning insights with real-world case analyses to comprehensively optimize service delivery and operational efficiency.

5. Conclusions and Recommendations

5.1. Conclusions

This study analyzed the relationship between government hotline data record standard scores and work order completion rates, revealing a significant positive correlation. Higher overall data quality scores, calculated by summing the six key evaluation indicators, were consistently associated with higher work order completion rates. Among these indicators, adjacent sentence similarity, classification predictability, and full-text similarity demonstrated the most substantial impact, underscoring the critical role of semantic clarity and structured coherence in data records. In contrast, record accuracy, address accuracy, and dispatch accuracy exhibited relatively lower predictive importance.
To further interpret these findings, this study incorporates relevant theoretical perspectives from data quality and information management. From the perspective of data quality, factors such as semantic coherence, contextual relevance, and logical consistency are essential for ensuring that information can be effectively understood and utilized in decision-making processes. The strong influence of adjacent sentence similarity, classification predictability, and full-text similarity reflects the fact that clear and well-structured data records facilitate accurate comprehension and task execution by frontline personnel, thereby contributing to higher completion rates.
Conversely, the relatively limited impact of record accuracy, address accuracy, and dispatch accuracy can be attributed to the diverse and complex nature of certain work order categories. In practice, work orders related to areas such as social governance, public facilities, and social security often involve ambiguous, unstructured, or incomplete information. In these cases, strict accuracy in individual data elements may not be the determining factor for successful resolution. Instead, overall semantic clarity and contextual integrity are more influential.
In summary, the differentiated impact of the six evaluation indicators reflects the inherent tension between data standardization and service flexibility in public governance. These findings not only validate the effectiveness of the proposed evaluation system but also provide a theoretical explanation for the varying influence of different data quality dimensions, offering valuable insights for optimizing hotline data management and improving service efficiency.

5.2. Recommendations

To further improve the quality and standardization of hotline work order data and enhance work order completion rates, this study offers the following recommendations for government departments:
(1)
Strengthen Employee Training and Guidance: Although this study did not directly evaluate human input behaviors, the case analysis revealed that certain incomplete or inaccurately worded records—such as missing address details or incorrect keywords—may reduce the effectiveness of automated classification and dispatch. These issues suggest the potential value of targeted employee training as a complementary measure to improve the overall quality of data. Government departments should implement tiered and role-specific training programs, including regular sessions for frontline staff in identifying key information, using standardized terms, and avoiding common errors. Real-world case studies should be incorporated to enhance practical skills. For reviewers and supervisors, training should focus on error correction, quality monitoring, and the delivery of feedback. The effectiveness of training should be tracked using pre–post evaluations, and the associated outcomes should inform adaptive retraining strategies.
(2)
Develop and Implement Standardized Guidelines: Introducing detailed and operational data entry guidelines will significantly improve the consistency and clarity of work order records. These guidelines should include (a) standardized templates for high-frequency issues, (b) a reference dictionary of recommended expressions and prohibited colloquialisms, (c) annotated examples highlighting common recording mistakes and suggested corrections, and (d) clear formatting rules for dates, locations, and administrative terms. To ensure their widespread adoption, these guidelines should be embedded within the hotline platform and updated periodically based on data audit findings and user feedback.
(3)
Leverage Intelligent Assistance Tools: Modern technologies such as natural language processing (NLP) and address verification systems can enhance the accuracy of recorded data. Intelligent tools should be integrated into the data entry interface to (a) provide real-time alerts for spelling errors and improper keywords, (b) offer automatic suggestions for standard issue descriptions based on historical data, (c) enable the use of APIs (e.g., Baidu Maps) to verify and complete address fields, and (d) automatically flag incomplete or semantically inconsistent records.
These tools can operate in a human-in-the-loop manner, where suggestions facilitate rather than replace staff decisions, ensuring both the efficiency and integrity of data.
(4)
Implement Automated and Dual Review Mechanisms: Establishing a layered quality review system can further enhance the accuracy of data. The first layer involves automated scripts that detect missing values, format inconsistencies, and low-quality text. The second layer consists of a manual review of flagged records by supervisors. The results obtained through this process should feed into a monthly feedback and correction loop, providing targeted guidance to staff and informing future training needs. In the long term, this mechanism should be supported by dashboard analytics, allowing for the tracking of quality trends and the benchmarking of performance.
Through the adoption of these strategies, government departments can significantly improve the standardization and reliability of hotline data. These recommendations not only address existing shortcomings in data recording but also provide a clear path for continuous improvement, thereby optimizing workflow efficiency, enhancing service delivery, and increasing public satisfaction.

6. Limitations and Future Work

This study proposed a multi-dimensional scoring method for hotline data record standards and validated its effectiveness through empirical analysis. However, several limitations remain. First, the data used were limited to a single municipal hotline system, which may restrict the generalizability of the findings. Second, while the six considered indicators were assigned equal weights in the scoring model, the random forest results revealed varying levels of predictive importance among these indicators. Future work could explore dynamic or learning-based weighting schemes to improve the accuracy of associated methods. Additionally, the existing evaluation framework is based on historical static data and, as such, real-time monitoring and feedback mechanisms should be incorporated in future studies to support adaptive improvements in hotline service quality.

Author Contributions

Conceptualization, Z.Z. and T.Z.; methodology, Z.Z.; software, Z.Z.; validation, Z.Z. and T.Z.; formal analysis, Z.Z.; investigation, Z.Z.; resources, Z.Z.; data curation, Z.Z.; writing—original draft preparation, Z.Z.; writing—review and editing, T.Z.; visualization, Z.Z.; supervi-sion, Z.Z. All authors have read and agreed to the published version of the manuscript.

Funding

This work was supported by the Natural Science Research Start-up Foundation of Recruiting Talents of Nanjing University of Posts and Telecommunications, (grant number NY223210).

Informed Consent Statement

This article does not contain any studies with human participants or animals performed by any of the authors.

Data Availability Statement

Data Access: https://pan.baidu.com/s/1mstmbJodyT-j6XkSlrA8vw?pwd=sr12, accessed on 24 February 2025.

Conflicts of Interest

The authors declare no conflicts of interest.

References

  1. Zhu, X.; Chen, Z.; Cheng, T.; Yang, C.; Wu, D.; Wu, Y.; Wang, H. Blockchain for urban governance: Enhancing trust in smart city systems with advanced techniques. Sustain. Cities Soc. 2024, 108, 105438. [Google Scholar] [CrossRef]
  2. Zhang, Z.C.; Li, A.G.; Wang, L.; Cao, W.; Yang, J. Big data-assisted urban governance: A comprehensive system for business documents classification of the government hotline. Eng. Appl. Artif. Intell. 2024, 132, 107997. [Google Scholar] [CrossRef]
  3. The State Council of the People’s Republic of China. Guidelines on Further Improving the 12345 Government Hotline Service Mechanism. 2021. Available online: https://www.gov.cn/zhengce/content/2021-01/06/content_5577419.htm (accessed on 6 January 2021).
  4. Hunan Provincial People’s Government General Office. Notice on Issuing the 2025 Key Points of Government Services and Data Work in Hunan Province. 2024. Available online: https://hunan.gov.cn/hnszf/xxgk/wjk/szfbgt/202406/t20240613_33326346.html (accessed on 31 May 2024).
  5. Zheng, Y.; Gan, Q.; Zhang, C.; Zhang, X. The Current Situation and Challenges of Local Government Data Governance: An Empirical Study Based on 43 Government Hotline Departments. E-Government 2020, 7, 66–79. [Google Scholar]
  6. Fan, B.; Yu, Y. Influencing Factors of Government Data Quality Based on Adaptive Structuration Theory: A Case Study of the Data from Government Service Hotline 12345. Doc. Inf. Knowl. 2021, 38, 13–24. [Google Scholar]
  7. Wang, Y.Z.; Lian, D.F.; Chen, E.H. Event assignment based on KBQA for government service hotlines. Appl. Artif. Intell. 2024, 38, 2348162. [Google Scholar] [CrossRef]
  8. Li, Z.; Yi, X.; Chen, S.; Zhang, J.; Li, T. Government Event Dispatch Approach Based on Deep Multi-view Network. Comput. Sci. 2024, 51, 216–222. [Google Scholar]
  9. Zhang, Z. Understanding the relationship between normative records of appeals and government hotline order dispatching: A data analysis method. Data Technol. Appl. 2024, 58, 496–516. [Google Scholar] [CrossRef]
  10. Huang, W.; Su, C.; Wang, Y. An intelligent work order classification model for government service based on multi-label neural network. Comput. Commun. 2021, 172, 19–24. [Google Scholar] [CrossRef]
  11. Zhao, T.; He, Z.; Shao, J.; Regmi, A.; Shi, L.; Cai, Y. Decoding hotline’s information with text mining: A protocol for improving tobacco control in Shanghai. Tob. Induc. Dis. 2024, 22, 107. [Google Scholar] [CrossRef]
  12. Zhang, Z.; Li, A.; Xu, Y.; Liang, Y.; Jin, X.; Wu, S. Understanding citizens’ satisfaction with the government response during the COVID-19 pandemic in China: Comprehensive analysis of the government hotline. Libr. Hi Tech 2023, 41, 91–107. [Google Scholar] [CrossRef]
  13. Karkošková, S. Data governance model to enhance data quality in financial institutions. Inf. Syst. Manag. 2023, 40, 90–110. [Google Scholar] [CrossRef]
  14. de Oliveira, N.R.; Medeiros, D.S.; Moraes, I.M.; Andreonni, M.; Mattos, D.M. Towards intent-based management for Open Radio Access Networks: An agile framework for detecting service-level agreement conflicts. Ann. Telecommun. 2024, 79, 693–706. [Google Scholar] [CrossRef]
  15. Zhang, X.; Yu, X. Measurement and improvement of island B&BS customer satisfaction. Acta Psychol. 2024, 248, 104425. [Google Scholar]
  16. Ali, O.; Shrestha, A.; Chatfield, A.; Murray, P. Assessing information security risks in the cloud: A case study of Australian local government authorities. Gov. Inf. Q. 2020, 37, 101419. [Google Scholar] [CrossRef]
  17. Baffour, B.; Valente, P. An evaluation of census quality. Stat. J. IAOS 2012, 28, 121–135. [Google Scholar] [CrossRef]
  18. Zhang, Z.; Lin, X.; Shan, S. Big data-assisted urban governance: An intelligent real-time monitoring and early warning system for public opinion in government hotline. Future Gener. Comput. Syst. 2023, 144, 90–104. [Google Scholar] [CrossRef]
  19. Tejedo-Romero, F.; Ferraz Esteves Araujo, J.F.; Gonçalves Ribeiro, M.J. The usability of Brazilian government open data portals: Ensuring data quality. Humanit. Soc. Sci. Commun. 2025, 12, 297. [Google Scholar] [CrossRef]
  20. Mohmad, N.; Hassan, N.; Samy, G.; Aziz, N.S.A.; Maarop, N.; Abu Bakar, N.A. A review of factors influencing patient readmission based on data quality dimension model. In Proceedings of the 2020 8th International Conference on Information Technology and Multimedia (ICIMU), Selangor, Malaysia, 24–25 August 2020; IEEE: Piscataway, NJ, USA, 2020; pp. 26–31. [Google Scholar]
  21. Park, J.; Tosaka, Y. Metadata quality control in digital repositories and collections: Criteria, semantics, and mechanisms. Cat. Classif. Q. 2010, 48, 696–715. [Google Scholar] [CrossRef]
  22. Schmidt, C.; Struckmann, S.; Enzenbach, C.; Reineke, A.; Stausberg, J.; Damerow, S.; Huebner, M.; Schmidt, B.; Sauerbrei, W.; Richter, A. Facilitating harmonized data quality assessments: A data quality framework for observational health research data collections with software implementations in R. BMC Med. Res. Methodol. 2021, 21, 63. [Google Scholar] [CrossRef]
  23. Song, H.; Yu, J.; Han, Q. Industrial multivariate time series data quality assessment method. J. Comput. Appl. 2024, 44, 1743–1750. [Google Scholar]
  24. Vetro, A.; Canova, L.; Torchiano, M.; Minotas, C.O.; Iemma, R.; Morando, F. Open data quality measurement framework: Definition and application to open government data. Gov. Inf. Q. 2016, 33, 325–337. [Google Scholar] [CrossRef]
  25. Ba, W.; Chen, B.; Li, Q. Comprehensive evaluation method for traffic flow data quality based on grey correlation analysis and particle swarm optimization. J. Syst. Sci. Syst. Eng. 2024, 33, 106–128. [Google Scholar] [CrossRef]
  26. Wu, D.; Xu, H.; Wang, Y.; Zhu, H. Quality of government health data in COVID-19: Definition and testing of an open government health data quality evaluation framework. Libr. Hi Tech 2021, 40, 516–534. [Google Scholar] [CrossRef]
  27. Deng, Y.; Ju, H.; Zhong, G.; Li, A.; Ding, Y. A general data quality evaluation framework for dynamic response monitoring of long-span bridges. Mech. Syst. Signal Process. 2023, 200, 110514. [Google Scholar] [CrossRef]
  28. Qaiser, S.; Ali, R. Text mining: Use of TF-IDF to examine the relevance of words to documents. Int. J. Comput. Appl. 2018, 181, 25–29. [Google Scholar] [CrossRef]
  29. Guo, Y.; Barnes, S.; Jia, Q. Mining meaning from online ratings and reviews: Tourist satisfaction analysis using latent Dirichlet allocation. Tour. Manag. 2017, 59, 467–483. [Google Scholar] [CrossRef]
  30. Tang, J.; Meng, Z.; Nguyen, X.; Mei, Q.; Zhang, M. Understanding the limiting factors of topic modeling via posterior contraction analysis. In Proceedings of the International Conference on Machine Learning, PMLR, Beijing, China, 21–26 June 2014; pp. 190–198. [Google Scholar]
  31. Hadi, M.; Fard, F. AOBTM: Adaptive online biterm topic modeling for version-sensitive short-texts analysis. In Proceedings of the 2020 IEEE International Conference on Software Maintenance and Evolution (ICSME), Adelaide, Australia, 28 September–2 October 2020; IEEE: Piscataway, NJ, USA, 2020; pp. 593–604. [Google Scholar]
  32. Sousa, M.; Sakiyama, K.; Rodrigues, L.; Moraes, P.H.; Fernandes, E.R.; Matsubara, E.T. BERT for stock market sentiment analysis. In Proceedings of the 2019 IEEE 31st International Conference on Tools with Artificial Intelligence (ICTAI), Portland, OR, USA, 4–6 November 2019; IEEE: Piscataway, NJ, USA, 2019; pp. 1597–1601. [Google Scholar]
  33. Grootendorst, M. BERTopic: Neural topic modeling with a class-based TF-IDF procedure. arXiv 2022, arXiv:2203.05794. [Google Scholar]
  34. Rau, L. Extracting company names from text. In Proceedings of the Seventh IEEE Conference on Artificial Intelligence Application, Miami Beach, FL, USA, 24–28 February 1991; IEEE Computer Society: Washington, DC, USA, 1991; pp. 29–32. [Google Scholar]
  35. Chinchor, N. MUC-6 named entity task definition (version 2.1). In Proceedings of the 6th Message Understanding Conference, Columbia, MD, USA, 6–8 November 1995. [Google Scholar]
  36. Fukuda, K.; Tamura, A.; Tsunoda, T.; Takagi, T. Toward information extraction: Identifying protein names from biological papers. In Pacific Symposium on Biocomputing; World Scientific Publishing Co. Inc.: Singapore, 1998; pp. 707–718. [Google Scholar]
  37. Quimbaya, A.; Múnera, A.; Rivera, R.; Rodríguez, J.C.D.; Velandia, O.M.M.; Peña, A.A.G.; Labbé, C. Named entity recognition over electronic health records through a combined dictionary-based approach. Procedia Comput. Sci. 2016, 100, 55–61. [Google Scholar] [CrossRef]
  38. Keretna, S.; Lim, C.; Creighton, D. A hybrid model for named entity recognition using unstructured medical text. In Proceedings of the 2014 9th International Conference on System of Systems Engineering (SOSE), Glenelg, Australia, 9–13 June 2014; IEEE: Piscataway, NJ, USA, 2014; pp. 85–90. [Google Scholar]
  39. Yamada, H.; Kudo, T.; Matsumoto, Y. Japanese named entity extraction using support vector machine. Trans. Inf. Process. Soc. Jpn. 2002, 43, 44–53. [Google Scholar]
  40. Han, X.; Kwoh, C.; Kim, J. Clustering-based active learning for biomedical named entity recognition. In Proceedings of the International Joint Conference on Neural Networks, Vancouver, BC, Canada, 24–29 July 2016; IEEE: Piscataway, NJ, USA, 2016. [Google Scholar]
  41. Li, J.; Sun, A.; Han, J.; Li, C. A survey on deep learning for named entity recognition. IEEE Trans. Knowl. Data Eng. 2022, 34, 50–70. [Google Scholar] [CrossRef]
  42. Ningrinla, M.; Rakesh, T. KNN-ST: Exploiting spatio-temporal correlation for missing data inference in environmental crowd sensing. IEEE Sens. J. 2021, 21, 3429–3436. [Google Scholar]
  43. Rocchio, J. Relevance feedback in information retrieval. In The Smart Retrieval System Experiments in Automatic Document Processing; Prentice Hall: New York, NY, USA, 1971; pp. 313–323. [Google Scholar]
  44. Li, Q.; Wan, P.; Hao, T. Application of PSO-SVM-based text classification on the precision marketing of insurance. J. Glob. Trade Manag. 2022, 28, 111–129. [Google Scholar]
  45. Pipino, L.L.; Lee, Y.W.; Wang, R.Y. Data quality assessment. Commun. ACM 2002, 45, 211–218. [Google Scholar] [CrossRef]
  46. Lewis, A.; Weiskopf, N.; Abrams, Z.; Foraker, R.; Lai, A.M.; O Payne, P.R.; Gupta, A. Electronic health record data quality assessment and tools: A systematic review. J. Am. Med. Inform. Assoc. 2023, 30, 1730–1740. [Google Scholar] [CrossRef]
  47. Varela, L.; Sandhu, N.; Walker, R.; Southern, D.A.M.; Quan, H.; Eastwood, C.A.R. Development of data quality indicators for improving hospital international classification of diseases-coded health data quality globally. Med. Care 2024, 62, 575–582. [Google Scholar] [CrossRef]
  48. Cai, L.; Zhu, Y. The challenges of data quality and data quality assessment in the big data era. Data Sci. J. 2015, 14, 2. [Google Scholar] [CrossRef]
  49. Reda, O.; Benabdellah, N.C.; Zellou, A. A systematic literature review on data quality assessment. Bull. Electr. Eng. Inform. 2023, 12, 3736–3757. [Google Scholar] [CrossRef]
  50. Chen, H.; Hailey, D.; Wang, N.; Yu, P. A review of data quality assessment methods for public health information systems. Int. J. Environ. Res. Public Health 2014, 11, 5170–5207. [Google Scholar] [CrossRef]
  51. Zhou, Y.; Tu, F.; Sha, K.; Ding, J.; Chen, H. A survey on data quality dimensions and tools for machine learning. arXiv 2024, arXiv:2406.19614. [Google Scholar]
  52. Batini, C.; Cappiello, C.; Francalanci, C.; Maurino, A. Methodologies for data quality assessment and improvement. ACM Comput. Surv. (CSUR) 2009, 41, 1–52. [Google Scholar] [CrossRef]
  53. Wang, R.Y.; Strong, D.M. Beyond accuracy: What data quality means to data consumers. J. Manag. Inf. Syst. 1996, 12, 5–33. [Google Scholar] [CrossRef]
  54. Hamdy, M.E.; Shaalan, K. A hybrid framework for applying semantic integration technologies to improve data quality. Int. J. Inf. Technol. 2018, 2, 27–44. [Google Scholar]
  55. Tian, Z.; Zhong, R.Y.; Vatankhah Barenji, A.; Wang, Y.T.; Li, Z.; Rong, Y. A blockchain-based evaluation approach for customer delivery satisfaction in sustainable urban logistics. Int. J. Prod. Res. 2021, 59, 2229–2249. [Google Scholar] [CrossRef]
  56. Redman, T.C. The impact of poor data quality on the typical enterprise. Commun. ACM 1998, 41, 79–82. [Google Scholar] [CrossRef]
  57. Gharehchopogh, F.S.; Khalifelu, Z.A. Analysis and evaluation of unstructured data: Text mining versus natural language processing. In Proceedings of the 2011 5th International Conference on Application of Information and Communication Technologies (AICT), Azerbaijan, Baku, 12–14 October 2011; IEEE: Piscataway, NJ, USA; pp. 1–4. [Google Scholar]
  58. Li, Y.; Shang, H. Service quality, perceived value, and citizens’ continuous-use intention regarding e-government: Empirical evidence from China. Inf. Manag. 2020, 57, 103197. [Google Scholar] [CrossRef]
  59. Cheng, J.; Liu, Y. The effects of public attention on the environmental performance of high-polluting firms: Based on big data from web search in China. J. Clean. Prod. 2018, 186, 335–341. [Google Scholar] [CrossRef]
  60. Tao, F.; Qi, Q.; Liu, A.; Kusiak, A. Data-driven smart manufacturing. J. Manuf. Syst. 2018, 48, 157–169. [Google Scholar] [CrossRef]
  61. Adegoke, K.; Adegoke, A.; Dawodu, D.; Bayowa, A.; Adekoya, A. Interoperability in Digital Healthcare: Enhancing Consumer Health and Transforming Care Systems. Preprint 2025. [Google Scholar] [CrossRef]
  62. Otto, B.; Weber, K. Data governance. In Daten-und Informationsqualität: Auf dem weg zur Information Excellence; Springer: Berlin/Heidelberg, Germany, 2011; pp. 277–295. [Google Scholar]
  63. Mutinda, F.W.; Yada, S.; Wakamiya, S.; Aramaki, E. Semantic textual similarity in Japanese clinical domain texts using BERT. Methods Inf. Med. 2021, 60, e56–e64. [Google Scholar] [CrossRef]
  64. Huang, Y. Empirical study on the factors affecting the performance of domestic government data openness. Soft Sci. 2023, 37, 10–17. [Google Scholar]
  65. Niu, X.; Wang, X.; Gao, J.; Wang, X. Has third-party monitoring improved environmental data quality? An analysis of air pollution data in China. J. Environ. Manag. 2020, 253, 109698. [Google Scholar] [CrossRef]
Figure 1. Government hotline processing workflow.
Systems 13 00320 g001
Figure 2. Framework for evaluation of data record standards and their impact on work order completion.
Systems 13 00320 g002
Figure 3. Technical route of the proposed framework.
Systems 13 00320 g003
Figure 4. BERT model text processing principle.
Systems 13 00320 g004
Figure 5. Number of work orders closed by various districts and departments in City A in 2023.
Systems 13 00320 g005
Figure 6. Flowchart of dispatch accuracy calculation.
Systems 13 00320 g006
Figure 7. Spelling error detection process.
Systems 13 00320 g007
Figure 8. Working principle of the BERT-BiLSTM-CRF model.
Systems 13 00320 g008
Figure 9. Calculation method for adjacent sentence similarity.
Systems 13 00320 g009
Figure 10. Calculation method for full-text similarity.
Systems 13 00320 g010
Figure 11. Linear correlation matrix of variables.
Systems 13 00320 g011
Figure 12. Statistical distribution of work order field scores across different categories.
Systems 13 00320 g012
Figure 13. Evaluation of indicator importance.
Systems 13 00320 g013
Table 1. Accuracy of Qwen-7B and other pre-trained language models.
ModelAverage
Alpaca-7B28.9
Vicuna-7B31.2
ChatGLM-6B37.1
Baichuan-7B42.7
ChatGLM2-6B50.9
InternLM-7B53.4
ChatGPT-3.553.5
Claude-v1.355.5
Qwen-7B60.8
Table 2. Performance of Qwen-7B and other models on C-Eval test set.
ModelAvg.Avg. (Hard)STEMSocial SciencesHumanitiesOthers
ChatGLM-6B38.929.233.348.341.338.0
Chinese-Alpaca-Plus-13B41.530.536.649.743.141.2
Baichuan-7B42.831.538.252.046.239.3
WestlakeLM-19B44.634.941.651.044.344.5
AndesLM-13B46.029.738.161.051.041.9
BatGPT-15B-sirius47.031.942.757.548.643.6
ChatGLM2-6B51.737.148.660.551.349.8
InternLM-7B52.837.148.067.455.445.8
Baichuan-13B53.636.747.066.857.349.8
Claude-v1.354.239.051.961.752.153.7
ChatGPT-3.554.441.452.961.850.953.6
Qwen-7B59.641.052.874.163.155.2
Table 3. Coding for different work order fields.
CategoryCode
Transportation0
Housing Security1
Party and Government Affairs2
Public Safety3
Public Services4
Agriculture, Forestry, Water, and Land5
Healthcare6
Urban and Rural Construction7
Urban Comprehensive Management8
Safety Supervision9
Government Administration10
Livelihood Security11
Public Security and Legal Affairs12
Environmental Protection13
Science, Education, Culture, and Health14
Science, Education, Culture, and Tourism15
Comprehensive Economic Management16
Mass Organizations17
Industry Supervision18
Outside Scope of Acceptance19
Table 4. Descriptive statistics for the utilized indicators.
IndicatorMinimumMaximumVarianceMeanObservations
Classification Predictability (CP)0.0370.9990.0430.612266,850
Dispatch Accuracy (DA)010.0480.950266,850
Record Accuracy (RA)0.89314.08 × 10−50.997266,850
Address Accuracy (AA)010.2370.375266,850
Adjacent Sentence Similarity (ASS)00.9360.0060.745266,850
Full-Text Similarity (FTS)010.0080.814266,850
Work Order Field (WOF)01920.7997.923266,850
Work Order Handling Department (WOHD)020.3370.366266,850
The Completion of the Work Orders (CWO)010.1370.836266,850
Table 5. Experimental parameters of the algorithms.
ParametersText ClassificationNamed Entity Recognition
max_seq_length128256
train_epoches120
batch_size1284
learning_rate5 × 10−53 × 10−5
rnn_dim 128
train_data_size871,1091,734,751
test_data_size48,396257,841
dev_data_size48,397243,060
Table 6. Experimental results obtained for the considered algorithms.
AlgorithmsAccuracyPrecisionRecallF1
Text classification0.92190.94460.92190.9234
Named entity recognition0.95480.70480.75000.7267
Table 7. Four types of moderating effects.
Main Effect SignInteraction Term Sign
Significant positive effect of the independent variable on the dependent variableInteraction term (independent variable× moderating variable) is significantly positive
Interaction term (independent variable× moderating variable) is significantly negative
Significant negative effect of the independent variable on the dependent variableInteraction term (independent variable× moderating variable) is significantly positive
Interaction term (independent variable× moderating variable) is significantly negative
Table 8. The regression analysis results of five indicators with respect to work order completion.
EstimateStd. Errort ValuePr (>|t|)
Classification Predictability0.0809770.00344123.534<2 × 10⁻¹⁶ ***
Dispatch Accuracy−0.0297180.003253−9.134<2 × 10⁻¹⁶ ***
Record Accuracy−0.1976840.112459−1.7580.08
Address Accuracy0.0172910.00147511.725<2 × 10⁻¹⁶ ***
Full-Text Similarity0.8118780.01811444.820<2 × 10⁻¹⁶ ***
Significance p-value: ***, <0.001.
Table 9. The results after adjusting the standard errors using the heteroskedasticity-consistent covariance matrix estimator.
EstimateStd. Errort ValuePr (>|t|)
Classification Predictability0.0809770.00318525.42<2 × 10⁻¹⁶ ***
Dispatch Accuracy−0.0297180.002979−9.975<2 × 10⁻¹⁶ ***
Record Accuracy−0.1976840.114634−1.7240.085
Address Accuracy0.0172910.00145811.863<2 × 10⁻¹⁶ ***
Full-Text Similarity0.8118780.01917142.350<2 × 10⁻¹⁶ ***
Significance p-value: ***, <0.001.
Table 10. The regression analysis results of three indicators with work order completion.
EstimateStd. Errort ValuePr (>|t|)
Score0.00654310.000262724.90<2 × 10⁻¹⁶ ***
Work Order Field0.00244800.000156615.63<2 × 10⁻¹⁶ ***
Work Order Handling Department0.05837170.001236347.21<2 × 10⁻¹⁶ ***
Significance p-value: ***, <0.001.
Table 11. Analysis of moderating effects by work order field.
EstimateStd. Errort ValuePr (>|t|)
Score0.00256350.00056764.5166.29 × 10−6 ***
Work Order Field0.00262380.000157316.676<2 × 10⁻¹⁶ ***
Score × Work Order Field0.00032990.00006155.3648.16 × 10−8 ***
Significance p-value: ***, <0.001.
Table 12. Analysis of moderating effects by work order handling department.
EstimateStd. Errort ValuePr (>|t|)
Score0.00750210.0003232 23.213<2 × 10⁻¹⁶ ***
Work Order Handling Department0.0587536 0.001236947.499<2 × 10⁻¹⁶ ***
Score × Work Order Handling Department−0.00204420.0004363−4.6852.8 × 10−6 ***
Significance p-value: ***, <0.001.
Table 13. Specific case examples.
Case No.Work Order DescriptionScoreIssue Analysis
1The caller wants to drive a bus with a llama to XX for a performance but is unsure if animal quarantine procedures are required.−7.47The caller’s area was not clarified, and quarantine procedures need to be handled in the corresponding jurisdiction. This caused a delay in work order completion.
2The caller reports illegal parking on an unmarked cement road at XX Road, located at the intersection of XX, XX, and XX areas.−14.96The key term “illegal parking” was mistakenly written as “false parking”. As machine learning algorithms are used for text classification, the misspelling of this keyword greatly impacted classification, reducing overall work order completion.
Disclaimer/Publisher’s Note: The statements, opinions and data contained in all publications are solely those of the individual author(s) and contributor(s) and not of MDPI and/or the editor(s). MDPI and/or the editor(s) disclaim responsibility for any injury to people or property resulting from any ideas, methods, instructions or products referred to in the content.

