Abstract
The development of tourism governance (TG) is influenced by the tourism economy (TE), and the development of TE is guaranteed by tourism governance. This study investigates the development levels of the tourism economy and tourism governance, as well as their interactive coordination in 31 Chinese provinces (including municipalities and autonomous regions) from 2012 to 2021. First, the vertical and horizontal differentiation method was employed to measure tourism economy and tourism governance development levels. Second, the Panel Vector Autoregression (PVAR) model was adopted to examine the Granger causality and the interactive effects between the tourism economy and tourism governance. Third, the coupled coordination model, kernel density estimation, and Markov chain model were combined to explore the degree of coordinated development and the spatio-temporal evolutionary trend of TE-TG. The findings reveal the following: (1) The development level of the tourism economy exhibits a fluctuating upward trend, with its spatial distribution pattern demonstrating a distinct coastal-to-inland decreasing gradient. Meanwhile, tourism governance shows a steady improvement trajectory marked by significant regional disparities. (2) A long-term equilibrium relationship has been established between the tourism economy and tourism governance, with bidirectional Granger causality observed between the two systems. (3) The coupled coordination between the tourism economy and tourism governance has progressively increased. However, the development level of tourism governance still lags behind that of the tourism economy. The eastern and central regions demonstrate significantly higher TE-TG coordination levels compared to the western and northeastern regions.
1. Introduction
Achieving coordinated development between the tourism economy (TE) and tourism governance (TG) constitutes the ultimate goal of tourism market governance [1,2,3]. Market failure theory posits that relying solely on self-regulation within economic markets leads to inefficient resource allocation and complicates supply-demand equilibrium management. Tourism economic activities exhibit pronounced market failure characteristics [4]. For example, the market mechanism fails to reflect externalities, and the overexploitation of tourism resources can damage the ecological environment and cultural heritage. Although overexploitation generates short-term gains, it perpetuates environmental pollution, ecological degradation, and cultural erosion in destinations. The uniqueness and irreplaceability of tourism resources foster monopolistic pricing and service undersupply. Severe information asymmetry exists between tourism consumers and operators. Consumers’ limited access to complete tourism information enables operators to exploit informational advantages, inducing problematic practices including low-cost tourism traps, forced shopping, price gouging, non-refundable deposits, and false advertising [5]. While digital transformation enhances tourism enterprise efficiency and consumer convenience, it simultaneously intensifies information asymmetry in tourism activities. For instance, tourism e-commerce platforms leverage user data to construct precise profiles and deploy algorithmic bias toward customized product promotion, thereby reinforcing filter bubbles and eroding consumer autonomy. Platforms utilize geographic location and consumption records to implement dynamic pricing strategies, displaying differentiated prices for new versus frequent users to fabricate limited-time discount illusions. Leading shared accommodation platforms consolidate dominant market positions via traffic and data monopolies, constraining SMEs’ (small and medium-sized enterprises) operational viability. Overall, tourism market failures have become increasingly common, causing serious impacts on tourism’s economic order and posing serious challenges to tourism development. Therefore, government intervention and regulatory governance are critical to preserving coordination, transparency, and equity in tourism markets [6,7].
Government intervention theories posit that institutional design and policy tools enable governments to resolve structural contradictions, including tourism externalities, information asymmetry, and public goods undersupply, thereby fostering sustainable tourism development [8,9,10]. Tourism governance research employs four theoretical frameworks: institutional theory, regulatory theory, policy implementation theory, and public choice theory, collectively enabling multidimensional analysis. These theories are able to explain the structural design, interest game, policy implementation, and power interaction in the tourism governance process. Institutional theory emphasizes the synergistic coordination between formal institutions (e.g., laws, policies) and informal institutions (e.g., cultural norms, social expectations) to legitimize tourism development [11,12]. New Zealand’s governmental initiatives exemplify this through the Resource Management Act and sustainable tourism planning, effectively conserving natural heritage and biodiversity [13]. China implemented the Tourism Law and localized regulatory frameworks to institutionalize market stabilization measures [14]. Saudi Arabia enacted a new environmental law to protect natural landscapes, cultural heritage, and the marine environment, implementing policy measures to promote sustainable tourism development [15]. The Egyptian government introduced a Tourism Police unit and a Price Disclosure App, while requiring travel agencies to submit security deposits to regulate disorderly practices in the Pyramid Region’s tourism sector. The Indonesian government implemented a single-use plastic prohibition policy and created a Garbage Bank recycling network in Bali to mitigate the island’s plastic pollution emergency. Regulatory governance theory posits that effective tourism governance necessitates three-tier coordination: governmental regulation, corporate self-discipline, and community-public oversight mechanisms [6,16]. For example, Airbnb establishes community commitment clauses that allow hosts to report offending tenants and shares data with the government (e.g., Paris requires the platform to report monthly listing information to combat illegal short-term rentals). Australia’s Uluru-Kata Tjuta National Park returns 20% of entrance fee revenue to the Aboriginal Anangu people, who participate in visitor management decisions. The Indian state of Kerala launched the Responsible Tourism APP, which allows tourists to report environmental vandalism (e.g., plastic waste) and redeem points for discounts on attractions. Policy implementation theory can analyze the subject interaction, resource allocation, and interest game in the process of policy implementation. The fuzzy-conflict model of policy implementation suggests that government agencies, tourism developers, and indigenous people will be caught in a dynamic game process because of the equilibrium distribution of interests and resources, thus affecting the adoption and implementation of policies [17]. For example, tourism development in Curaçao has been caught in the “Prisoner’s Dilemma of Competition”, in which political actors did not adopt laws on tourism environmental protection and sustainable development for a long time in order to maximize the attraction of foreign investment, but this behavior has created an ecological threat to the survival of the indigenous people’s environment [18]. Public choice theory explains how local governments prioritize short-term gains through tourism resource overexploitation, disregarding ecological carrying capacities. For example, in Egypt, although environmental regulations have been enacted to protect the sustainable development of the tourism industry, corruption and bureaucratic inefficiency have led to rent-seeking behavior by local government agencies, which has led to serious environmental damage in nature reserves and ecologically sensitive areas along the Red Sea coast [15]. Despite violating GSTC coral protection standards, Maldivian authorities maintain overwater villa construction to preserve high-end tourism revenue streams. On the whole, most countries or regions have carried out market governance of tourism based on the framework of institutional theory and regulatory theory and achieved certain results. Previous research and practice cases have fully proved the importance of regulatory governance for the sustainable development of the tourism economy.
According to the theory of economic base and superstructure, the economic base determines the superstructure, and the tourism economy has a decisive role in tourism governance [19]. The shape of the tourism economy shapes the framework of tourism governance, and the development and change in the tourism economy promote the upgrading of the tourism regulatory system. Therefore, it is also particularly important to explore the role and impact of the tourism economy on tourism regulatory governance. However, the focus of the existing research and practice cases tends to discuss the role of institutions, laws, policies, etc., on the development of the tourism economy from the perspective of regulatory governance, neglecting the impact of the tourism economy on tourism governance; for example, the impact of legal policies on national tourism budget allocation [20], the impact of the Tourism Law on the business performance of tourism-listed firms [21], and the moderating effect of the rule of law stabilization on the balance of payments in tourism [22]. Although the above studies have confirmed the positive role of necessary government intervention in regulating tourism market failures through quantitative modeling, the research perspectives are mostly unidirectional path studies of the role of regulatory governance on tourism economic development. To date, few studies have investigated the correlation, causation, and coordinated interaction between the tourism economy and tourism governance, despite the obvious mutual influence between the two. More studies have focused on the role of tourism governance in influencing the tourism economy [20,21,22], or discussing the tourism economy in relation to carbon emissions [23], the ecological environment [24,25], digital economy [26], urbanization [27], and other issues in terms of linkages and coordination mechanisms. There is a lack of scientific discussion on the linkage, two-way interaction, and coordination relationship between tourism economy and tourism governance.
In order to fill this research gap, this study adopts the research methods of economics and geography to explore the causal, interactive, and coordinated relationship between China’s tourism economic system and tourism governance system with a case site in China. To address these issues, first, this study establishes a comprehensive evaluation index system for the tourism economic system and tourism governance system. Second, the development level of TE-TG was evaluated by using the vertical and horizontal differentiation method, and geospatial visualization was analyzed by using ArcGIS. Third, the PVAR model was applied to test whether there is a causal relationship and dynamic association between the tourism economic system and the tourism governance system. Fourth, the degree of coordination between TE and TG was measured by the improved coupled coordination model, which was temporally and spatially presented using 3D kernel density estimation and spatial visualization software. The dynamic transfer probability of the degree of coordinated development of TE and TG was also predicted by combining the Markov model. This study aims to provide valuable insights and practical guidance for the high-quality, coordinated, and sustainable development of the tourism economic system and tourism governance system.
2. Theoretical Framework for Coordinated Interaction Between the Tourism Economic System and the Tourism Governance System
The Marxian base-superstructure dialectic posits that tourism market failures stem from dynamic imbalances between economic base resource allocation mechanisms and superstructural institutional responsiveness [19]. The tourism economic base fundamentally shapes governance system attributes, while the tourism governance system reciprocally adapts to economic development needs. The two form the spiral evolution relationship of “economic foundation determines the direction of governance-governance system feeds economic efficiency-dynamic adjustment realizes synergy”, which is the ultimate goal of the tourism economic system and tourism governance system (Figure 1).
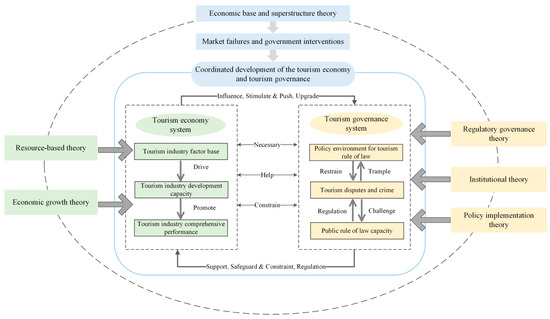
Figure 1.
Mechanism of coordination and interaction between TE and TG.
In the tourism economy system, the resource base theory and the economic growth theory believe that the tourism industry factors (human, capital, technology, etc.) can drive the development of the industry, thus promoting the significant improvement of the tourism economic performance [28,29]. Market actors’ profit-seeking behavior, compounded by tourism market imperfections (monopolistic competition, externalities, information asymmetries), frequently induces consumer rights violations and anti-competitive practices. These market distortions simultaneously challenge regulatory frameworks and stimulate iterative improvements in governance mechanisms and policy instruments.
In the tourism governance system, the regulatory theory proposes that the governance of the tourism market requires multiple proactive collaborations between government, business, and communities [6]. Therefore, the joint participation of government, tourism enterprises, and social citizens is the optimal governance to effectively regulate the order of economic transactions in the tourism market [16]. Effective governance systems necessitate institutional theory-informed policy design coupled with implementation science principles [11,17]. The national and governmental levels take the lead in formulating tourism economic laws, regulations, and policies (e.g., Tourism Law, Regulations on Travel Agencies, Interim Provisions on the Administration of Online Tourism Business Services, Regulations on the Administration of Tourist Guide Personnel, Regulations of the People’s Republic of China on Nature Reserves), as well as continuously revising and improving the formal system, and supervising the execution efficiency and implementation process at all levels of government. At the same time, it is necessary to enhance the moral concepts of the public and the awareness of the integrity of tourism enterprises, and to continuously strengthen the binding effect of the informal system. Ultimately, through the joint efforts of the government, society, and tourism enterprises, the curbing and regulation of the illegal and criminal situation in the tourism market can be realized, and the tourism market can be promoted to return to the path of order, fairness, and efficiency [16].
In summary, the tourism economic system and the tourism governance system are in a relationship of mutual demands, mutual assistance, and mutual constraints. Their interaction evolves through an institutional spiral: structural determination → adaptive response → regulatory reconfiguration. Under the role of government intervention, tourism economic development promotes the effective improvement of the tourism governance system, and tourism regulation and governance maintain the smooth operation of the tourism economy. The tourism regulatory system continuously adapts to the new needs of economic development, and the tourism economy develops healthily under the control of the regulatory system, forming a coordinated development pattern of the tourism economy and tourism regulation.
3. Research Design and Methodology
3.1. Research Design and Logical Ideas
To investigate the coordination relationship between the tourism economic system and tourism governance system, this study adopts a structured research framework (Figure 2): Problem Formulation → Mechanism Analysis → Description of the Current Situation → Empirical Investigation → Policy Implications.
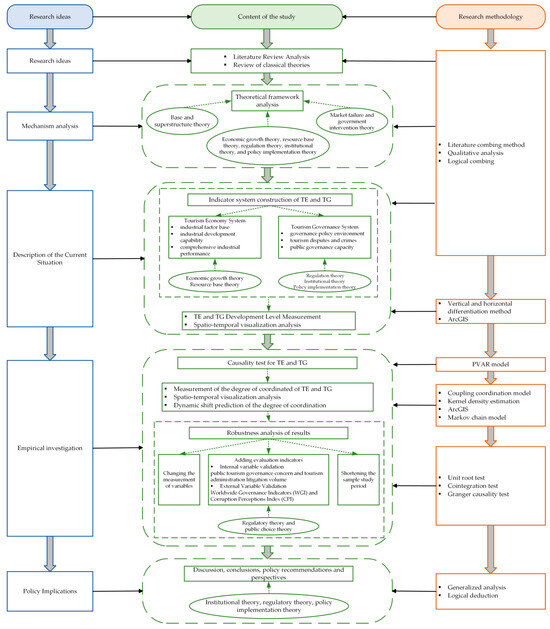
Figure 2.
Research ideas and methods.
First, we systematically review and analyze the literature addressing the core propositions of this study. We examine the current status of tourism market failures, analyze the application of existing governance theories to tourism economic development, and identify gaps in current research. Second, we elaborate on the theoretical framework and logical relationship between the coordinated development of the tourism economy system and the tourism governance system based on the base and superstructure theories, market failure, and government intervention theories. The roles played by economic growth theory, resource-based theory, regulation theory, institutional theory, and policy implementation theory in the tourism economic subsystem and tourism governance subsystem are specifically analyzed. Third, based on the above theoretical framework analysis, it guides the empirical model construction of this study. Resource-based theory and economic growth theory are applied to guide the model construction and variable selection of the tourism economy system. The evaluation model of the tourism governance system is constructed using regulation theory, institutional theory, and policy implementation theory. This lays the research foundation for the subsequent measurement of tourism economy level and tourism governance level. Fourth, employing the vertical and horizontal differentiation method, we quantitatively assess the development levels of the tourism economy and tourism governance. Using ArcGIS, we spatially visualize TE/TG levels across China’s 31 provincial regions, with substantive interpretation of distribution patterns. Fifth, we implement PVAR modeling, conducting sequential analyses including unit root tests, cointegration tests, Granger causality examinations, and impulse response simulations to validate TE-TG interactions. Sixth, applying a modified coupled coordination model, we quantify TE-TG synergy. Through MatlabR2023b-based 3D kernel density estimation and spatiotemporal visualization, we characterize their coordinated development dynamics, supplemented by spatial Markov modeling for transition probability analysis. Seventh, to ensure methodological rigor, we conduct robustness checks through the following: (1) adding evaluation indicators, (2) changing the measurement of variables, and (3) shortening the sample study period. In particular, the test method of adding evaluation indexes is subdivided into internal variable validation and external variable validation. The internal variable validation selected the public tourism governance concern, tourism administration litigation volume, and the external variable validation selected the Worldwide Governance Index (WGI) and the Corruption Perceptions Index (CPI). These four indicators were determined mainly based on regulation theory and public choice theory. Finally, according to the conclusions of the above theoretical analysis, current situation portrayal, and empirical research, under the guidance of theories such as institutional theory, regulation theory, and policy implementation theory, we propose targeted recommendations and policies for the coordinated development of the tourism economy and tourism governance.
3.2. Building the Indicator System
3.2.1. Tourism Economy System
Resource-based theory and economic growth theory point out that the resource elements of tourism can drive the development of the tourism industry, which in turn generates economic performance. The tourism economy system (TE) refers to the interpenetration and reorganization of resources, information, talents, technology, and other elements of the tourism industry to form a sustainable, dynamic, and complex system. Based on this, this study constructs the evaluation indexes of the tourism economic system from three dimensions, namely, industrial factor base, industrial development capability, and comprehensive industrial performance. Finally, 16 specific variables such as the number of tourism enterprises, the number of tourism employees, the tourism consumption capacity of residents, the number of tourists received, and the tourism income are identified as the measurement indicators (Table 1).

Table 1.
Evaluation indicator system of TE.
3.2.2. Tourism Governance System
Regulatory theory suggests that tourism governance requires the public participation of three main parties: the government, tourism operators, and citizens in the community. Institutional theory suggests that tourism governance requires both formal institutions (laws, departmental regulations) and informal institutions (morals, customs). The policy implementation theory suggests that tourism governance requires the cooperation of all levels of government to effectively implement policies and legal norms. Based on this, this study constructs the evaluation system of the tourism governance system from three levels, namely, governance policy environment, tourism disputes and crimes, and public governance capacity. Finally, 16 specific indicators such as tourism industry laws, tourism administrative regulations, departmental regulations, regional governance level, the number of litigation and disputes in tourism enterprises, and the regional public crime rate were selected as measurement variables (Table 2).
Table 2.
Evaluation indicator system of TG.
3.3. Methodology
3.3.1. Vertical and Horizontal Differentiation Method
The vertical and horizontal differentiation method is suitable for multidimensional data. This solves the problem of dynamic changes in cross-sectional data over time. Therefore, it applies to the dynamic evaluation of tourism economy development and tourism governance development. The main steps are as follows [41]:
(i) Standardized treatment of indicators. The indicators are set as , and an evaluation matrix is built based on time . To eliminate quantitative and unit differences between different indicators, is made dimensionless using the extreme variance method.
Positive indicator:
Negative indicator:
(ii) Establishment of a comprehensive evaluation function. The formula is as follows [41]:
where is the weight of the indicator .
(ⅲ) Calculating the composite assessment value. The variability between indicators was calculated using the following formula [41]:
where , is an order matrix, is a order symmetric matrix. This transforms the comprehensive evaluation function into a nonlinear planning problem: ,. When takes the eigenvector with the largest eigenvalue of the matrix , is maximal. Finally, the value of is substituted into to assess the evaluation value of TE and TG in different years in each province (municipality, autonomous region), which lays a foundation for the subsequent investigation of the degree of coordination.
3.3.2. Panel Vector Auto-Regression (PVAR) Model
The advantage of the PVAR model is that it is able to overcome the problem of heterogeneity, endogeneity, and homogeneity of variables. It is suitable for reflecting the dynamic relationships and influences between different systems. Therefore, the PVAR model was used to reveal the interactive response and causal relationship between TE and TG. Meanwhile, it is an important test step for the subsequent analysis of the coupled and coordinated development of TE and TG, and a prerequisite foundation for the subsequent analysis of the coupled coordination. The formula is as follows [42]:
where is a two-dimensional endogenous variable consisting of TE and TG. is the intercept term. is the lag order. is the parameter matrix for the lag order . is the individual fixed effect. is the time-fixed effect. is the random perturbation term.
3.3.3. Modified Coupling Coordination Model
A coupling coordination degree model was proposed to identify the multivariate coupling states between different systems. It is widely used in the economic, social, environmental, and other fields. The tourism economy subsystem is causally linked to the tourism governance subsystem, which is a coordinated development relationship that interacts and influences each other. Compared with the traditional regression model, this model breaks through the limitation of unidirectional causal analysis and is able to reveal the bidirectional dynamic role between systems. Therefore, it is suitable for the study of the coordinated development of TE and TG. It can be combined with time series data to capture the trajectory of changes in the coordination relationship. It can also reveal the spatial differentiation characteristics of coordination relationships in different regions. Compared with correlation analysis methods, it has the advantage of visualizing the data results. Compared with traditional econometric models, it has multi-indicator system compatibility and can handle complex systems containing multiple dimensions, such as social, ecological, and policy. However, the traditional coupled coordination model has limitations in terms of linear relationship assumptions. Its linear assumptions, static processing problems may affect the precision of the conclusions, and there is a problem of imbalance between reliability and validity. To improve the precision of the results, Zhang et al. [32] proposed a modified coupling coordination model. Therefore, the formula for measuring the degree of coupling ordination between TE and TG is as follows:
where D is the degree of coupling coordination, n is the number of subsystems, Ui is the measured value of the system, and is the coefficient of determination for the system. Considering previous studies and the present study’s context, the two subsystems of TE and TG are considered equally important. Therefore, this study considered and as 0.5 and 0.5, respectively. A uniform distribution function was employed to determine the type of coupling-coordinated development of TE and TG (Table 3).
Table 3.
Classification of the degree of coupling coordination and classification of development types.
3.3.4. Kernel Density Estimation
Kernel density estimation can reflect the tendency of elements to disperse and aggregate in a specific space and is widely used in the dynamic depiction of variables. Therefore, it is suitable for analyzing the characteristics of the temporal evolution of TE and TG coupling coordination. The formula is as follows [43]:
Where is the kernel density estimate, n is the number of provinces (municipalities and autonomous regions), H is the bandwidth, is the coupling coordination, and is the mean value of the coupling coordination.
A Gaussian kernel function was used for dynamic estimation. The formula is as follows [43]:
Kernel density estimates are strongly influenced by the bandwidth H. An optimal bandwidth exists for a Gaussian kernel function, for which Silverman [44] proposed an optimal-bandwidth calculation method. The formula is as follows [43]:
3.3.5. Markov Chain Model
- (1)
- Traditional Markov Chains
Markov chains are employed to determine the stochastic processes within discrete exponential sets in the temporal and spatial states. This study uses Markov chains to predict the dynamic transfer patterns and transfer probabilities of the degree of coordination between TE and TG. It should be noted that the Markov chain assumes that the state transfer probability does not change over time, but in reality, the transfer probability is often affected by external shocks (e.g., policy adjustments, technological innovations). Therefore, Markov models have contradictions between the underlying assumptions and the dynamic reality of change. For this reason, it is important to take such limitations into account when interpreting the forecasting results of Markov models.
According to the previous research base and industry experience [45], the 4-category mean value method is mostly used to classify the developmental states of tourism systems when making Markovian forecasts of tourism systems. The mean-value classification method is based on a probabilistic framework with a transparent classification process and a clear mathematical definition. It can extract the average characteristics of state transfer, and the calculation process is rigorous, which can more accurately describe the transfer probability of long-term trends. Compared with finer classification, the four-class mean can reduce the overlapping area of classification and improve the accuracy of the results by merging similar states. At the same time, the four-class average weakens the impact of local fluctuations on the overall classification by expanding the coverage of state intervals. Therefore, this study continues this categorization by classifying the degree of coupling and coordination between the tourism economy and tourism governance into four types. Types I, II, III, and IV denote low coupling, sub-low coupling, sub-high coupling, and high coupling, respectively. Transfers between different types at different times are represented by order matrices. The transfer probability was calculated using the following formula [45]:
where denotes the probability that the degree of coupling coordination is changed from type to type . denotes the number of provinces (municipalities and autonomous regions) that transferred from type to type . denotes the number of provinces (municipalities and autonomous regions) of type .
Based on the Markov transfer probability being smooth over time, the following formula is derived [45]:
where and are probability distributions at different moments. is the powers of the transfer probability matrix .
- (2)
- Spatial Markov Chains
Spatial Markov chains integrate the concept of “spatial lag” into traditional Markov chains. The coordinated development of TE and TG in these provinces (municipalities and autonomous regions) was not spatially independent. Therefore, it is necessary to investigate the transfer probability of the degree of coupling coordination between TE and TG under the spatial spillover effect. Based on the type of spatial lag, the traditional Markov matrix is divided into conditional transfer probability matrices of the order . Furthermore, it analyzes the probability of upward or downward transfer of the type of coupled coordination under different spatial constraints. The formula is as follows [45]:
where denotes the spatial lag operator. The is the degree of coupling coordination in a province . denotes the spatial weight between the province and province . A geographic neighborhood weight matrix was chosen.
3.4. Data Sources
The scope of this study is 31 provinces (municipalities directly under the central government and autonomous regions) in China (excluding Hong Kong, Macau, and Taiwan). The data for the 16 indicators of the tourism economy subsystem were obtained from the China Statistical Yearbook (2012–2021), the China Tourism Yearbook (2012–2021), and provincial national economic statistics bulletins and government websites. The data for the 16 indicators of the tourism governance subsystem were obtained from China Law Yearbook (2012–2021), China Rule of Law Yearbook (2012–2021), and official platforms such as China Judgement Network Database, Peking University Fabulous Database, National Database of Laws and Regulations, and National Database of Regulations. For some of the missing value data, the linear interpolation method of SPSS 26.0 software was used to supplement the data. For outlier data, the reasonableness was judged based on historical data, and the median or quartile method was applied to replace the outliers. Due to the excessive layers of Chinese statistical organizations (e.g., provinces, cities, districts, counties, streets, etc.), the chain of information transmission is lengthy and prone to data distortion or delay. For example, official statistics may have data quality problems such as deviations from statistical standards, classification errors, and unit conversion errors. In addition, considering the impact of COVID-19 on the tourism industry in recent years, the timeliness and robustness of the statistics have been affected to a certain extent. Therefore, in order to ensure the accuracy and reliability of the data, this study collects data released by the World Bank (https://www.worldbank.org/ (accessed on 10 September 2024)), Euromonitor International Database (https://www.euromonitor.com/ (accessed on 11 September 2024)), World Tourism Council (https://wttc.org/ (accessed on 11 September 2024)), and other platforms as a supplementary source of information. The above data were compared with China’s official statistics, and the cross-checking of data from multiple sources was used to address the shortcomings in the quality of official statistics.
4. Results
4.1. Analysis of the Temporal and Spatial Evolution of TE and TG
4.1.1. Characteristics of Temporal Distribution
In this study, Excel software was utilized to map the level of tourism economic development and tourism governance from 2012 to 2021 (Figure 3). From 2012 to 2019, policies such as the Outline for the Development of National Tourism and Leisure and the Tourism Development Plan for the 13th Five-Year Plan were promulgated one after another, and the development of the tourism industry was in good shape. The level of tourism economic development fluctuates from 0.0813 to 0.0998, an increase of 22.76%. In 2020, affected by the COVID-19 pandemic, tourism economic development suffered a “severe blow”, and the level of the economy declined rapidly [46,47]. In 2021, the tourism industry turned from a crisis to a safe place. In 2021, the tourism industry recovered from the crisis, and the tourism economy is gradually recovering and improving. By region, the TE level in the eastern region has been high and clearly ahead of other regions. The level of tourism economic development in the central region is in second place, significantly higher than the western and northeastern regions. The development level of the western and northeastern regions is relatively similar and significantly lower than that of the eastern and central regions. This phenomenon is the result of a combination of factors such as economic foundation, policy orientation, resource endowment, and market demand. For example, the state has set up special economic zones such as Shenzhen and Zhuhai in the eastern part of the country and introduced preferential policies such as tax exemptions for the tourism industry and the introduction of foreign capital. Jiangsu and Zhejiang collaborated with digital technology to create “a cell phone tour West Lake” intelligent tourism platform and “Zhouzhuang Ancient Town” digital tourism products. The central province of Henan has formulated a strategy to strengthen its cultural and tourism industry and set up a cultural and tourism industry development fund. The Yangtze River Economic Belt has launched a policy for the development of city clusters, which has facilitated the joint development of tourism resources and recreational products in cities such as Shanghai, Hangzhou, and Suzhou. In contrast, the western and northeastern regions are more backward in policy implementation and tourism product innovation, as well as having serious natural environmental constraints. For example, there is a serious imbalance in the distribution of funds for tourism poverty alleviation in the Western Development Strategy. Jilin Province, Changbai Mountain ski resort, and hot springs resources have not formed a synergistic effect; the unit price is only 1/3 of Japan’s Hokkaido. Tibet Naqu Alpine’s regional tourism development costs are four times that of the eastern coastal scenic area, and are suitable for excursions only six months a year. Kanas scenic area in Xinjiang relies heavily on ticket revenue, and the vacancy rate of the neighboring lodges reaches 80% in winter. Therefore, under the effect of multiple factors, there are significant regional differences in the level of tourism economy.
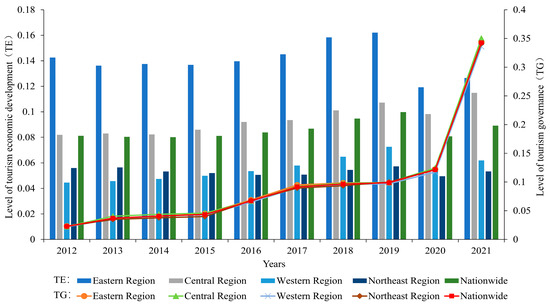
Figure 3.
Evaluation results of the TE level and TG level.
From 2012 to 2021, the level of tourism governance in China has gradually improved, showing a stable growth trend. This phenomenon is the result of the Chinese government’s efforts to promote institutional improvement, reform the governance system, and promote social co-governance. It reflects a concerted effort from top-level design to grassroots implementation. In 2009, China issued the Implementing Rules for the Regulations on Travel Agencies; in 2013, it enacted the Tourism Law of the People’s Republic of China and accompanying regulations; and in 2018, it implemented the “National Tourism Market Blacklist” system. Through the issuance of a series of laws, regulations, and policies, China’s tourism market has realized effective formal constraints at the institutional level. In 2018, China implemented reforms and functional integration of tourism management institutions. Cultural administration and tourism administration were merged, a move that ended the fragmented management model of the tourism industry in the past. This is the Chinese government’s reconstruction of the tourism regulatory system, and this governance system reform has realized the transformation of tourism regulation from “multiple management” to “collaborative governance.” In addition, in the process of tourism governance, the Chinese Government has fully integrated the regulatory theoretical framework to realize social co-governance and pluralistic participation in tourism governance. First, it has strengthened the role of industry associations. For example, the China National Tourism Association (CNTA) has issued the Code of Service for Online Tourism Platforms and has promoted the establishment of an “early compensation” mechanism by enterprises such as Ctrip and Flying Pig. Secondly, the public supervision mechanism has been brought into full play. The 12301 Tourism Service Hotline and the “Handy Shoot” reporting platform have been jointly realized. For example, in 2023, 17 cases were investigated and dealt with at the Huangshan Mountain Scenic Area through tourists’ reports, a decrease of 65% compared with 2019. Again, there is the implementation of the community benefit sharing model. For example, Fujian Tulou implemented the “scenic area + village collective + farmers” dividend mechanism, the villagers shifted from passive demolition and the removal of the change to active maintenance, and the destruction of cultural relics was reduced by 90%. As a result, the level of tourism governance in China has been steadily rising, thanks to the improvement of the system, the optimization of the regulatory system, and the common governance of society.
4.1.2. Characteristics of Spatial Distribution
This study employed ArcGIS 10.6 to visualize tourism economy (TE) and governance (TG) spatial distributions for 2012 and 2021 (Figure 4). Using Jenks’ natural breaks method, regions were classified into five TE/TG levels: high, sub-high, medium, sub-low, and low. The analysis revealed pronounced spatial differentiation in TE/TG levels.
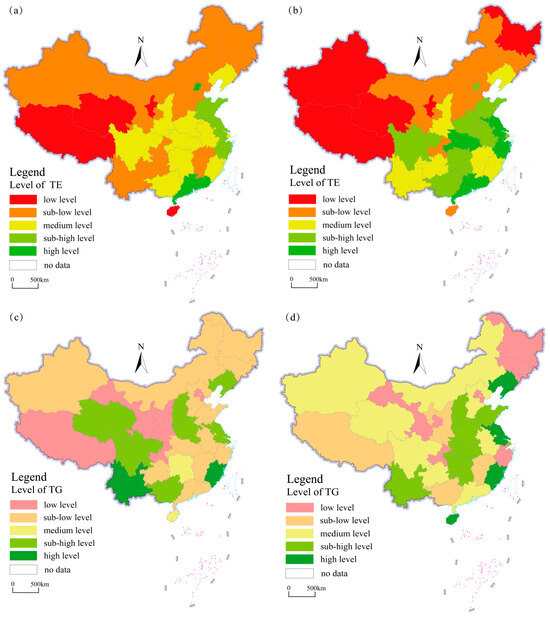
Figure 4.
Spatial distribution of TE level and TG level. (a) Level of development of tourism economy in 2012; (b) level of development of tourism economy in 2021; (c) level of tourism governance development in 2012; and (d) level of tourism governance development in 2021.
TE levels exhibited a coastal-inland gradient, decreasing from southeast to northwest. Southeastern coastal regions developed export-oriented economies, leveraging location advantages and policy benefits [48]. Affluent demographics generated robust tourism demand, accelerating TE growth. Conversely, northwestern regions faced slower TE growth due to policy neglect, economic constraints, and resource limitations. In 2012, high/sub-high TE regions were concentrated in Beijing, Guangdong, Jiangsu, Zhejiang, and Shandong. This clustering reflected synergies between economic bases, policy advantages, and innovative practices. For example, Beijing’s 2012 per capita tourism spending (¥4500) indicated strong market demand. Zhejiang’s 2012 high-end tourism initiatives boosted Qiandao Lake villa bookings by 35%. Foshan’s ceramic-themed industrial tourism attracted 800,000 visitors in 2012. Shandong’s agritourism policy drew 1.2 million visitors to the Shouguang Vegetable Expo, increasing local F&B revenue by 40%. Medium-level regions clustered east of the Hu Line (The Hu Huanyong Line is an important demarcation line for population density in Chinese geography. It is a straight line drawn roughly from the city of Heihe in Heilongjiang Province in the northeast of China to the city of Tengchong in Yunnan Province in the southwest of China, dividing the country into two regions: the southeast and the northwest. It is a key entry point for understanding China’s national conditions, resource allocation, and regional development strategies). Low/sub-low TE regions showed fragmented distributions across northwest, northeast, and southwest China. Northwest regions faced ecological constraints like Qinghai’s protected lagoons restricting commercial development. Northeast China struggled with industrial transitions and population decline, evidenced by Anshan’s unsuccessful industrial tourism conversion. Southwest China’s geographical barriers hindered development, as seen in Nujiang Grand Canyon’s inaccessible terrain lacking highway connections.
In 2021, there was a marked expansion of high-level and sub-high-level regions and a marked reduction in medium-level regions. The level of tourism economic development in the central and eastern regions increased significantly. This is because the eastern region is rich in tourism resources, the “siphon effect” is significant, and the level of tourism economy is in a dominant position in the country. At the same time, the tourism industry in the central region is developing rapidly, and the tourism economy is gaining momentum. For example, in 2021, Henan Province launched the “Da Song Night City” project, which increased the proportion of nighttime tourists from 30% to 65%, and the income of scenic spots increased by 120% year-on-year. Wuhan, Hubei Province, was approved to build a national cultural and tourism consumption demonstration city and issued 150 million yuan of cultural and tourism consumption vouchers, leading to rapid growth in tourism revenue in 2021. Hunan integrated Mao Zedong’s former residence, Yuelu Academy, and other red resources to create the “Xiang Gan red” tourism corridor. In 2021, it received more than 120 million tourists. On the other hand, the tourism economy in the western and northeastern regions is still at a low or sub-low level due to the scarcity of tourism resources and the closed geographical location. Overall, the level of tourism economic development in the area east of the Hu Huanyong Line has increased significantly. However, the level of tourism economic development in some areas west of the Hu Huanyong Line has a tendency to decrease.
In 2012, Yunnan and Fujian were regions with high levels of tourism governance, with their tourism industry governance management significantly ahead of other regions. The sub-high-level regions were scattered across Qinghai, Sichuan, Shanxi, Henan, and other regions. The medium-level region was Hunan. Low- and sub-low-level regions were distributed in patches across different regions. The reason for this is that Yunnan and Fujian rely on national strategies and continue to realize innovations in local governance. In 2009, the Chinese government issued the Opinions on Accelerating the Development of Tourism, which pushed localities to explore comprehensive tourism reforms. Yunnan, as one of the first pilot provinces, has been granted the authority to implement policies at an early stage and on a pilot basis. The Yunnan government is actively exploring new models for tourism market regulation and cross-border tourism. At the same time, in 2011, it put forward the strategy of “strengthening tourism province”, focusing on rectifying market disorder and implementing standardized management of scenic spots. The Fujian Provincial Government issued the “Fujian Provincial Tourism Regulations”, the first in the country to stipulate that “scenic spot ticket prices shall not be adjusted upward within three years”, to curb the chaos of the ticket economy. The Fujian tourism administration has promoted the innovation of social co-governance models. For example, in 2012, it implemented the “World Heritage Tulou Protective Dividend”, which directly allocates 20% of the ticket revenue to the residents of Tulou, and villagers participate in the daily management decision-making. In addition, Fujian has also implemented cross-sectoral comprehensive law enforcement reforms. For example, in 2011, the Wuyishan Tourism Comprehensive Law Enforcement Bureau was established, integrating the authority of seven departments, including culture and tourism, forestry, and market supervision, and investigating and dealing with 87 cases of “illegal tour guides”. As a result, Fujian and Yunnan are far ahead in terms of tourism governance, thanks to a series of joint efforts by the central government and local governments. However, other provinces (municipalities directly under the central government and autonomous regions) in China have lagged behind in tourism governance due to deviations in policy implementation, confusion over the powers and responsibilities of management departments, and failures in coordinated governance. For example, in Northeast China, fines and raids were implemented in order to rectify the chaos of the “black car” situation instead of establishing a network of car access, tourists, and transportation through supporting mechanisms, resulting in a 45% increase in the number of complaints about tourists stranded in the station during the winter peak season. Hainan Sanya encountered consumer fraud after the incident when attempting to carry out special rectification, but price transparency and other initiatives were non-institutionalized, resulting in the recurrence of similar problems. The southwestern part of the tourist city established a “tourism blacklist”, but did not include transportation, finance, and other departments, resulting in the same kind of complaints being repeated and a waste of governance resources.
In 2021, the high-level and sub-high-level regions of tourism governance shifted to the eastern and central parts of China. The original sub-low-level regions are mostly transformed into medium-level regions. Low-level and sub-low-level regions are significantly reduced, mainly in the western and northeastern regions. This change stems from both the overall deployment of China’s national strategy and the systematic upgrading of local governance capacity. First, the Chinese government has implemented a coordinated regional development strategy for tourism governance. For example, Shanghai, Jiangsu, Zhejiang, and Anhui jointly issued the Special Plan for Culture and Tourism in the Yangtze River Delta Eco-Green Integrated Development Demonstration Zone, which opened up a mechanism for inter-provincial tourism complaint handling. The time limit for handling tourism complaints in the Yangtze River Delta region has been shortened to 24 h, and the cross-regional dispute resolution rate has been raised to 95%. Second, local governments have implemented cross-sectoral comprehensive law enforcement reforms. For example, Hubei Province has established a comprehensive law enforcement bureau for the culture and tourism market, which integrates the law enforcement powers of culture, tourism, and cultural relics. The Wudang Mountain Scenic Area has investigated and dealt with 63 cases of “black tour guides” through joint law enforcement. Guangdong Province's online construction data sharing platform, through public security, transportation, market supervision, and 12 other departments' data, provided the scenic area passenger overload automatic warning. Again, local governments have innovated ways to regulate tourism credit. For example, Zhejiang Province has implemented the “tourism credit code”, which allows tourists to scan the code to check the credit rating of merchants. Complaints from merchants in Hangzhou’s West Lake’s scenic area have dropped by 47%, and more than 90% of the merchants have been awarded “excellent credit ratings.” However, the western and northeastern regions have a low level of tourism governance due to a combination of loose regulatory mechanisms, institutional management deficiencies, and insufficient law enforcement capacity. For example, Qinghai Lake’s scenic area involves environmental protection, culture and tourism, agriculture and animal husbandry, and other multi-departmental forms of management, but the lake highway’s private toll had gone a long time without anyone solving its problems, until the CCTV channel exposure after the establishment of a temporary joint law enforcement group; however, half a year had passed after the recurrence of the chaos. A scenic spot in Xinjiang illegally constructed a sightseeing cable car in the protected area, which was dismantled after being notified by the central environmental protection inspectors. Ski resorts in Heilongjiang were included in the “tourism blacklist” for failing to meet safety standards, but they did not link up with the financial and transportation systems and continued to operate illegally after changing legal persons. As a result, there are significant spatial differences in the level of tourism governance between the eastern, central, western, and northeastern regions.
4.2. Analysis of Causal Interactions Between TE and TG
This study assumes that there is an interactive and causal relationship between the tourism economic system and the tourism governance system, and that they are constantly coupled and coordinated, and interact with each other. The basic assumption of the coupled coordination model is that there are mutual influences and interrelationships between different systems, rather than complete independence. The PVAR model testing mechanism can determine whether there are dependencies and causal interactions between different systems. Therefore, before exploring the degree of coupling and coordination between the tourism economy and tourism governance, it is necessary to test whether there are correlations and interactions between TE and TG. This is an important testing step for the subsequent exploration of the coordination between TE and TG. Consequently, in order to verify whether the data meet the underlying hypotheses, this study carries out the PVAR test on TE and TG before conducting the coupled coordination analysis. The test results are as follows.
4.2.1. Variable Stability Test
Before the causality test, the variable data need to be tested for smoothness. The PVAR model can be constructed only if the data are smooth. The homogeneous unit root LLC test and heterogeneous unit root IPS test methods take into account many factors, such as the time trend of the data, interception, heteroskedasticity, and the problem of the sequence of disturbance terms. The test conditions are stringent and can effectively avoid the pseudo-regression phenomenon caused by data non-stationarity. They are suitable for the smoothness test of panel data. Therefore, they are selected to conduct a unit root test on the tourism economic level (TE) and tourism governance level (TG). The results show (Table 4) that both variables reject the original hypothesis of unit root at a 1% significance level, indicating that the variables are smooth and can be analyzed subsequently.
Table 4.
Unit root smoothness test.
4.2.2. Optimal Lag Order Selection and Cointegration Test
The selection of the lag order is crucial for the model setting and accuracy. The Akaike Information Criterion (AIC), Bayesian Information Criterion (BIC), and Hannan-Quinn Information Criterion (HQIC) are effective in identifying the optimal lag order of the model. When the statistic takes the smallest value, its corresponding lag order works best. Therefore, it is comprehensively applied to select the optimal lag order of the model. The results show (Table 5) that the optimal lag orders of AIC, BIC, and HQIC are all two, so the lag order of the PVAR model is set as two.
Table 5.
Results of lag order selection for PVAR panel.
Cointegration test can consider the long-term equilibrium relationship between variables, and Kao test, Pedroni test, and Westerlund test are suitable for cointegration analysis of homogeneous and heterogeneous panel data, which have the advantages of strong adaptability and wide compatibility of data. Therefore, the above tests are chosen to analyze the cointegration relationship between the two variables, and the results are shown in Table 6. The statistics of all test terms pass the test at a 1% and 5% significance level, respectively. Therefore, the original hypothesis that there is no cointegration relationship is rejected. This indicates that there is a long-term equilibrium relationship between tourism economic development and tourism governance, and the next test of causality can be conducted.
Table 6.
Results of the cointegration testing.
4.2.3. Granger Causality Test
The Granger causality test is able to identify whether there is a causal relationship between variables and is applicable to the determination of the causal relationship between tourism economic development and tourism governance. The test results (Table 7) show that the original hypotheses are rejected at the 1% significance level. It indicates that tourism economic development and tourism governance are Granger causal to each other. Tourism economic development can affect tourism governance to a certain extent, tourism governance also has an impact on tourism economy, and there is a causal association between the two. In conclusion, there is a long-term correlation between the tourism economic system and the tourism governance system, and the two are causally related to each other. This conclusion confirms the previous analysis and hypothesis on the causal interaction mechanism between tourism economy and tourism governance. Therefore, the harmonization of TE and TG can be further explored.
Table 7.
Granger causality testing results.
4.2.4. Impulse Response Analysis
Impulse response analysis can further reveal the dynamic interaction between TE and TG. It can reveal the conduction paths and time characteristics of the mutual impacts of the tourism economic system and the tourism governance system. ① The impact of tourism economic development on tourism governance tends to be close to 0 in the initial period (Figure 5a) and thereafter shows a positive impact state. However, it turns into a negative impact in the 4th period. The reason for this is that the tourism industry has a fast renewal rate, and new business forms keep emerging. This characteristic promotes the efficient operation of the tourism economy and also leads to the uneven quality of the tourism market. For example, price manipulation by tourism e-commerce platforms, “unreasonably low-price tours” by travel agencies, and infringement of intellectual property rights in digital tourism are among the many industry irregularities. Conflicts of interest among tourism consumers, operators, and practitioners have intensified, seriously impacting the regulatory order of the tourism market. ② The impact of tourism governance on tourism economic development is negative in the initial period (Figure 5b). With the increase in the number of lag periods, the positive shock is revealed and expands. This may be due to the fact that, at the initial stage, there are problems of inappropriate articulation, jurisdictional conflicts, and contradictions of rank in the tourism governance system and regulatory policies. This inhibited the rapid development of the tourism economy to a certain extent. Since then, the regulatory mechanism of the tourism market has been continuously improved, effectively curbing the ills of tourism market failure and illegal operation. The tourism governance system has continuously adapted to the new tourism market problems and formed a stable promotion and support situation for the development of the tourism economy. Similarly, this conclusion also confirms the previous analysis of the interaction mechanism between the tourism economy and tourism governance. Based on this, the coupled coordination model can be further applied to explore the coordinated development of TE and TG.

Figure 5.
Impulse response analysis of TE and TG.
4.3. Analysis of the Coordinated Development of TE and TG
4.3.1. Characteristics of Temporal Evolution
This study employed MatlabR2021b to depict the distribution of kernel density estimates of the coupled coordination of tourism economy and tourism governance. The temporal evolution of the degree of coordination between TE and TG from 2012 to 2021 is shown in Figure 6. ① Regarding the position of the center point of the curve, at the beginning of the study, the center was clustered on the left side, which gradually shifted to the right side. This illustrates that the level of coupling coordination between TE and TG in most regions showed a yearly improvement. The increase in the level of coordinated development of TE and TG is essentially the result of the combined effect of policy innovation, governance practices, and economic demand. The Tourism Law of the People’s Republic of China was implemented in 2013, regulating the tourism market for the first time in the form of a law, clarifying the protection of the rights and interests of tourists, the norms of travel agency operation, and other core contents. Since then, the Tourism Law has been revised twice in 2016 and 2018, gradually adapting to the needs of the emerging industry. For online tourism platforms, the Ministry of Culture and Tourism has issued the Interim Provisions on the Administration of Online Tourism Business Services to regulate the misuse of data, false propaganda, and violation of consumer privacy by OTA companies. ② In terms of crest height and curve width, the crest heights of TE and TG coupling coordination degrees fluctuate upward, and the bandwidth shows a slightly increasing trend. This revealed that there were still some gaps in the degree of coordination between TE and TG in the different regions. This is mainly due to differences in resource endowment and governance capacity. For example, local governments in the east focus more on the optimization of the business environment and enhancing the effectiveness of the tourism economy and regulatory governance through institutionalization (e.g., the establishment of tourism circuit courts). However, the weak economic foundation, backward governance concepts, and limited regulatory resources in the central and western regions constrain the coordinated development of TE and TG. ③ In terms of the number of wave crests, from 2012 to 2016, a predominantly bimodal pattern was observed, with both peak and sub-peak values occurring in the low-level region. This indicates that there was some polarization in the degree of coupling coordination between TE and TG in different regions. From 2017 to 2021, it changed mainly towards a multi-peak pattern, with a gradual widening of the peak-value gap. This suggests that the level of coordinated development of TE and TG in different regions showed a multipolar trend. ④ In terms of curve extensibility, the curves tended to trail off to the left and right over the study period. The left trailing tail shortened and thinned each year, whereas the right trailing tail extended and grew in height every year. This suggests that TE and TG had fewer regions with a low level of coordination and progressively more regions with a high level of coordination. The reason for this was the in-depth implementation of the strategy of Strategy for Coordinated Regional Development and Overall Law-based Governance. The tourism resources of different regions were integrated, and the tourism industries promoted each other. Tourism market regulation was interlinked, and Tourism Law enforcement was mutually cooperative. The invisible division of resources, markets, regulations, and governance was gradually eliminated. The level of coordination between TE and TG progressively increased, with regional differences gradually narrowing. This is mainly due to the fact that various regions continue to innovate the model of tourism governance and improve the regulatory mechanism of the tourism market. In balancing tourism economic development and tourism governance, the vitality of the tourism industry has been safeguarded, while consumer rights and industry norms have been maintained. For example, local governments have implemented governance programs such as legal literacy in scenic spots, legal literacy in enterprises, and circuit courts in tourist attractions. The market order has been regulated through strict law enforcement, and the tourism business environment has been optimized. As a result, the level of coordination between TE and TG has been increasing day by day, and regional differences have gradually converged.

Figure 6.
Dynamic evolution of the coupling coordination degree between TE and TG.
4.3.2. Characteristics of Spatial Evolution
ArcGIS 10.6 was adopted in this study to map the spatial distribution of the coordinated development of the tourism economy and tourism governance. The spatial evolution of the degree of coupling coordination between TE and TG in 2012, 2015, 2018, and 2021 is shown in Figure 7. Overall, there was a good coupling coordination trend between TE and TG. Most provinces (municipalities and autonomous regions) were gradually changed from a state of imbalance to a state of coordination. In 2012, all provinces (municipalities and autonomous regions) were in a state of imbalance, with Qinghai, Tibet, Gansu, and Chongqing even in a state of severe imbalance. The development of TE and TG is in a state of high mismatch. This is mainly due to the fact that the growth of tourism consumption in China at this stage relies mainly on an increase in the number of tourists. Travel agencies, in an effort to compete for customers, adopted a low-price competition strategy, which led to a decline in service quality and the problem of compulsory consumption. Meanwhile, in 2012, China had not yet introduced the Tourism Law, and relied mainly on administrative regulations and local regulations, with a low legal level and poor governance. Qinghai, Tibet, Gansu, and other places even suffer from an insufficient Tourism Law enforcement force, lack of professional talents, single tourism product, and vicious competition in the tourism market. Therefore, under the above factors, China’s TE and TG are in a state of total dissonance.
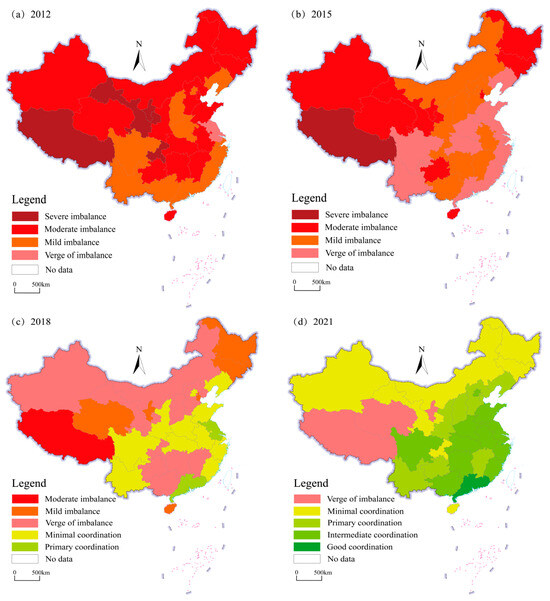
Figure 7.
Distribution of the degree of coupling coordination between TE and TG. (a) Level of TE-TG coupling coordination in 2012; (b) level of TE-TG coupling coordination in 2015; (c) level of TE-TG coupling coordination in 2018; and (d) level of TE-TG coupling coordination in 2021.
In 2015, there was a slight improvement in the imbalance, with only Tibet remaining in a severely imbalanced region. Moderately imbalanced regions are concentrated in the western and northeastern regions. Mildly imbalanced regions are patchily distributed in North China and the Yangtze River Basin. The regions of verging imbalance were gradually expanding along the east of the Hu Line. This is due to the fact that the eastern region took the lead in completing the revision of local regulations after the implementation of the Tourism Law. For example, Hainan has implemented comprehensive regulations for the tourism market in accordance with the Tourism Law and has cracked down on illegal behaviors such as ripping off tourists. Shanghai, Beijing, and other places, through the combination of credit supervision and special law enforcement, established the “red and black list” system. Zhejiang also piloted the “1 + 3 + N” comprehensive tourism supervision mechanism (tourism police + industry and commerce tourism branch + circuit court). Compared with the western and northeastern regions, the eastern region has more adequate legal and law enforcement resources and more innovative law enforcement mechanisms, which can create a better environment for the coordinated development of the tourism economy and tourism governance.
In 2018, severely imbalanced regions disappeared, leaving only Tibet as a moderately imbalanced region. Mild-imbalance and verging-imbalance provinces (municipalities and autonomous regions) were distributed in the region west of the Hu Line, as well as at the junction of southwest China, southern China, and central China. Most regions east of the Hu Line are transformed into a state of minimal coordination. It is noteworthy that Jiangsu and Guangdong exhibited primary coordination. This is mainly due to the fact that the two provinces have taken the lead in completing local legislative support under the framework of the Tourism Law. For example, Guangdong passed the Guangdong Provincial Tourism Regulations as early as 2014, strengthening rules on market access, contract regulation, and scenic area carrying capacity. Jiangsu, on the other hand, amended the Jiangsu Provincial Tourism Regulations to refine provisions on the protection of tourism resources and service quality standards. These regulations provide a clear basis for market regulation and reduce illegal operations in the tourism market. In addition, the two provinces have actively participated in the collaborative legislation on tourism in the Yangtze River Delta and Pearl River Delta. For example, Jiangsu and Zhejiang signed the Suzhou-Zhejiang-Wanzhou Tourism Cooperation Agreement in 2018 to unify market supervision standards and combat cross-regional “low-priced tours”, providing experience for the national collaborative governance of tourism. Thanks to the efforts of local governments, Jiangsu and Guangdong are ahead of other regions in terms of the level of coordination between the tourism economy and tourism governance.
In 2021, the TE and TG imbalance situation was significantly better, with only Tibet, Qinghai, and Ningxia on the verge of an imbalance. Guangdong transformed into a state of good coordination. The primary coordination regions were Xinjiang, Gansu, Inner Mongolia, Heilongjiang, Jilin, Chongqing, and Hainan. The regions of good coordination and intermediate coordination were distributed along the east side of the Hu Line. The reason for this is that the eastern and central regions have earlier emphasized the role of regulation and governance in safeguarding the tourism industry. For example, the Yangtze River Delta and Pearl River Delta regions took the lead in establishing a regional coordinated regulatory mechanism in 2014, forming a law enforcement model linking passenger sources and destinations. Zhejiang and Guangxi, on the other hand, adopted local regulations on tourism earlier. Regions such as Hainan, Sichuan, and Hunan have earlier explored comprehensive law enforcement models, such as the establishment of tourism police and circuit courts. In contrast, tourism governance and regulatory systems in the western and northeastern regions are lagging behind. For example, although the tourism coordination legislation in the three northeastern provinces has been implemented, the relevant supporting measures (such as the revision of local tourism regulations) are still in progress. In addition, the eastern region has formed a “judicial + administrative + social” model of multi-dimensional co-rule. Industry associations, tourism enterprises, and other social forces are actively involved in tourism governance and have taken the initiative to adapt to the requirements of governance. On the other hand, the western and northeastern regions are still dominated by the government, and there are problems such as weak law enforcement, a lack of professional talent, and insufficient synergy. As a result, these lead to inefficient synergies between the tourism economy and tourism governance.
4.3.3. Characteristics of Coupling Coordination Types
The types of coupling coordination between TE and TG were classified into three categories: TE lag, TE-TG synchronization, and TG lag (Table 8). In general, tourism governance is lagging behind the development of the tourism economy in most regions, and the phenomenon of lagging tourism regulation and governance is widespread. This reflects the fact that most provinces have not achieved synergistic development between tourism governance and the tourism economy. This is because the update of the tourism governance system lags behind the speed of market innovation. The rapid iteration of the tourism economy has given rise to new business models (e.g., Netflix attractions, B&B economy), but the relevant laws often take a long time to research and revise. For example, Enshi Prefecture in Hubei Province, a tourism hotspot for karst landscapes, only introduced a “tourism police” system in 2024. Prior to that, the lack of a dedicated enforcement mechanism left tourist complaints and safety hazards unresolved for a long time. China’s tourism industry also suffers from a mismatch between grassroots governance capacity and the size of the tourism economy. For example, rural tourism has grown explosively, but there are serious deficiencies in rural grassroots governance. In addition, local protectionism exists in some areas, which lowers the entry threshold for tourism enterprises or relaxes the regulation of the tourism market in pursuit of short-term economic benefits. For example, Jiuzhaigou in Aba Prefecture, Sichuan Province, had ecological problems caused by over-development in the early days, and it was not until after 2017 that ecological protection law enforcement was strengthened through tourism police and circuit courts. Furthermore, the tourism industry chain involves multiple sectors, such as transportation, environmental protection, and culture, and the intersection of powers and responsibilities can easily lead to blind spots in governance. For example, the Jianghan Plain is an important aquatic tourism area, but the environmental protection department and the tourism sector regulatory standards are not unified, resulting in the river chief system being implemented intensively during tourism development with minimal effect. In summary, the level of tourism governance is lagging behind the speed of tourism economic development due to multiple factors such as the system updating cycle, the game of interests, and coordination mechanisms.
Table 8.
Types of coordinated development between TE and TG.
4.3.4. Markov Analysis of Coupled Coordination Types
Traditional Markov Analysis
Markov chains were employed to further predict the development trends of TE and TG coupling coordination in China. We utilized MatlabR2021b to calculate the Markov probability transfer for the degree of TE-TG coordinated development. The degree of coupling coordination was classified into four categories, based on the traditional Markov chain approach: low-coupling type (I), below 50% of the regional mean of coupling coordination; sub-low-coupling type (II), between 50% and 100% of the regional mean; sub-high-coupling type (III), between 100% and 150% of the regional mean; and high-coupling type (IV), above 150% of the regional mean. The traditional Markov probability transfer matrix is presented in Table 9.
Table 9.
Traditional Markov probability transfer matrix.
The transfer probability on the main diagonal was significantly greater than that on the non-diagonal transfer probability. This suggests that the rank state of TE and TG coupling coordination was stable across the regions. The probability of maintaining the original state at t + 1 year was 33.33%, 79.19%, 83.33%, and 100%. The stability was weak in the low-value regions. There was also a tendency to solidify the degree of coordination in sub-low-value regions, sub-high-value regions, and high-value regions, with a clear club convergence characteristic, and coupling coordination situations had a certain path dependence. In terms of the type of transfer on non-diagonal lines, the transfer probability of the type on the upper-right side of the diagonal was higher than that on the lower-left side. This implies that the transfer probability from low-value regions to high-value regions is greater than that from high-value to low-value regions, corroborating the previous finding that coupling coordination increases from year to year. Rank shifts all occurred between neighboring types, indicating that the coupling coordination development of TE and TG was continuous and gradual. It was also difficult to achieve a leapfrog transfer. However, this study assumes that the transfer probability of the Markov model is fixed and ignores the dynamic effects of external shocks (e.g., policy interventions, unforeseen events) on the coordination mechanism between TE and TG. Therefore, the results of the study are predictions of the transfer probability of coordinated development in a rational and stable situation.
Spatial Markov Analysis
Spatial Markov chains were able to take the spatial lag factor into account compared to traditional Markov chains. The effect of the TE-TG coupling coordination degree in neighboring regions on native regions was investigated. The results are summarized in Table 10. The Markov transfer probability matrix, considering the “spatial lag” factor, was significantly different from the traditional Markov transfer probability matrix. This indicates that the degree of coupling coordination between TE and TG was influenced by spatial factors. There were varying effects of different lag types, which had varying effects on the same rank state. For example, when the spatial lag was of the low-coupling type, the probability of Type II maintaining its stability was 100%. When the spatial lag was of the sub-low-coupling type, the probability of type II maintaining stability was 85%, and the probability of transferring upward was 15%. When the spatial lag was of the sub-high-coupling type, the probability of Type II maintaining stability was 51.85%, and the probability of transferring upward increased to 48.15%. The same lag type had different effects on different rank states. For example, when the spatial lag was of the sub-high coupling type, the probabilities of Types II, III, and IV maintaining stability were 51.85%, 80.23%, and 100%, respectively. The probabilities of upward transfer for Types II and III were 48.15% and 18.60%, respectively. This demonstrates that the transfer probability is not only related to the lag type but is also influenced by the initial rank of the TE-TG coupling coordination state. Compared to the traditional Markov model, although the spatial Markov chain examines the influence of geospatial factors on the transfer probability, it is still insufficient for the consideration of factors such as policy, technology, and capital. Therefore, it is important to dialectically analyze the dynamics and comprehensiveness of the research results.
Table 10.
Spatial Markov probability transfer matrix.
4.4. Robustness Analysis
4.4.1. Adding Evaluation Indicators
Internal Variable Validation
In the robustness test, two indicators of the tourism governance system, namely, public tourism governance concern and tourism administration litigation volume, were added. The regulation theory proposes that tourism governance requires community citizen participation to fully utilize the public’s role of monitoring and cooperation. Therefore, this study takes public tourism governance concerns into consideration. The public tourism governance concern is derived from the Baidu Index. The Baidu Index is a data analysis platform based on Baidu’s massive netizen behavioral data (e.g., searching, clicking, sharing). It aims to quantitatively reflect the user attention and social concern of keywords, providing an objective basis for researching social hotspots and market demand. By analyzing the search frequency of keywords (weighted calculation, multiple searches are weighted differently), it can reflect the public’s active attention to specific topics. In this study, “tourism governance” and “tourism regulation” were used as search terms. The search period from 1 January 2012 to 31 December 2021 was taken as the search period. Data were captured by Python 3.8.10 technology (search behavior includes PC and mobile). The overall annual average value of the search index in 31 provinces (municipalities and autonomous regions) in China was counted, and the public tourism governance concern index was finally formed. The number of tourism administrative management litigation is obtained from the database of Beida Faber (https://www.pkulaw.com/ (accessed on 14 September 2024)), the World Tourism Council (https://wttc.org/ (accessed on 14 September 2024)), and other platforms. Tourism administrative litigation refers to judicial litigation filed with the people’s court in accordance with the law when tourists, tourism enterprises, and other subjects believe that the administrative acts of tourism and administrative departments (e.g., the Bureau of Culture and Tourism, the market supervision agency, etc.) infringe on their legitimate rights and interests. Public choice theory proposes that government administrations may make administrative decisions based on departmental interests or personal interests (e.g., lowering complaint rates, reducing administrative costs). For example, in the supervision of the tourism market, administrative authorities may enforce the law selectively: they strictly investigate and deal with issues such as high price rebates and safety of scenic spots, which are prone to public opinion pressure, while taking a passive approach to hidden issues such as ambiguous contract terms and defective service quality. This management style has led to the failure to effectively curb the illegal behavior of tourism enterprises, harming the rights and interests of tourists and giving rise to tourism administrative litigation. This indicator reflects the governance level and credibility of the tourism administration. Therefore, it is included in the tourism governance evaluation index for testing.
The results of the robustness tests show that TE and TG pass the unit root test at the 1% significance level, and the two variables are smooth (Table 11). It passes the Kao test, Pedroni test, and Westerlund test at lag 1 order, indicating that TE and TG have a long-term mutual influence relationship (Table 12 and Table 13). The Granger causality test at a 1% significance level proves that there is an interactive association and causality between the two (Table 14). Therefore, it confirms the high stability of the findings of this paper.
Table 11.
Unit root test—adding evaluation indicators (internal variable validation).
Table 12.
Selection of the lag order—adding evaluation indicators (internal variable validation).
Table 13.
Cointegration test—adding evaluation indicators (internal variable validation).
Table 14.
Granger causality test—adding evaluation indicators (internal variable validation).
External Variable Validation
External variable validation refers to the use of third-party data independent of the original research data set to test the robustness of the research findings. Since the variable data utilized in this study are derived from China’s internal official statistical bulletins or statistical platforms, there is a lack of effective external source data testing. Therefore, in order to ensure the reliability and accuracy of the research conclusions, this study selects the independent source data from the Worldwide Governance Indicators (WGI) and Corruption Perceptions Index (CPI) for the robustness verification of external variables. The independent data come from the integration of multi-source information from third-party institutions or academic teams, which effectively avoids the subjective tendency of a single institution. They focus on core topics of governance (e.g., rule of law, corruption control) and reflect real-time changes through dynamic updates. However, China’s domestic statistics are dominated by the official administrative system, which relies on hierarchical government collection. It has limited disclosure on sensitive issues (e.g., corruption, governance effectiveness) and insufficient dynamic monitoring of governance effectiveness. In addition, independent data discloses data collection methods, analytical models, and data credibility. Some of the rules of China’s domestic statistics are not fully disclosed, making public validation more difficult. Therefore, independent data have greater advantages in terms of data sources, methodological transparency, and verifiability, and can make up for the shortcomings of official statistics.
The Worldwide Governance Index (WGI) and the Corruption Perceptions Index (CPI) were selected for this study mainly on the basis of the regulation theory and the public choice theory. Regulation theory emphasizes the central position of government in regional governance. The Worldwide Governance Index (WGI) issued by the World Bank is a comprehensive measure of the effectiveness of regional government governance. It is able to systematically reflect regional tourism governance effectiveness by assessing the comprehensive performance of regions in six dimensions: rule of law level, corruption control, government effectiveness, regulatory quality, political stability, and public participation. Therefore, this study incorporates the Worldwide Governance Index (WGI) into the tourism governance evaluation system as an important external test variable. The Corruption Perception Index (CPI) is a global corruption perception assessment data published by the non-governmental organization Transparency International. It is a core indicator of the degree of integrity of regional public administrations and can reflect the effectiveness of governmental tourism governance. Public choice theory proposes that tourism governance needs to quantify the degree of standardization in the operation of government power, which in turn reveals the risk of corruption in tourism resource allocation, policy implementation, and market supervision. Transparency International’s Corruption Perceptions Index (CPI) is an effective indicator of the government’s governance of corrupt behavior, so it is included as an important external variable in the tourism governance evaluation system.
The results of the robustness test show (Table 15) that TE and TG reject the original hypothesis at a 1% significance level and pass the unit root test for LLC and IPS. This proves that the two variables are smooth. According to the AIC, BIC, and HQIC criteria (Table 16), the lag order of the model was determined to be first order. Variables were tested by Kao test, Pedroni test, and Westerlund test at 10%, 5%, and 1% significance levels (Table 17), which proved that TE and TG have an interactive long-term relationship. The variables rejected the original hypothesis at 10% and 1% significance levels and proved that TE and TG have a causal interaction by the Granger causality test (Table 18). Therefore, this study passed the robustness test of external independent data and proved the reliability and accuracy of the findings.
Table 15.
Unit root test—adding evaluation indicators (external variable validation).
Table 16.
Selection of the lag order—adding evaluation indicators (external variable validation).
Table 17.
Cointegration test—adding evaluation indicators (external variable validation).
Table 18.
Granger causality test—adding evaluation indicators (external variable validation).
4.4.2. Changing the Measurement of Variables
In order to further test the stability of the research results, this study replaces the comprehensive evaluation method of the variable TE and TG indicator system. The entropy weight TOPSIS model is used to measure the level of tourism economic development and tourism governance. The essence of the entropy weight TOPSIS method is to improve the TOPSIS evaluation method by applying the entropy weight method. Firstly, the entropy weight method is used to determine the weight of each evaluation index. Then, the TOPSIS method is used to rank the results of the evaluation object. On the basis of effectively eliminating the influence of subjective factors on the evaluation results, the contrast between the evaluation indicators is systematically and comprehensively reflected, and a more reasonable evaluation result can finally be obtained. The results of the robustness test show that TE and TG reject the original hypothesis at the 1% significance level, pass the unit root test, and the variables are smooth (Table 19). The Kao test, Pedroni test, and Westerlund test at 1% and 10% confidence levels indicate that TE and TG have a long and stable dependence relationship (Table 20 and Table 21). The original hypothesis is rejected at a 1% significance level, and the Granger causality test indicates that TE and TG have an interactive relationship and causal association (Table 22). The findings of the study are consistent with the initial empirical results, proving the stability of the findings.
Table 19.
Unit root test—changing the measurement of variables.
Table 20.
Selection of the lag order—changing the measurement of variables.
Table 21.
Cointegration test—changing the measurement of variables.
Table 22.
Granger causality test—changing the measurement of variables.
4.4.3. Shortening the Sample Study Period
Considering that COVID-19 has a large impact on the development of China’s tourism industry, the sample time period of the study was shortened to 2012–2019 in order to exclude its interference with the results of the study. The test results show that TE and TG variables are smooth and better pass the three types of cointegration tests (Table 23, Table 24 and Table 25). There is an interdependence between the tourism economic system and the tourism governance system. Both pass the Granger test at a 1% significance level (Table 26). This indicates that TE and TG are causally related to each other and have mutual influence. The conclusion of the robustness test further validates the high stability of the previous findings.
Table 23.
Unit root test—shortening the sample study period.
Table 24.
Selection of the lag order—shortening the sample study period.
Table 25.
Cointegration test–shortening the sample study period.
Table 26.
Granger causality test—shortening the sample study period.
5. Discussion
Taking 31 provinces (municipalities and autonomous regions) in China as case sites, this study explores the development level and coordination interactions between TE and TG in these regions from 2012 to 2021. The research methods include vertical and horizontal differentiation methods, the PVAR model, and the coupled coordination model. The results of the study reveal the time and space change rules of the coordinated development of TE and TG. The main conclusions and findings are as follows.
The empirical results show that the level of tourism governance in China has steadily increased from 2012 to 2021. The conclusion of this study is a continuation of previous research results [1,14], which confirms the improvement of China’s tourism governance capacity and governance level with data. It makes up for the shortcomings of previous studies that have insufficient data support and empirical tests. The favorable development trend of tourism governance in China is due to the good application of institutional theory and policy implementation theory by the Chinese government administration. In recent years, the Chinese government has issued laws and regulations such as the Implementing Rules of the Regulations on Travel Agencies and the Tourism Law. The central government provides unified leadership, and local governments actively cooperate and fully implement them. The governance and regulation of the tourism market order have been realized through formal constraints such as laws, regulations, and policies [11]. Similarly, many other countries have applied institutional theory to realize regulatory governance of tourism destinations. Latin American countries have effectively mitigated the ecological pollution and damage caused by tourism activities and corrected the external failure of the tourism market through the establishment of environmental regulations [49]. Countries such as New Zealand, South Africa, and Spain have also adopted governance measures such as enacting laws and setting up tourism development plans to realize effective governance and supervision of tourism [5,13,22].
In addition, there are significant differences in the spatial distribution of China’s tourism governance level, a finding that echoes previous scholars’ arguments about regional imbalances in the effectiveness of China’s tourism governance and the implementation of regulatory policies [2,7,8]. This may be due to China’s unique “pilot-promotion” model of tourism policy implementation. In some provinces (municipalities and autonomous regions), China has taken the lead in implementing reforms of the tourism governance system to accelerate the improvement of tourism governance. For example, a national-level comprehensive tourism reform zone was established in Fujian to explore institutional innovations in tourism land and information management. This policy has enabled Fujian to reach a high level of tourism governance in 2021, ahead of other regions. However, this policy has widened the tourism governance gap between different regions and widened the differences in the spatial distribution of China’s tourism governance level. The level of China’s tourism economic development is fluctuating and rising, with significant geographical preferences. The level of tourism economic development along the Pacific Ocean is significantly higher than that of inland areas. This measurement is consistent with the findings of previous studies [23,50,51]. It is largely due to the fact that the Pacific Rim is home to 80% of China’s open coastal cities and seven pilot free trade zones. Connecting the global route network through port clusters (e.g., Shanghai Yangshan Port and Shenzhen Yantian Port) facilitates international travelers and the cruise economy [52]. Similarly to the role of the ports of Los Angeles and San Francisco on the West Coast of the United States in driving the tourism economy. Therefore, the tourism economy along the Pacific Ocean has a higher level of development.
There exists a dynamic association and causal relationship between tourism economic development and tourism governance in China, and the level of coordinated development of the two is increasing day by day. This conclusion extends previous research on tourism economy and destination governance [3,31,51,53]. The mechanism of two-way interaction between TE and TG was confirmed in terms of empirical tests. The coordinated development of China’s TE and TG is mainly due to the fact that the Chinese government broke through the traditional regulatory theory and constructed a two-way regulatory framework of “incentive-constraint” in the field of tourism. The rules of governance are dynamically adjusted through positive incentive regulation and negative constraint regulation. In terms of positive incentives, a differentiated deposit system has been implemented for the quality of tourism services, and enterprises with AAA credit ratings can reduce or waive their deposits by 50%. In terms of negative constraints, a “blacklist” system for the tourism market has been established to ban travel agencies that violate the law. Although the development status of TE and TG has changed from dysfunctional to harmonized in most regions of China, the regional differences in the coordinated development of tourism economy and tourism governance are still large. The findings of this study are consistent with those presented by Sofield and Li [8] and Wang et al. [14]. The eastern region has the best state of coordinated development, while the western region has the lowest degree of coordinated development. This is because there are big differences between the East and the West in terms of economic foundation, resource endowment, and governance capacity. The eastern region has a strong economic foundation, and the investment and financing scale of the tourism industry in the east will account for 68% of the country in 2021. Economic core areas such as Shanghai and Guangdong form local markets with strong consumption power. However, tourism transportation in the western region is inconvenient, and tourism resources fluctuate seasonally. For example, the density of railroads in Tibet is only 6% of the national average. The number of tourists at the Qinghai Lake scenic spot in winter is less than 10 percent of the peak season. Eastern regions (e.g., Sanya City, Hainan Province) piloted a tourism police system in 2010, while the Tibet Autonomous Region (TAR) will only form its first professional Tourism Law enforcement team in 2022. Moganshan lodgings in Zhejiang Province have resolved property rights issues through local legislation, yet the renovation of distinctive dwellings in western ethnic areas is still constrained by land policies. Thus, these reasons lead to large regional differences in the coordinated development of China’s tourism economy and tourism governance.
Overall, China has been able to upgrade its tourism governance and achieve the goal of coordinated TE-TG development in a relatively short period of time, mainly benefiting from its governance system. China’s tourism governance model is globally distinctive, and its institutional design, policy instruments, and implementation logic differ significantly from those of other countries (especially Western federal or free-market dominated countries). China has a unitary state structure, with the central government leading local governments in a unified manner. Under the coordination of the central government, local governments can be fully mobilized. This mode of policy implementation allows formal systems such as tourism laws and regulations to maximize their practical value in a short period of time. For example, the central government uniformly formulates tourism development planning objectives (the “14th Five-Year Plan”), and each province (municipality directly under the central government, autonomous region) formulates supporting implementation plans, forming a vertical governance model of “central guidance - local refinement.” However, the governance structure of a federal state is centrally characterized by decentralization, with decentralized autonomy between the central and local levels. There is a certain gaming relationship between the federal government and the state governments. Under the federal system, each state (province) has independent legislative power, resulting in different standards of tourism policies. As a result, there are sometimes policy conflicts in the implementation of tourism laws, policies, and measures, leading to inefficient tourism governance. For example, Indian states compete for investment in tourism resources, and Kerala and Tamil Nadu compete viciously in the development of “backwater canals”, leading to duplicative infrastructure construction and ecological damage. In Australia, the federal government is responsible for ecological protection planning for the Great Barrier Reef, while the state of Queensland dominates tourism development, and the two sides have been playing a long-term game over the discharge standards for cruise ships, which has led to regulatory lag.
Furthermore, in contrast to the governance models of other countries, the Chinese Government has introduced a “pilot-propagation” model of tourism governance. The essence of this model is to gradually promote tourism governance policy reforms through “localized experimentation — lessons learned — nationwide promotion.” For example, Wuzhen in Zhejiang Province took the lead in exploring the “Smart Scenic Area Brain” project, and the successful experience has been promoted to the whole country through the central government. In 2014, “Xijiang Thousand Houses Miaozhai” in Guizhou Province successfully realized poverty alleviation through the “scenic area driven rural area” model. This model has been incorporated into the National Rural Tourism Poverty Alleviation Project Action Program, which has been extended to more than 2,000 poor villages in central and western China. The advantages of this governance model are that it can reduce policy risks, improve reform efficiency, and enhance institutional adaptability. It provides a Chinese program of “policy experimentation-learning-adaptation” for global tourism governance. Compared with the “decentralized experimentation-limited diffusion” model common in Western federal countries (e.g., the United States, Germany, etc.), it is of great significance.
In summary, the uniqueness of China’s tourism governance model stems from the institutional advantage of “focusing on big issues” and the policy model of “pilot-promotion.” It has been effective in promoting large-scale projects (e.g., model regions for tourism) and responding to public health emergencies in tourism. It can not only realize resource integration and policy promotion at the macro level but also stimulate the innovation vitality and risk control ability of local governments at the micro level. However, in practice, this model also faces challenges such as unbalanced regional development, policy adaptability, lack of governance flexibility, and multi-stakeholder balance. The future breakthrough lies in narrowing regional capacity gaps with digital governance tools, releasing local development space with institutional decentralization, and enhancing the efficiency of tourism resource allocation with market-based mechanisms. In the future, China should focus on finding a dynamic equilibrium solution between “effective market” and “active government” and contribute more inclusive Chinese solutions to global tourism governance.
6. Conclusion
6.1. Theoretical Implications
First of all, this study expands the evaluation perspective of the tourism system. Previous studies have mainly focused on measuring the development of the economic [53], social [51], and ecological [24] subsystems within the tourism system, while overlooking the exploration of the governance subsystem in tourism. In this study, tourism regulatory governance was considered from three dimensions of governance policy environment, tourism disputes and crimes, and public governance capacity. Finally, the evaluation index system of the tourism governance system is constructed, which enriches the evaluation dimension of the tourism internal system.
Secondly, this study enriches the methodologies and measurement models for tourism governance research. Previous studies have mainly assessed the effectiveness of the implementation of governance in tourism by using DID models [21], dynamic panel models [20], and questionnaires [40]. This study introduces the research methods of geography and economics and evaluates the coordination relationship between the tourism economy system and the tourism governance system by using the coupled coordination model and Markov chain. Moreover, ArcGIS 10.6 software was utilized in this study to spatially visualize and analyze the development level of the tourism governance system, thus achieving a geospatial description of it.
Finally, this study confirms the interaction mechanism and causal relationship between the tourism economy system and the tourism governance system. Previous studies have mostly focused on the coordination mechanism between the tourism economic system and other systems such as the ecosystem [25], the urban development system [27], and the digital economic system [26], without being able to elucidate the interaction mechanism between the tourism economic system and the tourism governance system. This study adopts the PVAR model and the coupled coordination model to demonstrate the bidirectional causal association and interactive coordination effect between the tourism economy system and the governance system. It verifies the theoretical assumption of coordinated interaction between TE and TG through mathematical modeling. Moreover, this study proposes that the tourism economy system can contribute to the improvement of the tourism governance system, and that the tourism governance system maintains the sustainable development of the tourism economy system. This finding enriches the research theory of the overall tourism system.
6.2. Practical Implications
China should prioritize enhancing tourism governance capacity in the western and northeastern provinces, where low governance levels and poor TE-TG coordination persist. This necessitates a multi-stakeholder governance framework involving governmental agencies, tourism operators, and local communities.
The government should improve the tourism governance system, establish a dynamic assessment mechanism for the implementation of regulations, and regularly revise the supporting rules in accordance with new sectors in the tourism market (e.g., ice and snow economy, cross-border tourism) to ensure the applicability of the regulatory system. For the western ecologically fragile areas (e.g., Qinghai) and northeastern ice and snow tourism areas (e.g., Heilongjiang, Jilin), special regulations should be formulated to clarify the boundaries of authority and responsibility between ecological protection and tourism development, and to solve the conflict of law enforcement caused by duplicated management. For the development of non-heritage tourism in western ethnic areas, excessive commercialization should be incorporated into the negative list (e.g., limit the number of daily tourists received in Guizhou’s Miao embroidery villages), while granting tax exemptions to compliant operators (e.g., subsidize the renovation of lodgings in Gansu’s Dunhuang). There should be an establishment of bilingual mediation offices in Sichuan, Tibet, Xinjiang, and other regions, and a fostering of professional mediation organizations for tourism disputes to meet the needs of ethnic minority languages and improve governance efficiency. Data from tourism, environmental protection, transportation, and other departments should be integrated to establish a “tourism governance brain” and shorten response time for law enforcement. For example, the whole-area monitoring system of the Kanas scenic area in Xinjiang will be extended to the same type of tourist destinations in Gansu and Ningxia. The Jiuzhaigou comprehensive law enforcement model in Sichuan should be promoted, and interdepartmental law enforcement teams for public security, forestry, and municipal supervision should be set up to realize real-time tourism supervision through drone inspections and heat map analysis.
For tourism enterprises, we suggest the implementation of an enterprise credit evaluation system. The illegal behaviors of tourism enterprises should be included in the credit file, and graded management should be implemented. For example, for scenic spots in Xinjiang and Tibet, behaviors such as fraudulent consumption and false propaganda can be included in the credit file. For enterprises with a low credit rating, a double deposit payment system should be implemented, and regular public announcements should be made on the status of enterprise credit rectification. In addition, tourism enterprises should promote industry alliance standard co-construction. Joint head enterprises to develop service standards higher than the national standard (such as B&B safety norms, ethical guidelines for tour guides) through the certification system to promote industry self-discipline. For example, the ski tourism scenic spots in Jilin and Heilongjiang should take the initiative to develop the Ski Coach Qualification Certification Codes in conjunction with the sports department to clear out the illegal coaches and force first aid skills assessments. Moreover, tourism enterprises should strengthen the safety of scenic spots. The western scenic areas need to regularly check the facilities for hidden dangers, such as in Gansu Dunhuang’s desert camping project, to strengthen emergency plan drills. Northeastern areas, such as the Heilongjiang Ice World, require special equipment (ski lifts, scenic elevators) to strengthen the use of units of routine maintenance and emergency drills to ensure the safe operation of equipment. Furthermore, tourism enterprises have to establish consumer protection mechanisms. The establishment of a 24 h customer service hotline, online complaint platform, false advertising complaint platform, service quality complaint platform, and a platform for other issues to be resolved in a timely manner should be established to avoid the escalation of conflicts.
The governance of the tourism market also requires active participation and supervision of the public. Community residents should play a leading role and participate in tourism governance. Residents in the western region can act as “front-line guardians” of ecological protection and participate in the planning and management of scenic spots. For example, Chaka Salt Lake in Qinghai can recruit herdsmen volunteers to supervise the behavior of tourists and reduce human damage. Establish a “community + scenic spot” consultation platform to promote residents’ participation in tourism development rulemaking. For example, in the southwest region, they should promote the “village rules and regulations autonomy” model of Sichuan’s Dacheng Yading, where villagers’ representatives supervise the pricing of lodgings and the implementation of service standards. Community residents can join the supervisory team as a “tourism supervisor.” The northeast region can follow the Shenyang Bayi morning market management model, invite the public as “tourism observers”, and the scenic area around the stores for regular inspection, focusing on monitoring price fraud, false advertising, and other issues. In addition, the public should take the initiative to monitor and utilize official channels to provide quick feedback on problems. Through the 12345 hotline, the culture and tourism department's official website, and other platforms, unreasonable low-price tours, forced consumption, and other behaviors can be reported with real names. For example, the northeast region can promote the ice and snow tourism season, the “tourism services through train” mechanism, through a small program code and real-time uploading of evidence of the violations of tourism enterprises. In Xinjiang, Gansu, Qinghai, and other tourist attractions, to promote “a store a code” commodity traceability services, tourists can scan the code to verify the legitimacy of the source of goods, to promote rapid consumer rights.
Additionally, federalized countries can also learn from China’s “pilot-promote” tourism governance policy. Policy innovation can be promoted through the establishment of a flexible, decentralized collaboration mechanism that is tailored to local conditions. For example, in the United States, Germany, and other federal countries, the state governments can, based on local resource endowment and governance needs, carry out pilot tourism management in specific areas (such as the perimeter of national parks and cultural heritage-intensive areas), such as pilot dynamic regulation of tourist carrying capacity, ecological protection compensation mechanism, or digital monitoring platform. At the same time, the federal government should set up a special fund and a cross-regional coordinating body to ensure the legitimacy and operability of the pilot policy through legal authorization and financial incentives. During the pilot process, a multi-level data sharing and evaluation system should be set up to regularly summarize local experiences and select replicable models (e.g., community participatory tourism development, low-carbon scenic area certification). These models can then be scaled up through federal legislation or policy initiatives, balancing a unified framework with local adaptability. For example, India can learn from the experience of the pilot tourism liberalization policy in China’s Hainan Free Trade Zone. Visa facilitation and cross-border tourism cooperation should be tested in large tourism states such as Kerala and then expanded to the whole country through the central-local joint mechanism after maturity. This path can not only give full play to the advantages of pluralistic governance in a federal system but also reduce the risks of governance reform through “small-scale experimentation - feedback and updating-system diffusion,” and ultimately achieve a balance between policy innovation and overall stability in tourism governance.
6.3. Limitations and Future Work
This study has some limitations. First, the evaluation indicator system was not adequate. The current study only considered the evaluation indicators for TE and TG from an objective perspective. Future research should use ethnography, fieldwork, questionnaires, and other methods to enrich the subjective aspects of evaluation indicators. At the same time, future work is required to continuously optimize and update the indicator system. Second, the coupled coordination model usually defaults to a linear association between the tourism economic subsystem and the tourism governance subsystem, but actual research has found that the relationship between the two may be characterized by nonlinear or stage-specific abrupt changes. The complex feedback mechanism between the two systems may be neglected if relying solely on the linear model. Therefore, future research needs to seek breakthroughs at the level of model dynamics, nonlinearity, and compatibility. For example, nonlinear system dynamics modeling tools are used to capture the complex mechanisms of the tourism economy and tourism governance through dynamic simulation. Alternatively, machine learning algorithms such as random forests and neural networks can be used to identify the nonlinear interaction effects between variables. Third, research on the mechanism, influencing factors, and enhancement paths of the coordinated development of TE and TG has not been sufficiently detailed. Future research should apply in-depth interviews, geodetectors, and fuzzy-set qualitative comparative analyses to better investigate these issues. Fourth, the case study selected for this study is China, which has some limitations in terms of the study area. In the future, corresponding studies can be carried out for India, Russia, and other countries with similar economies to explore the coordination and interaction between tourism economic development and tourism market governance in other countries or regions, and to conduct horizontal comparisons between different study areas.
Author Contributions
Data curation, N.W.; formal analysis, N.W.; investigation, N.W.; methodology, N.W.; validation, N.W.; visualization, N.W.; data curation, N.W.; writing—original draft, N.W.; conceptualization, G.W.; funding acquisition, G.W.; project administration, G.W.; supervision, G.W.; writing–review and editing, G.W. All authors have read and agreed to the published version of the manuscript.
Funding
This research was funded by the National Social Science Fund of China, grant number 23BJY143.
Data Availability Statement
The data presented in this study are available on request from the corresponding author due to the need to maintain the integrity of the findings and to ensure that users understand the context and limitations of the data.
Conflicts of Interest
The authors declare no conflicts of interest.
References
- Xu, Y.Y.; McGehee, N.G. Tour guides under zero-fare mode: Evidence from China. Curr. Issues Tour. 2017, 20, 1088–1109. [Google Scholar] [CrossRef]
- Tang, X.Y. The historical evolution of China's tourism development policies (1949–2013)—A quantitative research approach. Tour. Manag. 2017, 58, 259–269. [Google Scholar] [CrossRef]
- Pulido-Fernández, J.I.; Pulido-Fernández, M.D. Proposal for an Indicators System of Tourism Governance at Tourism Destination Level. Soc. Indic. Res. 2018, 137, 695–743. [Google Scholar] [CrossRef]
- Aguinis, H.; Kraus, S.; Pocek, J.; Meyer, N.; Jensen, S.H. The why, h.0ow, and what of public policy implications of tourism and hospitality research. Tour. Manag. 2023, 97, 104720. [Google Scholar] [CrossRef]
- Balsalobre-Lorente, D.; Driha, O.M.; Bekun, F.V.; Adedoyin, F.F. The asymmetric impact of air transport on economic growth in Spain: Fresh evidence from the tourism-led growth hypothesis. Curr. Issues Tour. 2021, 24, 503–519. [Google Scholar] [CrossRef]
- Guidi, M.; Guardiancich, I.; Levi-Faur, D. Modes of regulatory governance: A political economy perspective. Gov. Int. J. Policy Adm. Inst. 2020, 33, 5–19. [Google Scholar] [CrossRef]
- Deng, A.M.; Lu, J.Y.; Zhao, Z.Y. Rural destination revitalization in China: Applying evolutionary economic geography in tourism governance. Asia Pac. J. Tour. Res. 2021, 26, 215–230. [Google Scholar] [CrossRef]
- Sofield, T.; Li, S. Tourism governance and sustainable national development in China: A macro-level synthesis. J. Sustain. Tour. 2011, 19, 501–534. [Google Scholar] [CrossRef]
- Bichler, B.F. Designing tourism governance: The role of local residents. J. Destin. Mark. Manag. 2021, 19, 100389. [Google Scholar] [CrossRef]
- Zhai, Y.X.; Shi, P.H. The evolutionary characteristics, driving mechanism, and optimization path of China's tourism support policies under COVID-19: A quantitative analysis based on policy texts. Curr. Issues Tour. 2022, 25, 1169–1184. [Google Scholar] [CrossRef]
- Earl, A.; Hall, C.M. Institutional Theory in Tourism and Hospitality; Routledge: London, UK, 2021. [Google Scholar]
- Soares, A.L.V.; Mendes, L.; Gretzel, U. Technology adoption in hotels: Applying institutional theory to tourism. Tour. Rev. 2021, 76, 669–680. [Google Scholar] [CrossRef]
- Connell, J.; Page, S.J.; Bentley, T. Towards sustainable tourism planning in New Zealand: Monitoring local government planning under the Resource Management Act. Tour. Manag. 2009, 30, 867–877. [Google Scholar] [CrossRef]
- Wang, W.F.; Chang, Y.; Pearce, P.L. China’s first Tourism Law: Representations of stakeholders' responses. J. Tour. Cult. Change 2018, 16, 309–327. [Google Scholar] [CrossRef]
- Khater, M.; Ibrahim, O.; Sayed, M.N.E.; Faik, M. Legal frameworks for sustainable tourism: Balancing environmental conservation and economic development. Curr. Issues Tour. Early Access. 2024. [Google Scholar] [CrossRef]
- Coban, M.K.; Apaydin, F. Navigating financial cycles: Economic growth, bureaucratic autonomy, and regulatory governance in emerging markets. Regul. Gov. 2025, 19, 126–145. [Google Scholar] [CrossRef]
- Wang, D.; Ap, J. Factors affecting tourism policy implementation: A conceptual framework and a case study in China. Tour. Manag. 2013, 36, 221–233. [Google Scholar] [CrossRef]
- Dinica, V. Tourism on Curacao: Explaining the Shortage of Sustainability Legislation from Game Theory Perspective. J. Environ. Policy Plan. 2012, 14, 161–188. [Google Scholar] [CrossRef]
- Marx, K. A Contribution to the Critique of Political Economy; lnternational Publishers: New York, NY, USA, 1979. [Google Scholar]
- Dutta, N.; Kar, S. Relating rule of law and budgetary allocation for tourism: Does per capita income growth make a difference for Indian states? Econ. Model. 2018, 71, 263–271. [Google Scholar] [CrossRef]
- Shao, J.; Wang, M. Tourism law, labor supply and corporate performance in tourism listed firms. Financ. Res. Lett. 2024, 68, 105971. [Google Scholar] [CrossRef]
- Asongu, S.A.; Rahman, M.; Nnanna, J. Law, political stability, tourism management and economic development in sub-Saharan Africa. Curr. Issues Tour. 2023, 26, 2678–2691. [Google Scholar] [CrossRef]
- Li, S.X.; Cheng, Z.H.; Tong, Y.; He, B.A. The Interaction Mechanism of Tourism Carbon Emission Efficiency and Tourism Economy High-Quality Development in the Yellow River Basin. Energies 2022, 15, 6975. [Google Scholar] [CrossRef]
- Zhu, K.; Zhou, Q.; Cheng, Y.F.; Zhang, Y.T.; Li, T.; Yan, X.Y.; Alimov, A.; Farmanov, E.; David, L.D. Regional sustainability: Pressures and responses of tourism economy and ecological environment in the Yangtze River basin, China. Front. Ecol. Evol. 2023, 11, 1148868. [Google Scholar] [CrossRef]
- Li, Y.S. Management Model of the Coordinated Development of the Coastal Ecological Environment and Rural Tourism Economy. J. Coast. Res. 2020, 106, 53–56. [Google Scholar] [CrossRef]
- Chen, W.H.; He, X.R.; Cai, C.Y. Does the Digital Economy Promote Tourism Eco-Efficiency? - An Empirical Study Based on Chinese Cities. Pol. J. Environ. Stud. 2025, 34, 2063–2079. [Google Scholar] [CrossRef]
- Tan, Y.N.; Jiang, G.L.; Merajuddin, S.S.; Zhao, F. Urbanization and tourism economic development. Financ. Res. Lett. 2025, 73, 106632. [Google Scholar] [CrossRef]
- Zhu, L.; Zhan, L.X.; Li, S.B. Is sustainable development reasonable for tourism destinations? An empirical study of the relationship between environmental competitiveness and tourism growth. Sustain. Dev. 2021, 29, 66–78. [Google Scholar] [CrossRef]
- Yin, P.; Zheng, X.R.; Duan, L.; Xu, X.B.; He, M. A Study of the Contribution of Information Technology on the Growth of Tourism Economy Using Cross-Sectional Data. J. Glob. Inf. Manag. 2019, 27, 39–58. [Google Scholar] [CrossRef]
- Lai, Z.Z.; Ge, D.M.; Xia, H.B.; Yue, Y.L.; Wang, Z. Coupling coordination between environment, economy and tourism: A case study of China. PLoS ONE 2020, 15, e0228426. [Google Scholar] [CrossRef]
- Yang, Z.Y.; Sang, S.Y.; Zhu, Y.R. Analysis of coupled coordination and spatial interaction effects between digital and tourism economy in the Yangtze River Delta region. PLoS ONE 2024, 19, e0307756. [Google Scholar] [CrossRef]
- Zhang, K.; Mei, X.H.; Xiao, Z.Q. Spatio-temporal evolution of sports tourism industry integration: A empirical analysis of Xinjiang in China. PLoS ONE 2024, 19, e0300959. [Google Scholar] [CrossRef]
- Zhang, X.Y.; Huang, X.K.; Shi, J.L.; Zheng, Y.M.; Wang, J.H. Connections and Spatial Network Structure of the Tourism Economy in Beijing-Tianjin-Hebei: A Social Network Perspective. Land 2024, 13, 1691. [Google Scholar] [CrossRef]
- Zhang, X.Y.; Peng, B.F.; Zhou, L.L.; Lu, C.Y.; Wang, Y.L.; Liu, R.; Xiang, H. Tourism development potential and obstacle factors of cultural heritage: Evidence from traditional music in Xiangxi. J. Geogr. Sci. 2024, 34, 309–328. [Google Scholar] [CrossRef]
- Tang, C.C.; Wu, X.F.; Zheng, Q.Q.; Lyu, N. Ecological security evaluations of the tourism industry in Ecological Conservation Development Areas: A case study of Beijing's ECDA. J. Clean. Prod. 2018, 197, 999–1010. [Google Scholar] [CrossRef]
- Huang, C.K.; Lin, F.Y.; Chu, D.P.; Wang, L.L.; Liao, J.W.; Wu, J.Q. Coupling Relationship and Interactive Response between Intensive Land Use and Tourism Industry Development in China's Major Tourist Cities. Land 2021, 10, 697. [Google Scholar] [CrossRef]
- Wei, M.; Peng, Q.; Chen, M.H.; Su, C.H. Understanding the evolution of China's tourism industry performance: An internal-external framework. Int. J. Tour. Res. 2020, 22, 479–492. [Google Scholar] [CrossRef]
- Zhang, X.; Wu, S.F. Efficiency Evaluation and Spatio-Temporal Differentiation Analysis of tourism Industry in Cities Along the Beijing Hangzhou Grand Canal Based on Three-Stage DEA. Sage Open 2024, 14, 21582440241300557. [Google Scholar] [CrossRef]
- Cao, X. Challenges and potential improvements in the policy and regulatory framework for sustainable tourism planning in China: The case of Shanxi Province. J. Sustain. Tour. 2015, 23, 455–476. [Google Scholar] [CrossRef]
- Qasim, S.O.; Tumer, M.; Ozturen, A.; Kilic, H. Mediating role of legal services in tourism development: A necessity for sustainable tourism destinations. Curr. Issues Tour. 2020, 23, 2866–2883. [Google Scholar] [CrossRef]
- Liu, Y.X.; Yao, Y.B.; Fan, D.X.F. Evaluating Tourism Market Regulation from Tourists' Perspective: Scale Development and Validation. J. Travel Res. 2020, 59, 975–992. [Google Scholar] [CrossRef]
- Hu, M.J.; Li, Z.J.; Hou, B. The Influencing Effect of Tourism Economy on Green Development Efficiency in the Yangtze River Delta. Int. J. Environ. Res. Public Health 2023, 20, 1072. [Google Scholar] [CrossRef]
- Bai, Y.F.; Zhai, D.X.; Zhao, X.F.; Wu, D.L. The Impact of Property Rights Structure on High-Quality Development of Enterprises Based on Integrated Machine Learning-A Case Study of State-Owned Enterprises in China. Sustainability 2023, 15, 3016. [Google Scholar] [CrossRef]
- Silverman, B.W. Density Estimation for Statistics and Data Analysis; Chapman and Hall: New York, NY, USA, 1986. [Google Scholar]
- Yang, X.P.; Liu, L.L.; Wang, X.Y.; Niu, J.; Zhang, X.B. Spatio-temporal Evolution of Tourism Development Quality under the New Development Pattern of “Double Circulation”. Appl. Spat. Anal. Policy 2023, 16, 647–688. [Google Scholar] [CrossRef]
- Chang, Y.C. Accelerating domestic and international dual circulation in the Chinese shipping industry-An assessment from the aspect of participating RCEP. Mar. Policy 2022, 135, 104862. [Google Scholar] [CrossRef]
- Kuscer, K.; Eichelberger, S.; Peters, M. Tourism organizations’ responses to the COVID-19 pandemic: An investigation of the lockdown period. Curr. Issues Tour. 2022, 25, 247–260. [Google Scholar] [CrossRef]
- Chang, Y.C.; Liu, S.; Zhang, X. The construction of Global Maritime Capital-Current development in China. Mar. Policy 2023, 151, 105576. [Google Scholar] [CrossRef]
- Porto, N.; Ciaschi, M. Reformulating the tourism-extended environmental Kuznets curve: A quantile regression analysis under environmental legal conditions. Tour. Econ. 2021, 27, 991–1014. [Google Scholar] [CrossRef]
- Sun, Y.Y.; Lin, W.Y.; Sun, M.Y.; Chen, P. Spatiotemporal Evolution and Driving Forces of Tourism Economic Resilience in Chinese Provinces. Sustainability 2024, 16, 8091. [Google Scholar] [CrossRef]
- Wang, R.G.; Gao, L.; Zhu, Y.L.; Liu, Y.; Li, Y.Y.; He, J.C. Urban-Rural Integration Empowers High-Quality Development of Tourism Economy: Mechanism and Empirical Evidence. Sustainability 2023, 15, 15893. [Google Scholar] [CrossRef]
- Chang, Y.C. Maritime clusters: What can be learnt from the South West of England. Ocean Coast. Manag. 2011, 54, 488–494. [Google Scholar] [CrossRef]
- Li, Z.F.; Liu, H.Y. How tourism industry agglomeration improves tourism economic efficiency? Tour. Econ. 2022, 28, 1724–1748. [Google Scholar] [CrossRef]
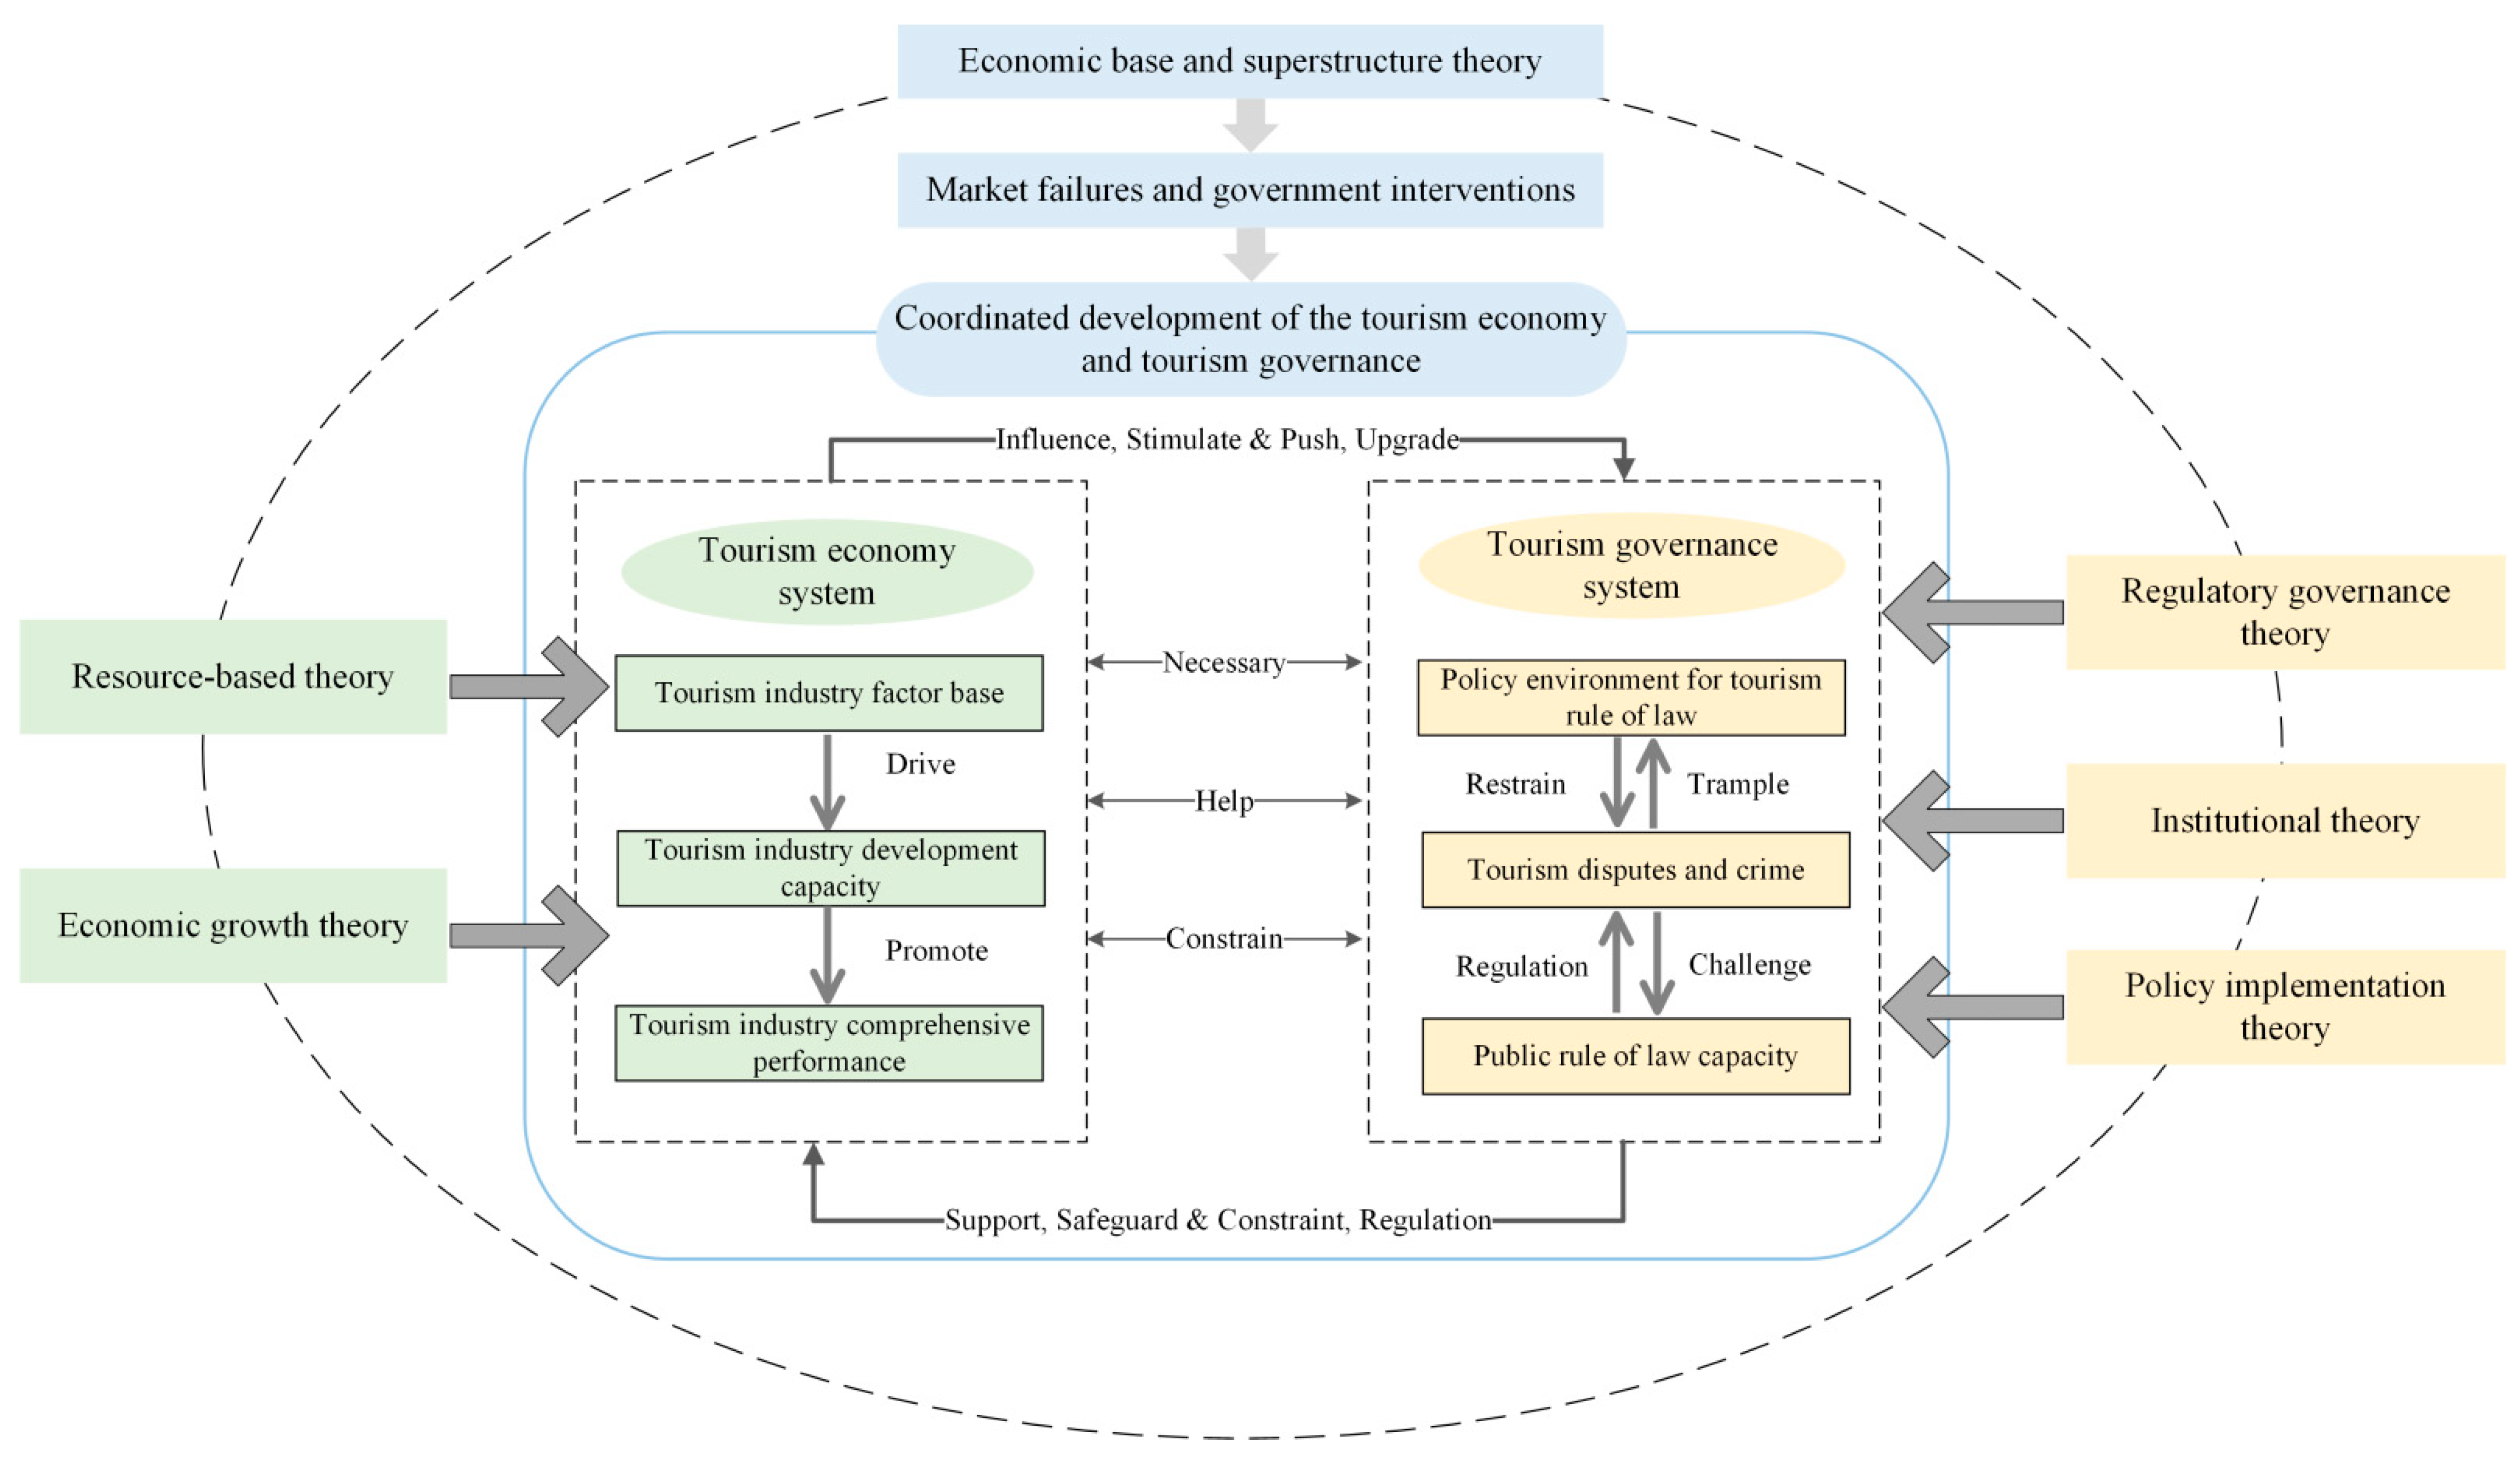
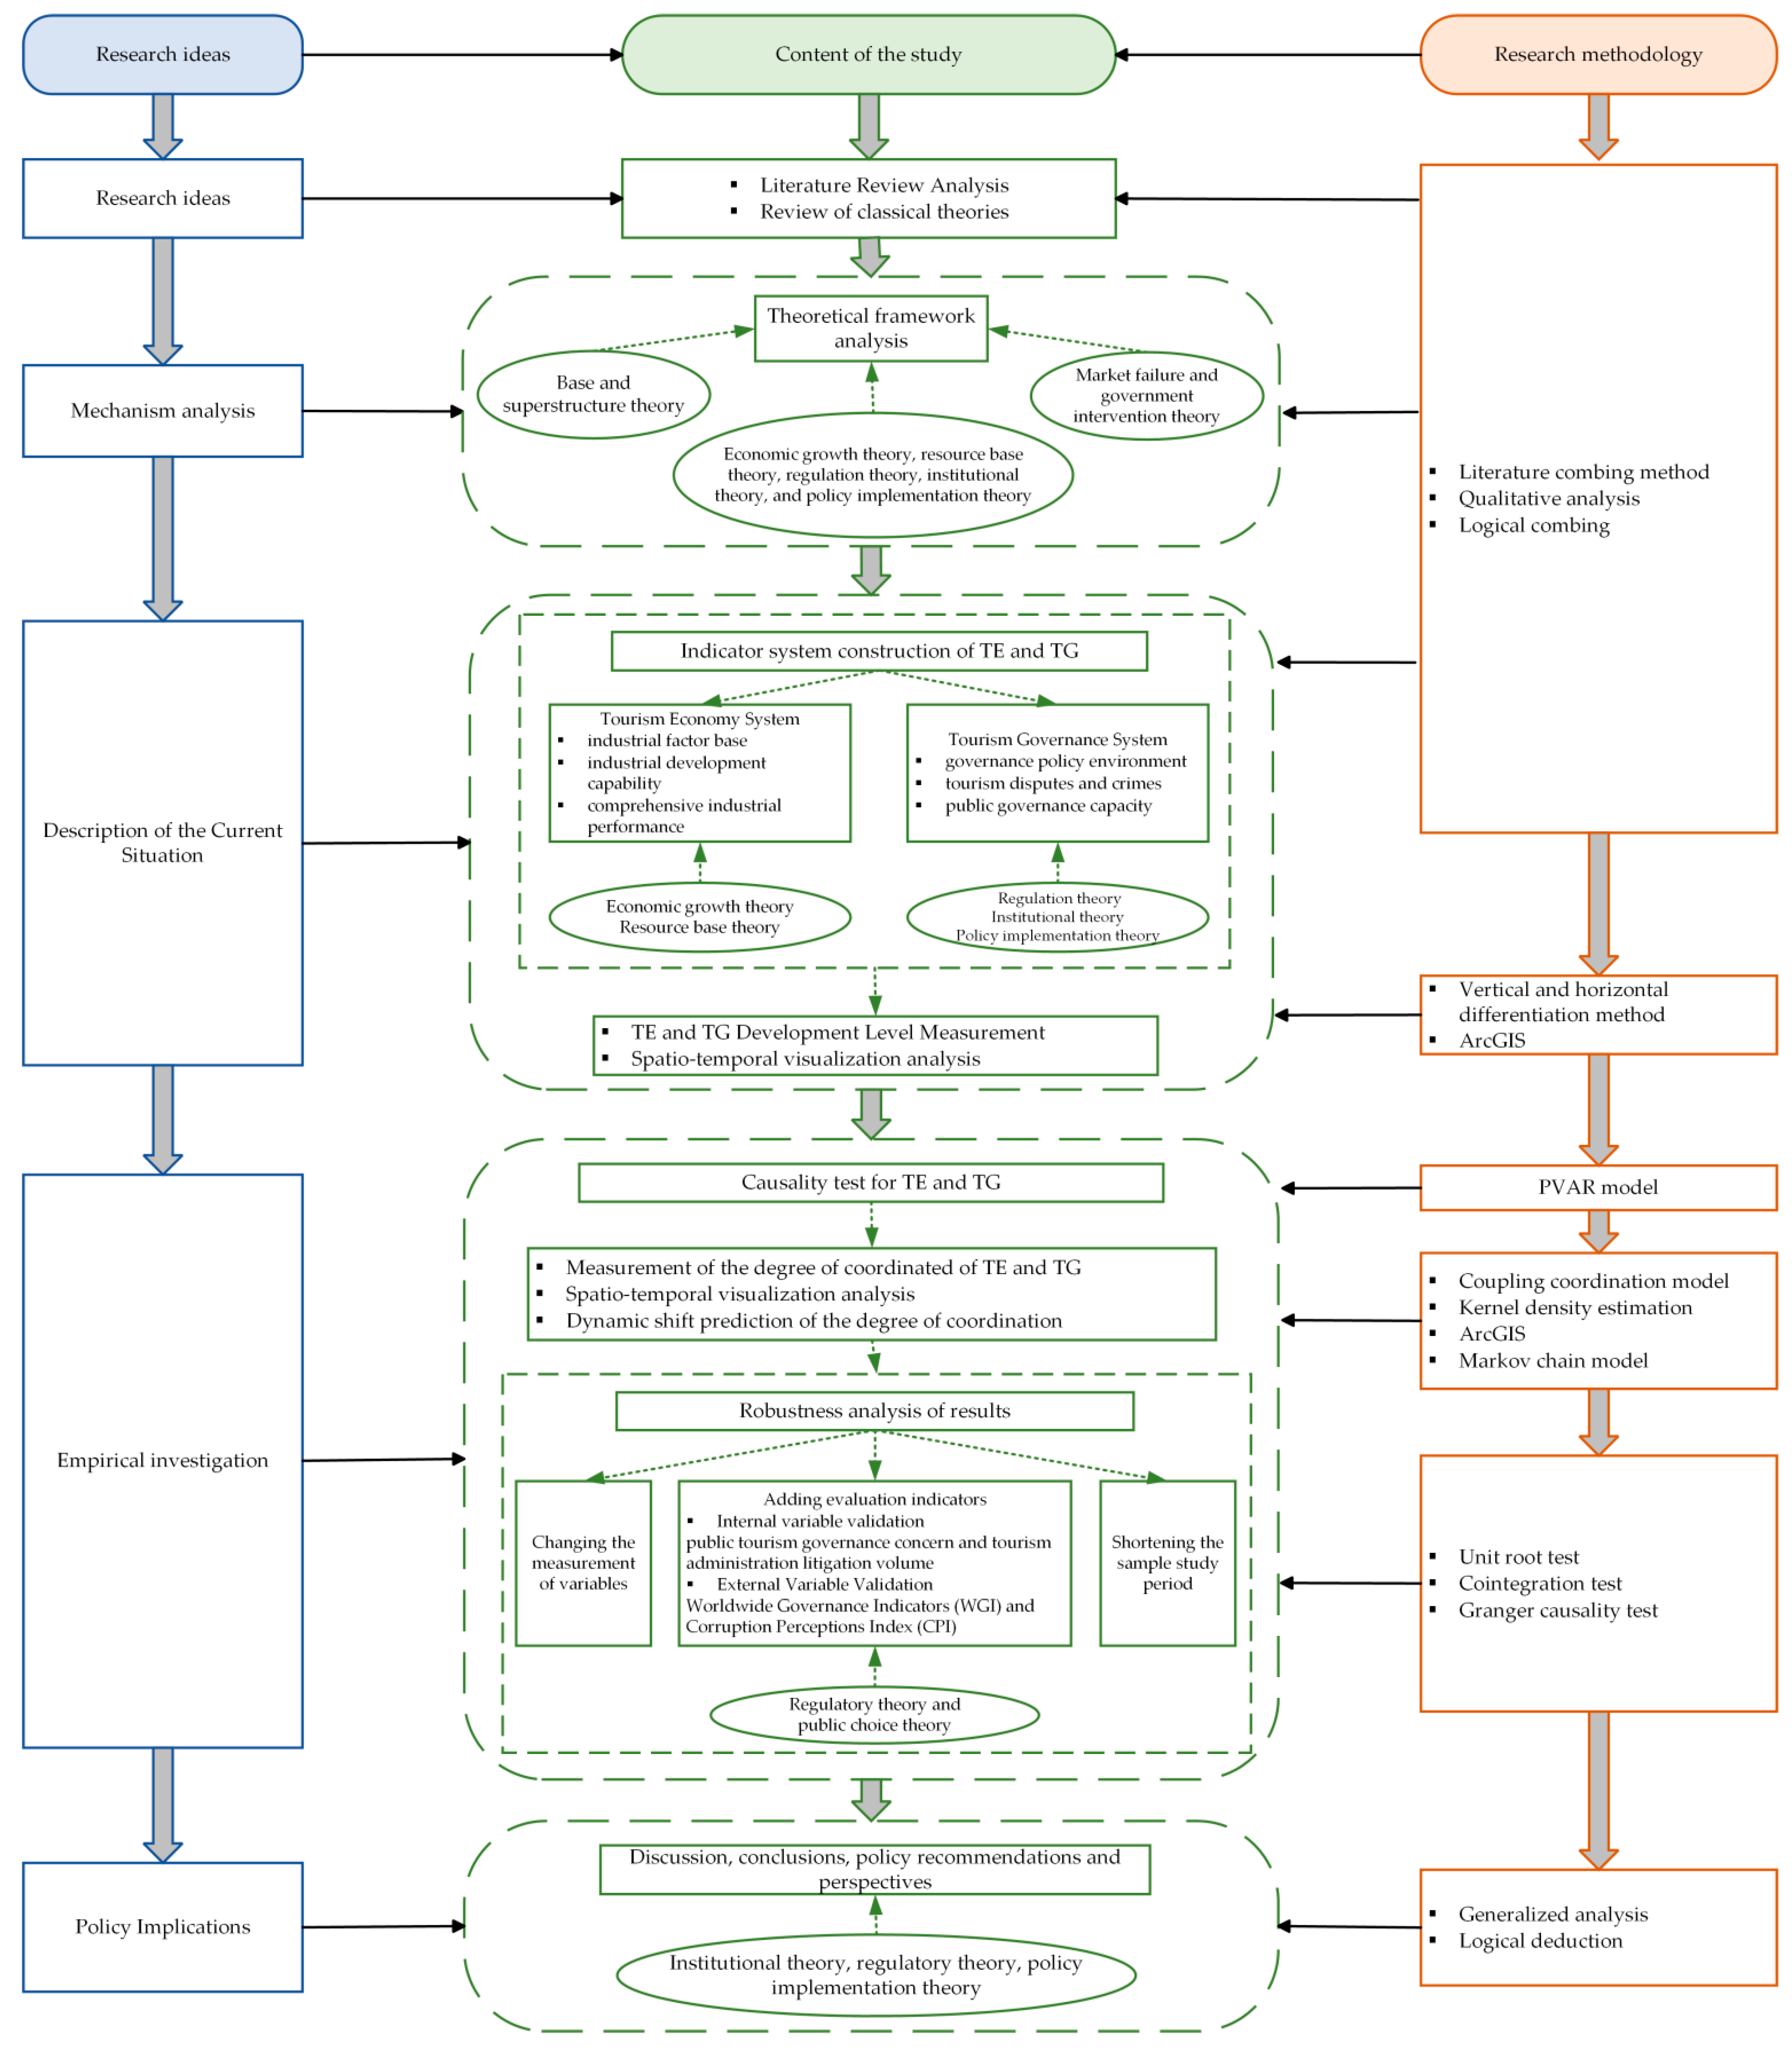

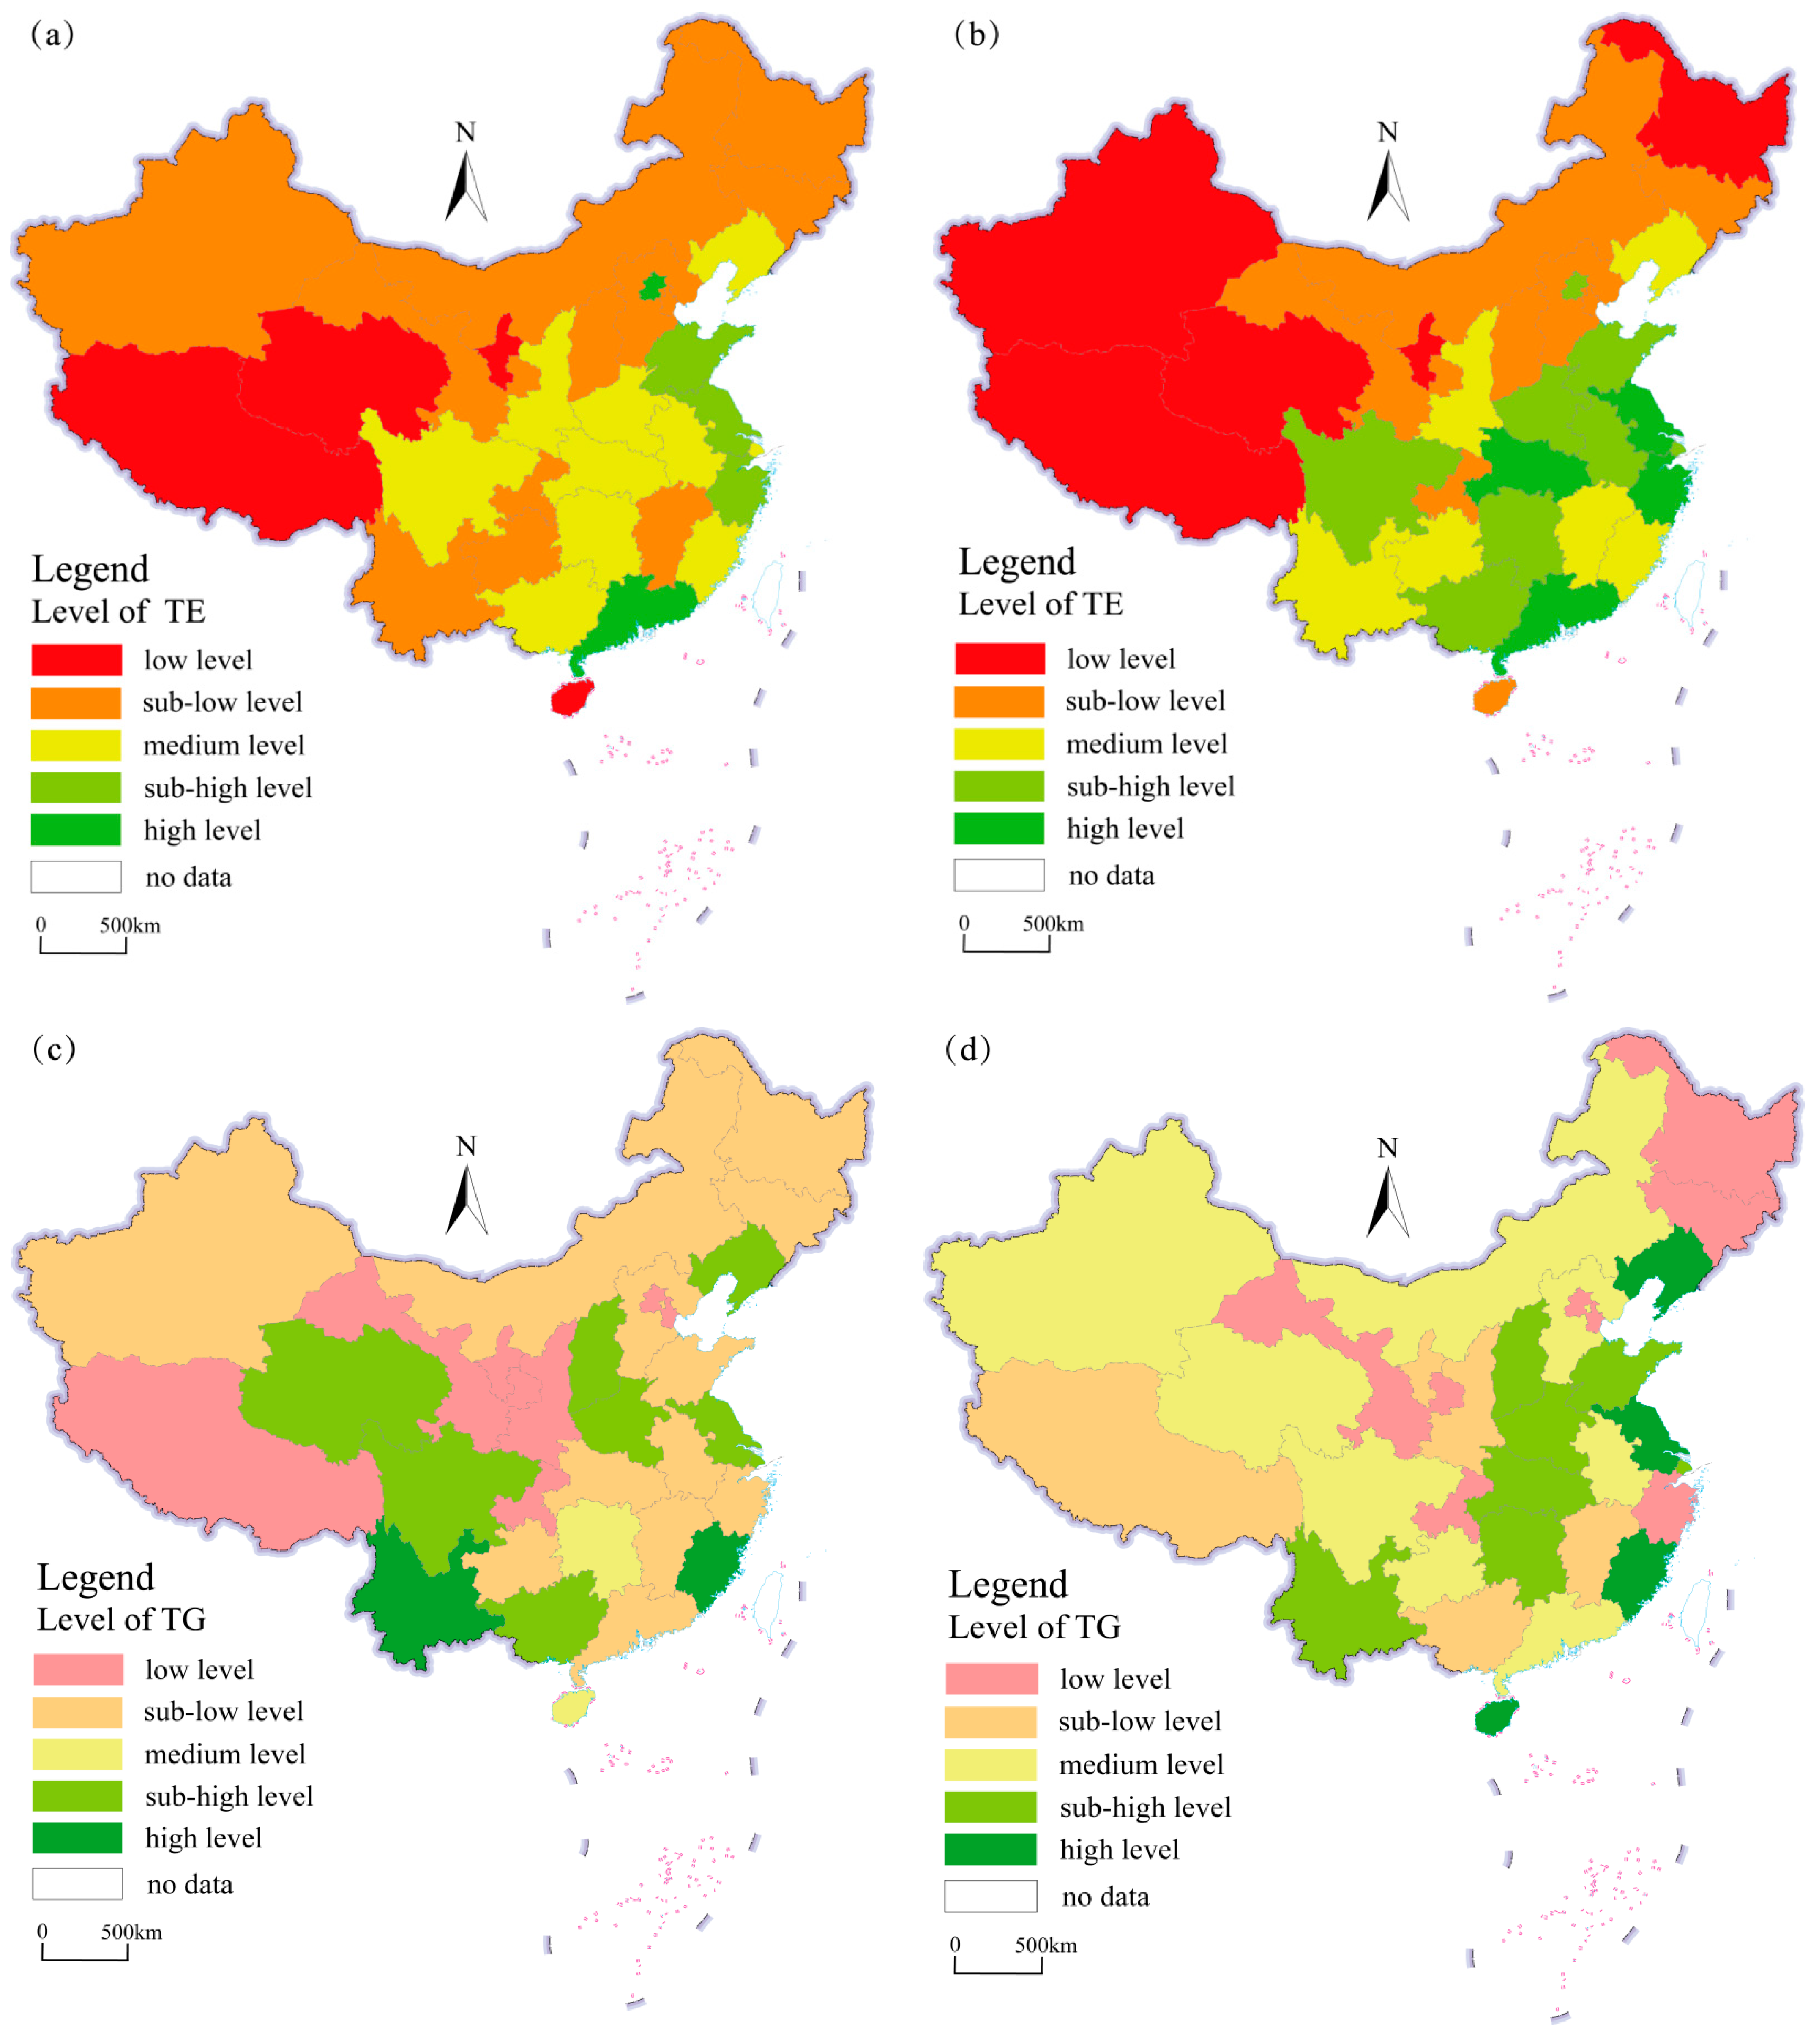
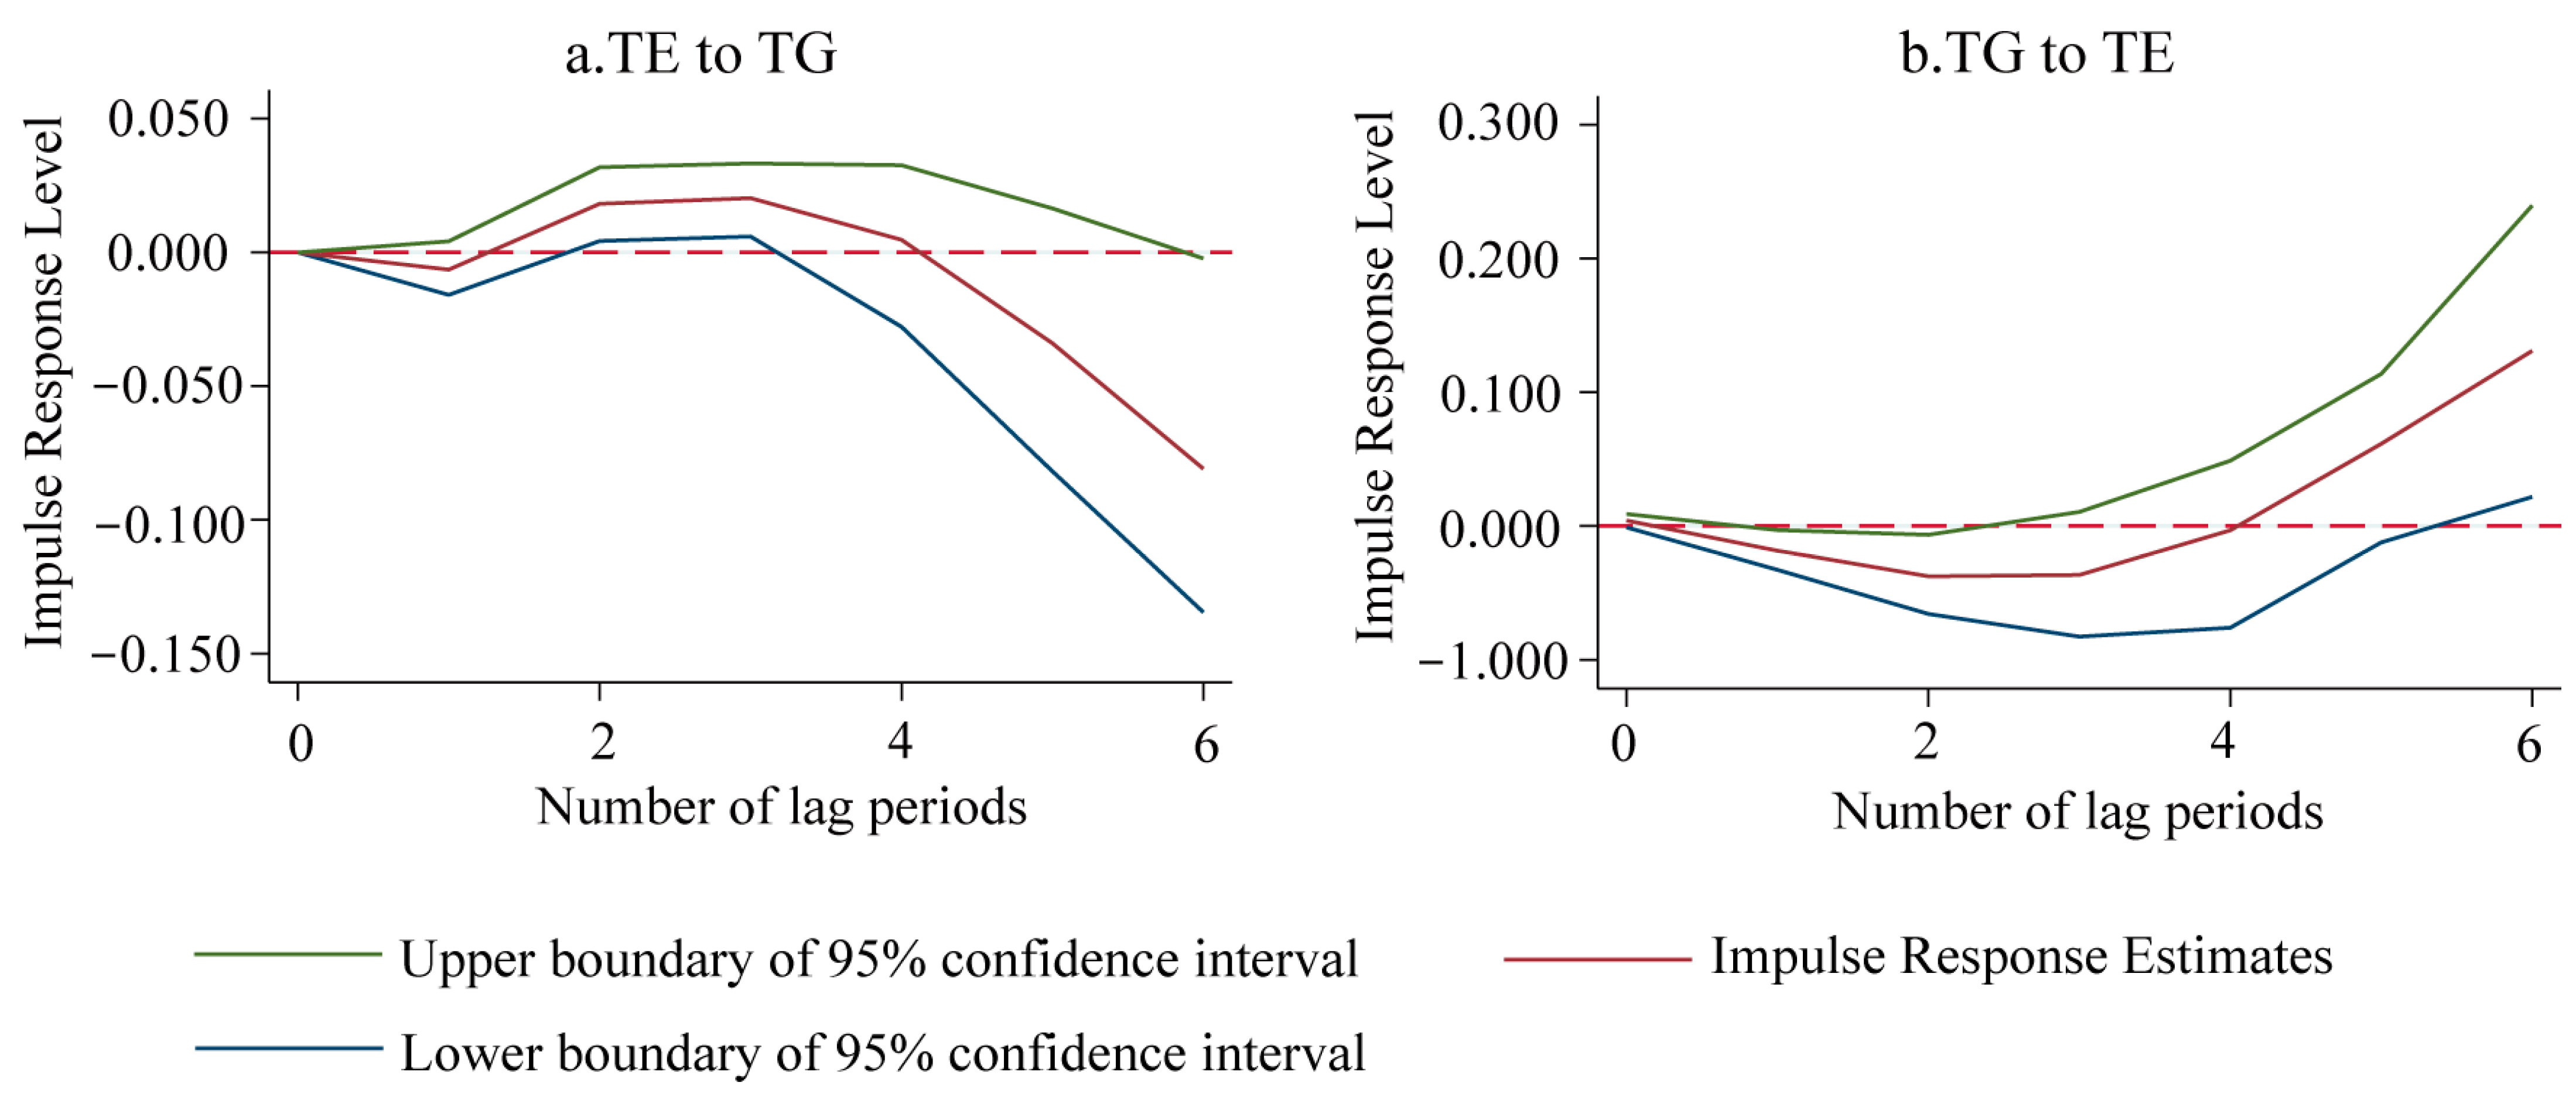
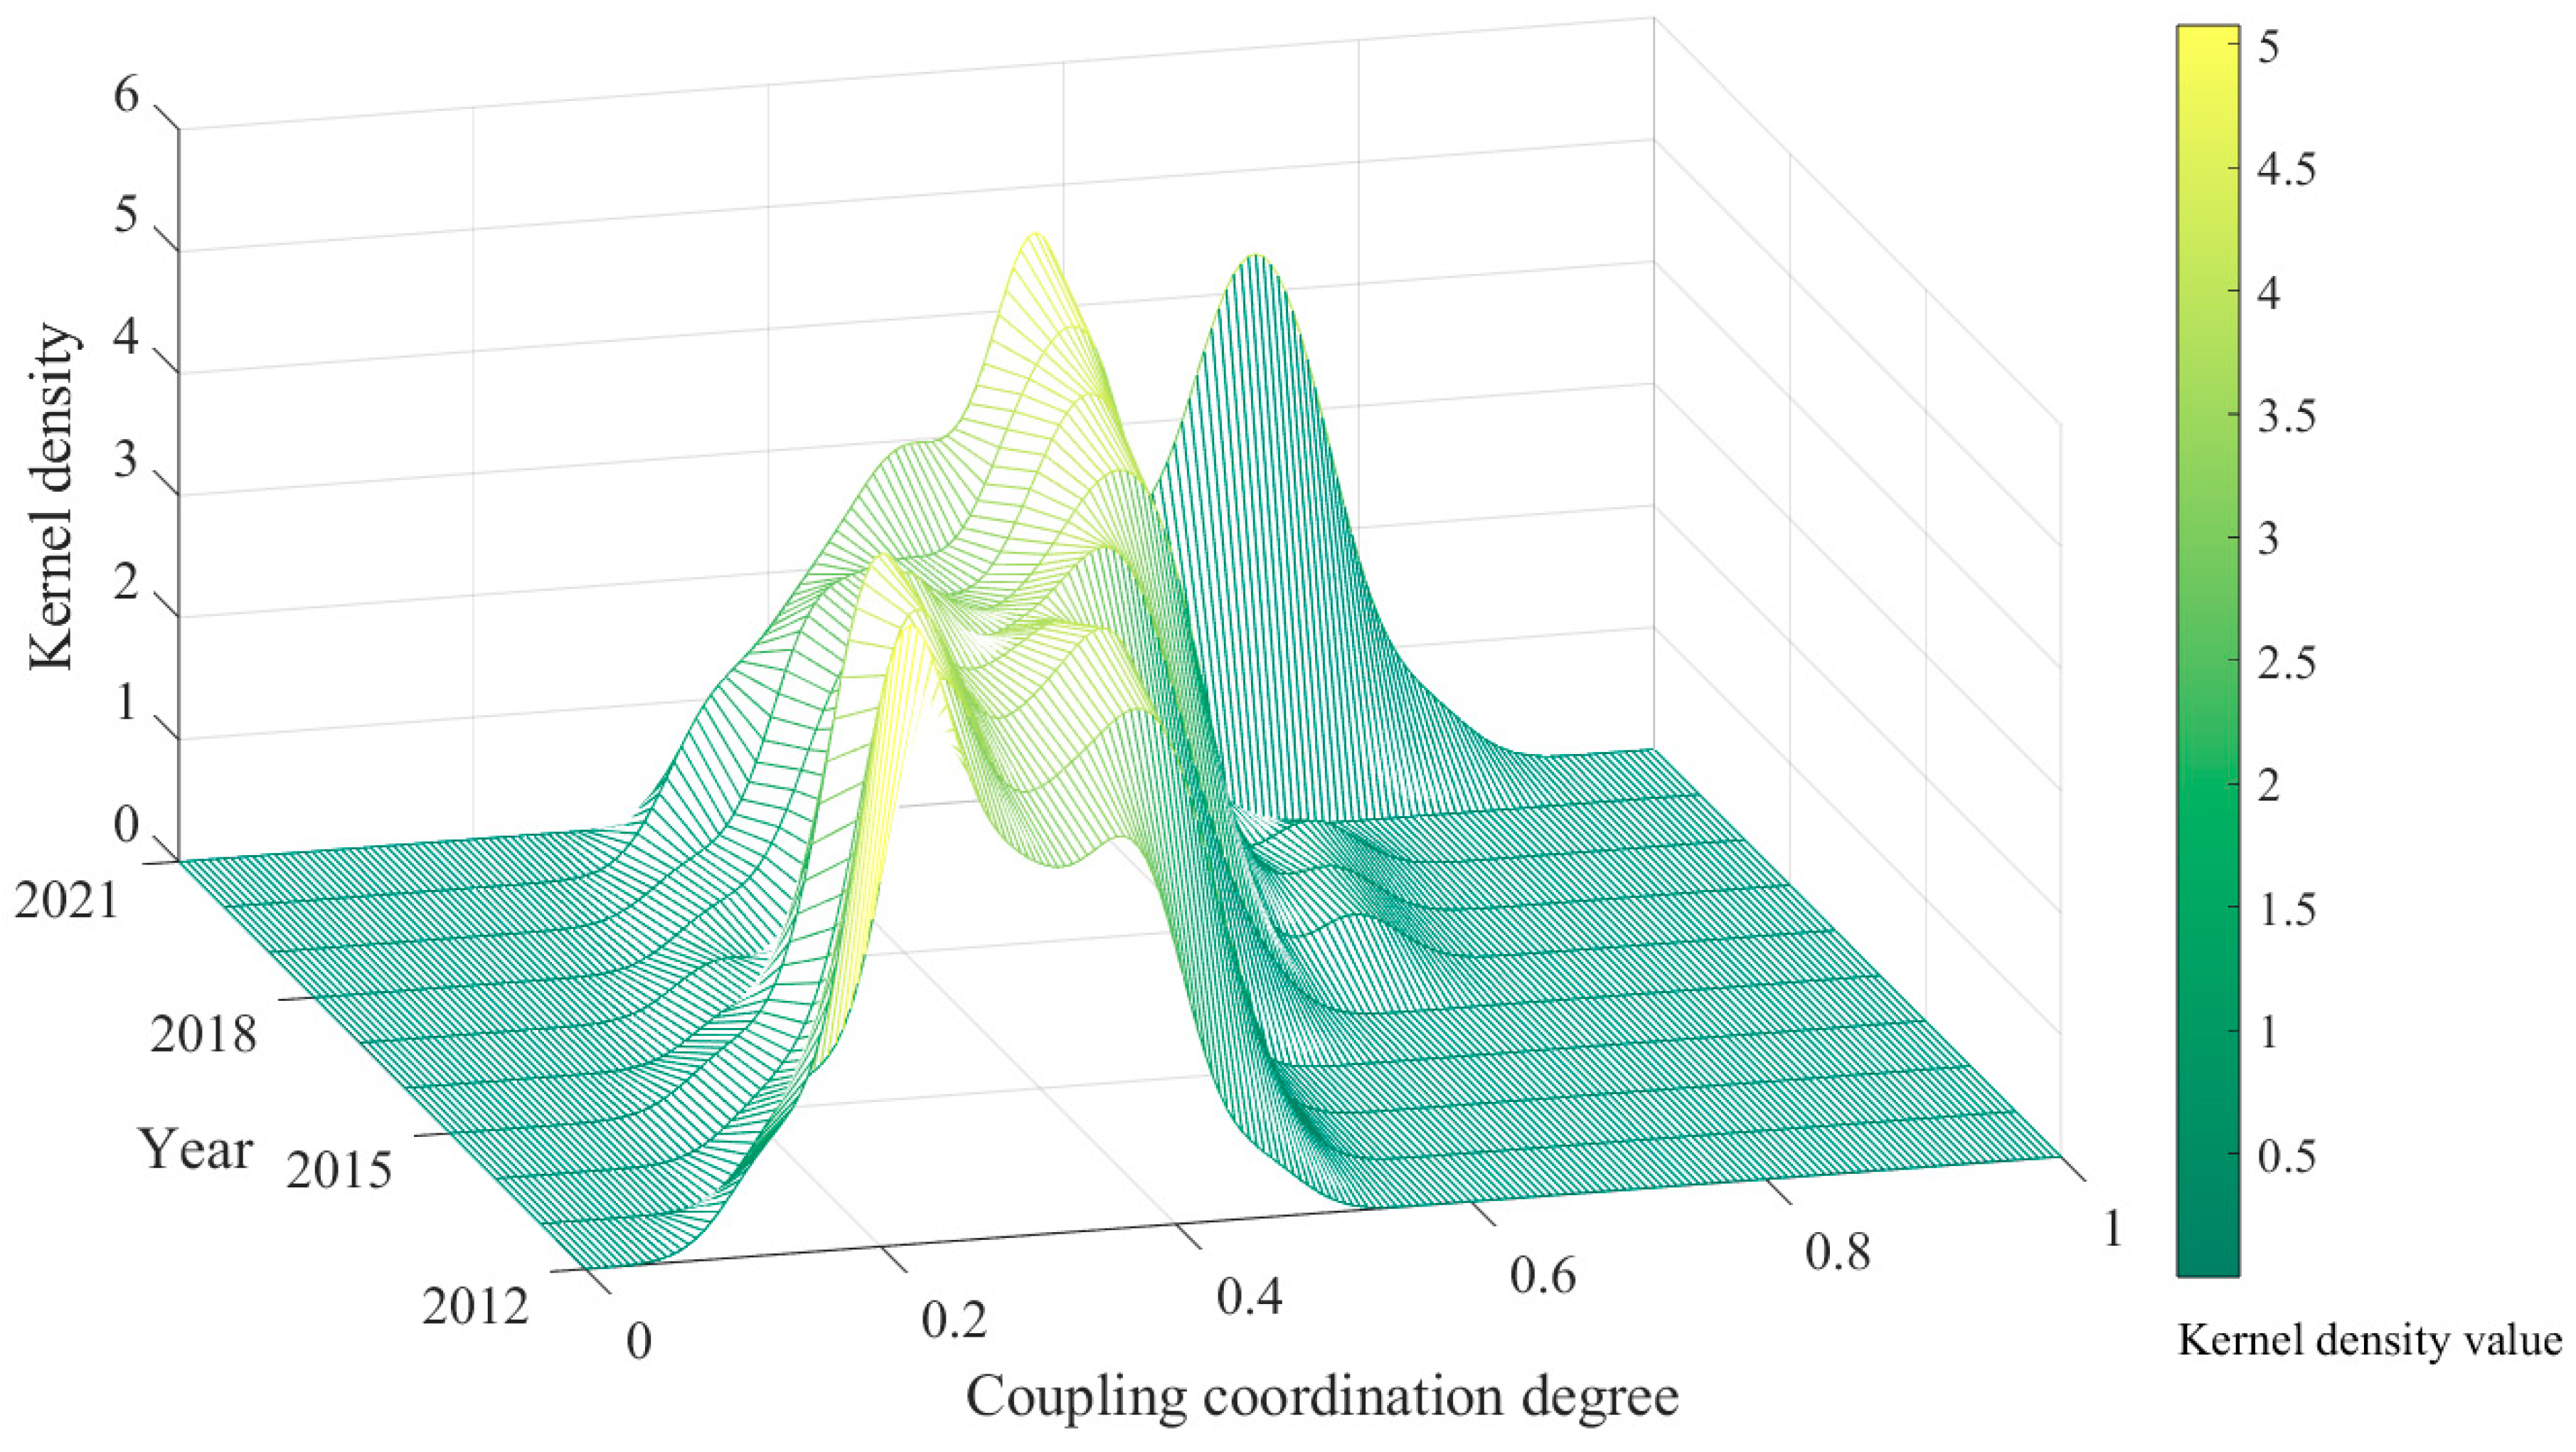
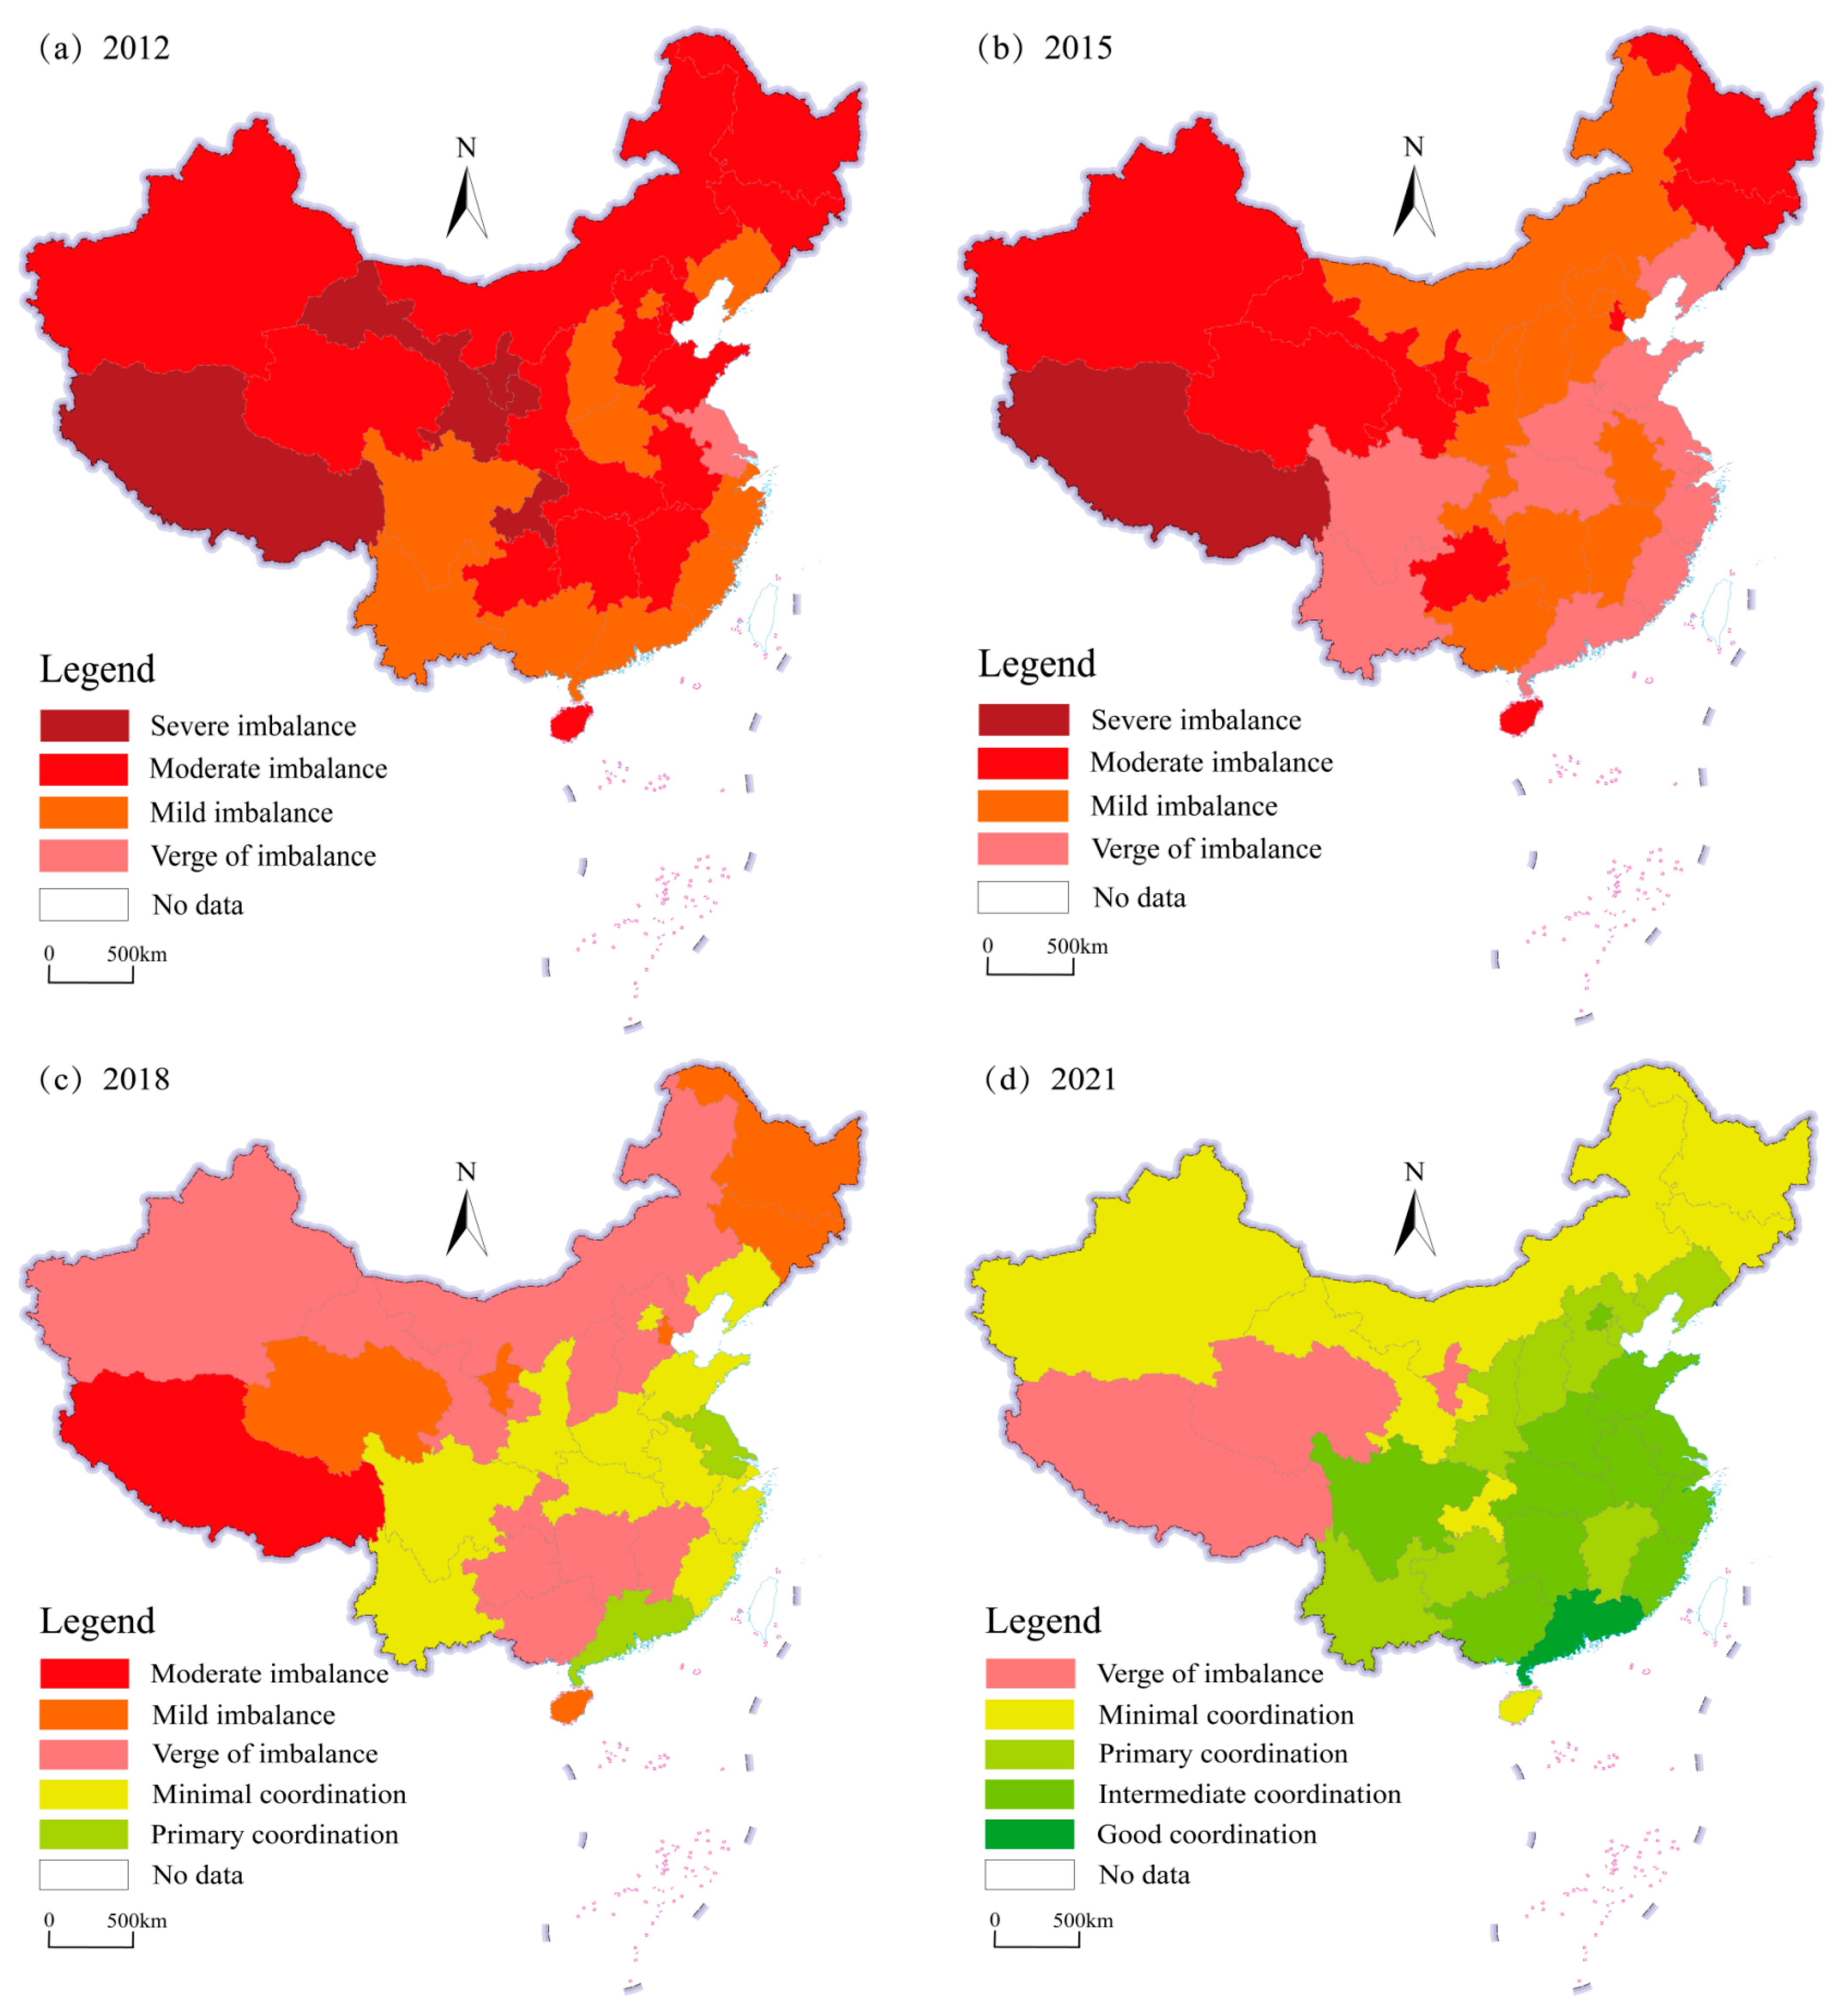
Disclaimer/Publisher’s Note: The statements, opinions and data contained in all publications are solely those of the individual author(s) and contributor(s) and not of MDPI and/or the editor(s). MDPI and/or the editor(s) disclaim responsibility for any injury to people or property resulting from any ideas, methods, instructions or products referred to in the content. |
© 2025 by the authors. Licensee MDPI, Basel, Switzerland. This article is an open access article distributed under the terms and conditions of the Creative Commons Attribution (CC BY) license (https://creativecommons.org/licenses/by/4.0/).