1. Introduction
The hospitality industry’s vulnerability to external disruptions, such as economic downturns, global health emergencies, and geopolitical disputes, underscores the need for a comprehensive analysis of the risk dynamics within it. In the context of interconnected global markets, the discourse on risk transmission has garnered significant attention in recent years. The ongoing discussion has transitioned from disputing the need for the challenge to examining the methods used to accomplish it, mitigating the adverse socioeconomic impacts, and identifying the crucial economic sectors that will spearhead this undertaking [
1]. The Chinese hospitality industry, which is a fundamental component of economic growth, is extremely vulnerable to economic, political, and environmental threats. The Chinese hospitality industry has become a significant worldwide player in recent years, showcasing the country’s strong economic expansion and rising consumer expenditure. However, this expansion has also resulted in increased susceptibility to systemic hazards, primarily due to the interdependence of many subsectors, including hotel resorts and luxury cruises, restaurants, the liquor and wine sector, film and entertainment, malls and supermarkets, leisure services, environmental and facilities services, air freight and logistics, railway and road transportation, which have a significant impact on the value chain of the hospitality industry. Many others are apprehensive about the increased enthusiasm for these transport sectors, arguing that focusing simply on hotels and entertainment does not provide a complete understanding of the hospitality value chain. A complex network of variables and environmental and facilities services that may help us understand the hospitality industry may show systemic dangers related to financial institutions, business risks, and failures.
Risk spillover refers to a situation in which the level of uncertainty or risk in one specific area or subsector increases and affects another area or subsector. Connectedness is utilized by researchers to comprehend the risks associated with networks. According to [
2], connectedness refers to the level of interconnections and interdependencies among the parts of a system. The study conducted by [
3] suggests that the connectivity technique has the ability to forecast future crises. The modern portfolio theory combines risk management and diversification by examining the relationship between financial theory and portfolios [
4]. Studying the impact of system-wide connectedness and systemic risk on the financial system is a fascinating endeavor [
5]. Therefore, risk management necessitates establishing connections, particularly in terms of default, return, and portfolio diversification. The connectedness model offers a comprehensive explanation of systemic risk by utilizing a network of elements. The system component linkage ratio is estimated. These models are able to identify the entities that transmit and receive systemic shocks, as well as detect the overall interconnectedness and accumulation of contagion within a system. In order to effectively manage risks in the financial market and monitor potential systemic dangers, it is crucial to accurately define the routes and forms via which stock sector risks are transmitted.
Dissecting risk transfer in Chinese hospitality industry is valuable. Over three decades of expansion and progress, China’s stock market has grown in size and scale. However, the Chinese stock market has grown slowly and is still immature, causing fast and substantial volatility [
6]. Many risk contagion studies have focused on financial markets, not hospitality. In recent years, spillovers and connectedness research has concentrated on financial market risk [
7]. This has led to a growing body of research on the interconnectivity of other variables. This includes studies on uncertainty connectedness [
8] and transport price transmissions which consider commodity, currency, and stock markets [
9]. People employ static models that may not effectively portray the spread of risk over time. This gap in the literature allows researchers to examine hospitality industry subsectors’ interconnections using more advanced and timely methods [
10]. Within the hospitality industry, this can lead to financial hardship, predominantly in the hotel and lodging industry, which in turn harms the travel and tourism industry, or vice versa [
11]. The Chinese hospitality industry’s subsectors impact the economy. These include employment creation, foreign trade, revenue generation, and GDP contribution [
12]. In the past, the hospitality industry has been cognizant of economic recessions, client preferences, environmental challenges, and global health emergencies [
13]. The economy is affected by COVID-19, with some subsectors being less vulnerable and others being more affected by China’s constraints. The pandemic has shown this susceptibility, affecting all hospitality industries [
14].
The relationships between value chain subsectors in the Chinese hospitality industry are important, yet understudied, especially in terms of risk transmission. There has been research on the overall effects of economic shocks on the hospitality industry, but not on how they spread across submarkets like hotel resorts and luxury cruises, restaurants, liquor and wine, film and entertainment, malls and supermarkets, leisure services, environmental and facilities services, air freight and logistics, railway transport, and road transport. Effective risk management requires a thorough understanding of the complex mechanisms that transfer risks in the value chain.
The COVID-19 pandemic has altered the spread of risks, but there is less understanding of how hospitality businesses transfer risks within their value chains. Kumar (2023) conducted a study that examined how changes in uncertainty affect the stocks of the European travel and leisure sector [
15]. The study used the copula-based conditional Value-at-Risk (CoVaR) technique and identified a notable transfer of risk. Shahzad et al. (2022) conducted a study on the relationship between US-based tourism companies during the COVID-19 pandemic [
16]. They discovered evidence of increased risk contagion, particularly in extreme cases, and observed that tiny tourism firms had gained more significance in the overall system. In a similar vein, Hadi (2023) employed TVP-VAR to determine that hotels, transportation, and recreational-based enterprises have a net effect of transmitting spillovers to other sectors inside the United States [
17]. In addition, Abdelsalam et al. (2023) demonstrate that certain subsectors within the tourism industry are more impacted than others, with restaurants and airlines being noticeably affected [
18]. In their study, Hu et al. (2024) examined the impact of COVID-19-related news on the return and volatility of four regional travel and leisure companies [
19]. Their findings suggest that the shocks in these stocks are primarily influenced by short-term variations.
The primary objective of this study is to investigate the interconnection between hospitality stocks and the mechanism of risk transmission within the value chain of the Chinese hospitality industry. Using the TVP-VAR model, this research aims to provide empirical evidence on the spillover effects among different hospitality sub-sectors and analyze the impact of economic and geopolitical events such as COVID-19 and the Russia–Ukraine conflict. The findings offer practical insights for risk management and policy formulation within the hospitality sector.
The precise mechanisms by which risk is transmitted across the value chain of the Chinese hospitality industry before, during, and after the COVID-19 pandemic and the Russia–Ukraine war remain unresolved, despite the manifest repercussions of both events. The impact of the pandemic and the Russia–Ukraine war has necessitated a fresh analysis of the inter-industry ties within the Chinese hospitality industry to reassess the risk management strategies. This study conducts an examination of the interrelationship between various subsectors of the Chinese hospitality industry value chain both prior to and in the aftermath of the pandemic as well as the Russia–Ukraine conflict to identify subsectors that are prone to risk and vulnerability fills the above-identified gap in the literature.
This study investigates the risk transmission mechanism in the Chinese hospitality industry. Based on the literature and the study’s objectives, we propose the following hypotheses:
H1. Some of the sub-sectors within the Chinese hospitality industry act as risk transmitters, while others act as risk receivers.
H2. External economic and geopolitical shocks significantly impact the risk transmission dynamics within the Chinese hospitality sector.
H3. The TVP-VAR model effectively captures the time-varying nature of risk transmission among Chinese hospitality subsectors.
The use of the TVP-VAR [
20] model for this study is based on its exceptional capacity to represent the dynamic and developing nature of risk transmission within the Chinese hospitality industry. The TVP-VAR model differs from standard models like GARCH or DCC-GARCH by allowing the coefficients to fluctuate dynamically, capturing real-time fluctuations and shifts in risk interdependencies among subsectors, instead of assuming static correlations between variables over time. This aspect is especially vital considering the swiftly evolving economic environment and the occurrence of substantial external disruptions, such as the COVID-19 pandemic and the Russia–Ukraine conflict, which have had deep and time-critical effects on this sector. The TVP-VAR model’s ability to capture these dynamic interactions makes it a valuable tool for analyzing how risk is communicated during periods of increased volatility and for identifying the individual subsectors that play a key role in transmitting or receiving risk over time. The study employs the TVP-VAR [
20] methodology to offer a more detailed and precise analysis of risk dynamics, providing useful insights that are crucial for stakeholders involved in risk management and policy development in the hospitality sector.
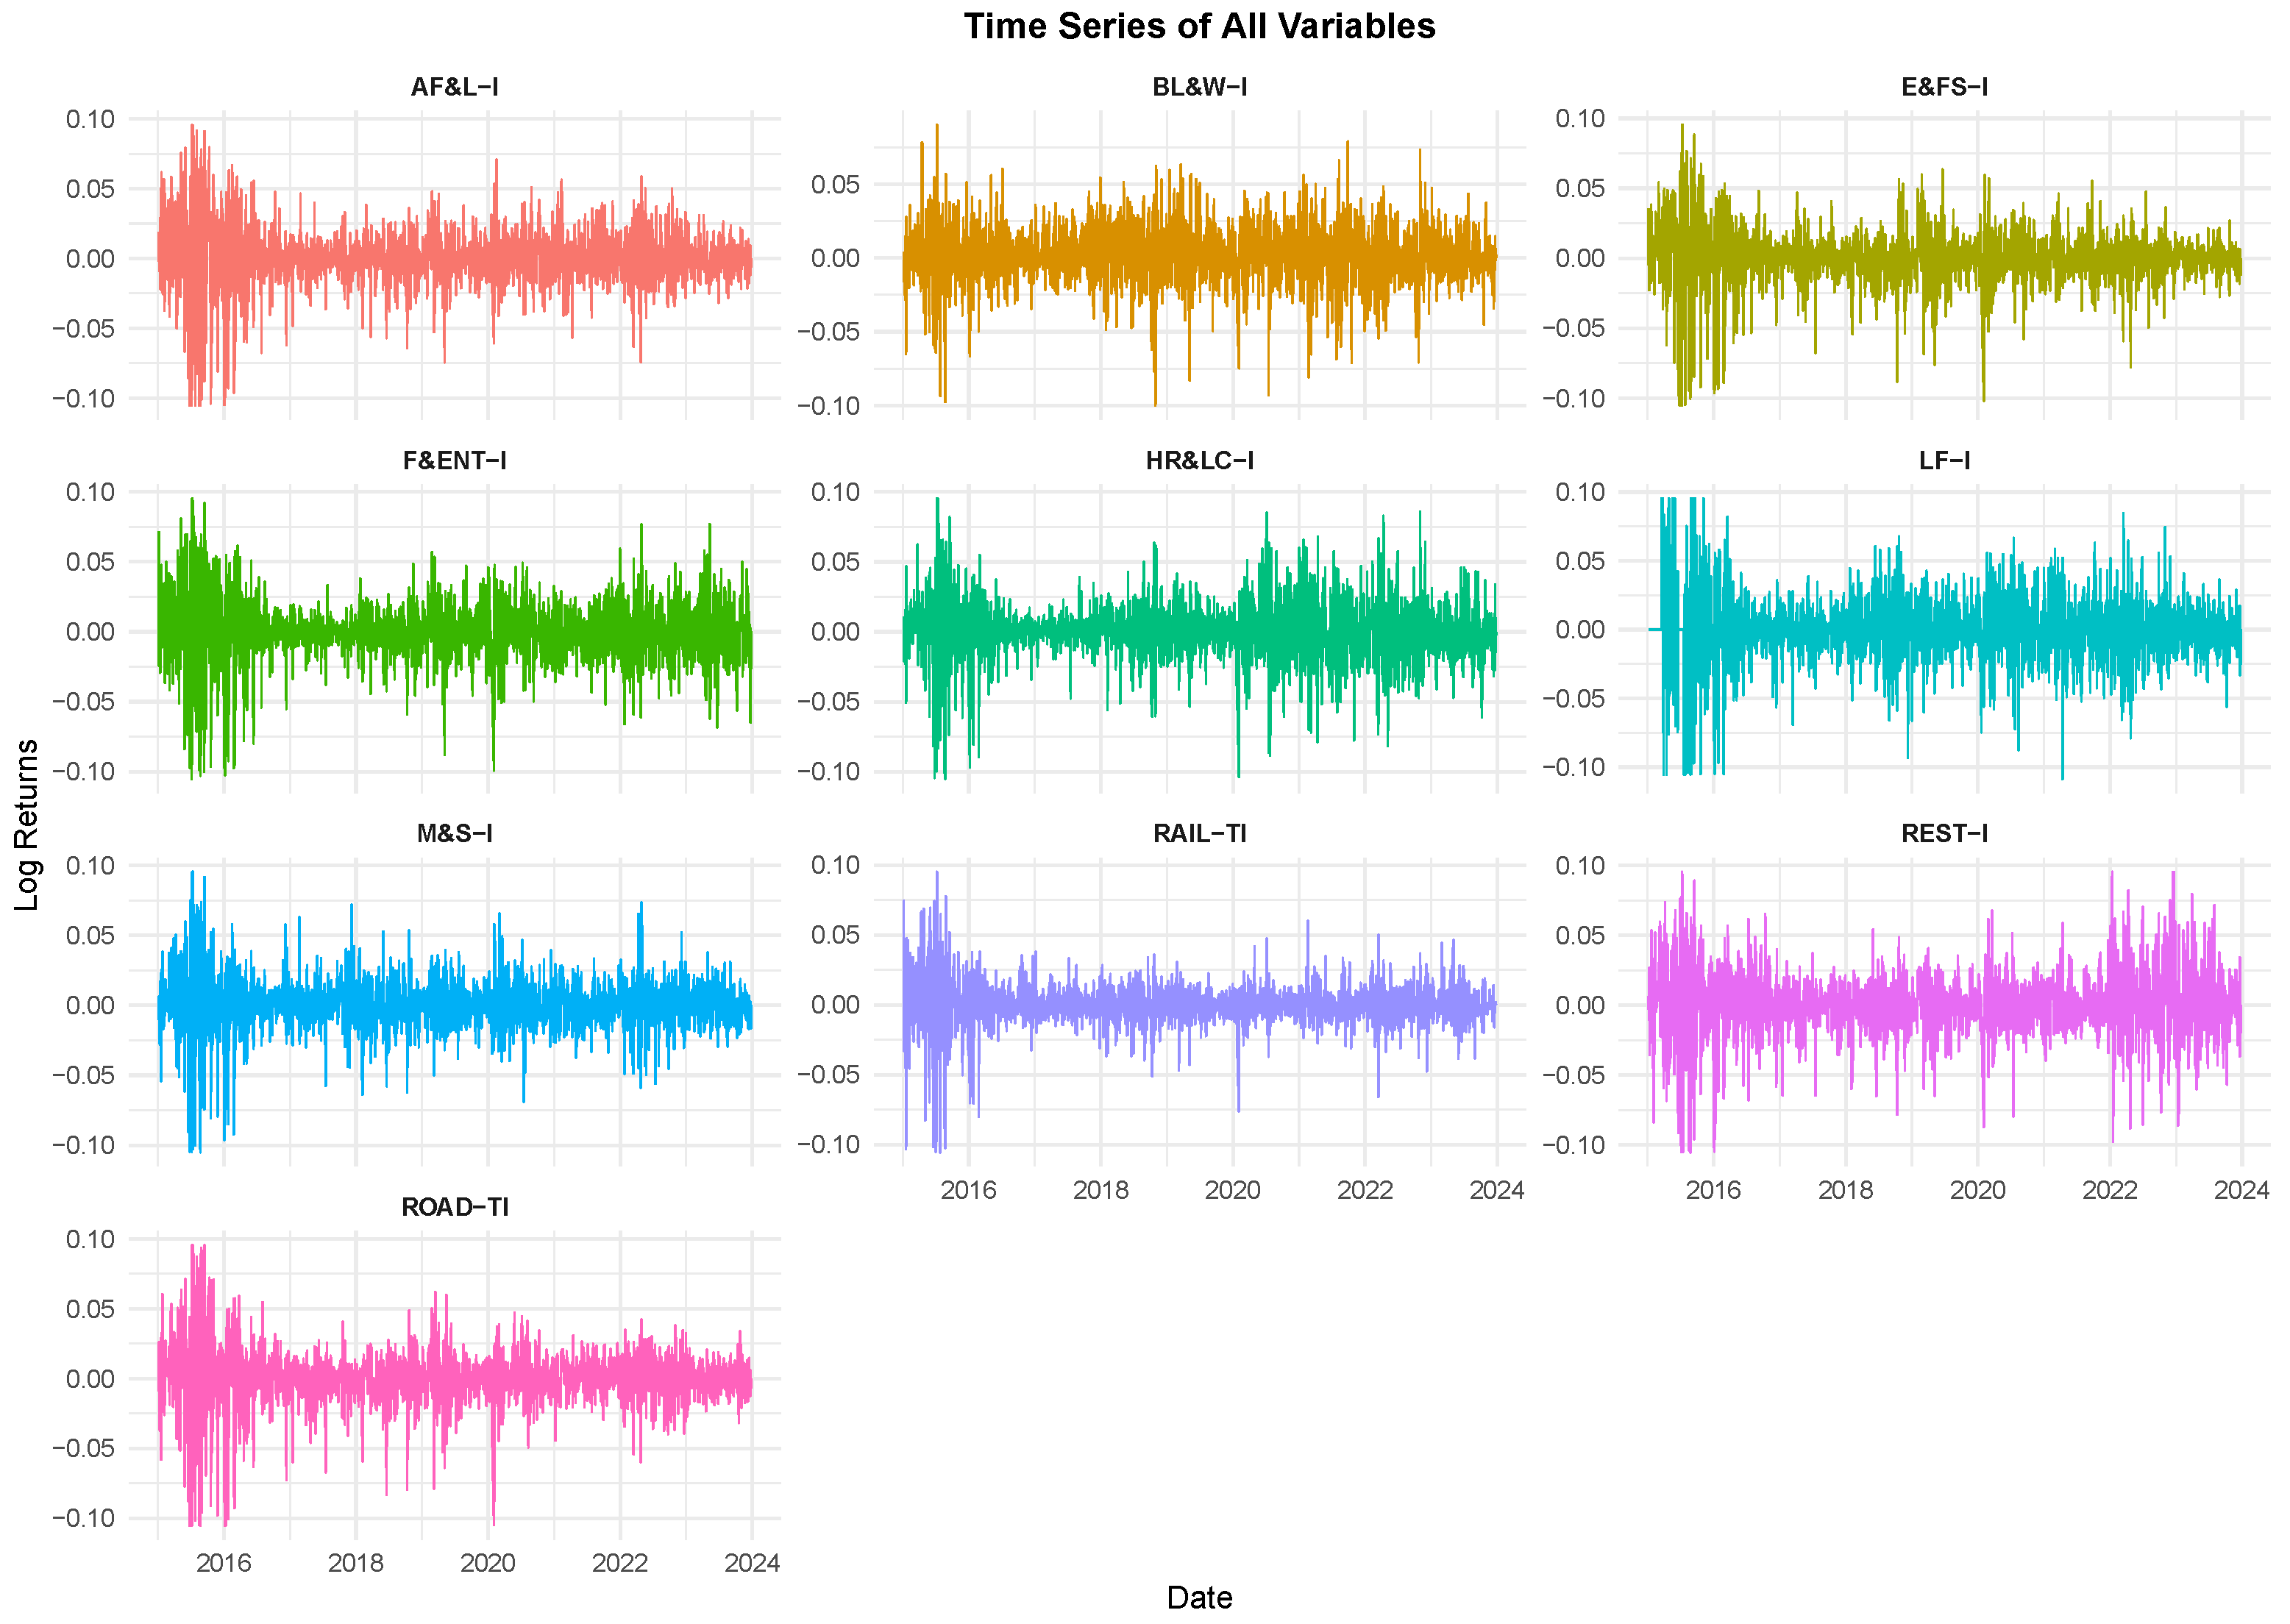
This study highlights the significance of analyzing the spillovers and interconnections among ten Chinese hospitality indices which comprehensively cover the value chain of Chinese hospitality industry, namely the Wind Environmental and Facilities Services Industry Index (E&FS-I), Wind Air Freight and Logistics Industry Index (AF&L-I), Wind Railway Transport Industry Index (RAIL-TI), Wind Road Transportation Industry Index (ROAD-TI), Wind Hotel Resort and Luxury Cruise Industry Index (HR&LC-I), Wind Leisure Facilities Industry Index (LF-I), Wind Restaurant Industry Index (REST-I), Wind Film and Entertainment Industry Index (F&ENT-I), Wind Mall and Supermarket Industry Index (M&S-I), and Wind Baijiu Liquor and Wine Industry Index (BL&W-I). The study examines the time frame from 5 January 2015 to 26 December 2023, which includes significant events such as the stock market crash in China in 2015, the coronavirus pandemic in 2019, and the Russia–Ukraine war in 2022. Its objective is to provide insights into the ongoing discussions about the significance of spillovers and interconnectedness applications.
The findings indicate a notable and fluctuating disparity in the distribution of risks among various hospitality stocks in China. The empirical research discovered that AF&L-I, ROAD-TI, HR&LC-I, E&FS-I, F&ENT-I, and M&S-I act as channels for the transmission of risk. BL&W-I, RAIL-TI, LF-I, and REST-I face several risks. Furthermore, notable political and economic advancements have a profound impact on the uneven transmission of returns, altering the magnitude and direction of the transmission between different sectors.
This study makes numerous substantial contributions to the current body of literature on the economic stability and risk transmission within the hospitality industry, with a particular emphasis on the Chinese market. Initially, it introduces a novel application of the TVP-VAR [
20] model to accurately represent the dynamic and evolving nature of risk transmission across various subsectors of the hospitality industry. This method enables a more precise and nuanced comprehension of the manner in which risk is disseminated throughout the industry, particularly pre, during, and after periods of increased economic and geopolitical instability, such as the Russia–Ukraine conflict and the COVID-19 pandemic. Secondly, the research identifies and classifies critical subsectors as either transmitters or receivers of risk, providing novel insights into the structural vulnerabilities and interdependencies of the industry. These findings have practical implications for the development of investment strategies, risk management, and policy formulation, offering stakeholders actionable insights to improve the resilience and stability of the hospitality sector. Thirdly, the research offers policymakers insights into the instruments that can be used to advance sustainability in the transportation, environmental and facilities and other hospitality sectors. Finally, this study contributes to the current body of knowledge by incorporating the examination of global events and their influence on the transmission of industry-specific risks. This closes a lacuna in the literature and establishes the foundation for future research on comparable phenomena in other industries or regions.
It is of the utmost importance for industry stakeholders, investors, and policymakers to acquire a thorough comprehension of these spillage processes within the Chinese hospitality industry, particularly in order to develop effective strategies to manage crises and mitigate risks. Further, there is an increasing tendency among investors to distribute sector assets, which has led to the occurrence of segment volatility clustering. As a result, the values of numerous stock sectors frequently fluctuate in tandem. This implies that the interconnections between various sectors are becoming more robust, facilitating the convergence and dissemination of financial risks. The investigation examines the mechanisms of resilience and the strategies of adaptation that these subsectors employ in response to the transmission of risks. We aim to provide valuable information that can improve the strategies for risk management and crisis response in the hospitality industry.
2. Background and Literature Review
Clarifying systemic risk’s precise meaning in the context of the stock market should come first before putting it through a thorough measurement process. Since earlier research on the topic focused more on the issue of economic systems from a broader perspective rather than on a particular segment, there is currently no agreed-upon, standard description of systemic risk in the financial market [
21]. Systemic risk is defined by [
22] as the likelihood that the majority or all of the system’s components will move in tandem to cause a breakdown. Lin (2008) posits that market risk manifests as a series of adverse economic events, such as noteworthy losses incurred by financial organizations or fluctuations in market prices resulting from a trigger occurrence [
23]. Benoit et al. (2017) defines the systemic risk as the likelihood that utmost investors would agonize sizable losses all at once [
1]. The arguments mentioned above, although lacking a clear definition, share several common characteristics that help us identify non-diversifiable risk in the stock market: (i) a broad rather than a focused impact; (ii) a chain reaction that amplifies the initial shock throughout the entire market; and (iii) unfavorable repercussions, whereby every sector of the stock market collectively suffers from the detrimental consequences of a market collapse.
An important focus in studying the spread of risk is the precise and effective detection and measurement of systemic risk. There are two methods for assessing systemic risk: one involves constructing indicators based on asset returns or conducting stress tests; the other entails calculating risk dependency to evaluate the transmission of risk between financial institutions and their impact on market risk [
24]. The mechanism that is most frequently used to evaluate the risk of assets is the Value-at-Risk (VaR) approach, with particular focus on the potential losses in extreme scenarios. However, this method fails to consider the interconnectedness of several assets and focuses solely on the risk associated with an individual asset. CoVaR is a metric that evaluates the value of the financial system at risk by taking into account the likelihood that an institution would experience problems. Furthermore, market risk is quantified by employing ΔCoVaR, which is characterized as a difference between CoVaRs in regular circumstances and extraordinary situations [
25]. Smaga (2014) states that the contagion mechanism facilitates the spread of hazards across the entire system, and the main factor contributing to the imperfect nature of risk in the stock market is the interconnections between industry sectors [
26]. Diebold and Yılmaz (2014) introduced a cutting-edge technique to statistically assess spillover effects via connectedness by analyzing the variance decomposition of forecast errors [
2]. The network approach has significant potential to portray the interconnectivity in the financial markets [
2]. The time-varying parameters vector autoregressions method was first developed by [
27] and is subsequently improved upon by [
20].The TVP-VAR framework [
20] is employed in conjunction with the FEVD-based connection technique [
2]. The study also uses [
2] the network approach to fully understand the risk transmission mechanism of the Chinese hospitality industry.
According to [
28], the financial market is a reliable gauge of the state of the economy’s finances and future prospects. One of the hottest finance-related topics is volatility, which gauges turbulence and unpredictability in financial markets. According to [
29], market uncertainty, institutional problems, and economic factors can all contribute to volatility in the financial markets. Crisis periods cause markets to become more erratic. The performance of stock markets is typically poisoned by any crisis or uncertainty in the global markets [
30]. Researchers usually try to figure out how a crisis affects stock markets whenever one happens. The relationship between stock market volatility and crises has been the subject of extensive investigation. Global financial markets suffered as a result of the 1997 Asian crisis, which sent shockwaves through the whole economy [
31].The US subprime mortgage business caused the US subprime lending crisis in July 2007, causing significant disruption to global financial markets and international stock exchanges [
31]. The Great Depression of 1929–1939 is thought to have been less severe than the global financial crisis of 2007–2009. Developed and developing nations were both affected by the economic slump during this crisis [
31]. The writers discovered that the banking industry was the most adversely affected. The financial sector experienced a sudden surge in volatility, leading to the failure or imminent collapse of several financial institutions [
31]. In 12 countries, the study found a link between uncertainty in economic policies and tourism [
32]. Nguyen et al. (2020) found global data indicating that economic policy uncertainty results in reduced tourist spending [
33]. This is due to visitors traveling more frequently but spending less money per trip, indicating that they are primarily traveling to neighboring countries. Tourism companies are very sensitive to infectious diseases. Chen et al. (2007) have shown how SARS affected restaurants and motels [
34]. Several studies have provided in-depth analysis of the unique sector-specific attributes of the US and Chinese economies amid the pandemic, with particular emphasis on the tourism industry. The recent surge in COVID-19 cases is likely to result in a rapid decline in both incoming and outbound tourism due to the health hazards posed by virus-related infections stemming from virus epidemics. Tourists avoid visiting particular geographical locations as a result of government restrictions. Health crises in the study environment may lead to substantial market changes in impacted regions when travelers intentionally choose to steer clear of certain crises [
35]. Travelers’ attitudes and decisions may be influenced by the perceived health hazards [
36]. The expression ’crisis’ refers to unexpected and sudden happenings which could end in civic unrest and public danger. Disease outbreaks in such situations pose challenges for people across various geographical regions or globally [
37]. Often, one particular region begins to suffer with a health issue before it spreads nationwide or worldwide, as was the case for the recent COVID-19 pandemic [
38]. Tourists should choose to visit less congested locations in order to practice social distancing [
35]. Travelers might anticipate a restricted employee–client interaction when it comes to accommodation facilities. Wen et al. (2021) found that managers were required to predict the expansion of hotels post-COVID-19 and concentrate on preparing for future crisis situations [
39]. Gössling and Higham (2021) comprehensively analyzed aviation, airline, and hotel impacts worldwide [
40]. They researched historical plagues and pandemics and COVID-19’s travel limitations and lockdown effects. Gössling and Higham (2021) assert that pandemics or epidemics can have significant effects on tourism, domestic economies, and societies, as confirmed by empirical data [
40]. Illness outbreaks are anticipated to exacerbate the strain on tourism and other businesses that sustain the most impoverished economies worldwide. Modifying the working behaviors of hotel staff could worsen the negative consequences. Tsionas (2021) anticipated gradual adjustments in travel, hospitality, and related sectors after the COVID-19 pandemic [
41]. Tsionas (2021) concluded that hotels with limited capacity needed government subsidies that varied greatly [
41]. Dolnicar and Zare (2020) stated that the current COVID-19 epidemic is the most damaging tourist catastrophe, surpassing prior setbacks [
42]. Every decline in a certain area prompted inquiries about the industry’s future outlook. The main concerns were primarily focused on the cruise industry. An authoritative study showed that China was the first country to be struck by COVID-19, which had a unidirectional impact on global stock markets due to their interconnection [
43]. This study was crucial for investors, as it helped them to determine whether the industry’s performance was better or worse in comparison to others, allowing them to make informed decisions about short- or long-term investments alongside equity returns. Tourism was seen as highly susceptible to the effects of the COVID-19 pandemic. During COVID-19, a strong connection between these sectors was expected, which worsened industrial performance [
44].
4. Empirical Results and Discussion
The findings are derived from a TVP-VAR model with a lag length determined by the Bayesian Information Criterion (BIC) and a 12-step-ahead generalized prediction error variance decomposition.
4.1. Detail Discussion
We present the results of our empirical study on the relationships between stocks in the hospitality sector using the model created by [
20]. Firstly, we display the Total Connectedness Index (TCI) across the whole period. This report conveys a thorough investigation of the interconnections and uneven transmission of returns between several industries, including stocks in the hospitality business. Furthermore, it analyzes the correlation between the transportation and hotel industries.
The static measure provides a thorough comprehension of the overall interconnectedness of various sectors. Subsequently, we analyze the fluctuating trends of the TCI in correlation with economic and political occurrences, encompassing the susceptibility of asset values. This enables us to examine the fluctuations in the degree of interdependence among various sectors in reaction to particular economic and political occurrences within a designated timeframe. This technique is crucial for assessing the fluctuations in the correlation across hospitality equity markets that are impacted by external events.
Our findings align with previous research on financial spillover effects in tourism and hospitality-related industries. For instance, Brida et al. (2016) explored how the interconnectedness of hospitality stocks influences sector-wide volatility [
32]. Similarly, Chen et al. (2007) examined how external crises, such as the SARS outbreak, affected the stock market, leading to increased systemic risk in tourism-dependent sectors [
34].
Our results indicate that key risk transmitters in the Chinese hospitality industry include the HR&LC-I, F&ENT-I, and AF&L-I. These industries exhibit strong outward risk spillover effects, meaning that their financial fluctuations significantly impact other sectors.
Conversely, risk receivers such as REST-I, BL&W-I, and LF-I display greater sensitivity to external economic and geopolitical shocks, particularly in times of financial crises. This pattern is consistent with findings from [
56], which demonstrated that certain subsectors are more susceptible to incoming risk flows due to limited financial buffers and higher operational dependencies.
Nevertheless, the TCI findings offer a restricted viewpoint, concentrating on the general level of connectivity rather than the precise interactions of sectoral industrial stocks. In order to tackle this issue, we will now describe the outcomes of net directional connectivity, focusing on hospitality sectors. Additionally, we will examine the NPDC and pairwise connection between different sectors. This research enables us to comprehend the asymmetrical relationships and mutual interconnectedness of specific sectors within the hospitality industry. Through the analysis of these indicators, we acquire an inclusive understanding of the process by which interconnections are established between specific sectoral industrial stocks. We begin by calculating the average connectivity metrics inside the sector network using all the available observations.
The average connectivity index for stocks is provided in
Table 4.
Table 4 displays the shocks that have an impact on various sectors in non-diagonal elements, whereas the principal diagonal elements represent shocks that are specific to the innovation itself. For instance, the column/row with the highest value of 38.69 in the BL&W-I reflects the extent to which its innovations affect the variability of the forecast inaccuracy.
The column and row residual values show shock transmission between the Baijiu liquor and wine industry and other sectors, both sending and receiving. The “To” and “From” connectedness indices are shown by the non-diagonal element totals in each column and row. These indexes measure each sector’s overall directional influence. The “NET” connectedness index row illustrates the sector spillover impact by comparing the “TO” row with the “FROM” column.
Baijiu liquor and wine industry has the highest net connectedness index of (−11.04), indicating that it receives the most connections. On the other hand, the hotel resort and luxury cruise and air freight and logistics sector has the strongest net sending capacity, with a net connectivity value of 7.14 and 7.09, respectively.
Furthermore, the study period consistently shows a negative net connectedness index for BL&W-I, RAIL-TI, LF-I, and REST-I. This suggests that the stock market provides more information to the markets about the performance of the static connectivity index than it receives from them. Therefore, it is crucial to focus on the influence of fluctuations in stock prices within the industry on the prices of these sectors.
This is vital for investigating the transmission mechanism among hospitality sectoral stocks during crisis periods. Furthermore, it functions as the main focal point of investigation in this work. The lower right corner the
Table 4 shows the TCI, which measures the percentage of FEVD that can be ascribed to cross-segment innovation within the network.
The total connectedness index (75.88%) designates a high degree of interconnectivity amongst sectors within this grid. To scrutinize the correlations among stock markets in the hospitality sector, our analysis primarily concentrates on the interplay between transportation and hospitality industry equities.
This analysis examines the impact of the interconnectedness of stocks between different hospitality industries stocks. The TCI between industry stocks is 75.88.
Furthermore, the row labeled “To” in the connectedness index emphasizes the cumulative impact of each sector’s directional shocks on all other sectors, whereas the “From” connectedness row focuses on the opposite direction.
The index column represents the cumulative impact of external shocks from various sectors. We see that the transfer of new ideas between different sectors of the hospitality industry is not equal in both directions. The term “connectedness” refers to the interdependence of several subsectors within the Chinese hospitality industry. This indicates the mechanism via which changes in one subsector might affect the stocks of other subsectors. The connectivity is established at 75.88, signifying considerable interconnectedness between subcategories within the hospitality industry. Significantly, empirical research revealed that AF&L-I, ROAD-TI, HR&LC-I, E&FS-I, F&ENT-I, and M&S-I act as risk transmitters. The following sectors, namely the BL&W-I, RAIL-TI, LF-I, and REST-I, are exposed to risk. The likely reason for the whole transfer of AF&L-I, ROAD-TI, HR&LC-I, E&FS-I, F&ENT-I, and M&S-I is rooted in their interdependence. These sectors are interdependent within the tourism business. The facts indicate that the involvement of hotels, entertainment and transportation has a direct influence on job development, with one out of every four individuals being eligible for employment. According to the estimate, the hospitality sector contributed 10.8% to the GDP. In comparison, the entire global job creation represents 10.6%. Three additional findings on recreational services reveal that the outdoor recreation sector contributes merely 1.8% to the present GDP of China, with minimal fluctuations observed among the primary states.
Conversely, entities that benefit from spillovers include BL&W-I, RAIL-TI, LF-I, and REST-I, along with other subsectors within the Chinese hospitality business. The receiver characteristics of these tourist subsectors reveal that BL&W-I, RAIL-TI, LF-I, and REST-I are the most vulnerable to external situations, such as global economic and financial considerations. Hence, fluctuating economic conditions, geopolitical dangers, and global pandemics significantly influence the interconnections between different sectors within the tourism business. Therefore, the subsectors that showed the greatest susceptibility to external influences are the ones that experience the most spillover effects.
In summary, our findings on the net interconnectivity of Chinese hospitality subsectors indicate that the AF&L-I, ROAD-TI, HR&LC-I, E&FS-I, F&ENT-I, and M&S-I sectors are the primary sources of spillovers, as they make significant contributions to the Chinese economy and create a large number of jobs. Furthermore, these six subsectors exhibit a strong interdependence, with each subsector enhancing the others in a significant manner. Therefore, these specific subsectors transfer spillover effects to other subsectors. In contrast, the remaining subsectors in the hospitality industry receive more spillovers than they generate. This indicates that they are particularly affected by external factors such as economic, financial, and geopolitical concerns. Thus, the remaining subsectors are exposed to risk transmission from the AF&L-I, ROAD-TI, HR&LC-I, E&FS-I, F&ENT-I, and M&S-I subsectors in a systematic fashion.
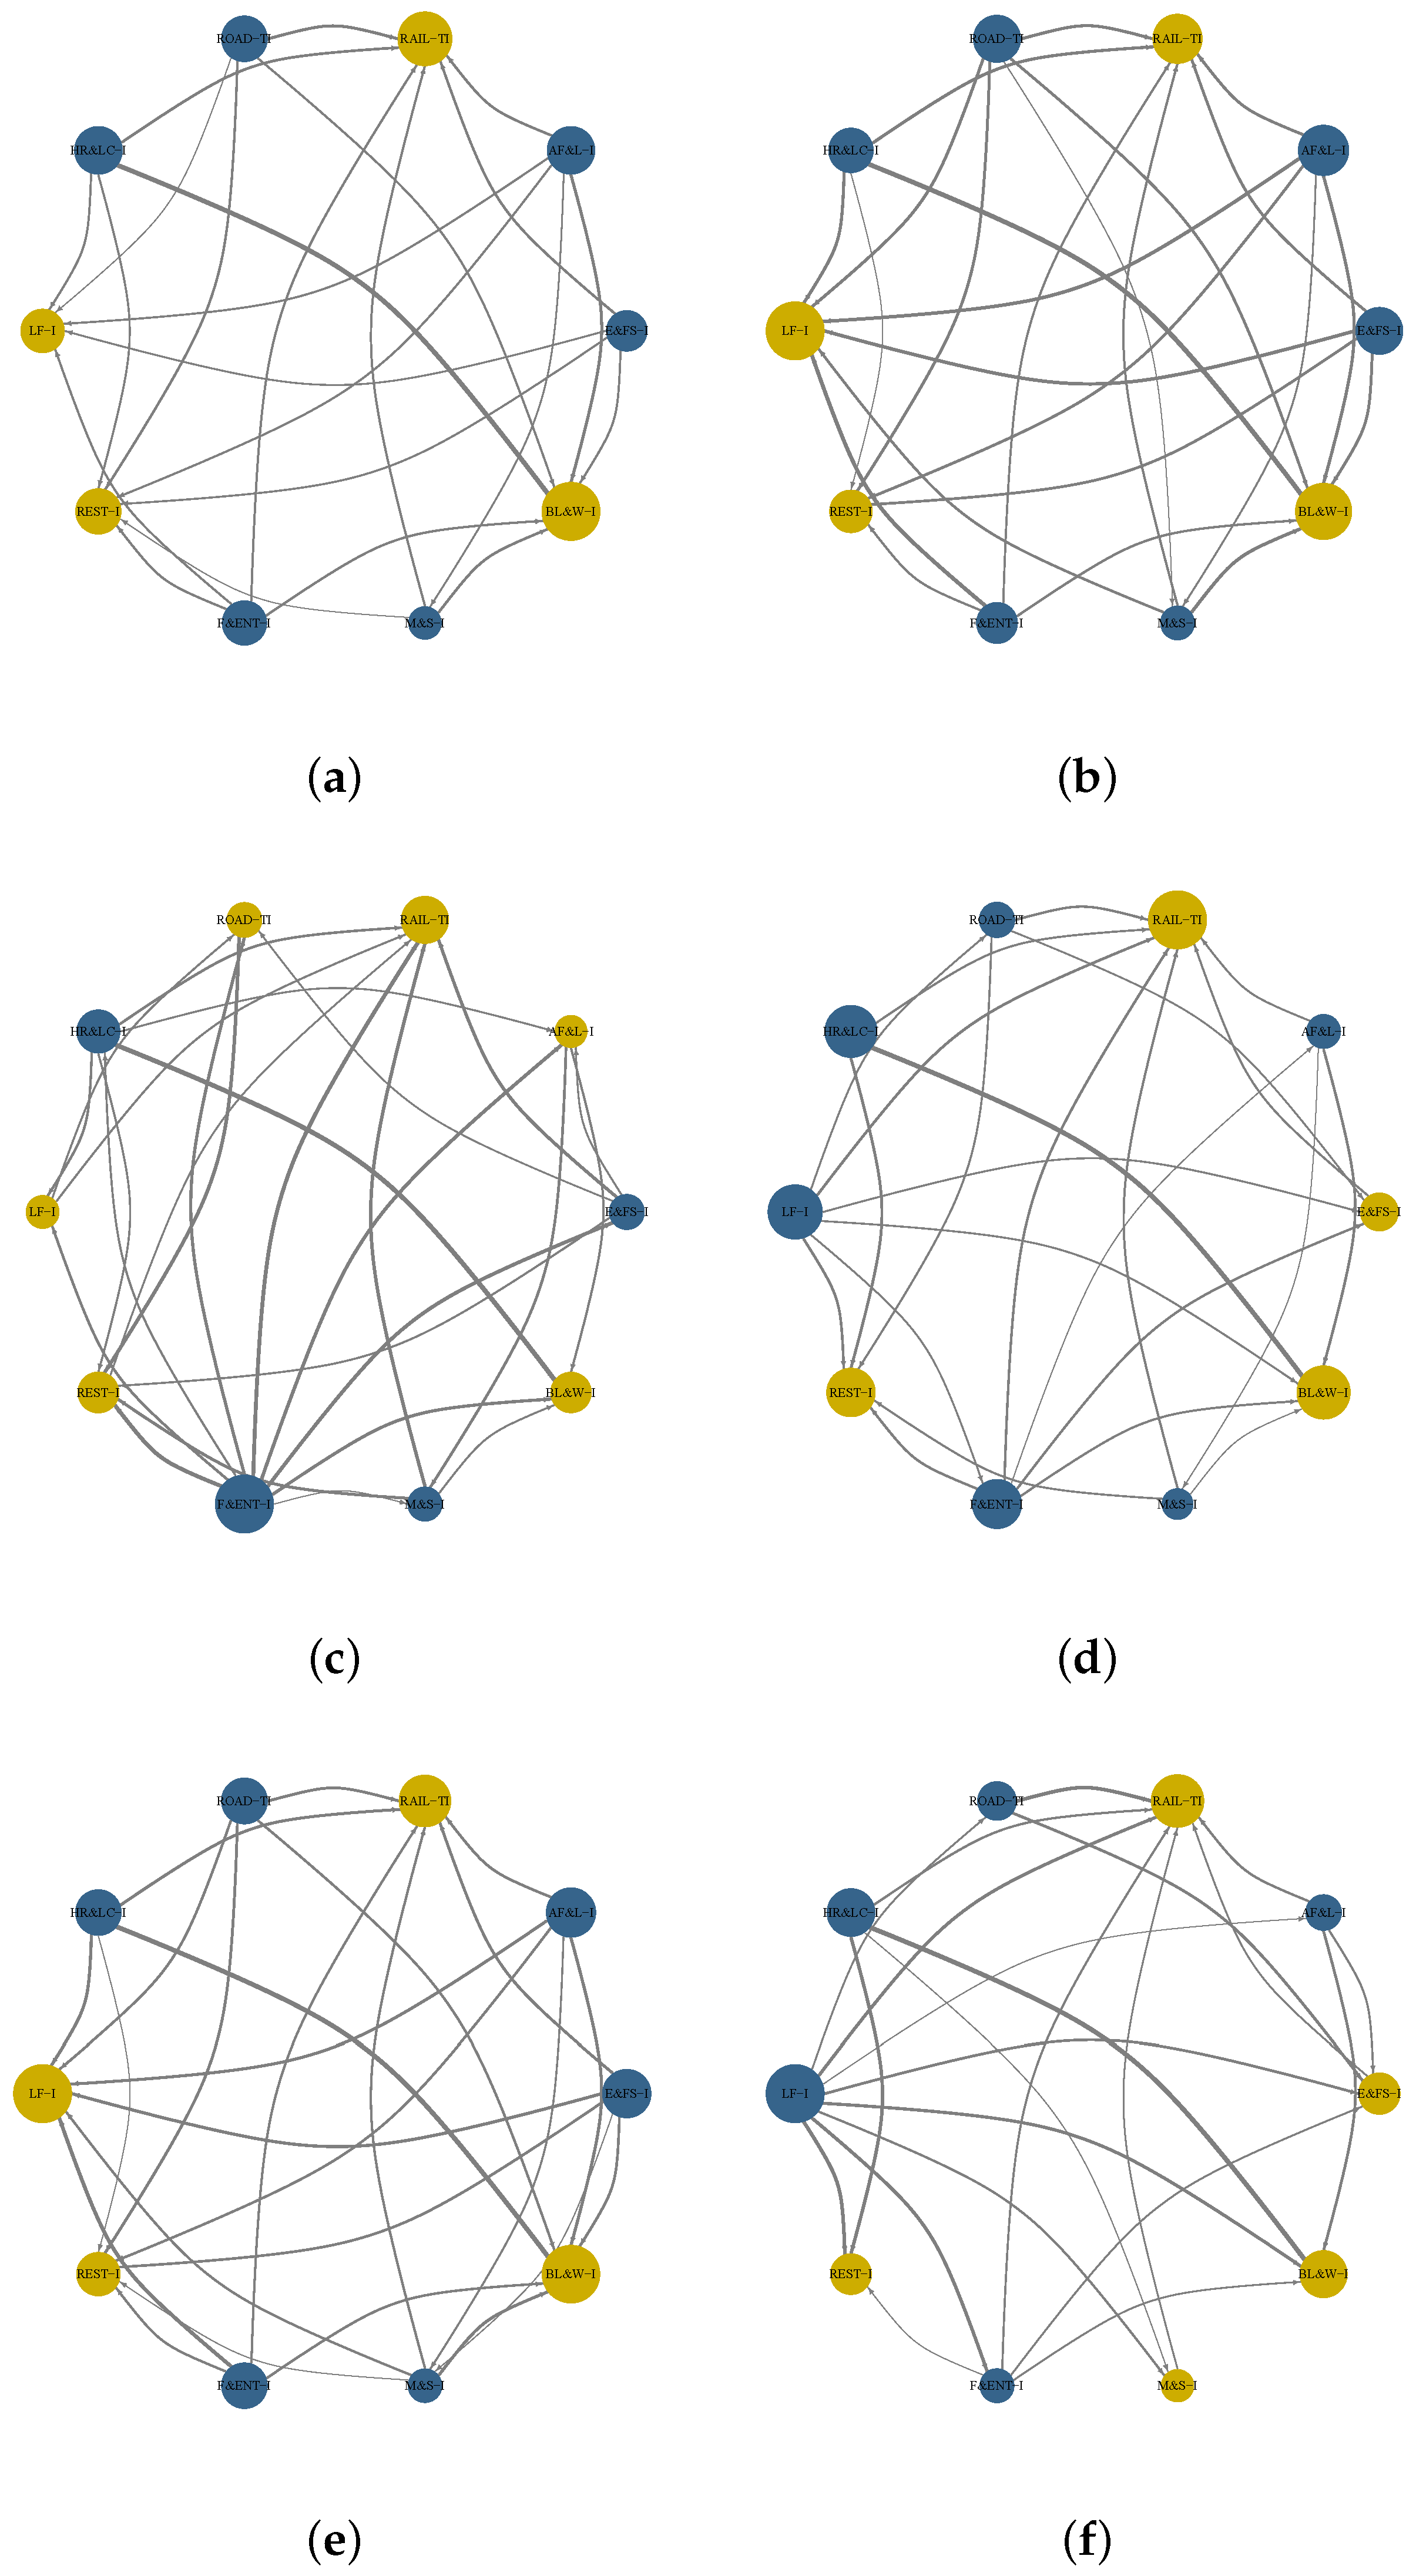
4.2. Network Diagram
Moreover,
Figure 2 shows six graphs that display networks corresponding to sectoral hospitality business stocks with fixed pairwise directed connection over important time periods:
- (a)
The entire sample period (5 January 2015 to 26 December 2023);
- (b)
Pre-COVID-19 and stock market crisis (5 January 2015 to 31 December 2019);
- (c)
The COVID-19 pandemic (1 January 2020 to 23 February 2022);
- (d)
Post-pandemic COVID-19 (1 January 2020 to 26 December 2023);
- (e)
Pre-Russia–Ukraine War (5 January 2015 to 23 February 2022);
- (f)
Recent Russia–Ukraine war (24 February 2022 to 26 December 2023).
Figure 2.
Yellow point means risk recipient and blue point means risk transmitter. Networks corresponding to sectoral hospitality business stocks have fixed pairwise directed connections over important periods. (a) The entire sample period (5 January 2015 to 26 December 2023). (b) Pre-COVID-19 and stock market crisis (5 January 2015 to 31 December 2019). (c) The COVID-19 pandemic (1 January 2020 to 23 February 2022). (d) Post-pandemic COVID-19 (1 January 2020 to 26 December 2023). (e) Pre-Russia–Ukraine War (5 January 2015 to 23 February 2022). (f) Recent Russia–Ukraine war (24 February 2022 to 26 December 2023).
The graphs demonstrate node size, node color, and line properties that accurately depict the market’s qualities. For example, the nodes size shows the economic significance of the interconnection among the hospitality sectors.
The nodes’ color in the network indicates whether they are recipients or senders. Yellow nodes represent recipients, whereas blue nodes represent senders. The thickness of arrows and edges linking the nodes indicate the strength of the direct connections.
Our analysis shows that BL&W-I, RAIL-TI, LF-I, and REST-I generally receive more shocks than they give during important political and economic events. M&S-I and E&FS-I generally transmit more risks than they receive during political and economic events.
However, the Russia–Ukraine war triggered a change in this trend. M&S-I and E&FS-I became receivers rather than transmitters and LF-I became a contributor to risk rather than a receiver.
This resulted in higher global energy prices, which made the transport sector a net contributor instead. Additionally, there was a notable increase in the impact of these changes on other sectors. Furthermore, the magnitude of reciprocal effects across sectors is less pronounced compared to the effects between stock sectors.
Moreover, the era after the crisis demonstrates a more robust level of interconnectedness between different sectors. The inter-nodal links in subgraphs have thicker curves. Nevertheless, the connections between different sectors fluctuate in times of crisis with varying causes. Amidst the stock market crisis in 2015, the turbulence in the stock market extended over the entirety of the market. During the COVID-19 financial crisis, which presented a worldwide systemic risk, the association between nodes showed increased intensity. The Baijiu liquor and wine industry node exhibits a pronounced coarsening, showing a robust correlation between other sectors.
Nevertheless, the aforementioned research only offers a fixed viewpoint of the possible interconnections within the sectoral hospitality industry stock networks and fails to provide an understanding of the changing dynamics of the hospitality industry in China. Furthermore, given the effect of significant economic and political events on the interconnectedness of sector networks across the observed period, it is essential to employ a time-varying dynamic analysis methodology. This method enables a more thorough comprehension of the asymmetrical relationships across sectors and offers useful insights into the dynamic nature of the hospitality industry.
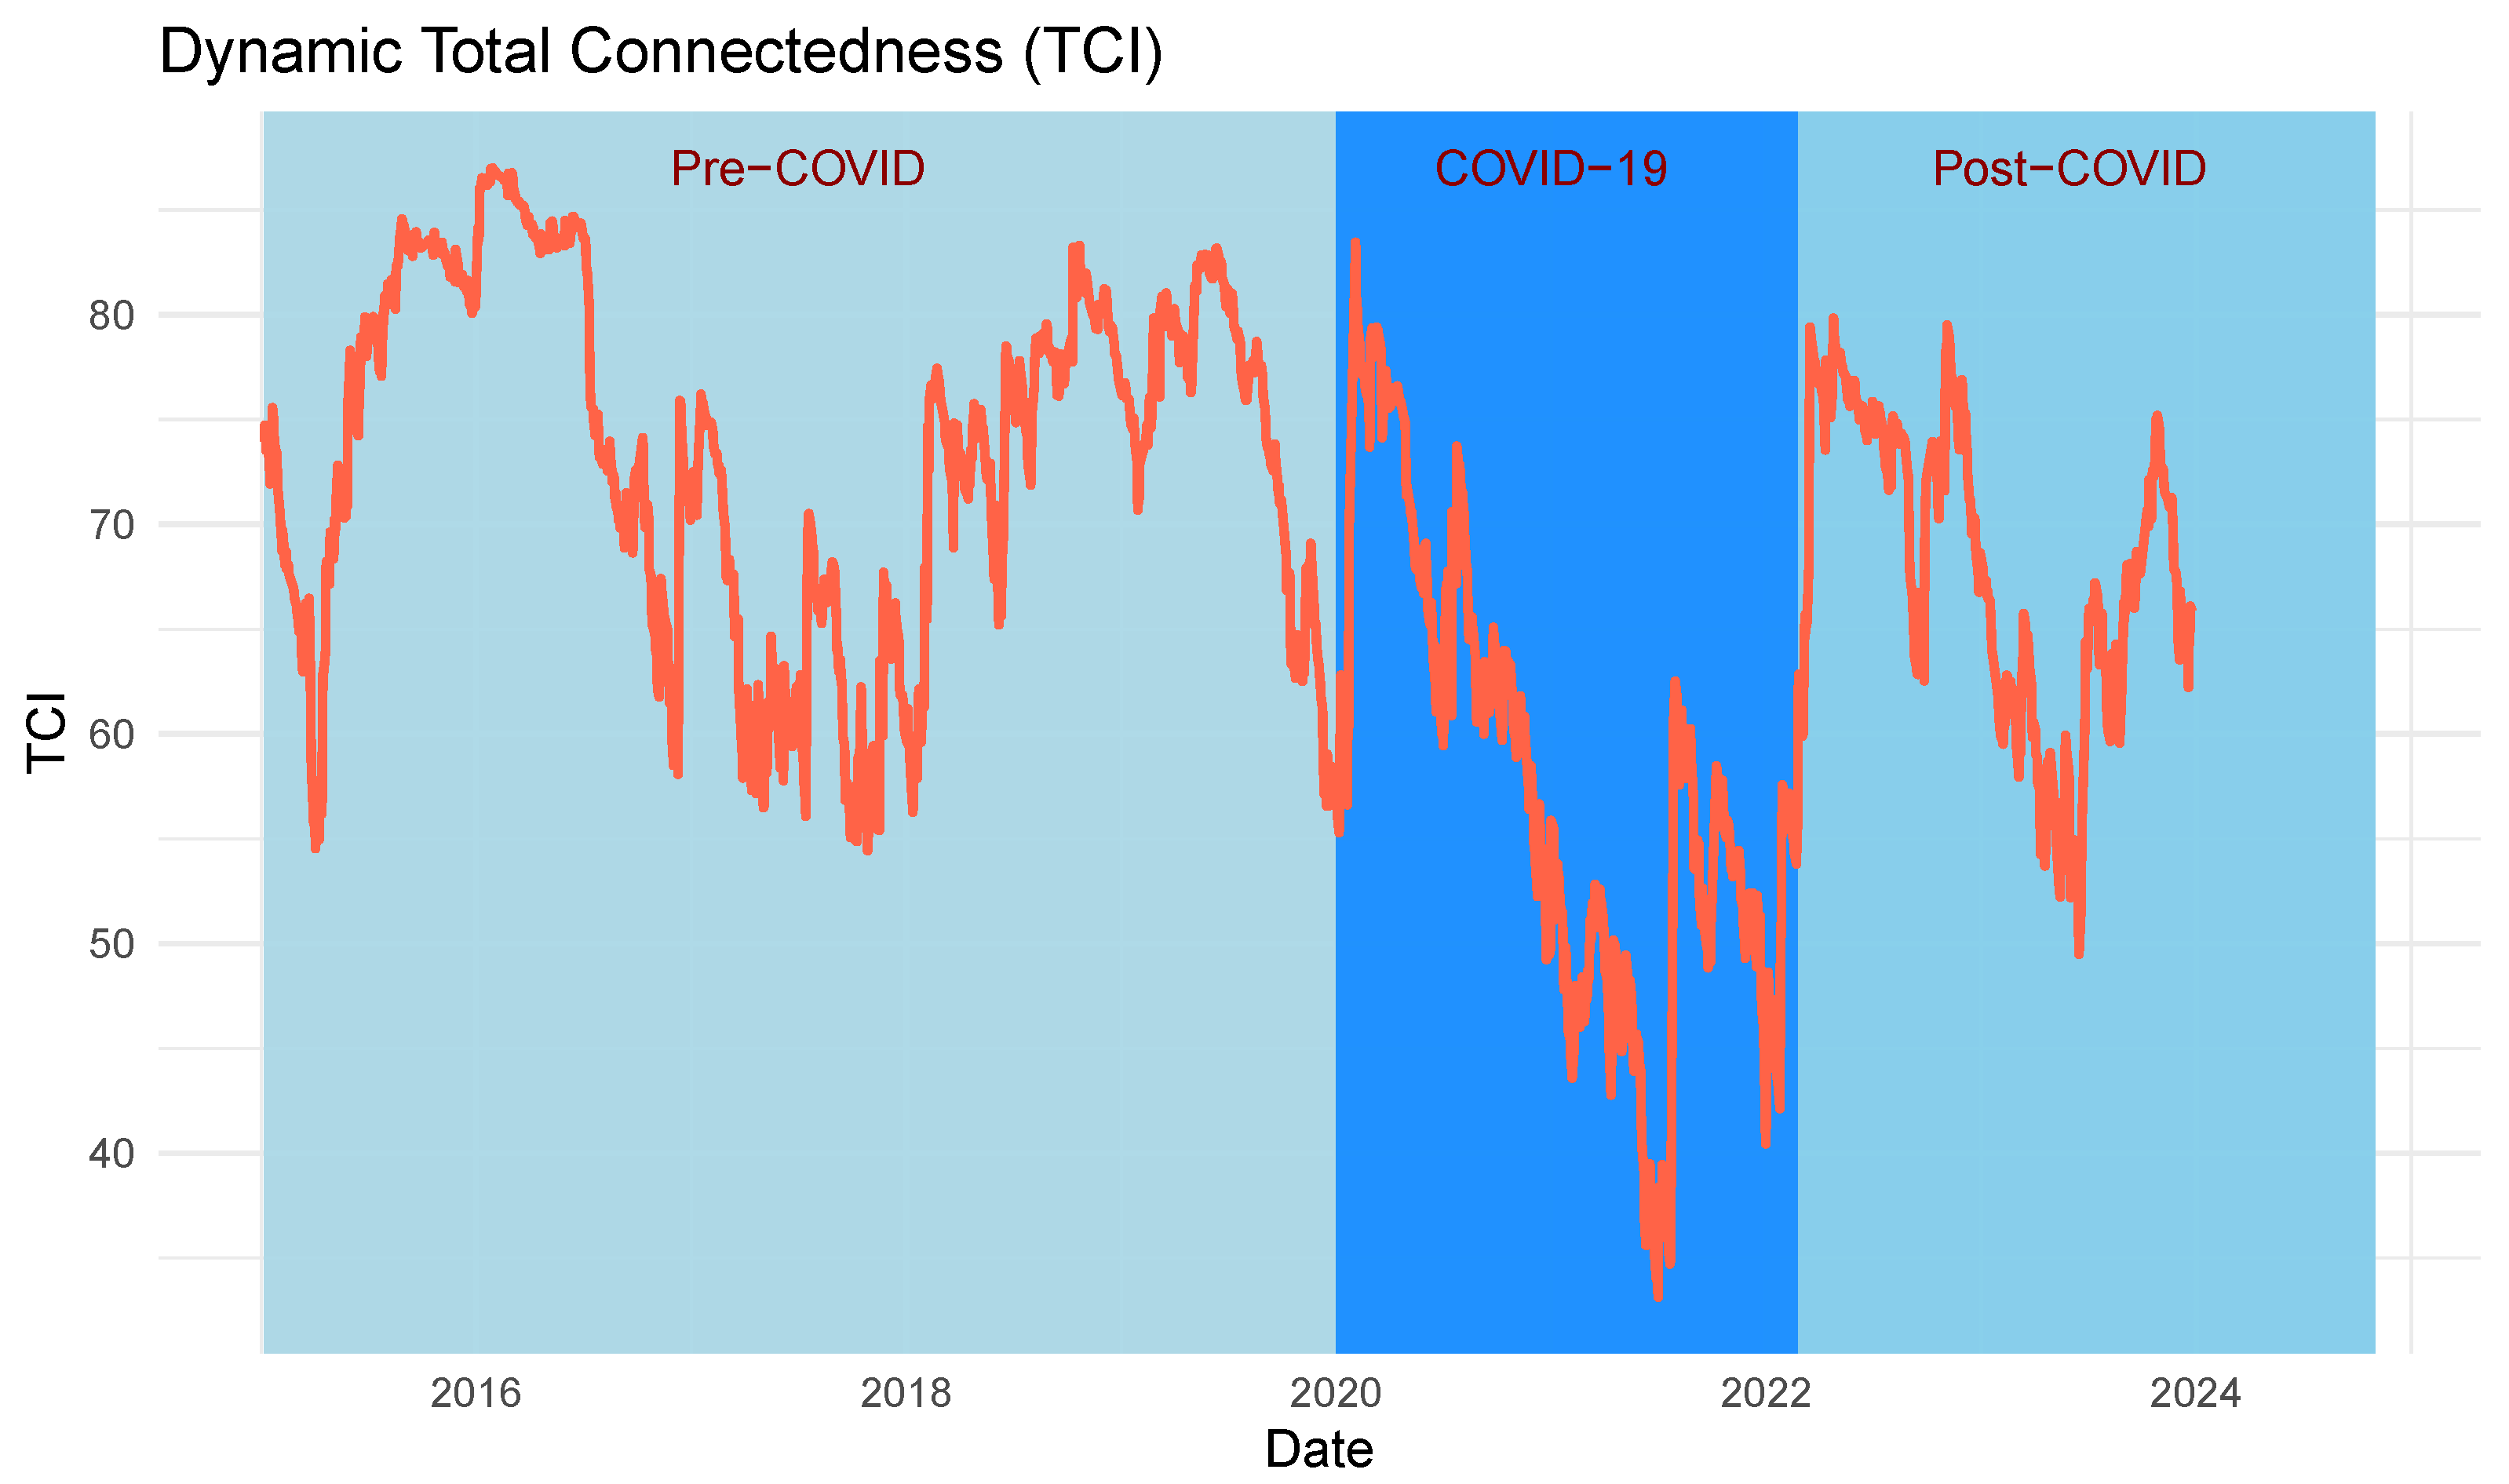
4.3. The Concept of Dynamic Total Connectivity
Over the past twenty years, significant transformations have occurred in the global economy, resulting in the Chinese economy becoming a leading economy globally and dominating the tourism industry. The responsiveness of China’s market has significantly increased as a result of dynamic economic and political conditions.
The connectedness table shows the possible level of interconnectedness across shares in the sectoral hospitality industry. However, it does not have the ability to monitor deviations in inter-market connectivity over time or the effect of peripheral shocks on interconnectedness. It is crucial to create a framework for analyzing changing dynamics over time in order to effectively study how important events have affected the interconnection of sector networks in China’s economic and financial development during the past ten years. This approach will function as an empirical benchmark for market participants.
Figure 3 and
Figure 4 display dynamic spillovers.
Figure 3 depicts the temporal evolution of the overall interconnection among different sectors of the hospitality stock market. The gray region reflects the bilateral connectivity, encompassing both favorable and unfavorable returns. The variability of the total connectivity swings between 5% and 86%, signifying that it is impacted by events and exhibits a recurring trend. There are three clearly defined periods of dynamic connectedness: the initial period spans from the beginning of 2015 to 2019, the second period spans from 2019 to 2021, and the third period began in 2022 and is ongoing. Notable events like the stock market collapse had an effect on these cycles, as did other incidents that led to systemic anxiety, like the US–China trade spat, the COVID-19 pandemic, and the Russian–Ukrainian war.
Figure 4 highlights asymmetry even more, illustrating the prevailing influence of negative returns interconnectedness. This dominance is a result of the inherent randomness of negative shocks and the fact that investors, particularly those who are cautious about taking risks, are more responsive to negative information than to good information. The COVID-19 pandemic in 2020 was a black swan event that demonstrated the highest degree of asymmetric connectedness. During this time, investors absorbed a significant amount of negative information and made changes to their investment allocations. This finding supports [
16], who reported the presence of uneven pandemic spillover effects on US stock market sectors. They say that bad spillover shocks are more influential than favorable ones.
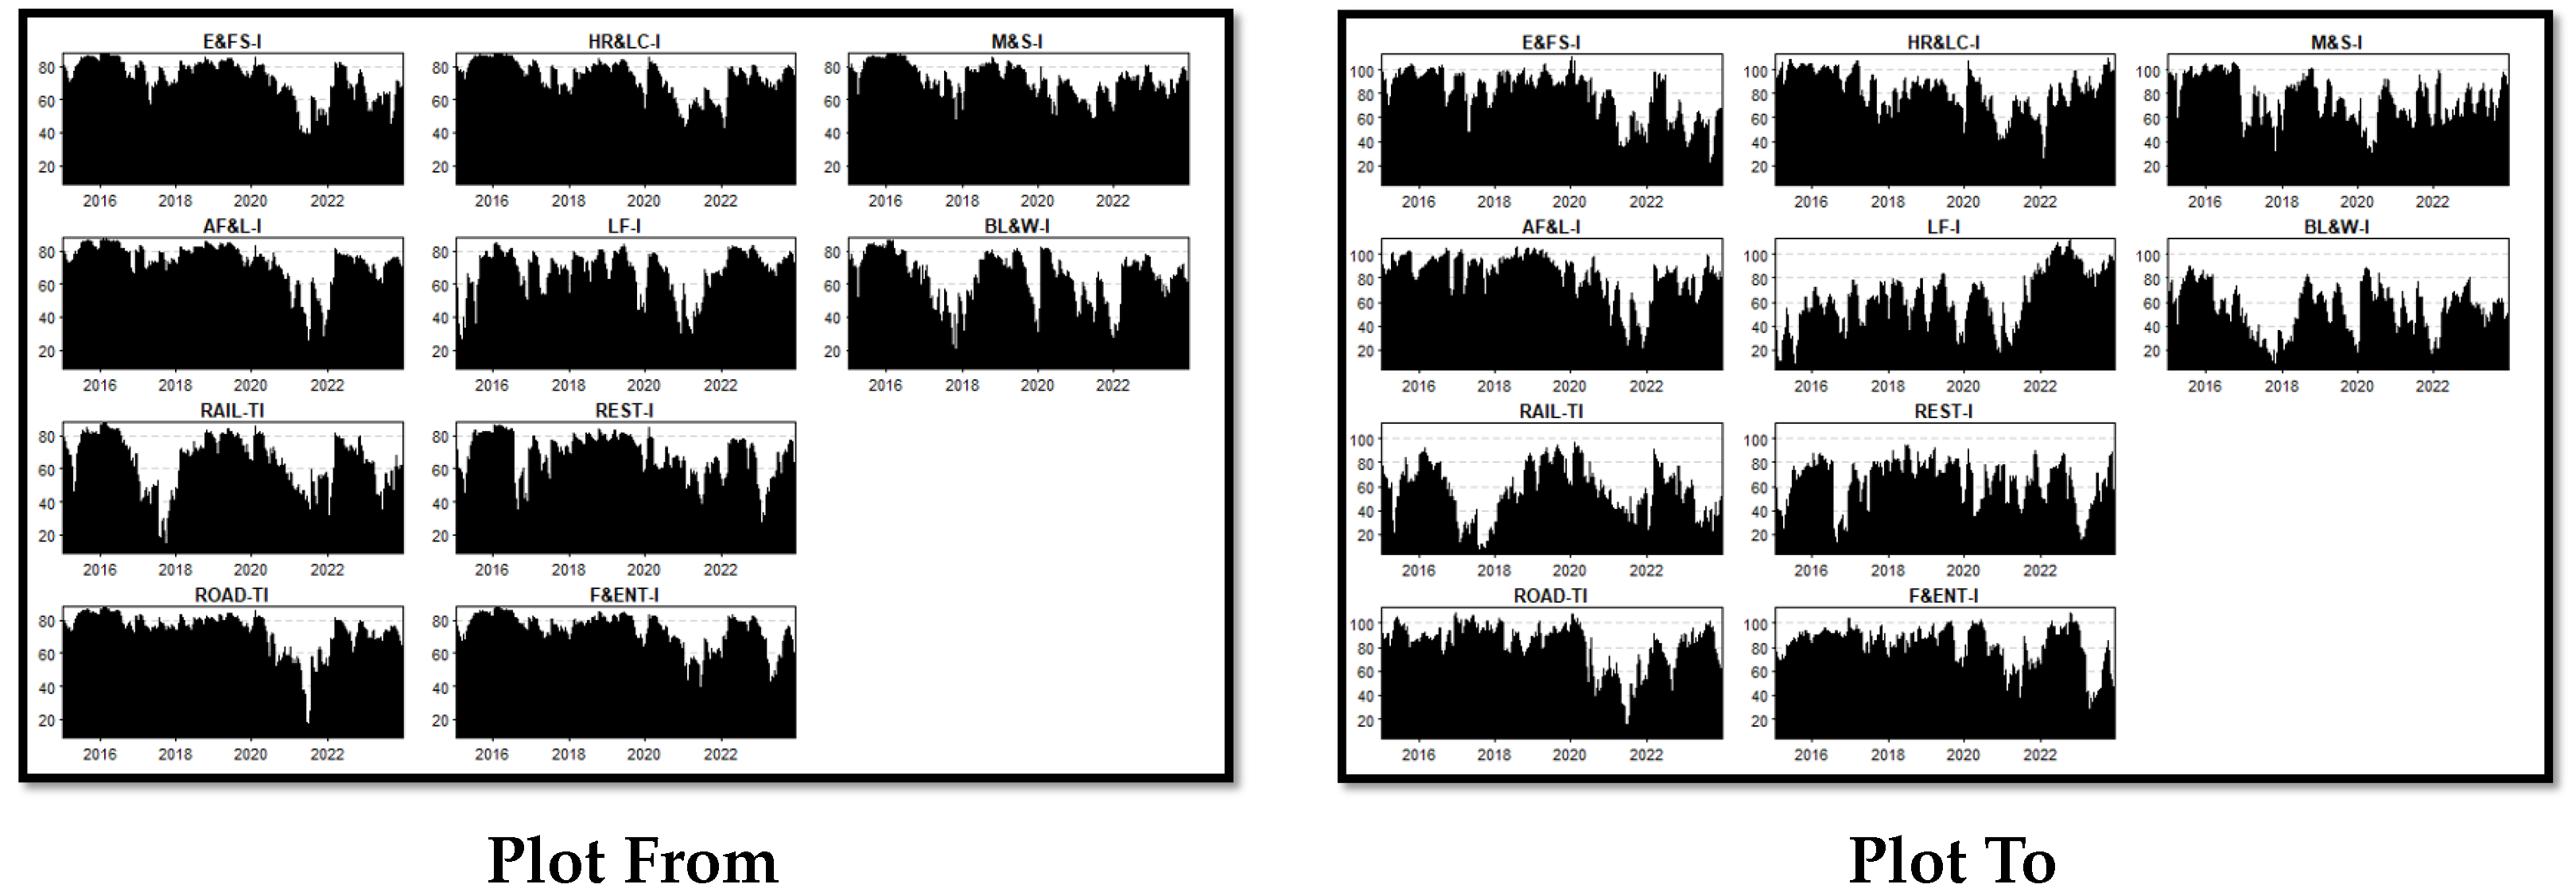
4.4. Time-Varying Connectedness
Figure 3 illustrates the fluctuating level of interconnection across China’s hospitality stocks throughout the observed timeframe. More precisely, the time-varying features quantify the fluctuations within different sectors of hospitality that hinder its advancement and growth.
Each point in the diagram corresponds to a specific irregular occurrence that contributes to the interdependence of the hospitality subsectors, resulting in an increase in the TCI over time. It shows that there are significant fluctuations that occur consistently during the whole duration of the sample. There were significant swings in the TCI (about 81.38% and 62.91%) between 2015 and 2020 due to concerns about the COVID-19 crisis. This was particularly relevant for tourist destinations such as China, which were facing sanctions. The TCI experienced a notable increase in 2020, which can be attributed to COVID-19. In this period, the Chinese government continued to offer assistance to the private sector, including the hospitality industry. As a result, trepidation permeated the stock market, leaving investors uncertain about corporations’ ability to sustain their recovery post-crisis.
Our analysis reveals that the TCI remained relatively stable with minor variations around its average from 2015 to 2018, which had a significant influence on the hospitality subsectors. A decrease in the TCI indicates the return of the tourism sectors to their usual state following an unpleasant incident [
11].
Moreover, the TCI experienced a following increase consistent with the significant expansion in the stock market, occasionally encountering oscillations, until the outbreak of the pandemic in China in 2019. The emergence of the pandemic resulted in the total connectedness reaching an unprecedented level: over 80%. This exemplifies the substantial influence of COVID-19 on the entirety of the hospitality sector and validates the conclusions of [
57]. In conclusion, our research demonstrates that the hospitality business was vulnerable to global risks across the studied period.
This section demonstrates the overall level of interconnectivity among China’s hospitality stocks by utilizing the changing characteristics within the specified time period. The level of interconnectedness is represented by
Table 2, which identifies the primary sources and recipients of spillover effects. According to
Figure 4, AF&L-I, ROAD-TI, HR&LC-I, E&FS-I, F&ENT-I, and M&S-I are the primary sources of spillovers, as spillovers are predominantly found in positive areas.
HR&LC-I experienced a significant and consistent negative impact on their financial performance during the observed time period, with just two brief exceptions: during the US–China trade dispute and at the beginning of the COVID-19 pandemic in 2020. Similar observations have been made with regard to ROAD-TI, which also propagated spillover effects to other subsectors. The net transmitters are explained by referring to the statistics presented in
Table 3. The table demonstrates the interconnectedness of AF&L-I, ROAD-TI, HR&LC-I, E&FS-I, F&ENT-I, and M&S-I, and how they contribute to the revenue production and employment creation in the China GDP. In contrast, the remaining sectors of the Chinese hospitality industry, including BL&W-I, RAIL-TI, LF-I, and REST-I, consistently experience the effects of spillover shocks over the whole study period, with most of these spillovers being negative in nature. The primary reason why certain individuals benefit the most from the Chinese tourism industry is due to their exposure to several distinct scenarios.
Overall, we observed that HR&LC-I, E&FS-I, F&ENT-I, and M&S-I experienced a significant transfer of spillover effects, which confirms our expectation that risk is transmitted by subsectors directly linked to the hospitality industry in China.
Furthermore, our findings support the previous empirical investigations conducted by [
57].
In contrast, the subsectors that are most vulnerable to external factors and global shifts are the ones that receive the most risk spillovers.
We apply this result to research on inter-sector spillover (connectedness) that includes the hospitality market.
The research scrutinizes the interdependence of industry stocks in China, as well as the effect of geopolitical risk on the connectivity of the sector network. The dynamic total connectivity is influenced by both event-driven and cyclical factors, which in turn impact the stock market during crisis periods.
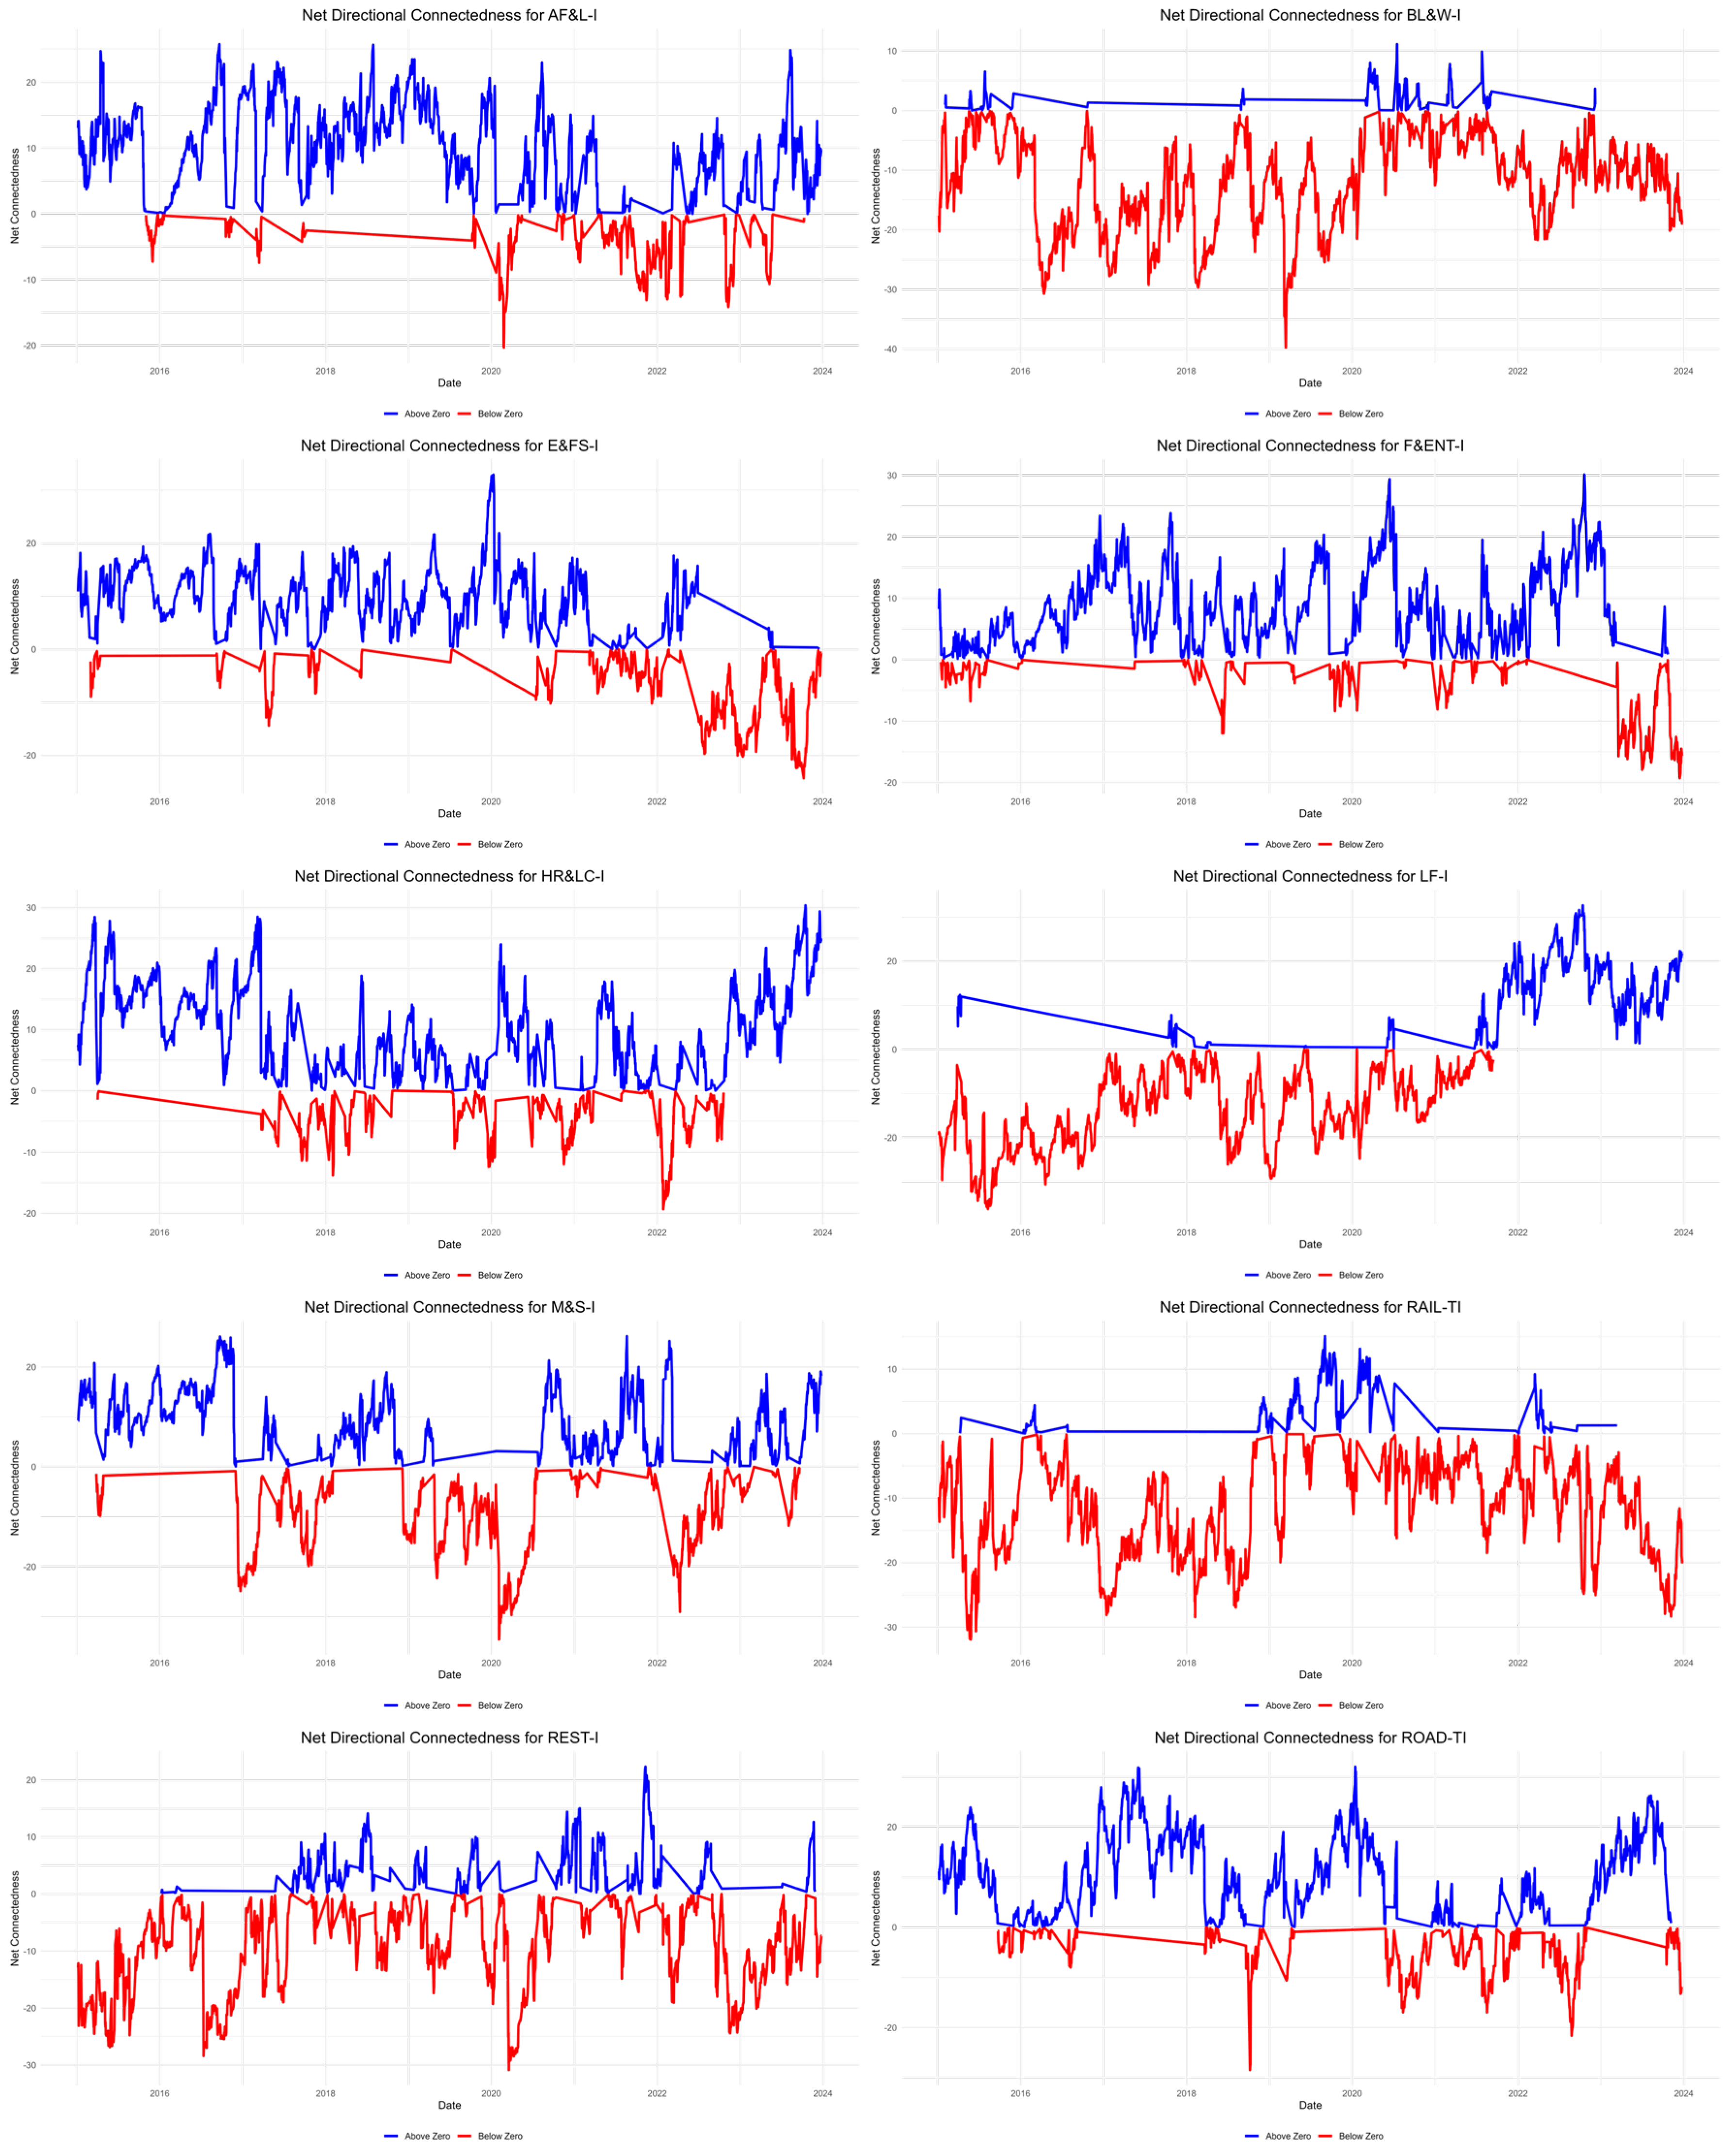
4.5. Directional Connectivity
Examining the interconnections between various sectors, namely, AF&L-I, ROAD-TI, HR&LC-I, E&FS-I, F&ENT-I, M&S-I, BL&W-I, RAIL-TI, LF-I, and REST-I, we analyze their relationship with all industry stocks. The utilization of a sectoral method facilitated a targeted analysis of the interconnectedness between certain sectors within the hospitality industry. This enabled stockholders to devise efficient investment tactics.
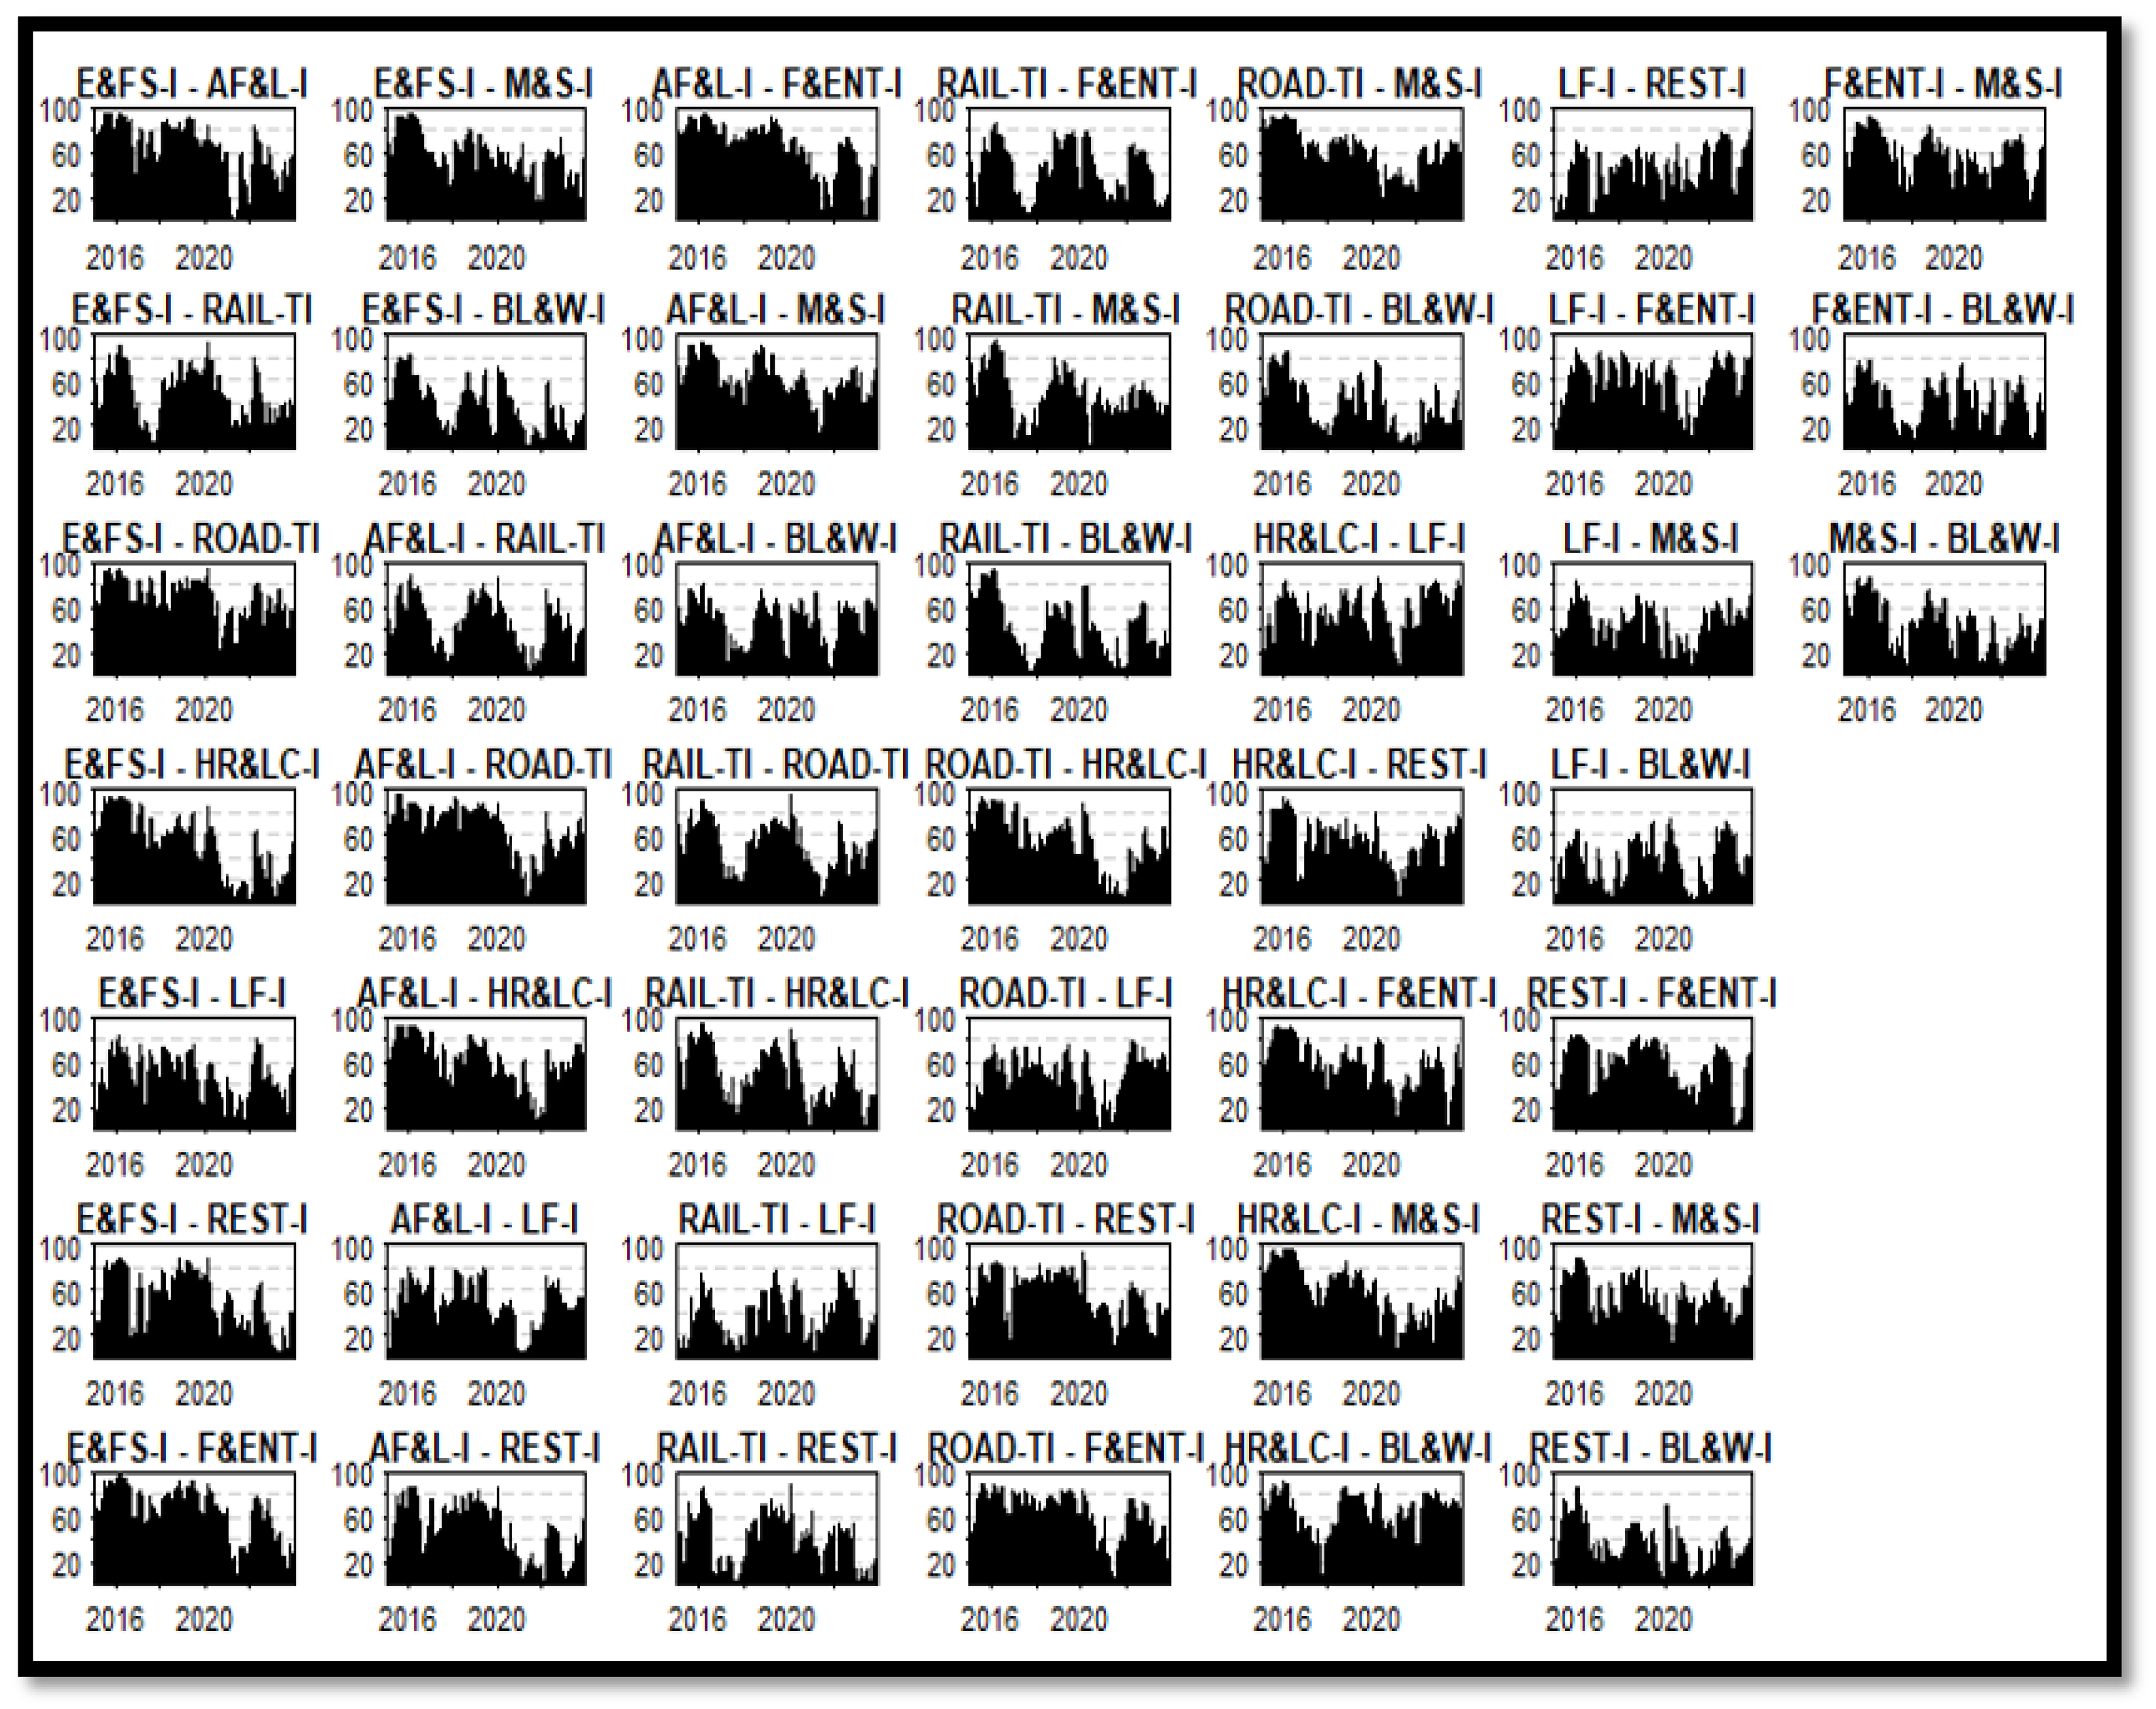
In
Figure 5 and
Figure 6, we illustrate the dynamic directional connectivity between sectoral industrial stocks, as well as their varying asymmetric spillover. This analysis will emphasize the variations in the overflow patterns and their evolving strength and orientation between different sectors of stock markets.
Figure 5 illustrates the overall interconnection between the ten industries. Positive numbers indicate individuals or entities that are sending more than they are receiving, while negative values indicate individuals or entities that are receiving more than they are sending.
During the whole study period, all stocks in different sectors received net stock market return spillovers, which is consistent with earlier findings. Nevertheless, the disparity in the transmission of returns between different sectoral stocks is distinct from the overall dynamic connectedness. The trend described was especially noticeable during the 2015 decline in the Chinese stock market. This was evidenced by a decrease in the connectedness index and a substantial narrowing the gap between returns.
Although hospitality sector stocks received net spillovers, they did not encounter a rise in negative spillovers during the era of economic upheaval. Conversely, these events caused a transfer of money from the stock market, leading to a decrease in the interdependence of returns and an increase in the prevalence of positive returns. This discovery implies that including BL&W-I, RAIL-TI, LF-I, and REST-I in a diverse portfolio is advantageous, especially in periods of turbulence.
The epidemic had a profound effect on the financial market, resulting in an unparalleled shock and widespread panic in stock markets. Furthermore,
Figure 5 provides estimations of the bidirectional connectivity indices, which measure the extent of spillover effects in both directions, specifically to and from stock indexes.
Figure 5 provides a comprehensive visualization of the overall interconnectivity between hospitality stocks. The directional risk flow indicates that higher net connectedness values reflect subsectors acting as dominant risk transmitters. Notably, the Russia–Ukraine conflict and the COVID-19 pandemic periods exhibit peak risk spillover effects, consistent with the global financial instability trends observed in other studies [
57].
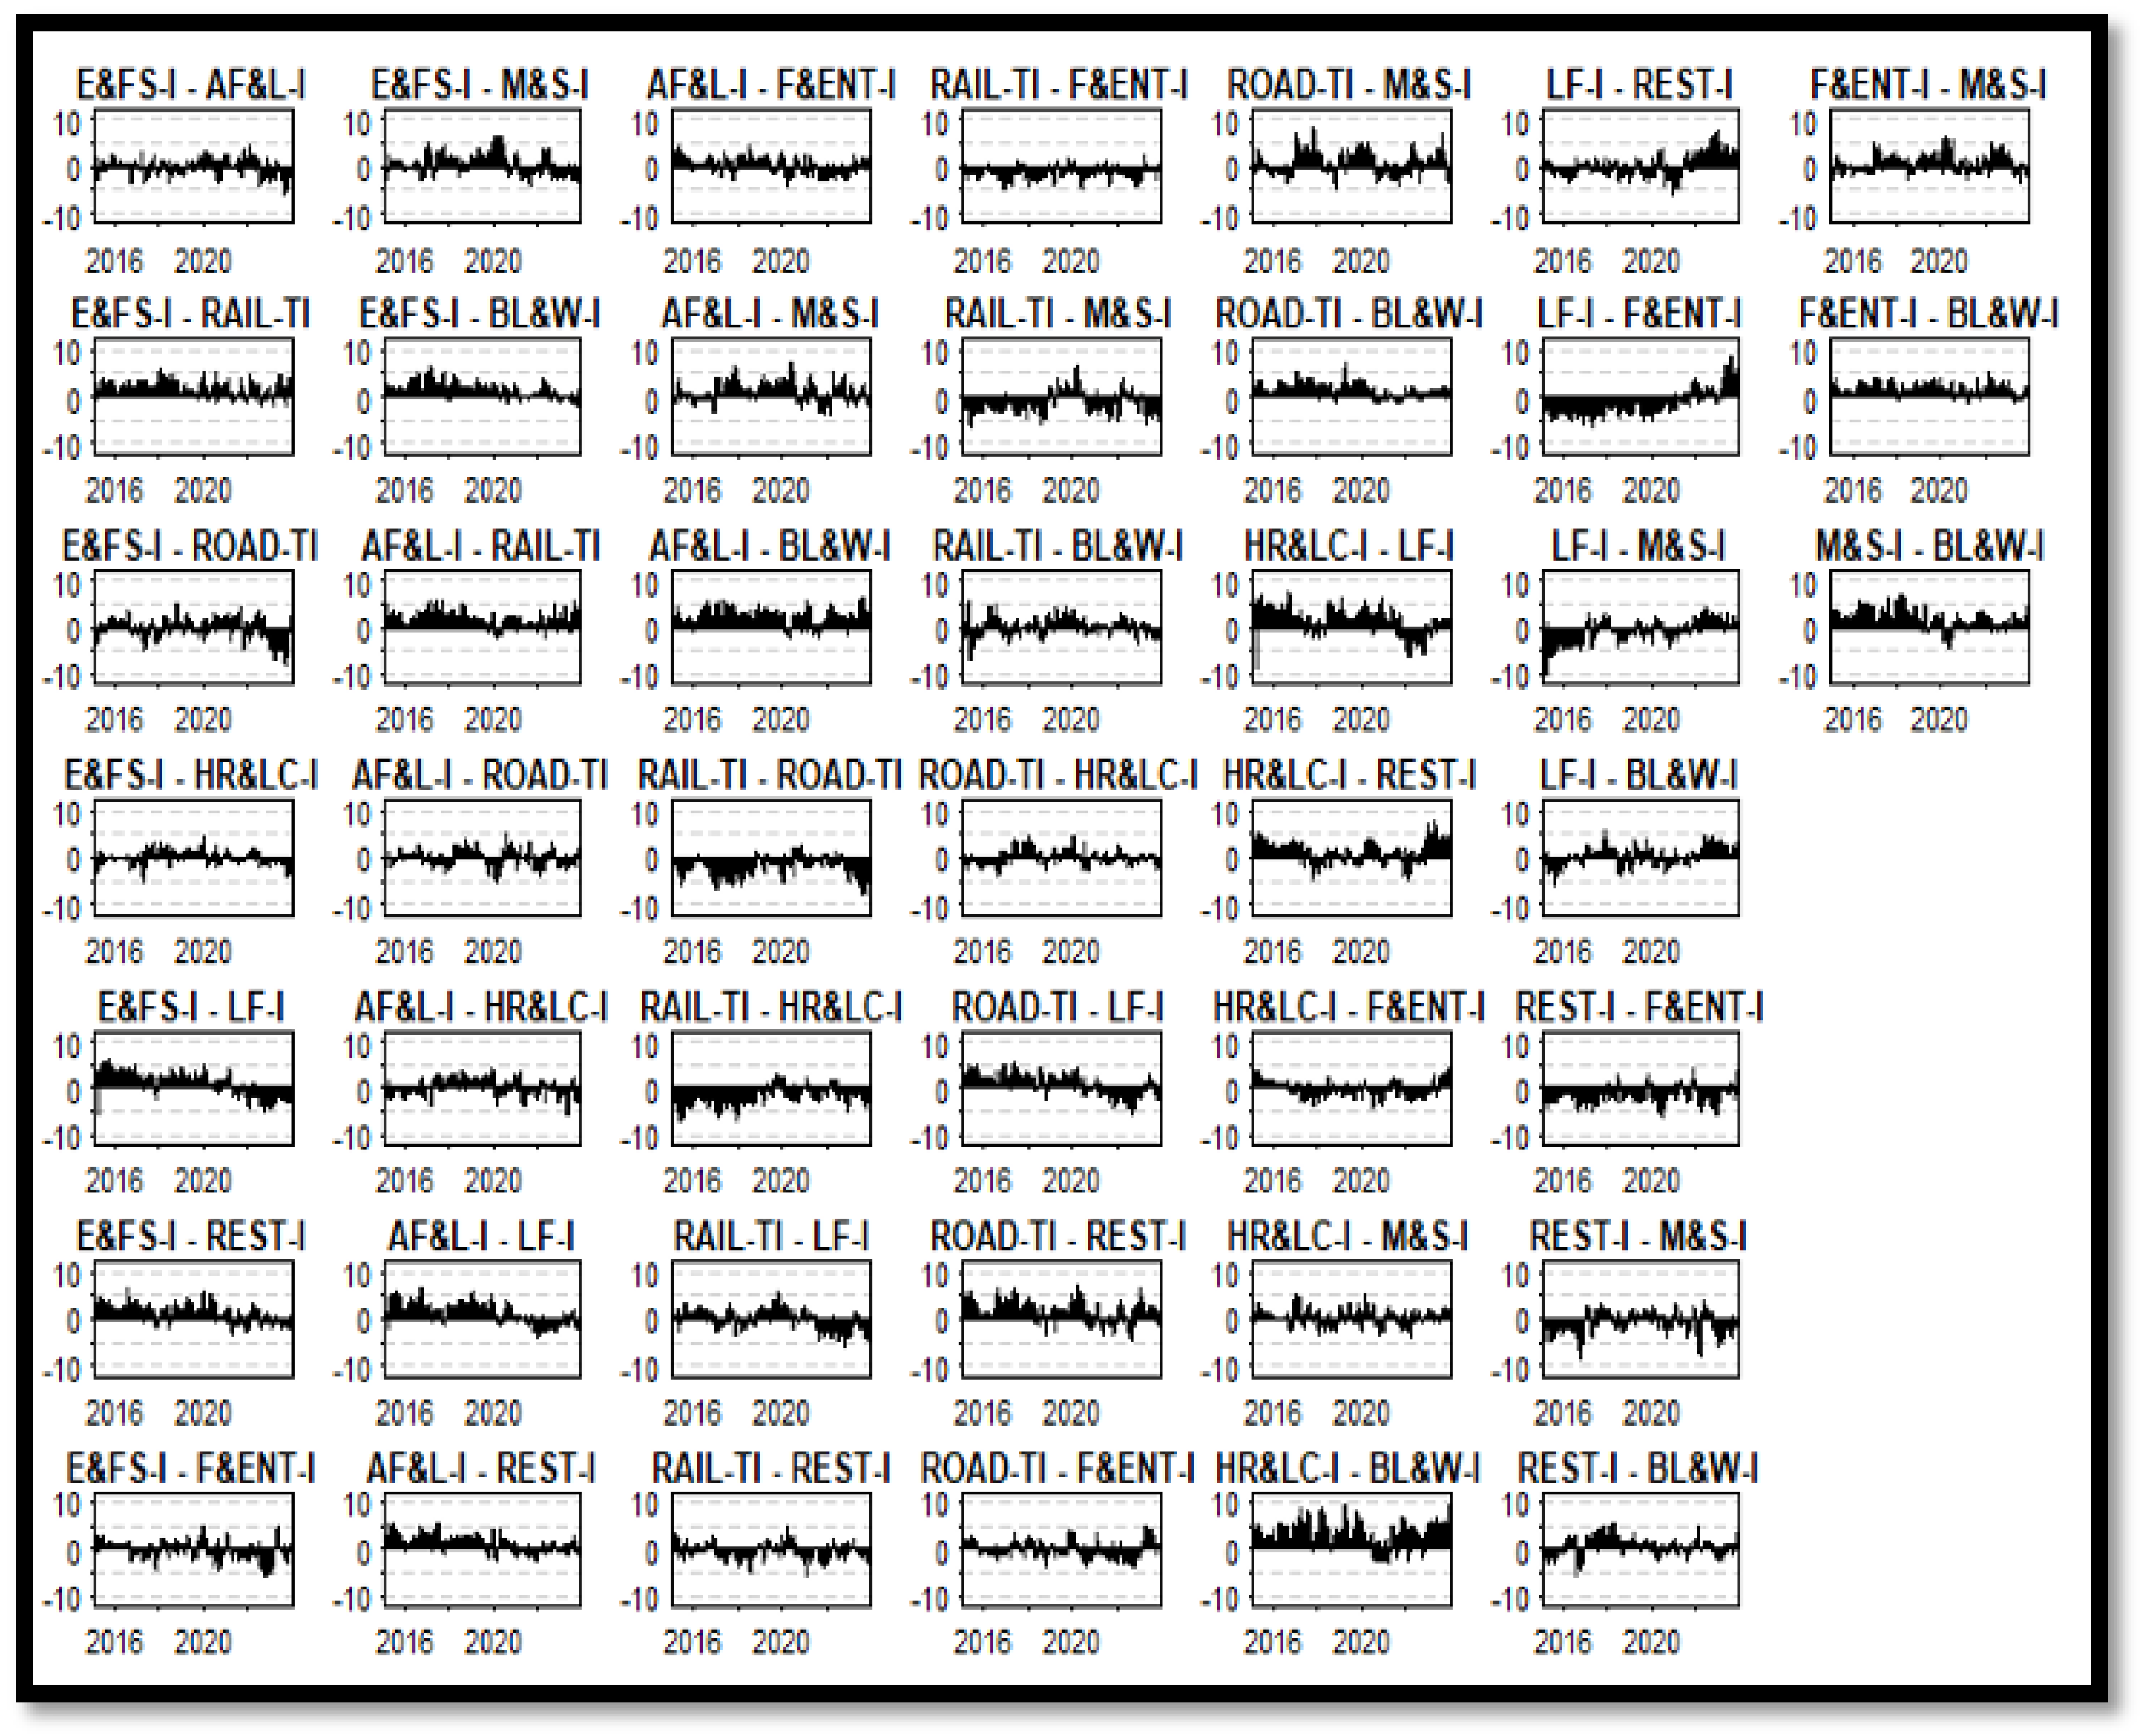
Figure 6 illustrates NPDC across hospitality subsectors. A positive NPDC value for a given industry implies that it transmits more financial shocks than it receives, reinforcing its role as a systemic risk driver. The road transportation, air freight, and environmental services sectors show the highest NPDC values, signifying their influence on overall sectoral stability.
Figure 7 presents ten subplots demonstrating time-varying directional connectedness among the hospitality subsectors. We observe that during crisis events, risk transmission intensifies, particularly in travel-related industries, highlighting their vulnerability to external shocks. It displays the ten subplots which show the dynamics and directional connectedness of each sector based on industrial stocks that correspond to the “FROM” and “To” columns in
Table 3.
The results have verified the significant influence of pandemic and Russia–Ukraine war on interconnection between hospitality stock markets, specifically from a viewpoint of individual sectors. Unlike the spillover of transport sector to hotel stock market, the spillover of industry stocks from specific sectors of the stock market.
Furthermore, with regard to the one-way transfer of returns from specific stocks in different sectors to stock markets, it was observed that from 2015 to 2023, there was a prevalence of positive returns in the asymmetric directional connectedness. The conflict between Russia and Ukraine had a substantial influence on worldwide oil and food prices, thus impacting the stock market. The outcome was a robust positive correlation among industry stocks, as evidenced by the TO directional connectedness.
Our analysis highlights the significance of taking into account specific sectors of hospitality when examining the effects of spillovers or quantifying the interconnectedness between Chinese stock markets. This is due to the lack of substantial investment options in China and the dominance of individual investors.
The heightened interconnectedness between hospitality stock markets in China is mostly attributed to the transmission of net information spillovers between stock markets. Various political and economic events have impacted it, leading to notable disparities in the interconnectedness between sectoral stock markets. Understanding the unique features of China’s financial sector, including its limited financialization, can offer useful insights to investors and regulators who wish to manage risks and find possibilities for diversification.
4.6. Robustness Tests
To ensure the robustness of our findings, we employed the connectedness approach developed by [
56]. The results in
Table 5 reaffirm the core insights of
Table 4, further validating our primary analysis using the TVP-VAR methodology [
20].
5. Conclusions
This study investigates the transmission of returns and interconnections between hospitality stocks in China. The findings demonstrate noteworthy fluctuations in returns between hospitality industry stocks.
Specifically, in our research, we discovered that AF&L-I, ROAD-TI, HR&LC-I, E&FS-I, F&ENT-I, and M&S-I act as risk transmitters and BL&W-I, RAIL-TI, LF-I, and REST-I, are exposed to risk. This suggests that the interconnectedness between stocks is influenced by business connections or the level of demand. This highlights the extensive prevalence and variety of these spillovers across other industries, surpassing the direct commercial connection and impacting the wide-ranging consumer markets. Additionally, we noticed a considerable disparity in interconnectedness, characterized by a high occurrence of return spillovers. These spillovers were inclined towards geopolitical and economic shocks. Contrary to expectations, there were no negative return spillovers observed during eras of economic uncertainty. In contrast, geopolitical and health issues led to enhancements in the overall interconnection and a transformation to a predominance of bad outcomes. This emphasizes the intricate interrelationships and the effect of particular events like the COVID-19 pandemic and the Russia–Ukraine war on uneven hospitality stocks interconnections.
Moreover, our research recorded the fluctuating characteristics of specific subsectors within the Chinese hospitality industry, where the occurrence of spillovers was particularly pronounced during periods of significant geopolitical and health hazards. Following these periods, there is a decrease in the overall connectivity index under regular situations, and it eventually stabilizes. The time-varying connectivity in the network confirms that the HR&LC-I, E&FS-I, F&ENT-I, and M&S-I activities sectors are responsible for sending significant risk spillovers to the other subsectors. Nevertheless, the economic indicators demonstrate a substantial and favorable influence on the interdependence of the various subsectors within the Chinese hospitality industry. The findings of this investigation have substantial practical implications for stakeholders in the Chinese hospitality sector, particularly in the domains of policy development, investment strategy, and risk management. The identification of key risk transmitters, such as the hotel resort and luxury cruise industry and the air freight and logistics industry, accentuates the importance of improved risk mitigation strategies in these critical subsectors for industry leaders and managers. Additionally, this may involve investing in technologies that enhance operational resilience, diversifying income streams, and implementing more robust contingency plans. For investors, the results offer valuable insights into the risk–return dynamics of various subsectors, which facilitates more informed decision-making and portfolio diversification, particularly during periods of economic uncertainty. For policymakers and regulatory organizations, these outcomes can also be utilized to develop targeted interventions that stabilize the most vulnerable sectors during crises, thereby diminishing the overall risk contagion within the industry.
Based on these findings, we suggest practical recommendations for policymakers, the Chinese government, the Chinese hospitality industry and its subsectors, market participants, investors, and portfolio managers. Policymakers and regulatory organizations have the ability to revise their existing regulations regarding the Chinese hospitality business, considering the ongoing pandemic’s disruptive impact worldwide, which is now hindering the industry’s full recovery. Therefore, implementing novel and revised exigence campaigns for the revival of the Chinese hospitality business would be advantageous for restoring the previously held position for overall and overly specific subsectors of the Chinese hospitality industry. The government of China and hospitality businesses may utilize our conclusions to recognize their primary hospitality businesses that are particularly vulnerable to economic shocks. Strategically analyzing and developing each subsector within the hospitality industry can provide long-term benefits by mitigating the negative impacts of unpredictable conditions. Market participants and stakeholders in the Chinese hospitality industry can also benefit from findings to identify the business that demonstrated lower vulnerability to the current pandemic and war situation and previous periods of geopolitical uncertainty. Investors and portfolio managers in the Chinese hospitality sector and related sectors will gain valuable insights from this study which will allow them to examine the performance of their own companies and consider their ability to generate good returns, especially under unfavorable market conditions. An effective strategy to safeguard mainstream investments from declining impacts is to evaluate the advantages and disadvantages of each subsector and assign appropriate risk weights to them. Therefore, portfolio managers, as well as stockholders, may benefit from the results of this study, which will help them with risk management and allow them to protect their investments during moments of severe market volatility. By comprehending the time-varying nature of risk transmission, stakeholders can adopt a more proactive and adaptive approach to risk management, thereby contributing to the long-term stability and sustainability of the Chinese hospitality industry.
While our study provides significant insights into risk transmission within the Chinese hospitality industry, certain limitations must be acknowledged. Firstly, our analysis relies on stock market data, which may not capture broader financial dynamics, such as the impact of private investment and consumer behavior on sectoral risk transmission. Secondly, the TVP-VAR model, while highly effective for time-varying spillovers, has inherent computational constraints that limit the granularity of short-term fluctuations. Lastly, our dataset spans from 2015 to 2023, and while it covers major economic shocks (e.g., COVID-19, the Russia–Ukraine conflict), future research could extend this timeline to analyze post-pandemic recovery patterns.
Future research could explore risk transmission in the broader tourism ecosystem, including airlines, travel agencies, and digital booking platforms. Additionally, alternative econometric approaches, such as machine learning-based risk prediction models, could be applied to hospitality sector data for enhanced forecasting. Expanding this study to other economies with significant tourism markets, such as Europe and Southeast Asia, would allow for comparative analysis of risk dynamics across regions. Lastly, a mixed-methods approach, integrating qualitative surveys with quantitative models, could provide richer insights into the behavioral aspects of investment decision-making within the hospitality industry.


