Article

Causation Analysis of Marine Traffic Accidents Using Deep Learning Approaches: A Case Study from China’s Coasts

1
Donghai Academy, Ningbo University, Ningbo 315832, China
2
Faculty of Governance and Global Affairs, Leiden University, 2311 EZ Leiden, The Netherlands
3
Department of Logistics and Maritime Studies, The Hong Kong Polytechnic University, Hong Kong, China
4
Barcelona Innovation in Transport (BIT), Department of Civil and Environmental Engineering, Universitat Politecnica de Catalunya (UPC-Barcelona Tech), 08034 Barcelona, Spain
*
Author to whom correspondence should be addressed.
Systems 2025, 13(4), 284; https://doi.org/10.3390/systems13040284
Submission received: 11 March 2025 / Revised: 7 April 2025 / Accepted: 9 April 2025 / Published: 12 April 2025
(This article belongs to the Section Systems Theory and Methodology)

Abstract

:
In response to the increasing frequency of maritime traffic accidents along China’s coast, this study develops an accident-cause analysis framework that integrates an optimized Bidirectional Encoder Representations from Transformers (BERT) with a Bidirectional Long Short-Term Memory network (BiLSTM), combined with the Apriori association rule algorithm. Systematic performance comparisons demonstrate that the BERT + BiLSTM architecture achieves superior unstructured-text-processing capability, attaining 89.8% accuracy in accident-cause classification. The hybrid framework enables comprehensive investigation of complex interactions among human factors, vessel characteristics, environmental conditions, and management practices through multidimensional analysis of accident reports. Our findings identify improper operations, fatigue-related issues, illegal modifications, and inadequate management practices as primary high-risk factors while revealing that multi-factor interaction patterns significantly influence accident severity. Compared with traditional single-factor analysis methods, the proposed framework shows marked improvements in Natural Language Processing (NLP) efficiency, classification precision, and systematic interpretation of cross-factor correlations. This integrated approach provides maritime authorities with scientific evidence to develop targeted accident prevention strategies and optimize safety management systems, thereby enhancing maritime safety governance along China’s coastline.

1. Introduction

Shipping stands as one of the most international of the world’s major industries, yet it remains inherently perilous [1]. According to the Statistical Bulletin on the Development of the Transportation Industry, between 2013 and 2023, China’s coastline saw 1898 major accidents, leading to 2034 fatalities or disappearances and the sinking of 849 vessels [2]. On a global scale, the situation is similarly concerning; from 2012 to 2021, Allianz Global Corporate & Specialty (AGCS) managed an average of approximately 2700 maritime accident insurance cases per year1. Given the phenomenon of underreporting and concealment of accidents, the actual accident number should be higher than the published data. Due to its unique environmental characteristics, marine traffic gives rise to a diverse array of accident types, including ship collisions, self-sinkings, fire and explosions, oil spill pollution, and others [3]. These incidents may not only result in direct casualties and property losses of vessels but also trigger cascading environmental crises [4]. Additionally, the growing demand for water transportation has resulted in a more complex navigation environment, thereby increasing the safety risks associated with waterborne navigation [5]. Consequently, it is critical to conduct a thorough analysis of the causes of maritime traffic accidents to reduce accident rates and minimize related losses.
This paper is organized as follows: Section 2 provides a comprehensive literature review and highlights the contribution. Section 3 introduces the accident classification model and the ship cause analysis method. Section 4 trains the model based on relevant data and uses Chinese marine traffic accidents as actual cases for research. Section 5 analyzes and discusses the causes of accidents. Section 6 concludes the major findings and provides prospects for further research.

2. Literature Review

2.1. Investigation into Causative Factors

For an extended period, accident-cause analysis has remained a central focus in safety research. Numerous scholars have examined maritime traffic accident causes from diverse perspectives, with the aim of identifying effective risk control strategies. These studies attribute accident causation to four primary factors—human, vessel, environment, and management—with each factor’s importance varying across different contexts [6]. Among them, human error, pointed out by the UK Marine Accident Investigation Branch (MAIB), is the main cause of most water accidents [7]. Subsequent studies have demonstrated that over 80 percent of maritime accidents can be directly attributed to human error or result from crew members’ inappropriate responses to hazardous situations [8]. For example, Chowdhury et al. found that human error in engine room operations was one of the important causes of accidents [9]. Hu et al. integrated the Human Factors Analysis and Classification System (HFACS) framework with Structural Equation Modeling (SEM) to quantitatively assess the layered interactions among human factors—particularly resource management—in relation to the causality of marine traffic accidents [10]. Given the key position of human factors, in-depth research on them is extremely necessary.
However, the causes of maritime accidents are multifaceted, so considering only human factors is insufficient. Many studies have moved beyond the singular focus on human errors. For instance, Bhardwaj et al. identified that management problems often underlie the root causes of accidents [8]. Kokotos et al. demonstrated that the implementation of an effective assessment system significantly influences the occurrence of ship accidents [11]. Cao et al. established a clear causal relationship between management practices and accident severity [12]. In addition to these human and managerial dimensions, objective factors such as ship-related issues and environmental conditions warrant further exploration. The International Maritime Organization has reported that approximately one-quarter of maritime accidents are attributable to ship mechanical failures [13]. Kimera et al. discovered that ship factors are closely linked to accident severity [14], a relationship that is particularly pronounced in collision incidents [15,16]. Regarding environmental factors, Chen et al. argues that good navigational conditions help to reduce the probability of serious accidents [17]. Lin et al. observed that certain regions exhibit a heightened risk of collision [18], while Jon et al. underscored the significant influence of environmental conditions on accident severity [19]. Bye directly states that low environmental visibility increases the likelihood of accidents [20].
In summary, the existing literature on maritime accident causation has predominantly focused on human factors as the primary contributors to incidents. However, these studies tend to examine factors in isolation, offering limited insight into the complex interaction mechanisms among multiple causal elements in maritime accidents.

2.2. Investigation into Causative Methodologies

During the systematic exploration of maritime accident causes, scholars have persistently endeavored to develop more efficient and precise analytical methodologies. The Formal Safety Assessment (FSA) method, officially endorsed by the International Maritime Organization, has become a widely adopted approach in risk management and accident analysis [21]. Bayesian networks (BNs) have demonstrated unique value in maritime safety studies due to their robust capability to represent complex relationships [22]. For example, Khan et al. employed Bayesian network technology to evaluate the risks associated with the transportation of dangerous goods in port environments [23]. Scholars were also dedicated to enhancing the Bayesian formula to address more complex research requirements [24]. However, given their reliance on substantial prior probability information, these methods often need to be integrated with other approaches to effectively mitigate subjective bias [25].
Furthermore, scholars have explored accident causation by developing a variety of algorithms and models. For instance, Chin et al. employed an ordered probity regression model to predict the risk of ship collisions [26]. Feng et al. proposed a quantitative method that integrates information entropy with K-means clustering to evaluate ship collision risk areas [27]. Melnyk et al. developed a causal model, in conjunction with cluster analysis, to systematically identify critical risk factors for maritime accidents from a data-driven perspective [28]. Based on the Fuzzy SWOT-AHP approach, Kececi et al. devised a cause analysis technology for ship accidents, termed Ship Accident Root cause Evaluation (SHARE) [29]. Chen et al. utilized the Reason-SHEL model to examine human factors in ship accidents [30]. Ma et al. constructed a dynamic modeling system for analyzing human factors in maritime collisions by integrating the Decision-Making Trial and Evaluation Laboratory (DEMATEL) model with fuzzy cognitive mapping, grounded in the HFACS framework [31].
With advancements in computer technology, NLP has emerged as an increasingly vital tool in accident analysis. Its application spans several domains, including public opinion monitoring [32], aviation [33], and mining [34]. Deep learning, with its exceptional data processing capabilities, has significantly advanced natural language processing and attracted considerable attention within the maritime domain. For example, Liu et al. employed an optimized Recurrent Neural Network (RNN) to forecast regional collision risks over a short time horizon in a specific ocean area [35]. Gan et al. introduced a cause-and-effect prediction model for marine accidents based on convolutional networks utilizing mutual information depth maps, achieving high-precision prediction and ranking of accident causes, thereby offering valuable insights for risk assessment and prevention [36]. Knowledge graphs have also garnered interdisciplinary interest. Chen et al. combined deep learning with the Classification and Regression Trees algorithm to develop an accident knowledge graph and identify critical risk factors through triplet extraction [37]. Gan et al. applied NLP to extract textual information from accident reports and construct knowledge graphs [38]. NLP is extensively utilized for data extraction tasks across various domains. For instance, Nurduhan et al. employed BERT-based quantization, UMAP reduction, and K-Means clustering to analyze human factors in maritime accidents, thereby visualizing their interactions and causal relationships [39]. Huang et al. utilized knowledge extraction to identify accident-related entities and elucidate the logical pathways of waterway accidents involving dangerous goods through clustering [40]. Yan et al. analyzed the semantic relationships between hazards in maritime accidents and developed a semi-automatic model for hazard and accident cause identification grounded in BERT [41], although this study placed less emphasis on the correlation between factors.
To sum up, the intricate interplay among multiple factors remains insufficiently elucidated, indicating a need for more comprehensive and systematic approaches in accident analysis. Future research should integrate data-mining techniques with deep learning methodologies to extract latent information from accident reports and reveal complex interdependencies, thereby enhancing accident prevention and management strategies. Moreover, a detailed synthesis of the reviewed literature is provided in Table 1.
This study distinguishes itself by first addressing the limitations of traditional single-factor analyses, which tend to focus exclusively on human error or equipment failure, thereby overlooking the complex interplay among various contributing factors. Recognizing the multifaceted nature of maritime accidents, our approach integrates a novel analytical framework that leverages advanced deep learning and data-mining techniques. Specifically, the framework combines a BERT + BiLSTM deep learning model with the Apriori association rule algorithm to automatically extract deep semantic information from unstructured accident reports. This integration not only enhances classification accuracy and interpretability but also reveals the intricate interdependencies among multiple risk factors.
Building on this innovative model, this study employs a two-stage process. Initially, accidents are categorized based on the intrinsic characteristics of their associated texts—a strategy that enhances classification precision and facilitates the effective analysis of large datasets. An extensive, internationally sourced dataset is utilized to train the model, which is subsequently refined and applied to Chinese maritime accident reports. This sequential methodology establishes a systematic and robust analytical framework, directly addressing the recurrent incidence of marine traffic accidents and their severe impacts on personnel, property, and environmental resources. In summary, this work lays a solid scientific foundation for maritime safety management and accident prevention strategies, offering valuable methodological insights for the application of natural language processing and data-mining techniques in complex accident analysis. The proposed framework holds significant relevance for maritime regulatory authorities, research institutions, scholars, and safety risk analysis professionals.

3. Methodology

This study focuses on the maritime sector, where accident reports are rich in technical terminology—such as sea state descriptions, ship status, and navigation operations—those traditional methods often overlook. BERT adapts well to this specialized vocabulary, enabling direct fine-tuning with maritime data without the need to train deep networks from scratch. This not only conserves computational resources but also rapidly produces high-quality text vector representations. In the maritime context, accurately capturing the sequence of events and their causal relationships is critical. BiLSTM excels at extracting bidirectional sequence information, making it particularly effective for tasks that demand sensitivity to temporal and causal dynamics. Moreover, because marine accidents typically result from multiple interacting factors, the Apriori algorithm is employed to efficiently identify frequent co-occurrence patterns within extensive datasets. Its flexibility in adjusting support and confidence thresholds facilitates the discovery of underlying causal relationships.
By integrating these approaches, the framework leverages BERT’s robust semantic capabilities alongside BiLSTM’s sequence modeling and Apriori’s association rule mining, offering a novel perspective on elucidating the complex multi-factor interactions that underlie maritime accidents.

3.1. BERT + BiLSTM Classification Model

The BERT + BiLSTM model synergistically combines BERT’s powerful semantic encoding capabilities with BiLSTM’s proficiency in capturing sequential information. In this framework, BERT initially encodes the accident-related text into high-dimensional contextual vectors, effectively extracting deep semantic features. Subsequently, BiLSTM processes these vectors to capture sequence dependencies and contextual associations, after which a linear classifier completes the accident-cause classification. This dual-dimensional analysis—integrating both semantic richness and sequential dynamics—significantly enhances the model’s classification accuracy and generalization ability, thereby improving overall performance.

3.1.1. BERT

BERT (Bidirectional Encoder Representations from Transformers) is based on the Transformer architecture [42] and is a pre-trained model for NLP proposed by Google [43].
(1)
Input Layer
The tokenizer will embed [CLS] tokens at the beginning of the sequence to indicate that this is a classification task and embed tokens at the end of the sequence or sentence to indicate the end of the sequence. Thus, a new sequence S is constructed:
S = C L S , S 1 , S 2 , , S n , S E P
Among them, S 1 , S 2 , , S n are the tokens in the original token sequence S.
(2)
Embedding layer
For the input token sequence S = S 1 , S 2 , , S n , the model first maps it to a high-dimensional vector representation E S i with the help of the embedding matrix E and then adds position embedding to give position information to each token to help the model capture the order relationship. The output of the embedding layer is the sum of the word embedding and position embedding of each token, forming the initial representation of the sequence.
(3)
Transformer Encoder Layer
Transformer uses a multi-head attention mechanism to increase the model’s ability to focus on different positions [44]. The query, key, and value matrices are split into multiple heads, and the self-attention operations are performed separately and then the outputs are concatenated:
A t t e n t i o n Q , K , V = s o f t m a x Q K T d k V
M u l t i H e a d Q , K , V = C o n c a t h e a d 1 , , h e a d h W O
F F N H = m a x 0 , H W 1 + b 1 W 2 + b 2
O u t p u t S u b l a y e r = L a y e r N o r m H + S u b l a y e r H
where each head h e a d i = A t t e n t i o n ( Q W i Q , K W i K , V W i V ) and W O is the parameter matrix of the output linear transformation. W 1 , W 2 are the weight matrix, and b 1 , b 2 are the bias vectors. S u b l a y e r H is a self-attention layer or a feedforward neural network.

3.1.2. BiLSTM

In a recurrent neural network, a long short-term memory network (LSTM) cell receives the hidden state h t 1 and cell state C t 1 of the previous time step and the input x t of the current time step at each time step. It outputs the hidden state h t and cell state C t of the current time step.
Key components of LSTM include the following [45]:
i t = σ W i · h t 1 , x t + b i
f t = W f · h t 1 , x t + b f
o t = σ W o · h t 1 , x t + b o
C ~ t = t a n h W C · h t 1 , x t + b C
C t = f t C t 1 + i t C ~ t
h t = o t t a n h C t
Among them, σ is the sigmoid activation function, W i is the weight matrix, b i is the bias, W f is the weight matrix, b f is the bias, tanh is the hyperbolic tangent activation function, W C is the weight matrix, and b C is the bias. BiLSTM is composed of a forward LSTM and a reverse LSTM. The forward LSTM is responsible for input, and the reverse LSTM is responsible for extracting features in forward and reverse order. The feature vectors of the two outputs are then combined into the final feature expression.
For instance, consider the sentence: “Thick fog reduces visibility at sea, making it challenging for crew members to distinguish navigation aids and lights”. In the input layer, BERT tokenizes this sentence using Word Piece, yielding the sequence: [“[CLS]”, “thick”, “fog”, “reduces”, “visibility”, “at”, “sea”, “,”, “making”, “it”, “challenging”, “for”, “crew”, “members”, “to”, “distinguish”, “navigation”, “aids”, “and”, “lights”, “[SEP]”]. In the embedding layer, each token is mapped to a high-dimensional vector that combines three components: word embeddings (capturing vocabulary semantics, e.g., “fog” relates to weather), position embeddings (indicating the token’s order in the sequence, e.g., “visibility” is the fifth token), and segment embeddings (marking the sentence segment; all tokens belong to segment A for a single sentence). The resulting matrix is then processed by the Transformer layer, where each token initially has a context-free representation. Through a multi-layer self-attention mechanism, the Transformer progressively extracts contextual features; for example, “visibility” is associated with “thick fog” and “sea” to reflect its context, while “challenging” connects with “crew members” and “distinguish” to capture the complexity of the task. A subsequent feedforward network further refines these nonlinear characteristics, updating the vectors to include global contextual information (e.g., recognizing “navigation aids” and “lights” as critical navigational elements).
Afterward, the BiLSTM layer processes these vectors bidirectionally. The forward LSTM captures left-to-right dependencies (such as the influence of “crew members” on the subsequent action “distinguish”), while the backward LSTM captures right-to-left dependencies (such as “lights” being modified by “navigation aids”). This integration of bidirectional temporal features reinforces the causal relationships—for instance, between “reduces visibility” and “challenging”. Finally, the output layer applies a Softmax function to compute the probability distribution, yielding the final classification decision (in this case, “poor visibility”). The complete structure of the model is shown in Figure 1.

3.2. Apriori Algorithm

The Apriori association rule algorithm is a classic algorithm for discovering frequent item sets and association rules in accident databases [46]. This framework can explore potential correlations between multiple factors in accident data, uncover the interactive relationships behind accident causes, address the limitations of classification models in causal analysis, and improve the overall understanding of the factors contributing to accidents [47]. The main process is to generate frequent item sets and then generate association rules as follows:
S u p p o r t X Y = N u m b e r   o f   t r a n s a c t i o n s   i n   t h e   f r e q u e n t   i t e m s e t X Y T o t a l   n u m b e r   o f   t r a n s a c t i o n s
C o n f i d e n c e X Y = S u p p o r t X Y S u p p o r t X
L i f t X Y = C o n f i d e n c e X Y S u p p o r t Y
C o n v i c t i o n X Y = 1 S u p p o r t Y 1 C o n f i d e n c e X Y
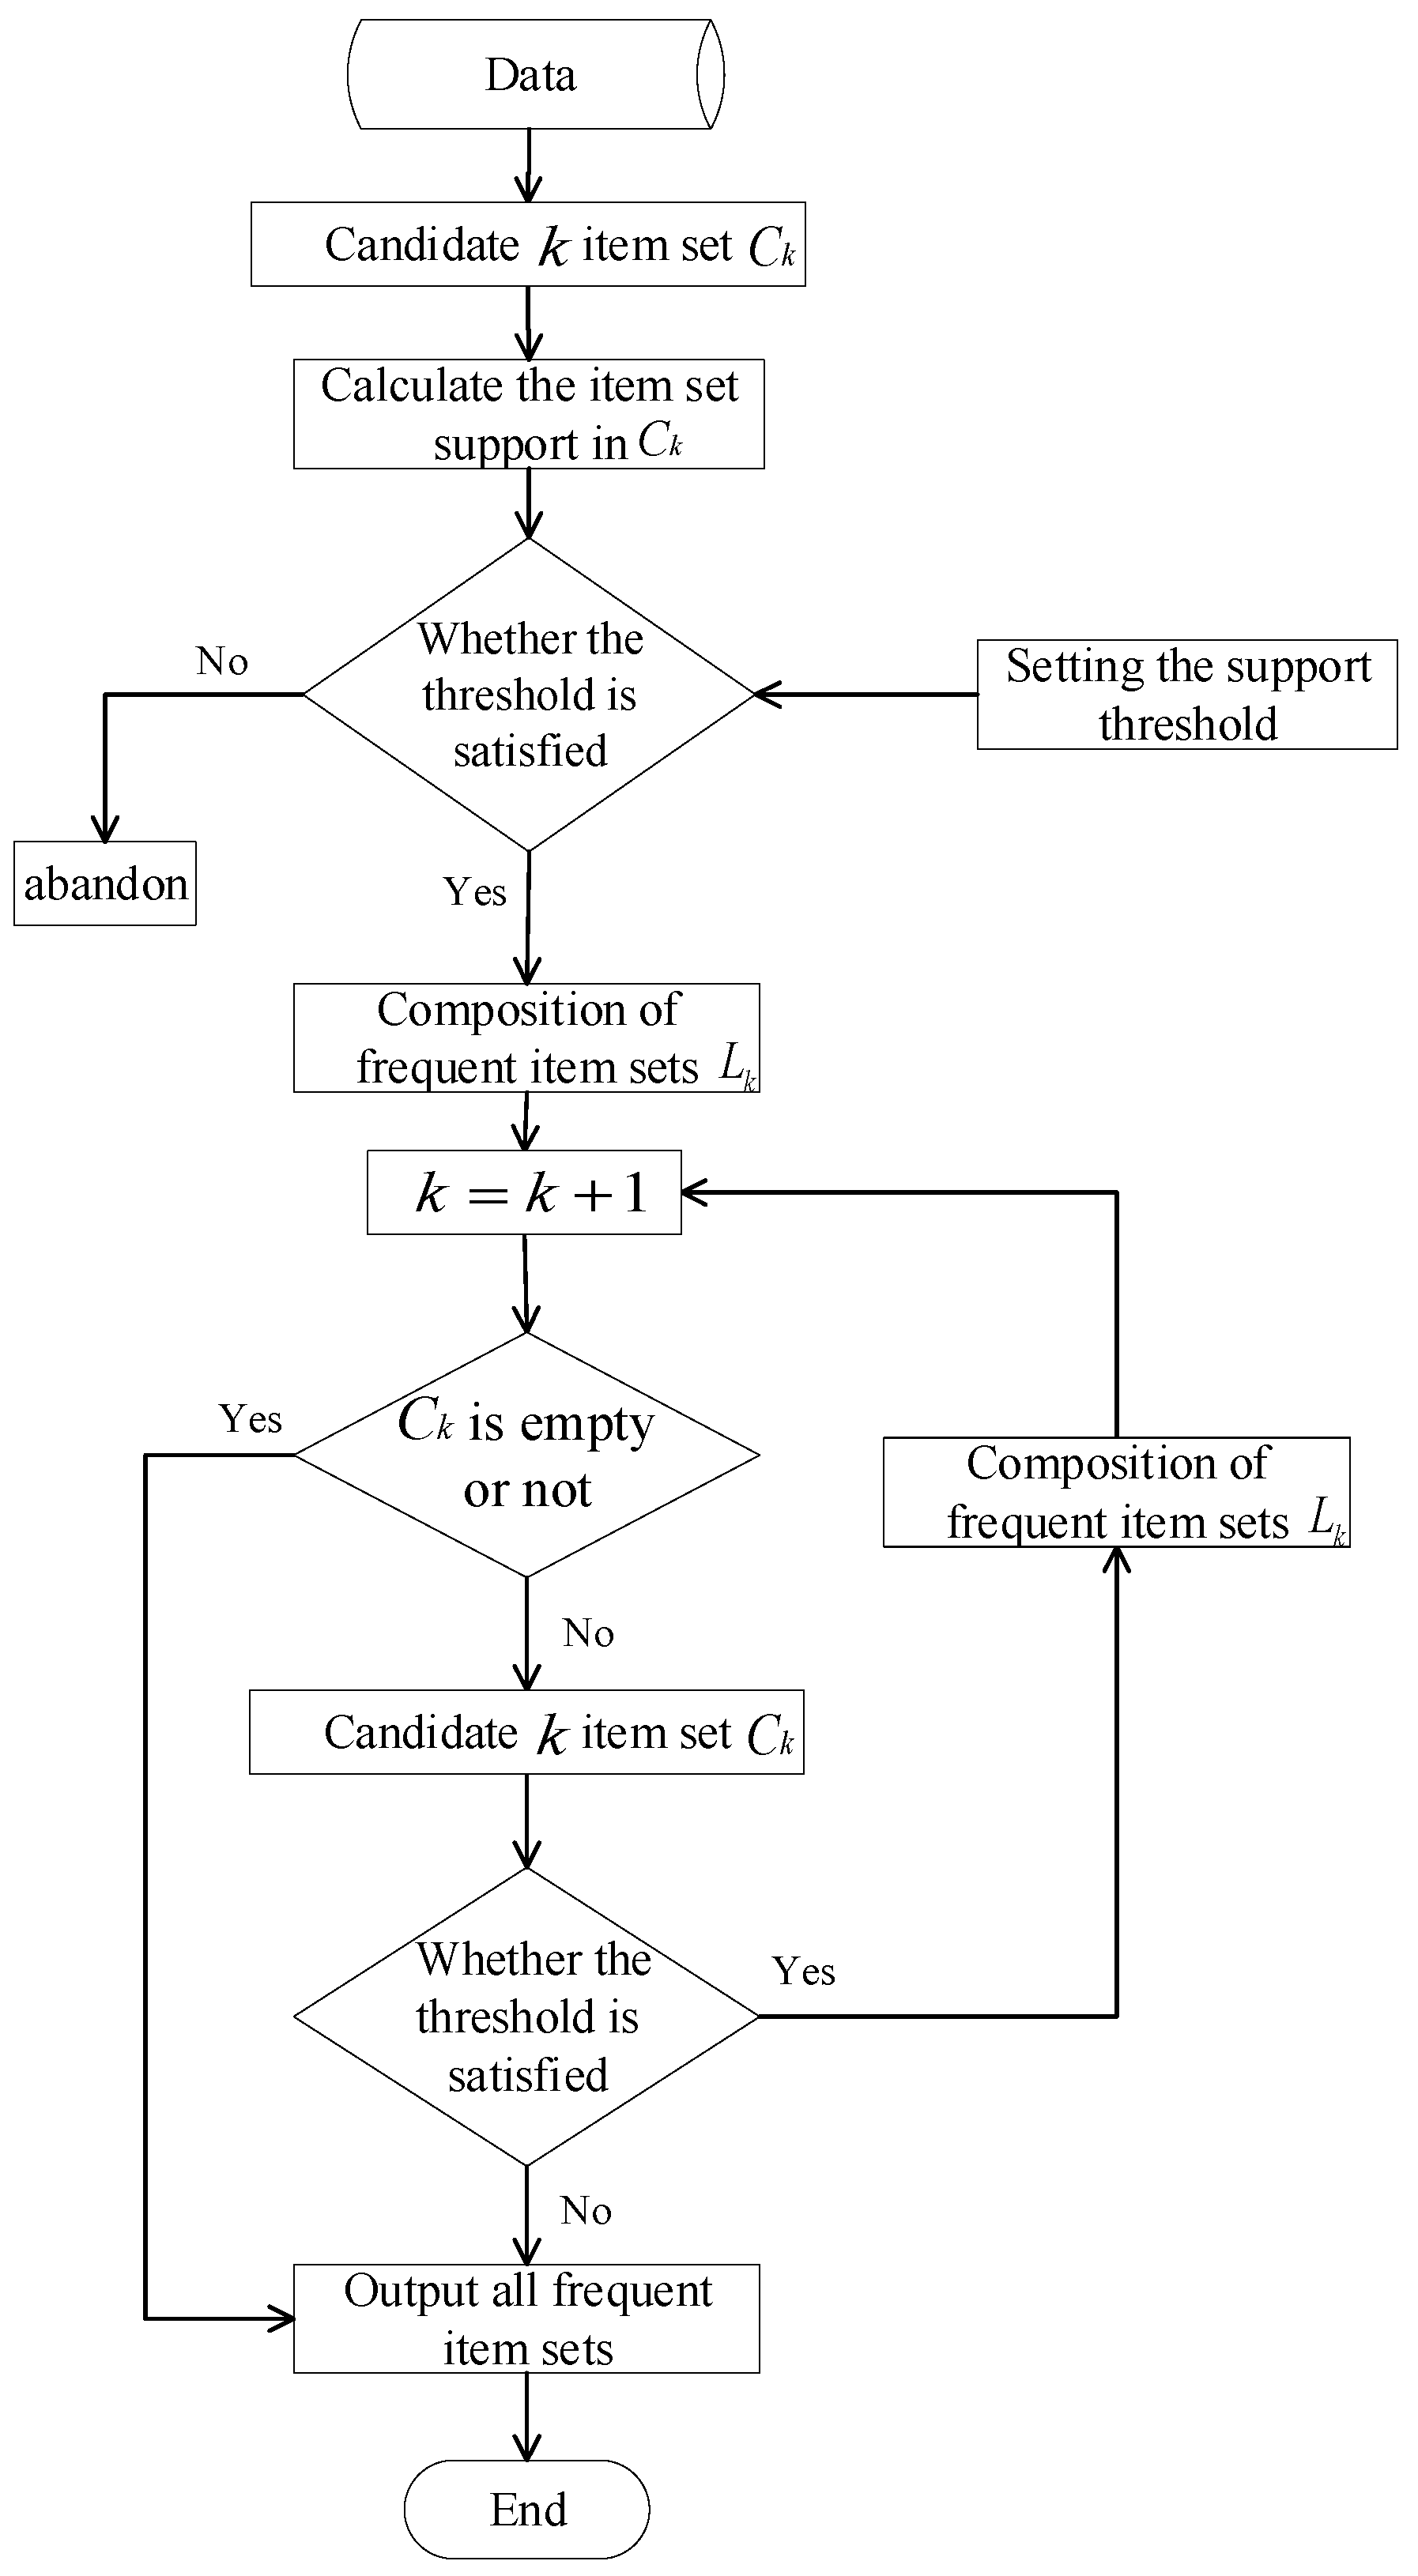
The set of maximum frequent items is found according to the graph and the association rules are composed based on the threshold restrictions (see Figure 2).

3.3. Framework

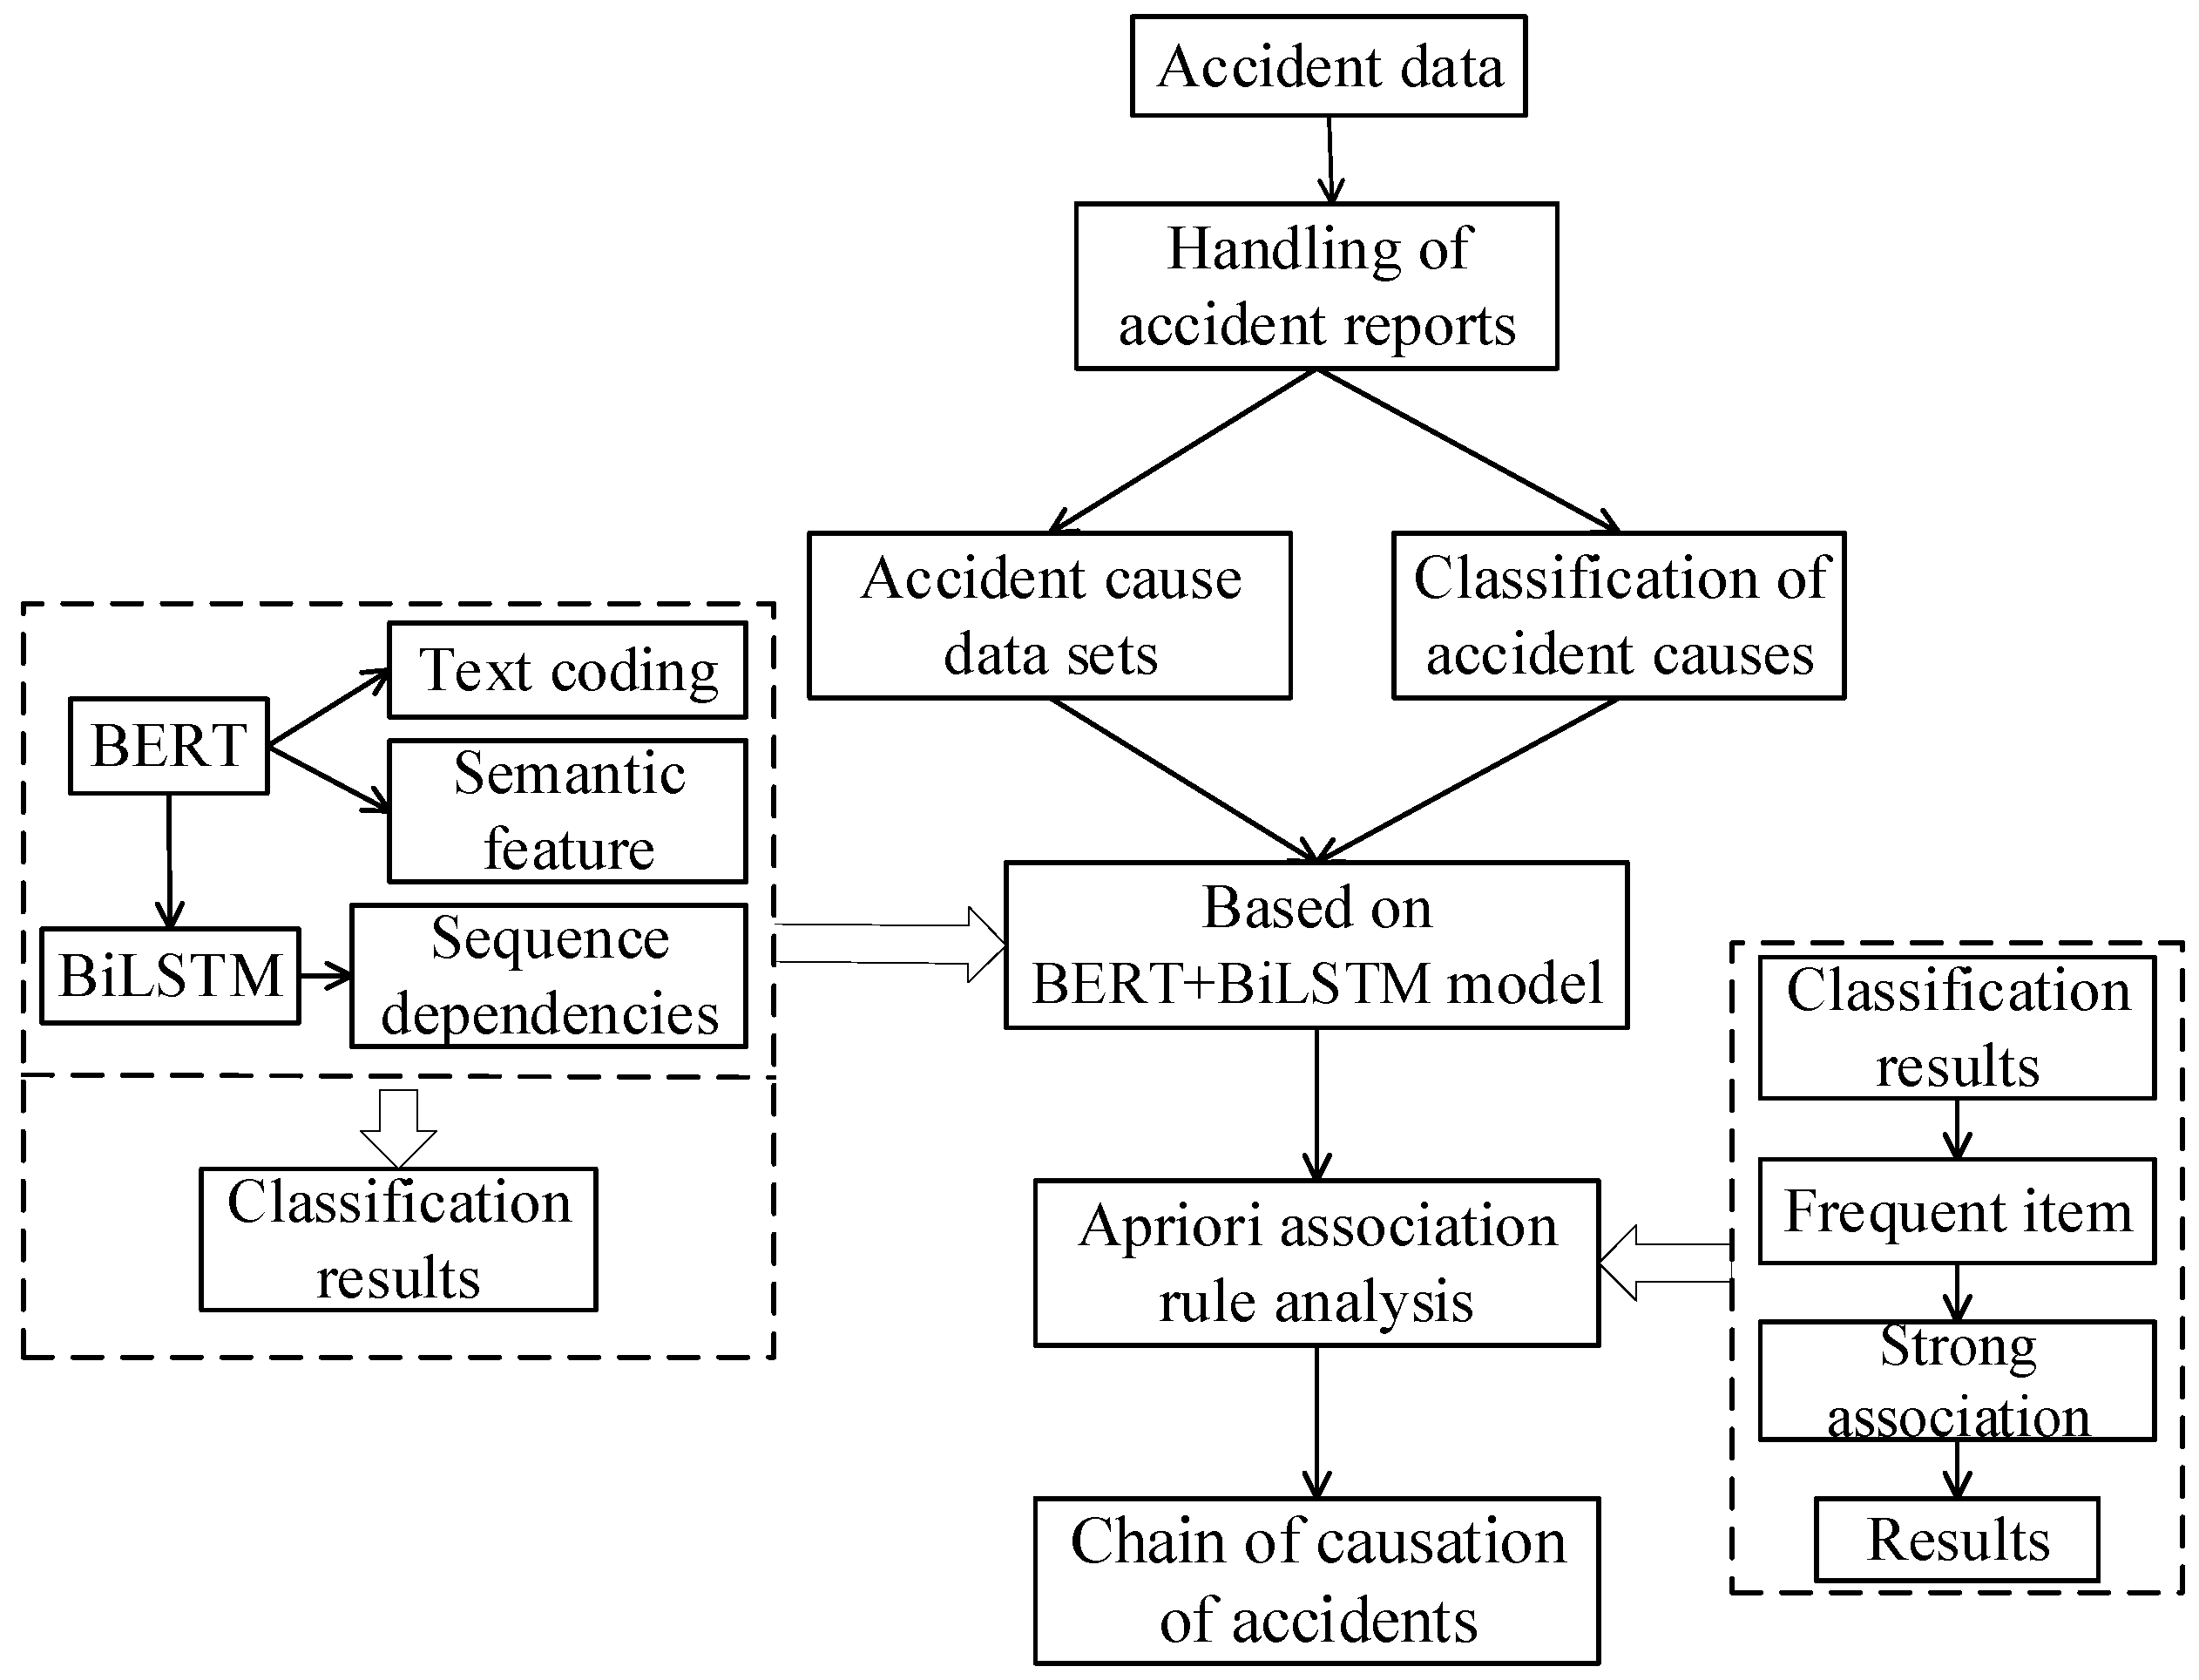
Although the BERT + BiLSTM model provides deep semantic understanding and efficient classification of accident-related texts, it does not account for the interactions among contributing factors. In contrast, the Apriori algorithm excels at revealing complex multi-factor interactions by mining association rules. By integrating these two approaches, the model delivers high-quality input data for rule mining, while the association algorithm supplements the classification output with insights into inter-factor relationships. This synergy not only enhances classification accuracy but also uncovers hidden multi-factor associations, thereby improving the comprehensiveness and practical applicability of accident analysis. Consequently, this study proposes a maritime accident analysis framework that combines an enhanced deep learning BERT model with Apriori association rules (see Figure 3).

4. Case Study

4.1. Data

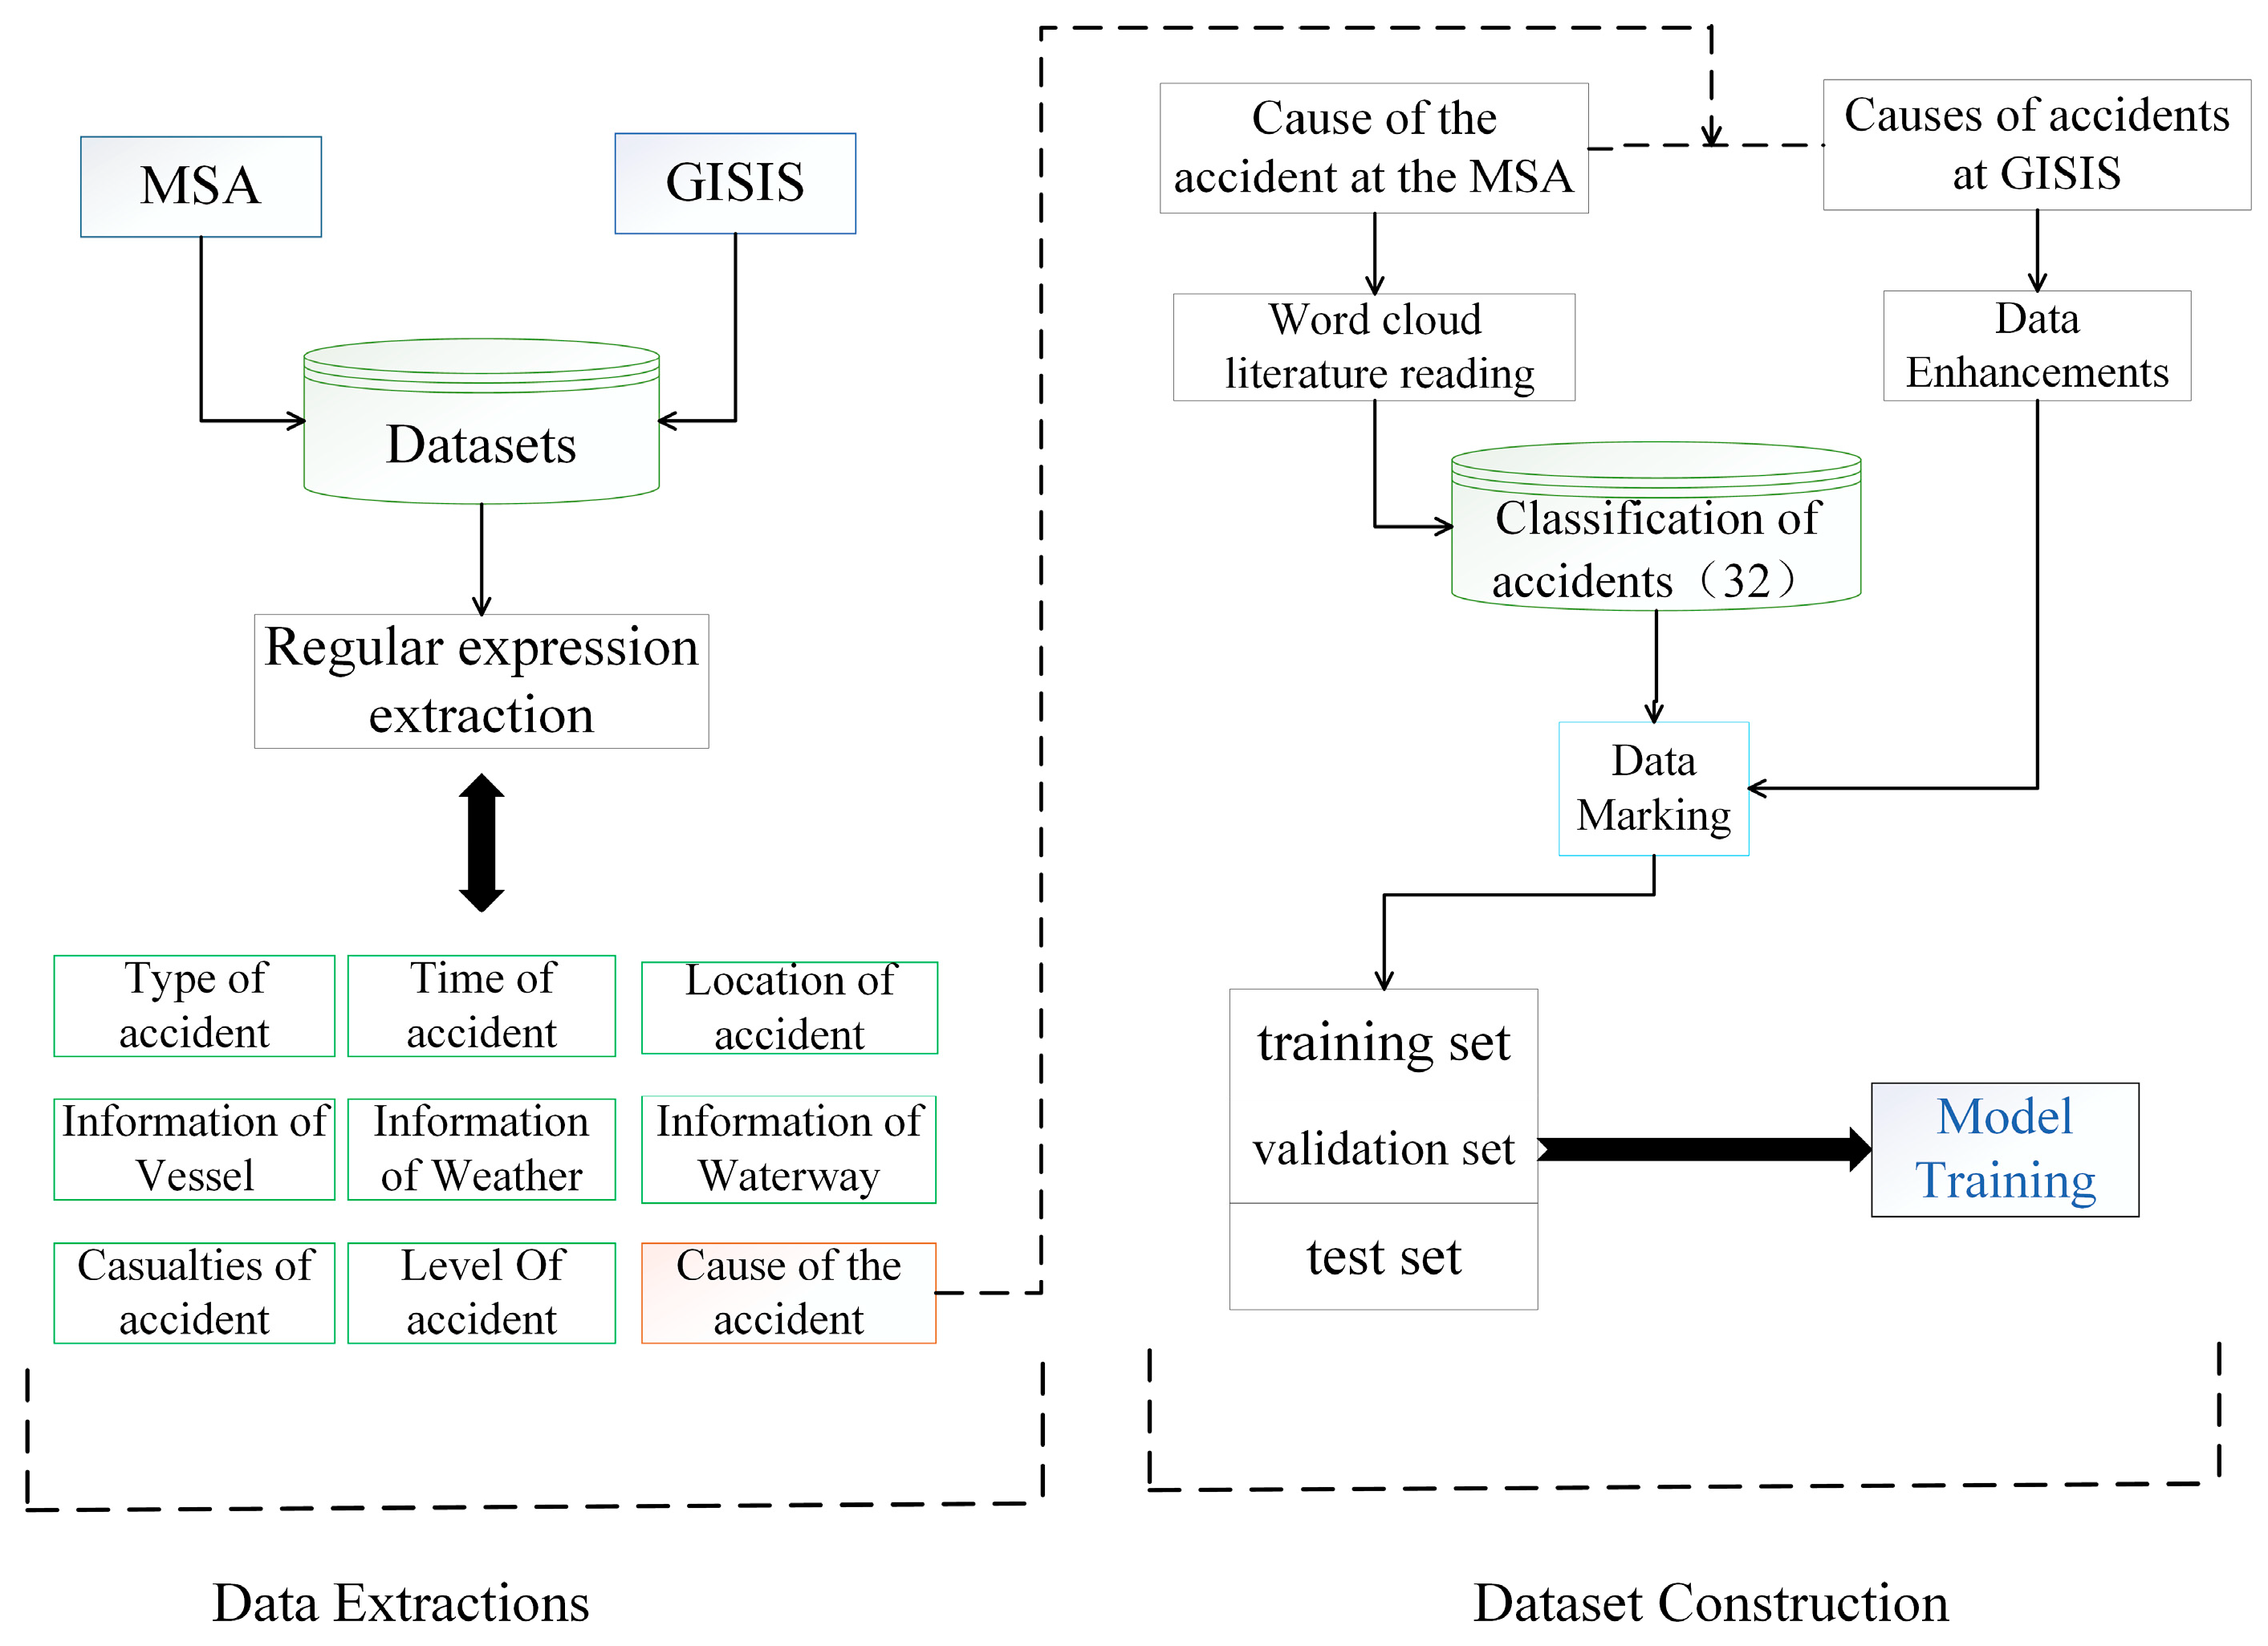
The accident report data utilized in this study were primarily sourced from the official website of the China Maritime Safety Administration, reports issued by local maritime safety bureaus (covering the period from 2014 to 2024), and the official website of the Global Integrated Shipping Information System (GISIS). Notably, GISIS data were predominantly employed for model training; therefore, greater emphasis was placed on the content and quality of the data rather than the specific temporal range. The core analysis relied on data reports from China’s coastal regions. Furthermore, critical information within the accident reports was extracted using regular expressions. For instance, a report might describe “Accident location: longitude 121.50° E, latitude 29.80° N; Accident type: Collision”. Regular expressions were applied to separately extract longitude, latitude information, and accident types to ensure precise data extraction. During data processing, it was discovered that some reports contained missing information. For such cases with incomplete data, an initial manual review of the original reports was conducted to supplement the missing details. If essential information remained unavailable even after consulting the original reports, the corresponding data were excluded to maintain overall data integrity and quality. The specific steps are represented in Figure 4.
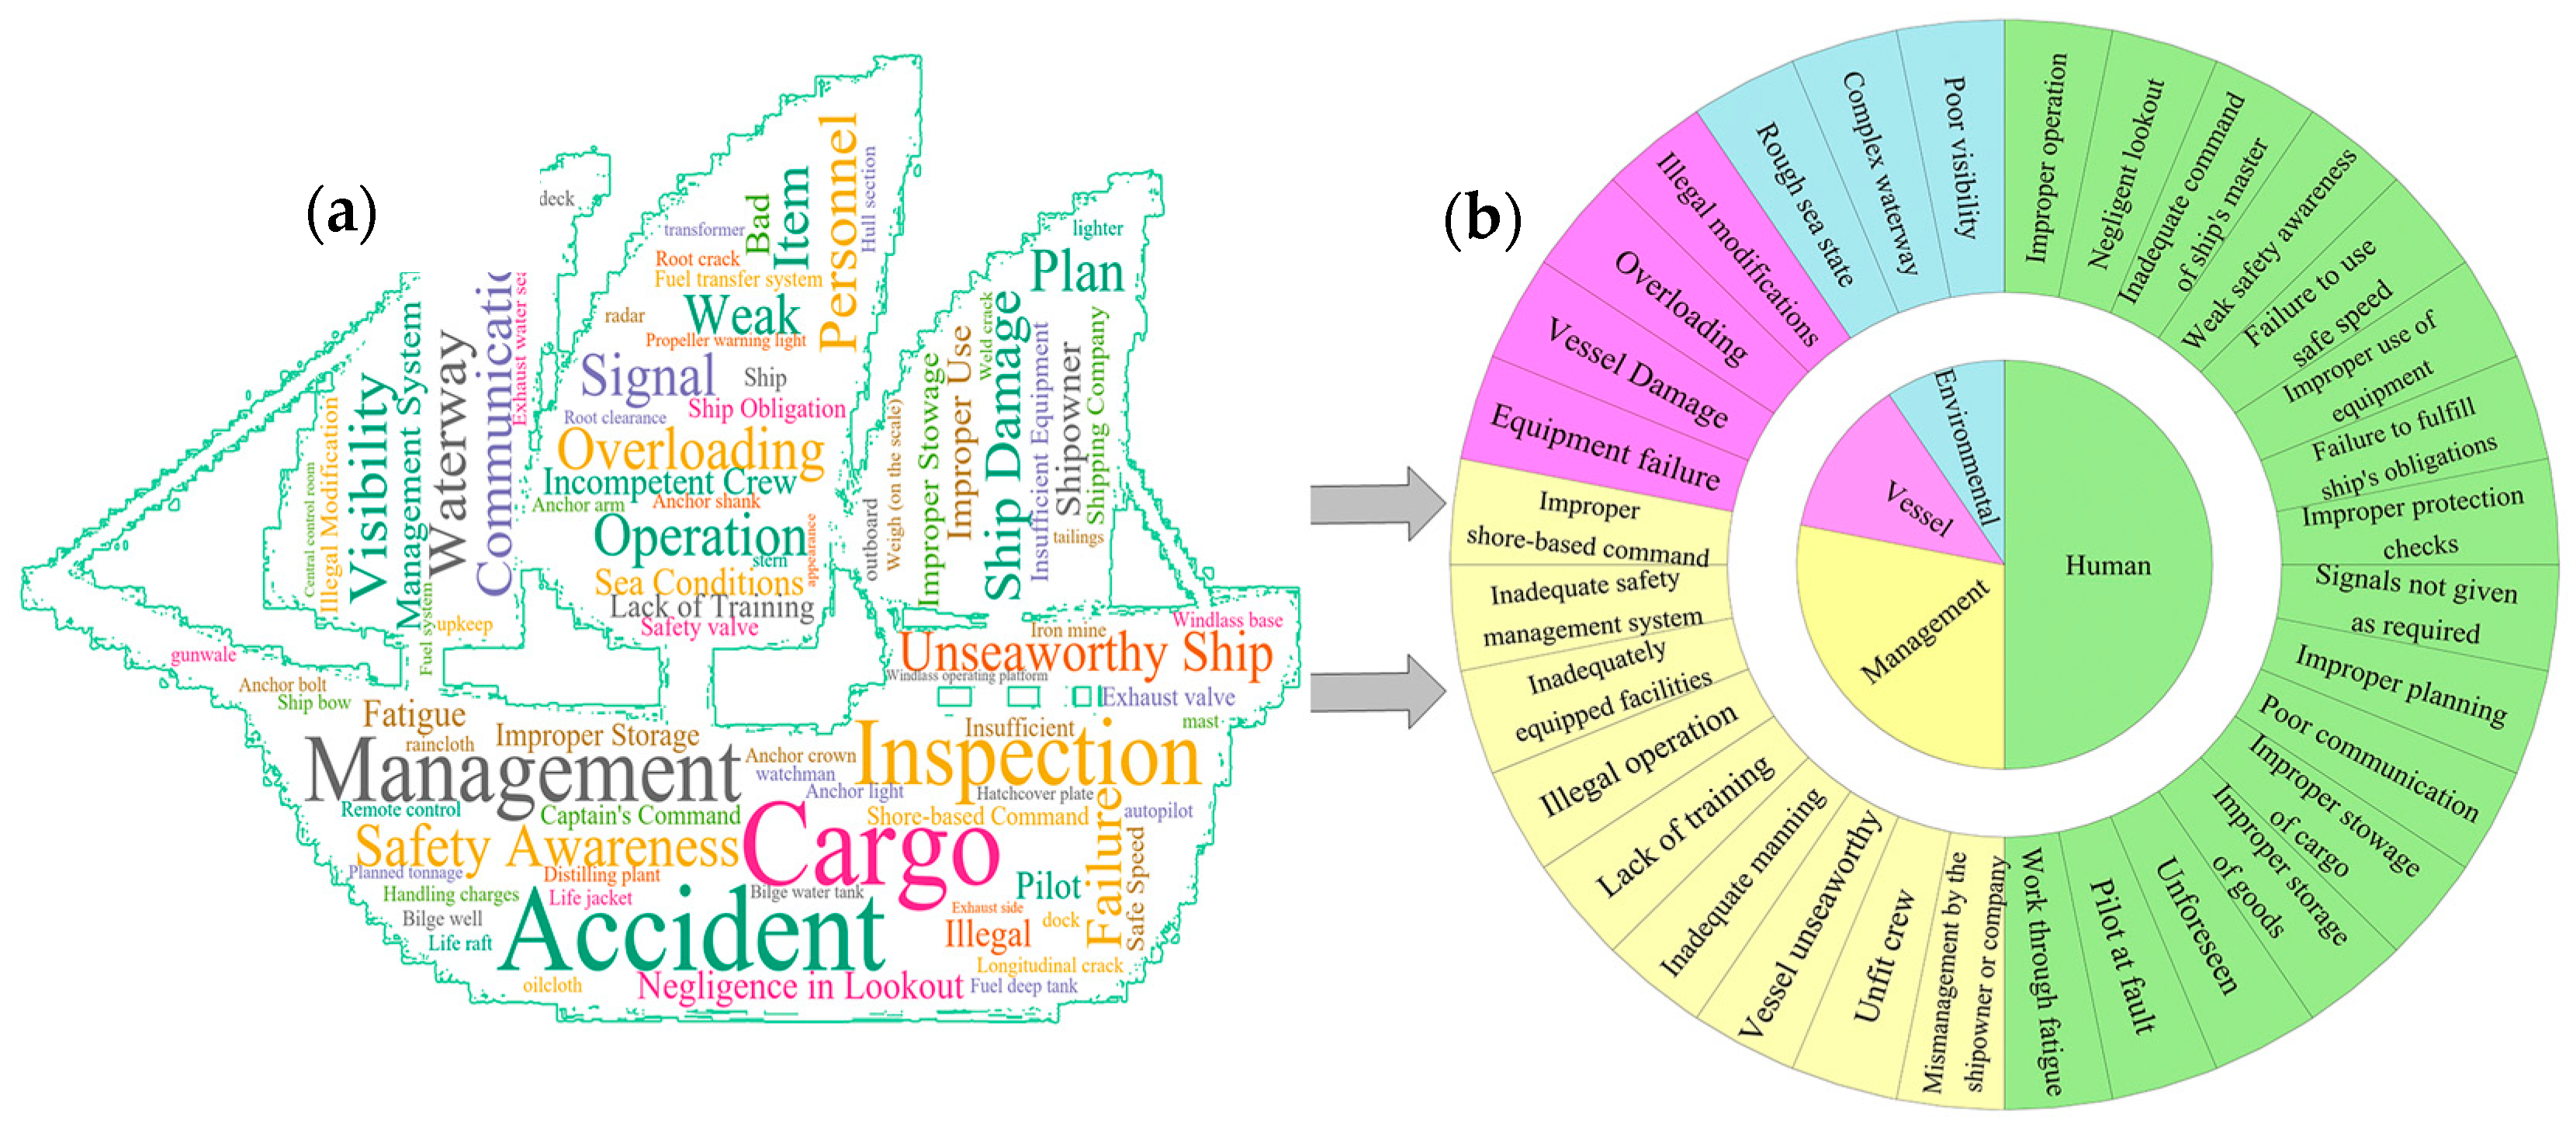
In terms of classification, given that accident causes typically result from multiple factors, this study initially employed word cloud analysis to visually represent the frequency of causes mentioned in Chinese accident reports. While this method provides an intuitive overview of prevalent causes, it lacks detailed classification dimensions. Consequently, based on relevant studies [6,41,48,49,50], the causes were systematically categorized into four primary groups—human factors, ship factors, environmental factors, and management factors—encompassing 32 specific subcategories, as illustrated in Figure 5.
Ensuring balanced category representation is crucial for improving model training outcomes [51]. To systematically maintain this balance, this study employs text augmentation techniques, including synonym replacement [52], back translation [53], and even AI generation [54]. These methods expand the dataset and ensure an equitable distribution of data across categories. The model is trained exclusively on international accident reports and the augmented dataset, which together encompass extensive details and enhance both the generalizability and practicality of the model [55]. Finally, the dataset comprises 32 accident-cause classifications, with each category containing approximately 800 base samples and totaling around 25,930 data points. The data are organized in a structured table, where each record includes a “cause of the accident” field extracted from the accident report and a manually labeled “Cause classification” field. For example, a report stating, “The ship failed to properly display navigation lights while operating at night and did not provide clear operational warnings to nearby vessels,” is categorized under “Signals not given as required”. For model training and evaluation, the dataset is partitioned into training, validation, and test sets in a 70%, 15%, and 15% ratio, respectively.

4.2. Modeling

The experimental environment configuration of this study is shown in Table 2:
According to the data presented in Table 3, the model’s test accuracy remains consistently high (above 0.88) across different parameter settings—including variations in gradient thresholds, hidden layer sizes, and batch sizes—demonstrating robust insensitivity to parameter fluctuations. Moreover, the introduction of dropout and regularization strategies effectively minimizes the disparity between training and test losses, thereby reducing overfitting risk and further enhancing the model’s robustness and generalization across diverse configurations.
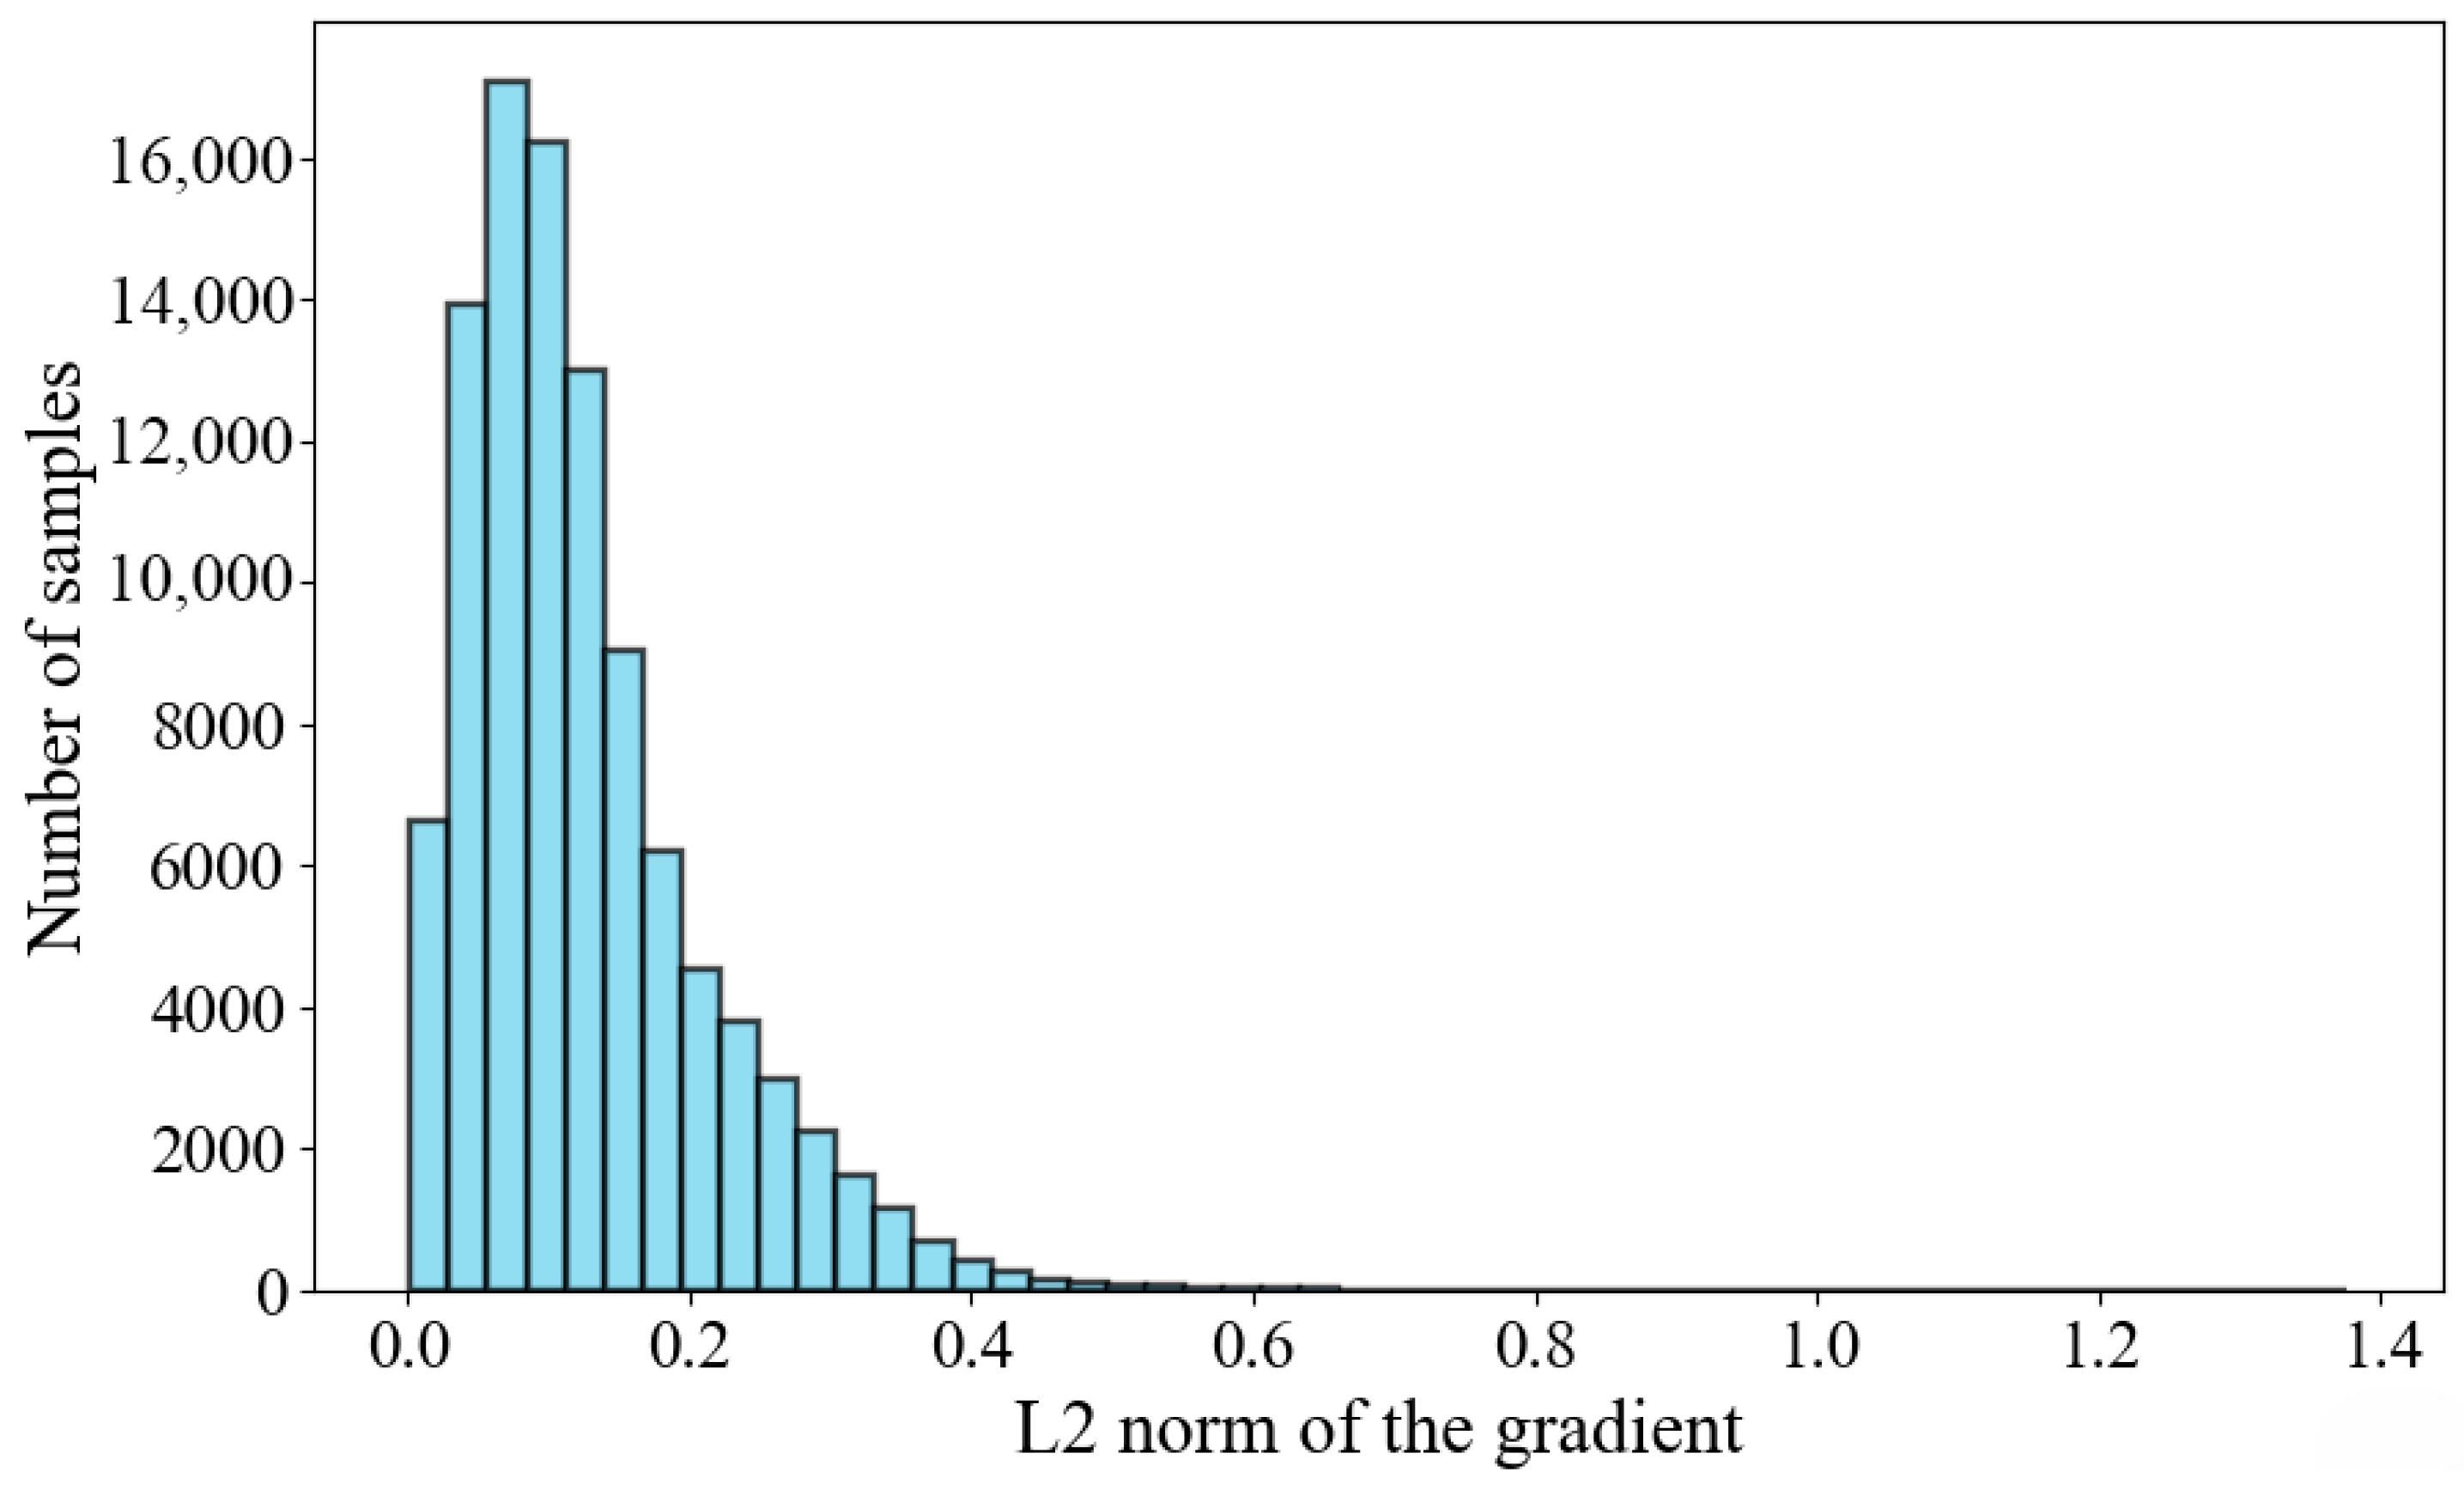
As illustrated in Figure 6, the L2 norm of most gradients is concentrated in the range of 0 to 0.2, exhibiting a pronounced right-skewed long-tail distribution, with only a minor fraction of gradients exceeding 0.3. This distribution indicates that, during training, the network parameters are updated in modest increments, significantly reducing the likelihood of gradient explosion or related instabilities. Although a few updates exhibit relatively larger gradients, their proportion is negligible based on the histogram.
In summary, the convergence behavior observed during training is notably stable, with no significant signs of numerical instability.

4.2.1. Loss Function and Accuracy

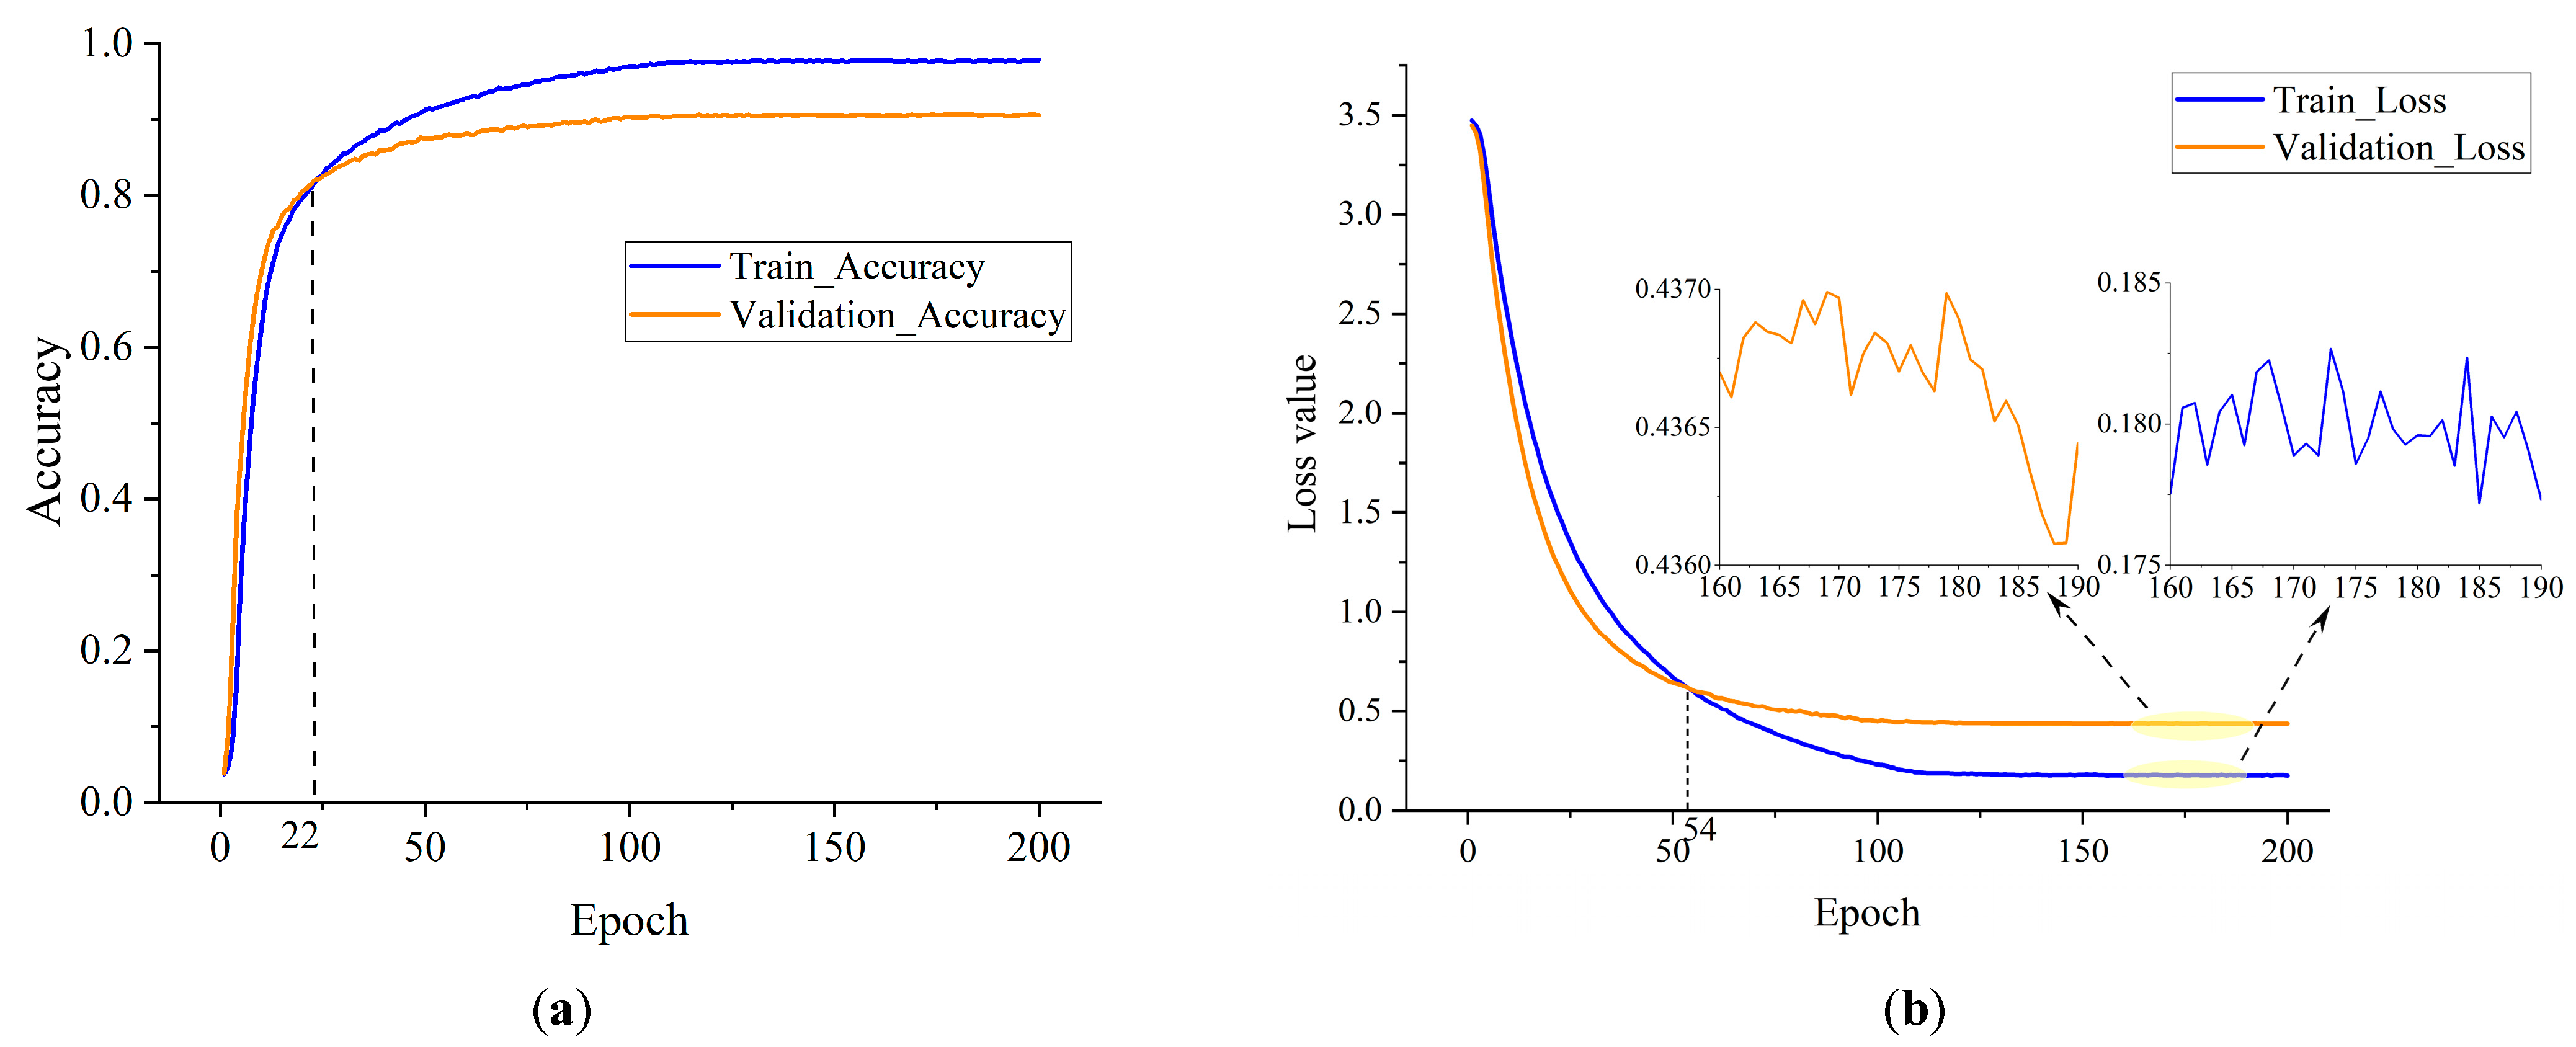
In Figure 7a, both training and validation accuracy rise rapidly in the initial phase and plateau at approximately 0.9 after around 20 epochs. Similarly, Figure 7b shows that training and validation loss decrease overall, with higher losses observed at the beginning and a gradual decline leading to stabilization in later stages. This behavior indicates robust classification performance and no apparent overfitting. The model effectively learns and optimizes throughout training, ultimately reaching a stable convergence.

4.2.2. Confusion Matrix

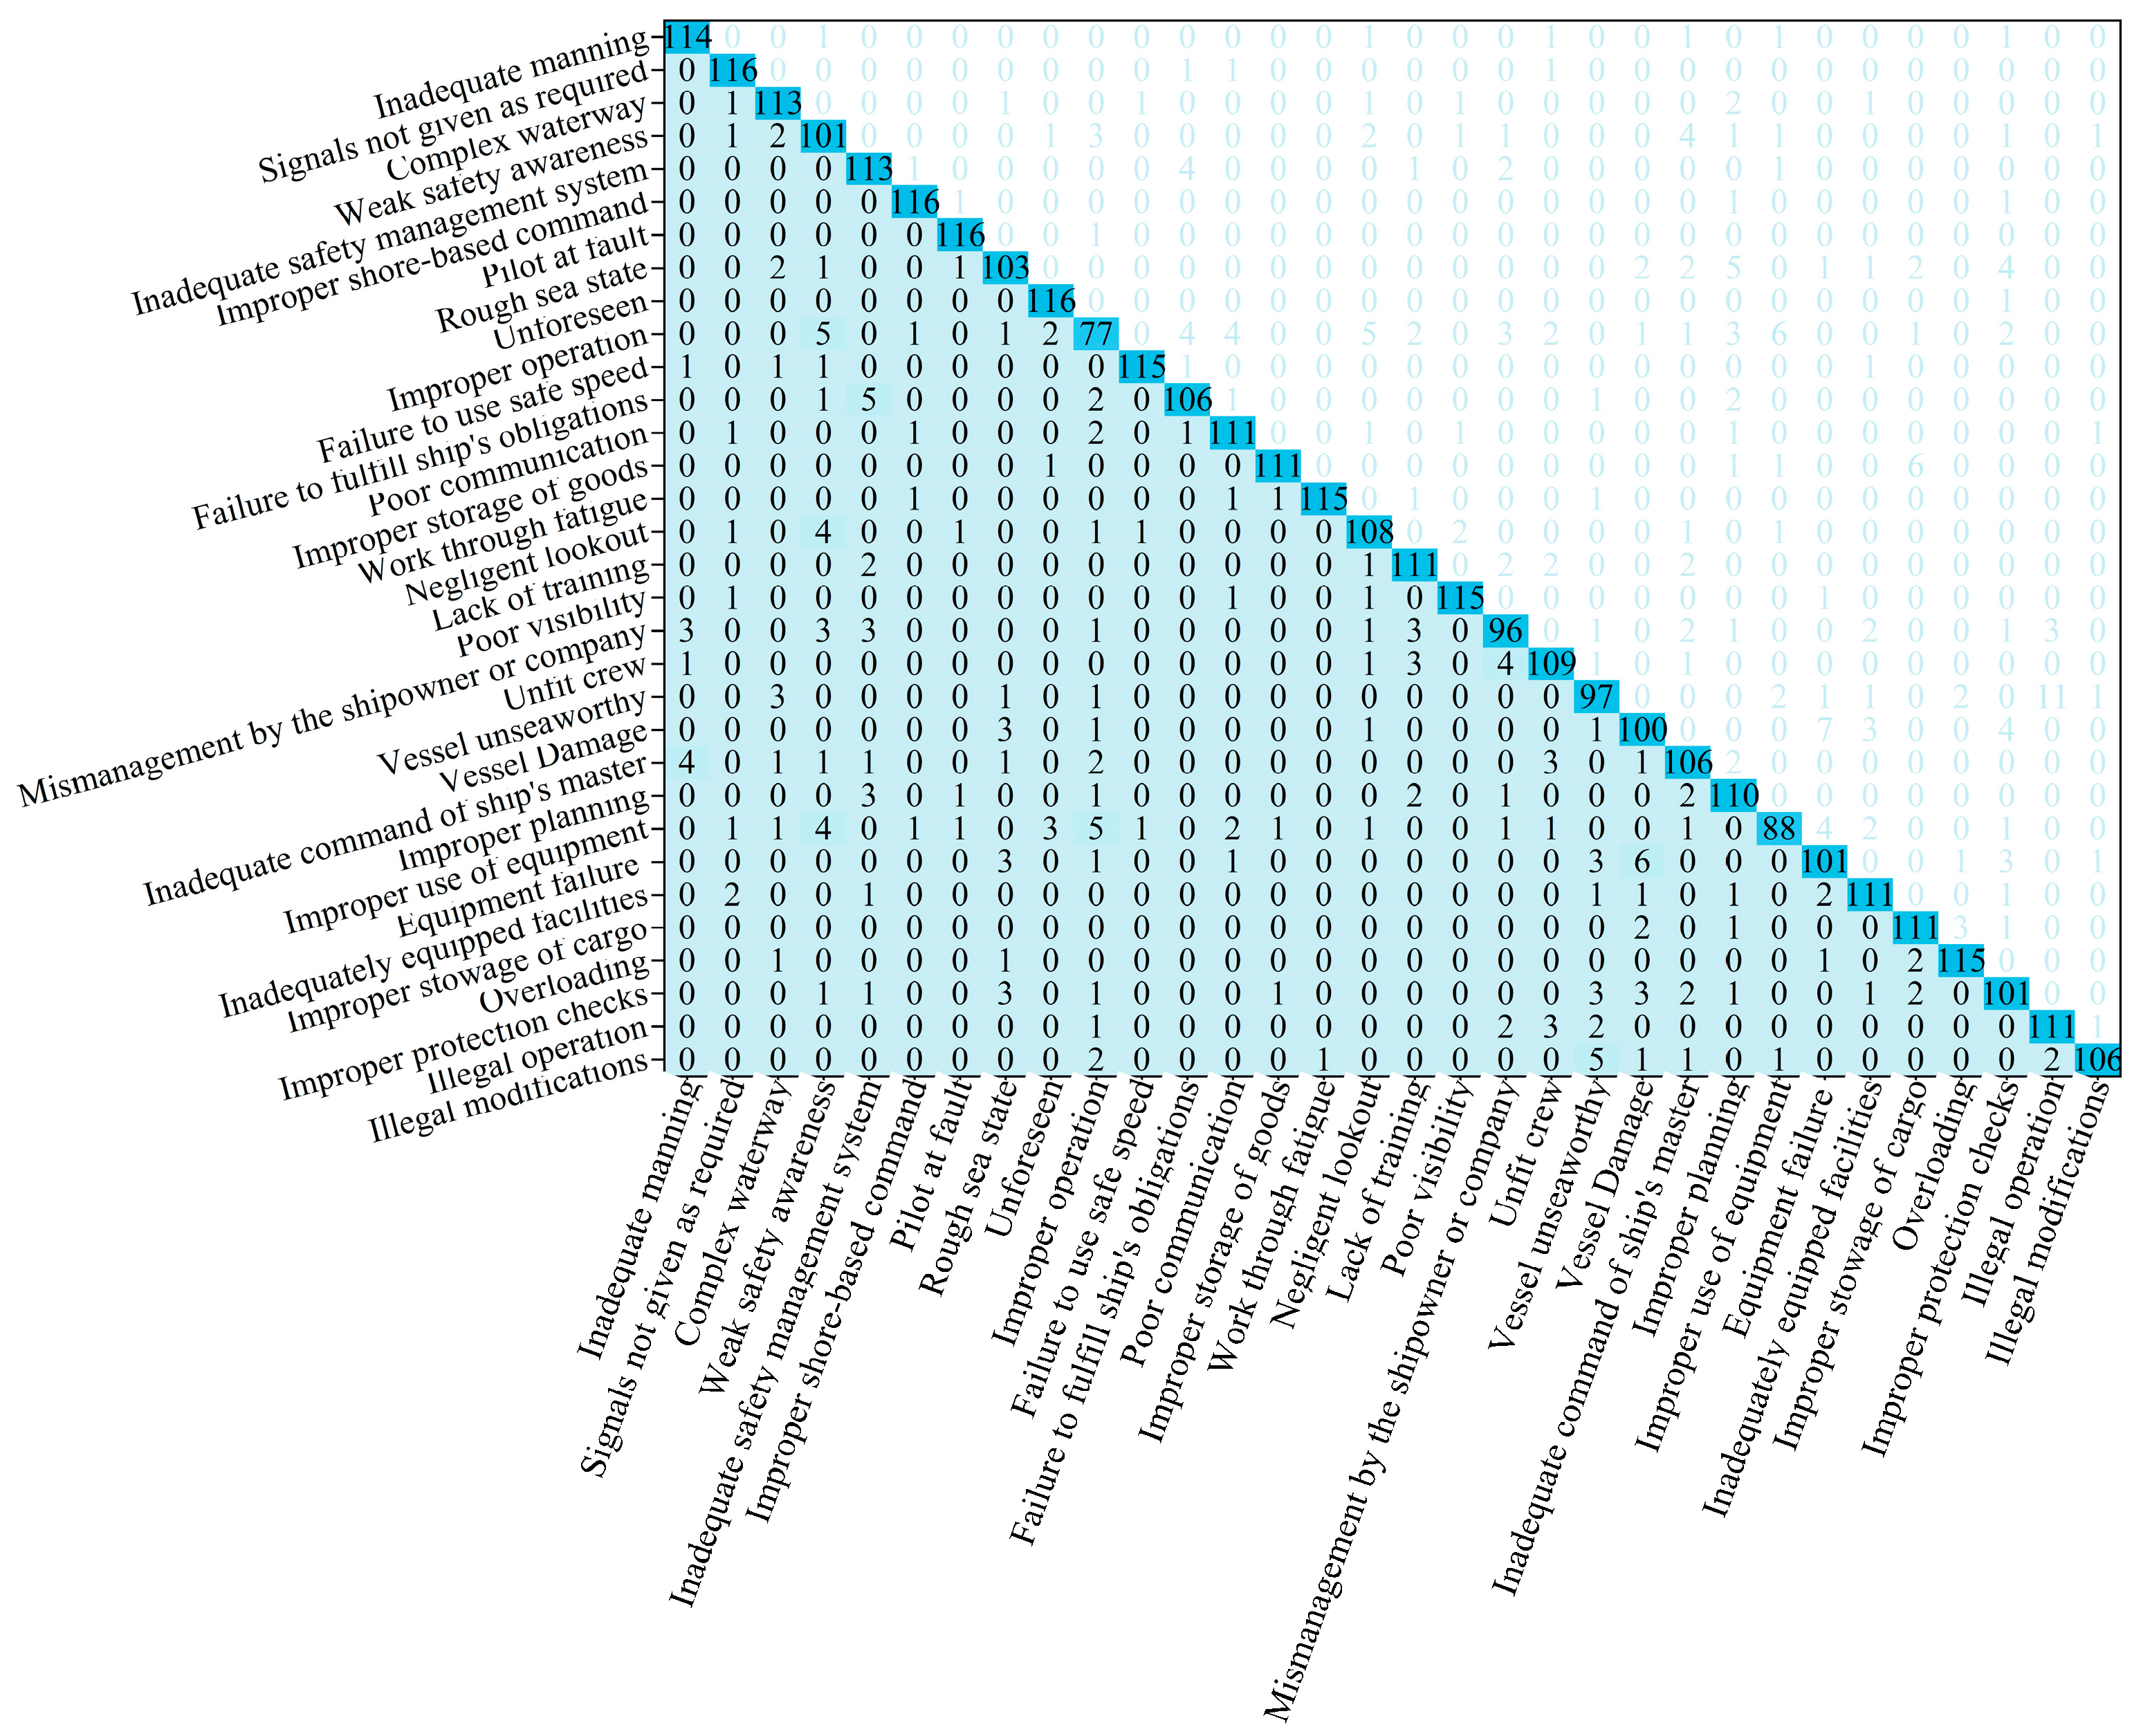
Figure 8 presents the prediction performance of the BERT + BiLSTM model across various accident cause categories via a confusion matrix. The horizontal axis represents the predicted category labels, while the vertical axis denotes the true labels. Each cell in the matrix indicates the number of predictions for a specific category. Notably, the diagonal cells are darkened—darker shades correspond to a higher count of correct predictions—whereas off-diagonal cells reveal the frequency and distribution of misclassifications. The pronounced concentration of data along the diagonal implies that the model accurately predicts accident causes across most categories, such as “signals not given as required”. This finding highlights the model’s robustness and reliability in classifying accident causes across a diverse set of categories.

4.3. Classification Results

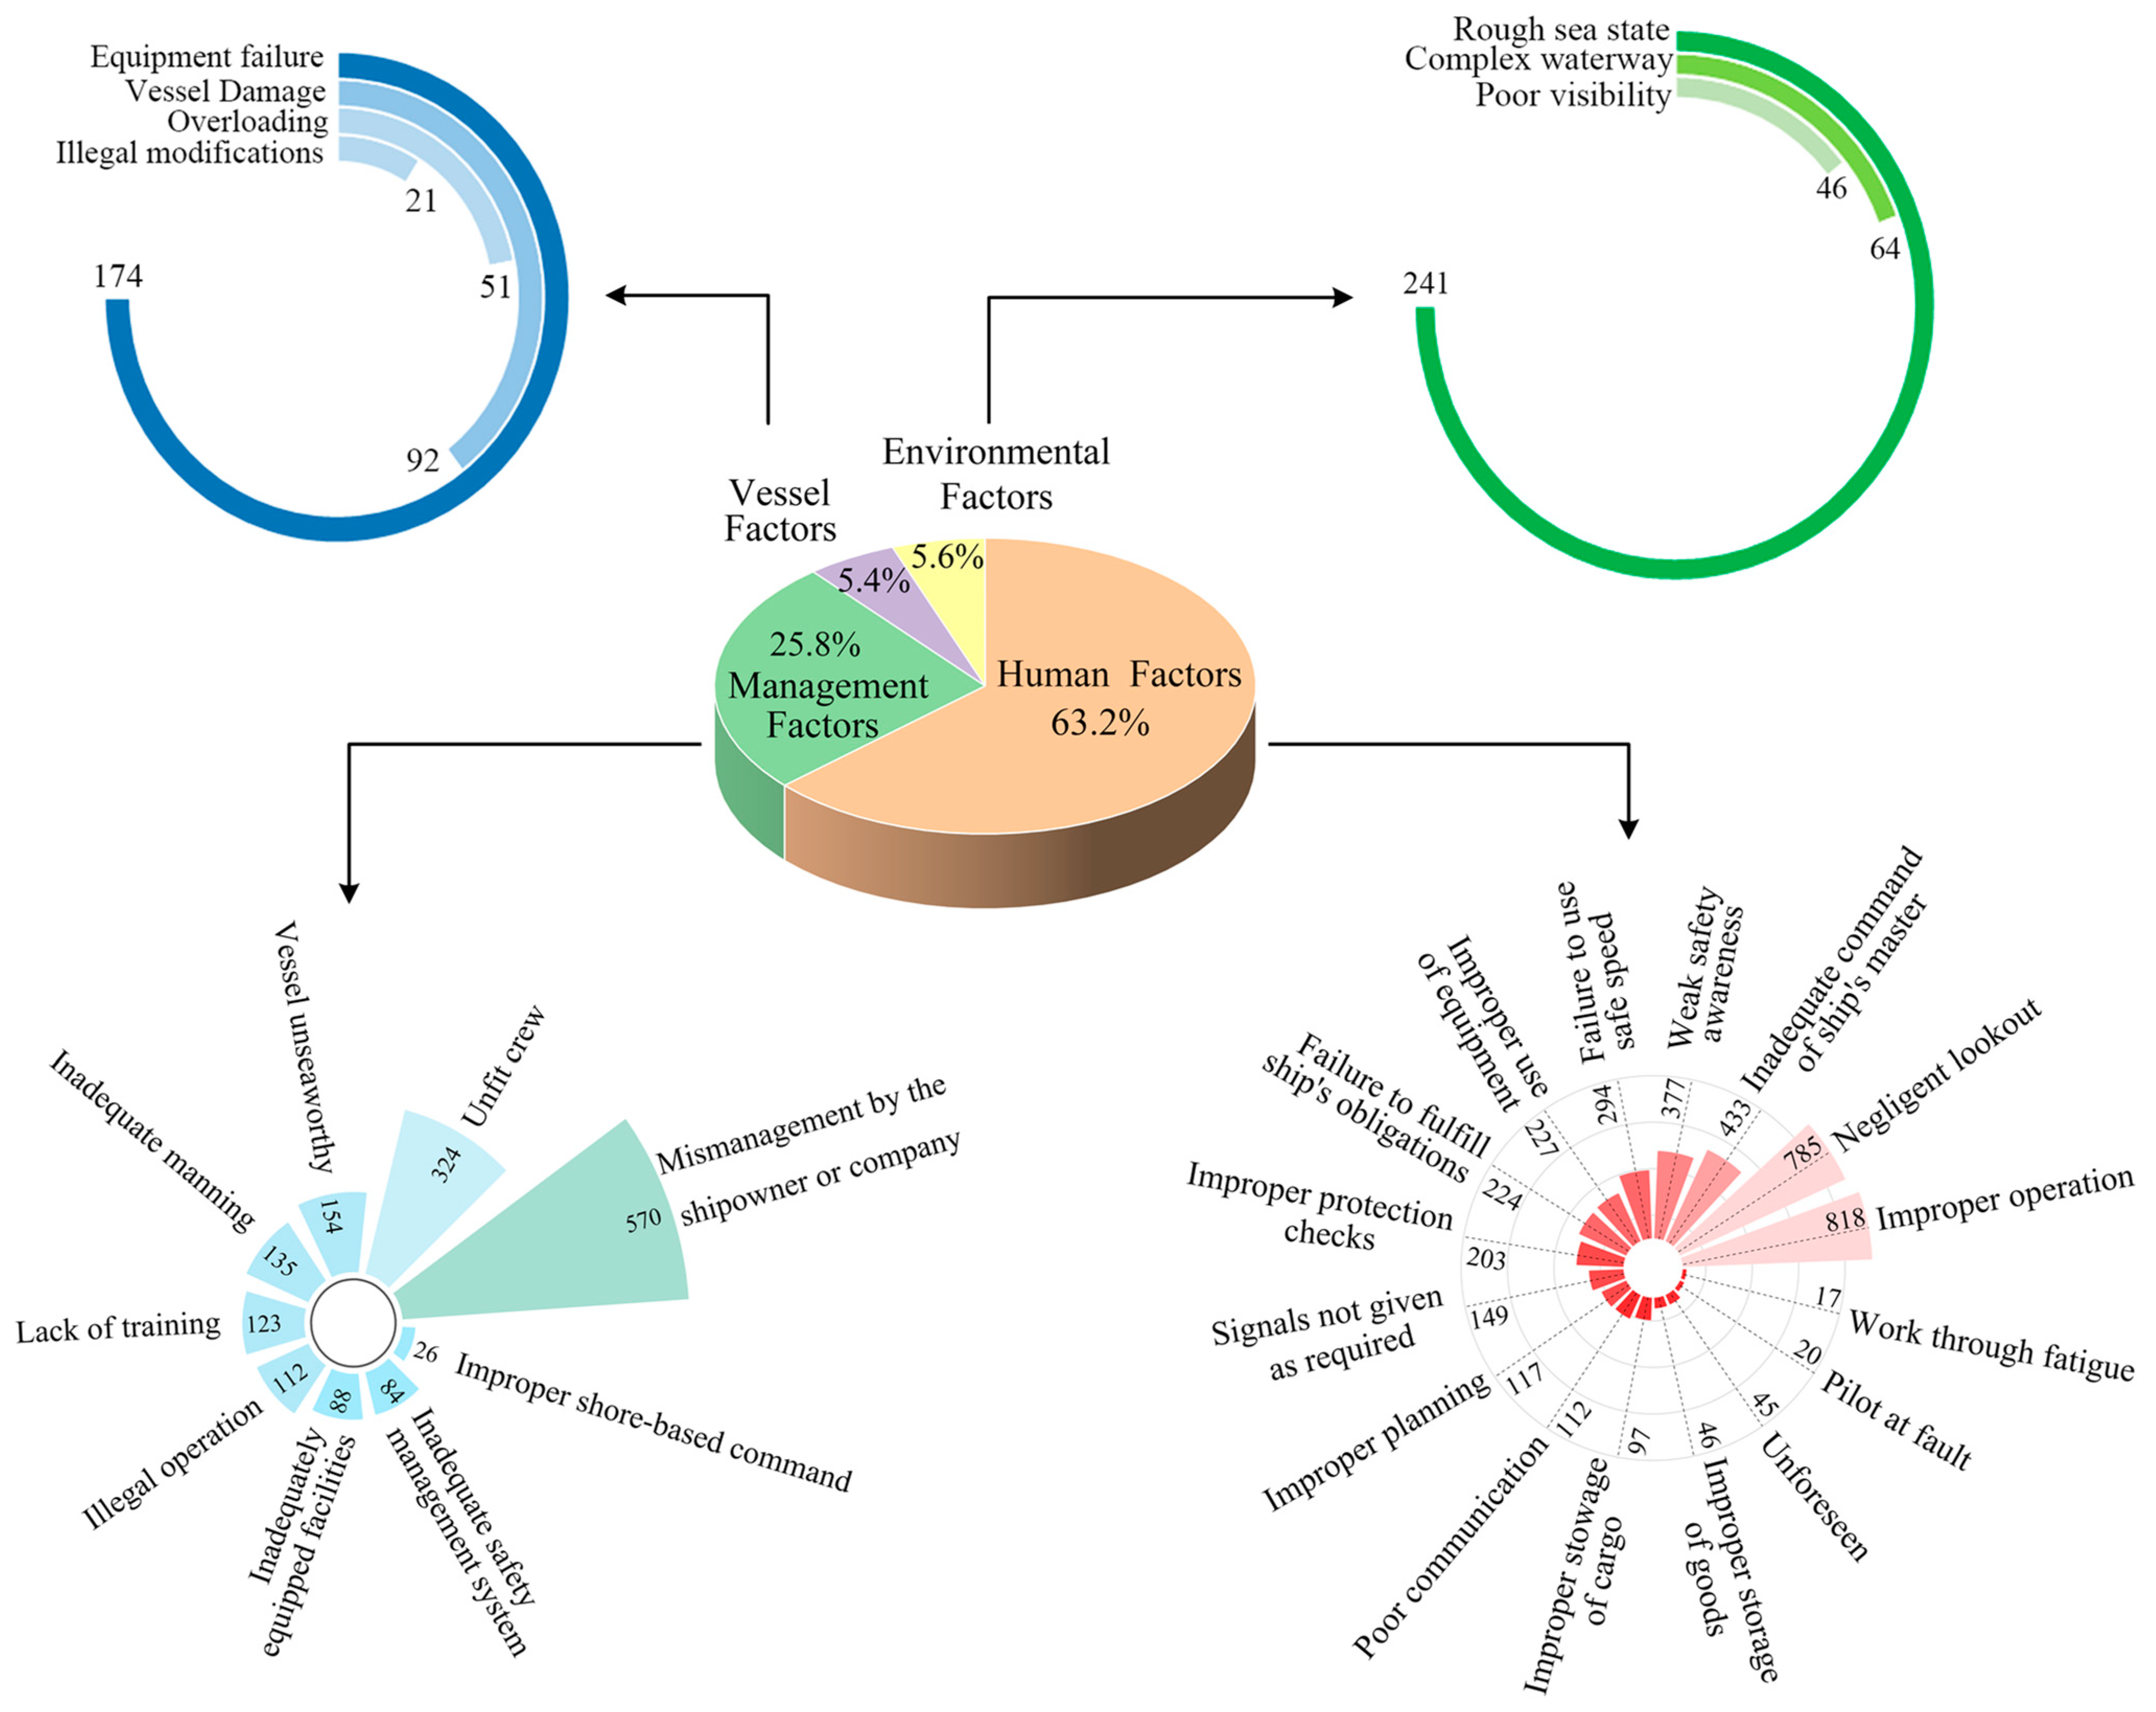
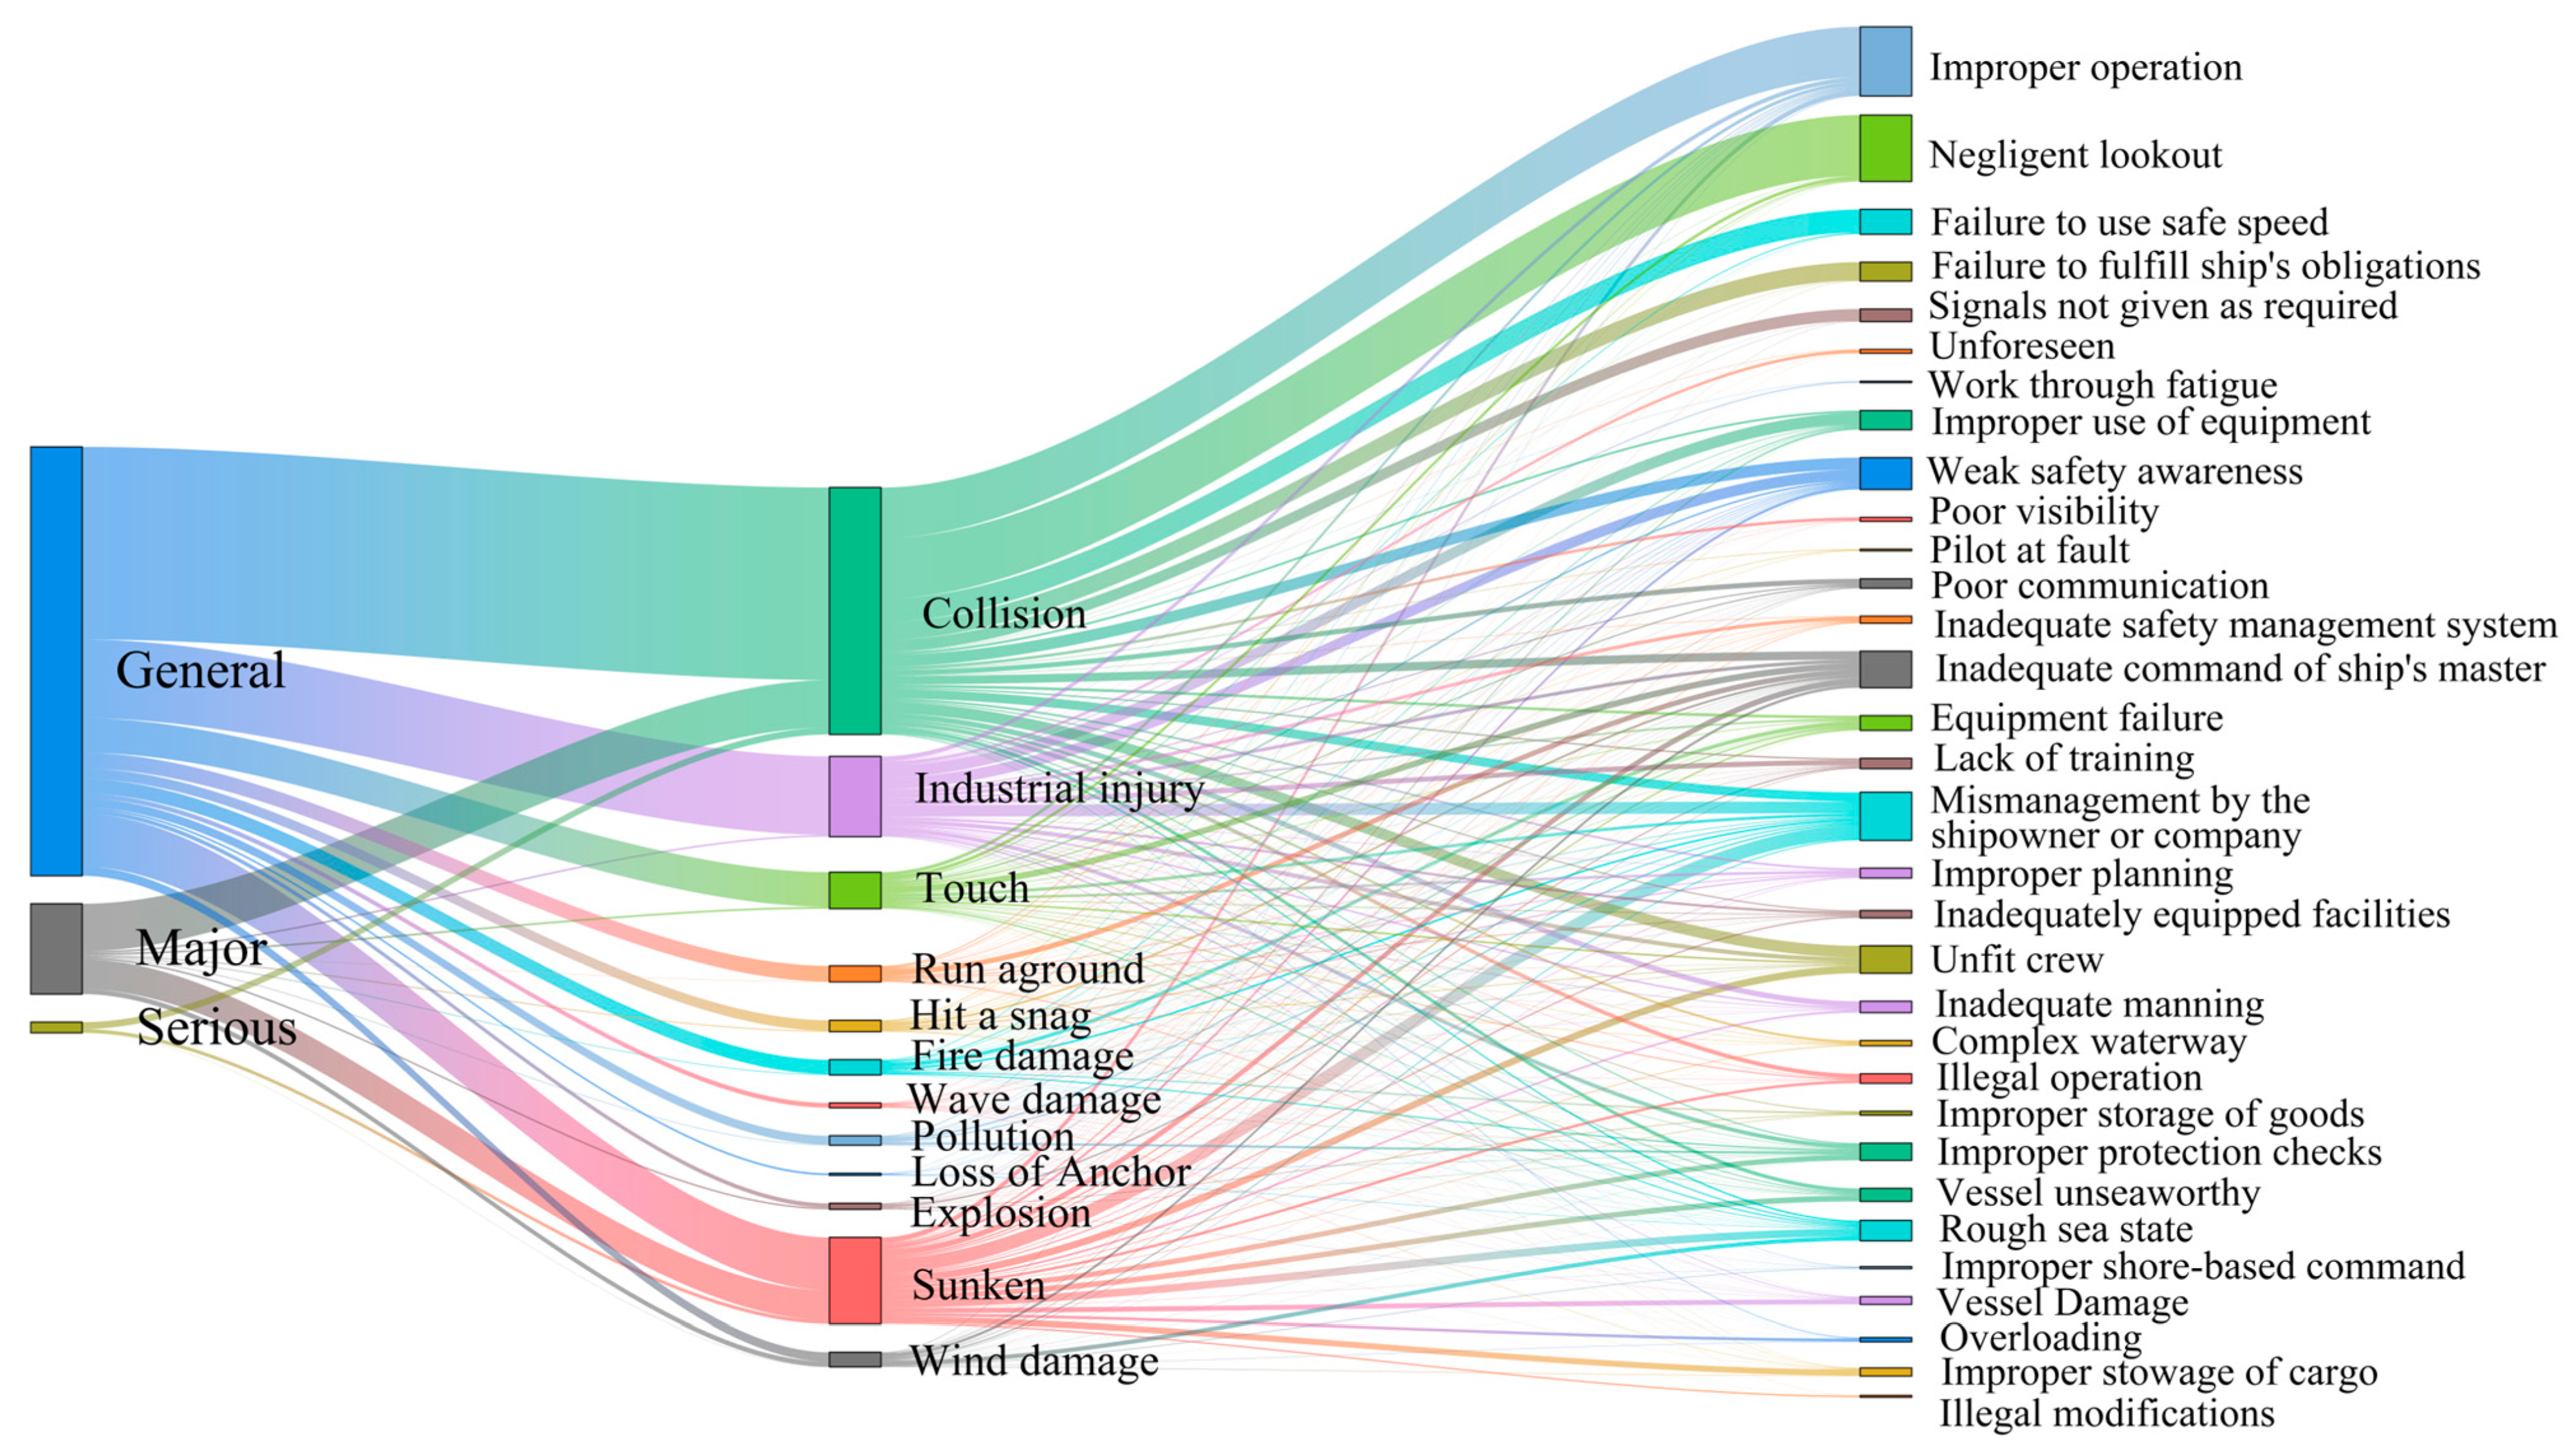
The trained BERT + BiLSTM text classification model was used to classify 6268 accident causes in 1337 reports on marine traffic accidents in China. The classification results are shown in Figure 9, and the specific causes are combined with the accident types and levels, as shown in Figure 10.
Figure 9 illustrates the relative importance of various factors in accident causation, with human factors being the most influential. Further analysis reveals that improper operation, inadequate management, and adverse sea conditions are the primary contributors to accidents. Within the ship factors category, elements such as ship damage, overloading, and illegal modifications exert influence under specific circumstances, although their impact is generally less pronounced than that of equipment failure. Among environmental factors, adverse sea conditions dominate, while complex waterways and poor visibility also contribute to accident occurrence. Although issues such as negligence in lookout, fatigue, poor communication, and improper planning are significant within human factors, their influence is somewhat smaller than that of improper operation. At the management level, the findings underscore the need to strengthen the role of shipowners and enhance training initiatives.
Figure 10 reveals the inherent logical relationship among accident level, accident type, and specific accident cause. The data show that general-level accidents occur most frequently, whereas major and large-scale accidents are less common. Notably, major and large accidents tend to be closely associated with particular accident types and causes, such as sinking incidents.
In general-level accidents, human factors are predominant. Primary causes include improper operation, negligent lookout, and fatigue, suggesting that most such incidents stem from crew operational errors or negligence. Notably, collision accidents are the most frequent, while contact and grounding accidents, although classified as general-level incidents, are relatively rare. Additionally, factors such as poor communication, failure to signal as required, and inadequate safety management systems also contribute to general accidents, albeit to a lesser extent. For large and major accidents, external environmental factors and critical equipment failures are decisive. Equipment malfunctions, poor management, and deficiencies in safety management systems are frequently linked to severe accident types, such as sinking and fire. In these incidents, equipment failures tend to exacerbate the consequences, while management shortcomings amplify the negative impacts. Furthermore, issues such as overloading and illegal modifications significantly contribute to the severity of these accidents.
Overall, the occurrence of various accident levels and types is closely linked to specific causal factors. General-level accidents are predominantly influenced by human factors, whereas major and severe accidents are largely driven by equipment failures, management deficiencies, and adverse environmental conditions. Consequently, addressing these incidents requires a comprehensive approach that considers multiple factors rather than focusing on a single aspect. In light of this insight, the Apriori association rule analysis method is employed in this study to further investigate the correlations among accident causes.

4.4. Apriori Association Results

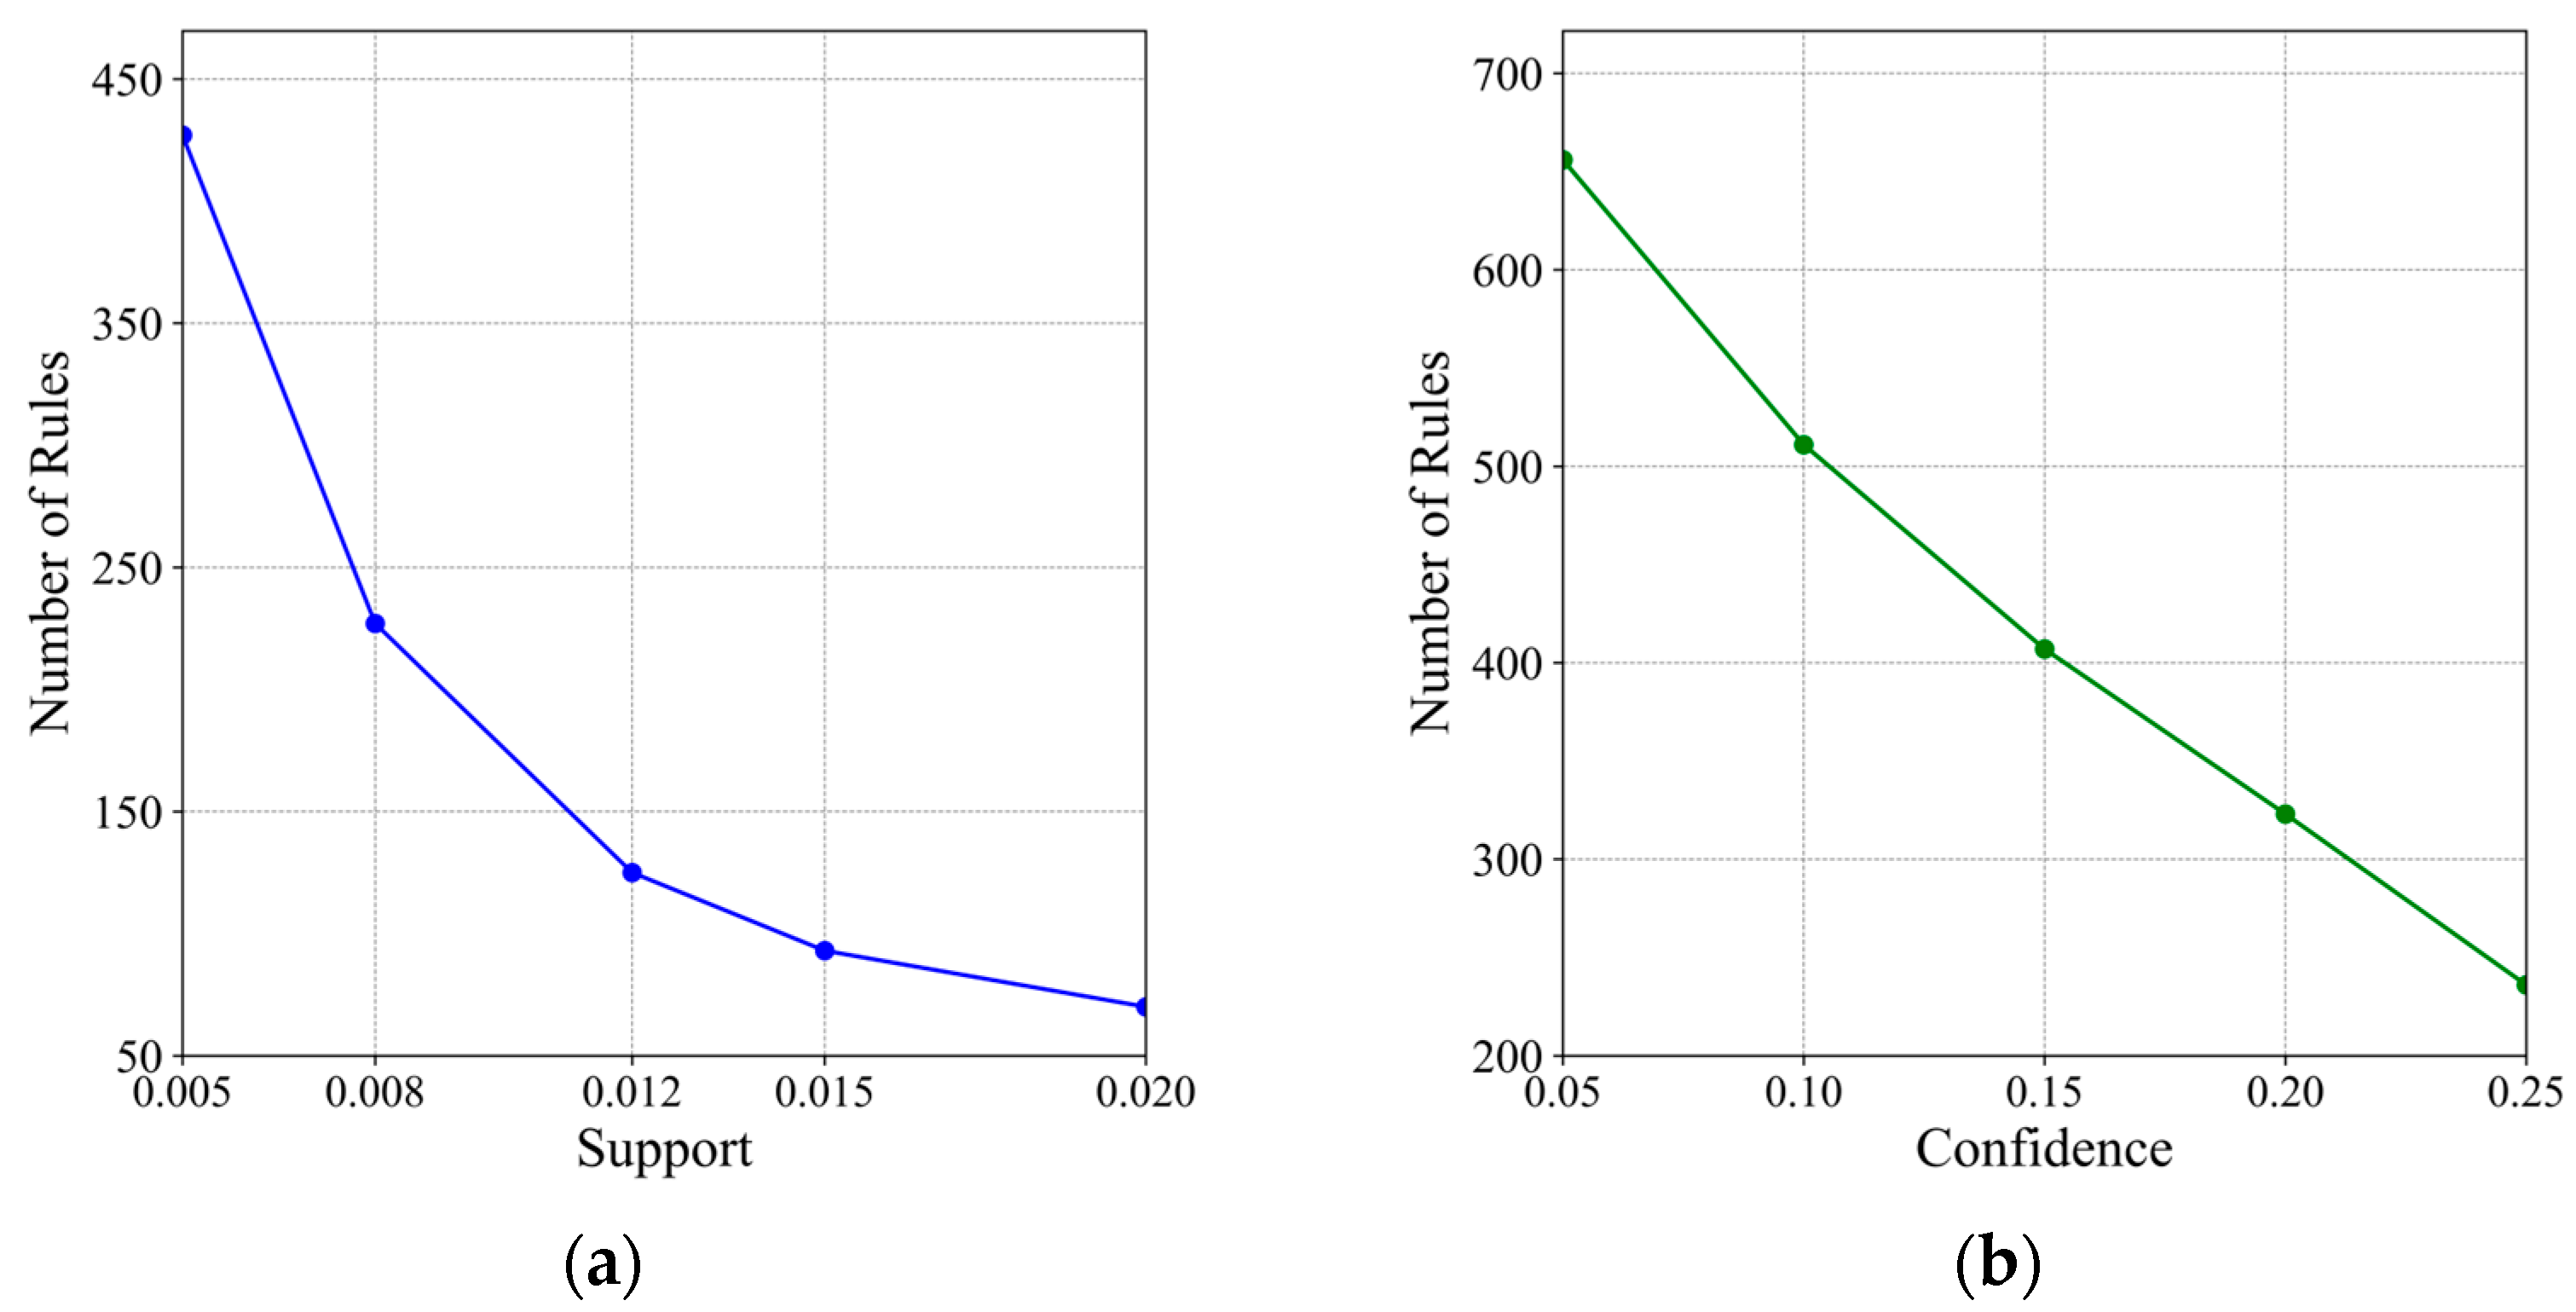
This study employs the output of the BERT + BiLSTM classification model as input for the Apriori algorithm, thereby enhancing the investigation of multi-factor relationships. In the algorithm construction phase (see Figure 11), an increase in the support threshold from 0.005 to 0.02 sharply reduces the number of generated rules—from approximately 450 to about 50—with the rate of reduction beginning to level off at a support value around 0.008. Similarly, as the confidence threshold increases from 0.05 to 0.25, the number of rules decreases from roughly 700 to 180, with a notable inflection occurring at approximately 0.15. Based on these observations and iterative testing, the threshold for accident association rules is set to M i n _ s u p p o r t 0.008 and M i n _ c o n f i d e n c e 0.15 to balance rule quality and coverage. Furthermore, to construct a comprehensive causal chain and capture potential associations, the thresholds for the accident causal chain are established at M i n _ s u p p o r t 0.01 and M i n _ c o n f i d e n c e 0.1 .
As shown in Figure 12, the Apriori algorithm processes accident causes derived from data handled by the BERT + BiLSTM model. Initially, raw data—including serial numbers and classification fields—are input into the system. During preprocessing, classification labels are aggregated by serial number, duplicates are removed, and the labels are transformed into a Boolean matrix. Subsequently, the Apriori algorithm identifies high-frequency item sets and generates association rules, eliminating redundant subsets before outputting the final rules.
By analyzing ship accident data, critical factors and their relationships were identified and then compared, analyzed, and summarized based on single-factor and multi-factor criteria:
(1)
The most widespread causes
The high support in Table 4 shows that these factors are pivotal in accident occurrence and represent key areas for improvement. Moreover, a higher node centrality implies more associations with other accident causes, suggesting that such factors may significantly influence multiple aspects of accident causation.
(2)
Sorting of strong association rules
The high-confidence rules indicate that under specific preconditions, the likelihood of a particular outcome is significantly elevated. As demonstrated by the rules in Table 5 and Table 6 —sorted by confidence—it becomes imperative to enhance training programs and upgrade equipment to improve operational standardization and personnel safety awareness. Simultaneously, the development of a multi-factor risk assessment system is crucial. Regular safety assessments should be implemented, particularly focusing on critical combinations, such as “Failure to use a safe speed”, “Inadequate manning” and “Negligent lookout”. For risks arising from the interplay of multiple factors, a systematic prevention strategy must be formulated, and potential hazards should be continuously monitored and addressed in real time through a dedicated early warning system.
The high-impact improvement rule demonstrates that both individual factors and their combinations substantially elevate risk, warranting prioritized management interventions. This is reflected in Table 7 and Table 8. For example, “Work through fatigue” increases the risk of “Improper use of equipment”, suggesting that crew work schedules should be planned to mitigate fatigue. Similarly, “Illegal modifications” lead to “Vessel unseaworthiness”, indicating the need for enhanced supervision of modification practices and strict seaworthiness inspections. Furthermore, the combination of “Inadequate command of the ship’s master” and “Improper operation” elevates the risk of “Pilot at fault”, underscoring the importance of comprehensive management, improved training, and rigorous supervision. Additionally, the joint occurrence of “Vessel unseaworthy” and “Improper operation” heightens the risks of “Signals not given as required” and “Unfit crew”, necessitating systematic preventive measures to ensure both vessel integrity and crew qualifications.
Based on confidence levels and degrees of enhancement, both single-factor and multi-factor scenarios are ranked, offering a comprehensive illustration of the diverse factors influencing accidents.

5. Discussion

5.1. Model Comparison

This paper compares the loss function, accuracy, and confusion matrix among three models: BERT alone, BERT with a pooling mechanism, and BERT + BiLSTM.
In this study (Table 9), all three models are configured with the same learning rate (1 × 10⁻⁶), batch size (32), and AdamW optimizer; however, there are targeted differences in their network architectures and regularization strategies. Specifically, both BERT and BERT + Pooling Mechanism directly utilize BERT’s 512-dimensional hidden layer, whereas BERT + BiLSTM incorporates an additional 128-unit BiLSTM layer to capture sequential information more effectively. Furthermore, the models differ in their dropout settings, L1 and L2 regularization coefficients, and gradient constraints. Regarding activation functions, BERT employs GELU, while the other models use Mish to enhance their nonlinear expression capabilities.
Overall, the fine-tuning of these hyperparameters is designed to balance model stability with the capacity to capture complex textual sequence information, thereby optimizing classification performance.
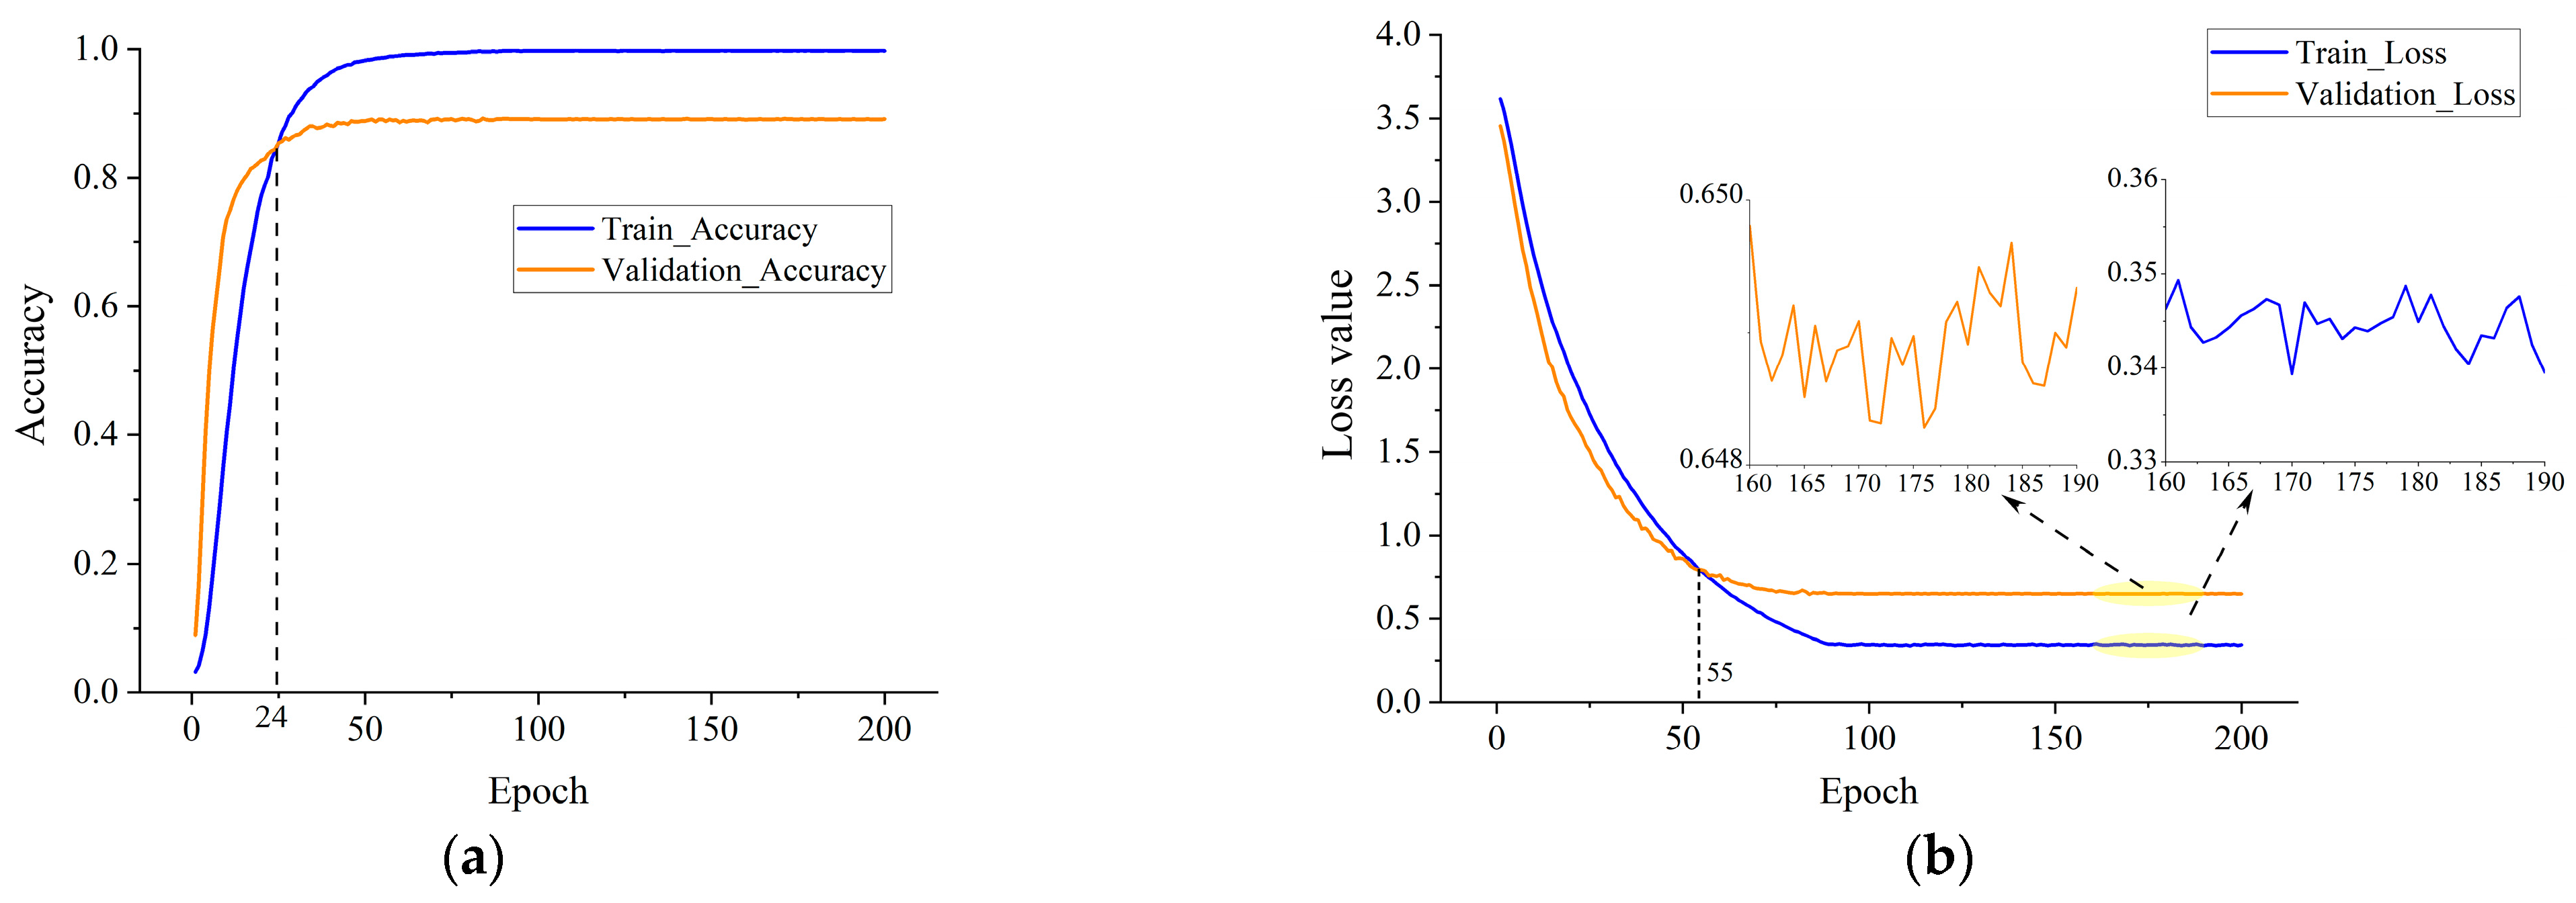
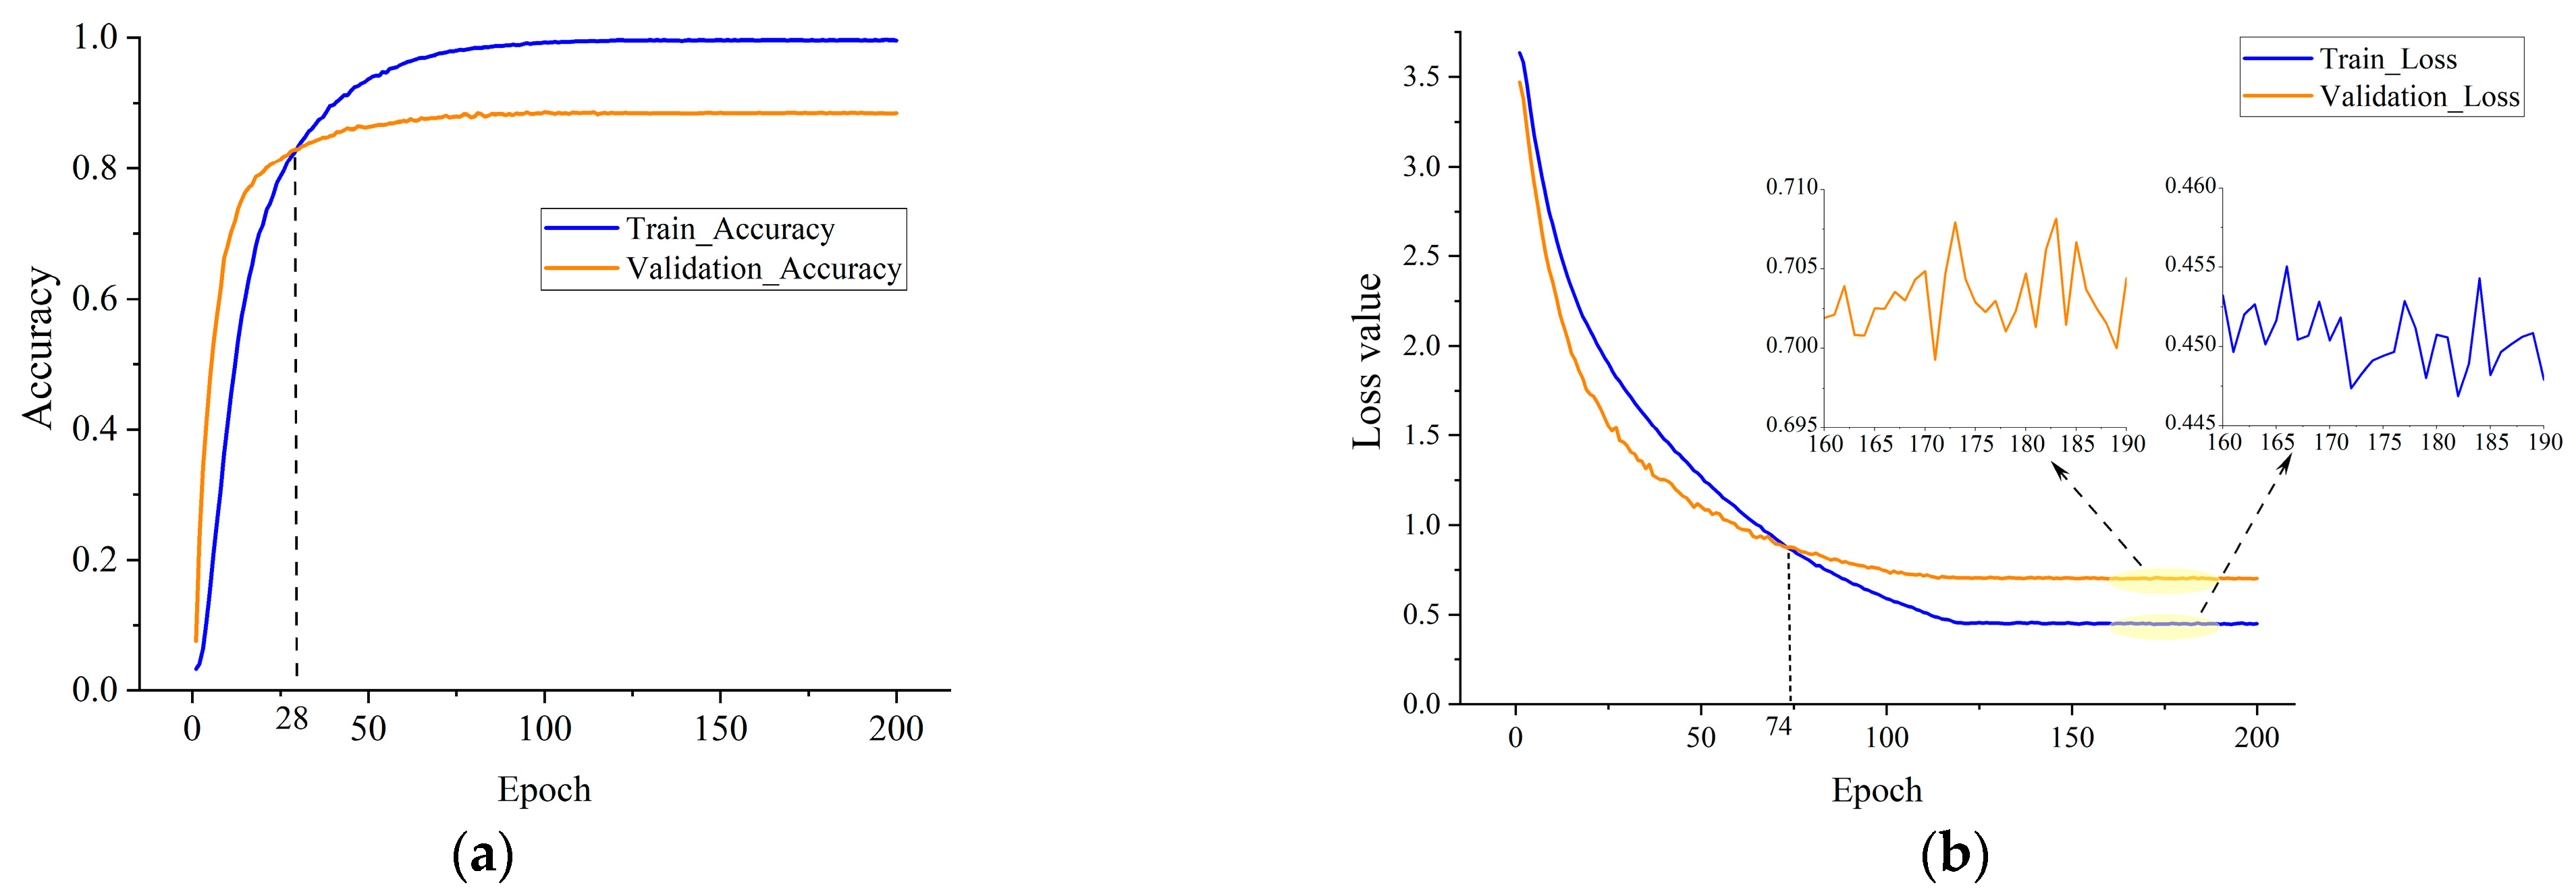
In the three sets of graphs (Figure 7, Figure 13 and Figure 14), the BERT + BiLSTM model demonstrates rapid convergence, achieving high training and validation accuracy within approximately 20 epochs and maintaining stable performance thereafter. Its loss curve remains consistent, indicating robust generalization. By contrast, while the BERT model shows early improvements, its validation loss begins to fluctuate markedly after around 50 epochs, suggesting reduced stability. The BERT + Pooling Mechanism model exhibits similar performance in terms of accuracy compared to the other two models; however, its loss function converges at a slower rate and demonstrates greater fluctuation in the later stages of training. Overall, the BERT + BiLSTM model exhibits clear advantages in both convergence speed and final accuracy.
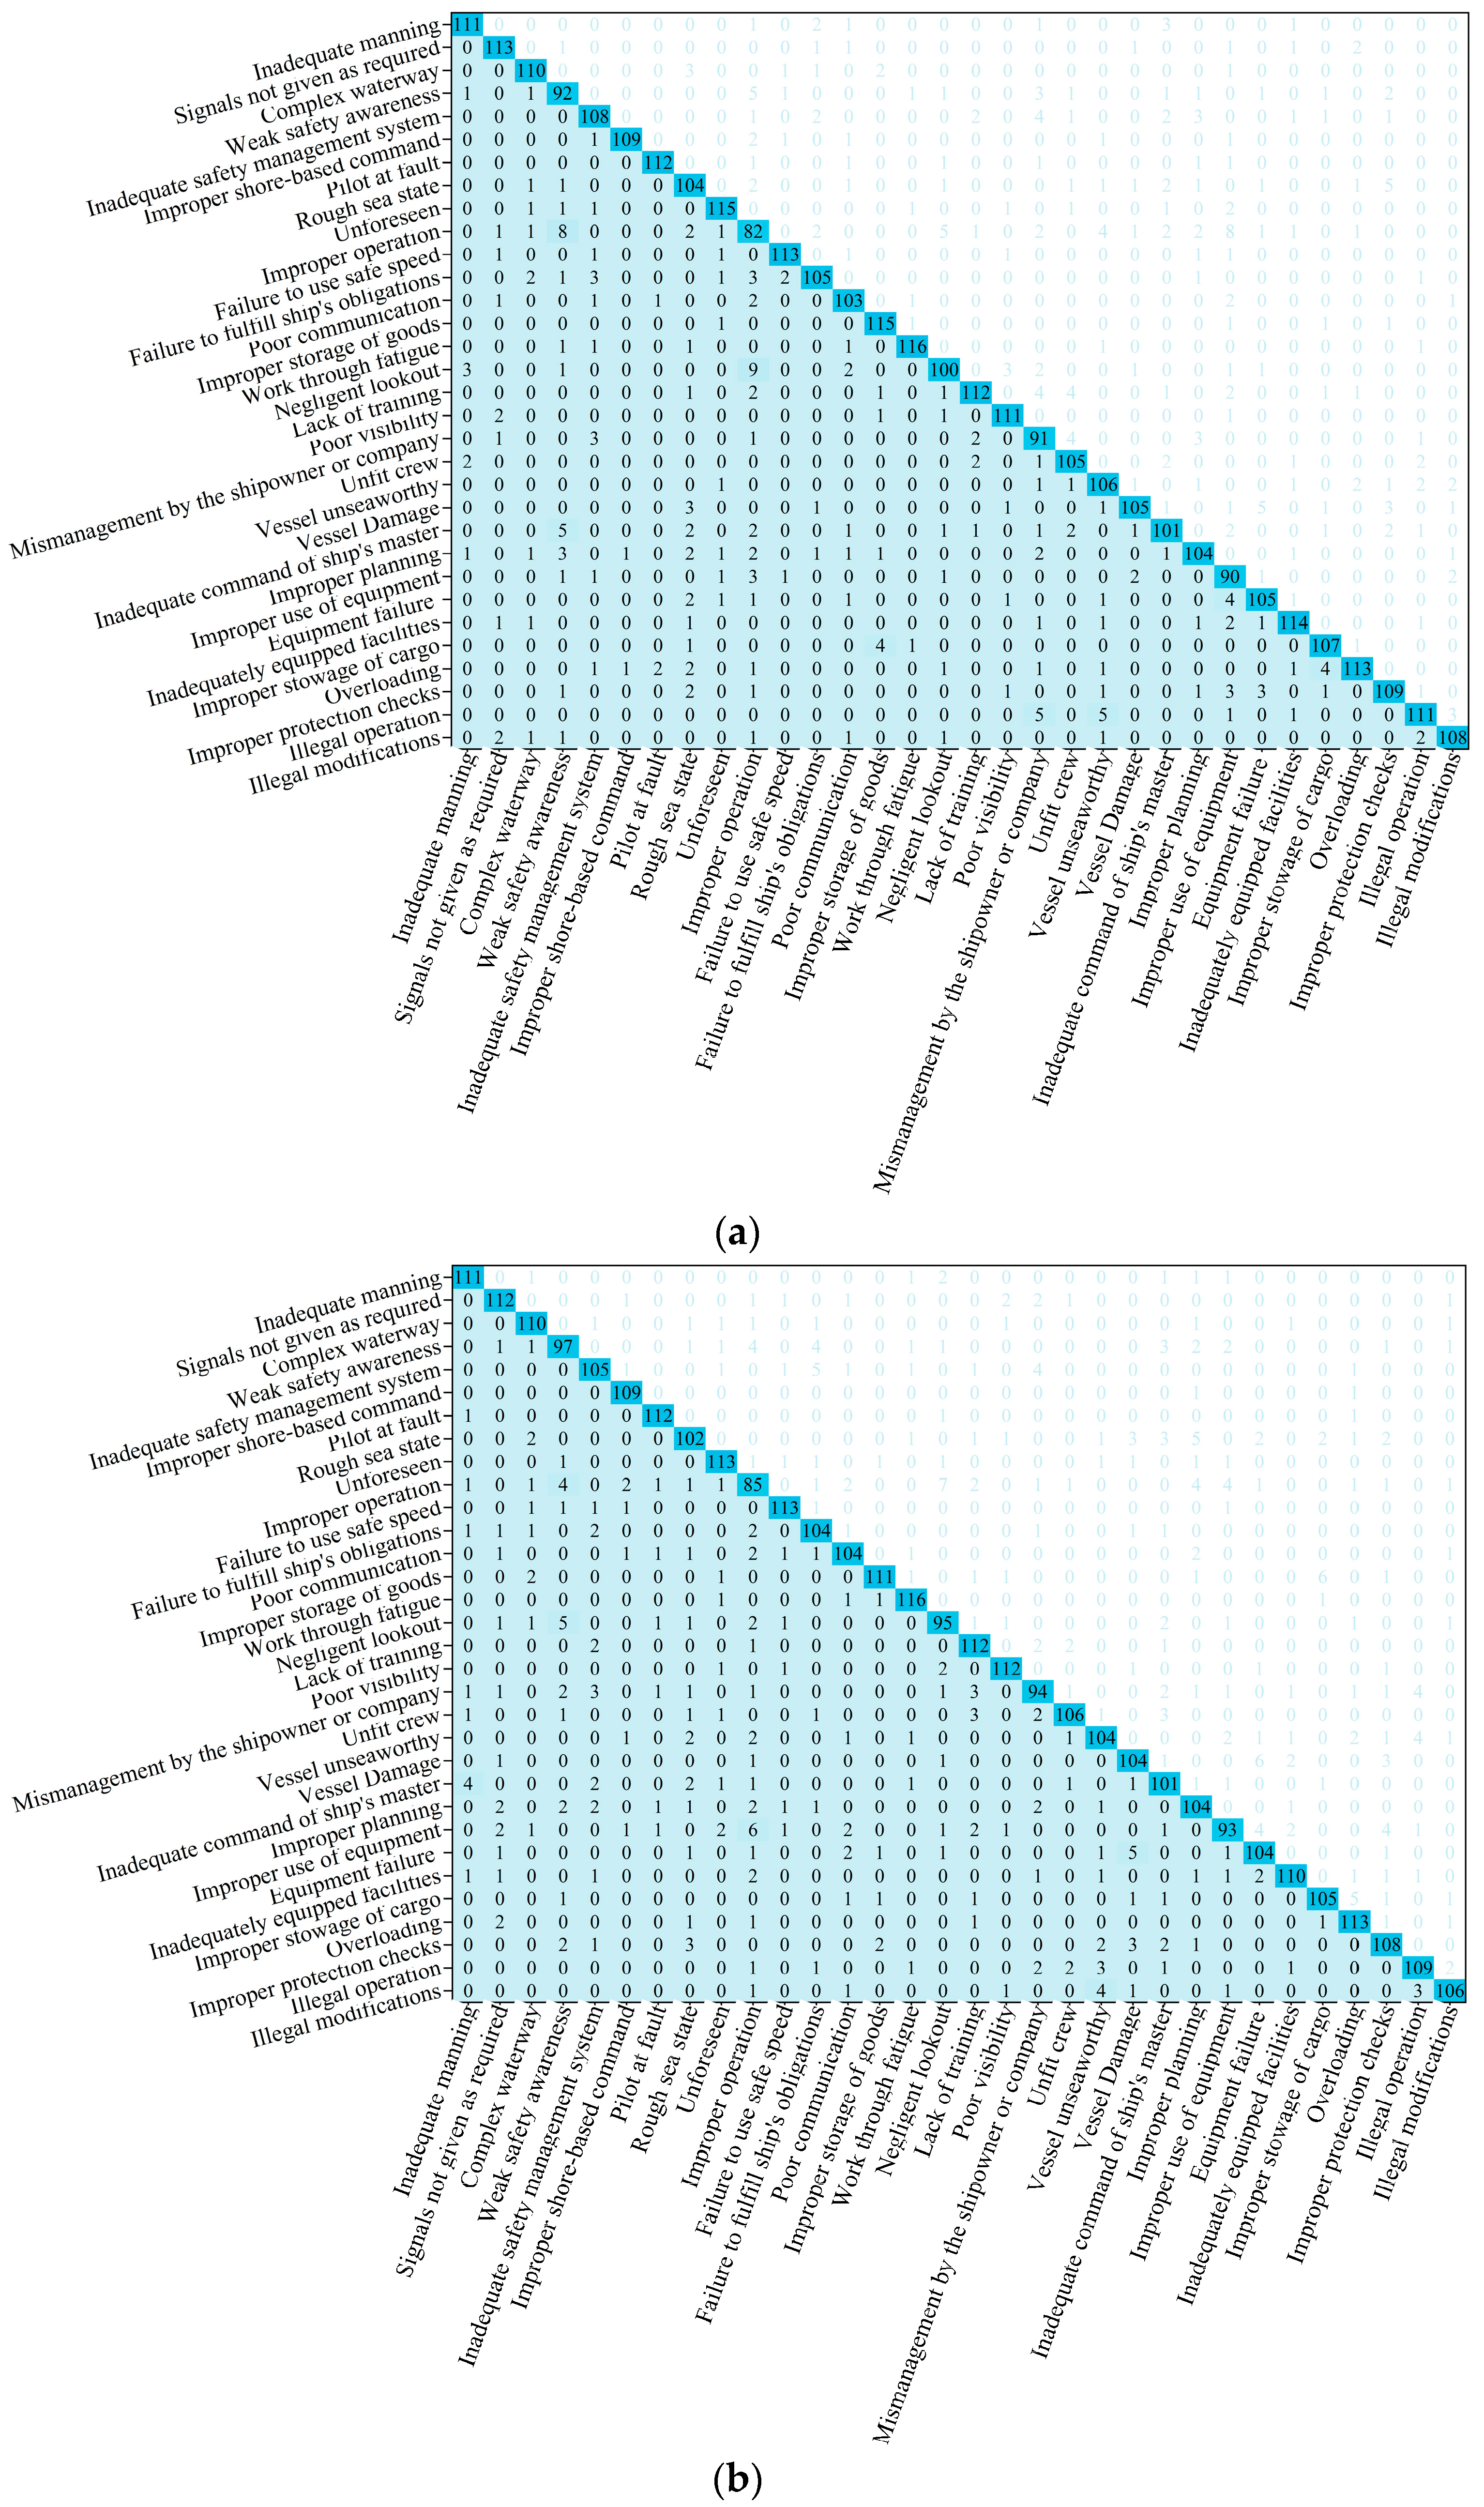
An examination of the three confusion matrices reveals that the BERT + BiLSTM model (Figure 8) consistently achieves higher diagonal values across most categories, reflecting superior classification accuracy. In contrast, the confusion matrix for the BERT model (Figure 15a) displays a more dispersed diagonal, with a higher rate of misclassifications in certain categories, which suggests limited discriminative power among similar classes. The BERT + Pooling Mechanism model (Figure 15b) demonstrates relatively high accuracy along the diagonal; however, it still exhibits some confusion in specific categories compared to the BERT + BiLSTM model. Overall, the BERT + BiLSTM model outperforms the other models in both classification accuracy and stability. While the BERT + Pooling Mechanism model does enhance the performance of the original BERT model to some extent, it remains slightly inferior to the approach incorporating bidirectional LSTM.
Table 10 presents the evaluation of the model’s accident cause classification performance using precision, recall, and F1-score. Here, precision reflects the frequency with which the model correctly predicts a specific category, while recall indicates the proportion of correctly identified samples within that category relative to all actual samples. The F1-score, serving as the harmonic mean of precision and recall, offers a balanced measure of accuracy and coverage. Statistically, the BERT + BiLSTM model achieves high F1 scores across most accident cause categories. It performs particularly well in critical categories, such as “Signals not given as required”, “Pilot at fault”, and “Work through fatigue”, demonstrating its robustness in handling complex text sequences and multi-class classification tasks. In contrast, the standalone BERT model shows significant fluctuations in certain categories (e.g., “Improper operation”), and while the BERT + Pooling Mechanism model improves classification performance relative to BERT, it remains slightly inferior to the BERT + BiLSTM approach.
Overall, in terms of overall accuracy, macro-average, and weighted-average metrics, the BERT + BiLSTM model leads with an overall performance of approximately 0.898, underscoring its clear advantages in capturing textual sequence information and managing multi-class classification challenges.

5.2. Apriori Algorithm Analysis

5.2.1. Complex Network Analysis

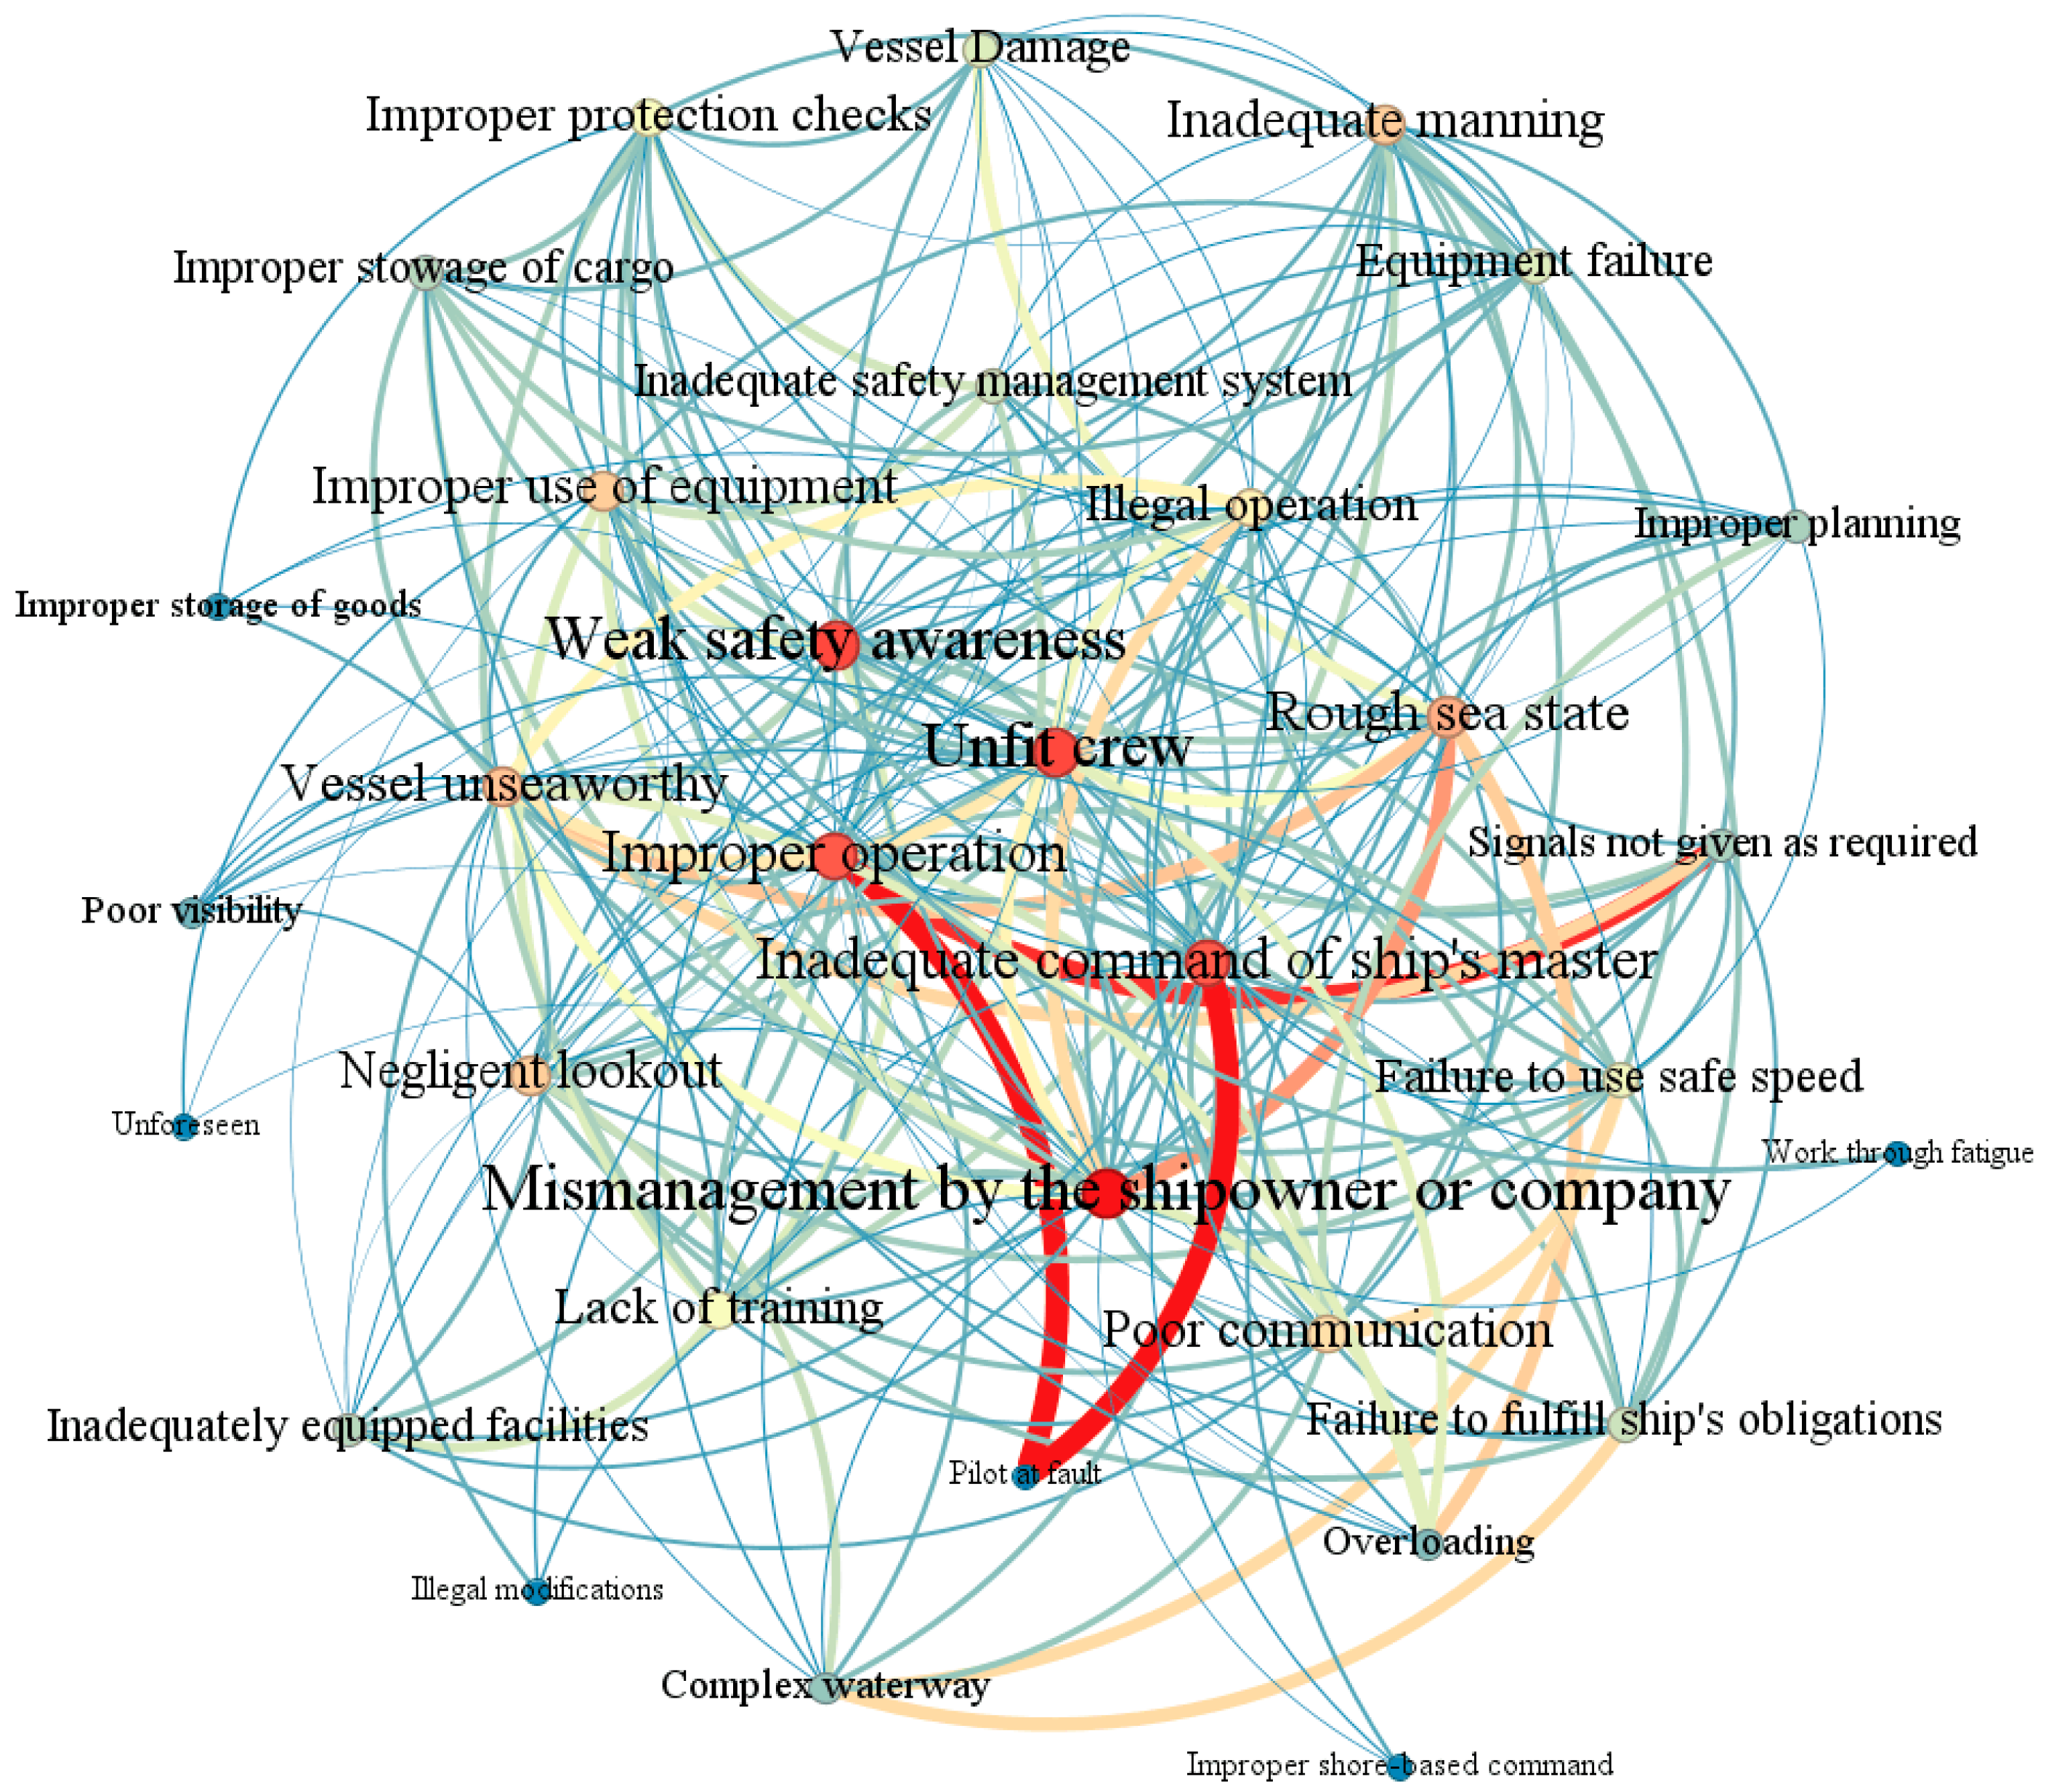
Figure 16, based on edge importance from the Apriori association rule analysis, illustrates a complex network of maritime accident causes. As depicted in the figure, the factors are not independent but are intricately interconnected, forming a highly integrated and complex system. Insufficient investment in safety measures, personnel training, and the development of a robust safety culture can lead to issues, such as “Insufficient manning”, “Inadequately equipped facilities”, and “Vessel unseaworthiness”. Regarding human and behavioral factors, a crew that lacks sufficient professional skills or training—or operates under high-pressure conditions—is more prone to operational errors, such as “Negligent lookout” and “Poor communication”. These errors not only directly elevate navigational risks but also interact synergistically with hardware malfunctions, adverse weather conditions and other contributing factors, thereby exacerbating accident severity. When deficiencies exist at both the management and human levels, adverse external conditions can transform minor failures into catastrophic incidents. Moreover, “Weak safety awareness” functions as a fundamental underlying driver, contributing to both managerial oversights and crew-related errors while further amplifying the negative impact of other risk factors due to inadequate risk assessment and insufficient safety investment.
Multiple data underscore the consequences of insufficient training and inadequate qualifications among personnel. Consequently, enterprises and regulatory bodies must enhance crew training and evaluation procedures while simultaneously elevating the professional competence and safety awareness of captains and other key personnel. Strengthening safety education and refining incentive and accountability mechanisms can embed safety consciousness as a core value throughout the organization—from top management to frontline crew. Additionally, it is imperative to ensure the timely maintenance and updating of ship equipment, thereby optimizing the allocation of crew resources and vessel facilities. The adoption of intelligent and digital technologies to monitor sea conditions, weather, and ship status will facilitate the early detection and mitigation of potential risks. Finally, regulators, insurance companies, industry associations, and other third-party entities should assume a more proactive role in auditing, assessment, and supervision processes.

5.2.2. Accident Causation Chain

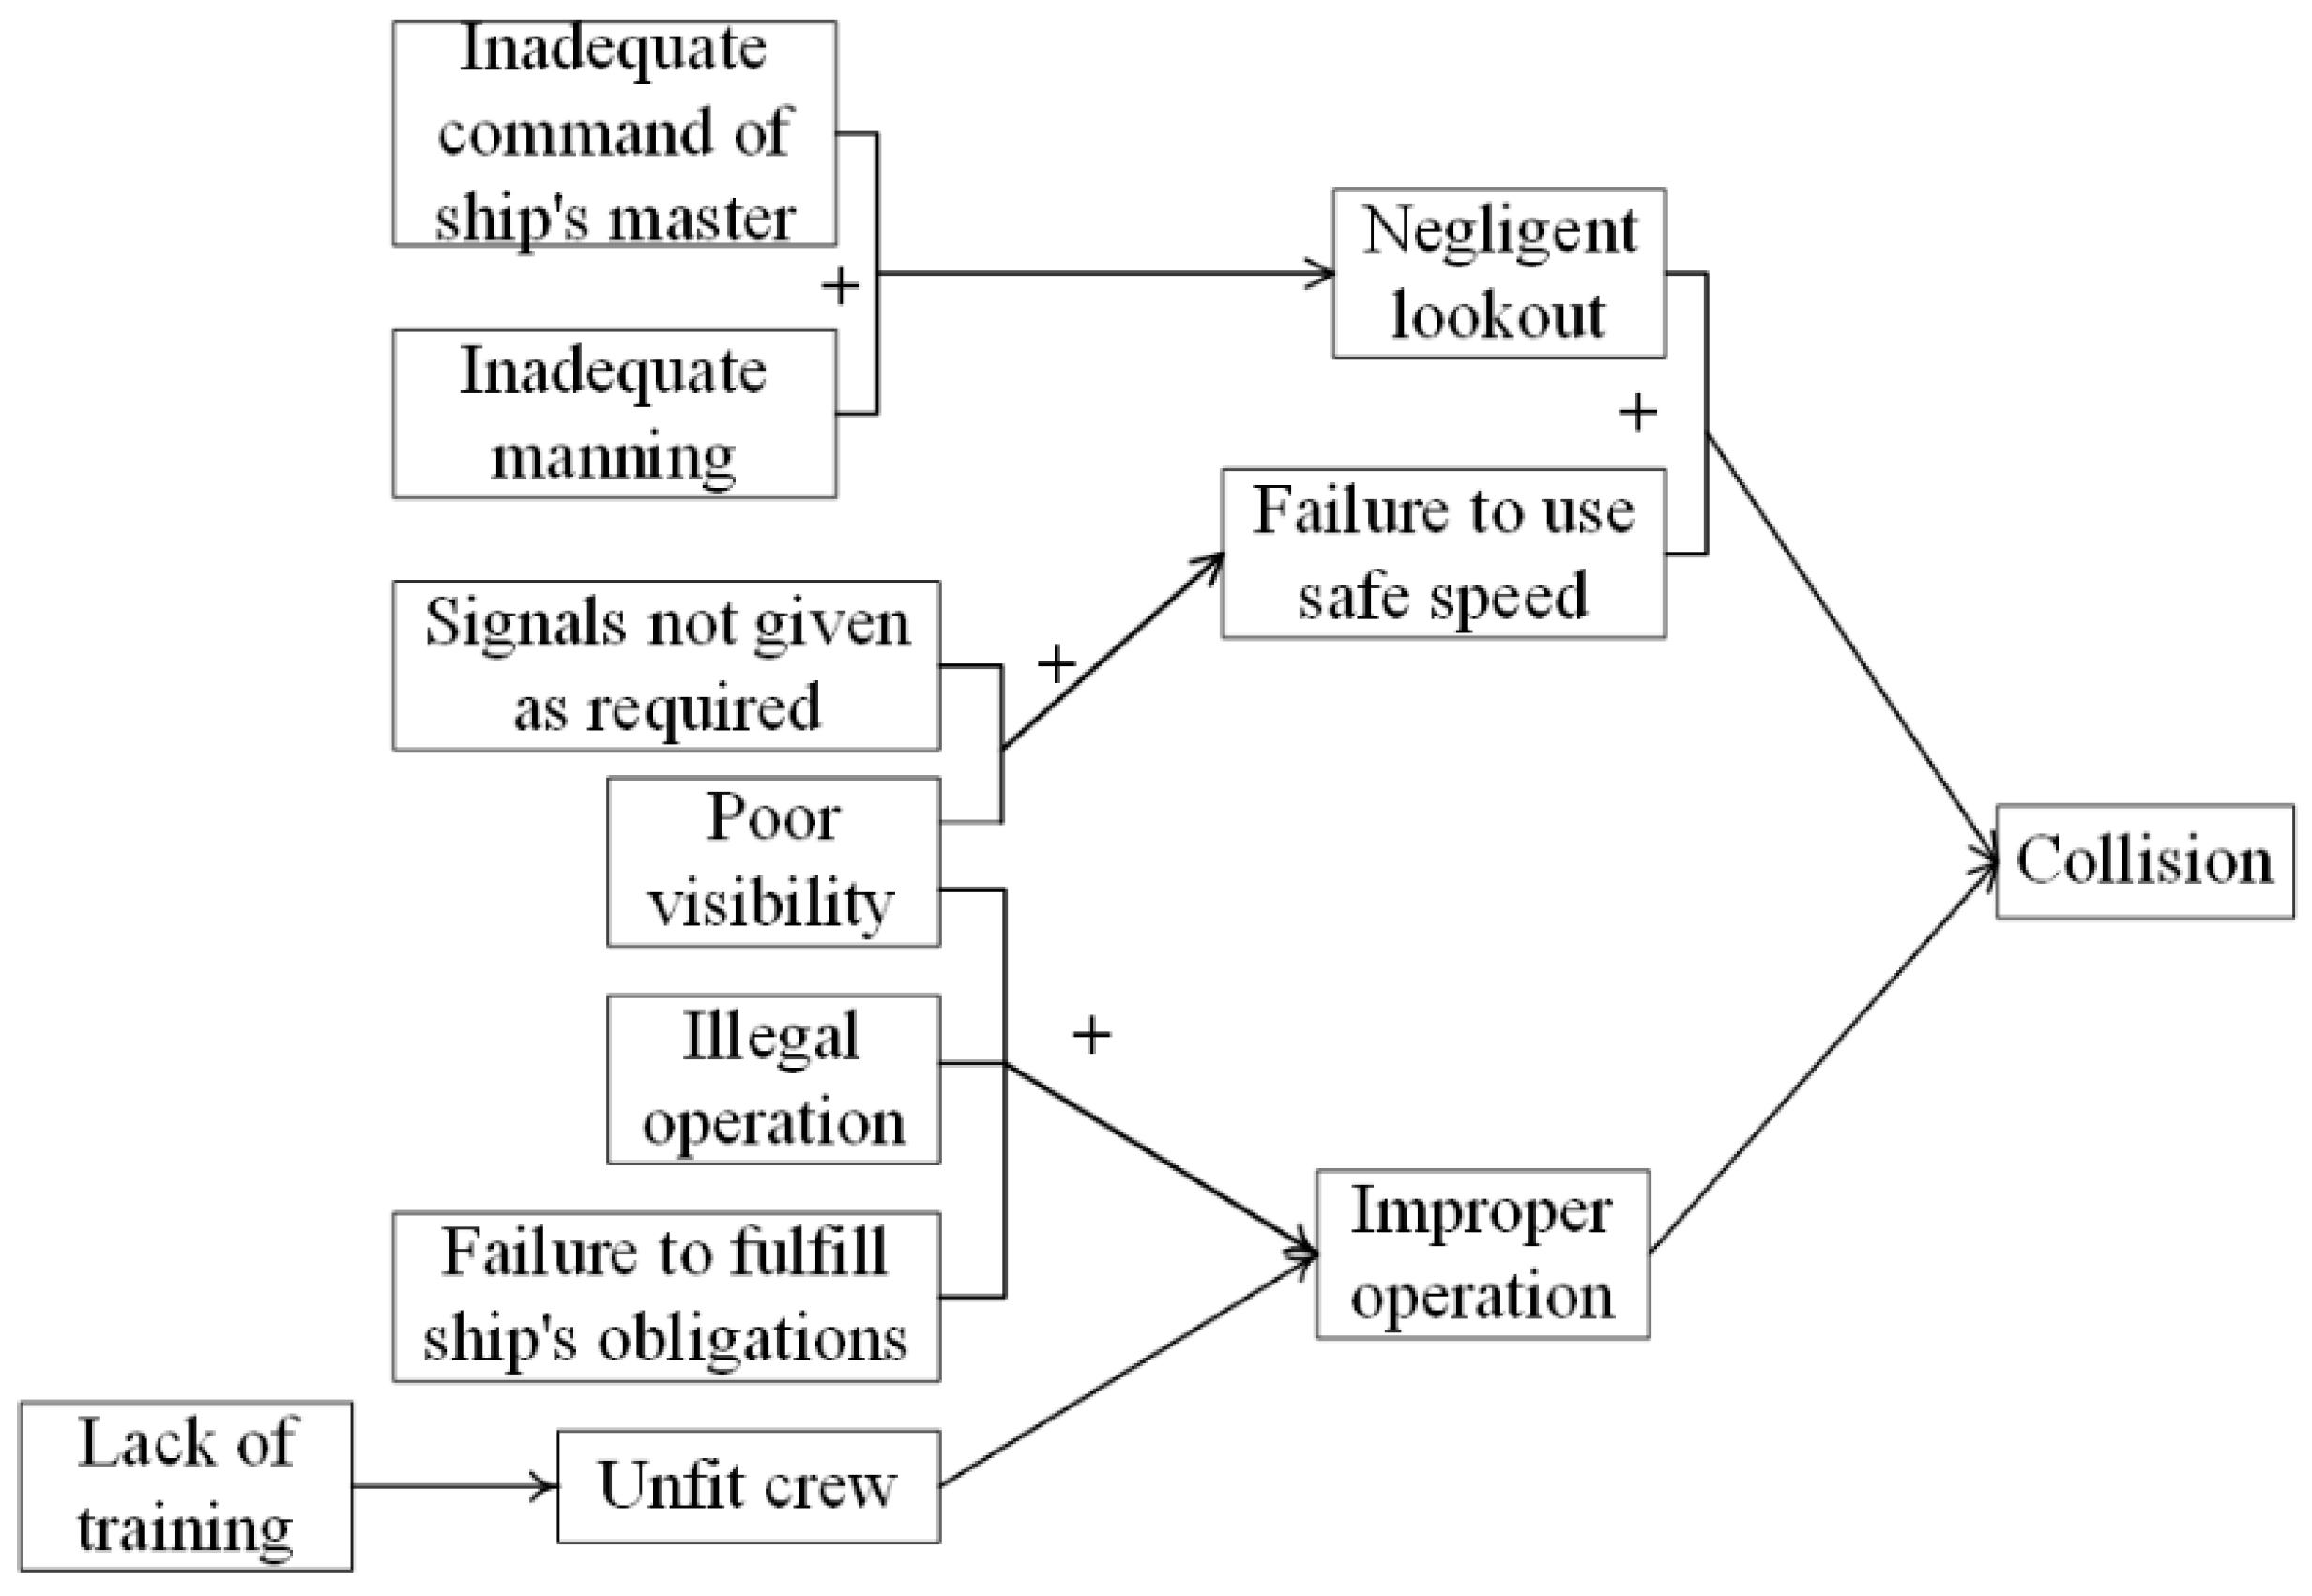
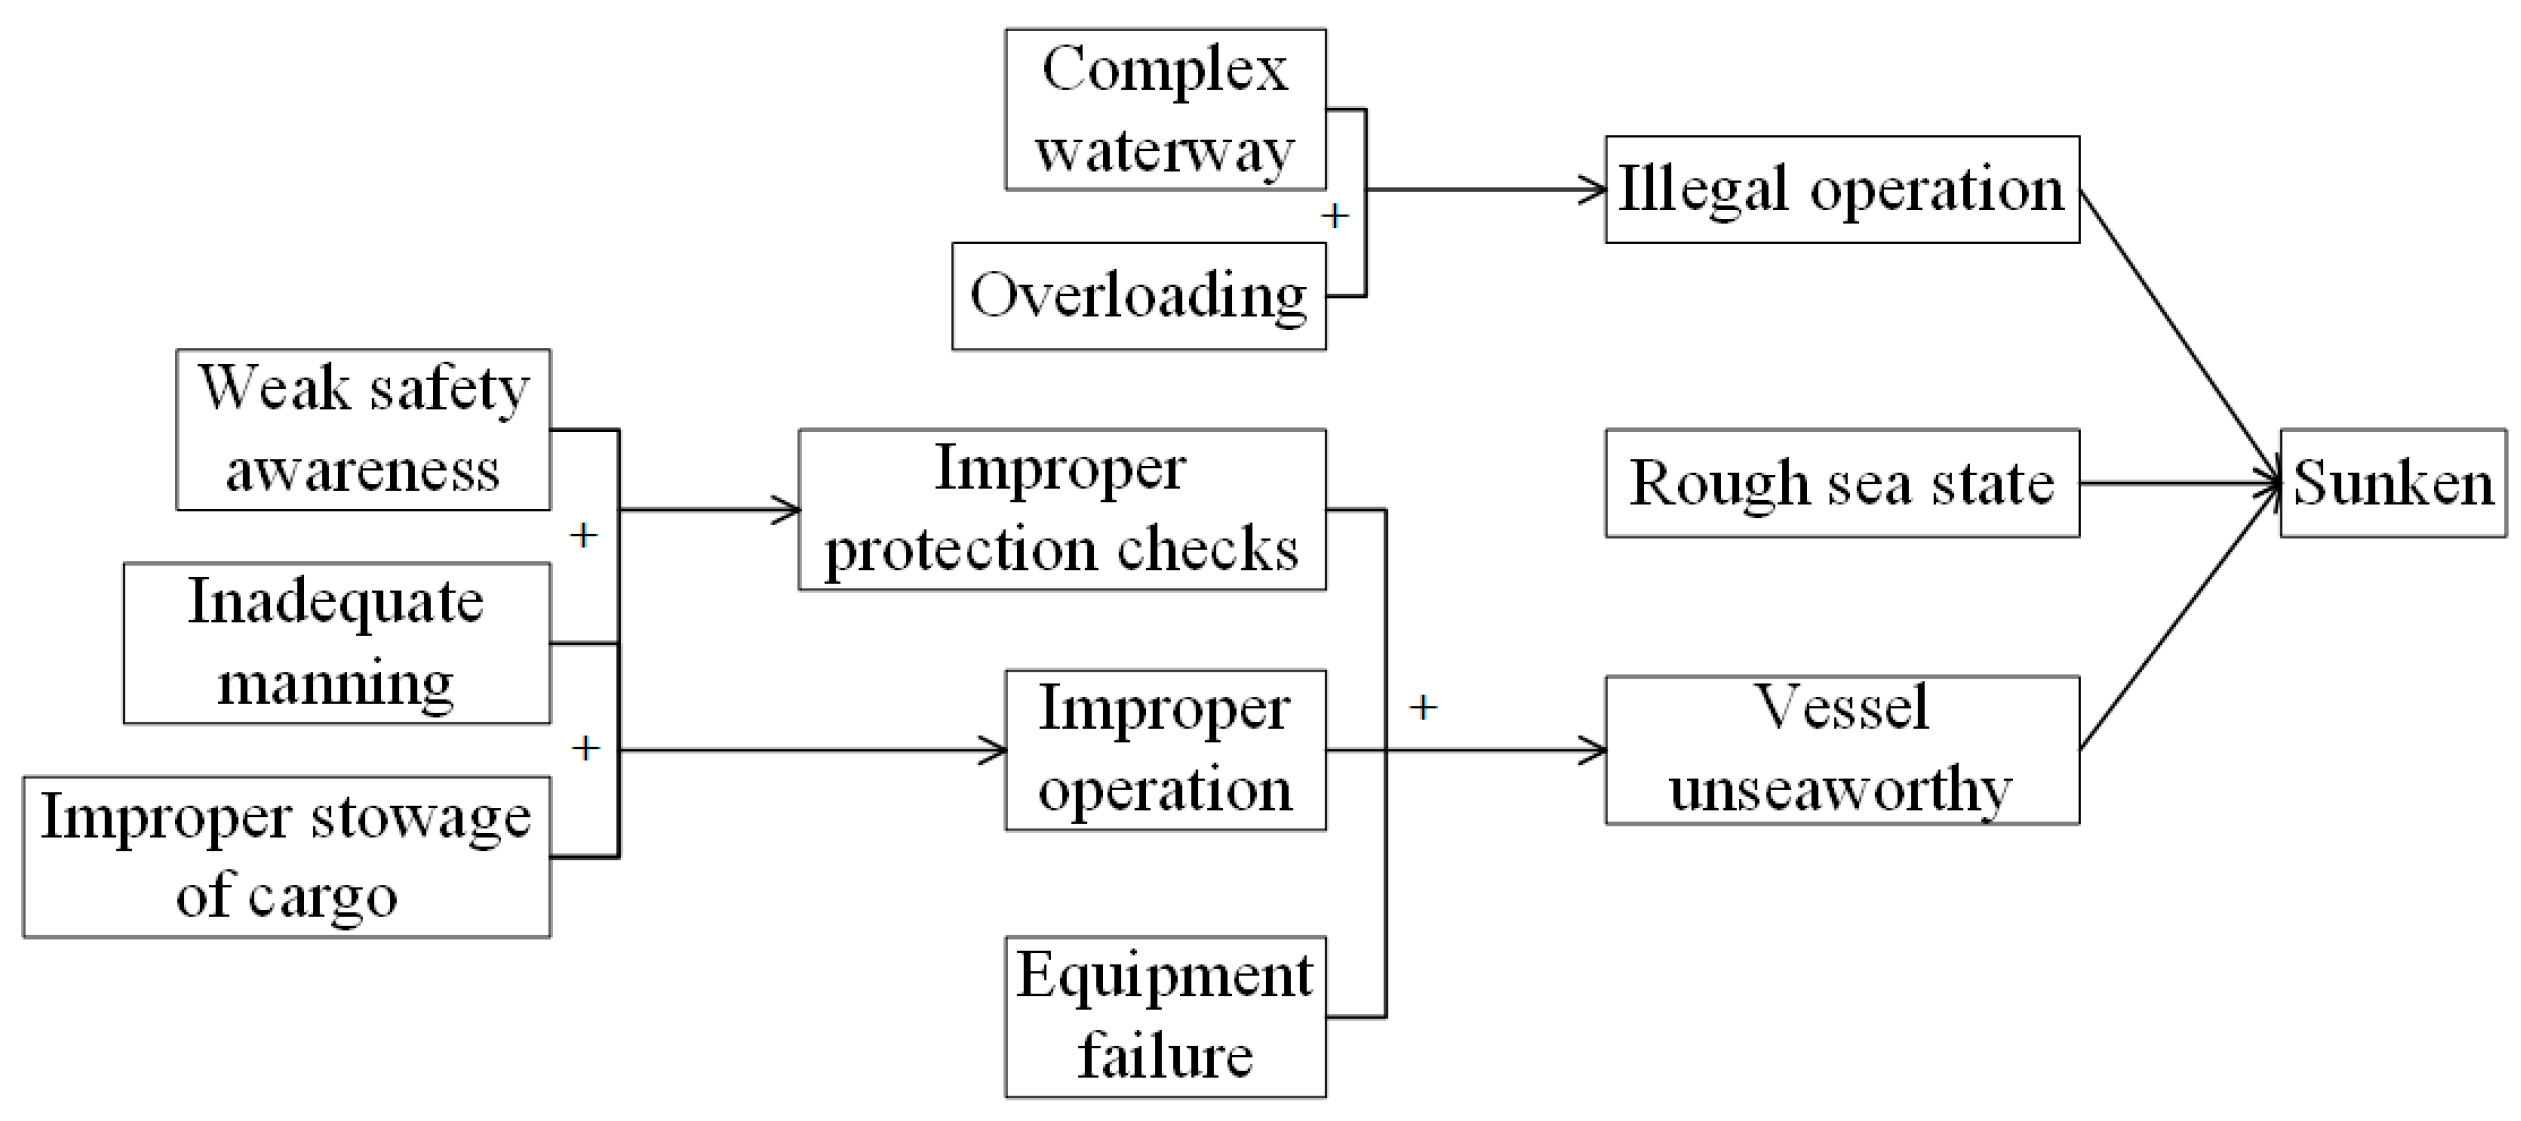
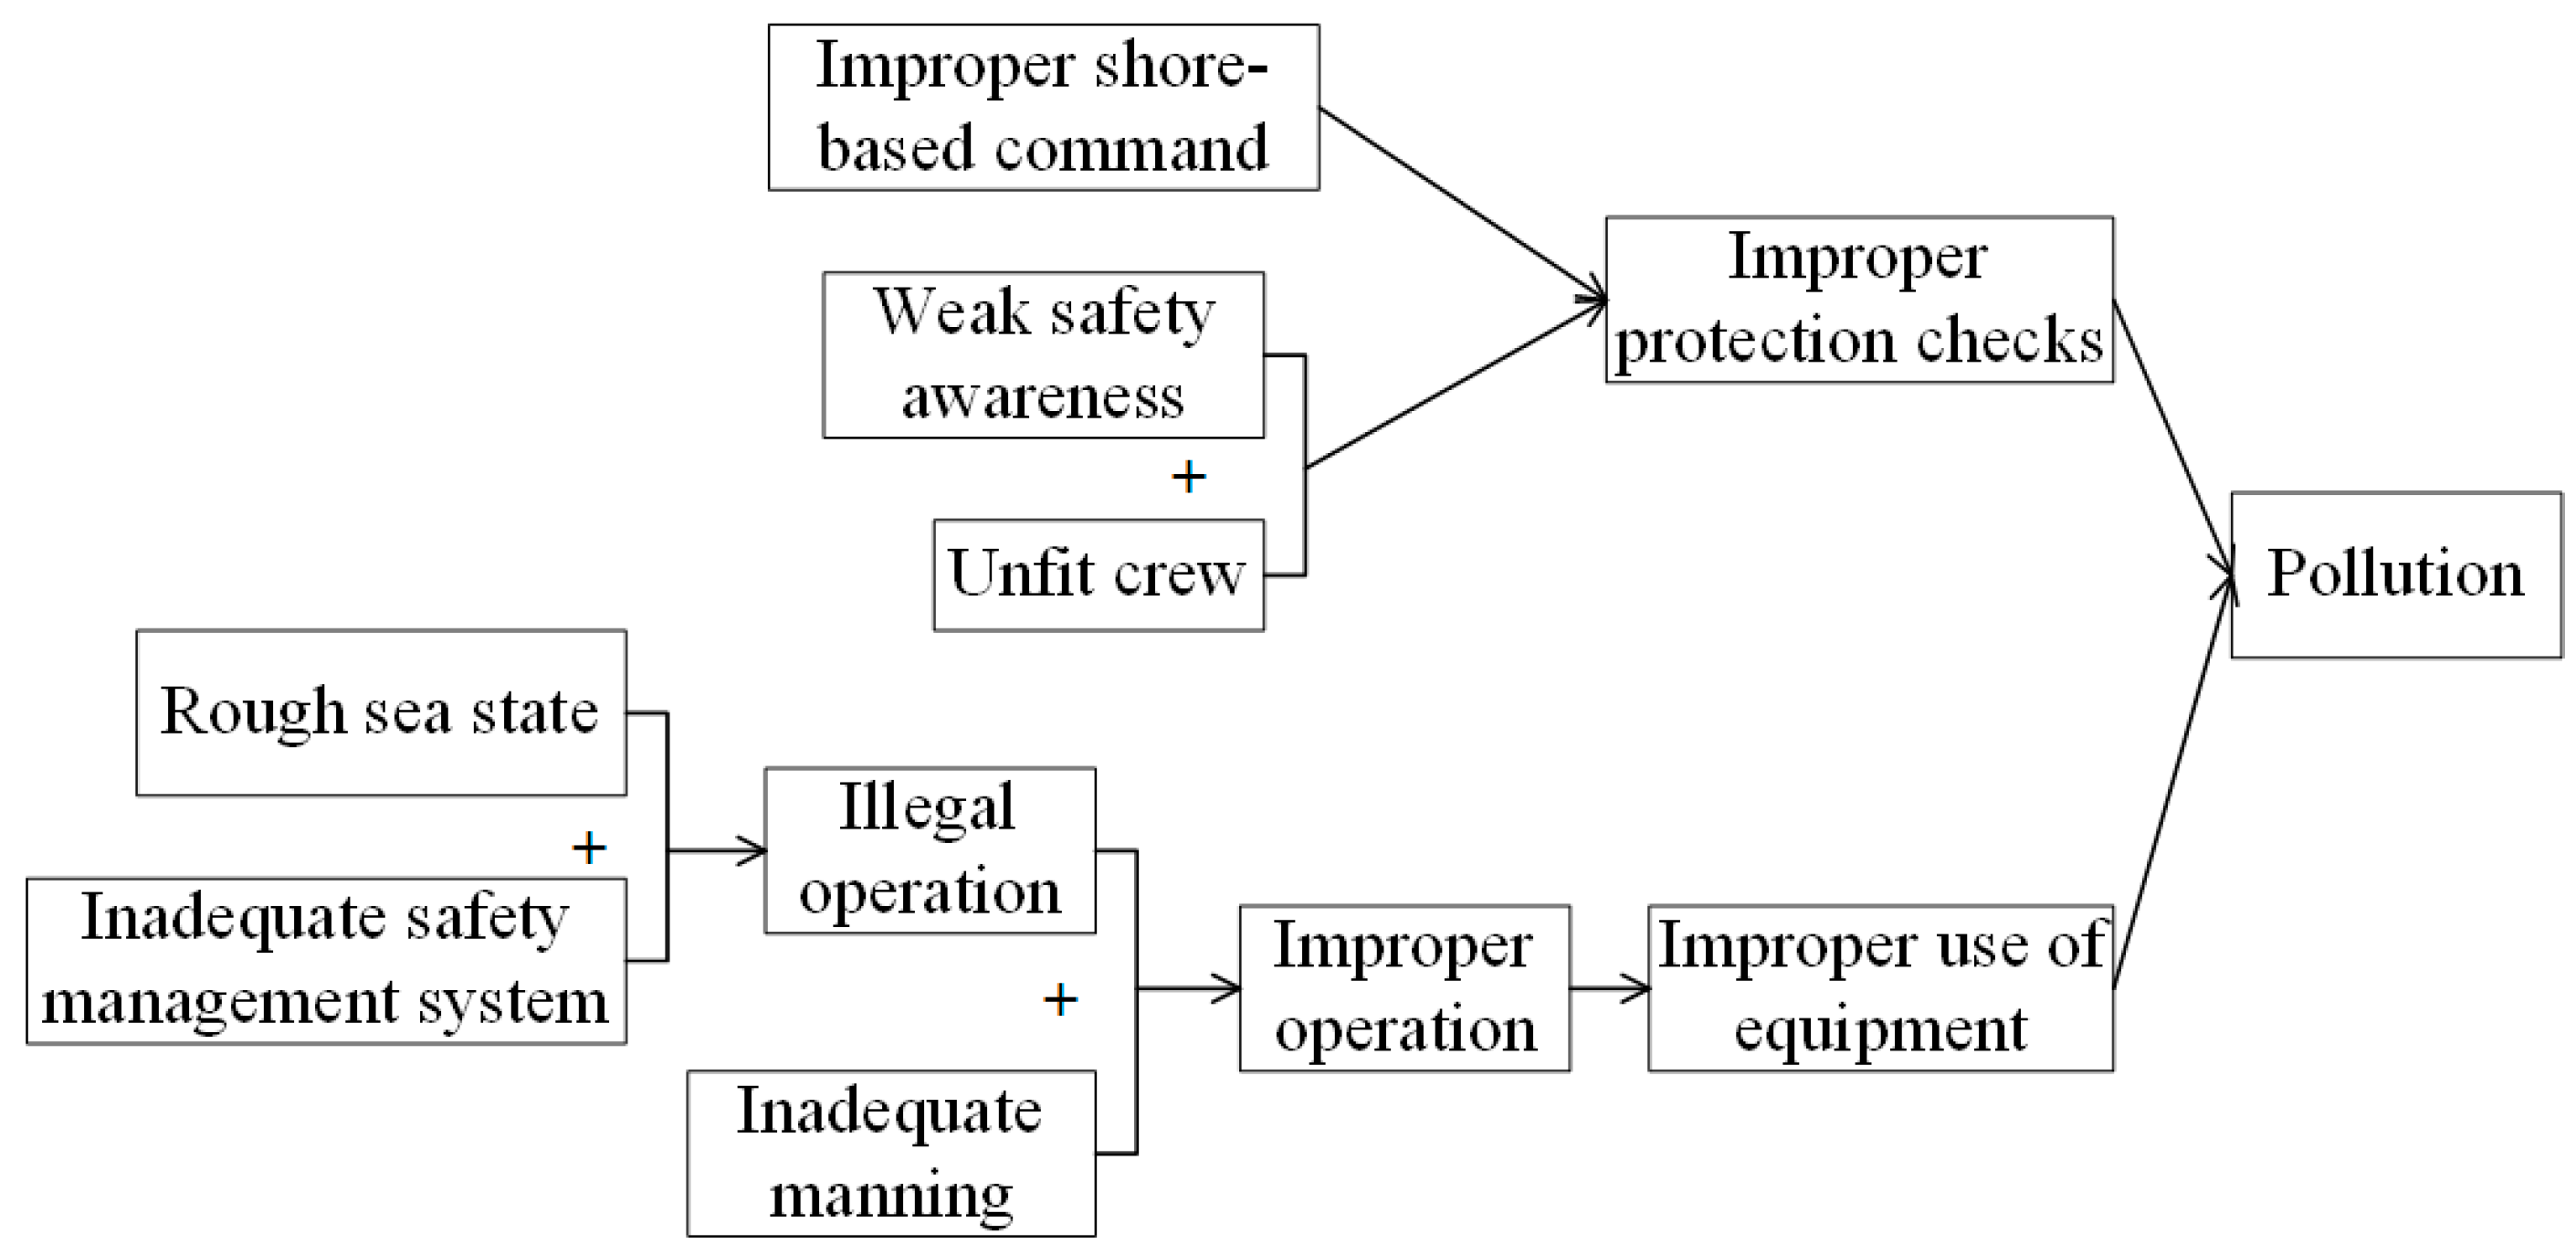
Guided by the accident type, the Apriori association rule analysis of the accident causes was performed. After multiple iterations, the threshold selection range was M i n _ s u p p o r t   0.01 and M i n _ c o n f i d e n c e   0.1 . During the construction of the accident correlation network, unreasonable correlation paths were systematically excluded to ensure the reliability of the analysis. Based on the algorithmic results, we identified and summarized the causal chains for different types of accidents, which are illustrated by Figure 17 (collision accidents), Figure 18 (sinking accidents), and Figure 19 (pollution accidents). Figure 17 demonstrates that in collision accidents, complex interactions among human errors, equipment malfunctions, and management oversights lead to the occurrence of accidents. Figure 18 elucidates the causal chain for sinking accidents, revealing the influence of adverse sea conditions, equipment failures, and other contributing factors. Meanwhile, Figure 19 highlights the synergistic effects of multiple factors—including environmental conditions, communication breakdowns, and management deficiencies—in the occurrence of pollution accidents. In general, this causal chain analysis clarifies that the primary vulnerabilities in ship safety management stem from the intricate interplay among various factors, such as personnel, equipment, management, and communication. While a single factor is generally insufficient to independently cause an accident, the convergence of these factors significantly elevates the risk of accidents.
(1)
Collision
Figure 17. Collision accident chain.
Systems 13 00284 g017
(2)
Sunken
Figure 18. Sunken accident chain.
Systems 13 00284 g018
(3)
Pollution
Figure 19. Pollution accident chain.
Systems 13 00284 g019

5.3. Analysis of Accident Information

This section is based on the statistical analysis of accident reports, with a focus on differences in accident levels, spatial distribution, accident types, and seasonal characteristics. The goal is to uncover the underlying patterns in accident occurrence.

5.3.1. Accident Level and Areas

According to the accident classification standards issued by the China Maritime Safety Administration, there were 1132 general accidents, 187 major accidents, and 18 serious accidents, as detailed in Table 11. Analysis of published accident reports indicates that water transport accidents in China predominantly fall under the category of general accidents, which tend to result in relatively few casualties (missing persons).
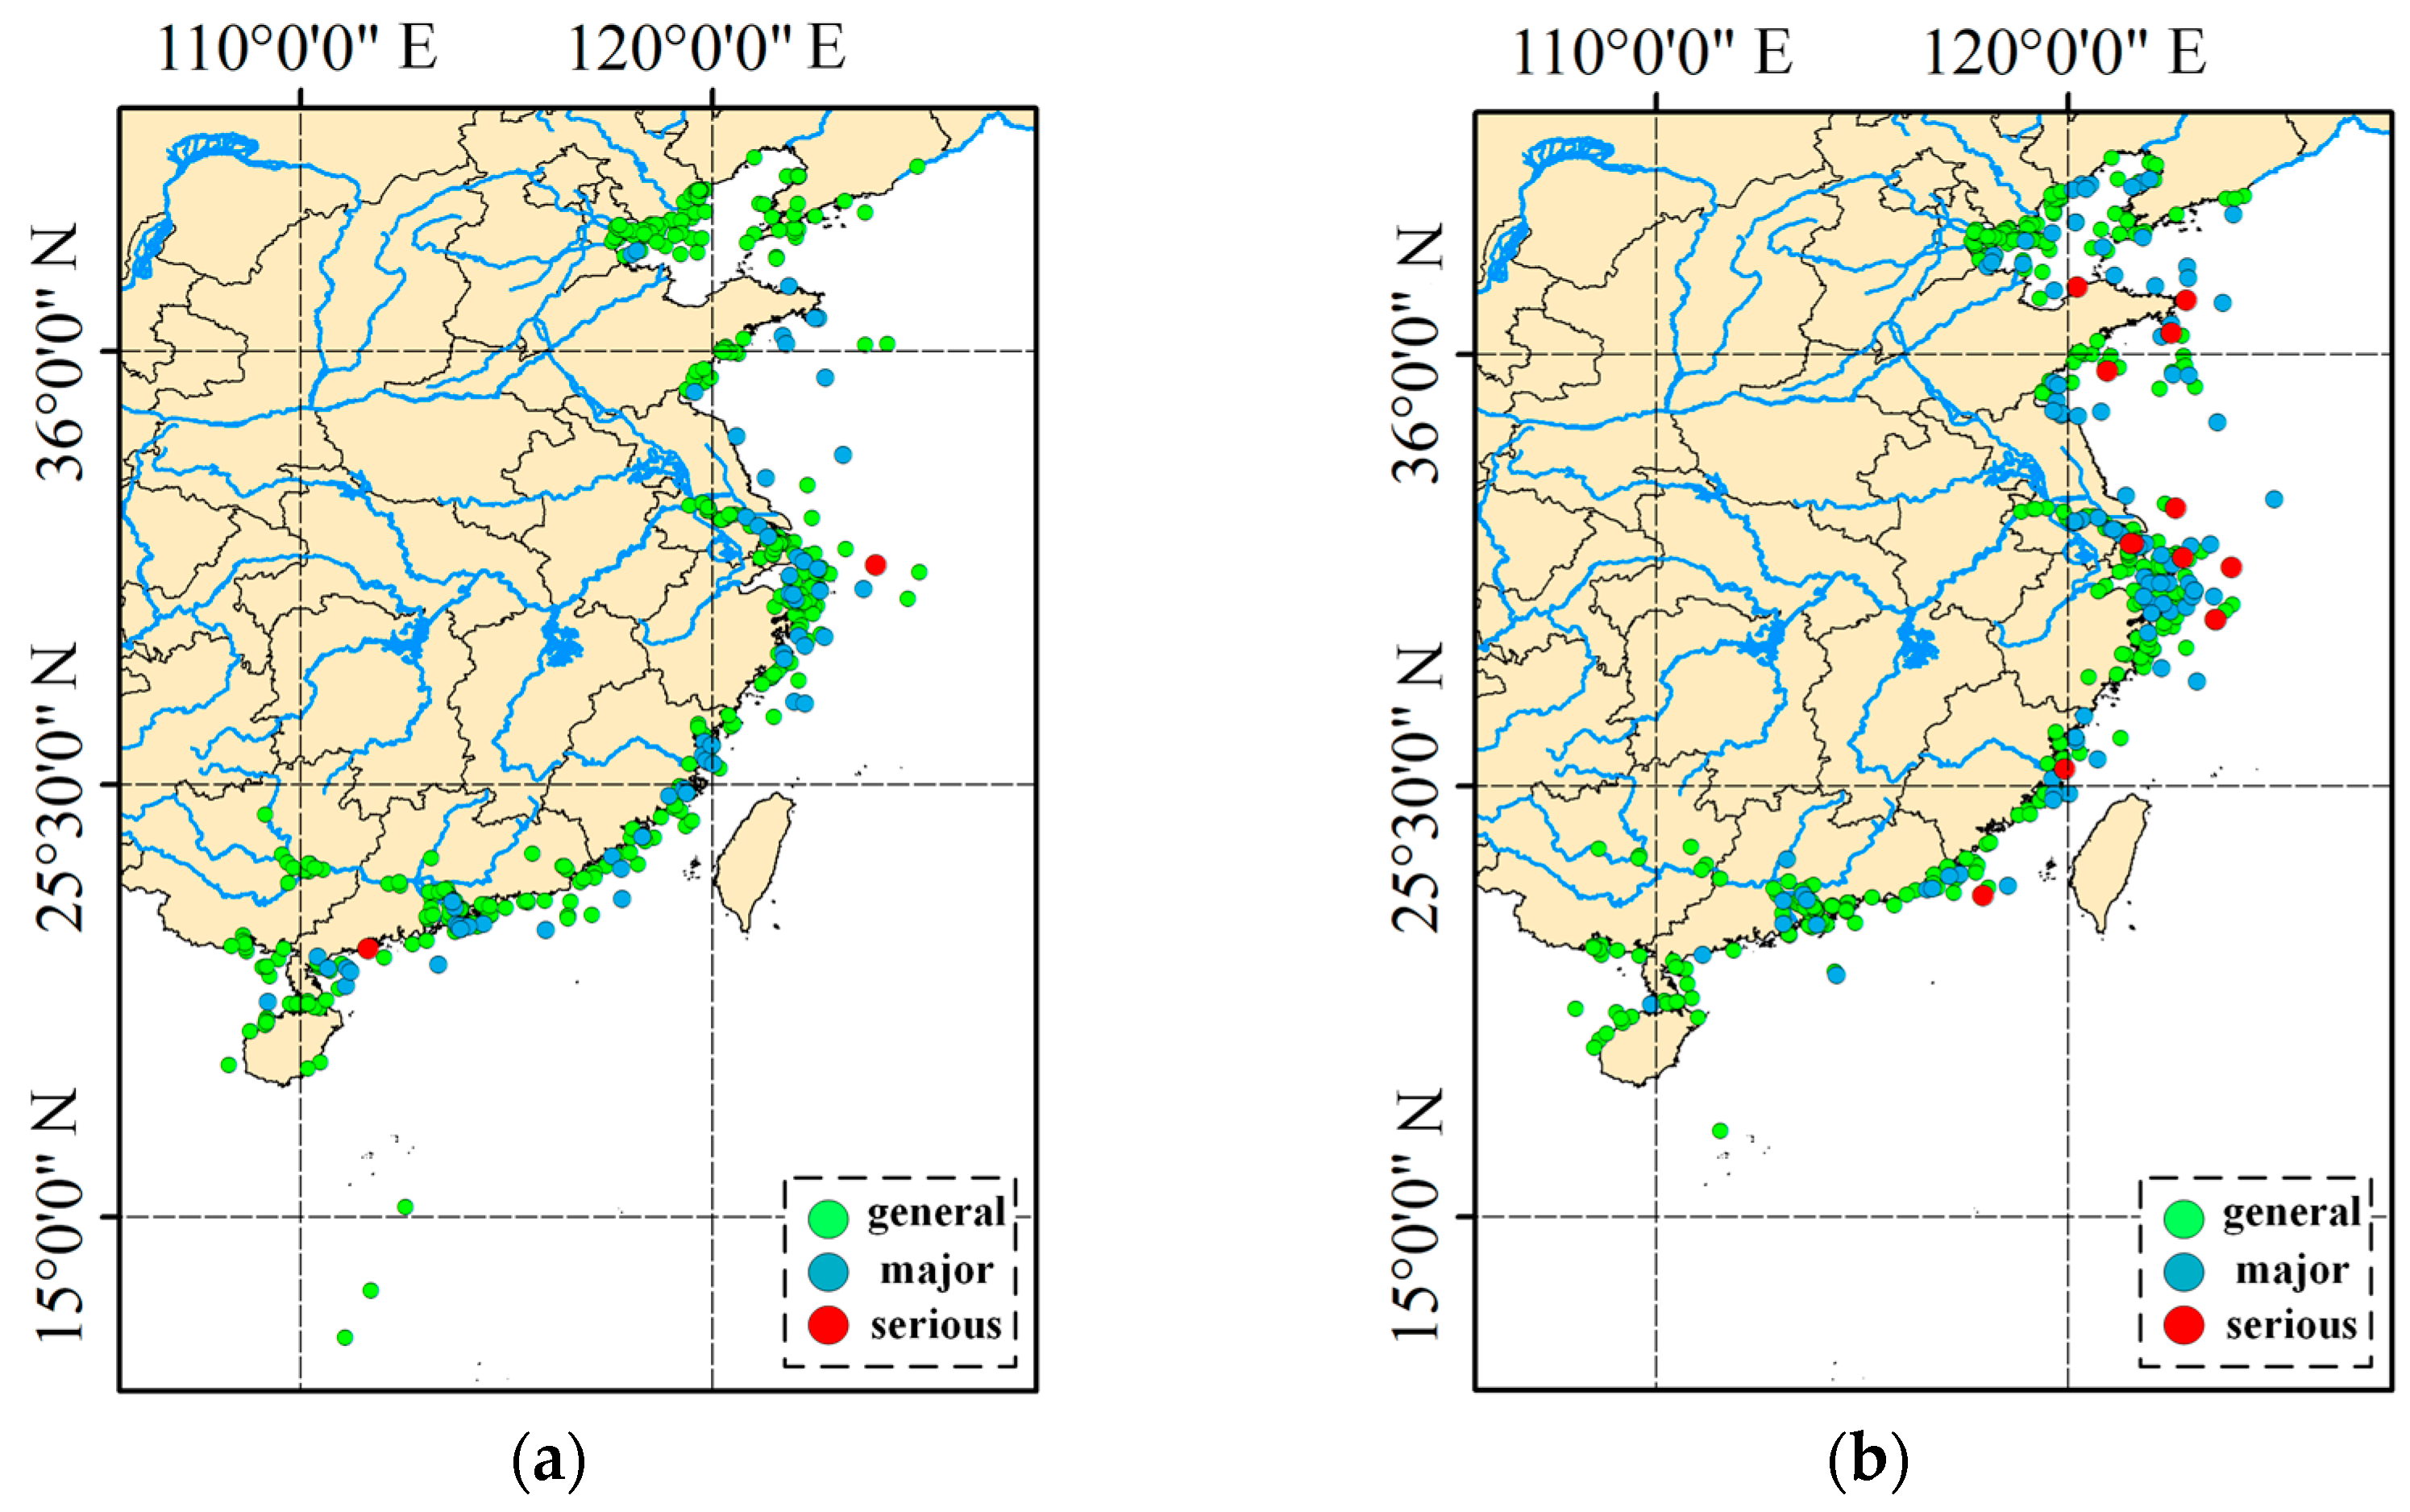
Figure 20 shows the distribution of accident levels in mainland China during daytime (06:00–18:00) and nighttime (18:01–06:00). A comparison of the density maps reveals that both the frequency and severity of accidents increase at night. In particular, the locations of large and major accidents are notably denser on the nighttime map. Additionally, accidents at night tend to cluster more in specific areas, especially along coastal and urban regions, which may be attributed to factors such as altered driving conditions and reduced visibility in low-light environments.
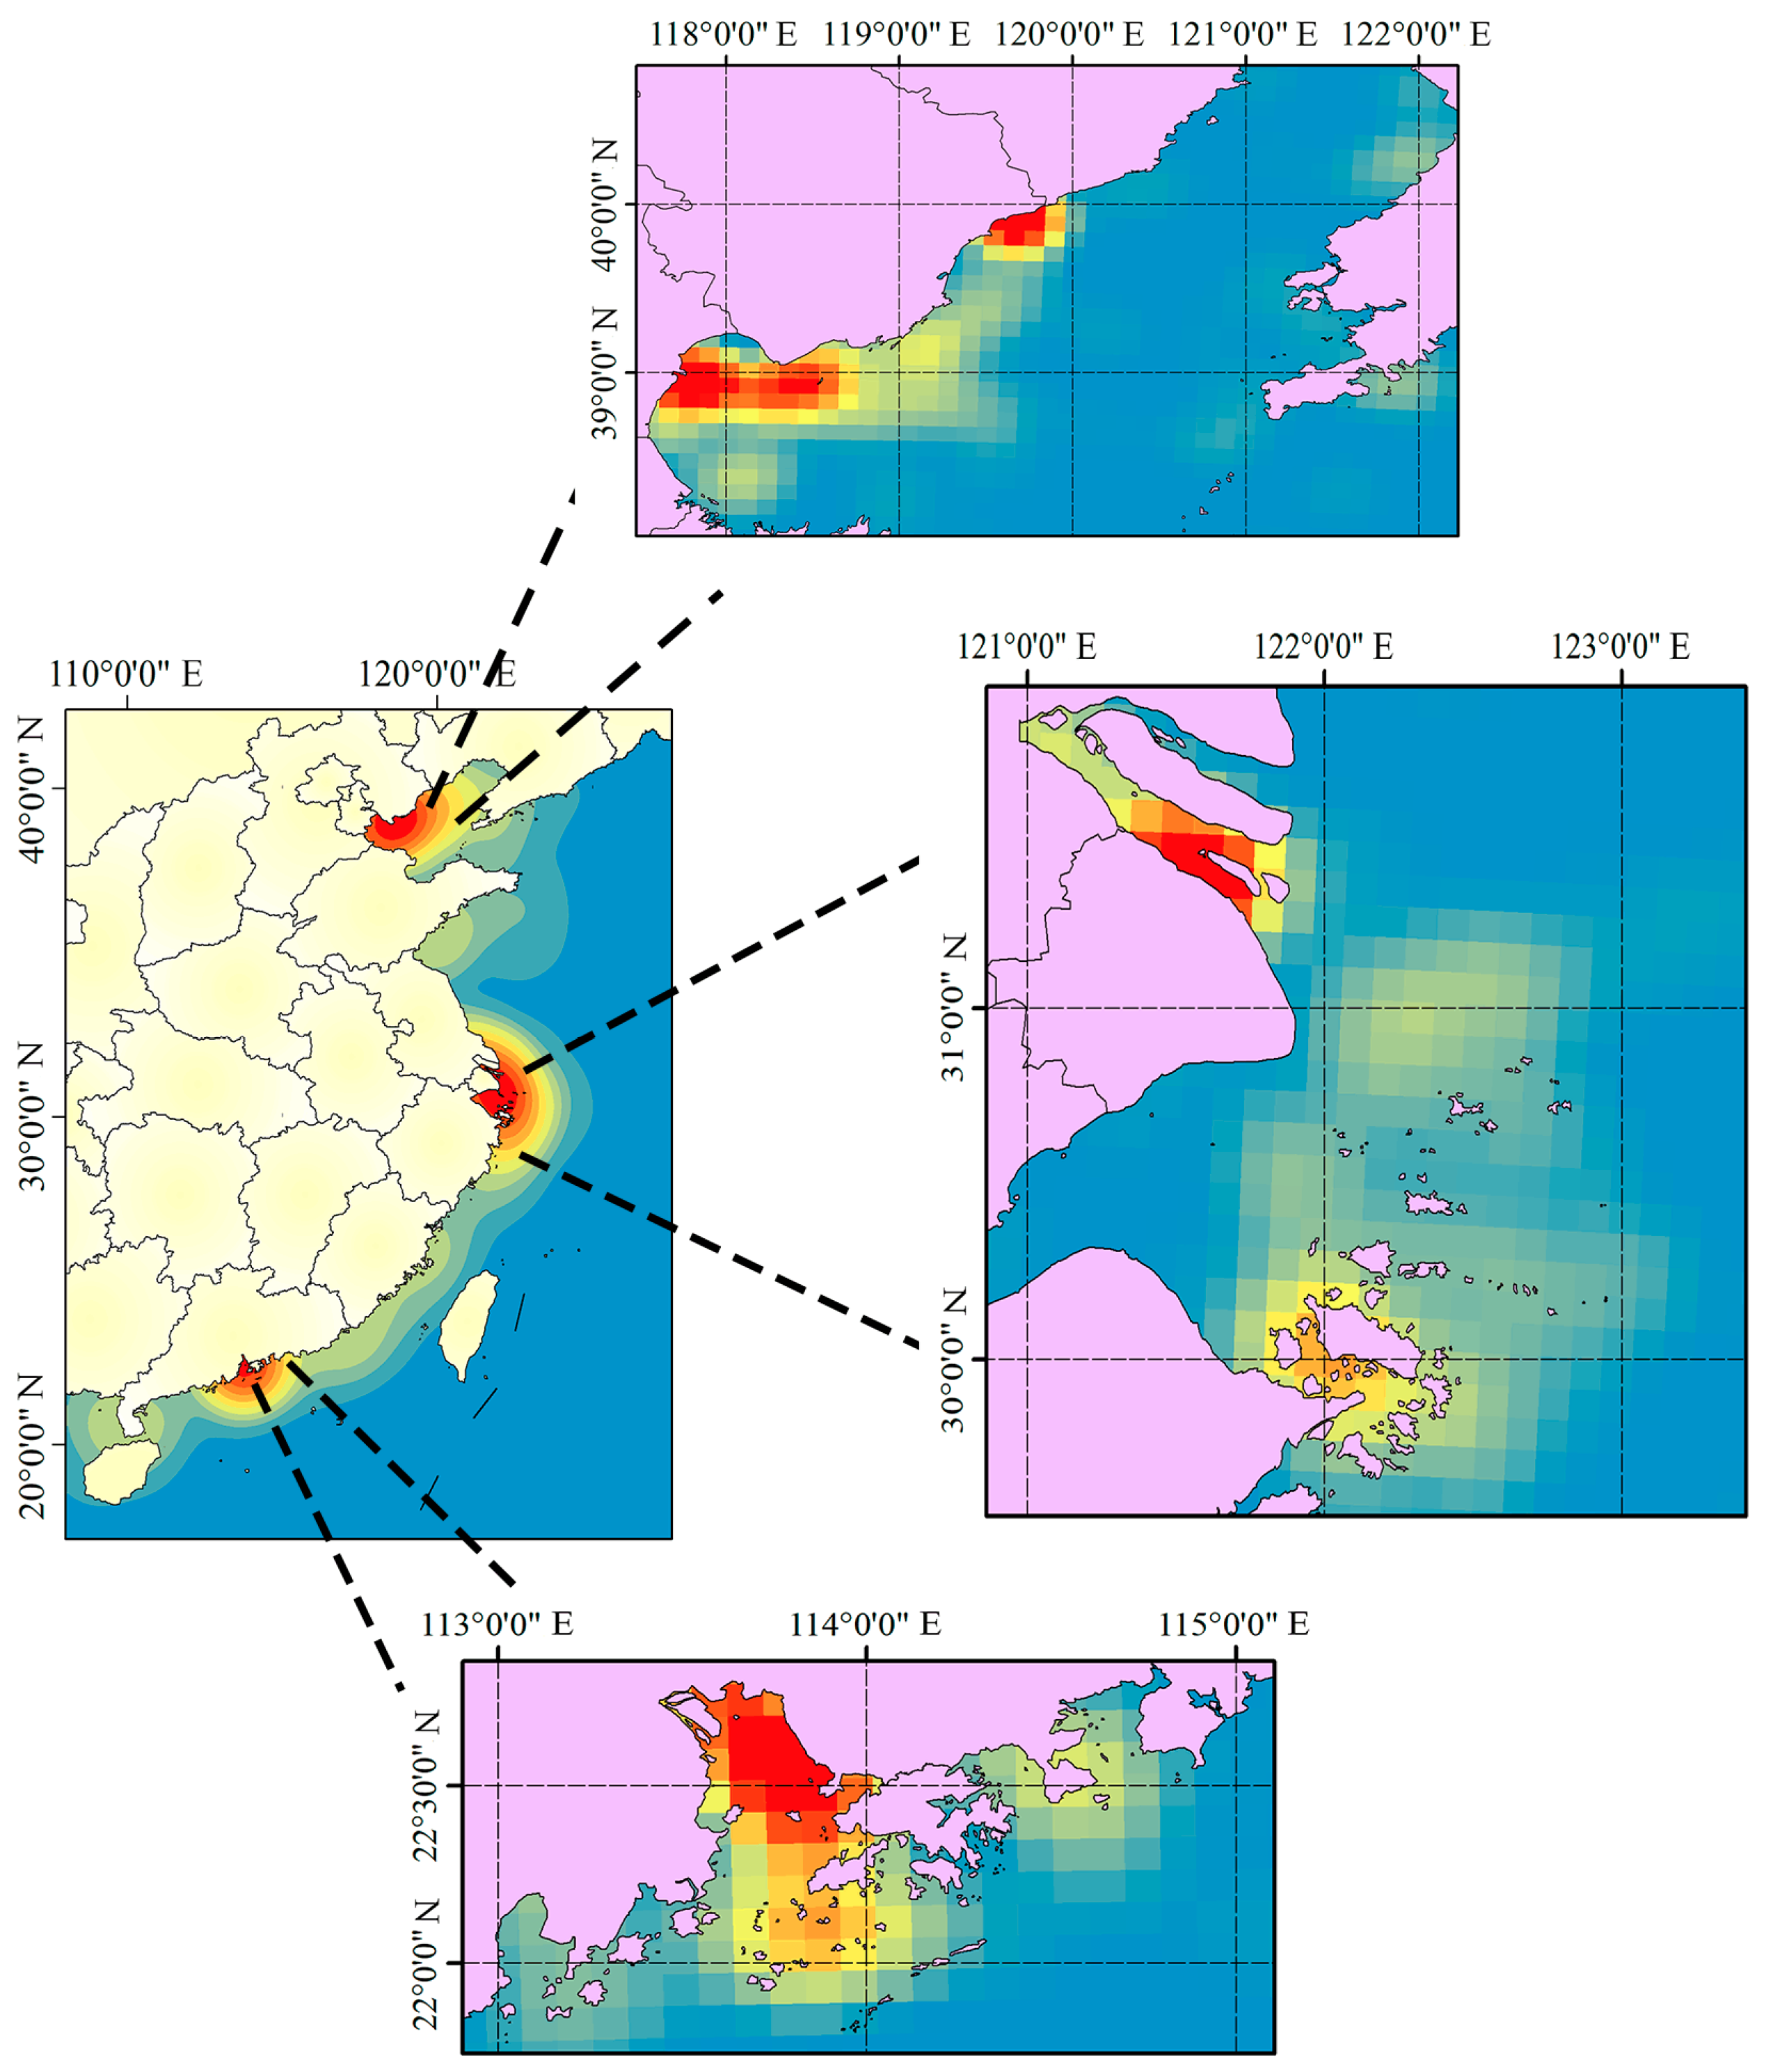
In the meantime, a heat map of coastal marine traffic accidents in China was drawn based on the accident locations, as shown in Figure 21 (The deeper the red hue, the greater the number of accidents reported). The main locations are the Bohai Sea Rim, the Yangtze River Estuary, and the Pearl River Delta. This hot spot distribution is also in line with the rule of ship traffic.

5.3.2. Type of Accident

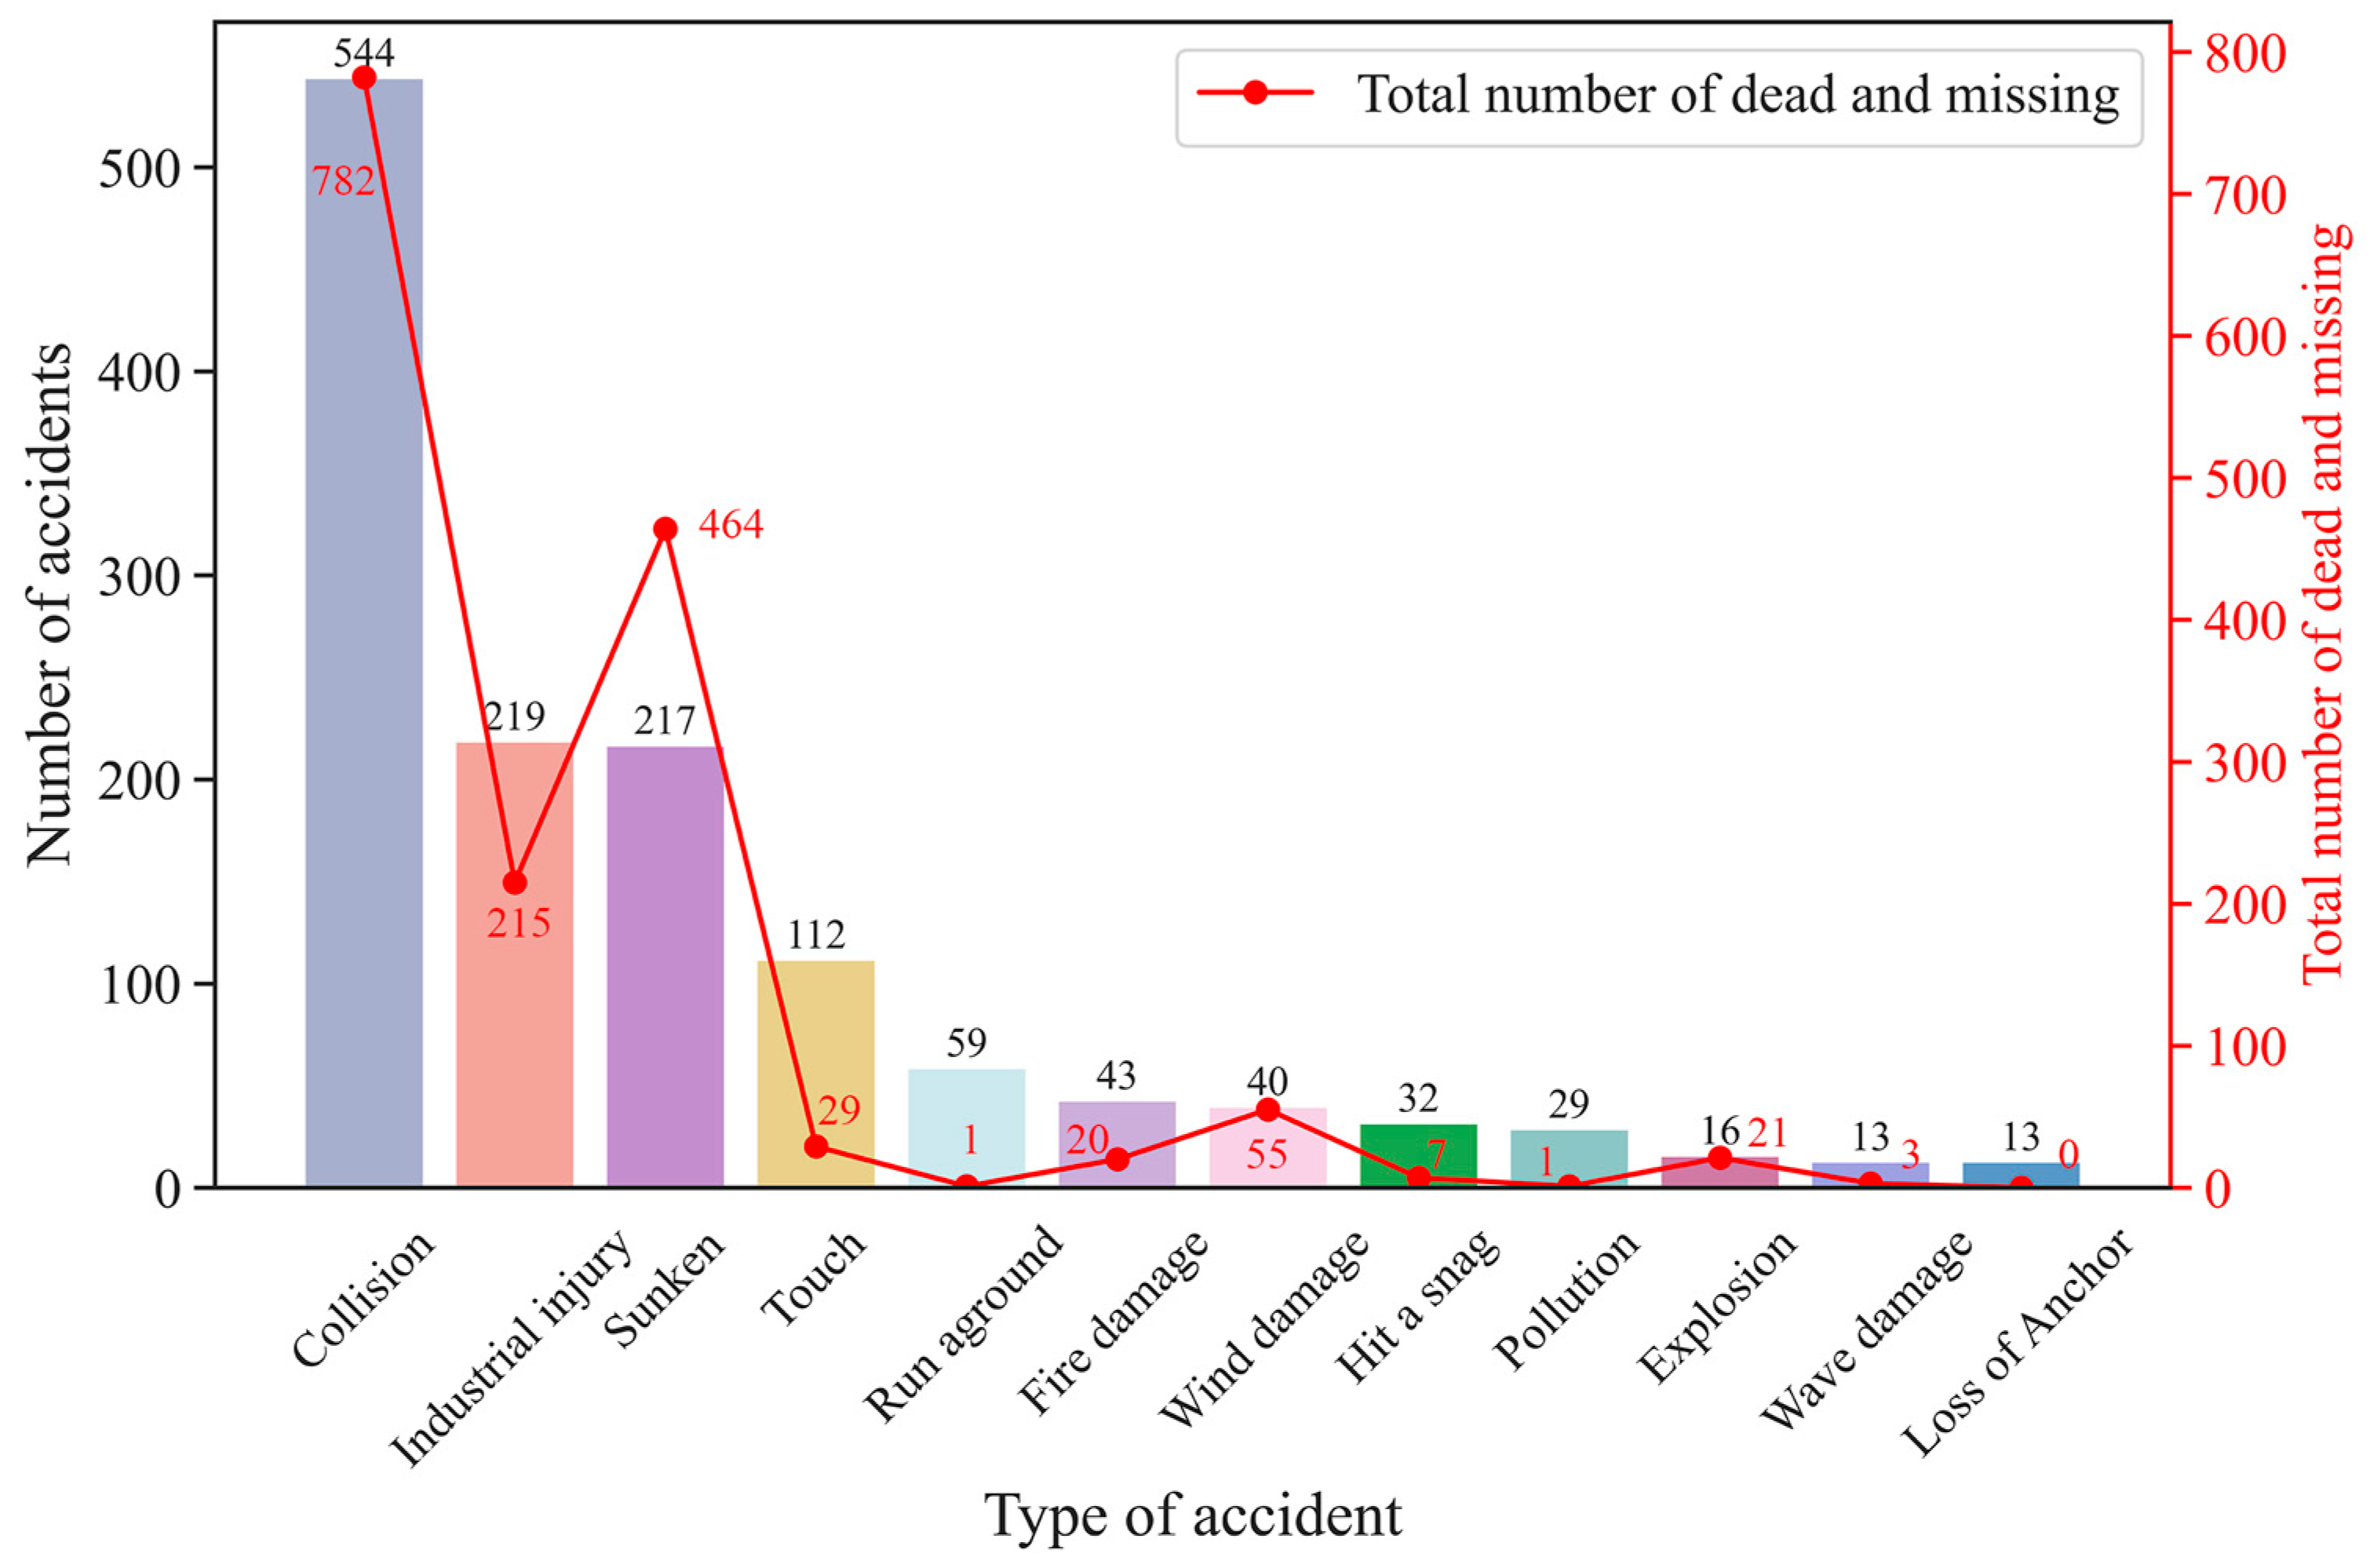
Figure 22 presents the distribution of over ten accident types, with collision accidents being the most prevalent at 544 cases, followed by industrial injuries (219 cases) and sinking accidents (217 cases). Other accident types, such as fire or explosion and grounding, occur relatively infrequently. Notably, collision and sinking accidents not only dominate in frequency but also have a disproportionate impact on casualty numbers. Collision accidents have resulted in over 700 casualties, far exceeding the nearly 500 casualties from sinking accidents. These findings highlight the critical need to prioritize collision and sinking accident prevention in maritime safety management.
Furthermore, the figure highlights an important statistical trend: Despite the relatively low frequency of fire and explosion accidents, the fatalities and disappearances per incident are notably high. This suggests that such accidents, although less common, pose significant inherent risks and require targeted preventive measures. Similarly, while grounding accidents occur more frequently, the casualty rates associated with them are comparatively low, potentially reflecting the effectiveness of current response strategies in mitigating their impact.

5.3.3. Seasonal Influences

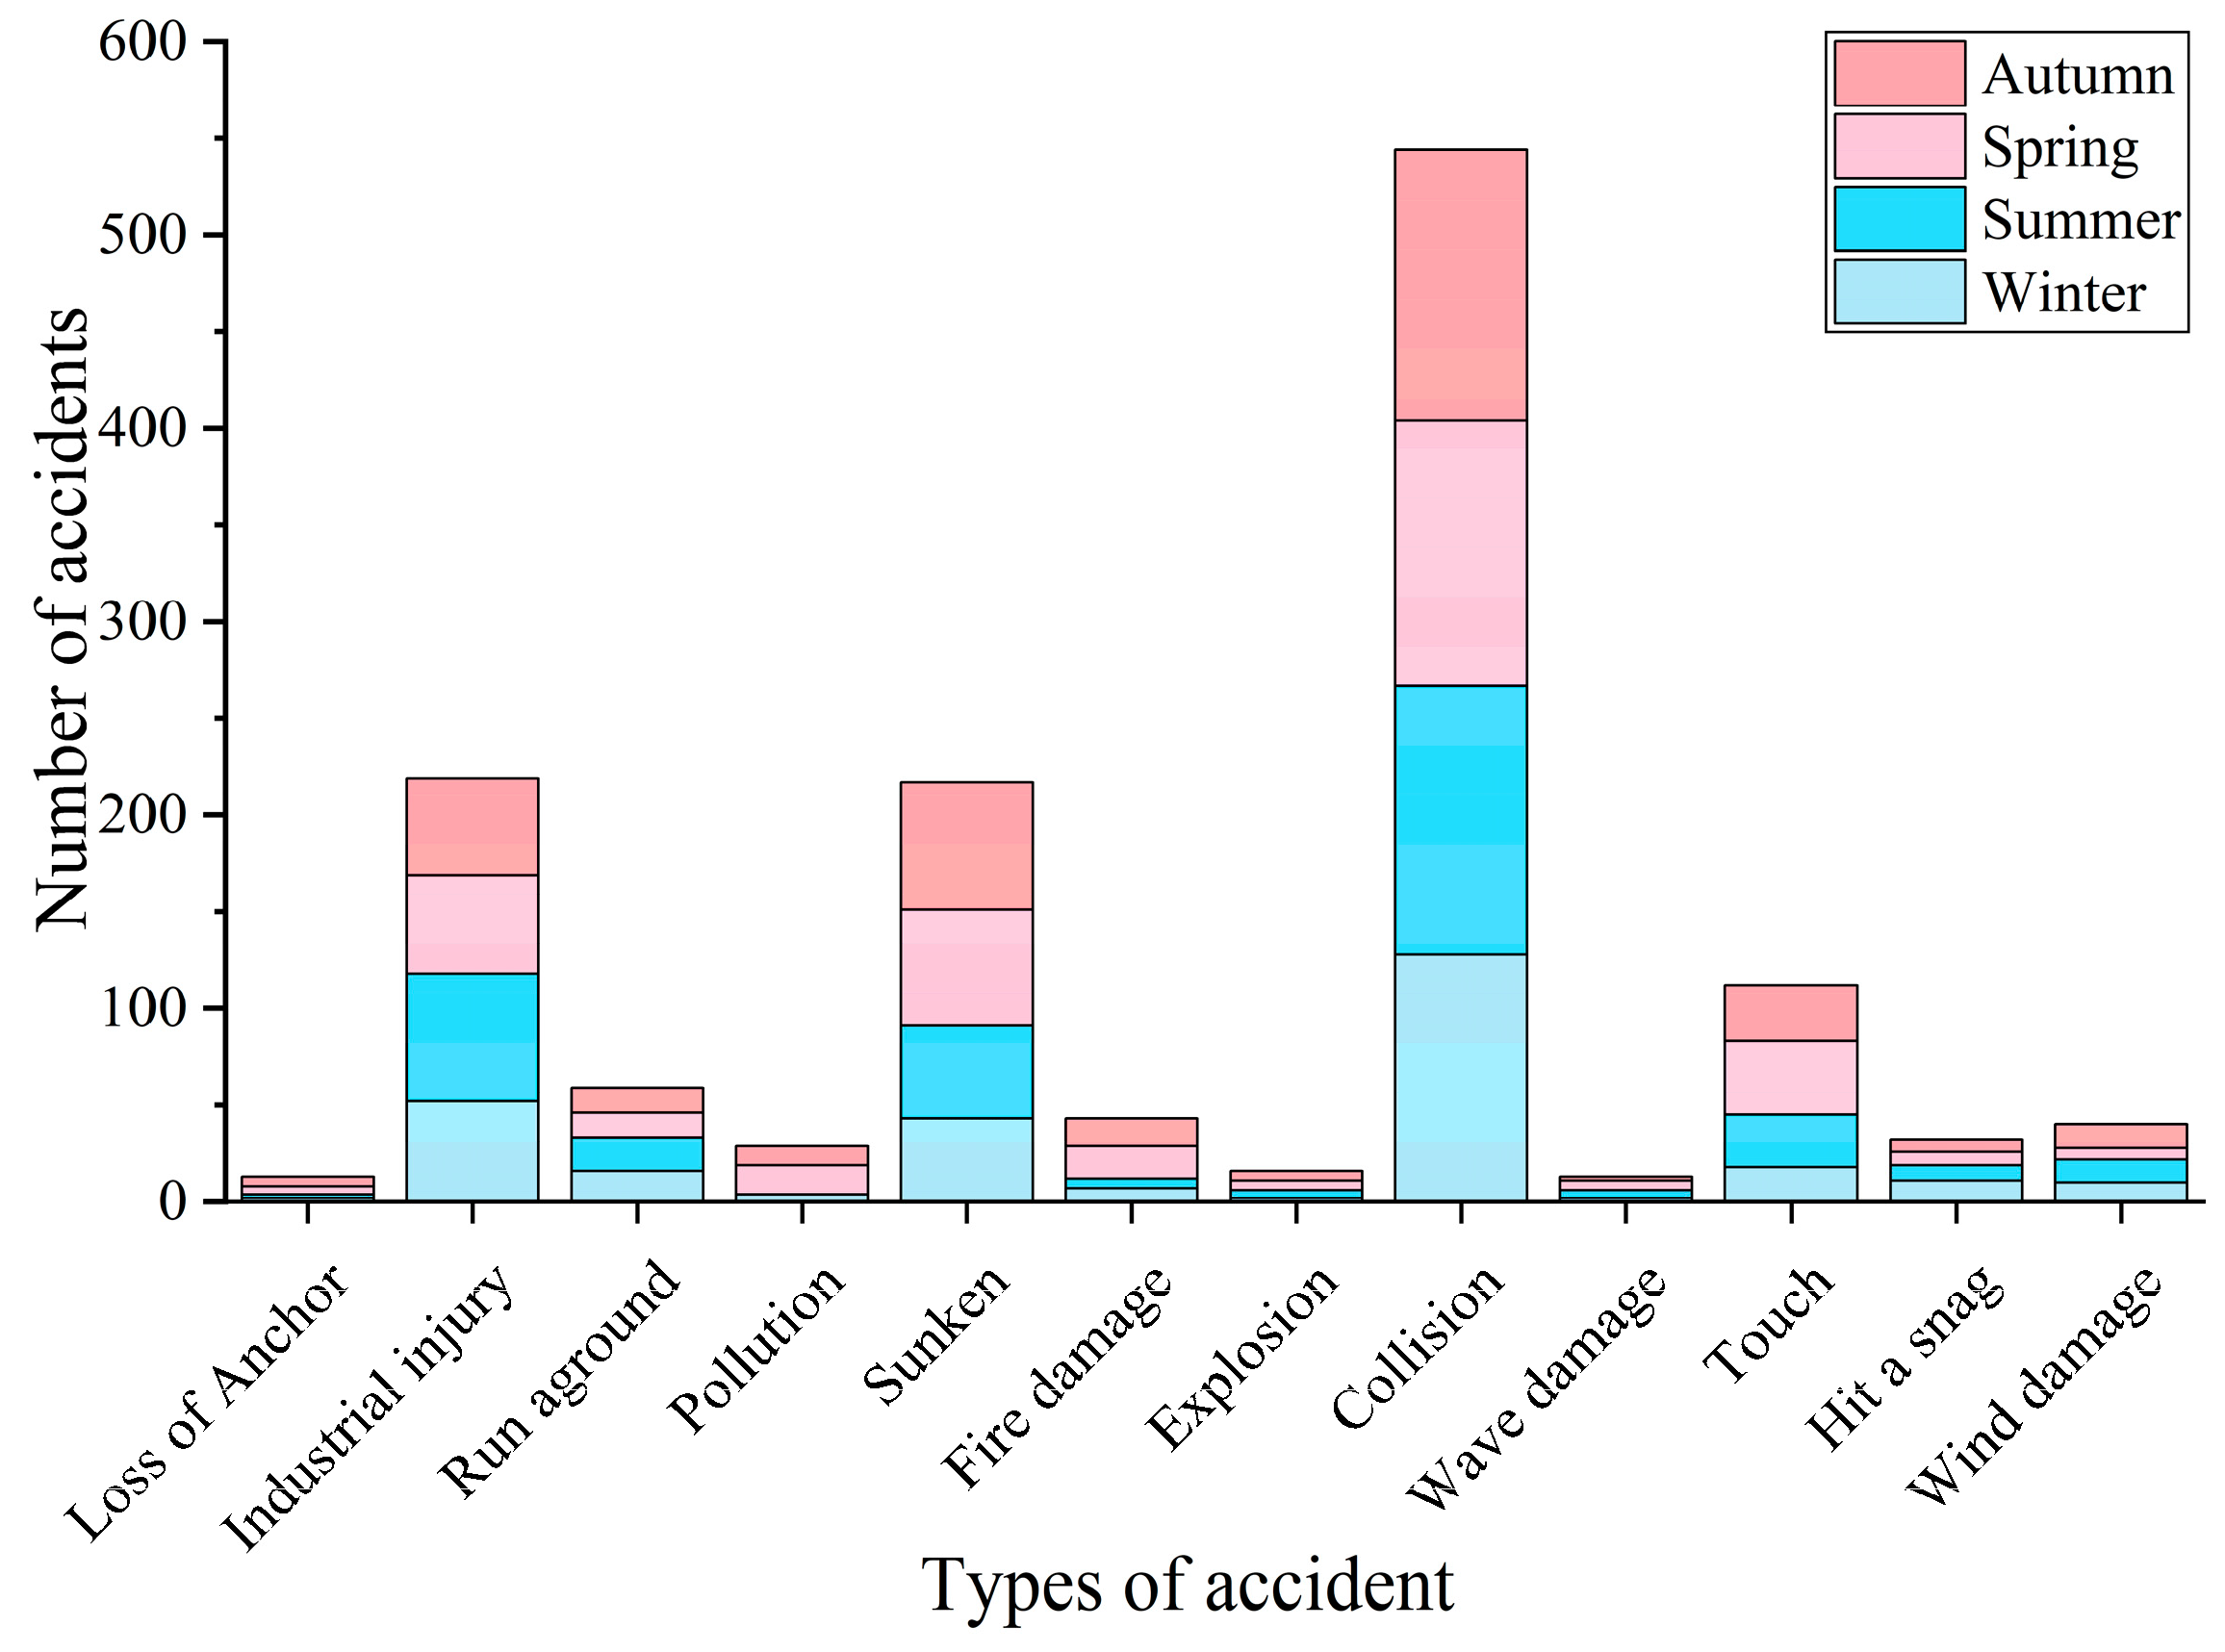
Previous studies have largely overlooked the influence of seasonal variations on maritime accidents. In this paper, as shown in Figure 23, seasonal factors significantly impact both the frequency and type of accidents. In particular, severe winter weather conditions markedly increase the likelihood of explosion and sinking accidents. This finding underscores the need to intensify maintenance and inspections of ship equipment—especially fuel and power systems—during the winter months. Moreover, issuing timely warnings and implementing protective measures in response to severe weather conditions are essential strategies to mitigate risks.
Spring and summer constitute peak shipping seasons, during which the frequency of work-related injuries, groundings, and pollution accidents increases significantly. It is advisable to intensify crew safety training during these periods to improve safety awareness and operational standards under high-intensity working conditions. Concurrently, enhanced monitoring and management of waterways and ports are essential to mitigate the risks of groundings and pollution incidents.
In contrast, collision accidents peak during summer and autumn due to heightened ship activities and increased shipping density. Consequently, it is imperative to reinforce traffic management during these seasons, optimize route design, and employ radar and Automatic Identification Systems (AIS) to bolster collision avoidance capabilities.
Moreover, fire and wave damage accidents occur year-round, underscoring their strong association with the condition of ship equipment and adherence to operational procedures. Regular inspections and maintenance of ship equipment, coupled with strict enforcement of operating protocols and regulatory compliance among crew members, are therefore recommended throughout the year.

5.4. Improvements

Maritime accident reports serve as a valuable data source in this study due to their status as official documents, enabling a systematic analysis that can effectively mitigate maritime accident risks [56,57]. Table 12 clearly outlines the enhancements introduced in this research.
This paper employs an enhanced BERT model to analyze marine traffic accidents, demonstrating the application of NLP in maritime safety. The multifactor analysis confirms the predominant role of human factors and emphasizes the significance of their interactions. High-confidence association rules—such as the link between fatigue and equipment misuse—are identified, forming the basis for targeted prevention strategies. Moreover, by integrating accident trend analyses with heat maps, this study proposes seasonal management strategies, including upgrading equipment in winter and optimizing routes during the summer/autumn periods.
In comparison to traditional approaches, this research offers substantial improvements in data mining, semantic analysis, and multifactorial investigation, providing novel insights into the processing of unstructured text in maritime safety contexts.
In terms of prevention policy, this paper advocates a multi-level approach. First, based on human factor standards, it recommends enhancing crew training through a classification-based training and certification system. Additionally, improvements should be made to the working environment by enforcing an anti-fatigue system and establishing dual-supervision mechanisms for mental health screening and behavior recording. The development of stringent operating procedures and comprehensive emergency response plans is expected to significantly reduce accidents caused by operational errors or improper judgment.
Second, at the technical prevention and control level, the establishment of regular maintenance and preventive maintenance systems is essential for addressing non-human-related causes. Real-time monitoring and predictive maintenance methodologies should be employed to promptly identify and eliminate potential equipment hazards. Legislative measures could mandate the installation of intelligent sensing systems on ships, and a national ship retrofitting record along with a dynamic sampling inspection mechanism could be implemented to further safeguard maritime operations.
Finally, at the system collaboration level, a dynamic risk assessment platform involving maritime departments, shipping enterprises, and insurance institutions is recommended. By promoting data sharing and establishing a closed-loop management system—encompassing early warning of violations, rectification and tracking, and insurance rewards and punishments—the platform would effectively block multi-factor coupling risk chains at their source.

6. Conclusions

This paper proposes a marine traffic accident cause analysis framework that integrates a BERT + BiLSTM deep learning model with the Apriori association rule algorithm. By leveraging advanced NLP techniques and multi-factor association mining, the framework efficiently classifies unstructured accident reports with an accuracy of 89.8% and systematically reveals complex causal relationships. This study identifies human factors (e.g., improper operation, fatigue), management deficiencies (e.g., owner malpractice), vessel conditions (e.g., equipment failure), and environmental factors (e.g., adverse sea conditions) as primary drivers of accidents. Moreover, high-confidence association rules (e.g., “fatigue -> improper use of equipment” and “illegal modification -> unseaworthy vessel”) demonstrate the significant impact of multi-factor interactions on accident severity. Spatial–temporal analysis further indicates that accident risks are higher at night, with collision and shipwreck incidents exhibiting seasonal trends, peaking in summer and winter, respectively. These findings provide a targeted basis for risk prevention and control measures in China’s coastal regions.
Despite these achievements, this study has several limitations. First, the data source is confined to accident reports publicly released by the China Maritime Safety Administration, which may not fully capture incident characteristics in other regions or unreported events. Additionally, the dataset’s concentration on maritime accidents limits the model’s classification performance for other accident domains. Furthermore, the available datasets restrict the model’s generalization capability, particularly in covering extremely rare events such as catastrophic accidents.
Future research should address these limitations by expanding the dataset to include time series data that capture the dynamic evolution of causality—such as real-time ship monitoring data (e.g., sensor logs) and crew behavior records—to construct a more comprehensive multi-modal database. Additionally, promoting the application and validation of unmanned ship technology during critical operational phases could further enhance maritime safety. By deepening data-driven approaches and fostering cross-disciplinary collaboration, future research is expected to improve the precision and foresight of maritime safety governance, thereby providing robust scientific support for the sustainable development of the global shipping industry.

Author Contributions

Z.Z.: Conception and design of the study, data analysis, interpretation of results, manuscript writing; X.L.: data collection, data interpretation; L.F.: literature search, manuscript revision; M.G.: statistical analysis, manuscript revision; H.F.: study design and guidance. All authors have read and agreed to the published version of the manuscript.

Funding

This work was sponsored by the National “111” Center on Safety and Intelligent Operation of Sea Bridges [grant number D 21013].

Data Availability Statement

The raw data supporting the conclusions of this article will be made available by the authors on request.

Acknowledgments

The authors would like to thank the anonymous referees for their constructive comments on this paper. Their comments significantly improved the quality of this paper.

Conflicts of Interest

The authors declare no conflicts of interest.

Note

1
https://commercial.allianz.com/content/dam/onemarketing/commercial/commercial/reports/ Allianz Global Corporate & Specialty (AGCS) -Safety-Shipping-Review-2023.pdf.

References

  1. Veitch, E.; Alsos, O.A. A systematic review of human-AI interaction in autonomous ship systems. Saf. Sci. 2022, 152, 105778. [Google Scholar] [CrossRef]
  2. Ministry of Transport of the People’s Republic of China. Transport Sector Development Bulletin 2023; Ministry of Transport of the People’s Republic of China: Beijing, China, 2024. [Google Scholar]
  3. Li, M.; Mou, J.; Chen, P.; Chen, L.; Van Gelder, P. Real-time collision risk based safety management for vessel traffic in busy ports and waterways. Ocean. Coast. Manag. 2023, 234, 106471. [Google Scholar] [CrossRef]
  4. Wang, H.; Liu, Z.; Wang, X.; Graham, T.; Wang, J. An analysis of factors affecting the severity of marine accidents. Reliab. Eng. Syst. Saf. 2021, 210, 107513. [Google Scholar] [CrossRef]
  5. Zhang, H.; Chen, B.; Zhao, Q.; Yu, J.; Fang, Z. Identification of risk key factors and prevention strategies for collision accidents between merchant and fishing vessels in China waters based on complex network. Ocean Eng. 2024, 307, 118148. [Google Scholar] [CrossRef]
  6. Deng, J.; Liu, S.; Xie, C.; Liu, K. Risk coupling characteristics of maritime accidents in Chinese inland and coastal waters based on NK model. J. Mar. Sci. Eng. 2021, 10, 4. [Google Scholar] [CrossRef]
  7. Magklasi, I. Safety of ship to ship transfers and investigation of marine accidents: An evaluation of the UK MAIB reports. J. Int. Marit. Law 2022, 28, 91–105. [Google Scholar]
  8. Bhardwaj, U.; Teixeira, A.; Soares, C.G. Casualty analysis methodology and taxonomy for FPSO accident analysis. Reliab. Eng. Syst. Saf. 2022, 218, 108169. [Google Scholar] [CrossRef]
  9. Chowdhury, M.N.; Shafi, S.; Arzaman, M.; Farhan, A.; Teoh, B.A.; Kadhim, K.A.; Salamun, H.; Abdul Kadir, F.K.; Said, S.; Kadir, K.A. Navigating Human Factors in Maritime Safety: A Review of Risks and Improvements in Engine Rooms of Ocean-Going Vessels. Int. J. Saf. Secur. Eng. 2024, 14, 1–14. [Google Scholar] [CrossRef]
  10. Hu, S.; Li, Z.; Xi, Y.; Gu, X.; Zhang, X. Path analysis of causal factors influencing marine traffic accident via structural equation numerical modeling. J. Mar. Sci. Eng. 2019, 7, 96. [Google Scholar] [CrossRef]
  11. Kokotos, D.X.; Linardatos, D.S. An application of data mining tools for the study of shipping safety in restricted waters. Saf. Sci. 2011, 49, 192–197. [Google Scholar] [CrossRef]
  12. Cao, Y.; Wang, X.; Wang, Y.; Fan, S.; Wang, H.; Yang, Z.; Liu, Z.; Wang, J.; Shi, R. Analysis of factors affecting the severity of marine accidents using a data-driven Bayesian network. Ocean Eng. 2023, 269, 113563. [Google Scholar] [CrossRef]
  13. Islam, R.; Khan, F.; Abbassi, R.; Garaniya, V. Human error probability assessment during maintenance activities of marine systems. Saf. Health Work 2018, 9, 42–52. [Google Scholar] [CrossRef]
  14. Kimera, D.; Nangolo, F.N. Reliability maintenance aspects of deck machinery for ageing/aged fishing vessels. J. Mar. Eng. Technol. 2022, 21, 100–110. [Google Scholar] [CrossRef]
  15. Antão, P.; Sun, S.; Teixeira, A.; Soares, C.G. Quantitative assessment of ship collision risk influencing factors from worldwide accident and fleet data. Reliab. Eng. Syst. Saf. 2023, 234, 109166. [Google Scholar] [CrossRef]
  16. Chen, P.; Huang, Y.; Mou, J.; Van Gelder, P. Probabilistic risk analysis for ship-ship collision: State-of-the-art. Saf. Sci. 2019, 117, 108–122. [Google Scholar] [CrossRef]
  17. Chen, J.; Bian, W.; Wan, Z.; Yang, Z.; Zheng, H.; Wang, P. Identifying factors influencing total-loss marine accidents in the world: Analysis and evaluation based on ship types and sea regions. Ocean Eng. 2019, 191, 106495. [Google Scholar] [CrossRef]
  18. Lin, Q.; Yin, B.; Zhang, X.; Grifoll, M.; Feng, H. Evaluation of ship collision risk in ships’ routeing waters: A Gini coefficient approach using AIS data. Phys. A Stat. Mech. Its Appl. 2023, 624, 128936. [Google Scholar] [CrossRef]
  19. Jon, M.H.; Kim, Y.P.; Choe, U. Determination of a safety criterion via risk assessment of marine accidents based on a Markov model with five states and MCMC simulation and on three risk factors. Ocean Eng. 2021, 236, 109000. [Google Scholar] [CrossRef]
  20. Bye, R.J.; Aalberg, A.L. Maritime navigation accidents and risk indicators: An exploratory statistical analysis using AIS data and accident reports. Reliab. Eng. Syst. Saf. 2018, 176, 174–186. [Google Scholar] [CrossRef]
  21. Wang, L.; Yang, Z. Bayesian network modelling and analysis of accident severity in waterborne transportation: A case study in China. Reliab. Eng. Syst. Saf. 2018, 180, 277–289. [Google Scholar] [CrossRef]
  22. New Zealand Journal of ScienceZhang, G.; Thai, V.V.; Yuen, K.F.; Loh, H.S.; Zhou, Q. Addressing the epistemic uncertainty in maritime accidents modelling using Bayesian network with interval probabilities. Saf. Sci. 2018, 102, 211–225. [Google Scholar] [CrossRef]
  23. Khan, R.U.; Yin, J.; Mustafa, F.S.; Anning, N. Risk assessment for berthing of hazardous cargo vessels using Bayesian networks. Ocean Coast. Manag. 2021, 210, 105673. [Google Scholar] [CrossRef]
  24. Animah, I. Application of bayesian network in the maritime industry: Comprehensive literature review. Ocean Eng. 2024, 302, 117610. [Google Scholar] [CrossRef]
  25. Li, K.X.; Yin, J.; Bang, H.S.; Yang, Z.; Wang, J. Bayesian network with quantitative input for maritime risk analysis. Transp. A Transp. Sci. 2014, 10, 89–118. [Google Scholar] [CrossRef]
  26. Chin, H.C.; Debnath, A.K. Modeling perceived collision risk in port water navigation. Saf. Sci. 2009, 47, 1410–1416. [Google Scholar] [CrossRef]
  27. Feng, H.; Grifoll, M.; Yang, Z.; Zheng, P. Collision risk assessment for ships’ routeing waters: An information entropy approach with Automatic Identification System (AIS) data. Ocean Coast. Manag. 2022, 224, 106184. [Google Scholar] [CrossRef]
  28. Melnyk, O.; Petrov, I.; Melenchuk, T.; Zaporozhets, A.; Bugaeva, S.; Rossomakha, O. Causal Model and Cluster Analysis of Marine Incidents: Risk Factors and Preventive Strategies. In Maritime Systems, Transport and Logistics I: Safety and Efficiency of Operation; Springer: Cham, Switzerland, 2025; pp. 89–105. [Google Scholar]
  29. Kececi, T.; Arslan, O. SHARE technique: A novel approach to root cause analysis of ship accidents. Saf. Sci. 2017, 96, 1–21. [Google Scholar] [CrossRef]
  30. Chen, D.; Pei, Y.; Xia, Q. Research on human factors cause chain of ship accidents based on multidimensional association rules. Ocean Eng. 2020, 218, 107717. [Google Scholar] [CrossRef]
  31. Ma, L.; Ma, X.; Lan, H.; Liu, Y.; Deng, W. A data-driven method for modeling human factors in maritime accidents by integrating DEMATEL and FCM based on HFACS: A case of ship collisions. Ocean Eng. 2022, 266, 112699. [Google Scholar] [CrossRef]
  32. Li, Z.; Zhou, L.; Yang, X.; Jia, H.; Li, W.; Zhang, J. User sentiment analysis of Covid-19 via adversarial training based on the BERT-FGM-BiGRU model. Systems 2023, 11, 129. [Google Scholar] [CrossRef]
  33. Journal of Marine Science and TechnologyPerboli, G.; Gajetti, M.; Fedorov, S.; Giudice, S.L. Natural Language Processing for the identification of Human factors in aviation accidents causes: An application to the SHEL methodology. Expert Syst. Appl. 2021, 186, 115694. [Google Scholar] [CrossRef]
  34. Tarshizi, E.; Buche, M.; Inti, B.; Chappidi, R. Text mining analysis of US Department of Labor’s MSHA fatal accident reports for coal mining. Min. Eng. 2018, 70, 43. [Google Scholar] [CrossRef]
  35. Liu, D.; Wang, X.; Cai, Y.; Liu, Z.; Liu, Z.-J. A novel framework of real-time regional collision risk prediction based on the RNN approach. J. Mar. Sci. Eng. 2020, 8, 224. [Google Scholar] [CrossRef]
  36. Gan, L.; Gao, Z.; Zhang, X.; Xu, Y.; Liu, R.W.; Xie, C.; Shu, Y. Graph neural networks enabled accident causation prediction for maritime vessel traffic. Reliab. Eng. Syst. Saf. 2025, 257, 110804. [Google Scholar] [CrossRef]
  37. Chen, J.; Zhuang, C.; Shi, J.; Jiang, H.; Xu, J.; Liu, J. Risk factors extraction and analysis of Chinese ship collision accidents based on knowledge graph. Ocean Eng. 2025, 322, 120536. [Google Scholar] [CrossRef]
  38. Gan, L.; Ye, B.; Huang, Z.; Xu, Y.; Chen, Q.; Shu, Y. Knowledge graph construction based on ship collision accident reports to improve maritime traffic safety. Ocean Coast. Manag. 2023, 240, 106660. [Google Scholar] [CrossRef]
  39. Nurduhan, M.; Kuleyin, B. Cluster-based Visualization of human element interactions in marine accidents. Ocean Eng. 2024, 298, 117153. [Google Scholar] [CrossRef]
  40. Huang, X.; Wen, Y.; Zhang, F.; Li, H.; Sui, Z.; Cheng, X. Accident analysis of waterway dangerous goods transport: Building an evolution network with text knowledge extraction. Ocean Eng. 2025, 318, 120176. [Google Scholar] [CrossRef]
  41. Yan, K.; Wang, Y.; Jia, L.; Wang, W.; Liu, S.; Geng, Y. A content-aware corpus-based model for analysis of marine accidents. Accid. Anal. Prev. 2023, 184, 106991. [Google Scholar] [CrossRef]
  42. Vaswani, A.; Shazeer, N.; Parmar, N.; Uszkoreit, J.; Jones, L.; Gomez, A.N.; Kaiser, Ł.; Polosukhin, I. Attention is all you need. In Proceedings of the 31st International Conference on Neural Information Processing Systems, Long Beach, CA, USA, 4–9 December 2017; pp. 6000–6010. [Google Scholar]
  43. Kenton, J.D.M.-W.C.; Toutanova, L.K. Bert: Pre-training of deep bidirectional transformers for language understanding. In Proceedings of the 2019 Conference of the North American Chapter of the Association for Computational Linguistics: Human Language Technologies, Volume 1 (Long and Short Papers), Minneapolis, MN, USA, 2–7 June 2019; pp. 4171–4186. [Google Scholar]
  44. Lv, S.; Lu, S.; Wang, R.; Yin, L.; Yin, Z.; AlQahtani, S.A.; Tian, J.; Zheng, W. Enhancing Chinese Dialogue Generation with Word–Phrase Fusion Embedding and Sparse SoftMax Optimization. Systems 2024, 12, 516. [Google Scholar] [CrossRef]
  45. Gers, F.A.; Schmidhuber, J.; Cummins, F. Learning to forget: Continual prediction with LSTM. Neural Comput. 2000, 12, 2451–2471. [Google Scholar] [CrossRef] [PubMed]
  46. Han, J.; Kamber, M.; Pei, J. 6-mining frequent patterns, associations, and correlations: Basic concepts and methods. Data Min. Concepts Tech. 2012, 243–278. [Google Scholar] [CrossRef]
  47. Guo, M.; Chen, M.; Yuan, L.; Zhang, Z.; Lv, J.; Cai, Z. Investigation of ship collision accident risk factors using BP-DEMATEL method based on HFACS-SCA. Reliab. Eng. Syst. Saf. 2025, 257, 110875. [Google Scholar] [CrossRef]
  48. Deng, J.; Liu, S.; Shu, Y.; Hu, Y.; Xie, C.; Zeng, X. Risk evolution and prevention and control strategies of maritime accidents in China’s coastal areas based on complex network models. Ocean Coast. Manag. 2023, 237, 106527. [Google Scholar] [CrossRef]
  49. Shi, J.; Liu, Z.; Feng, Y.; Wang, X.; Zhu, H.; Yang, Z.; Wang, J.; Wang, H. Evolutionary model and risk analysis of ship collision accidents based on complex networks and DEMATEL. Ocean Eng. 2024, 305, 117965. [Google Scholar] [CrossRef]
  50. Meng, X.; Li, H.; Zhang, W.; Zhou, X.-Y.; Yang, X. Analyzing ship collision accidents in China: A framework based on the NK model and Bayesian networks. Ocean Eng. 2024, 309, 118619. [Google Scholar] [CrossRef]
  51. Batista, G.E.; Prati, R.C.; Monard, M.C. A study of the behavior of several methods for balancing machine learning training data. ACM SIGKDD Explor. Newsl. 2004, 6, 20–29. [Google Scholar] [CrossRef]
  52. Kobayashi, S. Contextual augmentation: Data augmentation by words with paradigmatic relations. In Proceedings of the 2018 Conference of the North American Chapter of the Association for Computational Linguistics: Human Language Technologies, Volume 2 (Short Papers), Stent, Amanda; 2018; pp. 452–457. [Google Scholar]
  53. Sennrich, R.; Haddow, B.; Birch, A. Improving Neural Machine Translation Models with Monolingual Data. In Proceedings of the 54th Annual Meeting of the Association for Computational Linguistics (Volume 1: Long Papers), Berlin, Germany, 7–12 August 2016; pp. 86–96. [Google Scholar]
  54. Anaby-Tavor, A.; Carmeli, B.; Goldbraich, E.; Kantor, A.; Kour, G.; Shlomov, S.; Tepper, N.; Zwerdling, N. Do not have enough data? Deep learning to the rescue! In Proceedings of the AAAI Conference on Artificial Intelligence, New York, NY, USA, 7–12 February 2020; pp. 7383–7390. [Google Scholar]
  55. Ousidhoum, N.; Lin, Z.; Zhang, H.; Song, Y.; Yeung, D.-Y. Multilingual and Multi-Aspect Hate Speech Analysis. In Proceedings of the 2019 Conference on Empirical Methods in Natural Language Processing and the 9th International Joint Conference on Natural Language Processing (EMNLP-IJCNLP), Hong Kong, China, 3–7 November 2019; pp. 4675–4684. [Google Scholar]
  56. Safety ScienceWang, Y.; Fu, S. Framework for Process Analysis of Maritime Accidents Caused by the Unsafe Acts of Seafarers: A Case Study of Ship Collision. J. Mar. Sci. Eng. 2022, 10, 1793. [Google Scholar] [CrossRef]
  57. Maternová, A.; Materna, M.; Dávid, A.; Török, A.; Švábová, L. Human error analysis and fatality prediction in maritime accidents. J. Mar. Sci. Eng. 2023, 11, 2287. [Google Scholar] [CrossRef]
  58. Sotiralis, P.; Ventikos, N.P.; Hamann, R.; Golyshev, P.; Teixeira, A. Incorporation of human factors into ship collision risk models focusing on human centred design aspects. Reliab. Eng. Syst. Saf. 2016, 156, 210–227. [Google Scholar] [CrossRef]
  59. Fan, S.; Blanco-Davis, E.; Fairclough, S.; Zhang, J.; Yan, X.; Wang, J.; Yang, Z. Incorporation of seafarer psychological factors into maritime safety assessment. Ocean Coast. Manag. 2023, 237, 106515. [Google Scholar] [CrossRef]
  60. Dominguez-Péry, C.; Vuddaraju, L.N.R.; Corbett-Etchevers, I.; Tassabehji, R. Reducing maritime accidents in ships by tackling human error: A bibliometric review and research agenda. J. Shipp. Trade 2021, 6, 20. [Google Scholar] [CrossRef]
  61. Jiang, M.; Lu, J. Maritime accident risk estimation for sea lanes based on a dynamic Bayesian network. Marit. Policy Manag. 2020, 47, 649–664. [Google Scholar] [CrossRef]
  62. Zhang, L.; Wang, H.; Meng, Q.; Xie, H. Ship accident consequences and contributing factors analyses using ship accident investigation reports. Proc. Inst. Mech. Eng. Part O J. Risk Reliab. Eng. Syst. Saf. 2019, 233, 35–47. [Google Scholar] [CrossRef]
  63. Qu, X.; Meng, Q.; Suyi, L. Ship collision risk assessment for the Singapore Strait. Accid. Anal. Prev. 2011, 43, 2030–2036. [Google Scholar] [CrossRef]
  64. Li, H.; Zhou, K.; Zhang, C.; Bashir, M.; Yang, Z. Dynamic evolution of maritime accidents: Comparative analysis through data-driven Bayesian Networks. Ocean Eng. 2024, 303, 117736. [Google Scholar] [CrossRef]
  65. Chang, Y.-T.; Park, H. The impact of vessel speed reduction on port accidents. Accid. Anal. Prev. 2019, 123, 422–432. [Google Scholar] [CrossRef]
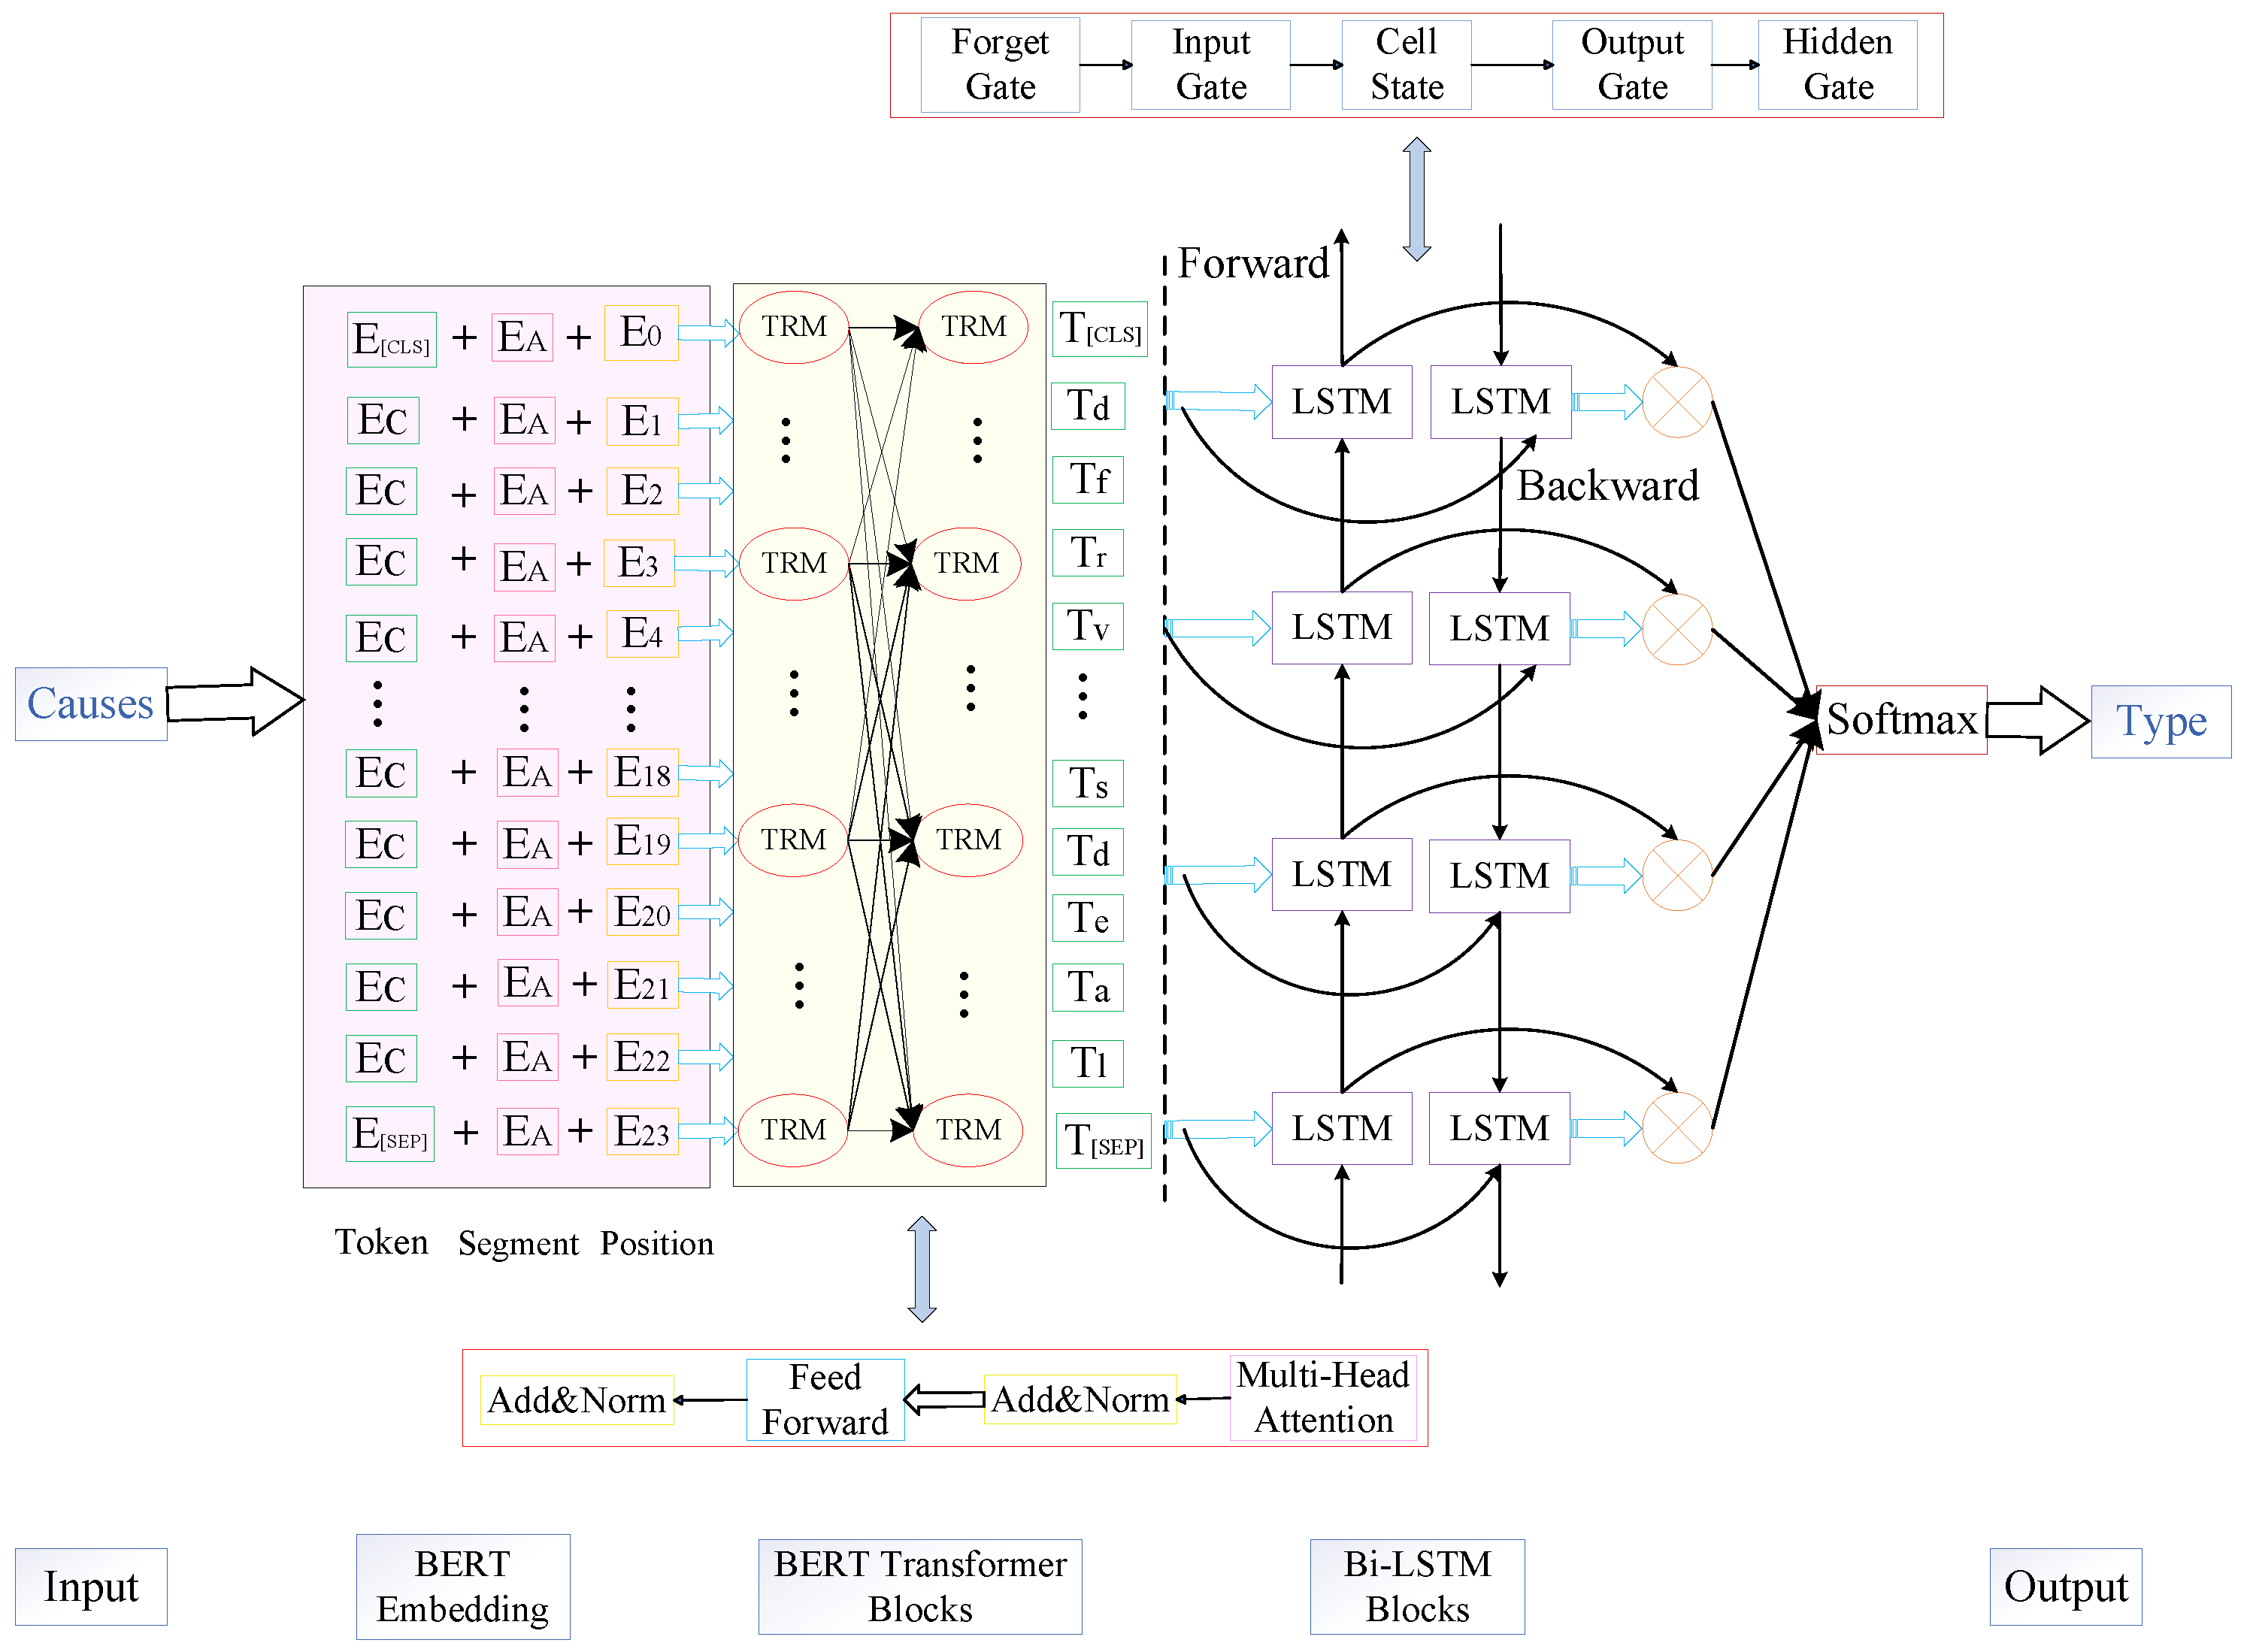
Figure 1. Model structure.
Systems 13 00284 g001
Figure 2. Association rules flowchart.
Systems 13 00284 g002
Figure 3. Research framework chart.
Systems 13 00284 g003
Figure 4. Data processing.
Systems 13 00284 g004
Figure 5. Word cloud diagram (a), Cause classification (b).
Systems 13 00284 g005
Figure 6. Gradient L2 norm change.
Systems 13 00284 g006
Figure 7. BERT + BiLSTM model accuracy (a) and loss (b).
Systems 13 00284 g007
Figure 8. BERT + BiLSTM model confusion matrix.
Systems 13 00284 g008
Figure 9. Classification of accident causes.
Systems 13 00284 g009
Figure 10. Sankey diagram.
Systems 13 00284 g010
Figure 11. Association rule threshold selection: changes in support (a) and changes in confidence (b).
Systems 13 00284 g011
Figure 12. Function of association rule module.
Systems 13 00284 g012
Figure 13. BERT model accuracy (a) and loss (b).
Systems 13 00284 g013
Figure 14. BERT+ Pooling Mechanism model accuracy (a) and loss (b).
Systems 13 00284 g014
Figure 15. Comparison of obfuscation matrices for BERT (a) and pooling mechanisms (b).
Systems 13 00284 g015
Figure 16. Association rule chart.
Systems 13 00284 g016
Figure 20. Accident level distribution: day (a) and night (b).
Systems 13 00284 g020
Figure 21. Heat map of accident.
Systems 13 00284 g021
Figure 22. Types of accidents and statistics on the number of dead and missing.
Systems 13 00284 g022
Figure 23. Seasonal chart.
Systems 13 00284 g023
Table 1. Literature summary.
Research ClassificationObject of Primary ConcernMethodologyResearch Focus
Subjective FactorHuman factor, Management factorCase Study, Quantitative Analysis of HFACS, Structural Equation Modeling, Causality Analysis, and Statistical Analysis.The critical role of human error and management deficiencies in accidents is analyzed, and the interplay among multiple factors is elucidated.
Objective FactorShip factor, Environmental factorStatistical Data Analysis, Correlation Analysis, Empirical Analysis, Case Study Analysis, and Comprehensive Statistical Evaluation.Analyze the influence of mechanical failures and environmental factors, such as low visibility, on the occurrence and severity of accidents.
Traditional Analysis MethodsComprehensive Analysis of Accident RiskFormal Security Assessment Method, Regression Model, Causal Model Combined with Cluster Analysis.Assess accident risks and propose a conventional methodology for systemic risk management and accident prevention.
Data-driven ModelsMultifactor Comprehensive AnalysisBayesian Networks (BNs) and Their Optimization Methodologies, Fuzzy SWOT AHP, Reason-SHEL, DEMATEL.Characterize and assess the complex interrelationships among factors involved in accidents to minimize subjective bias. Conduct dynamic analyses of human factors and causal mechanisms in accidents to systematically explore multi-factor interactions.
Deep LearningAccident Text Information ExtractionFeature Extraction and Knowledge Mapping.Improve the accuracy of accident risk prediction, achieve the extraction of information from accident report texts, and enable efficient identification of causal relationships.
Table 2. Environment configuration.
HeadingConfiguration Information
Operating systemWindows 11
Programming languagePython 3.9
Experimental platformJupyter Notebook
GPUGeForce RTX4060Ti (8G)
CPUInter Core i5-12400F
Deep Learning FrameworkPyTorch (CUDA 12.4)
Table 3. Parameter analysis.
CategoriesParametersTest Loss RateTest AccuracyDifference in Loss
Grads2.50.6750.8850.28
2.750.4670.8980.26
30.6950.8750.43
Hidden layer640.6450.8900.49
1280.4670.8980.26
2560.7000.8880.68
Batchsize160.7080.8830.56
320.4670.8980.26
640.6480.8890.41
Droupout0--0.83
1--0.67
2--0.26
Regularization1--0.54
2--0.26
Table 4. Degree centrality ranking.
Sort NumberThe Specific Cause of the AccidentDegree Centrality
1Mismanagement by the shipowner or company0.9677
2Improper operation0.8710
3Weak safety awareness0.8710
4Unfit crew0.8387
5Inadequate command of the ship’s master0.8387
6Rough sea state0.6774
7Inadequate manning0.6452
8Vessel unseaworthy0.6129
9Poor communication0.6129
10Negligent lookout0.6129
Table 5. Confidence of two-factor correlation.
Sort NumberCause CombinationLiftConfidenceSupport
1Failure to use safe speed -> Negligent lookout2.230.810.13
2Signals not given as required -> Negligent lookout2.220.800.07
3Failure to fulfill ship’s obligations -> Negligent lookout2.130.770.09
4Pilot at fault -> Inadequate command of the ship’s master3.490.760.01
5Illegal modifications -> Mismanagement by the shipowner or company2.450.760.01
Table 6. Confidence of multi-factor correlation.
Sort NumberCause CombinationLiftConfidenceSupport
1Inadequate manning, Improper operation, Failure to use safe speed -> Negligent lookout2.7710.01
2Vessel unseaworthy, Signals not given as required -> Improper operation2.330.920.01
3Poor communication, Failure to fulfill ship’s obligations -> Improper operation2.330.920.01
4Pilot at fault, Improper operation -> Inadequate command of ship’s master4.10.900.01
5Signals not given as required, Failure to use safe speed -> Negligent lookout2.470.890.03
Table 7. Lift of two-factor correlation.
Sort NumberCause CombinationLiftConfidenceSupport
1Work through fatigue -> Improper use of equipment4.290.530.01
2Illegal modifications -> Vessel unseaworthy3.730.370.01
3Inadequate safety management system -> Lack of training3.500.270.02
4Lack of training -> Inadequate safety management system3.500.200.02
5Pilot at fault -> Inadequate command of the ship’s master3.490.760.01
Table 8. Lift of multi-factor correlation.
Sort NumberCause CombinationLiftConfidenceSupport
1Inadequate command of ship’s master, Improper operation -> Pilot at fault9.070.150.01
2Pilot at fault -> Inadequate command of ship’s master, Improper operation9.070.530.01
3Vessel unseaworthy, Improper operation -> Signals not given as required, Unfit crew8.560.170.01
4Signals not given as required, Unfit crew -> Vessel unseaworthy, Improper operation8.560.270.01
5Signals not given as required, Vessel unseaworthy -> Unfit crew, Improper operation7.950.580.01
Table 9. Model parameter settings.
ParameterBERTPooling Mechanism + BERTBERT + BiLSTM
Hidden LayerBERT layer 512BERT layer 512LSTM layer 128
Learning Rate1 × 10−61 × 10−61 × 10−6
Dropout Layer332
L1 Regularization1 × 10−81 × 10−85 × 10−10
L2 Regularization0.050.010.05
Gradient2.353.52.75
OptimizerAdamWAdamWAdamW
Activation FunctionGELUMishMish
Batchsize323232
Table 10. Model indicator comparison.
ModelBERTBERT + BiLSTMBERT + Pooling Mechanism
Evaluation
Indicators
PrecisionRecallF1-ScorePrecisionRecallF1-ScorePrecisionRecallF1-Score
Cause
Inadequate manning0.9250.9410.9330.9270.9500.9380.9170.9410.929
Signals not given as required0.9340.9260.9300.9440.9750.9590.8890.9180.903
Complex waterway0.9320.9240.9280.9110.9420.9260.9090.9240.917
Weak safety awareness0.8210.7860.8030.8210.8420.8310.8360.8290.833
Inadequate safety management system0.8570.8930.8740.8760.9340.9040.8750.8680.871
Improper shore-based command0.9400.9820.9600.9670.9830.9750.9320.9820.956
Pilot at fault0.9490.9740.9610.9750.9920.9830.9490.9740.961
Rough sea state0.8460.8250.8350.8800.8370.8580.8570.8100.833
Unforeseen0.9270.9350.9310.9430.9910.9670.9110.9190.915
Improper operation0.6560.6720.6640.7550.6420.6940.7200.6970.708
Failure to use safe speed0.9420.9500.9460.9750.9580.9660.9340.9500.942
Failure to fulfill ship’s obligations0.8820.9130.8970.9060.8980.9020.8810.9040.893
Poor communication0.9200.8880.9040.9100.9250.9170.8890.8970.893
Improper storage of goods0.9580.9270.9430.9740.9250.9490.9490.8950.921
Work through fatigue0.9510.9590.9550.9910.9580.9750.9360.9670.951
Negligent lookout0.8130.8770.8440.8710.9000.8850.8410.8330.837
Lack of training0.8620.9330.8960.9020.9250.9140.8750.9330.903
Poor visibility0.9570.9330.9450.9580.9660.9620.9330.9410.937
Mismanagement by the shipowner or company0.8580.7580.8050.8570.8000.8280.8470.7830.814
Unfit crew0.9130.8750.8940.8930.9080.9010.9220.8830.902
Vessel unseaworthy0.8910.8550.8720.8360.8080.8220.8740.8390.856
Vessel Damage0.8540.8820.8680.8550.8330.8440.8600.8740.867
Inadequate command of the ship’s master0.8210.8630.8420.8410.8690.8550.8210.8630.842
Improper planning0.8460.8670.8560.8330.9170.8730.8250.8670.846
Improper use of equipment0.8910.7200.7960.8630.7390.7960.8450.7440.791
Equipment failure0.8610.8820.8710.8560.8420.8490.8600.8740.867
Inadequately equipped facilities0.9190.9190.9190.9020.9250.9140.9240.8870.905
Improper stowage of cargo0.9390.9070.9220.8950.9410.9170.9050.8900.897
Overloading0.8830.9340.9080.9500.9580.9540.8830.9340.908
Improper protection checks0.8580.8790.8690.8280.8420.8350.8500.8710.861
Illegal operation0.8810.9020.8920.8740.9250.8990.8930.8860.890
Illegal modifications0.9150.9150.9150.9550.8910.9220.9060.8980.902
Accuracy0.8870.8870.8870.8980.8980.8980.8830.8830.883
Macro avg0.8880.8870.8870.8980.8980.8970.8830.8840.883
Weighted avg0.8870.8870.8860.8980.8980.8970.8830.8830.882
Table 11. Accident classification criteria.
Accident LevelNumber of Deaths (Missing)Number of InjuredDirect Economic Losses
Extraordinary major accidentsMore than 30 peopleMore than 100 peopleMore than 100 million RMB
Serious accidentsMore than 10 people but less than 30 peopleMore than 50 people but less than 100 peopleMore than 50 million RMB and less than 100 million RMB
Major accidentMore than 3 people but less than 10 peopleMore than 10 people but less than 50 peopleMore than 10 million RMB and less than 50 million RMB
General accidentsMore than 1 person but less than 3 peopleMore than 1 person but less than 10 peopleLess than 10 million RMB
Table 12. Comparison with existing studies.
Research TopicsTraditional Methods/Current SituationImprovement Method (This Article)Comparison and Improvement
Data processingQuantitative risk analysis [58], relies on structured data and preset parameters [59].Enhancing the BERT model to directly extract deep semantic information from unstructured accident reports.BERT offers a profound understanding of textual data, particularly in capturing complex causal relationships, thereby significantly enhancing the analysis of unstructured text [43,55].
Classification of accident causesMost studies employ structural rule analysis techniques, resulting in findings that tend to be relatively generalized.Automatic classification is achieved using deep learning models that address four primary factors—human, management, ship, and environment—encompassing a total of 32 subcategories.The classification granularity is refined, and when combined with data enhancement techniques, the model’s coverage and accuracy are improved, thereby providing more targeted data support for accident prevention measures [6].
Accident cause analysisPrevious studies have predominantly emphasized human error as the primary cause of maritime accidents [7,60]. Most research relies on single-factor analysis and employs Bayesian network analysis for risk assessment; however, these approaches lack a comprehensive multi-factor perspective [12,23,61].Building on the BERT model, accident cause classification is refined and integrated with the Apriori association rule algorithm, thereby revealing the complex interactions among multiple factors and generating high-confidence association rules.The in-depth analysis of human factors was further refined, emphasizing the critical role of safety awareness [62]. Additionally, a range of integrated solutions were proposed to address combined issues, such as the interplay between fatigue and equipment failure, as well as the link between illegal modifications and ship unseaworthiness [63,64].
Accident trend researchBased on simple distribution analyses, research on the differences between accident types and regions remains limited [6].Visualization analysis—including heat maps and seasonal trend maps—reveals the distribution patterns of accident types, temporal trends, and regional characteristics.Nighttime accidents are predominantly concentrated in coastal areas. Shipwrecks occur more frequently during winter, whereas collisions are more common in summer and autumn. These observations have led to the proposal of management recommendations that are both time-based and area-specific [16,65].
Innovation and advantagesTraditional risk analysis methods, such as Bayesian networks and FSA, provide limited support for association rule generation, which hampers the capacity for dynamic analysis [21,58].The improved BERT model delivers deep semantic understanding and enables the automatic classification of diverse accident causes.This paper excels in dynamic data mining, effectively integrating it with semantic analysis to substantially enhance the comprehensive management of multiple factors.
Disclaimer/Publisher’s Note: The statements, opinions and data contained in all publications are solely those of the individual author(s) and contributor(s) and not of MDPI and/or the editor(s). MDPI and/or the editor(s) disclaim responsibility for any injury to people or property resulting from any ideas, methods, instructions or products referred to in the content.