Article

Coupling Coordination Evaluation and Optimization of Water–Energy–Food System in the Yellow River Basin for Sustainable Development

1
School of Economics, Management, and Law, Shandong Institute of Petroleum and Chemical Technology, Dongying 257061, China
2
School of Economics and Management, China University of Petroleum (East China), Dongying 257099, China
3
School of Management, Universiti Sains Malaysia, 118000 Gelugor, Malaysia
4
International Business College of Sdtbu, Shandong Technology and Business University, Yantai 265600, China
5
School of Economics and Management, North University of China, Taiyuan 030051, China
*
Authors to whom correspondence should be addressed.
Systems 2025, 13(4), 278; https://doi.org/10.3390/systems13040278
Submission received: 28 February 2025 / Revised: 17 March 2025 / Accepted: 19 March 2025 / Published: 10 April 2025

Abstract

:
Understanding the coupling mechanisms and coordinated development dynamics of the water–energy–food (WEF) system is crucial for sustainable river basin development. This study focuses on the Yellow River Basin, conducting a comprehensive analysis of the system’s coupling mechanisms and influencing factors. A structured evaluation framework is established, integrating the entropy weight–TOPSIS method, the coupling coordination degree model, and spatial correlation analysis. Empirical analysis is conducted using data from nine provinces (regions) along the Yellow River from 2003 to 2022 to assess the spatiotemporal evolution of the coupling coordination level. The Tobit regression model is employed to quantify the impact of various factors on the system’s coupling coordination degree. Results indicate that the comprehensive evaluation index of the WEF system in the Yellow River Basin exhibits an overall upward trend, with the system coupling degree remaining at a high level for an extended period, up from 0.231 to 0.375. The interdependence among the three major systems is strong (0.881–0.939), and while the coupling coordination degree has increased over time despite fluctuations, a qualitative leap has not yet been achieved. The evaluation index follows a spatial distribution pattern of midstream > downstream > upstream, characterized by a predominantly high coupling degree. However, the coordination degree frequently remains at a forced coordination level or below, with a general trend of midstream > downstream > upstream. From 2003 to 2008, a positive spatial autocorrelation was observed in the coupling and coordinated development of the WEF system across provinces, indicating a strong spatial agglomeration effect. By 2022, most provinces were clustered in “high-high” and “low-low” areas, reflecting a positive spatial correlation with minimal regional differences. Key factors positively influencing coordination include economic development levels, industrial structure upgrading, urbanization, and transportation networks, while technological innovation negatively affects the system’s coordination. Based on these findings, it is recommended to strengthen balanced economic development, optimize the layout of industrial structures, improve the inter-regional resource circulation mechanism, and promote the deep integration of technological innovation and production practices to address the bottlenecks hindering the coordinated development of the water–energy–food system. Policy recommendations are proposed to provide strategic references for the sustainable socioeconomic development of the Yellow River Basin, thereby achieving the high-quality coordinated growth of the water–energy–food system in the region.

1. Introduction

Water, energy, and food are three fundamental resources thar are essential for human survival and socioeconomic development. These resources collectively maintain ecological balance by regulating hydrological cycles, carbon emissions, and land productivity, while supporting economic growth and societal stability. The Yellow River Basin, often referred to as the “Mother River” of China, serves not only as a crucial grain-producing area and major energy base but also as an important region for water resource distribution. In the context of the Yellow River Basin, water resource allocation and utilization require significant energy inputs for transportation and purification. Similarly, energy extraction, storage, and processing are highly dependent on water availability. Furthermore, food production requires not only water resource irrigation but also energy-driven agricultural machinery and fertilizer inputs. This intricate resource-coupling relationship plays a pivotal role in the sustainable development of the Yellow River Basin. The Yellow River Basin spans nine provinces, where the utilization of water resources, energy development, and food production are interconnected and mutually influential. Assessing the coupling coordination level across different provinces is crucial for optimizing resource allocation and improving overall system efficiency.
Experts and scholars have conducted research on integrated systems such as those of water, energy, and food. Yang et al. studied the Yangtze River Economic Belt and found that regional economic agglomeration and transportation network optimization significantly enhance system coordination [1]. Afkhami et al. [2] observed in their research on arid regions of Africa that delays in technology transfer may lead to local imbalances in resource utilization efficiency. Chang et al. [3] emphasized in their study of the Hebei Province in China that technological innovation can enhance system coordination by promoting the diffusion of water-saving technologies. Existing research on the water–energy–food system mainly focuses on individual resource systems or the bilateral relationships between two resource systems, with limited systematic studies on the overall interconnections of the water–energy–food system.
Therefore, this study constructs a comprehensive evaluation index system to quantify the spatiotemporal dynamics of WEF coupling coordination in the Yellow River Basin and identifies key influencing factors through econometric modeling, providing targeted policy recommendations for sustainable resource management. The specific research framework is shown in Figure 1.

2. Literature Review

2.1. Research on the Concept and Relationships of the Water–Energy–Food System

The study of the WEF system [4] and its relationships has evolved into a multidisciplinary research domain that continues to expand. The conceptual development of the WEF system emerged in response to escalating global challenges, including population growth, resource depletion, ecosystem degradation, and increasing social and environmental pressures [5]. As a result, research on the WEF system primarily focuses on environmental and resource management, as well as governance strategies. Early studies emphasized macro-level management approaches, aiming to establish a foundational theoretical framework for understanding the complex interactions within the WEF nexus. Mehdi R [6] proposed establishing a sustainable decision support system based on the WEF security nexus, emphasizing the importance of collaborative governance among the three sectors for resource sustainability.
In order to further study the WEF resource allocation strategy, the water–energy–food relationship was first understood. As research advanced, the focus shifted towards optimizing WEF resource allocation at multiple scales, including national, watershed, regional, and urban levels. This phase of inquiry has explored various dimensions, such as biodiversity conservation, system vulnerability, and vital influencing factors, aimed at formulating strategies for efficient resource utilization and sustainable management.
The interdependencies among water, energy, and food are well documented in the literature. The relationship between water and energy is characterized by a bidirectional dependency: energy is required throughout the processes of extraction, transportation, and the treatment of water, while water is essential for energy development [7]. Many energy-intensive industries, such as thermal power, coal mining, and chemical production, consume large amounts of water. At the same time, hydropower, an important renewable energy source, is directly influenced by the availability and distribution of water resources.
Similarly, the water–food relationship highlights the critical role of water in agricultural production [8]. Khataar M et al. [9] took wheat and beans as experimental subjects and studied the effects of soil matric potential and salinity on their water use, water use efficiency, and the yield response factor in sandy loam and clay loam under greenhouse conditions. By analyzing the changes in various indicators under different conditions and the high correlation between the stem/root ratio and water use efficiency, they demonstrated that there is a close relationship between water use efficiency and crop yield, etc. Increased access to water resources enhances agricultural productivity, while water scarcity constrains food production.
The energy–food relationship has increasingly become relevant with the modernization of agriculture, as energy-intensive technologies have become integral to food production [10]. Hou Y et al. [11] integrated the relationship among the three systems with the spatial distribution characteristics and coordinated development mechanisms of the WEF complex system in the Yellow River Basin, proposing regional adaptation strategies to achieve efficient resource utilization and ecological economic balance.
Despite existing research on coupling coordination, this study reveals the temporal and spatial evolution patterns of the coordination among the three major systems in the Yellow River Basin. In terms of temporal analysis, it breaks through previous static or short-term studies by employing a 20-year time series (2003–2022) and comparing policy phases, identifying the policy lag effect and long-term evolution inflection points. For spatial analysis, it extends prior provincial distribution descriptions into a comprehensive spatial correlation network across the entire basin and quantifies spillover effects, demonstrating the inter-regional linkage of coordination. Compared to previous subjective weighting methods, such as the analytic hierarchy process (AHP), this study adopts the entropy weight–TOPSIS method, reducing subjectivity and enhancing result robustness. In addition, the growing reliance on biofuels as an alternative energy source has introduced new challenges, as the large-scale use of food crops for biofuel production may lead to significant changes in the agricultural industry’s structure, exacerbate food security concerns, and disrupt food supply chains [12]. Excessive agricultural water use complicates resource management by threatening long-term water security.
The WEF system operates as a highly interconnected and dynamically coupled feedback mechanism [13]. The extraction, production, and consumption of energy and food are highly dependent on water resources. Similarly, water-related processes, including extraction, distribution, wastewater treatment, and recycling, require significant amounts of energy [14]. Furthermore, food production not only relies on energy-intensive inputs but holds enormous potential for biomass energy development.
To enhance energy efficiency, Wang R et al. [15] analyzed the complex interactions between the WEF system and energy ecological efficiency, revealing the driving role of industrial structure adjustment in energy conservation and emission reduction, as well as optimization pathways. A fragmented or isolated approach to managing any single component within the WEF coupling system often results in inefficient resource utilization and weak system coordination. For example, Yin Rumeng [16] found that this limitation can lead to resource misallocation, localized waste, and heightened risks to food and energy security, severely threatening the sustainable development of the economy and society. To mitigate risks, Tian Z et al. [17] proposed policy recommendations for regional and high-quality development to address the limitations of the WEF system.
Future research is expected to place greater emphasis on the analysis of internal dynamics and external influences on the WEF coupling system [1]. Internal system analysis will focus on reliability, synergy, and correlations, with an emphasis on quantifying interactions within the system. External analysis will account for natural factors, such as climate change, extreme weather, and natural disasters, as well as social factors like urbanization, economic globalization, and land use changes [18]. Dengyu Y et al. [19] developed an evaluation index system from the perspectives of structure and efficiency, employing the entropy weight method to determine weights and using logarithmic forms to comprehensively assess the development levels of various systems. They also analyzed the coupling coordination degree of the WEF system, although their approach had certain limitations in terms of index selection and eliminating dimensional influences. Future studies will also aim to develop more comprehensive and integrated models that consider the interactions between water, energy, and food to enhance predictive accuracy and provide practical policy guidance.
Despite these advancements, several challenges persist in WEF research. Studies relying on total water usage metrics overlook critical issues related to water quality, hydropower sustainability, and food production [20]. Poor water quality in certain regions adversely affects agricultural production and water resource efficiency [21]. In addition, hydropower development may disrupt river ecosystems [22], while unregulated water extraction for agricultural purposes can lead to groundwater depletion and soil salinization. Furthermore, policy frameworks governing water, energy, and food systems remain relatively fragmented both domestically and internationally. Traditional resource economics and existing global governance structures are increasingly inadequate in addressing the complex interdependencies within the WEF coupling system [23]. Specific policies include rigid constraints and the optimal allocation of water resources, improving the unified management mechanism of river basins, attaching equal importance to agricultural production and water saving, adjusting the crop planting structure, promoting the green and low-carbon transformation of the Yellow River Basin, strengthening the link between the coordinated management of water, energy, food, and ecology, accelerating the low-carbon transformation of industries in the Yellow River Basin, and improving the economical use of land and water resources. We will accelerate the establishment of a coordinated security system for water–energy–food links in the Yellow River Basin, and establish a “water–energy–food” framework with the efficient use of water resources as the core. The lack of integrated governance mechanisms poses significant challenges to the coordinated and sustainable development of these resources [24].
As research on the WEF system continues to evolve, future studies will place greater emphasis on analyzing the internal characteristics and external influences of the system, developing more comprehensive models, and improving policy coordination [3]. Strengthening governance frameworks and fostering interdisciplinary collaboration will be essential for addressing challenges in resource management and ensuring sustainable development [25].

2.2. Research on the Operational Characteristics and Development Trends of the Water–Energy–Food System

Water resources serve as a vital foundation for the stable development of both energy and food systems [2]. Their movement generally follows the principle of proximity, flowing from resource-rich regions to resource-scarce areas. However, the spatiotemporal distribution of water resources is highly uneven [26] due to factors such as climate variability and human activities. The high degree of development and utilization has led to the coexistence of resource-based water scarcity and pollution-based water scarcity.
The interdependence of energy production and water availability has been widely acknowledged [27], particularly in the extraction and processing of fossil fuels, which require substantial water inputs. Water scarcity can directly constrain energy production, posing challenges to both conventional and renewable energy sectors. Similarly, food production is highly dependent on water resources, and advances in water-saving irrigation technologies [28] have had a significant impact on agricultural productivity. The movement of food typically follows a supply–demand gradient, transferring from high-yield regions to adjacent or densely populated areas to meet consumption demands. Water scarcity directly affects energy production and food cultivation [29], leading to energy supply constraints and reduced agricultural output. Water quality pollution can also affect food production through irrigation and soil contamination, reducing both yield and quality.
The impact of energy systems on water and food is substantial, as energy production and utilization often require large amounts of water resources, sometimes leading to adverse ecological effects. Fluctuations in energy prices can also influence agricultural production costs, affecting food prices and market stability [30]. Food production exerts pressure on water and energy resources, particularly in irrigation and food processing, where substantial water and water energy inputs are required. The growing global demand for food further intensifies water and energy needs in agriculture.
With increasing population growth and economic development, the demand for water, energy, and food continues to rise, exacerbating resource shortages and intensifying environmental pressures. At the same time, technological advancements and policy guidance have played a crucial role in promoting resource efficiency and sustainable development [31]. Qin G et al. [32] have suggested that the coordination and spatial balance of the WEF system should be analyzed, along with its impact on regional socioeconomic development. A key challenge lies in balancing resource utilization with environmental conservation to achieve long-term sustainability. Additionally, external environmental factors, such as climate change, introduce further uncertainty into the WEF system dynamics, necessitating adaptive management strategies.
To better understand the complex interactions within the WEF system, this study employs a combination of quantitative and qualitative methods to assess coupling and coordination dynamics. Compared to previous studies, this research utilizes the entropy weight method [33] and the analytic hierarchy process [34] to refine index weights, and applies variable fuzzy evaluation models to enhance calculation accuracy and system assessments.
Research on the WEF system is still at a relatively early stage [35], with limited quantitative studies providing comprehensive security assessments of regional water, energy, and food resources. There is a pressing need to further enhance data collection and analysis to improve the reliability of research findings. Ibarra V L [36] compared the application of Material Flow Analysis (MFA) and Life Cycle Assessment (LCA) in evaluating the WEF nexus at the organizational level, thoroughly analyzing the required indicator system for water, energy, and food. Existing evaluation index systems remain incomplete, as they primarily rely on single-factor indicators, lacking a more integrated approach that captures the multi-dimensional nature of WEF interactions. Future research should refine the evaluation index system by incorporating multi-factor indicators such as resource availability, environmental impact, economic considerations, and social dimensions. Moreover, policy support for WEF management remains largely insufficient. Current governance structures offer limited guidance for optimizing WEF interactions, necessitating strengthened policy formulation and implementation to promote the sustainable use of resources and coordinated development.

2.3. Studies on Factors Affecting WEF System Interconnections and Impact

From the perspective of climate change, global warming has intensified the frequency and severity of extreme weather events [37], such as droughts and floods, exacerbating global water scarcity. At the same time, climate change contributes to glacier melt and reduced river runoff, posing further threats to the sustainable use of water resources. The impact of climate change on the energy sector is mainly reflected in changes in energy demand and production. On the one hand, extreme weather events increase energy consumption for cooling and heating. On the other hand, climate change influences the production of renewable energy [38]; for instance, variations in wind speed and light intensity may affect the efficiency of wind and solar power generation.
The impact of climate change on food production is particularly significant. Extreme weather events, such as heat waves, droughts, and floods, can lead to lower agricultural yields, jeopardizing food security. In addition, climate-induced shifts in temperature and precipitation patterns may alter the crop-growing areas and cycles, significantly affecting global food production and distribution.
Economic development is another important factor influencing WEF system interactions [39]. As economies grow, demand for water, energy, and food intensifies, increasing the risk of resource depletion and environmental degradation. At the same time, economic development also influences technological advancements and financial investments in water resource management, energy development, and food production. In more-developed regions, greater adoption of advanced technologies and efficient management practices can improve resource utilization efficiency, alleviating the pressure on the water–energy–food systems. Conversely, in less-developed regions, inadequate infrastructure and financial constraints may exacerbate resource inefficiencies and environmental pressures.
Land resources serve as the foundation of food production and play an important role in water resources and energy management. The availability and quality of land resources directly affect agricultural yields and food security. Land use practices also affect the sustainability of water and energy resources [40]. For example, excessive agricultural expansion may lead to issues such as land degradation, water pollution, and limitations in energy development. Therefore, the rational use of land resources and the protection of the ecological environment are essential to achieve the coordinated development of the WEF system.
While numerous studies have explored the impacts of climate change, economic development, and land use on WEF interconnections, significant research shortcomings remain. One major limitation is the lack of a systematic approach. Existing research mainly focuses on individual resource systems or bilateral interactions, failing to comprehensively examine the complex interdependencies within the WEF system. This limits the understanding of transmission mechanisms and feedback loops among system components. The absence of dynamic feedback mechanisms makes it difficult to translate research findings into effective policy recommendations.
Furthermore, the evaluation indicator system for WEF security remains underdeveloped. Existing frameworks mainly rely on single-factor indicators, lacking multi-dimensional metrics that reflect the overall dynamics of the system. This limits the ability to conduct comprehensive assessments of WEF security and resilience. Addressing these limitations requires a more integrated research approach, improved data collection methodologies, and the incorporation of dynamic feedback mechanisms to enhance both analysis and policy implementation.

3. Theoretical Analysis

The water–energy subsystem is a fundamental requirement for the interdependent energy and food systems (see Figure 2). Water resources are essential for agricultural production, supplying irrigation through agricultural water input and precipitation. Additionally, water systems regulate these inputs to create optimal conditions for crop growth. The efficient operation of water distribution networks ensures adequate irrigation, thereby maintaining both the yield and quality of agricultural output. Beyond agriculture, water resources are vital for industrial processes, providing essential inputs that support production activities and promote economic development.
The energy subsystem serves as the driving force of socioeconomic systems. It is indispensable in agricultural mechanized production and industrial production processes, enhancing operational efficiency and facilitating technological innovation. Furthermore, the energy system is closely linked to the water distribution network, jointly supplying the necessary resources for the food subsystem.
The food subsystem is directly influenced by the water and energy subsystems, relying on these resources for crop cultivation, maturation, harvesting, and processing. In addition, it plays a crucial role in energy production by supplying raw materials, such as corn and wheat, for biomass energy. The integration of scientific agricultural practices and modern technologies has supported enhanced productivity in the food sector, while the sale of agricultural products for biomass energy facilitates resource recycling and promotes sustainable economic development.
Water–food–energy coupling can promote sustainable development. Zhang Ming [41] points out that to improve the efficiency of resource utilization, the optimal management of the water–food–energy coupling system can improve the efficiency of water resources’ utilization, reduce waste, and promote energy saving and consumption reduction in energy and food production. This will help to alleviate the shortage of resources and provide a solid resource base for sustainable development. To enhance the anti-risk ability of the system, the coordinated and safe development of the water–food–energy coupling system aims to improve the efficiency of resource flow and transformation through internal supply-and-demand balance and the optimization of external resource allocation. At the same time, with the help of social and government regulation, the system’s ability to resist external interference, such as the impact of natural disasters such as weather change and extreme weather, ensures the stability and sustainability of the system. The system aims to promote the improvement of economic and social benefits, and the optimization of the management of the water–food–energy coupling system can also promote the improvement of economic and social benefits. Through the rational allocation of resources, it can promote the development and innovation of related industries, and create more employment opportunities and economic benefits. At the same time, by improving the efficiency of resource utilization and reducing pollution emissions, the quality of the ecological environment and people’s living standards and happiness can also be improved. Ye Jing [42] proposed to promote coordinated regional development, and targeted sustainable development strategies can be formulated according to the resource endowment and development characteristics of different regions. For example, in the northwest resource-rich area, the water shortage can be alleviated through a water diversion project and water rights trading; in the Beijing–Tianjin–Hebei groundwater extraction area, the food security layout can be optimized and the coordinated regulation of water and energy can be strengthened. These measures can help to promote coordinated regional development and achieve win–win economic, social, and environmental outcomes.
The coupled water–food–energy system has a significant promotion effect on sustainable development [43]. By optimizing the management system, the efficiency of resource utilization can be improved, the system risk-resistance ability can be enhanced, the economic and social benefits can be promoted, and the regional coordination of development can be promoted. Therefore, in future development, great attention should be paid to the construction and optimization of a water–food–energy coupling system to provide a strong guarantee for the realization of sustainable development goals.

4. Study Method Design

4.1. Construction of the Index System

Building on the theoretical framework of the WEF system, an evaluation index system is constructed to assess the coupled and coordinated development of the Yellow River Basin (see Table 1). The selection of indicators is based on existing research [44] and categorizes water and energy system indicators into three dimensions: total amount, structure, and benefits. The food system indicators are classified into production, circulation, and consumption.

4.2. Entropy Weight–TOPSIS Method Model

To minimize the impact of variations in internal and external environments, the entropy method is employed to determine the objective weights of each evaluation index, enhancing the comparability of results. The entropy weight method quantifies the degree of variation in each indicator by calculating its entropy value; the greater the variation, the more information the indicator provides, and the greater its assigned weight. The TOPSIS method evaluates the relative advantages and disadvantages by calculating the distance between the evaluation object and the positive and negative ideal solutions. By combining the entropy weight method and the TOPSIS method, this approach effectively mitigates biases associated with subjective weighting while ensuring data objectivity and evaluation comprehensiveness.
However, the entropy weight–TOPSIS method also has certain limitations, such as a high sensitivity to data standardization and an inability to handle nonlinear relationships. In this study, to effectively eliminate the impact of environmental variations on evaluation results, the entropy method is used to determine the objective weights of each evaluation indicator, enhancing result comparability. The entropy weight–TOPSIS model is used to calculate the comprehensive development level of each subsystem, with the water system serving as an example for model introduction.
Considering the differences in dimensions, magnitudes, and directional effects of the indices, data standardization is performed using the range method, as defined by the following equations:
For positive indicators:
x i j = x i j m i n x j m a x x j m i n x j
For negative indicators:
x i j = m a x x j x i j m a x x j m i n x j
Weight determination is a crucial aspect of the WEF nexus evaluation. While subjective and objective assignment methods exist, the objective approach assigns weights based on the information entropy of each index, reflecting its variation. Here, the entropy method is used to determine weights, ensuring an unbiased representation of index significance.
The proportion of the value of the i-th region in the j-th index is calculated by the following:
Y i j = x i j / i = 1 m x i j
The information entropy is computed using the following expression:
e j = k i = 1 m ( Y i j × ln Y i j ) where   k = 1 ln m ,   0     e j     1 .
The redundancy of information entropy is then calculated using the following:
d j = 1 e j
The weight of the indicators is given by the following:
W i = d i / j = 1 n d j
The final score for the evaluation of individual indicators is as follows:
R i j = W i × X i j
The positive and negative ideal solutions are defined by the following:
Positive   Ideal   Solution :   S + = S 1 + , S 2 + , , S n +
Negative   Ideal   Solution :   S = S 1 , S 2 , , S n
In the calculation formula, S j + = m a x R 1 j , R 2 j , , R n j , S j = m i n R 1 j , R 2 j , , R n j .
The Euclidean distance of each evaluation object to the positive ideal solution and the negative ideal solution is calculated using the following formula:
O i + = j = 1 n ( S i j + R i j ) 2
O i = j = 1 n ( R i j S i j ) 2
The relative proximity of each evaluation strategy to the optimal solution C i is as follows:
W i = O i O i + + O i
where x i j is the standardized value of the j-th indicator in the i-th region; x i j is the value of the j-th evaluation index for the i-th region; m i n ( x j ) and m a x ( x j ) are the minimum and maximum values of the j-th indicator in the region, respectively; m is the number of regions for evaluation, and n is the number of indicators. As P i approaches 1, the evaluation object approaches the optimal evaluation level. According to this approach, the comprehensive evaluation values of the energy subsystem and the food subsystem for each province (region) are E y and F z , respectively.

4.3. Coupled Coordination Degree Model

The coupling coordination degree model is used to assess the coupling and coordination between the water, energy, and food systems. The coupling degree model measures the degree of interaction and mutual influence between these systems, while the coupling coordination degree model further evaluates the level of coordinated development among them. The coupling coordination degree model assumes that the subsystem interactions are linear and that subsystem weights are equal. However, in practical applications, these interactions often exhibit nonlinear relationships, and weight distributions may vary due to regional differences.
This study quantifies the coupling coordination level of the WEF system in the Yellow River Basin by calculating the coupling degree (C) and coordination degree (D). The coupling degree reflects the correlation strength between the systems, while the coordination degree reflects the level of synergistic development among them. The application of the coupling coordination degree model helps in identifying synergistic effects and bottleneck issues within the system, providing a scientific basis for optimizing resource allocation. The text evaluates the coupling degree and coupling coordination degree of the three systems, water, energy, and food, to reflect the interconnections and synergy among the systems. It utilizes a coupling degree model to measure the interactions and mutual influences between the systems and then employs a coupling coordination degree model to assess the level of coordinated development among the systems. The calculation formulas are as follows:
C = 3 W x × E y × F z 3 W x + E y + F z
T = a W x + b E y + c F z
D = C × T
where C is the coupling degree; D is the coupling coordination degree; and T refers to the coordination degree of the WEF system, with a value range of (0, 1]. A larger value indicates a higher degree of correlation, greater synergy among subsystems, and a higher level of comprehensive development of the system. The variables a , b , and c represent the weights of the three subsystems. Based on relevant research findings, it is considered that the importance of the water, energy, and food subsystems is the same, thus a = b = c = 1 / 3 . The grading criteria for the sum are listed in Table 2 and Table 3.

4.4. Spatial Correlation Analysis Based on Moran’s I Index

Spatial correlation analysis is used to examine the spatial dependence of the regional coupling coordination degree. The global Moran’s I index reflects the overall spatial autocorrelation trend of the coupling coordinated development of the WEF system across the entire region, while the local Moran’s I index assesses the degree of similarity between a spatial unit and its neighbors. Spatial correlation analysis assumes that there is spatial dependence between spatial units and that the spatial weight matrix accurately reflects adjacency relationships.
This study employs global and local spatial autocorrelation analyses to examine the spatial dependence of the regional coupling coordination degree. The global Moran’s I index reflects the overall spatial autocorrelation of the coupling coordination development in the WEF system across all provinces (region), providing insights into regional clustering patterns. On the other hand, the local Moran’s I index reflects spatial heterogeneity by measuring the degree of similarity between a given spatial unit and its neighboring regions. This allows for an assessment of spatial disparities in the coupling coordination of different provinces (autonomous regions). The calculation formulas for the global and local Moran’s I indices are as follows:
I = n i = 1 n j = 1 n W i j ( D i D ¯ ) ( D j D ¯ ) i = 1 n j = 1 n W i j i = 1 n ( D j D ¯ ) 2
I i = D i D ¯ S i 2 j = 1 , j i n W i j ( D j D ¯ )
where I is the global autocorrelation index; I i is the local spatial autocorrelation index; n is the number of research subjects; D i   a n d   D j are the observed values of the coordination coupling degree for regions i and j, respectively; D ¯ is the average of the observed values; W i j represents the spatial weight matrix (1 for spatial neighbors, 0 for non-neighbors); and S i 2 is the variance of the attribute value D i .

4.5. Tobit Model

The Tobit model, a limited dependent variable model, is applied to account for upper and lower limits in the explanatory variables. This study employs the Tobit model to analyze the influencing factors in the coupling coordination of the WEF system across nine provinces (autonomous regions) in the Yellow River Basin from 2003 to 2022. The standard Tobit model is as follows:
Y i = X i δ + ε i where   y i = Y i   i f   Y i > 0 ,   y i = 0     i f   Y i 0
where Y i is a latent variable; y i is a dependent variable; X i is the independent variable vector; δ is the vector of correlation coefficients; and ε i is the distractor (independent, and ε i ~ N 0 , σ ), such that Y i ~ N X i δ , σ .
Using the WEF coordination coupling degree (D) as the dependent variable, the following model is constructed:
d j t = β 0 + β 1 g d p i j t + β 2 l n t c h i j t + β 3 l n i s i j t + β 4 l n u r b i j t + β 5 l n d t a i j t + ε
where β 0 is the intercept term; β i 1 ~ 5 is the regression coefficient of each variable; g d p is the level of economic development (per capita GDP); t c h is the level of technological innovation, calculated by the number of authorized patents (unit: pieces); i s refers to the industrial structure, measured by the proportion of the added value of the secondary industry to GDP (unit: %); u r b is the urbanization rate (unit: %); d t a is the accessibility of transportation, calculated in terms of road mileage (unit: kilometers); j is a representation of the province (region); t refers to period; and ε is the residual term. During the estimation process, the logarithms of t c h i , i s i , u r b i , and d t a i are employed.

5. Empirical Analysis

5.1. Data Sources

This study utilizes social, economic, energy, and food-related data from 2003 to 2022 from the Yellow River Basin, covering nine provinces (autonomous regions): Qinghai Province, Sichuan Province, Gansu Province, Ningxia Hui Autonomous Region, Inner Mongolia Autonomous Region, Shaanxi Province, Shanxi Province, Henan Province, and Shandong Province. The primary data sources include the “China Statistical Yearbook”, the “China Energy Statistical Yearbook”, the “China Urban and Rural Construction Statistical Yearbook”, the “China Land and Resources Statistical Yearbook”, as well as the statistical yearbooks and bulletins from each province (autonomous region). The data collected had no missing values and were normalized using the range method [see Formulas (1) and (2)]. To maintain consistency in administrative divisions, the basin is categorized into three sections: the upstream (Sichuan Province, Ningxia Hui Autonomous Region, Qinghai Province, and Gansu Province); the midstream (Shaanxi Province, Shanxi Province, and Inner Mongolia Autonomous Region); and the downstream (Shandong Province and Henan Province).

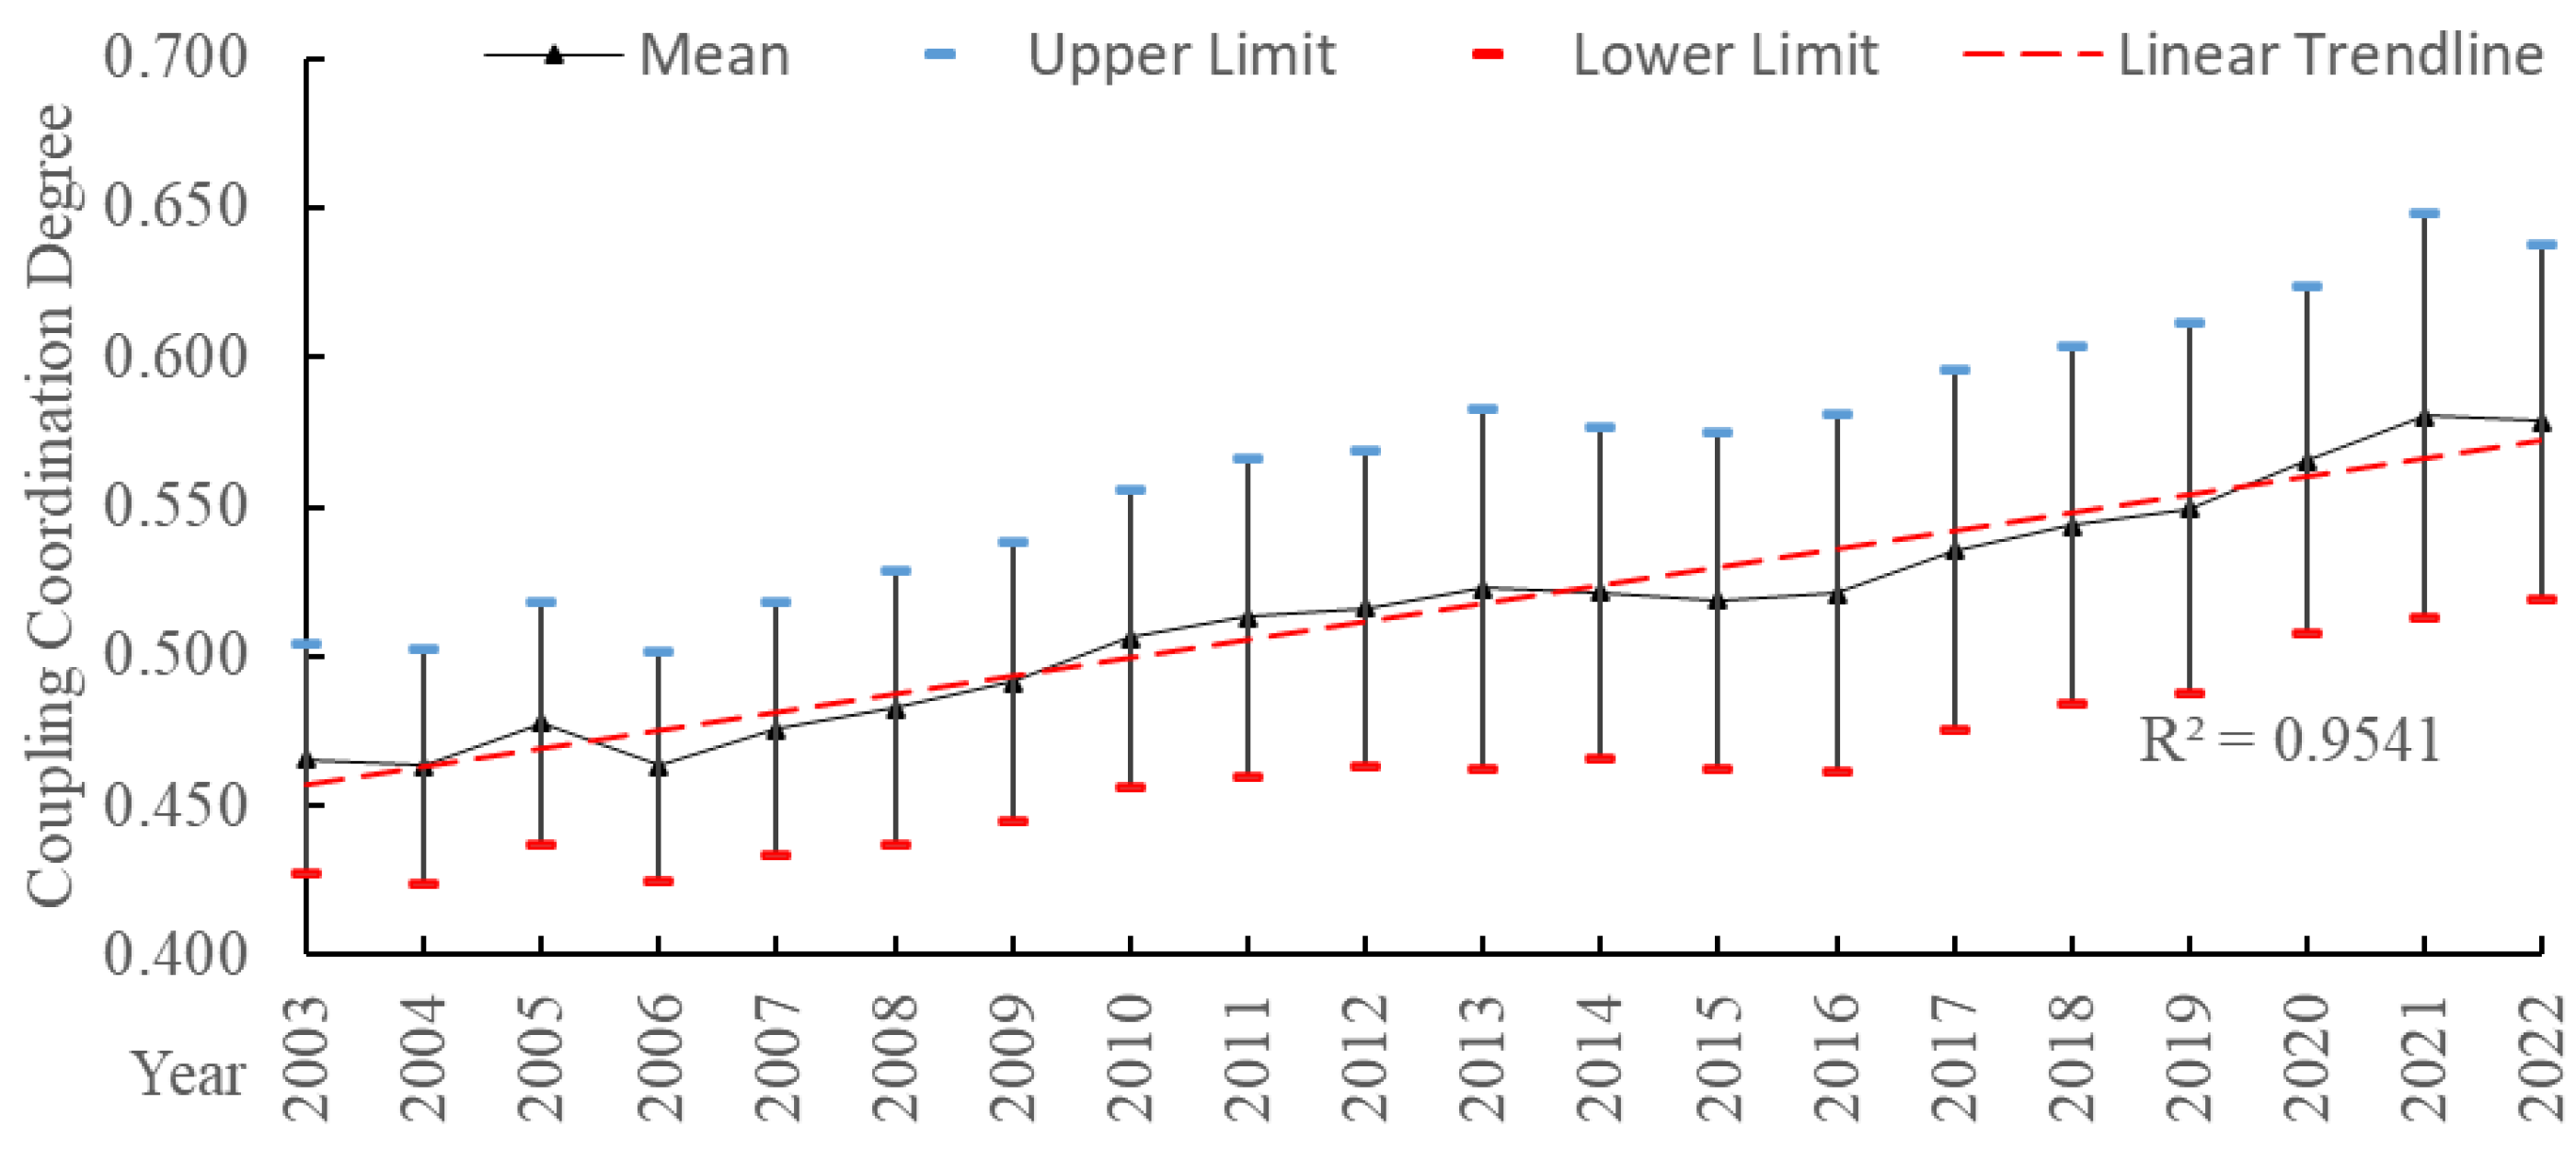
5.2. Coordination Timing Evolution of WEF System Coupling

To analyze the temporal evolution of the coupling and coordination of the WEF system in the research area, this study examines the comprehensive evaluation index, coupling degree, and coupling coordination degree of the system from 2003 to 2022, as detailed in Table 4.
As shown in Figure 3, if the R2 of the linear trend of water–energy–food system coupling in the Yellow River Basin from 2003 to 2022 is greater than 0.8, then the fitting effect is considered good. From 2003 to 2022, the average degree of the coordination of water–energy–food system coupling in the Yellow River Basin showed a growth trend in fluctuation, with an annual growth rate of 1.149%. In 2022, the average D of the coupling coordination of the water–energy–food system in the Yellow River Basin was 0.579. According to the current growth rate, it will take about 4 years for the coordinated development of the water–energy–food system coupling in the Yellow River Basin to reach the primary coordination.
Over the study period, the comprehensive evaluation index (T value) of the WEF system in the Yellow River Basin exhibited a general upward trend. The evaluation indices for the energy and food subsystems also showed steady growth, while the water resources subsystem displayed fluctuations and a comparatively slower increase. The water resources subsystem showed significant variations between 2003 and 2012, with its TW value oscillating around 0.2. After 2013, it entered a growth phase, peaking at 0.297 in 2021, reflecting improvements in water resource management and utilization efficiency. The energy subsystem maintained a consistent upward trend, with the TE value steadily increasing from 0.185 in 2003 to 0.290 in 2022, achieving an average annual growth of 2.39%. This growth was primarily driven by energy structure optimization and an increasing share of clean energy sources. The food subsystem exhibited the most significant growth, with the TF value rising from 0.252 in 2003 to 0.502 in 2022, achieving an average annual growth rate of 3.69%. This improvement was largely attributed to advancements in agricultural science and technology, the development of high-standard farmland, and increased resilience in the food supply chain.
Throughout the study period, the system coupling degree (C value) remained within the range of 0.881 to 0.939, indicating a persistently high level of interdependence among the water, energy, and food. The system coupling coordination degree (D value) continuously increased, despite fluctuations, with its evolution divided into three stages: (1) from 2003 to 2007, the D value ranged from 0.463 to 0.478, indicating a near-disorder stage characterized by prominent imbalances among subsystems; (2) from 2008 to 2017, the D value increased from 0.483 to 0.535, marking a transition to a barely coordinated stage, with the system synergy gradually improving; (3) from 2018 to 2022, the D value surpassed 0.544, reaching 0.579 in 2022, but remained in a barely coordinated stage, without achieving a qualitative breakthrough. This stagnation highlights the ecological vulnerability of the Yellow River Basin and the need to address resource competition pressures.
The advancement of ecological protection policies and high-quality development strategies in the Yellow River Basin has contributed to the coordinated enhancement of water resource efficiency, low-carbon energy transitions, and food security measures. However, to achieve a higher level of system coordination, enhanced policy coordination, resource constraint bottlenecks, and strategic interventions will be necessary in the future.

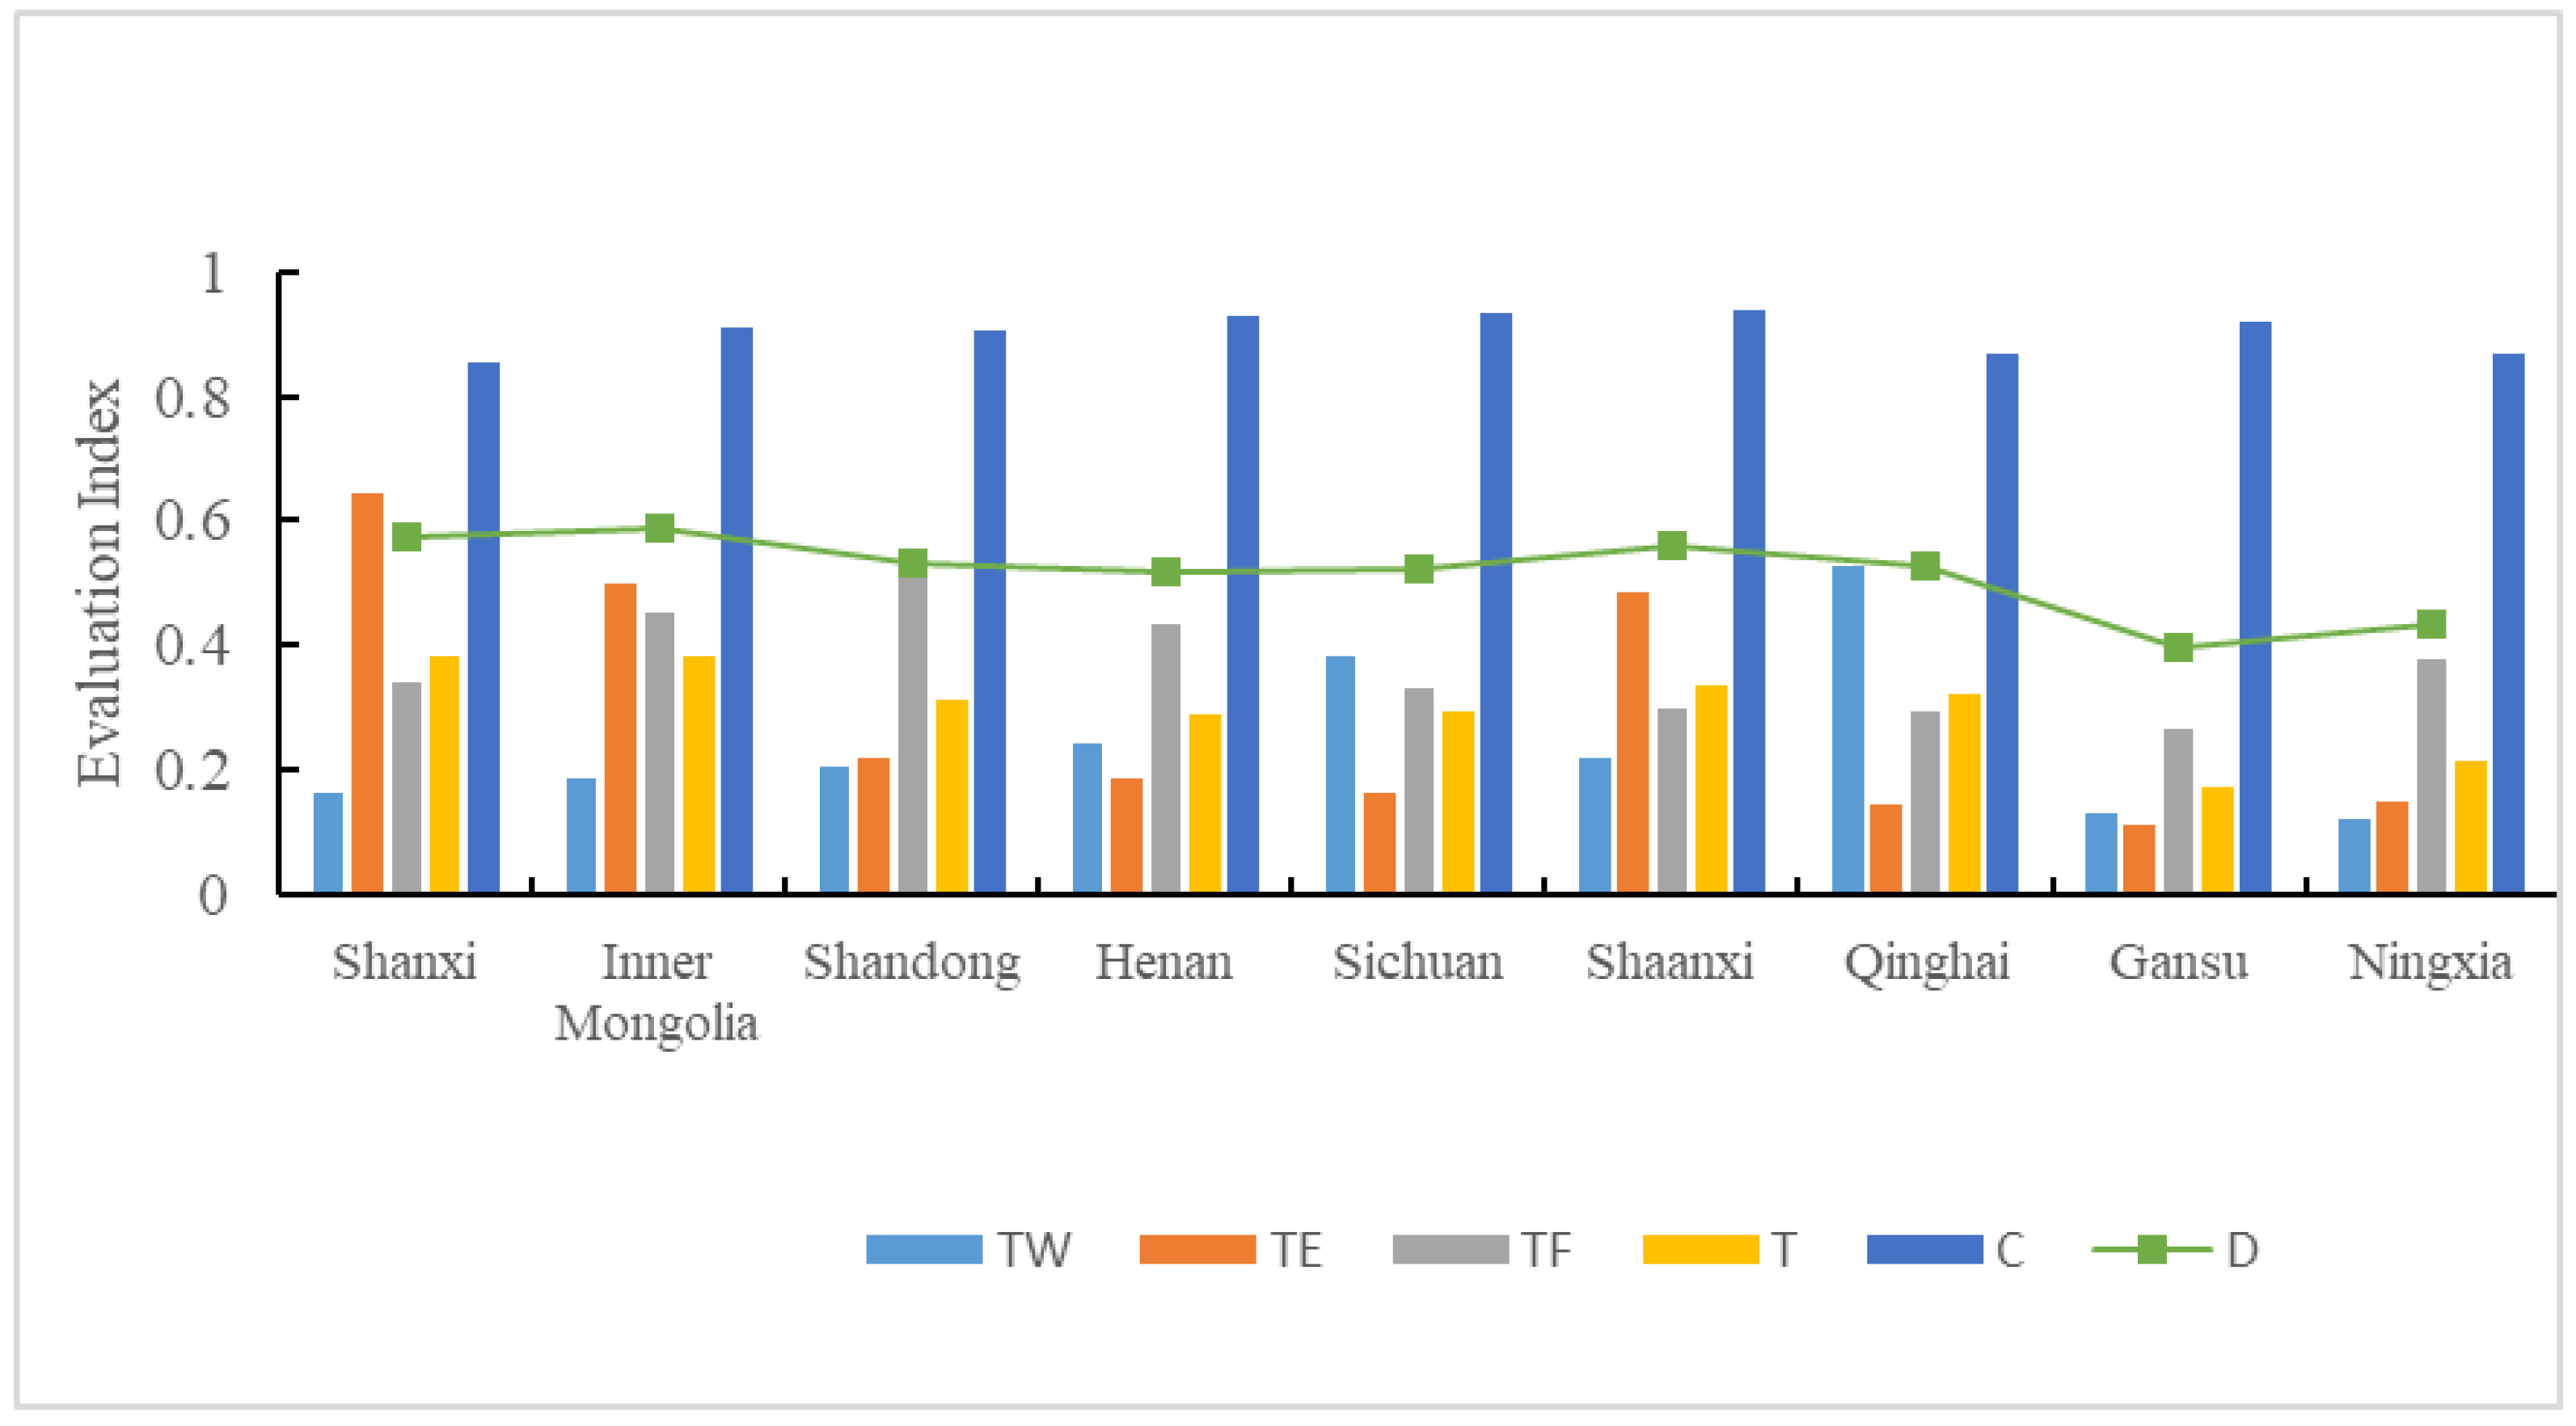
5.3. WEF System Coupling Coordinates Spatial Differences

To explore the spatial evolution of the coordinated development of the WEF system in the Yellow River Basin, the comprehensive evaluation index, coupling degree, and coupling coordination degree were calculated for the nine provinces (autonomous regions) across the upper, middle, and lower reaches from 2003 to 2022 (see Figure 4 and Table 5). Overall, the comprehensive evaluation index of the WEF system and its subsystems in the Yellow River Basin remains relatively low, ranging from 0.11 to 0.64, with the overall trend following the pattern of midstream > downstream > upstream.
The evaluation index of the water resource subsystem follows the pattern of upstream > downstream > midstream, reflecting the relatively abundant precipitation and higher water resource reserves in upstream areas. In contrast, the midstream and downstream regions have relatively low index values due to limitations in water use efficiency and water-saving technologies. In addition, severe soil and water loss in the midstream areas (such as the Loess Plateau) results in a relatively lower water resource evaluation index. The energy subsystem follows the pattern of midstream > downstream > upstream, with the midstream region benefitting from a prominent advantage in traditional energy resources, such as coal and natural gas, supported by policy incentives. The downstream region has a diverse economic structure and is undergoing a transformation in its energy structure, while the upstream area faces development constraints due to strict energy and ecological protection policies, leading to relatively low assessment values. The food subsystem follows the pattern of downstream > midstream > upstream, as the downstream region, characterized by high population density and intensive agricultural practices, leads to grain yield and sown area. In comparison, the midstream region faces prominent issues due to a single-structured food production system, while the upstream region is limited by dispersed arable land resources.
The coupling degree for the various provinces remained consistently above 0.85, indicating a high level of coupling and strong interactions among the three subsystems. However, the coordination degree mostly remained in the barely coordinated stage or lower, with an overall trend of midstream > downstream > upstream, indicating the urgent need for more balanced development. In the upstream region, the overall coupling and coordination degree is low. While the Ningxia Hui Autonomous Region is on the verge of imbalance and Gansu Province is in mild imbalance, the other two provinces are at a barely coordinated stage, mainly due to water scarcity, a weak economic infrastructure, and a strong focus on ecological conservation. In the downstream region, the Shandong and Henan Provinces are both in the barely coordinated stage, relying heavily on external energy sources, facing water shortages, and experiencing significant food production pressures. The midstream region, while also in the barely coordinated stage, benefits from national energy strategies, policy support, and strong infrastructure, leading to a relatively balanced economic structure. This is mainly due to the influence of the energy subsystem, where regional energy is relatively abundant and has limited synergy with agriculture, resulting in a relatively high level of coordinated development of the WEF system.
The observed pattern in the coupling and coordination degree results from the combined effects of energy production advantages, resource competition pressure, and ecological constraints. In the future, achieving high-quality coordination in the Yellow River Basin will require enhanced water resource protection and utilization to address regional disparities, institutional innovation, technological upgrades to optimize resource allocation, and strengthened regional cooperation to mitigate conflicts among subsystems.

5.4. Spatial Correlation Analysis of Coupled Coordination of the WEF System

The global Moran’s I index for the coupling coordination degree of the WEF system was calculated using Stata 17 (Table 6). The Moran’s I values from 2003 to 2008 were 0.267, 0.240, 0.238, 0.235, 0.297, and 0.166, while the values from 2020 to 2022 were 0.153, 0.175, and 0.179. All p-values passed the 10% significance test and were positive, suggesting a positive spatial autocorrelation in the coupling and coordinated development of the WEF system among the Yellow River Basin provinces for 2003–2008, indicating a strong spatial agglomeration trend.
Furthermore, the Moran scatter plot reflects the local spatial autocorrelation of the coupling coordination degree of the WEF system from 2020 to 2022 (see Figure 5). From 2003 to 2008, the value of Moran’s I decreased, indicating that the spatial dependence of water and regional correlation among provinces (autonomous regions) in the Yellow River Basin decreased. Since 2008, the Moran’s I value has gradually increased, indicating a gradual increase in concentration. In 2022, most provinces were situated in the “high-high” and “low-low” regions, demonstrating a spatial positive correlation, that is, the same direction of agglomeration effect dominates, indicating minimal spatial differences at that time. This shows that in the nine provinces in the Yellow River Basin (autonomous region), the water–energy–food system coupling coordination degree in the geographical space adjacent peer effect and spillover effect, the adjacent areas between natural, economic, social, and cultural similarity are high, there is space distance, low transportation costs, frequent contact, and fast and convenient information access. The dynamic evolution of the spatial pattern of coupling coordination in the Yellow River Basin is closely related to regional development imbalances. Upstream provinces are constrained by ecological vulnerability and economic limitations, leading to low resource utilization efficiency, while midstream and downstream provinces benefit from industrialization and urbanization, resulting in a higher system coordination degree. However, insufficient resource flow and weak policy coordination between regions have limited spatial spillover effects. In the future, strengthening collaborative mechanisms across provinces, optimizing water and energy allocation, and promoting high-quality coordinated development will be essential for the Yellow River Basin.

5.5. Analysis of the Influencing Factors of the WEF System Coupling Coordination

The collinearity test was conducted for each variable, with both VIF and MeanVIF values being less than 10, indicating no collinearity. This study employs a benchmark regression model and a Tobit model for regression analysis, with the results of both models being largely consistent (see Table 7). The main results are as follows:
(1)
The level of economic development has a positive impact on the coupling coordination degree of the WEF system. As per capita GDP increases, resource management capacity improves, with increased technological investment promoting the coordinated development of the water, energy, and food systems. Economic development provides financial support for upgrading water conservation facilities, expanding clean energy sources, and advancing efficient agricultural technologies, thereby optimizing resource allocation efficiency.
(2)
The upgrading of industrial structures promotes the coupling coordination of the three systems, with a regression coefficient of 0.135. It shows that it has a positive influence on the coupling and coordination of the three systems in the Yellow River Basin. When the logarithm of the industrial structure level increases by 1%, the coupling and coordination of the three systems in the Yellow River Basin increases by 0.135%. The development of the secondary industry drives advancements in energy technologies, water-saving solutions, sewage treatment, and agricultural production materials, facilitating the integrated development of WEF coupling. Inter-industry synergy plays a crucial role, as the energy industry supports secondary industry expansion, while industries such as chemical and building materials provide essential equipment and resources for energy extraction and processing.
(3)
Urbanization is positively correlated with the coupling coordination degree of the WEF system, with a regression coefficient of 0.080. This shows that it has a positive influence on the coupling coordination of the three systems in the Yellow River Basin. For the increase in urbanization level, the coupling coordination of the three systems in the Yellow River Basin increases by 0.080%. The agglomeration effect of population and industry promotes the concentrated construction of infrastructure, significantly enhancing resource allocation efficiency. However, excessive urbanization may compress ecological spaces, necessitating the adoption of sustainable solutions such as green infrastructure, “sponge cities”, and distributed energy systems to achieve a balance between urban expansion and system coordination.
(4)
The transportation network shows a positive correlation with the coupling coordination degree of the three systems, with a regression coefficient of 0.065. It shows that it has a positive influence on the coupling and coordination of the three systems in the Yellow River Basin. For the log optimization of the traffic network, the coupling and coordination of the three systems in the Yellow River Basin increased by 0.065%. An efficient transportation and logistics system helps break geographical barriers, facilitating cross-regional energy transmission, food redistribution, and water rights transactions. Key projects such as the north-to-south grain transport, the south-to-north water diversion, and the west-to-east electricity transmission all rely on infrastructure optimization, highlighting its critical role in enabling resource flow and regional integration.
(5)
Technological innovation has a negative impact on the coupling coordination degree of the WEF system, with a regression coefficient of −0.026. The results indicate that for the logarithm optimization of scientific and technological innovation level, the coupling and coordination of the three systems in the Yellow River Basin decreased by 0.026%. This negative effect may be due to the current focus on improving efficiency in a single resource, where different regions emphasize various key areas of technological innovation, potentially leading to an imbalance in the development of the three major systems. It may also be attributed to the threshold effect of technological innovation on the coupling coordination of water, energy, and food, as well as the time required for the transformation of scientific and technological achievements. Consequently, the potential of technological innovation to promote coordinated development has not been fully realized. Therefore, the current effect of technological innovation on enhancing coupling coordination among the three major systems of water, energy, and food requires further optimization.
(6)
Other external factors may affect the coupling coordination of the WEF system, such as climate change and global economic trends. Climate change can directly affect the availability of water resources in the Yellow River Basin by altering the temporal and spatial distribution of precipitation, increasing the frequency of extreme weather events (such as droughts and floods), and accelerating glacial melting. This may lead to regional disparities in resource availability across the upper, middle, and lower reaches, resulting in a decrease in the coupling coordination degree of the WEF system. Conversely, climate change may also drive the implementation of targeted policy measures to mitigate its effects, potentially improving the coupling coordination degree of the WEF system. Global economic trends may indirectly influence the coordination of the WEF system through fluctuations in international energy prices, changes in global food market supply and demand, and multinational investment and technology transfer. Fluctuations in the international energy market may increase fossil energy extraction, accelerating the transformation of the regional energy structure. However, in the short term, this transition may exacerbate competition for water resources (such as the high water consumption of the coal chemical industry). Changes in the global food trade pattern may affect regional food security by influencing import dependence or export restrictions, thereby disrupting local agricultural production and water resource allocation.

6. Conclusions and Recommendations
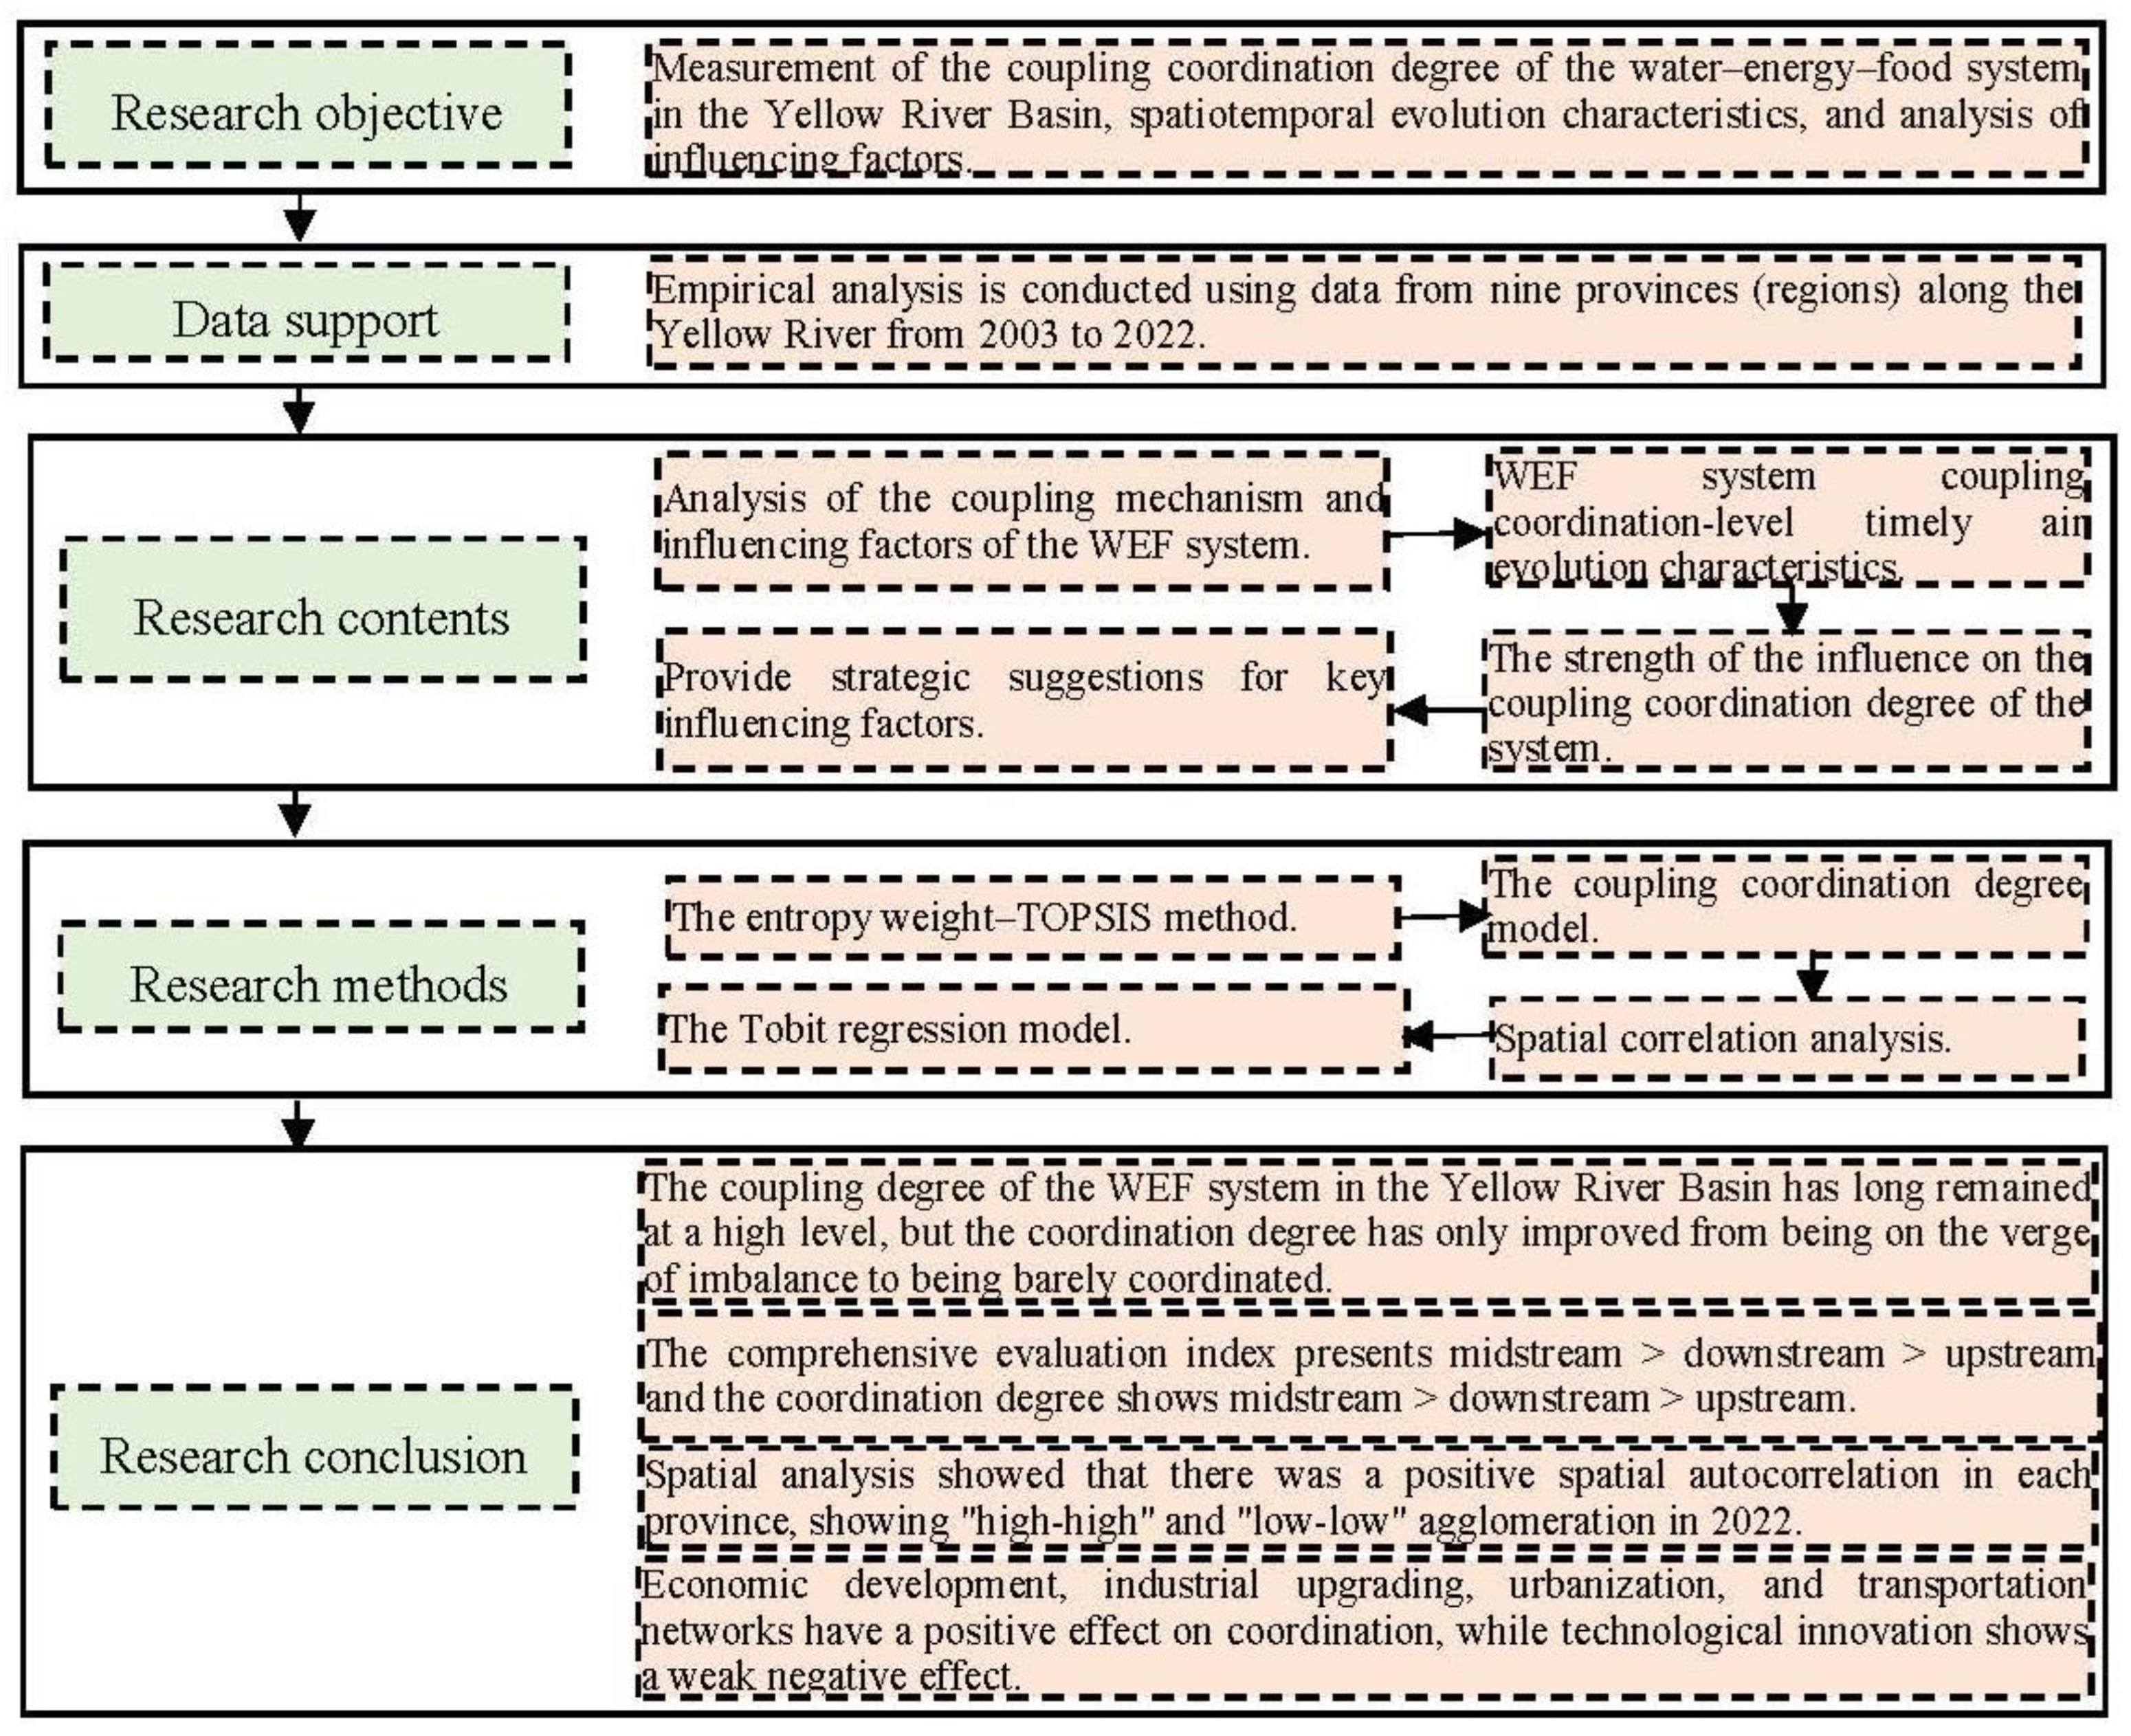
6.1. Conclusions

From a temporal perspective, the comprehensive evaluation index of the WEF system in the Yellow River Basin shows an overall upward trend. The indices for the energy and food subsystems have steadily increased, while the water resource subsystem has exhibited fluctuations before gradually rising with a relatively small amplitude. The system’s coupling degree has consistently remained at a high level, indicating a strong correlation and interdependence among the three major subsystems. The coupling coordination degree has risen despite fluctuations, transitioning through phases of near-disorder and forced coordination. However, it has not reached a higher level of coordinated development, reflecting the ecological vulnerability and resource competition pressures within the basin.
In terms of spatial differences in coupling coordination, the comprehensive evaluation index and subsystem evaluation indices for the WEF system across various provinces and regions of the Yellow River Basin remain relatively low. The comprehensive evaluation index exhibits the pattern of middle reaches > lower reaches > upper reaches, with subsystem indices showing different spatial distributions that are influenced by resource availability, economic structures, and ecological conditions. While the coupling degree remains generally high, often at a high-level coupling stage, the coordination degree is frequently in a state of forced coordination or lower, with an overall trend of middle reaches > lower reaches > upper reaches. The upper reaches have a low degree of coupling coordination due to water shortages and economic underdevelopment; the lower reaches face constraints from energy input, water scarcity, and food production pressures; and the middle reaches benefit from energy advantages and policy support, resulting in relatively higher coordinated development.
From the perspective of spatial correlation characteristics, between 2003 and 2008, a positive spatial autocorrelation existed among the Yellow River Basin provinces concerning the coupling and coordinated development of the WEF system, indicating a strong spatial agglomeration trend. By 2022, most provinces were situated in “high-high” and “low-low” clusters, reflecting a positive spatial correlation where similar values clustered, minimizing spatial differences.
In terms of influencing factors, economic development, industrial structure upgrading, urbanization, and transportation networks positively impact the coupling coordination of the WEF system. Economic growth enhances resource management capabilities and technological investments; industrial upgrading promotes resource efficiency and strengthens linkages across industries; urbanization drives infrastructure development and improves resource allocation efficiency; and transportation networks facilitate resource flow. However, technological innovation has a negative impact on coupling coordination, likely due to a disconnect between technological innovation and production practices, the improper use of technology, and low rates of industrialization and technological conversion.
This study utilizes statistical data from nine provinces (autonomous regions) in the Yellow River Basin from 2003 to 2022. The data sources include the China Statistical Yearbook and relevant statistical bulletins. The findings indicate that the level of scientific and technological innovation exerts a negative impact on the coupling and coordination degree, which may be related to the quantification mode of scientific and technological innovation. In the current research, the number of authorized patents as the independent variable of the level of scientific and technological innovation may not fully reflect the practical application effect of scientific and technological innovation and its promoting effect on the system coupling. Influenced by the data source, this paper takes the province as the research object. In the next step, the field research can be conducted at the county level. Future research can further explore the role of science and technology innovation in the water–energy–food system coupling coordination mechanism, deepen the understanding of the practical application effect of science and technology innovation, and refine the quantification methods of scientific and technological innovation levels. This will enable a more accurate reflection of its role in promoting system coupling.

6.2. Recommendations

Based on the theoretical and empirical analyses of the coupling coordination degree of the WEF system in the Yellow River Basin, this study proposes the following policy recommendations to address resource competition pressure, optimize system synergy, and promote sustainable development in the region.
First, balanced economic development should be promoted, along with strengthening resource management. Financial transfer payments and industrial support policies need a large amount of financial support, but local governments may face the problem of insufficient funds, and set up the Yellow River Basin ecological protection fund, which is jointly funded by the central and local governments to support resource management and technology investment in economically disadvantaged areas. Regions should develop characteristic economies based on their resource endowments, such as upstream areas focusing on ecological agriculture and hydropower industries due to abundant water resources, midstream areas utilizing energy advantages to develop deep processing and efficient utilization industries, and downstream areas employing economic and technological advantages to develop high-end manufacturing and modern service industries. These measures can improve resource utilization efficiency and promote the coordinated development of the WEF system.
Second, integrating technological innovation and accelerating the transformation of scientific and technological achievements should be prioritized. We recommend adjusting the direction of scientific and technological innovation, from the improvement of single-resource efficiency to the overall synergistic efficiency of the water–energy–food system, relying on the ecological protection and high-quality development and innovation alliance of the Yellow River Basin, and integrating the resources of universities, scientific research institutions, and enterprises to form an interdisciplinary and cross-field innovation force. The upstream regions of Sichuan, Ningxia, Qinghai, and Gansu should focus on ecological protection, strictly implement water source conservation and soil and water preservation, prioritize the development of clean energy sources, such as photovoltaics and wind power, support water diversion projects and water-saving technologies, promote ecological compensation mechanisms, and resolve the challenges of resource-based economies. The midstream regions of Shaanxi, Shanxi, and Inner Mongolia should accelerate the low-carbon transformation of traditional energy through technological advancements, strengthen water-saving measures in coal chemical industries and the reuse of mine water, utilize geographical advantages to build energy hubs, promote dryland farming and smart irrigation technologies, and promote inter-provincial resource allocation cooperation among Shanxi, Shaanxi, and Inner Mongolia. The downstream regions of Shandong and Henan need to optimize the spatial distribution of grain production and the structure of water-intensive crops, expand seawater desalination and reclaimed water utilization, improve the logistics channels for the “Northern Grain Transported South” initiative, establish a smart supply system for water resources and energy in urban agglomerations, and promote sustainable and efficient urbanization.
Third, optimizing industrial structure layout and promoting green industry development is essential. Some regions may face economic pressure due to the withdrawal of traditional industries, which leads to resistance to industrial upgrading, and enterprises are encouraged to carry out green transformation through financial subsidies, tax incentives, and project support. Each region in the Yellow River Basin should formulate differentiated industrial upgrading strategies based on its industrial foundation and resource conditions. A backward production capacity should be phased out, setting “dual control” thresholds for water and energy consumption per unit output value in the coal industry in traditional energy bases such as Shanxi and Shaanxi to force inefficient production exits. Additionally, promoting the integration of energy and agriculture, such as piloting “biomass energy-organic fertilizer-food production” closed-loop models in major agricultural provinces like Henan and Shandong, can improve energy utilization rates and establish a virtuous cycle of tertiary industry linkage.
Fourth, improving transportation infrastructure and strengthening regional resource circulation should be pursued. Inter-provincial transportation projects need the coordination of multiple regions and departments, which makes it difficult to coordinate the planning and construction of inter-provincial transportation projects through the joint conference system of inter-provincial river and lake chiefs in the Yellow River Basin, particularly in strengthening the connectivity and support of railways, highways, and waterways, optimizing the layout of transportation hubs, and enhancing logistics efficiency to break down geographical barriers to resource flow. In the upstream regions, such as Qinghai, Sichuan, Gansu, and Ningxia, water resources are relatively abundant; however, the economic foundation is weak. Improving transportation infrastructure, strengthening the construction of railways and highways, and promoting the external transportation of resources are essential. At the same time, the abundance of water resources in the upstream areas presents potential for water rights trading. In the midstream regions of Shaanxi, Shanxi, and Inner Mongolia, where the coal and other energy industries are well developed, it is crucial to optimize the design of energy transportation corridors, develop multimodal transport, and improve transportation efficiency. The midstream faces challenges related to water resource scarcity, which should be addressed by coordinating the allocation of water resources between those upstream and downstream through water rights trading.
Lastly, advancing the process of green urbanization is crucial for achieving coordinated sustainable development. The existing urbanization model and policy framework may be difficult to adapt to the requirements of green urbanization through policy guidance to promote the construction of green infrastructure. Strengthening urban infrastructure and public services can attract an orderly migration of rural populations while promoting urbanization development in rural areas, facilitating urban–rural integration, narrowing the urban–rural gap, and reducing resource utilization disparities caused by uneven urbanization. These measures will create a favorable urbanization environment for the coupling coordination of the WEF system. In upstream areas, it is necessary to emphasize ecological prioritization, green energy, and specialized agriculture, while promoting the resettlement of rural populations. Midstream areas can promote the integration and upgrading of production and cities, build a coal-based hydrogen circular economy demonstration zone, optimize regional power grids and industrial waste heat heating systems, implement ecological restoration in mining areas and pilot digital agriculture, and create a new development model characterized by “energy transition-industry synergy-urban-rural mutual support”. Downstream areas can develop smart port city clusters, expand vertical agriculture and seawater desalination infrastructure, improve the digital platform for inter-provincial water and grain trading, and improve intercity rail transit to guide gradual population transfer. This approach will foster a development model of “technological innovation-resource intensification-regional linkage”.

6.3. Discussion

This study analyzes the spatiotemporal differentiation patterns of the coupling coordination degree of the water–energy–food system in the Yellow River Basin and identifies its key influencing factors through the development of a comprehensive evaluation index system and the integration of multiple models. Compared to similar studies, this article focuses on the provinces along the Yellow River Basin, providing a systematic analysis of WEF coupling coordination, which is essential for addressing the national strategic priorities of the region. It serves as an important supplement to the research on the WEF coupling coordination within the Yellow River Basin.
However, due to discrepancies in statistical classifications among publicly available data from certain counties and cities, it is not possible to obtain a complete dataset at the county or city level. Therefore, this study relies on provincial data, which limits its ability to capture the heterogeneity of coupling coordination and restricts the precision of policy recommendations at finer administrative levels, representing a key limitation of this study. To address this issue, the research team plans to focus on specific counties or cities along the Yellow River Basin, selecting study areas based on data availability and their representativeness. Future studies will investigate the WEF coupling coordination at the county and city levels and propose more targeted policy recommendations.

Author Contributions

Conceptualization, B.L. and P.Z.; methodology, P.Z. and Y.Q.; software, P.Z. and S.M.; validation, Y.F. and J.W.; formal analysis, Y.F. and H.I.; investigation, Y.F. and P.Z.; resources, Y.F. and P.Z.; data curation, Y.F. and P.Z.; writing—original draft preparation, Y.F., B.L., H.L. and Y.Q.; writing—review and editing, P.Z., H.I. and H.D.; visualization, P.Z.; supervision, H.I. and H.D.; project administration, P.Z., H.I. and S.M.; funding acquisition, P.Z. All authors have read and agreed to the published version of the manuscript.

Funding

This research was funded by Dongying Science Development Fund Project (DJB2023014).

Data Availability Statement

The data supporting the plots within this paper and other study findings are available from the corresponding author upon reasonable request.

Acknowledgments

We would like to express our gratitude to the Dongying Regional High-Quality Economic Development Research Base at Shandong Institute of Petroleum and Chemical Technology for their financial support.

Conflicts of Interest

The authors declare no conflicts of interest.

References

  1. Yang, W.; Chen, J.; Ding, T.; Yan, X.; Gong, W. Supply-demand security assessment of water-energy-food systems: A perspective on intra-city coupling and inter-city linkages of ecosystem services. Sustain. Cities Soc. 2024, 117, 105964. [Google Scholar] [CrossRef]
  2. Afkhami, S.; Bavani, M.R.A.; Gohari, A.; Naderi, M.M.; Saadi, T. Sustainability analysis of single vs. multiple adaptation strategies in tackling the adverse impacts of climate change on groundwater resources using water-food-energy nexus approach. J. Clean. Prod. 2024, 459, 142532. [Google Scholar] [CrossRef]
  3. Chang, H.; Zhang, B.; Han, J.; Zhao, Y.; Cao, Y. Evaluation of the Coupling Coordination and Sustainable Development of Water–Energy–Land–Food System on a 40-Year Scale: A Case Study of Hebei, China. Land 2024, 13, 1089. [Google Scholar] [CrossRef]
  4. Mperejekumana, P.; Shen, L.; Zhong, S.; Gaballah, M.S.; Muhirwa, F. Exploring the potential of decentralized renewable energy conversion systems on water, energy, and food security in africa. Energy Convers. Manag. 2024, 315, 118757. [Google Scholar] [CrossRef]
  5. Miao, C.; Yao, S.S.; Liu, S.J.; Kai, Z. Effect of water-soluble thiourea formaldehyde (WTF) on soil contaminated with high copper (Ⅱ) concentration. J. Hazard. Mater. 2021, 409, 124929. [Google Scholar] [CrossRef]
  6. Rahmani, M.; Jahromi, S.H.M.; Darvishi, H.H. SD-DSS model of sustainable groundwater resources management using the water-food-energy security Nexus in Alborz Province. Ain Shams Eng. J. 2023, 14, 101812. [Google Scholar] [CrossRef]
  7. Behera, B.; Selvam, S.M.; Balasubramanian, P. Hydrothermal Processing of Microalgal Biomass: Circular Bio-economy Perspectives for Addressing Food-Water-Energy Nexus. Bioresour. Technol. 2022, 359, 127443. [Google Scholar] [CrossRef]
  8. Yao, L.; Tan, S.; Hou, S. Spatial equilibrium model-based optimization for inter-regional virtual water pattern within grain trade to relieve water stress. Water Supply 2022, 22, 5393–5409. [Google Scholar] [CrossRef]
  9. Khataar, M.; Mohammadi, M.H.; Shabani, F. Soil salinity and matric potential interaction on water use, water use efficiency and yield response factor of bean and wheat. Sci. Rep. 2018, 8, 2679, Erratum in Sci. Rep. 2018, 8, 13280. [Google Scholar] [CrossRef]
  10. Przybyla, G.; Nadaleti, C.W.; Gomes, P.J.; Santos, M.C.; Souza, E.G. Transforming by-products into renewable energy: Biochemical analysis of anaerobic digestion of biowastes for bioreactors optimization supporting the low-carbon agroindustry. Int. J. Hydrogen Energy 2024, 94, 912–921. [Google Scholar] [CrossRef]
  11. Hou, Y.; Zhao, G.; Liu, Y.; Li, X. Spatial adaptation patterns and coordinated development of water-energy-food complex system in the yellow river basin. Sci. Rep. 2024, 14, 31241. [Google Scholar] [CrossRef] [PubMed]
  12. Bolognini, S. The Future of Agro-Energy in the European Union Considering the Relationship between Food Emergency and Energy Emergency. Eur. Food Feed Law Rev. 2015, 10, 194–209. [Google Scholar]
  13. Leiva, R.R.; Barros, V.M.; Barbero, E.E.; Ibarra, L.V.; Fernández, M. Embedding Water-Energy-Food nexus and circularity assessment for organization benchmarking: A case study for dairy farms. Waste Manag. 2024, 189, 410–420. [Google Scholar] [CrossRef] [PubMed]
  14. Zhang, X.; Gu, J.; Liu, Y. Necessity of direct energy and ammonium recovery for carbon neutral municipal wastewater reclamation in an innovative anaerobic MBR-biochar adsorption-reverse osmosis process. Water Res. 2022, 211, 118058. [Google Scholar] [CrossRef]
  15. Wang, R.; Xiao, Y.; Huang, H.; Chang, M. Exploring the complex relationship between industrial upgrading and energy eco-efficiency in river basin cities: A case study of the Yellow River Basin in China. Energy 2024, 312, 133498. [Google Scholar] [CrossRef]
  16. Yin, R.; Li, X.; Fang, B. The Relationship between the Spatial and Temporal Evolution of Land Use Function and the Level of Economic and Social Development in the Yangtze River Delta. Int. J. Environ. Res. Public Health 2023, 20, 2461. [Google Scholar] [CrossRef]
  17. Tian, Z.; Mu, X. Towards China’s dual-carbon target: Energy efficiency analysis of cities in the Yellow River Basin based on a “geography and high-quality development” heterogeneity framework. Energy 2024, 306, 132396. [Google Scholar] [CrossRef]
  18. Smout, S.A.; Guidry, J.P.; Benotsch, E.G. Psychosocial Factors Inhibiting Timely COVID-19 Vaccination and Booster Receipt Among Transgender and Gender Diverse Adults. Transgender Health 2024, 9, 565–572. [Google Scholar] [CrossRef]
  19. Yin, D.; Yu, H.; Lu, Y.; Jian, Z.; Gensheng, L. A Comprehensive Evaluation Framework of Water-Energy-Food System Coupling Coordination in the Yellow River Basin, China. Chin. Geogr. Sci. 2023, 33, 333–350. [Google Scholar] [CrossRef]
  20. Anshebo, A.A.; Larebo, M.Y.; Behera, S.; Gopalan, N. Prevalence of unintended pregnancy and associated factors among pregnant women with disabilities in Ethiopia: From the social model of disability perspective. Front. Glob. Women’s Health 2024, 5, 1458664. [Google Scholar] [CrossRef]
  21. Julián, G.; Enrique, H.J.; Carlos, B.; Laura, A.D.; Octavio, R.R.C. Improving the Water-Use Efficiency and the Agricultural Productivity: An Application Case in a Modernized Semiarid Region in North-Central Mexico. Sustainability 2020, 12, 8122. [Google Scholar] [CrossRef]
  22. Dennis, M.; Angst, C.; Larsen, R.J.; Rey, E.; Larsen, A. A national scale floodplain model revealing channel gradient as a key determinant of beaver dam occurrence and inundation potential can anticipate land-use based opportunities and conflicts for river restoration. Glob. Ecol. Conserv. 2024, 56, e03304. [Google Scholar] [CrossRef]
  23. Zhang, J. Research on the Economic Connotation of New Energy and Traditional Energy. IOP Conf. Ser. Earth Environ. Sci. 2018, 170, 042063. [Google Scholar] [CrossRef]
  24. Zhiyu, Z.; Yejun, X. Evaluation of Water—Energy—Food—Economy Coupling Efficiency Based on Three-Dimensional Network Data Envelopment Analysis Model. Water 2022, 14, 3133. [Google Scholar] [CrossRef]
  25. Javed, R.; Roychowdhury, M.; Kumar, J.; Bhave, S.; Nag, A.; Ghosh, S.; Mahajan, A.; Kapoor, S.; Nair, R.; Chandy, M. 705–Regulatory Affairs, Quality Systems, Policy, and Ethics: Developing a Multi-Stakeholder Initiative to Overcome Barriers in Implementing Fact Mandated Quality Management System (QMS) in an Indian Transplant Center. Cytotherapy 2023, 25, S158–S159. [Google Scholar] [CrossRef]
  26. Yang, Y.; Guo, M.; Wang, L.; Zong, L.; Liu, D.; Zhang, W.; Wang, M.; Wan, B.; Guo, Y. Unevenly spatiotemporal distribution of urban excess warming in coastal Shanghai megacity, China: Roles of geophysical environment, ventilation and sea breezes. Build. Environ. 2023, 235, 110180. [Google Scholar] [CrossRef]
  27. Xiang, D.; Gao, L.; Liu, X.; Guo, C.; Yang, S.; Qian, Y. Water consumption analysis of olefins production from alternative resources in China. J. Clean. Prod. 2016, 139, 146–156. [Google Scholar] [CrossRef]
  28. Pronti, A.; Auci, S.; Berbel, J. Water conservation and saving technologies for irrigation. A structured literature review of econometric studies on the determinants of adoption. Agric. Water Manag. 2024, 299, 108838. [Google Scholar] [CrossRef]
  29. Wang, C.; Shuai, C.; Chen, X.; Huang, W.; Hou, W.; Zhao, B.; Sun, J. Analyzing the potential local and distant economic loss of global construction sector due to water scarcity. Environ. Impact Assess. Rev. 2025, 110, 107667. [Google Scholar] [CrossRef]
  30. Hokey, M. Examining the Impact of Energy Price Volatility on Commodity Prices from Energy Supply Chain Perspectives. Energies 2022, 15, 7957. [Google Scholar] [CrossRef]
  31. Yeboah, E.K.; Feng, B.; Jamatutu, A.S.; Gawusu, S.; Nyarko, F.E. Could Africa leapfrog to a low-carbon future? Evidence on the nexus between environmental tax, foreign direct investment, resource dependence, and technological progress. J. Environ. Manag. 2024, 372, 123397. [Google Scholar] [CrossRef] [PubMed]
  32. Qin, G.; Liu, J.; Lin, H.; Javed, T.; Gao, X.; Tang, Y.; Mu, X.; Guo, M.; Wang, Z. Assessing the Coordination and Spatial Equilibrium of Water, Energy, and Food Systems for Regional Socio-Economic Growth in the Ili River Valley, China. Agronomy 2024, 14, 2037. [Google Scholar] [CrossRef]
  33. Huang, L.; Xu, D.Q.; Yue, S.J.; Chen, Y.Y.; Fu, R.J.; Lu, Z.; Tang, Y.P. Research on Q-markers of Eupatorium lindleyanum based on analytic hierarchy process-entropy weight method and network pharmacology. Zhongguo Zhong Yao Za Zhi = Zhongguo Zhongyao Zazhi = China J. Chin. Mater. Medica 2021, 46, 5545–5554. [Google Scholar]
  34. Tomczewski, A.; Mikulski, S.; Szymenderski, J. Application of the Analytic Hierarchy Process Method to Select the Final Solution for Multi-Criteria Optimization of the Structure of a Hybrid Generation System with Energy Storage. Energies 2024, 17, 6435. [Google Scholar] [CrossRef]
  35. Chen, J.; Ding, T.; Li, M.; Wang, H. Multi-Objective Optimization of a Regional Water-Energy-Food System Considering Environmental Constraints: A Case Study of Inner Mongolia, China. Int. J. Environ. Res. Public Health 2020, 17, 6834. [Google Scholar] [CrossRef]
  36. Ibarra, V.L.; Leiva, R.R.; Barbero, E.E.; Fernández, M.; Feijoo, G.; García, S.G.; Moreira, M.T. A material flow or life cycle analysis perspective for the Water-Energy-Food nexus assessment of organisations? A comparative study. Future Foods 2024, 10, 100444. [Google Scholar] [CrossRef]
  37. Mukhopadhyay, A.; Mondol, H.M.; Rahman, M.; Unicomb, L.; Khan, R.; Mazumder, H.; Ferdous, M.N.; Pickering, E.V.; Makris, K.C.; Martinez, A.C.M.; et al. The direct and urinary electrolyte-mediated effects of ambient temperature on population blood pressure: A causal mediation analysis. Environ. Int. 2025, 195, 109208. [Google Scholar] [CrossRef]
  38. Feng, Y.; Zhao, T. Exploring the Nonlinear Relationship between Renewable Energy Consumption and Economic Growth in the Context of Global Climate Change. Int. J. Environ. Res. Public Health 2022, 19, 15647. [Google Scholar] [CrossRef]
  39. Hopf, B.N.; Bessems, J.; Santonen, T.; Viegas, S.; Casteleyn, L.; Poddalgoda, D.; Lamkarkach, F.; Göen, T.; Jeddi, M.Z.; Koller, M.; et al. Introducing the OECD Guidance Document on Occupational Biomonitoring: A Harmonized Methodology for Deriving Occupational Biomonitoring Levels (OBL). Toxicol. Lett. 2024, 403, 132–143. [Google Scholar] [CrossRef]
  40. Wang, K.; Li, Z.; Xu, Z.; Wang, J.; Jia, M.; Wang, L.; Yue, X.; Duo, X. Evaluating and simulating the impacts of land use patterns on carbon emissions in coal resource-based regions: A case study of Shanxi province, China. J. Clean. Prod. 2024, 458, 142494. [Google Scholar] [CrossRef]
  41. Zhang, M.; Qin, J.; Tan, H.; Mao, H.; Tu, X.; Jian, R. Education level of farmers, market-oriented reforms, and the utilization efficiency of agricultural water resources in China. Econ. Change Restruct. 2023, 56, 3927–3947. [Google Scholar] [CrossRef]
  42. Ye, J.; Tian, L.; Zhou, Y. Regional Energy–Economy–Environment Coupling Coordinated Development System Driven by Carbon Peaking and Carbon Neutralization over 13 Cities in Jiangsu Province. Sustainability 2023, 15, 1588. [Google Scholar] [CrossRef]
  43. Esan, O.; Nwulu, N.; Adepoju, O.O. A bibliometric analysis assessing the water-energy-food nexus in South Africa. Heliyon 2024, 10, e37651. [Google Scholar] [CrossRef] [PubMed]
  44. Gu, M.; Ye, C.; Lou, T.; Li, X. Coupling mechanism of coordinated development of land use and water-energy-food systems in Yangtze River Economic Belt. Yangtze River 2023, 54, 11–18. [Google Scholar]
Figure 1. Research framework diagram.
Systems 13 00278 g001
Figure 2. Correlation of the Water–Energy–Food system.
Systems 13 00278 g002
Figure 3. Mean values and 95% confidence intervals of water–energy–food system coupling coordination in the Yellow River Basin from 2003 to 2022.
Systems 13 00278 g003
Figure 4. Average value of the comprehensive evaluation index of the water–energy–food system in provinces (autonomous region) of Yellow River Basin from 2003 to 2022.
Systems 13 00278 g004
Figure 5. Moran scatter plots of the WEF system coupled coordination in the Yellow River Basin. Note: 1~9 represents Shanxi, Inner Mongolia, Shandong, Henan, Sichuan, Shaanxi, Qinghai, Gansu, and Ningxia, respectively.
Systems 13 00278 g005
Table 1. Comprehensive evaluation index system of the WEF system.
SubsystemEvaluating IndicatorUnitIndicator Nature
Water systemPer capita water resourcesm3/personforward direction
Total precipitationmmforward direction
Water consumption per capitam3/personnegative direction
Household water proportion%negative direction
The proportion of agricultural water used%negative direction
Industrial water proportion%negative direction
Ecological water proportion%forward direction
Water consumption used per unit of GDPm3/CNY ten thousand negative direction
Production of water modulusMillion m3/km2forward direction
Production water system numberm3/100 mmforward direction
Energy systemPer capita energy consumptiont standard coal/personnegative direction
Energy industry investment100 millionforward direction
Energy consumption intensityt standard coal/CNY ten thousand negative direction
Sulfur dioxide emissionsTen thousand tnegative direction
Power consumption per unit of GDP100 million KWH/CNY 100 million negative direction
The proportion of coal consumption%negative direction
Growth coefficient of energy consumption%negative direction
Total disposable energy productionTen thousand t standard coalforward direction
Energy self-sufficiency rate%forward direction
Energy consumption per unit of industrial-added valuet standard coal/CNY 100 millionnegative direction
Food systemPer capita output of grainkg/human beingforward direction
The per-unit-area yield of grainkg/hm2forward direction
Fertilizer loadkg/hm2negative direction
Mechanical powerkg/hm2forward direction
Food consumer price index%negative direction
The proportion of the effective irrigated area%forward direction
The Engel coefficient of urban residents%negative direction
Natural population growth ratenegative direction
Per capita disposable income of rural residentsWan Yuanforward direction
Proportion of grain planting area%forward direction
Table 2. Ranking criteria of coupling degree.
Coupling Degree (C)Degree of Coupling
(0, 0.3]Low-level coupling type
(0.3, 0.5]Moderate-level coupling type
(0.6, 0.8]Break-in coupling type
(0.8, 1)Coordination coupling type
1Benign resonance coupling
Table 3. Ranking criteria of coupling coordination degree.
Coupling Coordination Degree (D)Collaborative DegreeCoupling Coordination Degree (D)Collaborative Degree
(0, 0.1)Extreme disorder[0.5, 0.6)Forced coordination
[0.1, 0.2)Major maladjustment[0.6, 0.7)Primary coordination
[0.2, 0.3)Moderate dysregulation[0.7, 0.8)Intermediate coordination
[0.3, 0.4)Mild dysregulation[0.8, 0.9)Good coordination
[0.4, 0.5)On the verge of dysregulation[0.9, 0.1]Quality coordination
Table 4. Comprehensive evaluation index, coupling degree, and coupling coordination of water–energy–food system in Yellow River Basin from 2003 to 2022.
YearTWTETFTCDCoupling PhaseCoupling Coordination Phase
20030.2190.1850.2520.2310.9390.466High-level couplingOn the verge of dysregulation
20040.1880.1960.2690.2310.9310.464High-level couplingOn the verge of dysregulation
20050.2140.2040.2730.2470.9240.478High-level couplingOn the verge of dysregulation
20060.1780.2050.2720.2320.9260.463High-level couplingOn the verge of dysregulation
20070.1980.2060.2840.2450.9220.476High-level couplingOn the verge of dysregulation
20080.1920.2130.3100.2560.9100.483High-level couplingOn the verge of dysregulation
20090.1970.2290.3130.2660.9090.492High-level couplingOn the verge of dysregulation
20100.2080.2490.3240.2810.9120.506High-level couplingForced coordination
20110.2090.2560.3410.2900.9070.513High-level couplingForced coordination
20120.2090.2590.3490.2970.8970.516High-level couplingForced coordination
20130.2080.2660.3690.3010.9060.523High-level couplingForced coordination
20140.1990.2650.3810.3070.8870.521High-level couplingForced coordination
20150.1910.2590.3950.3040.8840.519High-level couplingForced coordination
20160.2040.2470.3970.3040.8940.521High-level couplingForced coordination
20170.2240.2460.4280.3240.8860.535High-level couplingForced coordination
20180.2380.2440.4460.3360.8810.544High-level couplingForced coordination
20190.2350.2530.4620.3420.8840.549High-level couplingForced coordination
20200.2710.2560.4730.3600.8900.566High-level couplingForced coordination
20210.2970.2640.4870.3740.9020.581High-level couplingForced coordination
20220.2580.2900.5020.3750.8930.579High-level couplingForced coordination
Notes: TW, TE, and TF are the evaluation indices for the water resources, energy, and food subsystems, respectively.
Table 5. Average values of WEF system coupling and coupling coordination by provinces (autonomous region) in the Yellow River Basin from 2003 to 2022.
RegionProvinceSystem Coupling DegreeSystem Coupling
Coordination Degree
Coupling PhaseCoupling Coordination Phase
UpstreamSichuan0.9360.524High-level couplingForced coordination
Qinghai0.8700.529High-level couplingForced coordination
Gansu0.9200.396High-level couplingMild dysregulation
Ningxia0.8710.433High-level couplingOn the verge of dysregulation
MidstreamShanxi0.8560.572High-level couplingForced coordination
InnerMongolia0.9110.588High-level couplingForced coordination
Shaanxi0.9380.562High-level couplingForced coordination
DownstreamShandong0.9070.532High-level couplingForced coordination
Henan0.9300.519High-level couplingForced coordination
Table 6. Results of Moran’s I test for the coupling coordination of water–energy–food systems in the Yellow River Basin from 2003 to 2022.
YearMoran’s IzpYearMoran’s Izp
20030.2672.5820.01020130.1021.3640.172
20040.2402.4160.01620140.1161.4270.153
20050.2382.3690.01820150.1501.6330.102
20060.2352.4320.01520160.1661.7440.081
20070.2972.7450.00620170.1661.760.079
20080.1661.8670.06220180.1131.4490.147
20090.0791.2880.19820190.0921.3030.193
20100.1061.450.14720200.1531.6670.096
20110.1101.4310.15220210.1751.7570.079
20120.0871.2550.21020220.1791.8360.066
Table 7. Tobit regression analysis results.
Variable(1)—Benchmark Regression(2)—Tobit
gdp0.024 *** (5.05)0.024 *** (5.14)
lntch−0.026 *** (−6.31)−0.026 *** (−6.42)
lnis0.135 *** (5.18)0.135 *** (5.27)
lnurb0.080 ** (2.22)0.080 ** (2.25)
lndta0.065 *** (8.39)0.065 *** (8.53)
_cons−0.907 *** (−4.94)−0.907 *** (−5.02)
var(e.d) 0.002 *** (9.49)
N180180
r20.638
r2_a0.628
F61.413
Note: * p < 0.1, ** p < 0.05, *** p < 0.01.
Disclaimer/Publisher’s Note: The statements, opinions and data contained in all publications are solely those of the individual author(s) and contributor(s) and not of MDPI and/or the editor(s). MDPI and/or the editor(s) disclaim responsibility for any injury to people or property resulting from any ideas, methods, instructions or products referred to in the content.

