

Towards Sustainable Supply Chains: Evaluating the Role of Supply Chain Diversification in Enhancing Corporate ESG Performance


Abstract
1. Introduction
2. Literature Review
2.1. The SCP Paradigm
2.2. Influence of SCD on Enterprise Performance
2.3. Factors Influencing ESG Performance
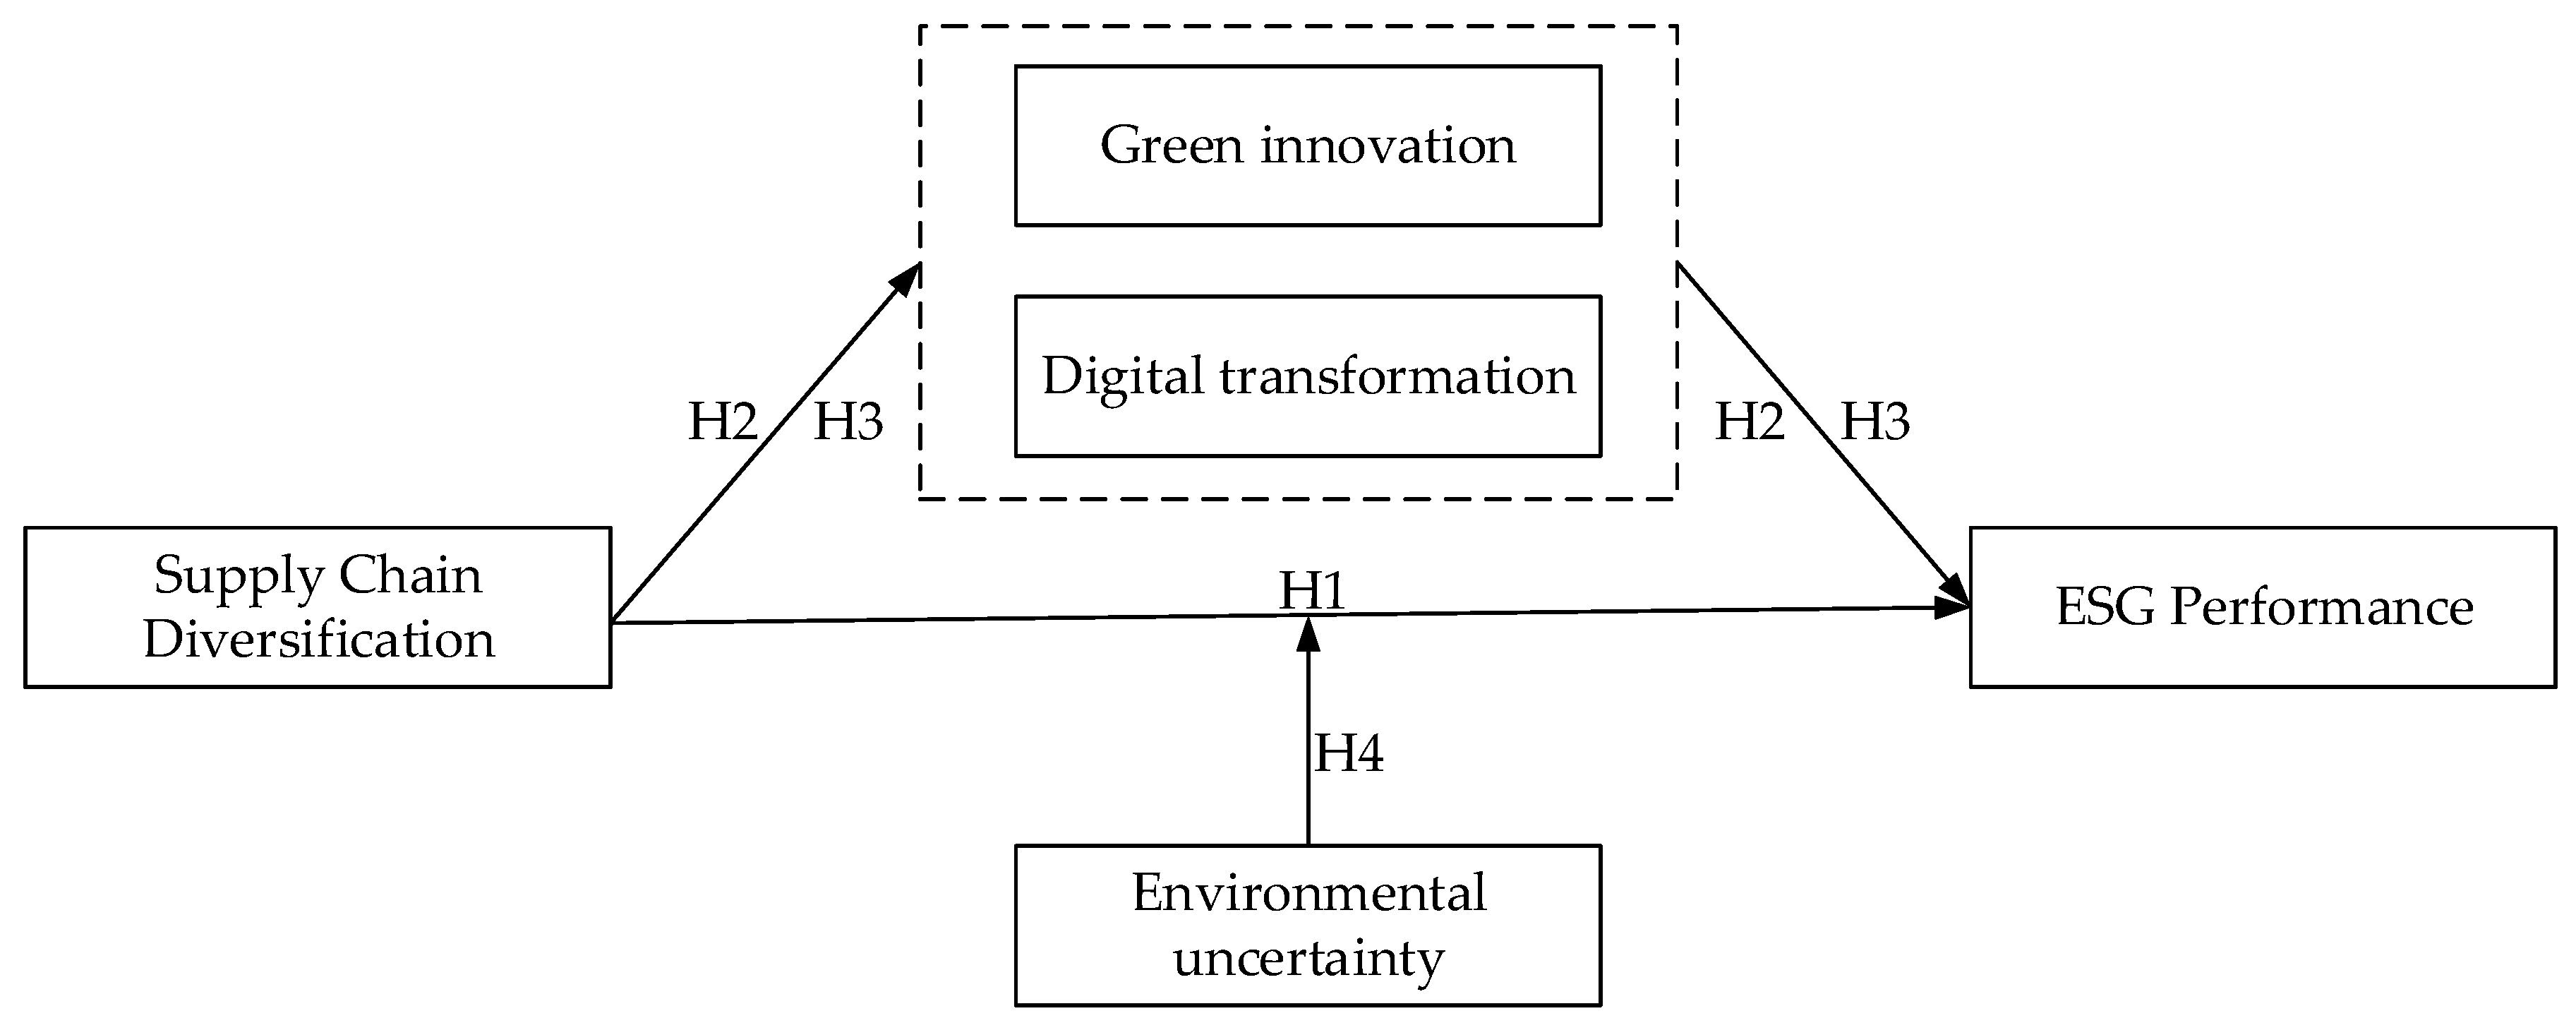
3. Hypothetical Development
3.1. SCD and ESG Performance
3.2. The Mechanism of Green Innovation
3.3. The Mechanism of Digital Transformation
3.4. Moderating Role of Environmental Uncertainty
4. Data and Methods
4.1. Data and Sample
4.2. Variable Measurement
4.3. Modeling
5. Empirical Results
5.1. Summary Statistics
5.2. Baseline Regression Results
5.3. The Mediation Mechanism Model
5.4. The Moderating Mechanism Model
5.5. Robustness Test
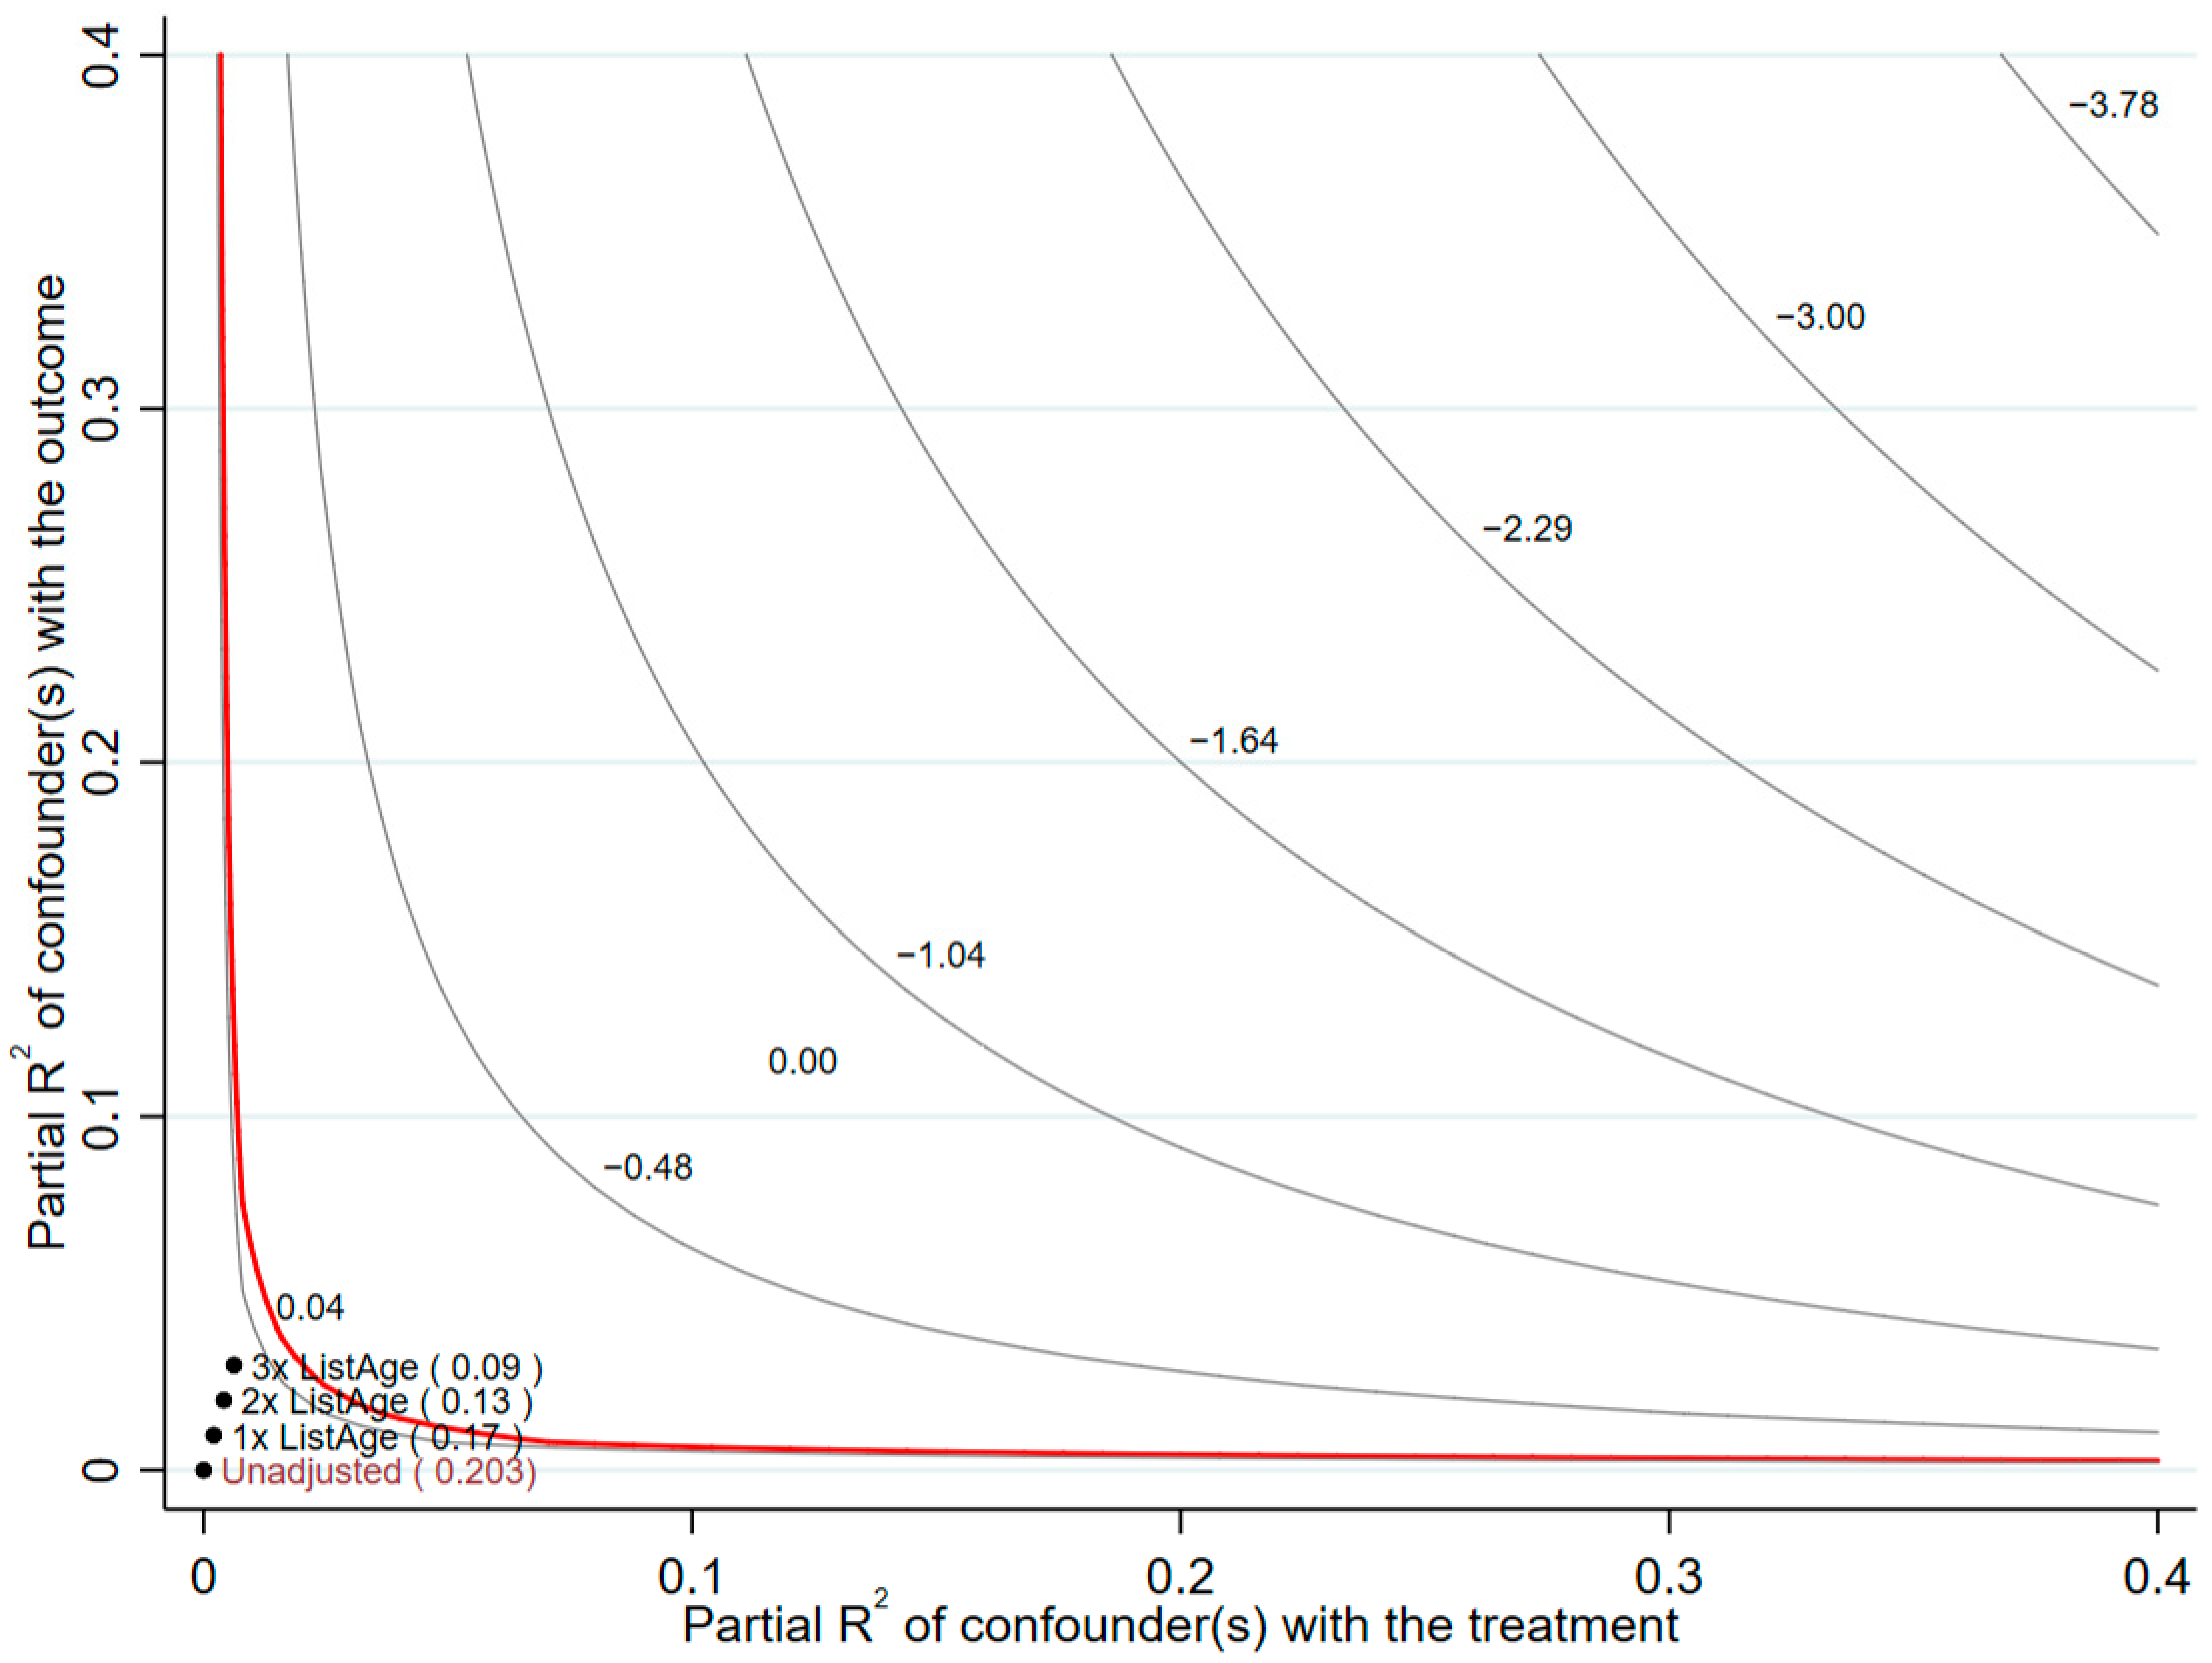
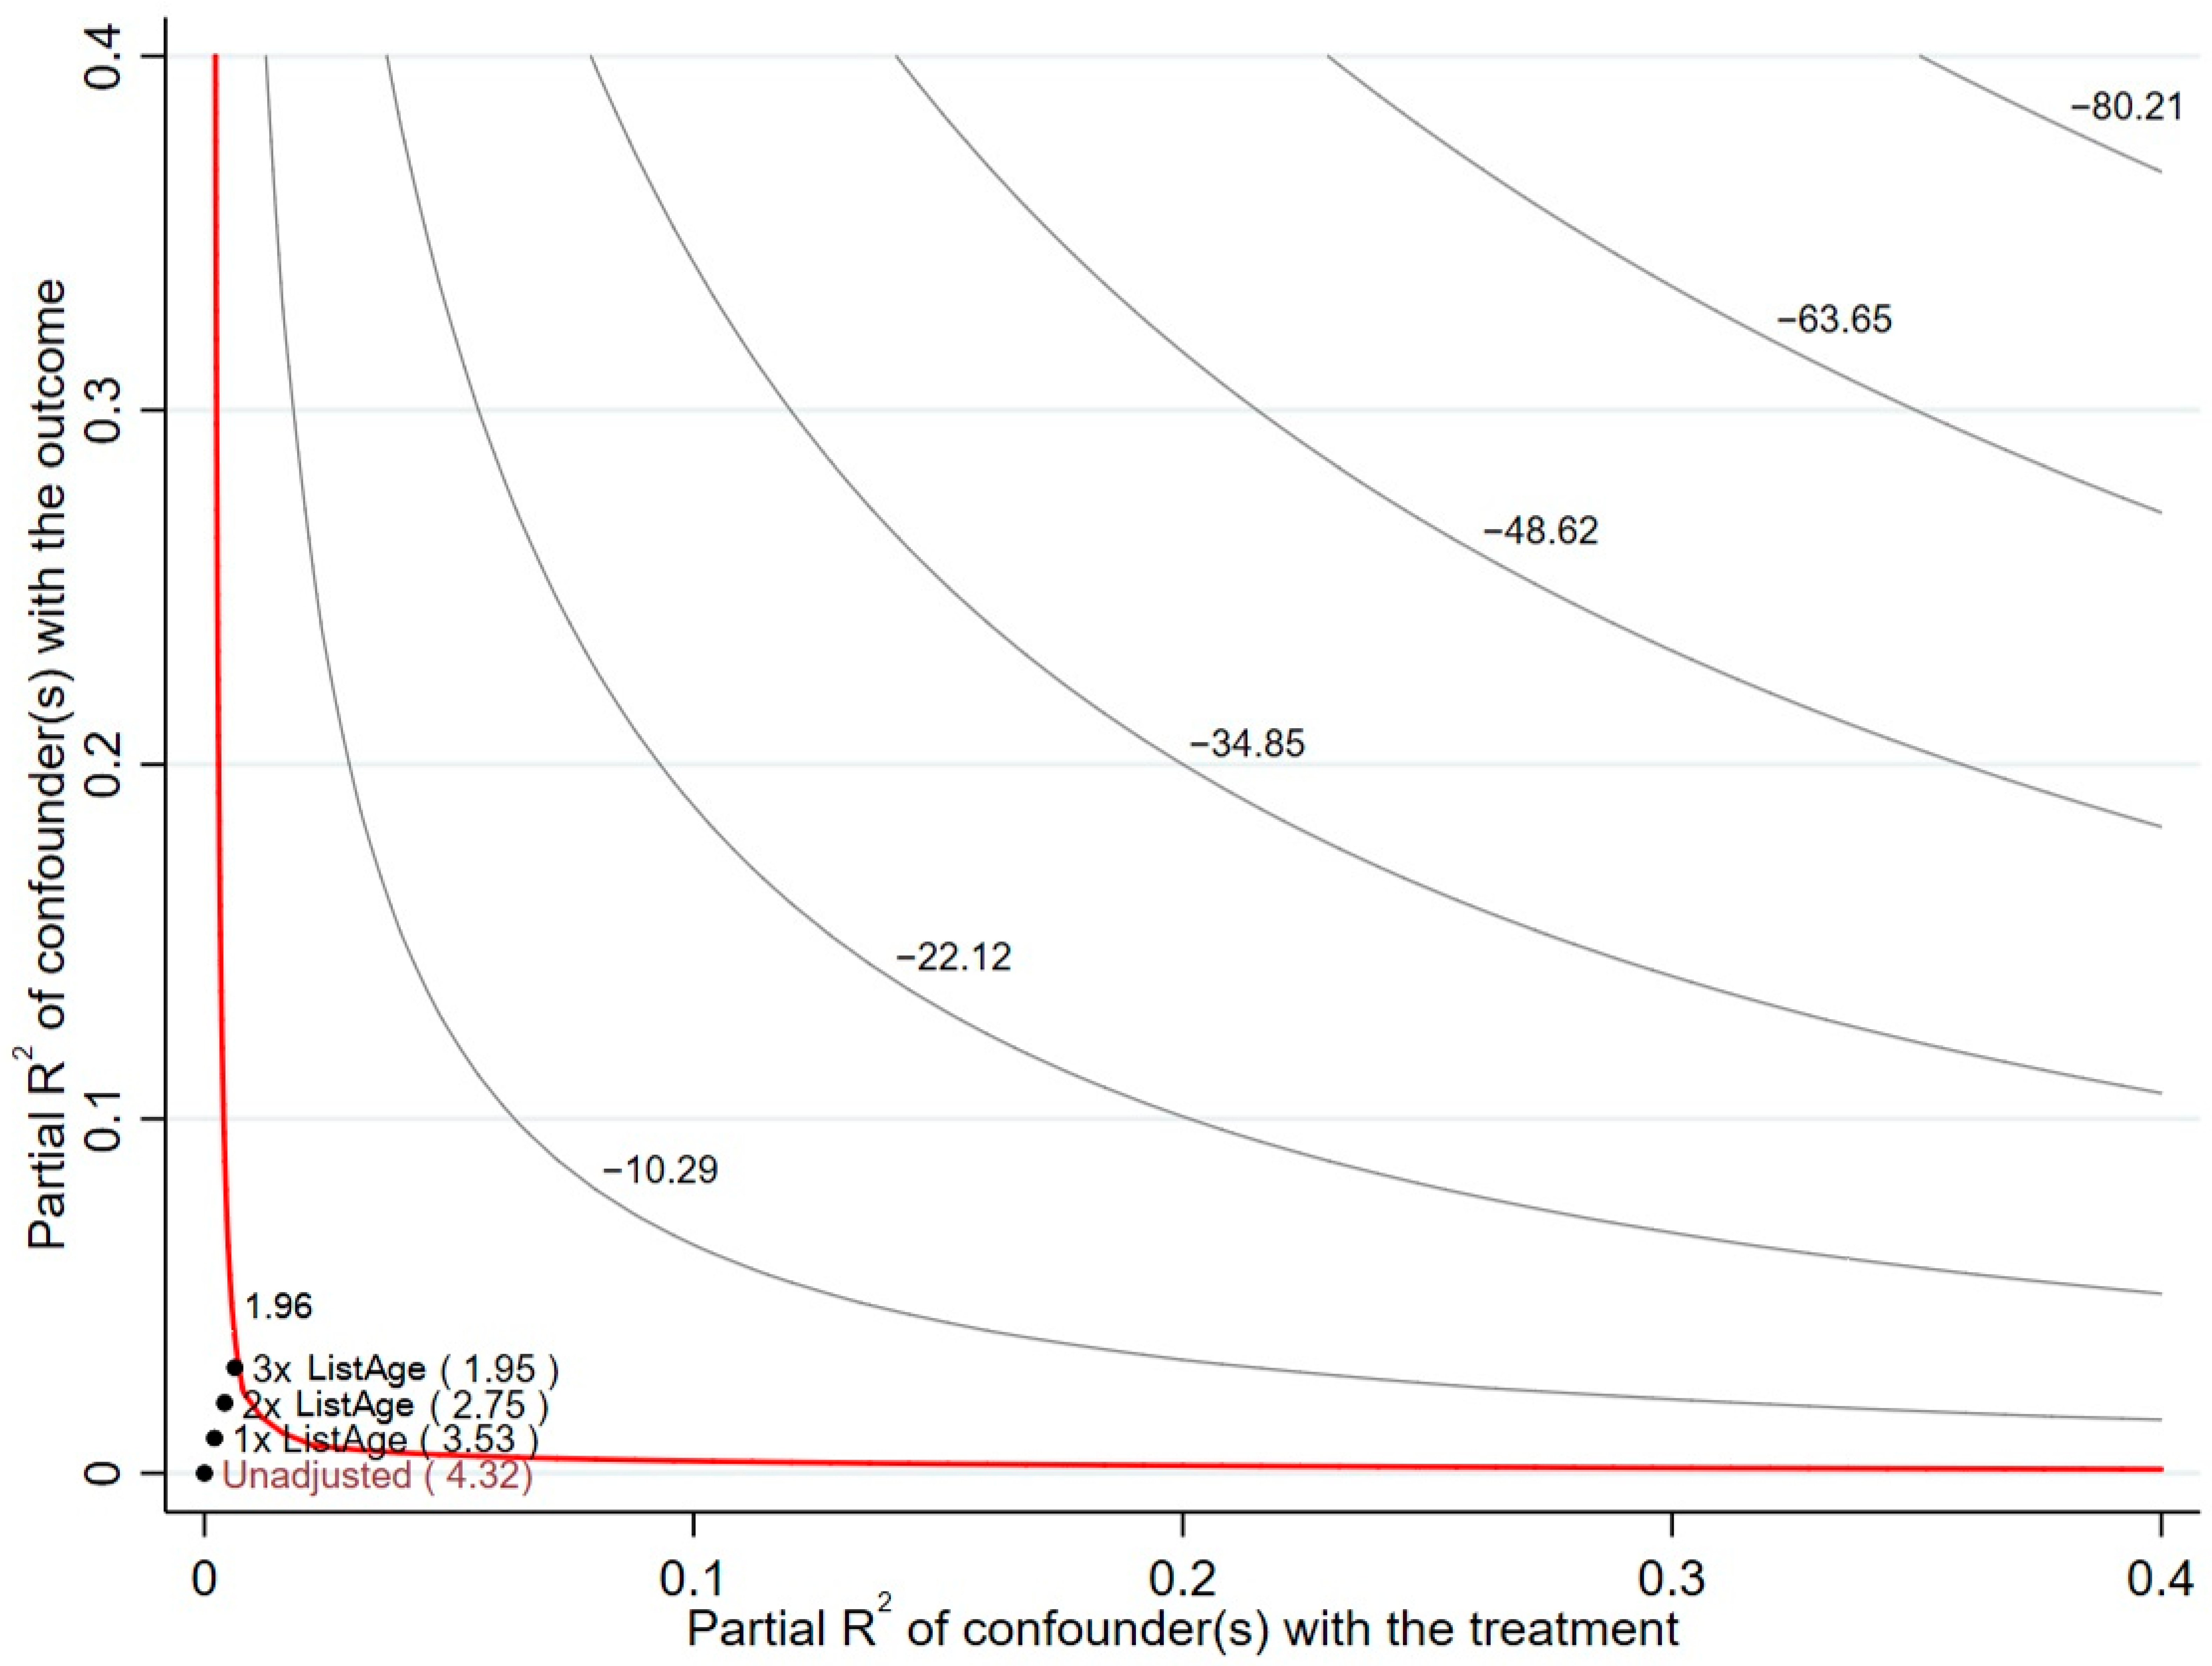
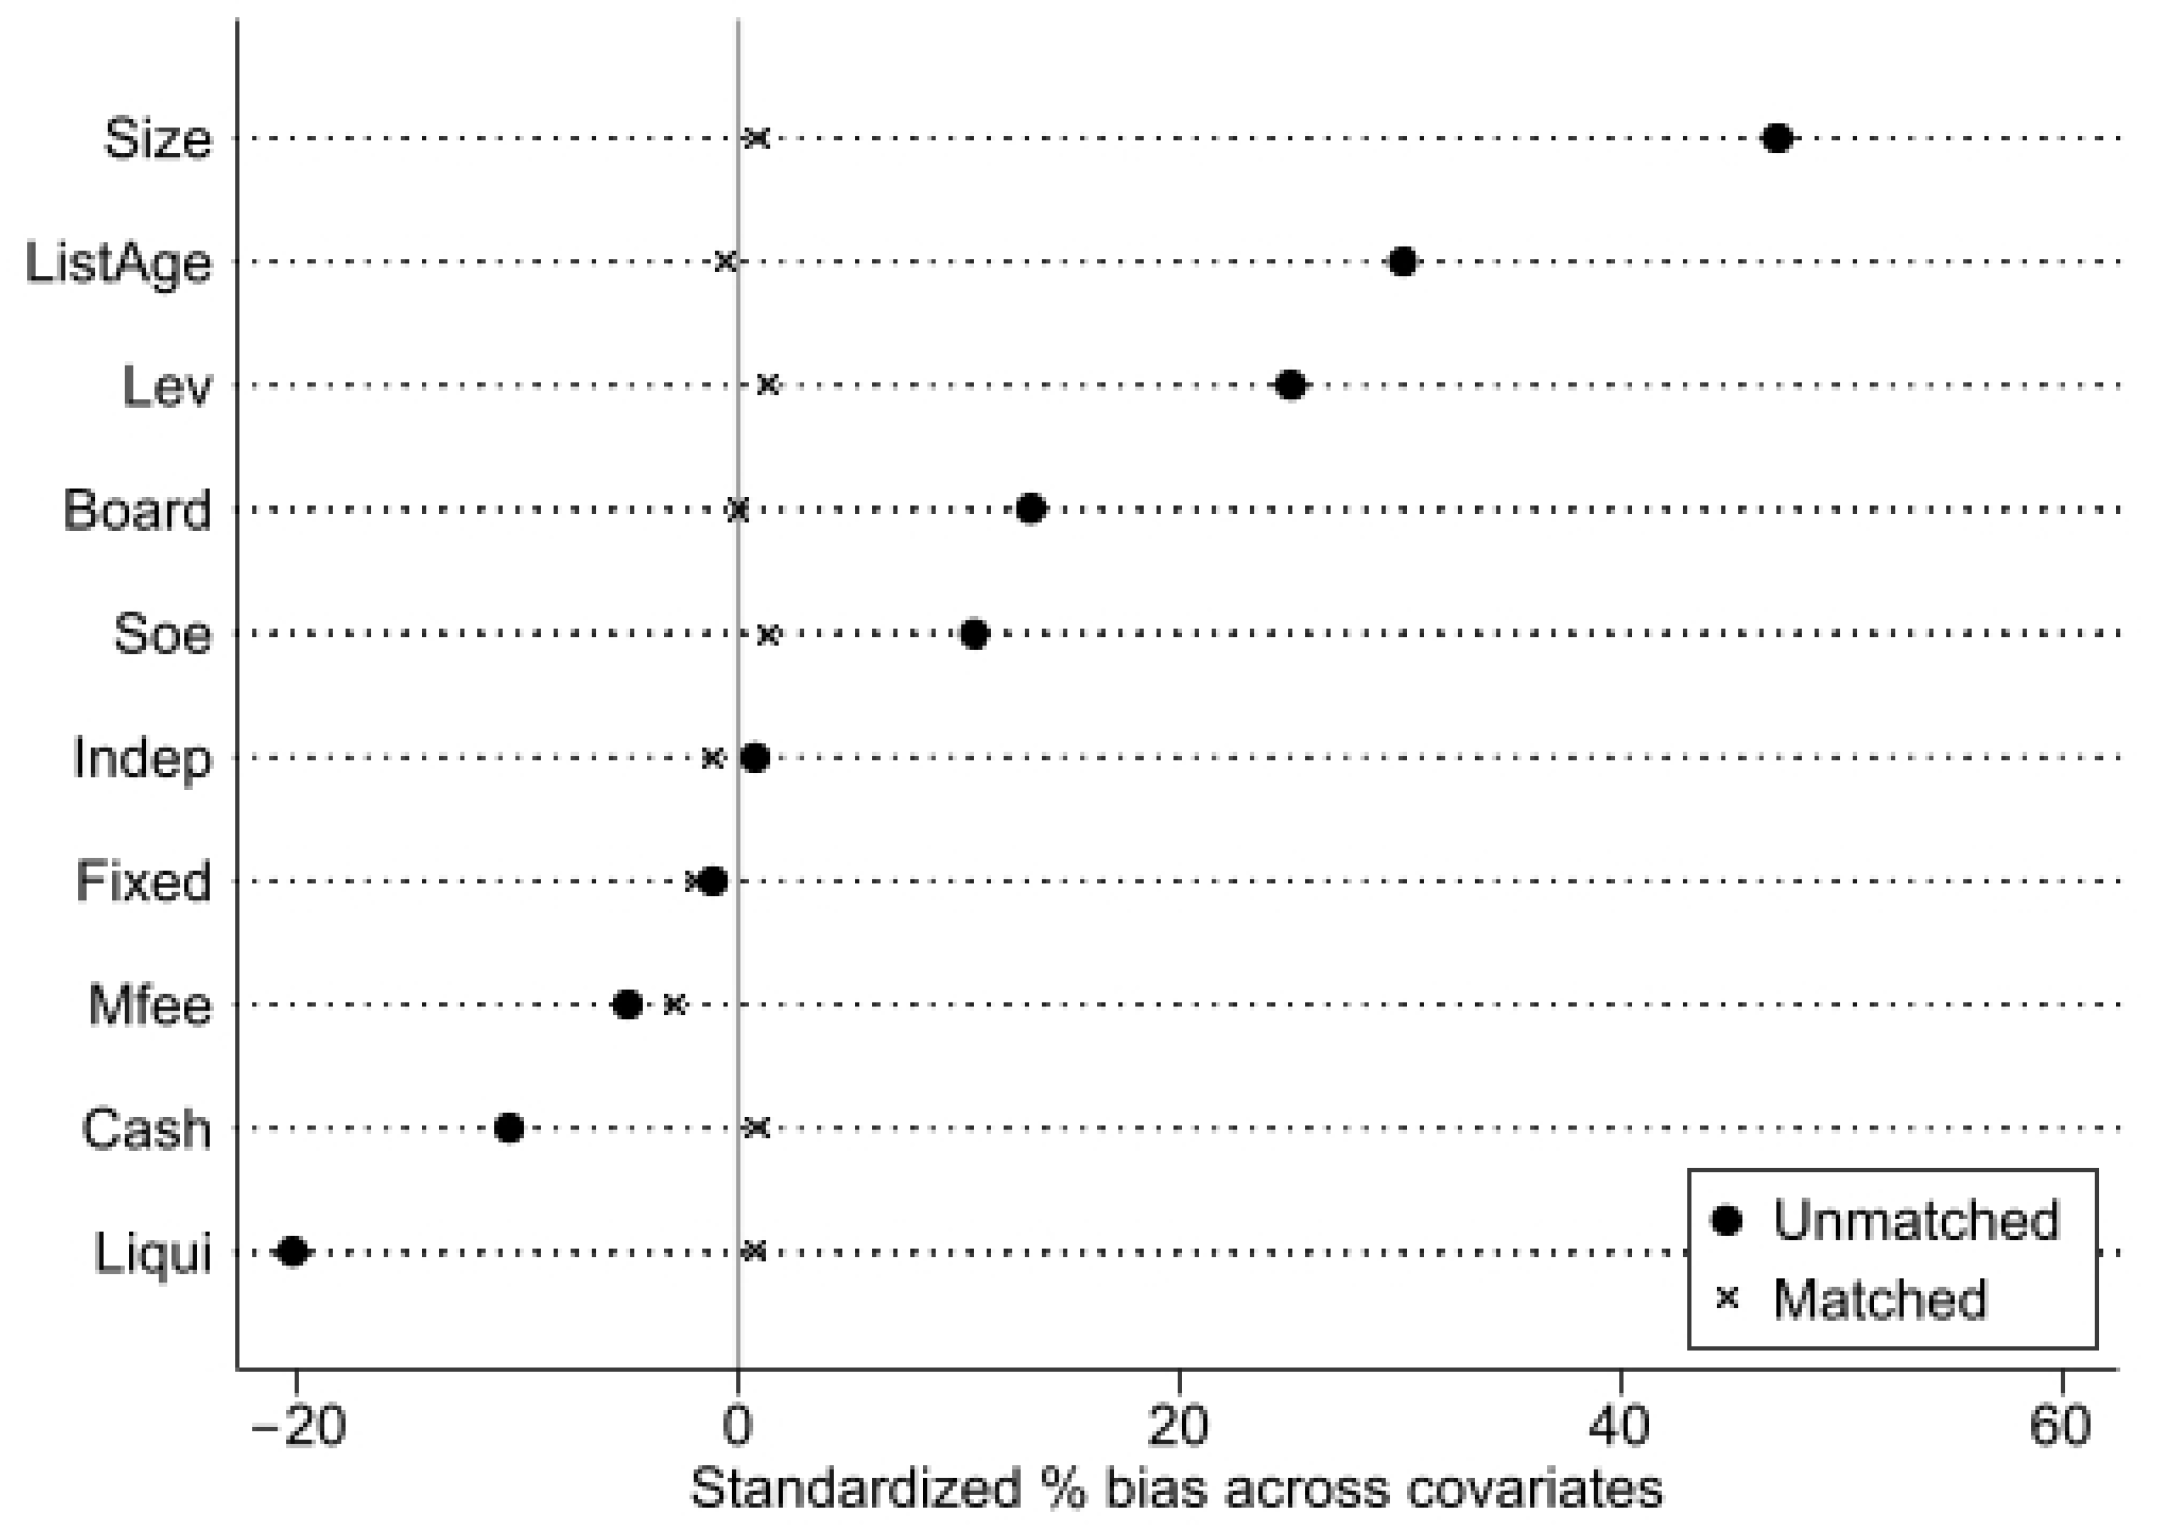
5.6. Endogeneity Test
5.7. Heterogeneity Analysis
6. Discussion and Implications
6.1. Discussion
6.2. Theoretical Implications
6.3. Management Implications
6.4. Limitations and Future Research
Author Contributions
Funding
Data Availability Statement
Conflicts of Interest
References
- Cheng, Y.; Wang, M.; Xiong, Y.; Huang, Z. Towards the United Nations sustainable development goals: Evidence from ESG performance, labor share and environmental governance pressure in China. J. Clean. Prod. 2025, 486, 144465. [Google Scholar] [CrossRef]
- Arzo, S.; Hong, M. A roadmap to SDGs-emergence of technological innovation and infrastructure development for social progress and mobility. Environ. Res. 2024, 246, 118102. [Google Scholar] [CrossRef] [PubMed]
- Omar, A.; Kirchoff, J.F.; Russo, I.; Gligor, D.M. Understanding the dynamics of global supply chain sustainability initiatives: The role of institutional distance from the buyer’s perspective. J. Purch. Supply Manag. 2022, 28, 100792. [Google Scholar] [CrossRef]
- Drempetic, S.; Klein, C.; Zwergel, B. The Influence of Firm Size on the ESG Score: Corporate Sustainability Ratings Under Review. J. Bus. Ethics 2020, 167, 333–360. [Google Scholar] [CrossRef]
- Liu, X.; Cifuentes-Faura, J.; Zhao, S.; Wang, L. The impact of government environmental attention on firms’ ESG performance: Evidence from China. Res. Int. Bus. Financ. 2024, 67, 102124. [Google Scholar] [CrossRef]
- Han, L.; Shi, Y.; Zheng, J. Can green credit policies improve corporate ESG performance? Sustain. Dev. 2024, 32, 2678–2699. [Google Scholar] [CrossRef]
- Sun, Q.; Li, Y.; Hong, A. Integrating ESG into Corporate Strategy: Unveiling the Moderating Effect of Digital Transformation on Green Innovation through Employee Insights. Systems 2024, 12, 148. [Google Scholar] [CrossRef]
- Martiny, A.; Taglialatela, J.; Testa, F.; Iraldo, F. Determinants of environmental social and governance (ESG) performance: A systematic literature review. J. Clean. Prod. 2024, 456, 142213. [Google Scholar] [CrossRef]
- Karaman, A.S.; Ellili, N.O.D.; Uyar, A. Do sustainable supply chain practices mitigate carbon emissions? The role of supplier environmental, social and governance training. Bus. Strategy Environ. 2024, 33, 8126–8148. [Google Scholar] [CrossRef]
- Jia, F.; Xu, Y.; Chen, L.; Fernandes, K. Does supply chain concentration improve sustainability performance: The role of operational slack and information transparency. Int. J. Oper. Prod. Manag. 2024, 44, 1831–1862. [Google Scholar] [CrossRef]
- Chai, B.; Sultan, S.M.; Tanveer, A.; Muhammad, A.Q. How uncertainty can determine corporate ESG performance? Corp. Soc. Responsib. Environ. Manag. 2024, 31, 2290–2310. [Google Scholar] [CrossRef]
- Vural-Yavas, C. Economic policy uncertainty, stakeholder engagement, and environmental, social, and governance practices: The moderating effect of competition. Corp. Soc. Responsib. Environ. Manag. 2021, 28, 82–102. [Google Scholar] [CrossRef]
- Tian, L.; Tian, W.; Guo, M. Can supply chain digitalization open the way to sustainable development? Evidence from corporate ESG performance. Corp. Soc. Responsib. Environ. Manag. 2025, 32, 2332–2346. [Google Scholar] [CrossRef]
- Huarng, K.; Yu, T.H. Causal complexity analysis of ESG performance. J. Bus. Res. 2024, 170, 114327. [Google Scholar] [CrossRef]
- Kovacs, B.B.; Neszveda, G.; Baranyai, E.; Zaremba, A. ESG unpacked: Environmental, social, and governance pillars and the stock price reaction to the invasion of Ukraine. Eurasian Bus. Rev. 2024, 14, 755–777. [Google Scholar] [CrossRef]
- Hou, Z.; Li, D.; Jin, F.; Zhang, Y.; And Luo, W. Green supply chain knowledge networks and corporate ESG performance: The role of green technology innovation and knowledge integration capability. Int. J. Prod. Res. 2025, 1–22. [Google Scholar] [CrossRef]
- Wang, Q.; Zhou, H.; Zhao, X. The role of supply chain diversification in mitigating the negative effects of supply chain disruptions in COVID-19. Int. J. Oper. Prod. Manag. 2024, 44, 99–132. [Google Scholar] [CrossRef]
- Yin, W.; Ran, W. Supply Chain Diversification, Digital Transformation, and Supply Chain Resilience: Configuration Analysis Based on fsQCA. Sustainability 2022, 14, 7690. [Google Scholar] [CrossRef]
- Guo, X.; Pang, W. The impact of digital transformation on corporate ESG performance. Financ. Res. Lett. 2025, 72, 106518. [Google Scholar] [CrossRef]
- Khan, M.A. ESG disclosure and Firm performance: A bibliometric and meta analysis. Res. Int. Bus. Financ. 2022, 61, 101668. [Google Scholar] [CrossRef]
- Truant, E.; Borlatto, E.; Crocco, E.; Sahore, N. Environmental, social and governance issues in supply chains. A systematic review for strategic performance. J. Clean. Prod. 2024, 434, 140024. [Google Scholar] [CrossRef]
- Yuen, K.F.; Wang, X.; Wong, Y.D.; Li, K.X. The role of stakeholder participation and sustainability integration in maritime transport: A structure-conduct-performance analysis. Transp. Policy 2020, 99, 44–53. [Google Scholar] [CrossRef]
- Porter, M.E. The Structure within Industries and Companies’ Performance. Rev. Econ. Stat. 1979, 61, 214–227. [Google Scholar] [CrossRef]
- Bain, J.S. Barriers to New Competition: Their Character and Consequences in Manufacturing Industries; Harvard University Press: Cambridge, MA, USA, 1956. [Google Scholar]
- Moudud-Ul-Huq, S. Does bank competition matter for performance and risk-taking? Empirical evidence from BRICS countries. Int. J. Emerg. Mark. 2021, 16, 409–447. [Google Scholar] [CrossRef]
- Ralston, P.M.; Blackhurst, J.; Cantor, D.E.; Crum, M.R. A Structure–Conduct–Performance Perspective of How Strategic Supply Chain Integration Affects Firm Performance. J. Supply Chain Manag. 2015, 51, 47–64. [Google Scholar] [CrossRef]
- Mackelprang, A.W.; Bernardes, E.; Burke, G.J.; Welter, C. Supplier Innovation Strategy and Performance: A Matter of Supply Chain Market Positioning. Decis. Sci. 2018, 49, 660–689. [Google Scholar] [CrossRef]
- Morgan, T.R.; Tokman, M.; Richey, R.G.; Defee, C. Resource commitment and sustainability: A reverse logistics performance process model. Int. J. Phys. Distrib. Logist. Manag. 2018, 48, 164–182. [Google Scholar] [CrossRef]
- Vu, H.T.; Ha, N.M. A Study on the Relationship Between Diversification and Firm Performance Using the GSEM Method. Emerg. Mark. Financ. Trade 2021, 57, 85–107. [Google Scholar] [CrossRef]
- Grover, A.K.; Dresner, M. A theoretical model on how firms can leverage political resources to align with supply chain strategy for competitive advantage. J. Supply Chain Manag. 2022, 58, 48–65. [Google Scholar] [CrossRef]
- Birge, J.R.; Capponi, A.; Chen, P. Disruption and Rerouting in Supply Chain Networks. Oper. Res. 2022, 71, 750–767. [Google Scholar] [CrossRef]
- Huang, J.; Sun, Y.; Zhang, S. Green Technology Innovation and Corporate ESG—Evidence Based on Listed Companies in China. Sustainability 2025, 17, 1410. [Google Scholar] [CrossRef]
- Zhao, X.; Cai, L. Digital transformation and corporate ESG: Evidence from China. Financ. Res. Lett. 2023, 58, 104310. [Google Scholar] [CrossRef]
- Wang, W.; Sun, Z.; Wang, W.; Hua, Q.; Wu, F. The impact of environmental uncertainty on ESG performance: Emotional vs. rational. J. Clean. Prod. 2023, 397, 136528. [Google Scholar] [CrossRef]
- Lin, Y.; Fan, D.; Shi, X.; Fu, M. The effects of supply chain diversification during the COVID-19 crisis: Evidence from Chinese manufacturers. Transp. Res. Part E Logist. Transp. Rev. 2021, 155, 102493. [Google Scholar] [CrossRef]
- Feng, M.; Wang, T. Enhancing digital transformation: Exploring the role of supply chain diversification and dynamic capabilities in Chinese companies. Ind. Manag. Data Syst. 2024, 124, 2467–2496. [Google Scholar] [CrossRef]
- Sharma, A.; Borah, S.B.; Haque, T.; Adhikary, A. Engaging customers and suppliers for environmental sustainability: Investigating the drivers and the effects on firm performance. J. Acad. Mark. Sci. 2024. [Google Scholar] [CrossRef]
- Lin, B.; Zhu, Y. Supply chain configuration and total factor productivity of renewable energy. Renew. Sustain. Energy Rev. 2025, 209, 115140. [Google Scholar] [CrossRef]
- Brandon-Jones, E.; Squire, B.; Autry, C.W.; Petersen, K.J. A Contingent Resource-Based Perspective of Supply Chain Resilience and Robustness. J. Supply Chain Manag. 2014, 50, 55–73. [Google Scholar] [CrossRef]
- Rajesh, R.; Rajeev, A.; Rajendran, C. Corporate social performances of firms in select developed economies: A comparative study. Socio-Econ. Plan. Sci. 2022, 81, 101194. [Google Scholar] [CrossRef]
- Bai, F.; Shang, M.; Huang, Y. Corporate culture and ESG performance: Empirical evidence from China. J. Clean. Prod. 2024, 437, 140732. [Google Scholar] [CrossRef]
- Wong, S.L. The impact of female representation and ethnic diversity in committees on environmental, social and governance performance in Malaysia. Soc. Bus. Rev. 2024, 19, 207–229. [Google Scholar] [CrossRef]
- Liu, H.; Zhang, Z. The impact of managerial myopia on environmental, social and governance (ESG) engagement: Evidence from Chinese firms. Energy Econ. 2023, 122, 106705. [Google Scholar] [CrossRef]
- Cohen, S.; Kadach, I.; Ormazabal, G.; Reichelstein, S. Executive Compensation Tied to ESG Performance: International Evidence. J. Account. Res. 2023, 61, 805–853. [Google Scholar] [CrossRef]
- Zhang, X.; Jiang, Q.; Cifuentes-Faura, J.; Hu, X.; Li, Y. Do tax incentives matter in promoting corporate ESG performance toward sustainable development? Bus. Strategy Environ. 2025, 34, 57–69. [Google Scholar] [CrossRef]
- Gao, D.; Zhou, X.; Wan, J. Unlocking sustainability potential: The impact of green finance reform on corporate ESG performance. Corp. Soc. Responsib. Environ. Manag. 2024, 31, 4211–4226. [Google Scholar] [CrossRef]
- He, X.; Jing, Q.; Chen, H. The impact of environmental tax laws on heavy-polluting enterprise ESG performance: A stakeholder behavior perspective. J. Environ. Manag. 2023, 344, 118578. [Google Scholar] [CrossRef] [PubMed]
- He, F.; Guo, X.; Yue, P. Media coverage and corporate ESG performance: Evidence from China. Int. Rev. Financ. Anal. 2024, 91, 103003. [Google Scholar] [CrossRef]
- Chen, S.; Leng, X.; Luo, K. Supply chain digitalization and corporate ESG performance. Am. J. Econ. Sociol. 2024, 83, 855–881. [Google Scholar] [CrossRef]
- Shen, Y.; Ma, J.; And Wang, W. Supply chain digitization and enterprise ESG performance: A quasi-natural experiment in China. Int. J. Logist. Res. Appl. 2024, 1–23. [Google Scholar] [CrossRef]
- Zhu, Y.; Zhang, Z. Supply chain digitalization and corporate ESG performance: Evidence from supply chain innovation and application pilot policy. Financ. Res. Lett. 2024, 67, 105818. [Google Scholar] [CrossRef]
- Qiao, P.; Xie, Y.; Fung, A.; Feng, K.; Fung, H. Optimizing smart supply chain for enhanced corporate ESG performance. Int. Rev. Financ. Anal. 2025, 97, 103868. [Google Scholar] [CrossRef]
- Yang, Y.; Wang, L.; Yang, D. The conformity effect of ESG performance in supply chain networks. Financ. Res. Lett. 2024, 65, 105555. [Google Scholar] [CrossRef]
- Wang, S.; Hu, H.; Fan, H. Does supply chain finance improve firms’ ESG performance? Econ. Lett. 2025, 247, 112098. [Google Scholar] [CrossRef]
- Qian, Z.; Wang, C.X.; Yang, H. Association between corporate diversification strategies and inventory performance: A firm-level investigation. Int. J. Oper. Prod. Manag. 2025, 45, 88–113. [Google Scholar] [CrossRef]
- Cai, J.; Sharkawi, I.; Taasim, S.I. How does digital transformation promote supply chain diversification? From the perspective of supply chain transaction costs. Financ. Res. Lett. 2024, 63, 105399. [Google Scholar] [CrossRef]
- Dyer, J.H.; Singh, H. The relational view: Cooperative strategy and sources of interorganizational competitive advantage. Acad. Manag. Rev. 1998, 23, 660–679. [Google Scholar]
- Berenguer, G.; Costas Lorenzo, N.; Sáez De Tejada Cuenca, A. The State of Supplier Diversity Initiatives by Large Corporations: The New Sustainable Supply Chain? Prod. Oper. Manag. 2024, 34, 1305009093. [Google Scholar] [CrossRef]
- Greer, B.M.; Maltbia, T.E.; Scott, C.L. Supplier diversity: A missing link in human resource development. Hum. Resour. Dev. Q. 2006, 17, 325–341. [Google Scholar] [CrossRef]
- Lee, H.; Wu, X. Green supplier selection and environmental performance of firms in the Chinese manufacturing industry: The roles of behavior and outcome controls. J. Manuf. Technol. Manag. 2023, 34, 1141–1161. [Google Scholar]
- Richard, O.C.; Su, W.; Peng, M.W.; Miller, C.D. Do external diversity practices boost focal firm performance? The case of supplier diversity. Int. J. Hum. Resour. Manag. 2015, 26, 2227–2247. [Google Scholar] [CrossRef]
- Dangelico, R.M.; Pujari, D.; Pontrandolfo, P. Green Product Innovation in Manufacturing Firms: A Sustainability-Oriented Dynamic Capability Perspective. Bus. Strategy Environ. 2017, 26, 490–506. [Google Scholar] [CrossRef]
- Zhao, Y.; Feng, T.; Shi, H. External involvement and green product innovation: The moderating role of environmental uncertainty. Bus. Strategy Environ. 2018, 27, 1167–1180. [Google Scholar] [CrossRef]
- Wang, L.; Li, M.; Wang, W.; Gong, Y.; Xiong, Y. Green innovation output in the supply chain network with environmental information disclosure: An empirical analysis of Chinese listed firms. Int. J. Prod. Econ. 2023, 256, 108745. [Google Scholar] [CrossRef]
- Jing, H.; Zhang, S. The Impact of Artificial Intelligence on ESG Performance of Manufacturing Firms: The Mediating Role of Ambidextrous Green Innovation. Systems 2024, 12, 499. [Google Scholar] [CrossRef]
- Sharma, M.; Kumar, A.; Luthra, S.; Joshi, S.; Upadhyay, A. The impact of environmental dynamism on low-carbon practices and digital supply chain networks to enhance sustainable performance: An empirical analysis. Bus. Strategy Environ. 2022, 31, 1776–1788. [Google Scholar]
- Ma, Y.M.; Deng, Z.; Teng, Y.; Yang, Z.; Zheng, X.V. Firms’ multi-sided platform construction efforts and ESG performance: An information processing theory perspective. Ind. Mark. Manag. 2023, 115, 455–469. [Google Scholar] [CrossRef]
- Menanno, M.; Savino, M.M.; Accorsi, R. Digitalization of Fresh Chestnut Fruit Supply Chain through RFID: Evidence, Benefits and Managerial Implications. Appl. Sci. 2023, 13, 5086. [Google Scholar] [CrossRef]
- Wang, Y.; Lo, F.; Huarng, K. What shapes innovative firms’ performance? A multi-level analysis. J. Innov. Knowl. 2024, 9, 100599. [Google Scholar] [CrossRef]
- Lefebvre, V.M.; Sorenson, D.; Henchion, M.; Gellynck, X. Social capital and knowledge sharing performance of learning networks. Int. J. Inform. Manag. 2016, 36, 570–579. [Google Scholar] [CrossRef]
- Zhang, L.; Pu, X.; Cai, Z.; Liu, H.; Liang, L. Uniting partners to cope with environmental uncertainty: Disentangling the role of social capital in developing supply chain agility. J. Purch. Supply Manag. 2023, 29, 100822. [Google Scholar] [CrossRef]
- Donkor, F.; Papadopoulos, T.; Spiegler, V. The supply chain integration—Supply chain sustainability relationship in the UK and Ghana pharmaceutical industry: A stakeholder and contingency perspective. Transp. Res. Part E Logist. Transp. Rev. 2021, 155, 102477. [Google Scholar] [CrossRef]
- Liang, Y.; Tan, Q.; Pang, J. Bless or curse, how does extreme temperature shape heavy pollution companies’ ESG performance?—Evidence from China. Energ. Econ. 2024, 131, 107378. [Google Scholar] [CrossRef]
- Sun, L.; Ong, T.S.; Teh, B.H.; Di Vaio, A. Sustainable performance measurement through digital transformation within the sustainable development framework: The mediating effect of supply chain concentration. Sustain. Dev. 2024, 32, 5895–5912. [Google Scholar] [CrossRef]
- Xu, Y.; Yuan, L.; Khalfaoui, R.; Radulescu, M.; Mallek, S.; Zhao, X. Making technological innovation greener: Does firm digital transformation work? Technol. Forecast. Soc. Change 2023, 197, 122928. [Google Scholar] [CrossRef]
- Ghosh, D.; Olsen, L. Environmental uncertainty and managers’ use of discretionary accruals. Account. Organ. Soc. 2009, 34, 188–205. [Google Scholar] [CrossRef]
- Khalid, F.; Irfan, M.; Srivastava, M. The impact of digital inclusive finance on ESG disputes: Evidence from Chinese non-financial listed companies. Technol. Forecast. Soc. Change 2024, 204, 123415. [Google Scholar] [CrossRef]
- Hausman, J.A. Specification Tests in Econometrics. Econometrica 1978, 46, 1251–1271. [Google Scholar] [CrossRef]
- Baron, R.M.; Kenny, D.A. The moderator–mediator variable distinction in social psychological research: Conceptual, strategic, and statistical considerations. J. Personal. Soc. Psychol. 1986, 51, 1173. [Google Scholar] [CrossRef]
- Wen, W.; Ke, Y.; Liu, X. Customer concentration and corporate social responsibility performance: Evidence from China. Emerg. Mark. Rev. 2021, 46, 100755. [Google Scholar] [CrossRef]
- Cinelli, C.; Hazlett, C. Making Sense of Sensitivity: Extending Omitted Variable Bias. J. R. Stat. Soc. Ser. B Stat. Methodol. 2020, 82, 39–67. [Google Scholar] [CrossRef]
- Zhao, C.; Gan, Z.; Xu, Z. Supply chain ESG and non-financial corporate shadow banking: Evidence from China. Financ. Res. Lett. 2024, 66, 105682. [Google Scholar] [CrossRef]
- Zheng, S.; Zhang, Q.; Zhang, P. Can customer concentration affect corporate ESG performance? Financ. Res. Lett. 2023, 58, 104432. [Google Scholar] [CrossRef]
- Qi, Y.; Han, M.; Zhang, C. The Synergistic Effects of Digital Technology Application and ESG Performance on Corporate Performance. Financ. Res. Lett. 2024, 61, 105007. [Google Scholar] [CrossRef]
- Albuquerque, R.; Koskinen, Y.; Zhang, C. Corporate Social Responsibility and Firm Risk: Theory and Empirical Evidence. Manag. Sci. 2018, 65, 4451–4469. [Google Scholar] [CrossRef]
- Bhandari, K.R.; Ranta, M.; Salo, J. The resource-based view, stakeholder capitalism, ESG, and sustainable competitive advantage: The firm’s embeddedness into ecology, society, and governance. Bus. Strategy Environ. 2022, 31, 1525–1537. [Google Scholar] [CrossRef]
- Khamisu, M.S.; Paluri, R.A.; Sonwaney, V. Stakeholders’ perspectives on critical success factors for environmental social and governance (ESG) implementation. J. Environ. Manag. 2024, 365, 121583. [Google Scholar] [CrossRef]
- Baldini, M.; Maso, L.D.; Liberatore, G.; Mazzi, F.; Terzani, S. Role of Country- and Firm-Level Determinants in Environmental, Social, and Governance Disclosure. J. Bus. Ethics 2018, 150, 79–98. [Google Scholar] [CrossRef]
- Cambrea, D.R.; Paolone, F.; Cucari, N. Advisory or monitoring role in ESG scenario: Which women directors are more influential in the Italian context? Bus. Strategy Environ. 2023, 32, 4299–4314. [Google Scholar] [CrossRef]
- Gillan, S.L.; Koch, A.; Starks, L.T. Firms and social responsibility: A review of ESG and CSR research in corporate finance. J. Corp. Financ. 2021, 66, 101889. [Google Scholar] [CrossRef]
- Crace, L.; Gehman, J. What Really Explains ESG Performance? Disentangling the Asymmetrical Drivers of the Triple Bottom Line. Organ. Environ. 2022, 36, 150–178. [Google Scholar] [CrossRef]


| Reference | Theory | Independent Variable | Key Findings |
|---|---|---|---|
| Tian et al. [13] | Stakeholder theory | Supply chain digitalization | Supply chain digitalization improves ESG by enhancing internal operational efficiency, increasing inter-firm trade credit, and strengthening external oversight |
| Shen et al. [50] | None | Supply chain digitalization | Supply chain digitalization can alleviate financing constraints and improve corporate governance, thereby enhancing ESG |
| Zhu and Zhang [51] | None | Supply chain digitalization | Supply chain digitalization can enhance ESG performance by strengthening corporate governance, improving total factor productivity, and alleviating financing constraints |
| Chen et al. [49] | None | Supply chain digitalization | Supply chain digitalization significantly promotes corporate ESG by reducing information asymmetry and alleviating financing constraints |
| Qiao et al. [52] | Resource orchestration theory | Smart supply chain | Smart supply chain practices stimulate corporate social responsibility (CSR) disclosure, thereby enhancing ESG |
| Yang et al. [53] | None | Supply chain network | Peer companies within the supply chain network can significantly enhance the ESG performance of the target company |
| Hou et al. [16] | Knowledge-based theory, social network theory, and dynamic capabilities theory, Structure–conduct–performance framework | Green supply chain knowledge network | The green supply chain knowledge network fosters corporate green technology innovation and enhances ESG performance, with knowledge integration capability exhibiting a positive moderating effect |
| Wang et al. [54] | None | Supply chain finance | Supply chain finance can alleviate financial constraints and strengthen oversight to enhance ESG |
| Our research | Structure–conduct–performance framework | Supply chain diversification | SCD can enhance green innovation and digital transformation, thereby strengthening ESG performance. Environmental uncertainty (EU) positively moderates the relationship between SCD and ESG performance |
| Type | Variable Name | Symbol | Variable Measurement |
|---|---|---|---|
| Dependent variables | ESG performance | ESG | Huazheng ESG rating index |
| Independent variables | Supply chain diversification | SCD | (supplier diversification + customer diversification)/2 |
| Mechanism variable | Green innovation | GI | Ln (total number of green patent applications + 1) |
| Digital transformation | DT | Ln (digital transformation word frequency + 1) | |
| Moderating variables | Environmental uncertainty | EU | Measured by the coefficient of variation of industry-adjusted firms’ sales revenue over the past 5 years. |
| Control variables | Company size | Size | Ln (total assets) |
| Total leverage ratio | Lev | Total liabilities/Total assets | |
| Listing age | ListAge | Ln (2023-year of listing + 1) | |
| Cash holdings | Cash | (Monetary funds + trading financial assets)/Total assets | |
| Number of board members | Board | Ln (number of directors) | |
| Proportion of independent directors | Indep | Number of independent directors/Total number of board members | |
| Ownership nature | Soe | 1 for state-owned holding enterprises and 0 for others | |
| Cash equivalents | Liqui | Short-term investments/Total assets | |
| Management fee ratio | Mfee | Administrative expenses/revenue | |
| Fixed assets ratio | Fixed | Net fixed assets/total assets |
| Variable | N | Mean | SD | Min | Max | VIF |
|---|---|---|---|---|---|---|
| ESG | 35,316 | 4.155 | 0.934 | 1.000 | 6.750 | - |
| SCD | 35,316 | −0.340 | 0.169 | −0.897 | −0.033 | 1.076 |
| Size | 35,316 | 22.200 | 1.288 | 18.96 | 26.44 | 1.740 |
| Lev | 35,316 | 0.407 | 0.204 | 0.008 | 0.999 | 2.683 |
| ListAge | 35,316 | 2.033 | 0.931 | 0.000 | 3.434 | 1.575 |
| Cash | 35,316 | 0.216 | 0.152 | 0.012 | 0.841 | 1.693 |
| Board | 35,316 | 2.269 | 0.254 | 1.609 | 2.996 | 1.157 |
| Indep | 35,316 | 0.385 | 0.075 | 0.231 | 0.615 | 1.055 |
| Soe | 35,316 | 0.290 | 0.454 | 0.000 | 1.000 | 1.360 |
| Liqui | 35,316 | 0.069 | 0.203 | −0.602 | 0.613 | 2.343 |
| Mfee | 35,316 | 0.084 | 0.065 | 0.007 | 0.502 | 1.219 |
| Fixed | 35,316 | 0.202 | 0.150 | 0.001 | 0.708 | 1.631 |
| Variable | ESG | SCD | Size | Lev | ListAge | Cash | Board |
|---|---|---|---|---|---|---|---|
| ESG | 1 | ||||||
| SCD | 0.132 *** | 1 | |||||
| Size | 0.202 *** | 0.230 *** | 1 | ||||
| Lev | −0.124 *** | 0.136 *** | 0.485 *** | 1 | |||
| ListAge | −0.131 *** | 0.151 *** | 0.451 *** | 0.379 *** | 1 | ||
| Cash | 0.156 *** | −0.072 *** | −0.230 *** | −0.451 *** | −0.324 *** | 1 | |
| Board | −0.059 *** | 0.056 *** | 0.238 *** | 0.174 *** | 0.226 *** | −0.118 *** | 1 |
| Indep | 0.078 *** | 0.019 *** | −0.069 *** | −0.065 *** | −0.078 *** | 0.028 *** | −0.195 *** |
| Soe | 0.029 *** | 0.040 *** | 0.345 *** | 0.269 *** | 0.426 *** | −0.132 *** | 0.279 *** |
| Liqui | 0.147 *** | −0.091 *** | −0.356 *** | −0.619 *** | −0.349 *** | 0.211 *** | −0.186 *** |
| Mfee | −0.142 *** | −0.031 *** | −0.347 *** | −0.233 *** | −0.053 *** | 0.072 *** | −0.020 *** |
| Fixed | −0.081 *** | −0.053 *** | 0.119 *** | 0.104 *** | 0.136 *** | −0.364 *** | 0.117 *** |
| Indep | Soe | Liqui | Mfee | Fixed | |||
| Indep | 1 | ||||||
| Soe | −0.163 *** | 1 | |||||
| Liqui | 0.070 *** | −0.253 *** | 1 | ||||
| Mfee | 0.027 *** | −0.085 *** | 0.058 *** | 1 | |||
| Fixed | −0.044 *** | 0.166 *** | −0.400 *** | −0.082 *** | 1 |
| Variable | (1) | (2) | (3) | (4) |
|---|---|---|---|---|
| ESG | ESG | ESG | ESG | |
| SCD | 0.208 *** | 0.203 *** | ||
| (2.958) | (2.972) | |||
| CD | 0.152 *** | |||
| (2.824) | ||||
| SD | 0.084 * | |||
| (1.690) | ||||
| Size | 0.243 *** | 0.245 *** | 0.246 *** | |
| (13.574) | (13.761) | (13.827) | ||
| Lev | −0.654 *** | −0.654 *** | −0.653 *** | |
| (−9.026) | (−9.030) | (−8.995) | ||
| ListAge | −0.242 *** | −0.241 *** | −0.240 *** | |
| (−12.594) | (−12.560) | (−12.504) | ||
| Cash | 0.132 ** | 0.131 ** | 0.128 ** | |
| (2.038) | (2.020) | (1.982) | ||
| Board | −0.186 *** | −0.186 *** | −0.186 *** | |
| (−7.919) | (−7.900) | (−7.898) | ||
| Indep | 0.382 *** | 0.383 *** | 0.381 *** | |
| (5.298) | (5.309) | (5.287) | ||
| Soe | 0.057 * | 0.056 * | 0.056 * | |
| (1.851) | (1.830) | (1.828) | ||
| Liqui | 0.157 *** | 0.156 ** | 0.156 ** | |
| (2.585) | (2.566) | (2.557) | ||
| Mfee | −1.100 *** | −1.089 *** | −1.098 *** | |
| (−7.762) | (−7.676) | (−7.736) | ||
| FIXED | −0.123 | −0.120 | −0.117 | |
| (−1.332) | (−1.298) | (−1.260) | ||
| _cons | 4.226 *** | −0.073 | −0.149 | −0.195 |
| (176.433) | (−0.181) | (−0.373) | (−0.488) | |
| Firms/Year/Ind FE | Yes | Yes | Yes | Yes |
| N | 35,316 | 35,316 | 35,316 | 35,316 |
| R2 | 0.565 | 0.587 | 0.587 | 0.587 |
| Variable | (1) | (2) | (3) | (4) | (5) |
|---|---|---|---|---|---|
| GI | ESG | DT | ESG | ESG | |
| SCD | 0.160 ** | 0.196 *** | 0.289 *** | 0.196 *** | 0.145 * |
| (2.344) | (2.870) | (3.626) | (2.861) | (1.960) | |
| GI | 0.041 *** | ||||
| (5.561) | |||||
| DT | 0.025 *** | ||||
| (3.382) | |||||
| EU | −0.048 *** | ||||
| (−7.504) | |||||
| SCD×EU | 0.057 * | ||||
| (1.866) | |||||
| Size | 0.361 *** | 0.228 *** | 0.210 *** | 0.238 *** | 0.251 *** |
| (17.785) | (12.724) | (10.263) | (13.196) | (13.106) | |
| Lev | 0.007 | −0.653 *** | −0.198 ** | −0.649 *** | −0.576 *** |
| (0.108) | (−9.032) | (−2.414) | (−8.944) | (−7.603) | |
| ListAge | −0.061 *** | −0.240 *** | 0.175 *** | −0.246 *** | −0.239 *** |
| (−3.166) | (−12.503) | (7.902) | (−12.829) | (−11.210) | |
| Cash | −0.140 ** | 0.138 ** | −0.247 *** | 0.138 ** | 0.132 * |
| (−2.332) | (2.137) | (−3.435) | (2.136) | (1.928) | |
| Board | 0.015 | −0.187 *** | 0.099 *** | −0.189 *** | −0.163 *** |
| (0.645) | (−7.947) | (4.283) | (−8.019) | (−6.488) | |
| Indep | 0.078 | 0.377 *** | −0.166 ** | 0.386 *** | 0.330 *** |
| (1.162) | (5.244) | (−2.373) | (5.354) | (4.211) | |
| Soe | 0.083 *** | 0.053 * | −0.049 | 0.058 * | 0.028 |
| (2.732) | (1.729) | (−1.513) | (1.894) | (0.627) | |
| Liqui | 0.054 | 0.156 ** | −0.027 | 0.158 *** | 0.172 *** |
| (0.952) | (2.557) | (−0.411) | (2.596) | (2.642) | |
| Mfee | 0.279 ** | −1.112 *** | −0.135 | −1.096 *** | −1.121 *** |
| (2.117) | (−7.865) | (−0.896) | (−7.738) | (−7.412) | |
| Fixed | −0.014 | −0.123 | −0.544 *** | −0.110 | −0.108 |
| (−0.154) | (−1.333) | (−5.203) | (−1.186) | (−1.107) | |
| _cons | −6.994 *** | 0.217 | −3.242 *** | 0.009 | −0.275 |
| (−15.440) | (0.540) | (−7.046) | (0.023) | (−0.641) | |
| Firms/Year/Ind FE | Yes | Yes | Yes | Yes | Yes |
| N | 35,278 | 35,278 | 35,316 | 35,316 | 29,697 |
| R2 | 0.762 | 0.588 | 0.821 | 0.588 | 0.613 |
| Variable | (1) | (2) | (3) | (4) | (5) |
|---|---|---|---|---|---|
| ESG | ESG | ESG | ESG | ESG | |
| SCD | 0.165 ** | 0.205 ** | 0.264 *** | 0.208 ** | 0.137 * |
| (2.575) | (2.020) | (2.860) | (2.277) | (1.761) | |
| Size | 0.209 *** | 0.243 *** | 0.249 *** | 0.252 *** | 0.190 *** |
| (9.964) | (11.409) | (9.336) | (10.643) | (9.296) | |
| Lev | −0.397 *** | −0.745 *** | −0.432 *** | −0.625 *** | −0.834 *** |
| (−5.557) | (−8.853) | (−4.222) | (−6.625) | (−10.064) | |
| ListAge | −0.130 *** | −0.230 *** | −0.308 *** | −0.307 *** | −0.105 *** |
| (−4.408) | (−9.735) | (−9.829) | (−12.539) | (−4.798) | |
| Cash | −0.185 *** | 0.111 | 0.216 ** | 0.112 | 0.239 *** |
| (−3.138) | (1.460) | (2.558) | (1.419) | (3.396) | |
| Board | −0.045 ** | −0.189 *** | −0.195 *** | −0.181 *** | −0.207 *** |
| (−2.142) | (−6.802) | (−5.988) | (−6.480) | (−8.147) | |
| Indep | 0.154 ** | 0.345 *** | 0.273 *** | 0.384 *** | 0.524 *** |
| (2.346) | (3.932) | (2.798) | (4.506) | (6.814) | |
| Soe | −0.137 *** | 0.010 | 0.085 | 0.050 | 0.078 |
| (−5.627) | (0.254) | (1.176) | (1.172) | (1.630) | |
| Liqui | −0.016 | 0.144 ** | 0.294 *** | 0.168 ** | 0.129 * |
| (−0.280) | (2.041) | (3.372) | (2.216) | (1.904) | |
| Mfee | −0.452 *** | −1.281 *** | −0.492 *** | −1.283 *** | −1.637 *** |
| (−2.953) | (−7.851) | (−2.795) | (−6.338) | (−10.609) | |
| Fixed | −0.064 | −0.125 | 0.112 | −0.069 | −0.274 *** |
| (−0.697) | (−1.153) | (0.908) | (−0.643) | (−2.761) | |
| _cons | 2.020 *** | −0.092 | −0.231 | −0.177 | 0.891 * |
| (4.392) | (−0.194) | (−0.385) | (−0.335) | (1.938) | |
| Firms/Year/Ind FE | Yes | Yes | Yes | Yes | Yes |
| N | 35,316 | 25,093 | 23,752 | 22,353 | 22,353 |
| R2 | 0.587 | 0.589 | 0.685 | 0.577 | 0.610 |
| Variable | (1) | (2) | (3) | (4) | (5) | (6) |
|---|---|---|---|---|---|---|
| ESG | ESG | ESG | ESG | ESG | ESG | |
| θ0 | 0.248 *** (0.044) | 0.361 *** (0.047) | 0.392 *** (0.048) | 0.579 *** (0.038) | 0.198 *** (0.046) | 0.462 *** (0.028) |
| DML model | RF | GBDT | RR | SVM | Lasso | NN |
| Control | Yes | Yes | Yes | Yes | Yes | Yes |
| Firms/Year /Ind FE | Yes | Yes | Yes | Yes | Yes | Yes |
| N | 35,316 | 35,316 | 35,316 | 35,316 | 35,316 | 35,316 |
| Variable | 2SLS | Heckman Two-Step Method | PSM | ||
|---|---|---|---|---|---|
| (1) | (2) | (3) | (4) | (5) | |
| SCD | ESG | ESG_Dum | ESG | ESG | |
| SCD_IV1 | 0.896 *** | ||||
| (28.852) | |||||
| Mandatory | 0.731 *** | ||||
| (15.548) | |||||
| IMR | −0.655 *** | −0.655 *** | |||
| (−8.807) | (−8.807) | ||||
| SCD | 0.355 ** | 0.200 *** | 0.203 *** | ||
| (2.391) | (2.751) | (2.971) | |||
| Size | 0.034 *** | 0.278 *** | 0.277 *** | 0.102 *** | 0.243 *** |
| (16.888) | (26.269) | (17.791) | (4.122) | (13.535) | |
| Lev | −0.001 | −0.709 *** | −0.925 *** | −0.165 * | −0.651 *** |
| (−0.088) | (−10.354) | (−8.652) | (−1.797) | (−8.987) | |
| ListAge | 0.011 *** | −0.210 *** | −0.233 *** | −0.168 *** | −0.241 *** |
| (4.423) | (−18.579) | (−13.717) | (−7.508) | (−12.545) | |
| Cash | −0.028 ** | 0.557 *** | 0.531 *** | −0.075 | 0.133 ** |
| (−1.982) | (8.539) | (5.207) | (−1.028) | (2.052) | |
| Board | 0.005 | −0.223 *** | −0.215 *** | −0.082 *** | −0.185 *** |
| (0.790) | (−7.696) | (−4.877) | (−3.014) | (−7.877) | |
| Indep | 0.051 *** | 0.885 *** | 1.263 *** | −0.202 ** | 0.377 *** |
| (2.967) | (10.478) | (9.487) | (−2.057) | (5.234) | |
| Soe | −0.019 *** | 0.185 *** | 0.124 *** | −0.019 | 0.055 * |
| (−3.923) | (7.239) | (3.404) | (−0.435) | (1.794) | |
| Liqui | −0.022 * | 0.490 *** | 0.405 *** | −0.011 | 0.160 *** |
| (−1.721) | (7.906) | (4.327) | (−0.167) | (2.620) | |
| Mfee | 0.069 ** | −0.922 *** | −1.346 *** | −0.492 *** | −1.098 *** |
| (2.150) | (−6.518) | (−6.257) | (−3.037) | (−7.746) | |
| Fixed | −0.040 ** | −0.082 | 0.356 *** | −0.259 *** | −0.123 |
| (−2.453) | (−1.043) | (2.912) | (−2.591) | (−1.331) | |
| Constant | −0.830 *** | −1.124 *** | −5.808 *** | 3.329 *** | −0.066 |
| (−18.020) | (−4.246) | (−16.506) | (5.810) | (−0.163) | |
| Kleibergen-Paap rk LM | 823.414 *** | ||||
| Cragg-Donald Wald F | 6177.117 *** | ||||
| Stock-Yogo | [16.380] | ||||
| Firms/Year/Ind FE | Yes | Yes | Yes | Yes | Yes |
| N | 35,221 | 35,221 | 31,000 | 30,588 | 35,278 |
| R2 | 0.150 | 0.187 | 0.612 | 0.587 | |
| Variable | (1) | (2) | (3) | (4) | (5) | (6) |
|---|---|---|---|---|---|---|
| ESG | ESG | ESG | ESG | ESG | ESG | |
| SCD | 0.155 * | 0.214 ** | 0.115 | 0.201 ** | 0.176 ** | 0.345 ** |
| (1.703) | (1.969) | (1.228) | (2.069) | (2.245) | (2.497) | |
| Size | 0.209 *** | 0.355 *** | 0.240 *** | 0.257 *** | 0.260 *** | 0.200 *** |
| (6.029) | (11.118) | (10.023) | (10.117) | (12.314) | (5.568) | |
| Lev | −0.649 *** | −0.727 *** | −0.676 *** | −0.657 *** | −0.668 *** | −0.605 *** |
| (−6.441) | (−5.870) | (−6.782) | (−6.695) | (−7.889) | (−4.211) | |
| ListAge | −0.349 *** | −0.087 ** | −0.223 *** | −0.249 *** | −0.232 *** | −0.269 *** |
| (−12.942) | (−2.325) | (−8.065) | (−9.396) | (−10.503) | (−6.467) | |
| Cash | 0.059 | 0.150 | 0.197 ** | 0.037 | 0.233 *** | −0.110 |
| (0.732) | (1.314) | (2.285) | (0.400) | (3.106) | (−0.851) | |
| Board | −0.164 *** | −0.189 *** | −0.160 *** | −0.169 *** | −0.179 *** | −0.196 *** |
| (−5.181) | (−5.339) | (−4.818) | (−4.829) | (−6.576) | (−4.403) | |
| Indep | 0.343 *** | 0.332 *** | 0.415 *** | 0.344 *** | 0.319 *** | 0.535 *** |
| (3.500) | (3.177) | (4.125) | (3.242) | (3.821) | (3.977) | |
| Soe | 0.045 | 0.079 ** | −0.006 | 0.098 ** | 0.077 ** | 0.034 |
| (0.869) | (2.017) | (−0.135) | (2.358) | (2.210) | (0.550) | |
| Liqui | 0.104 | 0.158 | 0.209 *** | 0.141 | 0.120 * | 0.251 ** |
| (1.288) | (1.566) | (2.587) | (1.618) | (1.668) | (2.168) | |
| Mfee | −1.026 *** | −0.983 *** | −1.022 *** | −0.895 *** | −1.076 *** | −1.178 *** |
| (−5.935) | (−3.327) | (−5.508) | (−4.301) | (−7.074) | (−3.080) | |
| Fixed | −0.093 | −0.167 | −0.258 ** | −0.089 | −0.186 | −0.091 |
| (−0.769) | (−1.084) | (−2.102) | (−0.707) | (−1.623) | (−0.654) | |
| _cons | 0.776 | −2.989 *** | −0.114 | −0.430 | −0.447 | 0.915 |
| (1.056) | (−4.068) | (−0.214) | (−0.742) | (−0.946) | (1.125) | |
| Firms/Year/Ind FE | Yes | Yes | Yes | Yes | Yes | Yes |
| N | 17,457 | 17,522 | 17,725 | 16,642 | 25,290 | 9854 |
| R2 | 0.630 | 0.597 | 0.637 | 0.629 | 0.601 | 0.581 |
| Variable | (1) | (2) | (3) | (4) | (5) | (6) |
|---|---|---|---|---|---|---|
| ESG | ESG | ESG | ESG | ESG | ESG | |
| SCD | 0.252 * | 0.267 ** | 0.143 | 0.193 ** | 0.560 *** | 0.003 |
| (1.670) | (2.124) | (1.464) | (2.383) | (3.098) | (0.018) | |
| Size | 0.216 *** | 0.236 *** | 0.266 *** | 0.236 *** | 0.273 *** | 0.272 *** |
| (4.949) | (7.042) | (9.881) | (10.865) | (5.536) | (5.095) | |
| Lev | −0.612 *** | −0.381 *** | −0.817 *** | −0.679 *** | −0.446 ** | −0.608 *** |
| (−3.855) | (−2.874) | (−7.610) | (−8.033) | (−2.132) | (−2.707) | |
| ListAge | −0.151 *** | −0.293 *** | −0.282 *** | −0.253 *** | −0.231 *** | −0.169 *** |
| (−3.139) | (−7.394) | (−10.105) | (−11.233) | (−4.141) | (−2.687) | |
| Cash | −0.044 | 0.046 | 0.178 ** | 0.126 * | 0.311 * | −0.173 |
| (−0.293) | (0.337) | (2.008) | (1.692) | (1.837) | (−0.804) | |
| Board | −0.146 *** | −0.184 *** | −0.192 *** | −0.185 *** | −0.146 ** | −0.232 *** |
| (−3.166) | (−3.921) | (−5.857) | (−6.504) | (−2.365) | (−3.556) | |
| Indep | 0.331 ** | 0.426 *** | 0.347 *** | 0.465 *** | 0.096 | 0.315 |
| (2.109) | (3.185) | (3.466) | (5.508) | (0.509) | (1.453) | |
| Soe | 0.030 | 0.075 | 0.037 | 0.063 | 0.074 | −0.032 |
| (0.549) | (1.300) | (0.759) | (1.623) | (1.174) | (−0.419) | |
| Liqui | 0.054 | 0.350 *** | 0.057 | 0.146 ** | 0.217 | 0.192 |
| (0.406) | (3.072) | (0.648) | (2.037) | (1.421) | (1.050) | |
| Mfee | −0.568 | −1.388 *** | −1.074 *** | −1.137 *** | −0.804 * | −1.252 *** |
| (−1.532) | (−4.740) | (−5.587) | (−6.920) | (−1.926) | (−3.077) | |
| Fixed | −0.396 ** | 0.012 | −0.221 | −0.148 | −0.108 | −0.219 |
| (−2.081) | (0.080) | (−1.550) | (−1.352) | (−0.438) | (−0.944) | |
| _cons | 0.255 | 0.072 | −0.383 | 0.110 | −0.840 | −0.778 |
| (0.261) | (0.095) | (−0.636) | (0.225) | (−0.764) | (−0.636) | |
| Firms/Year/Ind FE | Yes | Yes | Yes | Yes | Yes | Yes |
| N | 7692 | 9496 | 17,293 | 25,554 | 5015 | 3746 |
| R2 | 0.636 | 0.603 | 0.590 | 0.580 | 0.594 | 0.613 |
Disclaimer/Publisher’s Note: The statements, opinions and data contained in all publications are solely those of the individual author(s) and contributor(s) and not of MDPI and/or the editor(s). MDPI and/or the editor(s) disclaim responsibility for any injury to people or property resulting from any ideas, methods, instructions or products referred to in the content. |
© 2025 by the authors. Licensee MDPI, Basel, Switzerland. This article is an open access article distributed under the terms and conditions of the Creative Commons Attribution (CC BY) license (https://creativecommons.org/licenses/by/4.0/).
Share and Cite
Wang, X.; Wu, H.; Shen, Y.; Wang, T. Towards Sustainable Supply Chains: Evaluating the Role of Supply Chain Diversification in Enhancing Corporate ESG Performance. Systems 2025, 13, 266. https://doi.org/10.3390/systems13040266
Wang X, Wu H, Shen Y, Wang T. Towards Sustainable Supply Chains: Evaluating the Role of Supply Chain Diversification in Enhancing Corporate ESG Performance. Systems. 2025; 13(4):266. https://doi.org/10.3390/systems13040266
Chicago/Turabian StyleWang, Xihong, Hui Wu, Yang Shen, and Tao Wang. 2025. "Towards Sustainable Supply Chains: Evaluating the Role of Supply Chain Diversification in Enhancing Corporate ESG Performance" Systems 13, no. 4: 266. https://doi.org/10.3390/systems13040266
APA StyleWang, X., Wu, H., Shen, Y., & Wang, T. (2025). Towards Sustainable Supply Chains: Evaluating the Role of Supply Chain Diversification in Enhancing Corporate ESG Performance. Systems, 13(4), 266. https://doi.org/10.3390/systems13040266