Abstract
Data quality in IoT and smart manufacturing environments is essential for optimizing workflows, enabling predictive maintenance, and supporting informed decisions. However, data from sensors present significant challenges due to their real-time nature, diversity of formats, and high susceptibility to faults such as missing values or inconsistencies. Ensuring high-quality data in these environments is crucial to maintaining operational efficiency and process reliability. This paper analyzes some of the data quality metrics presented in the literature, with a focus on adapting them to the context of Industry 4.0. Initially, three models for the classification of the dimensions of data quality are presented, proposed by different authors, which group together dimensions such as accuracy, completeness, consistency, and timeliness in different approaches. Next, a systematic methodology is adopted to evaluate the metrics related to these dimensions, always using a real-time monitoring scenario. This approach combines dynamic thresholds with historical data to assess the quality of incoming data streams and provide relevant insights. The analysis carried out not only facilitates continuous monitoring of data quality but also supports informed decision-making, helping to improve operational efficiency in Industry 4.0 environments. Finally, this paper presents a table summarizing the selected metrics, highlighting the advantages, disadvantages, and potential usage scenarios, and providing a practical basis for implementation in real environments.
1. Introduction
Data quality is a key factor in the success of data-driven business applications, ensuring integrity and reliability in decision-making processes [1]. With the growing adoption of Internet of Things (IoT) devices and cyber–physical systems (CPSs) in the manufacturing industry, the volume of data generated has increased to record levels, encompassing both structured and unstructured data [2]. These devices, composed of interconnected sensors, produce large quantities of time-series data organized by timestamps [3]. An IoT application may have hundreds or thousands of sensors that generate massive amounts of data [4]. The diversity of data sources and formats poses a significant challenge to ensuring data quality in real time, making the use of advanced monitoring methods essential [5]. In this context, one of the main challenges is the heterogeneity of data sources, especially when it comes to integrating sensor data with other sources [6], combining data from multiple sensors, each with different characteristics, requires advanced techniques to ensure that the resulting data are both reliable and useful [7]. Monitoring data quality plays a key role in identifying and solving these issues, as well as preparing the data for other uses [8].
In a typical Industry 4.0 scenario, sensors monitor variables such as temperature, pressure, and rotation in machinery, providing valuable information for processes like predictive maintenance and operational management. However, these systems face significant challenges in maintaining data quality, including real-time data validation, the integration of legacy systems with modern technologies, and managing the massive volume of data. Many companies store these data without fully leveraging them, resulting in what is referred to as “dark data”, and failing to realize their true potential [9]. Corallo et al. [9] defined dark data in the manufacturing industry as uncatalogued or poorly structured data that are generated, collected, and stored during operations, but remain unanalyzed due to a lack of appropriate analytical tools. This lack of utilization can prevent the generation of valuable insights and compromise operational efficiency.
The presence of missing and incomplete data is also a critical issue in IoT sensor networks, where data gaps can occur due to factors such as sensor failure or environmental conditions. Addressing this challenge requires robust data imputation and error detection techniques [7]. In this context, data quality dimensions such as accuracy, timeliness, completeness, and consistency become increasingly relevant. However, there are still significant gaps in the literature on defining, categorizing, and applying these dimensions in dynamic real-time environments. Effective assessment of these dimensions in such contexts requires automated techniques such as data profiling, which facilitates the identification of anomalies, outliers, and inconsistent patterns, among others. For example, in IoT systems, data profiling can be used to detect sensor failures, such as missing values, enabling problem resolution before production is affected.
This article proposes a comprehensive approach to assessing data quality in IoT-based manufacturing systems, focusing on the application of well-established metrics from the literature, adapted to the needs of real-time environments. The structure of this article is as follows: Section 1 introduces the problem and the main focus of this study. Section 2 provides an overview of various definitions and classifications of data quality dimensions proposed by different authors. Section 3 presents an in-depth analysis of the various metrics and their applications in smart manufacturing. Section 4 discusses the different metrics of each dimension, the challenges associated with dark data, and the use of sketching techniques to analyze large volumes of data. Finally, Section 5 summarizes the conclusions and suggests future directions for research in this area.
2. Related Work
Assessing data quality in smart manufacturing environments is fundamental to ensuring operational efficiency and process reliability. Several recent studies have explored the methodologies and challenges associated with this issue, providing valuable insights for adapting data quality metrics in the context of Industry 4.0.
Rangineni et al. [1] conducted a review on the importance of data quality and its impact on data analytics, addressing several dimensions. The review also examined methodologies and best practices for improving data quality, highlighting the role of data analysis techniques in identifying and correcting inconsistencies, with the aim of optimizing decision-making and operational efficiency in organizations. Some of the techniques included data cleansing, data profiling, and predictive analytics.
Goknil et al. [2] presented a systematic review of data quality in CPS and IoT in the context of Industry 4.0. The authors identified specific challenges related to integrating and managing data from different sources, best practices, and metrics for measuring data quality, software engineering solutions used to manage data quality, and the state of techniques for data repair, cleansing, and monitoring in application domains.
Zhang et al. [10] explored data quality management in IoT, discussing data quality frameworks and methodologies, as well as international standards. The study addressed issues such as dimensions, metrics, and data issues, and proposed solutions to mitigate these issues and ensure the reliability of information used in smart manufacturing processes.
In addition, Liu et al. [11] investigated how data quality affects big data analytics in smart factories and identified related research topics, challenges, and methods. By linking the dimensions of data quality to smart factory issues, the study highlighted the importance of addressing data quality issues to ensure the effectiveness of analytics and the efficiency of manufacturing processes.
Apart from these approaches, recent research has also explored the use of deep learning models and hybrid optimization techniques to improve data analysis and reliability in IoT environments. The study by Al-Zaidawi e Çevik [12] proposed advanced strategies for monitoring IoT networks, such as feedforward neural networks (FFNNs), convolutional neural networks (CNNs), and multilayer perceptrons (MLPs), optimized by hybrid optimization techniques such as hybrid gray wolf optimization with particle swarm optimization (HGWOPSO) and hybrid world cup optimization with Harris hawks optimization (HWCOAHHO). These approaches are designed to balance global and local search processes to improve model building and adaptation in IoT environments. By using complementary search behaviors, they improved convergence speed and increased recognition accuracy through more efficient synergy between global and local search.
2.1. Data Quality
Data quality has become increasingly crucial for all types of organizations, enabling continuous progress and minimizing, or even eliminating, issues related to data integrity [13]. However, data quality does not have a single definition. It is a multifaceted concept that requires careful consideration [14] to meet the specific needs and expectations of each organization [15]. Data quality always depends on the context in which the data are used, not just when they are created; it is critical to identify when data quality is low because it affects business performance.
With the rapid growth of IoT devices and the increasing amount of data they generate, ensuring the quality of these data has become a key challenge. This issue is particularly critical in IoT applications, where data reliability and accuracy are essential for making correct and effective decisions [5]. There are two main reasons why the data quality problem persists in IoT systems [2]. First, sensor readings are often incomplete or corrupted by unpredictable factors like electromagnetic interference, packet loss, or signal processing issues. Second, the collected data often travel long distances across the edge-cloud continuum, which can introduce additional errors, latency, and inconsistencies. Most data quality issues in these scenarios relate to the signal-to-noise ratio [2], making it difficult to extract accurate information from the raw data.
All these problems lead to many different errors in the data, such as anomalies, missing values, deviations, data drift, data noise, constant values, uncertainties, stuck-at-zero/stuck-at-fault [10], outliers, bias, duplicate records, data discontinuity, data imprecision, high dimensionality, data inconsistency, and data veracity [2]. When it comes to multiple data sources, the problems are compounded by variations in data ranges, differences in units of measurement, differences in specifications, and the presence of inherent uncertainties [10]. The most common types of sensor-related data quality errors are outliers and missing values [4]. In addition to the errors that may exist in the data, a significant part of the data generated by sensors remains unexplored and unstructured, which is often referred to as dark data [9]. Dark data encompass uncategorized, unlabeled, and unexplored data that are often ignored by organizations [2]. Despite being generated during routine business operations, these data remain largely untapped due to the lack of sophisticated analytical tools [9]. It is estimated that 90% of the data are hidden, representing a potential opportunity to enrich analysis and improve decision-making in organizations [16]. In smart manufacturing, for example, sensors collect data from machines that often go unanalyzed due to factors such as lack of connectivity or incompatible data formats. However, if exploited, the data could reveal valuable patterns or insights to predict mechanical failures or optimize processes to achieve greater operational efficiency.
The concept of data quality incorporates several dimensions, representing specific attributes or characteristics of the data quality. These dimensions provide a means to assess, quantify, and manage the quality of data [15,17]. For example, a data quality dimension may describe a single aspect of data, such as accuracy or timeliness, and, when measured appropriately, it offers insights into the overall quality of the data [10]. While there is no universal standard for defining these dimensions, they are typically contextual and vary depending on the environment in which the data are used [10,18]. Each dimension reflects a distinct attribute of data, allowing organizations to interpret and improve data quality systematically [2]. Identifying these dimensions serves as the foundation for assessing data quality effectively and initiating continuous improvement activities [19]. Establishing clear criteria for evaluation ensures that the data align with established needs and expectations. Furthermore, the ability to detect and mitigate issues in real-time is crucial for maintaining the integrity and usefulness of IoT data.
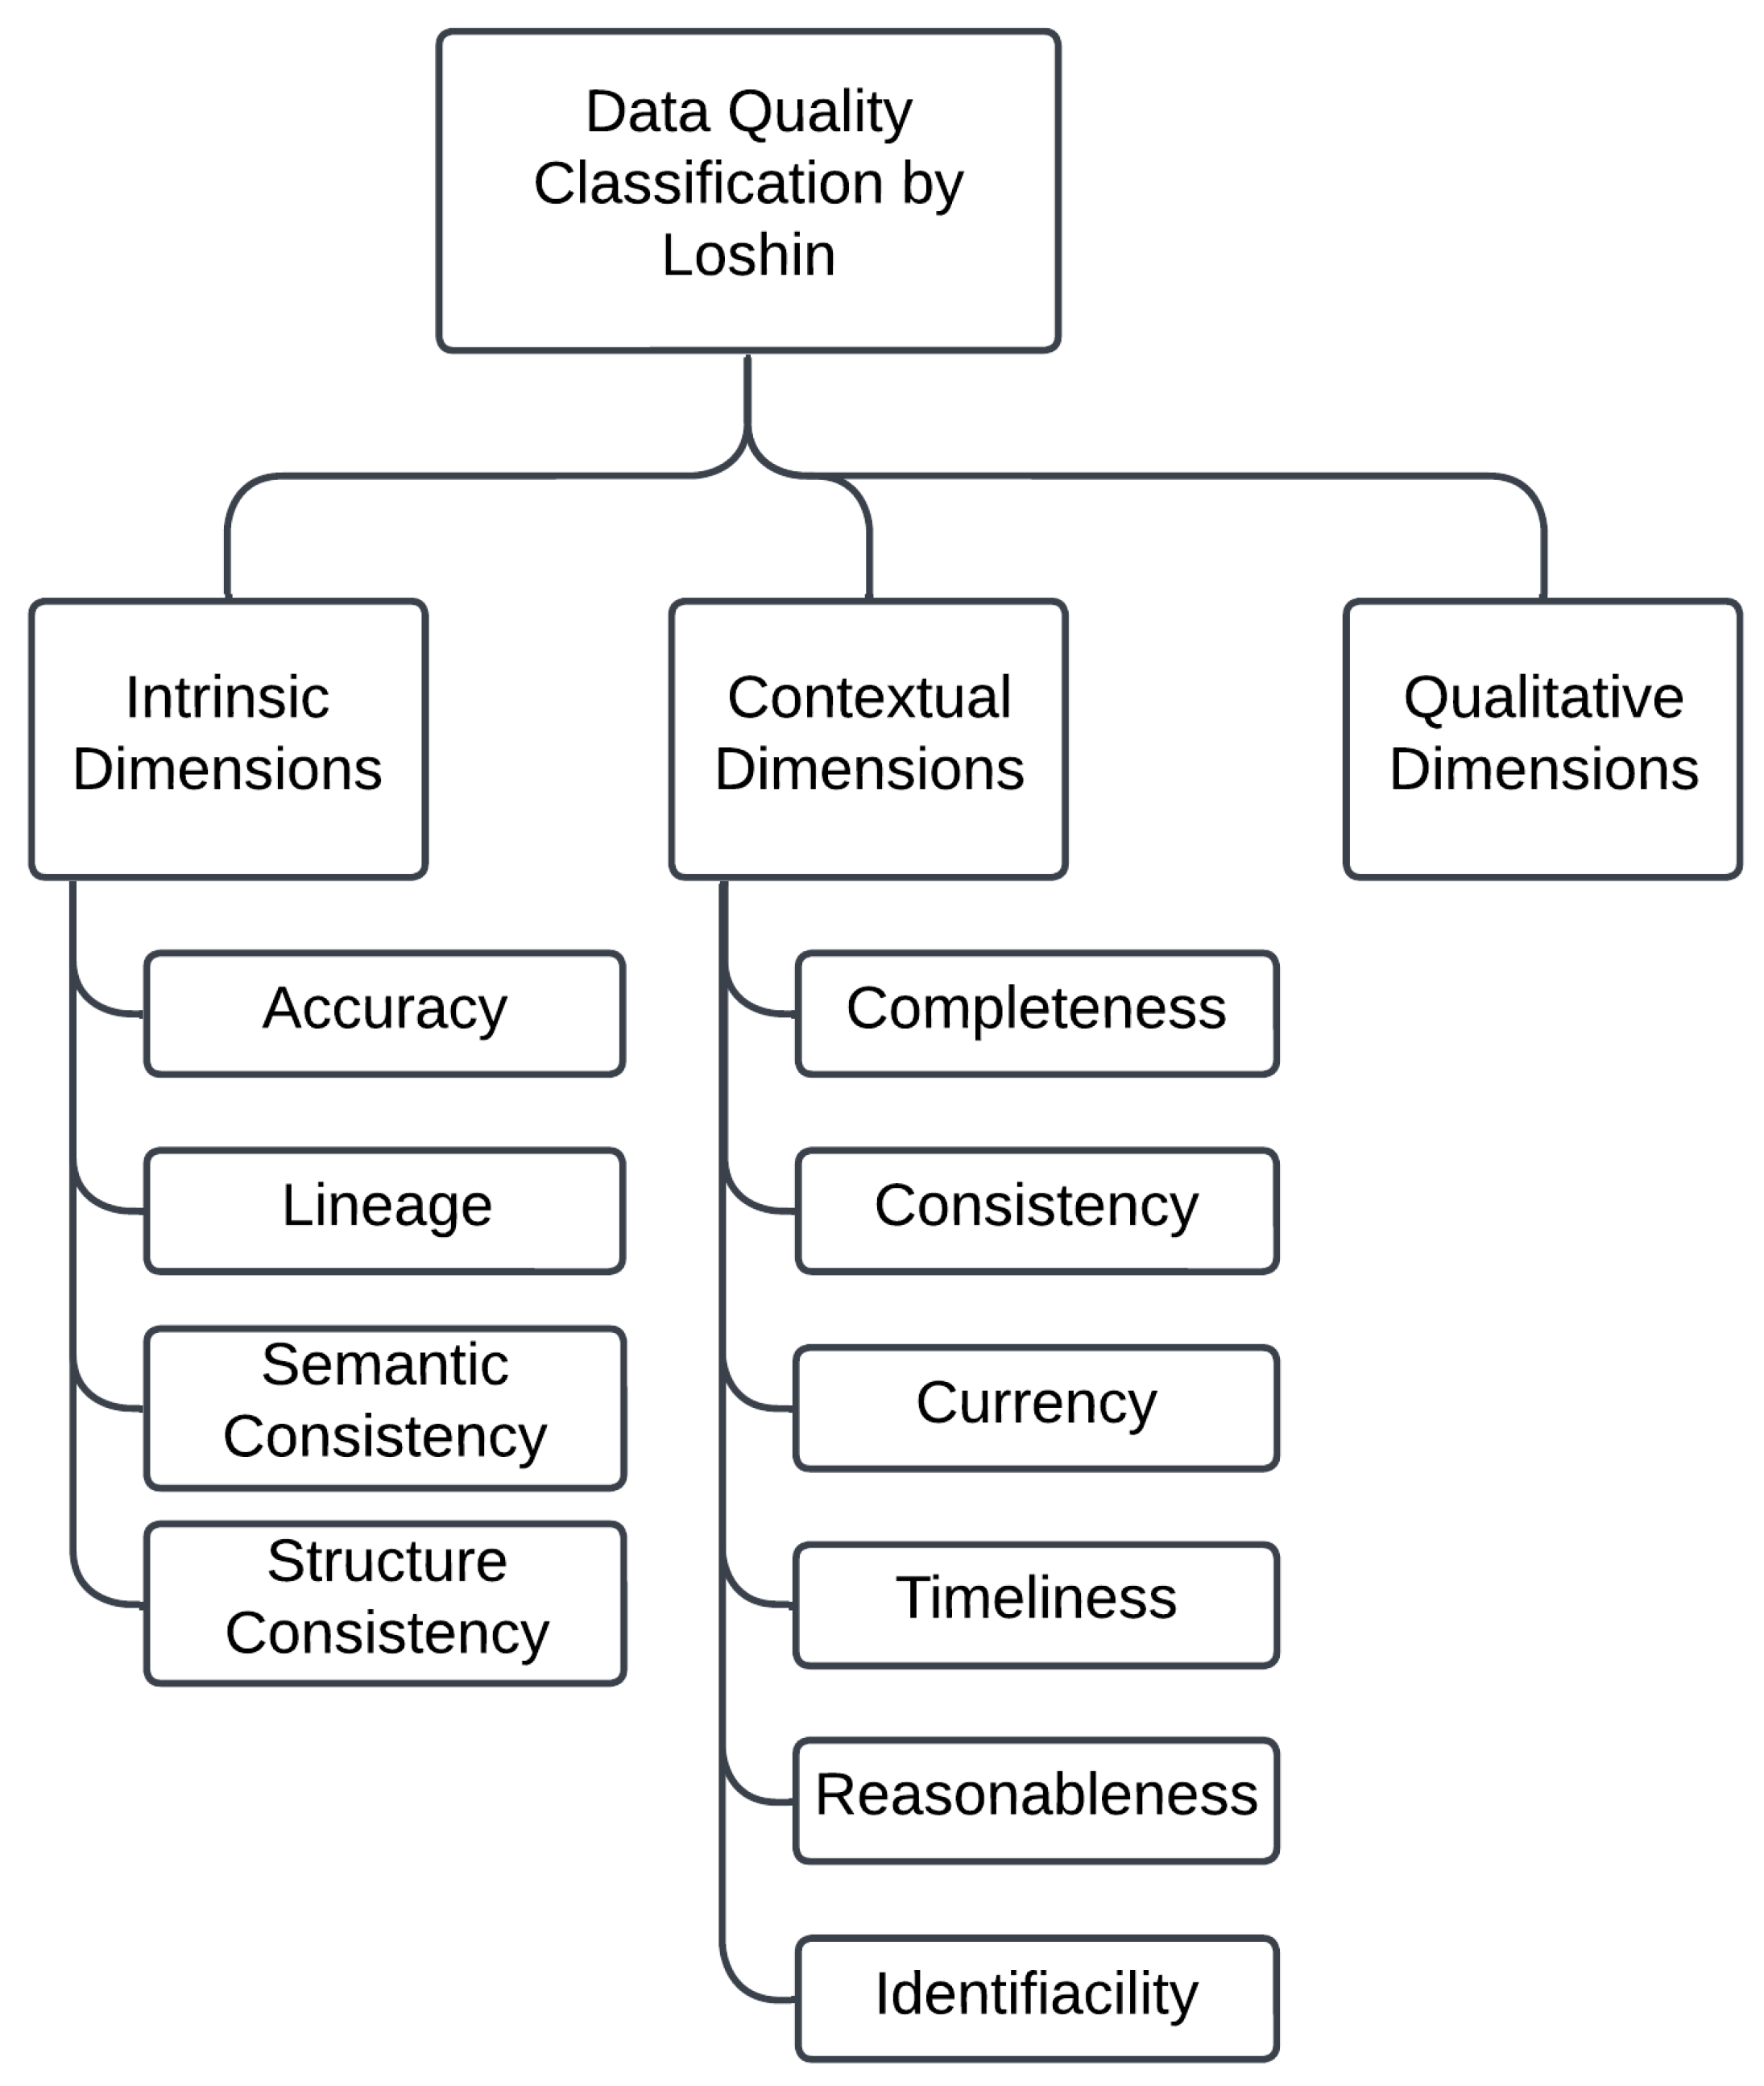
2.2. Data Quality Classification
Data quality is an essential factor in any analytical process, and various authors have proposed different ways of classifying it. These approaches typically involve dividing the dimensions of data quality into specific groups, each focusing on different aspects of quality assessment.
Batini and Scannapieco [14] proposed several groups of data quality dimensions (called clusters), such as the accuracy group, the completeness group, and the consistency group, among others. Each of these groups addresses specific categories of problems, as well as strategies and metrics for assessing data quality. Dimensions are grouped together based on their similarity. For example, in the accuracy group, Batini and Scannapieco distinguished accuracy between structural accuracy and temporal accuracy. Structural accuracy is divided into two aspects: syntactic accuracy (which assesses the distance between a value and the elements of the corresponding definition domain) and semantic accuracy (closeness of the value to the true value), while the temporal group measures how quickly updates to data values reflect changes in the real world; this group encompasses three dimensions: currency (concerns how quickly the data are updated in relation to changes occurring in the real world), volatility (characterizes how often the data changes over time), and timeliness (expresses how up-to-date the data are for the task at hand). The completeness group, which contains dimensions such as completeness, pertinence, and relevance, refers to the ability to represent each and every relevant aspect. The completeness dimension measures the extent to which all the necessary data are present and accounted for, ensuring that the dataset contains all the necessary information without omissions or gaps. It is divided into three types of completeness: schema completeness (the degree to which concepts and their properties are not missing from the schema), column completeness (a measure of missing values for a specific property or column in a table), and population completeness (missing values relative to a reference population). The consistency group is defined as the ability of information to present a uniform and synchronized representation of reality, as determined by integrity constraints, business rules, and other formal mechanisms. All the groups identified by the authors and the dimensions associated with each group are presented in Figure 1.
Figure 1.
Data quality classification by Batini and Scannapieco [14].
According to Loshin [13], dimensions can be categorized and ordered in a hierarchy to facilitate many processes. They can be intrinsic dimensions, which are at a lower level, and contextual and qualitative dimensions, which are at a higher level. In the first group, intrinsic dimensions are measures associated with the values of the data, independent of any association with a data element or record. These dimensions characterize the structure, formats, meanings, and enumeration of data domains. Some of the dimensions within this group are accuracy (the degree to which the values correctly reflect the attributes of the actual entities), structural consistency (the frequency with which attributes of similar meaning share the same structure and format), and semantic consistency (the consistency of definitions and meanings between attributes within a data model and between different enterprise datasets). Contextual dimensions, representing a second group, are measures that assess the consistency or validity of one data element in relation to others. These dimensions depend on the context and business policies that are implemented as rules in systems and processes. Some of the dimensions that belong to this group are completeness (the need to include all relevant information, without excess or lack of data, and is related to ensuring that certain attributes have values), consistency (uniformity and conformity of data across different levels of an organization), currency (the degree to which information is current in relation to the real world), and timeliness (the time expectation for the accessibility of information). In the last group, the qualitative dimensions focus on how well the information meets defined expectations and reflect a synthesis of the intrinsic and contextual dimensions. They combine measures associated with compliance at the highest level of data quality and are particularly valuable in situations where quantitative measurements are less clear or applicable, enabling a more holistic assessment of data quality. Figure 2 shows the different groups. It also illustrates the dimensions associated with each group that the author has studied.
Figure 2.
Data quality classification by Loshin [13].
Wang et al. [17] divided the dimensions of data quality into four groups: intrinsic, contextual, representational, and accessibility, as presented in Figure 3, with the dimensions associated with each group. The intrinsic group indicates that the data have quality in themselves and includes the dimensions of accuracy, objectivity, believability, and reputation. The contextual group should be considered in the context of the task at hand, i.e., it focuses primarily on the context of the task rather than the context of the data representation. Ensuring high data quality at the contextual level is not always easy, as business needs and requirements can change over time. The dimensions of contextual data quality include value-added, relevance, timeliness, completeness, and the appropriate amount of data. The representational group refers to the format of the data, which must be concise and consistent, as well as the meaning of the data. The dimensions associated with representational data quality are interpretability, ease of understanding, concise representation, and representational consistency. Finally, the accessibility group highlights the importance of the functionality and permissions required to access the systems, focusing on the extent to which data are available and can be accessed by the data consumer. This group includes the dimensions of accessibility and access security.
Figure 3.
Data quality classification by Wang et al. [17].
The dimensions of data quality [13] are fundamental to assessing whether data are fit for their intended use. By establishing clear evaluation criteria, these dimensions allow for data quality to be measured objectively, ensuring that data are aligned with established needs and expectations. Identifying these relevant dimensions is essential to initiate ongoing evaluation processes and promote improvements in data quality [19].
In addition, data quality dimensions reflect different aspects that can be measured, making it possible to classify and quantify quality. These metrics make it possible to identify gaps and opportunities for improvement along the information flow, ensuring compliance with established standards [13].
3. Measuring Data Quality Dimensions
The dimensions of data quality can be easily linked to the metrics used to assess data completeness and usefulness. This enables the distinction between high- and low-quality data to be made based on assessing the degree to which the data are useful and relevant [2]. Currently, there are numerous metrics used to evaluate the quality of sensor data, but there is still a lack of a common and valid data quality assessment framework [20]. This challenge highlights the need for a structured approach to evaluating data quality dimensions, ensuring consistency and applicability across different industrial contexts. But first, it is essential to understand what a good metric is and what the essential characteristics of a metric are. Table 1 identifies the characteristics presented by Loshin [13] for a good metric.
Table 1.
Key criteria for evaluating good metrics.
Measuring the dimensions of data quality can be objective when based on quantitative metrics and subjective when based on qualitative judgments [15]. It is preferable to use metrics based on quantifiable data rather than subjective data to avoid misinterpretation [13]. Some metrics produce a normalized score in the range [0, 1], as a binary value, percentage, score, relative frequency, and probability [2], and one dimension may correspond to one or more metrics [10]. Metrics can be applied at different levels of analysis to provide a more detailed and accurate understanding of the data. At the record level, the analysis considers the complete set of information, which can include elements such as timestamps, machine identifiers, and values from multiple sensors. This level provides a global view of the data captured at a given time. Another level of analysis is at the data element level, where the metric is applied to specific attributes within the information set. In this case, each attribute can be considered as a column, representing, for example, the values recorded by a single sensor over time. This approach allows for a more focused evaluation, making it easier to identify trends and variations in specific aspects. Metrics can also be applied at the individual data value level. In this case, each piece of data is analyzed in isolation, allowing a detailed assessment of its characteristics.
In their study, Liu et al. [11] identify the primary data issues in smart manufacturing, many of which have already been discussed in Section 2.1. The systematic review conducted by the authors directly relates data quality issues to four dimensions, accuracy, timeliness, completeness, and consistency, as explored in the following subchapters, and highlights that the presence of incomplete, inaccurate, inconsistent, or out-of-date data significantly compromises the efficiency of smart manufacturing, affecting everything from process control to predictive maintenance. This direct relationship, which justifies the selection of the four dimensions as the most relevant for data quality analysis, is illustrated in Table 2.
Table 2.
Justification for the four data quality dimensions in smart manufacturing.
In contrast to the above approach, we will adopt the methodology of Batini and Scannapieco [14] with reference to the dimension of accuracy. This is divided into two parts: structural accuracy and temporal accuracy, the latter of which includes the timeliness dimension. The following subchapters address each of the four dimensions of data quality (structural accuracy, temporal accuracy, completeness, and consistency), as well as their respective metrics, following the previously established criteria that describe the characteristics of a good metric as defined by Loshin [13].
3.1. Structural Accuracy
As mentioned in Section 2.2, Batini and Scannapieco [14] identified two types of structural accuracy: syntactic accuracy, which measures the proximity of a value to the other values in the domain, and semantic accuracy, which compares the value to a single reference value, that is, measures the proximity of it to the true value. The accuracy dimension can be associated with various problems such as inaccurate, invalid, or incorrect values, data that do not fit all potential values, noisy data, outliers, faulty data, and others [11]. These errors can occur due to equipment or system failures, recording errors, human errors, reading errors, or problems in the work environment. Mahanti [15] defined accuracy as the degree to which the data represent reality, i.e., the degree to which each data point describes a real-world object, and measures it at two distinct levels, namely, the data record and the data element [15]. For example, at the data record level, accuracy can be assessed by verifying that the combined readings from multiple sensors accurately reflect the operational status of a machine in a smart manufacturing environment. At the data element level, it can be assessed by checking whether a single sensor value, such as temperature, matches the actual temperature measured in real-time, or is completely anomalous.
3.1.1. Measuring Accuracy at the Data Record Level
The accuracy of data records can be evaluated by comparing all critical data elements in a record with the corresponding elements in the reference dataset. If the values of the critical elements of a record fall within an acceptable range relative to the corresponding values in the reference record, then that record is considered accurate. The equation presented by Mahanti [15] is (1), where the accuracy is calculated as the ratio between the number of fully accurate records () and the total of records ().
This metric can be applied to both syntactic and semantic accuracy. To determine , each value must be compared to an appropriate reference dataset. In the case of syntactic accuracy, this comparison checks that the values of the critical elements of the record conform to the values allowed in the domain, such as ensuring that a recorded temperature is within an acceptable range, while in the case of semantic accuracy, the comparison is made against the corresponding actual value in the real world, such as checking that the temperature recorded by the sensor corresponds to the actual measured value.
Table 3 shows the evaluation of the characteristics of this metric, according to the criteria defined by Loshin [13].
Table 3.
Evaluation of the accuracy metric (1) at the data record level.
3.1.2. Measuring Accuracy at the Data Element Level
The accuracy of data elements is assessed by comparing each element to its defined value domain in the reference. It is identical to Equation (1), but it is contextualized at the data element, where is the number of accurate values and is the total number of data elements, excluding missing values. Applying the characteristics of a good metric, as identified by Loshin [13], the evaluation of this metric is presented in Table 4.
Table 4.
Evaluation of the accuracy metric (1) at the data element level.
The accuracy metric, as defined, can be used to assess data quality in IoT environments, provided that it is applied with the appropriate adaptations and updates to reference value domains in dynamic scenarios. Goknil et al. [2], in their study related to Industry 4.0, presented several metrics collected from various studies. One of these metrics was very similar to (1), and identified the metric used in [21] as M5. However, instead of counting the total number of correct values, they focused on the number of incorrect values. The metric determines the proportion of incorrect values in relation to the total, and the result is adjusted by subtracting this proportion from 1, to reflect the degree of accuracy of the data.
3.1.3. Measuring Accuracy at the Data Value Level
Based on this concept of accuracy, another metric presented by Goknil et al. [2] is the metric identified by M4, as used in [22], indicating how close the values are to the correct values. This metric is calculated using the following mathematical expression:
where is the data value to be analyzed and X is the set of existing valid values, which can be defined based on historical data, expected ranges, or a reference dataset. This normalized accuracy score, which can be considered a measure of syntactic accuracy, is useful for understanding the relative position of a value in relation to the entire range of data. If is close to 0, it means that is close to the minimum value observed in X, while if is close to 1, it means that is close to the maximum value observed in X. When is less than 0 or greater than 1, it indicates that the score is outside the range of values observed in X, suggesting the presence of outliers or errors in the data.
Evaluating this metric based on the characteristics of a good metric according to Loshin [13] results in Table 5.
Table 5.
Evaluation of the accuracy metric (2) at the data value level.
In summary, the three metrics analyzed offer different approaches to measuring accuracy, each with strengths and limitations depending on the context in which they are applied. The accuracy of the data records level provides a holistic view of the dataset by assessing the correctness of entire records. While this approach is straightforward and useful for ensuring that all critical elements of a record are accurate, its strict requirement for full accuracy across all elements may limit its practicality in scenarios with inherent variability or minor acceptable discrepancies. The accuracy of the data element level focuses on evaluating individual data elements against their defined value domains, offering greater granularity and the ability to identify specific areas requiring improvement. This metric is particularly useful for systems where the accuracy of each element directly impacts performance, but its reliance on predefined reference values may limit its effectiveness in highly dynamic environments. The accuracy at the data value level provides a relative measure of accuracy by evaluating how individual values compare to the range of observed data. This metric is well-suited for identifying outliers and understanding data distribution, offering insights into variability and trends. It also enables adaptability over time, as minimum and maximum values can be updated with new data, making it particularly relevant for dynamic systems. While all three metrics contribute valuable perspectives to the assessment of data accuracy, the characteristics of the data value level metric make it particularly well-aligned with contexts where adaptability, identification of variability, and responsiveness to data trends are critical, such as in dynamic and data-intensive environments like smart manufacturing.
3.2. Temporal Accuracy
Temporal accuracy is of particular relevance due to the speed at which changes in the real world are reflected in data updates. Batini and Scannapieco [14] proposed three main dimensions to characterize temporal accuracy: currency, volatility, and timeliness.
This section will provide a brief overview of the dimensions of currency and volatility, with a particular focus on timeliness, given its importance. This emphasis is derived from the study by Liu et al. [11], which identifies timeliness as a critical dimension of data quality in smart manufacturing environments. We will analyze the timeliness dimension through two main metrics: the one proposed by Mahanti [15] and the metric described by Ballou et al. [23] and Goknil et al. [2].
The timeliness dimension, defined as the degree to which data are updated according to a specific context of use, addresses issues of outdated or outmoded data as well as the challenge of temporal alignment [11].
3.2.1. Measuring Timeliness Based on Time Interval
Mahanti [15] defined the timeliness dimension as measuring the time interval between when data are created and delivered to the user. When measuring timeliness, the following three temporal components come into play: the moment of occurrence (), the moment of provided (), and the moment of delivery (); this is when there is a time interval between the occurrence of the event and its recording. The author presents an identical metric for scenarios like this:
This metric is defined as the difference between the time of data delivery and the moment of occurrence, as the moment of provision is nullified. However, when measuring timeliness, it is important to consider the time lag between each of the time components. This detailed breakdown allows for a better understanding of delays and the impact of various factors on data relevance, providing a more granular view of overall timeliness. In order to establish the timeliness of the data, it is necessary to define a threshold that indicates when the data are no longer relevant for analysis. This threshold must be determined on the basis of the specific context, given that even within the same factory, different machines may have disparate operating times. These variations in operating cycles imply that the interval for considering data as current can be different, resulting in the necessity for adjustments to the validity criteria in accordance with the various systems and equipment.
Table 6 presents the evaluation of metric (3) based on the characteristics identified by Loshin [13] for a good metric.
Table 6.
Evaluation of the timeliness metric (3) based on the time interval.
3.2.2. Measuring Timeliness Considering Currency and Volatility
Batini and Scannapieco [14] define and measure three different dimensions in time-related accuracy dimensions: currency, volatility, and timeliness. The currency dimension represents how quickly data changes in the real world and is usually measured relative to the last time the data were updated. When data change at a fixed frequency, calculating currency becomes easier. However, when the frequency of the change varies, one possibility offered by the author is to calculate the average frequency of the change. The volatility dimension, on the other hand, characterizes the period during which the data remain valid. This validity may vary depending on the type of data and the context in which they are used. In smart manufacturing scenarios, where decisions must be made in real-time, the volatility of data such as sensor readings can be quite short. Batini and Scannapieco [14] also defined the timeliness dimension as the principle that data should not only be current but also available at the appropriate moment for the events that justify their use.
Ballou et al. [23] propose more elaborate metrics for temporal data dimensions, linking currency, volatility, and timeliness. In this approach, timeliness is understood as a function dependent on both currency and volatility. Currency is defined as follows:
where represents the age of the data at the time they are received. is when the information is delivered to the user. refers to the moment the data were obtained in the system. Volatility is defined as the period during which the data remain valid, i.e., the time the information can be reliably used for decision-making. Timeliness is then defined as follows:
In this metric, the timeliness value varies between 0 and 1, where 0 indicates low timeliness and 1 represents data completely within the ideal range for decision-making. The use of the maximum function ensures that if the timeliness value falls below 0, it is always adjusted to 0. This ensures that negative values are avoided and the value remains within the expected range [0, 1]. Goknil et al. [2] identified a similar metric, called M28, used in [22]. The main difference is in the numerator of the fraction. In the metric presented by Sicari et al., the currency is defined as the age, representing the time elapsed from the moment the data were collected to the moment of analysis. On the other hand, in the metric presented in (4), age is incorporated directly into the currency calculation. Despite this difference, the resulting value of the two metrics remains the same. This is because, according to Sicari et al., the age is the time interval between the generation of the data and their receipt by the user for analysis; this is equivalent to the currency calculation proposed by Ballou et al.
According to the characteristics defined by Loshin [13], Table 7 was constructed to evaluate metric (5).
Table 7.
Evaluation of timeliness metric (5).
The timeliness metric (5), when considered in smart manufacturing environments, not only meets Loshin’s criteria but also stands out for its importance in operational efficiency and rapid response capability.
The metrics analyzed for temporal accuracy, based on time intervals (3) and the combination of currency and volatility (5), offer different approaches to evaluating the timeliness of data. The time interval metric (3) is simple, making it suitable for measuring delays between the occurrence of an event and the moment the data are accessed. Its simplicity makes it easy to interpret and implement in systems that prioritize immediate delay monitoring. On the other hand, metric (5) stands out for providing a more comprehensive assessment by combining data currency with the period during which the data remain useful, represented by volatility. Additionally, its output, normalized between 0 and 1, offers a clear and intuitive view of the timeliness of the data. This makes it not only easier to monitor continuously but also more practical for comparing different scenarios or systems, making it especially useful for dashboards and quick analyses. It is important to note that different approaches to measuring timeliness should not be treated as equivalent. Metric (3) focuses on simple time differences, while metric (5) introduces a more sophisticated perspective that considers age, currency, and volatility. Therefore, metric (5) is better suited for smart manufacturing contexts, where quick decision-making is essential and having a clear understanding of data readiness is critical for operational efficiency.
3.3. Completeness
The completeness dimension refers to the extent to which the data are complete or missing [15], that is, the degree to which all expected values are present in the dataset. This dimension is related to issues of missing values and null values [11]. To measure the degree of data completeness, Mahanti [15] first defined what missing data means and what the missing values correspond to, dividing the dimension into three levels: data element, data record, and dataset (given that—in the context of IoT—data are generated from various sources, it is essential to assess completeness at a more granular level. Therefore, the metric at the dataset level is insufficient and will not be explored).
For each attribute, it is necessary to know whether the element is mandatory or inapplicable. Mandatory attributes always have values, while inapplicable attributes have values only under certain conditions/scenarios or when certain criteria or conditions are met [15]. For example, during maintenance, some machines may be in test mode, resulting in certain values not being collected or entered. Similarly, when a machine is turned off or placed in standby mode, sensors may continue to transmit data, but without relevant values (i.e., “null” or zero values), as there is no activity being recorded. It is also necessary to determine how missing values are represented in the dataset. While blank spaces, spaces, and null values are equivalent to missing data, sometimes certain values such as unknown, not applicable, NA, and N/A are also equivalent to missing values.
3.3.1. Measuring the Completeness Metric at the Data Element Level
Assuming that the mandatory elements have been defined and all missing values (such as nulls, blanks, and others) have been identified, the missing values are summed up in the variable; is the total number of data values that must be filled in for the data element, defining the completeness metric at the data element level by the following mathematical formula:
This metric is also presented in the study by Goknil et al. [2] in a similar way, identified as M10, M11, and M13. M11 and M13 exhibit the same discrepancy observed in the M10 metric, where the measurement is based on missing values. The presented metric can be evaluated based on the characteristics defined by Loshin [13], as shown in Table 8.
Table 8.
Evaluation of the completeness metric (6) at the data element level.
This completeness metric at the data element level is clear, measurable, business-relevant, and easy to implement, making it suitable for smart manufacturing environments. Although it has limited capability to detail the root causes of issues, it is effective in signaling data absence and guiding corrective actions.
3.3.2. Measuring Completeness at the Data Record
The (6) metric is also used to calculate the completeness dimension at the record level, where is the number of values in a record that must be completed and is the number of values in a record that are not completed. The evaluation of this metric according to Loshin’s characteristics [13] is shown in Table 9.
Table 9.
Evaluation of the completeness metric (6) at the data record level.
When applied at the record level, the completeness metric remains useful in smart manufacturing, especially to ensure that records are complete.
3.3.3. Measuring Completeness in Event Occurrences over Time
To complement the two metrics mentioned by [2,15], a third metric was adapted based on the previous ones to assess the regularity and coverage of events at specific time intervals. This metric evaluates how closely the actual number of occurrences aligns with the expected number within a given time interval T (e.g., 5 min intervals). It provides insights into the uniformity and completeness of data collection, focusing on the presence or absence of records rather than missing values within individual records. The formula used is as follows:
where is the number of occurrences within the specified time interval T, and is the expected number of occurrences within the same interval.
This metric offers a way to evaluate the regularity of the data and identify gaps or irregularities in the collection of events. To do this, the number of events is counted in each interval. Depending on the approach, the metric may determine the largest number of events over a given period. The resulting value is then compared with the actual number of occurrences in that interval, allowing an accurate assessment of data completeness.
Based on the characterization of a good metric, as defined by Loshin [13], the evaluation is presented in Table 10.
Table 10.
Evaluation of the completeness metric (7) in event occurrences over time.
After evaluating the different completeness metrics, the three metrics are essential for a smart manufacturing scenario, as they provide very important and unique perspectives on data completeness. The occurrence metric makes it possible to monitor the regularity of data collection, identifying gaps at specific intervals; this is crucial to ensure the continuity of production processes. On the other hand, the data element level and the data record level metrics provide a detailed view of which attributes/records have empty data, allowing for specific corrective actions. Together, these metrics offer a comprehensive approach to assessing data quality and integrity, which are key to effectiveness in smart manufacturing environments.
3.4. Consistency
The consistency dimension is defined as ensuring that data values are uniform across all instances of an application and that data across the entire organization is properly synchronized [15]. This dimension relates to various data quality issues, such as inconsistent values, data from different sources with contradictions, and duplicated data for the same observation [11]. It is important to highlight that data consistency does not necessarily imply accuracy. Batini and Scannapieco [14] reinforced that consistency refers to the violation of semantic rules defined over a set of data items, where these items can be tuples in relational tables or records in files. These rules must be established in collaboration with subject matter experts to ensure that they correctly reflect the relationships and constraints of the domain. Examples of such rules include the following: If a machine has two temperature sensors, both must report measurements in the same scale, the timestamp referring to the moment the sensor values are collected must be consistent with the actual collection time, and the identifier of the machine containing the sensors must exist in another table or document listing all machines of the company or sector. These are just a few examples of semantic rules that can be applied to ensure data consistency.
Mahanti [15] divides the dimension into three parts: consistency at the data element level, consistency between records, and consistency at the dataset level.
3.4.1. Measuring Data Element Consistency
In data element consistency, the focus is on the rules between the data elements within the same record. First, the elements that have a relationship between them and therefore need to be consistent, i.e., the rules that exist in the data are first found. The next step is to verify that the received record respects these rules between the identified elements; if they do, the record is considered consistent. The consistency metric is calculated as the ratio between the number of consistent rules found and the total number of rules that must exist . The consistency equation can be expressed as follows:
This method allows for a more granular analysis of consistency since each combination of elements is individually assessed. To evaluate this metric, we used Loshin’s method [13], as shown in Table 11.
Table 11.
Evaluation of the data element consistency metric (8).
In the context of smart manufacturing, where multiple sensors and systems are integrated, data element consistency metrics are an excellent choice, as they offer a detailed and flexible view, allowing inconsistencies to be identified in specific interactions between data elements, which is crucial for maintaining the accuracy and performance of real-time systems.
3.4.2. Measuring Cross-Record Consistency
Cross-record consistency refers to the coherence and conformity between records from different datasets, ensuring that related data across sources adhere to the same predefined rules. To measure this consistency, all consistency rules are applied collectively, verifying whether records across datasets conform to these rules as a whole. The number of consistent and inconsistent records is then identified, and Equation (8) is used to quantify the overall consistency between datasets.
To assess the cross-record consistency metric, we can apply the criteria established by Loshin [13], as shown in Table 12.
Table 12.
Evaluation of the cross-record consistency metric (8).
The cross-record consistency metric performs well against Loshin’s characteristics, proving to be clear, measurable, and relevant for business. Additionally, it allows for specific corrective actions and offers good options for representation and reportability. Its monitoring and drill-down capability make it a valuable tool for ensuring data quality in dynamic business contexts, such as those found in Industry 4.0.
3.4.3. Measuring Dataset Consistency
Lastly, the consistency at the dataset level is measured between the source system and the target system. These inconsistencies occur when there are loading failures and only a partial amount of data has been loaded, or when reloading did not occur from the last checkpoint, causing the data in the target system to be inconsistent with those in the source.
Formula (9), which is used to measure inconsistency, is calculated as the absolute value of the difference between the number of records in the source (), and the number of records in the target table (), divided by the total number of records in the source ().
The source refers to the system responsible for generating and transmitting the data, which may include the sensor itself or an intermediary system that aggregates the data before transmission; the target system is the final storage location. The analysis of this metric according to the characteristics of Loshin [13] is represented in Table 13.
Table 13.
Evaluation of the consistency metric (9) at the dataset level.
The consistency metric at the dataset level plays an important role in ensuring that data transfers between systems are executed correctly, without significant losses or failures.
Given the challenges of Industry 4.0, where data integrity is essential for real-time decision-making, all three metrics are important. Consistency of data elements provides detailed analysis of data interactions, consistency cross-records ensures coherence across different datasets, and consistency at the record level ensures that information is not lost when transferred between systems. Together, these metrics provide a comprehensive approach to ensuring data quality in an intelligent production environment.
4. Discussion
In smart manufacturing, the integration of real-time data from various sources is crucial, and choosing data quality metrics is fundamental. Data are often transmitted in real-time, generating significant amounts of time series data organized by timestamps [3], which requires continuous monitoring to track changes and identify patterns. These metrics are essential for live operations, where a plant manager or IT specialist can use them to monitor data quality in real-time, ensuring that deviations, anomalies, or inconsistencies are detected as soon as they occur. With continuous assessment, these professionals can act quickly to prevent problems that could compromise production quality, cause equipment failure, or introduce inefficiencies in the manufacturing process. This proactive approach not only minimizes waste and rework but also improves decision-making.
For the accuracy dimension (Section 3.1), the metric of accuracy at the value level (metric (2)) is crucial to ensure greater precision in identifying specific problems in sensors and machines. Deviations in reported values reveal that sensors are measuring values above or below the expected range, which can indicate an imminent problem in the equipment. This metric enables the identification of small discrepancies that may indicate impending failures, allowing preventive corrections to be implemented. By evaluating individual values, if anomalies persist, it is possible to infer faults in the sensor, in a part of the machine, or in the machine as a whole, depending on the context. Table 14 summarizes the metrics related to the accuracy dimension. It highlights the key advantages, disadvantages, and ideal application scenarios for assessing data accuracy in industrial environments.
Table 14.
Summary of accuracy metrics.
The timeliness metric analyzed in Section 3.2 includes the time interval-based metric (3) and the combined currency and volatility metric (5). The first metric (3) is simple and effective for assessing the timeliness of data delays in real-time transmission scenarios. It provides quick feedback on the difference between the time the data were generated and the time the user accessed the data. On the other hand, metric (5) provides a more comprehensive assessment, considering not only the currency of the data but also their volatility. This metric is particularly useful in dynamic contexts, such as automated production lines, where the frequency of updates can vary and the validity of the data is critical for real-time decision-making. In addition, the fact that its output is limited to the range between 0 and 1 offers a more intuitive view of the timeliness of the data. Thus, metric (5) provides a more complete view of the temporal quality of the data, ensuring not only that the data are recent, but also that they are valid for the situation in question. Table 15 presents the timeliness metric. It outlines the benefits, limitations, and typical use cases of the timeliness metric, particularly in real-time decision-making contexts such as smart manufacturing systems.
Table 15.
Timeliness metric summary.
The completeness metric (Section 3.3) is crucial for assessing data integrity in smart manufacturing environments, where the presence of expected values is essential for effective decision-making. The following three metrics are essential for this context: completeness at the element and data record levels (Section 3.3.1—metric (6), Section 3.3.2—metric (6)), and completeness of occurrences over time (7). The first metric (metric (6)) is simple and provides a detailed understanding of data quality, allowing the identification of attributes that contain missing values. Its application is key to ensuring that each critical parameter is available and valid, which is essential for real-time operations. The second metric (metric (6)), which is the same as the first but applied at the record level, also provides insight into completeness at the record level, supporting important decisions at the record level, such as a machine breakdown. On the other hand, the completeness of occurrences over time metric (metric (7)) evaluates the regularity and coverage of events at specific time intervals, providing a clear view of data completeness over time. This metric is particularly relevant in manufacturing environments, where the absence of data can indicate failures in data collection or interruptions in the process, and the increase in data can indicate duplication failures when sending the data, enabling corrective action. Together, these metrics form a robust approach for ensuring the integrity and quality of data in IoT and smart manufacturing systems, which is essential for optimizing processes and minimizing operational risks. Table 16 summarizes the completeness dimension metrics, essential for evaluating the integrity and coverage of data in smart manufacturing systems. It discusses how these metrics help ensure that all required data points are present and highlights their application in ensuring robust data for decision-making.
Table 16.
Completeness metric summary.
The data consistency dimension (Section 3.4) is fundamental in smart manufacturing environments and the adoption of three metrics—element combination consistency (metric (8)), record consistency (Section 3.4.2—metric (8)), and dataset consistency (metric (9))—is essential. Each of these metrics addresses different aspects of data integrity. The consistency of data elements is crucial to ensure that variables interact logically, allowing the identification of rules that must be maintained throughout the dataset between elements. Record consistency is vital when using multiple data collection systems, ensuring the coherence of information from different sources.
Finally, dataset consistency is important to ensure that the data in the target system match the data in the source system, avoiding problems that can arise due to loading errors or outdated data. By using these three metrics together, organizations can ensure a comprehensive approach to data quality management. Each metric offers a unique perspective, and together they create a vital monitoring system for consistency, which is essential for operational efficiency and making informed decisions in real-time. Table 17 presents the metrics for the consistency dimension, which ensures that data are logically coherent across elements, records, and datasets. It provides an overview of how these metrics help in identifying and maintaining data consistency in systems with multiple sensors or data sources, ensuring reliable and accurate data for operational decisions.
Table 17.
Consistency metric summary.
A key step in this evaluation process is data profiling, which involves the systematic analysis of datasets to extract metadata and identify patterns such as missing values, data types, and dependencies [24]. This step not only supports the identification of potential data quality problems but also increases the effectiveness of the metrics applied to each quality dimension [13]. Data profiling focuses on analyzing individual columns within a table, generating key metrics such as total values (size), unique values (cardinality), and non-null values (completeness) [25]. It also identifies minimum and maximum values, data types, and common patterns. Beyond syntactic metadata, profiling can predict semantic data types or domains. Data profiling tasks are a great support in calculating the different metrics for each dimension of data quality, making the process more efficient and straightforward. For example, to calculate metric (6) from the completeness dimension (Section 3.3.1), the task of counting the total number of rows and identifying the null values in the cardinality category significantly facilitates the calculation of the metric.
Due to the large volumes of data generated continuously from various sources, the different formats, and the incompleteness of the data, it is difficult to analyze all this data [26]. This leads to the emergence of the concept of dark data, which refers to data that is generated, stored, but not analyzed, or used by organizations [9]. Much of the data are used only for real-time control or anomaly detection, without exploiting their strategic potential to generate deeper insights [27]. Moreover, 90% of the data generated by IoT devices are never analyzed, and up to 60% of the data begin to lose value a few milliseconds after they are generated [9]. This waste results in rising costs for data management, storage, and maintenance, as well as missed opportunities to optimize processes, which is why real-time analysis is important—it allows us to extract value from the data before the data become irrelevant.
One of the approaches that can be effective in detecting dark data is the consistency metric (9) since it makes it possible to compare the number of data points that leave the source with those that arrive at the destination and are actually analyzed. By comparing these two values, organizations can quickly identify if there are data that are not being used, helping to mitigate the waste of valuable information and maximize potential. In addition, a promising solution to reduce the amount of dark data is to use the sketching technique. Sketching is a widely used technique that analyzes a selected sample of global data flow, in a random or pseudo-random way, to determine patterns in the data and formulate solutions, allowing for a margin of error [28]. The process of sketching data includes averaging the samples collected, and compressive learning has several advantages [29].
Since processing continuous data streams also represents a significant challenge in terms of execution time and memory consumption [30], and given that the evolution of computing has not been proportional to the increase in the amount of information [31], sketching also supports this problem. Algorithms such as count–min sketch and HyperLogLog are examples of algorithms that drastically reduce memory usage while maintaining high precision in frequency estimation and cardinality counting [31]. By using a sketch that is much smaller than the total number of samples, the data are significantly compressed, facilitating both storage and transfer. In addition, the sketch speeds up the learning phase, as its complexity becomes independent of the amount of original data. Another advantage is that sketching can preserve users’ privacy, as the transformation applied can hide individual information. This makes sketching particularly advantageous in IoT environments, where the continuous streams of data require efficient, scalable processing. Traditional data reduction methods, such as sampling, are widely used to minimize computational complexity, as they allow computations to be performed on a smaller subset of the original stream. However, when applied in isolation, these methods can introduce biases in the estimation of aggregates and compromise the representativeness of the data. Sketching techniques, on the other hand, offer a scalable alternative, preserving computational efficiency without compromising the accuracy of the estimates [30]. Finally, this technique is especially suitable for distributed implementations and streaming scenarios. By applying sketching, it is possible not only to reduce the accumulation of dark data but also to improve the efficiency of real-time processing by avoiding the accumulation of information that does not add value.
5. Conclusions
This article aimed to explore the importance of data quality in smart manufacturing and identify the key dimensions of data quality that are most relevant to the Industry 4.0 context. The central focus was on proposing practical metrics for evaluating these dimensions, with a particular emphasis on how these metrics can help organizations optimize their operations, enhance decision-making, and maintain efficient processes. As the manufacturing industry becomes more automated and data-driven, the need for high-quality data has never been more critical. The purpose of this review was to highlight the importance of data quality and its impact on manufacturing processes.
The key findings of this study identify critical dimensions of data quality: accuracy, completeness, timeliness, and consistency. Accuracy ensures that the data reflect the true values without anomalies. Completeness, on the other hand, is about ensuring that all necessary data are present, without missing values that can result from sensor failures or environmental conditions. Timeliness is also becoming increasingly significant as organizations rely more on real-time data to make operational decisions. Consistency addresses the challenge of ensuring that the data remain reliable across various systems and over time. The contribution of this study lies in identifying and discussing the key dimensions of data quality and proposing metrics that can be used to evaluate them effectively. This is particularly relevant to smart manufacturing systems, where the integration of IoT devices, sensors, and other technologies generates massive volumes of data. This study provides insight into the practical aspects of data quality in such systems and the importance of measuring and ensuring its quality.
For future research, it would be useful to explore how the proposed data quality metrics can be applied in real-world smart manufacturing scenarios. The integration of sketching techniques and sampling methods to reduce dark data could be a key area of study, as these approaches have the potential to optimize data storage, transfer, and analysis. In addition, future studies could also explore how these metrics can be integrated into Industry 5.0, where human–machine collaboration is central. Unlike Industry 4.0, which focuses on automation and connectivity, Industry 5.0 emphasizes closer interaction between human workers and intelligent systems, promoting greater personalization, flexibility, and sustainability in production processes. In this scenario, data quality metrics must evolve to capture not only technical aspects but also the impact of human intervention. Human–machine collaboration creates new dynamics that affect data quality. For example, traditional metrics may require new approaches to assess the reliability and transparency of data generated in collaborative environments. The challenges of Industry 5.0 make it essential to develop new data quality monitoring strategies that ensure not only accuracy and completeness, but also interpretability and alignment with both productive and ethical objectives.
In conclusion, this study highlights the importance of data quality in smart manufacturing, particularly within the context of Industry 4.0. By proposing and discussing metrics to evaluate data quality, this article contributes to the ongoing effort to optimize manufacturing processes. As the volume and complexity of data continue to grow, addressing data quality challenges will be essential to maximizing the benefits of IoT and CPS technologies. This review serves as a fundamental step in understanding the landscape of data quality in smart manufacturing, opening the way for future research. By continuing to explore innovative data quality strategies, organizations can unlock the full potential of their data assets to improve efficiency, quality, and competitiveness in the era of Industry 4.0.
Author Contributions
Conceptualization, T.P., B.O. and Ó.O.; validation, Fillipe Ribeiro; investigation, T.P., B.O., Ó.O. and F.R.; data curation, F.R.; writing—original draft preparation, T.P.; writing—review and editing, B.O. and Ó.O. All authors have read and agreed to the published version of the manuscript.
Funding
This work was supported by the European Union under the Next Generation EU, through a grant from the Portuguese Republic’s Recovery and Resilience Plan (PRR) Partnership Agreement, within the scope of the project PRODUTECH R3—“Agenda Mobilizadora da Fileira das Tecnologias de Produção para a Reindustrialização”. Total project investment: EUR 166.988.013,71; total grant: EUR 97.111.730,27.
Data Availability Statement
No new data were created or analyzed in this study. Data sharing is not applicable to this article.
Conflicts of Interest
Author Fillipe Ribeiro was employed by the company JPM Industry. The remaining authors declare that the research was conducted in the absence of any commercial or financial relationships that could be construed as a potential conflict of interest.
References
- Rangineni, S.; Bhanushali, A.; Suryadevara, M.; Venkata, S.; Peddireddy, K. A Review on Enhancing Data Quality for Optimal Data Analytics Performance. Int. J. Comput. Sci. Eng. 2023, 11, 51–58. [Google Scholar] [CrossRef]
- Goknil, A.; Nguyen, P.; Sen, S.; Politaki, D.; Niavis, H.; Pedersen, K.J.; Suyuthi, A.; Anand, A.; Ziegenbein, A. A Systematic Review of Data Quality in CPS and IoT for Industry 4.0. ACM Comput. Surv. 2023, 55, 1–38. [Google Scholar] [CrossRef]
- Hu, C.; Sun, Z.; Li, C.; Zhang, Y.; Xing, C. Survey of Time Series Data Generation in IoT. Sensors 2023, 23, 6976. [Google Scholar] [CrossRef] [PubMed]
- Teh, H.Y.; Kempa-Liehr, A.W.; Wang, K.I.K. Sensor data quality: A systematic review. J. Big Data 2020, 7, 11. [Google Scholar] [CrossRef]
- Tverdal, S.; Goknil, A.; Nguyen, P.; Husom, E.J.; Sen, S.; Ruh, J.; Flamigni, F. Edge-Based Data Profiling and Repair as a Service for IoT; Association for Computing Machinery: New York, NY, USA, 2024; pp. 17–24. [Google Scholar] [CrossRef]
- Kuemper, D.; Iggena, T.; Toenjes, R.; Pulvermueller, E. Valid.IoT: A framework for sensor data quality analysis and interpolation. In Proceedings of the 9th ACM Multimedia Systems Conference, Amsterdam, The Netherlands, 12–15 June 2018; pp. 294–303. [Google Scholar] [CrossRef]
- Krishnamurthi, R.; Kumar, A.; Gopinathan, D.; Nayyar, A.; Qureshi, B. An overview of IoT sensor data processing, fusion, and analysis techniques. Sensors 2020, 20, 6076. [Google Scholar] [CrossRef]
- Li, F.; Nastic, S.; Dustdar, S. Data quality observation in pervasive environments. In Proceedings of the 2012 IEEE 15th International Conference on Computational Science and Engineering, Paphos, Cyprus, 5–7 December 2012; IEEE: Piscataway, NJ, USA, 2012; pp. 602–609. [Google Scholar] [CrossRef]
- Corallo, A.; Crespino, A.M.; Vecchio, V.D.; Lazoi, M.; Marra, M. Understanding and Defining Dark Data for the Manufacturing Industry. IEEE Trans. Eng. Manag. 2023, 70, 700–712. [Google Scholar] [CrossRef]
- Zhang, L.; Jeong, D.; Lee, S. Data Quality Management in the Internet of Things. Sensors 2021, 21, 5834. [Google Scholar] [CrossRef] [PubMed]
- Liu, C.; Peng, G.; Kong, Y.; Li, S.; Chen, S. Data Quality Affecting Big Data Analytics in Smart Factories: Research Themes, Issues and Methods. Symmetry 2021, 13, 1440. [Google Scholar] [CrossRef]
- Qasim Jebur Al-Zaidawi, M.; Çevik, M. Advanced Deep Learning Models for Improved IoT Network Monitoring Using Hybrid Optimization and MCDM Techniques. Symmetry 2025, 17, 388. [Google Scholar] [CrossRef]
- Loshin, D. The Practitioner’s Guide to Data Quality Improvement; Elsevier: Amsterdam, The Netherlands, 2010. [Google Scholar] [CrossRef]
- Batini, C.; Scannapieco, M. Data and Information Quality; Springer: Berlin/Heidelberg, Germany, 2016; Volume 63. [Google Scholar] [CrossRef]
- Mahanti, R. Data Quality: Dimensions, Measurement, Strategy, Management, and Governance; ASQ Quality Press: Milwaukee, WI, USA, 2019; Available online: https://asq.org/quality-press/display-item?item=H1552 (accessed on 15 September 2024).
- Gimpel, G.; Alter, A. Benefit From the Internet of Things Right Now by Accessing Dark Data. IT Prof. 2021, 23, 45–49. [Google Scholar] [CrossRef]
- Wang, R.Y.; Strong, D.M. Beyond Accuracy: What Data Quality Means to Data Consumers. J. Manag. Inf. Syst. 1996, 12, 5–33. [Google Scholar] [CrossRef]
- Karkouch, A.; Mousannif, H.; Al Moatassime, H.; Noel, T. Data quality in internet of things: A state-of-the-art survey. J. Netw. Comput. Appl. 2016, 73, 57–81. [Google Scholar] [CrossRef]
- Cichy, C.; Rass, S. An Overview of Data Quality Frameworks. IEEE Access 2019, 7, 24634–24648. [Google Scholar] [CrossRef]
- Cheng, H.; Feng, D.; Shi, X.; Chen, C. Data quality analysis and cleaning strategy for wireless sensor networks. EURASIP J. Wirel. Commun. Netw. 2018, 2018, 61. [Google Scholar] [CrossRef]
- Byabazaire, J.; O’Hare, G.; Delaney, D. Using trust as a measure to derive data quality in data shared IoT deployments. In Proceedings of the 2020 29th International Conference on Computer Communications and Networks (ICCCN), Honolulu, HI, USA, 3–6 August 2020; IEEE: Piscataway, NJ, USA, 2020; pp. 1–9. [Google Scholar] [CrossRef]
- Sicari, S.; Cappiello, C.; Pellegrini, F.D.; Miorandi, D.; Coen-Porisini, A. A security-and quality-aware system architecture for Internet of Things. Inf. Syst. Front. 2016, 18, 665–677. [Google Scholar] [CrossRef]
- Ballou, D.; Wang, R.; Pazer, H.; Tayi, G. Modeling Information Manufacturing Systems to Determine Information Product Quality. Manag. Sci. 1998, 44, 462–484. [Google Scholar] [CrossRef]
- Naumann, F. Data profiling revisited. ACM Sigmod Rec. 2014, 42, 40–49. [Google Scholar] [CrossRef]
- Abedjan, Z.; Golab, L.; Naumann, F.; Papenbrock, T. Data Profiling. Synth. Lect. Data Manag. 2018, 10, 1–154. [Google Scholar] [CrossRef]
- Zhong, K.; Jackson, T.; West, A.; Cosma, G. Building a Sustainable Knowledge Management System from Dark Data in Industrial Maintenance. In Proceedings of the International Conference on Knowledge Management in Organizations, Kaohsiung, Taiwan, 29 July–4 August 2024; Uden, L., Ting, I.H., Eds.; Springer: Cham, Switzerland, 2024; pp. 263–274. [Google Scholar] [CrossRef]
- Trajanov, D.; Zdraveski, V.; Stojanov, R.; Kocarev, L. Dark Data in Internet of Things (IoT): Challenges and Opportunities. In Proceedings of the 7th Small Systems Simulation Symposium, Cavan, Ireland, 16–18 April 2018; pp. 1–9. Available online: https://www.researchgate.net/publication/323337110_Dark_Data_in_Internet_of_Things_IoT_Challenges_and_Opportunities (accessed on 22 October 2024).
- Khram, I.; Shamseddine, M.; Itani, W. STCCS: Segmented Time Controlled Count-Min Sketch. In Proceedings of the 2020 ITU Kaleidoscope: Industry-Driven Digital Transformation (ITU K), Online, 7–11 December 2020; IEEE: Piscataway, NJ, USA, 2020; pp. 1–7. [Google Scholar] [CrossRef]
- Gribonval, R.; Chatalic, A.; Keriven, N.; Schellekens, V.; Jacques, L.; Schniter, P. Sketching data sets for large-scale learning: Keeping only what you need. IEEE Signal Process. Mag. 2021, 38, 12–36. [Google Scholar] [CrossRef]
- Rusu, F.; Dobra, A. Sketching Sampled Data Streams. In Proceedings of the 2009 IEEE 25th International Conference on Data Engineering, Shanghai, China, 29 March–2 April 2009; IEEE: Piscataway, NJ, USA, 2009; pp. 381–392. [Google Scholar] [CrossRef]
- Cormode, G. Data sketching. Commun. ACM 2017, 60, 48–55. [Google Scholar] [CrossRef]
Disclaimer/Publisher’s Note: The statements, opinions and data contained in all publications are solely those of the individual author(s) and contributor(s) and not of MDPI and/or the editor(s). MDPI and/or the editor(s) disclaim responsibility for any injury to people or property resulting from any ideas, methods, instructions or products referred to in the content. |
© 2025 by the authors. Licensee MDPI, Basel, Switzerland. This article is an open access article distributed under the terms and conditions of the Creative Commons Attribution (CC BY) license (https://creativecommons.org/licenses/by/4.0/).


