Abstract
The expectations for the (re)use of open government data (OGD) are high. However, measuring their impact remains challenging, as their effects are not solely economic but also long-term and spread across multiple domains. To accurately assess these impacts, we must first understand where they occur. This research presents a structured approach to developing a taxonomy for open government data (OGD) impact areas using machine learning-driven topic modeling and iterative taxonomy refinement. By analyzing a dataset of 697 OGD use cases, we employed various machine learning techniques—including Latent Dirichlet Allocation (LDA), Non-Negative Matrix Factorization (NMF), and Hierarchical Dirichlet Process (HDP)—to extract thematic categories and construct a structured taxonomy. The final taxonomy comprises seven high-level dimensions: Society, Health, Infrastructure, Education, Innovation, Governance, and Environment, each with specific subdomains and characteristics. Our findings reveal that OGD’s impact extends beyond governance and transparency, influencing education, sustainability, and public services. Our approach provides a scalable and data-driven methodology for categorizing OGD impact areas compared to previous research that relies on predefined classifications or manual taxonomies. However, the study has limitations, including a relatively small dataset, brief use cases, and the inherent subjectivity of taxonomic classification, which requires further validation by domain experts. This research contributes to the systematic assessment of OGD initiatives and provides a foundational framework for policymakers and researchers aiming to maximize the benefits of open data.
1. Introduction
Background and Motivation
Open government data (OGD) constitute a vital source of publicly released data from the government sector. The primary goals of the OGD are to foster transparency, enhance accountability, and create added value [1]. In recent years, the production and analysis of data by public sector organizations have expanded considerably, resulting in increased research attention on OGD [2,3,4,5,6]. As government-generated data continue to grow, efforts to make them accessible to the public remain a priority. Initially, the emphasis was on promoting transparency in governance [7]. However, since 2010, expectations surrounding open data have evolved significantly [8,9]. Today, OGD are valued not just for their role in transparency but also for their potential to drive innovation, foster a data-driven economy, and contribute to societal goals [10,11]. Governments worldwide have begun leveraging OGD to support economic development, create new business opportunities, improve public services, and enhance civic engagement [12]. Notable examples include the U.K.’s Open Data Institute [13], which has supported the development of data-driven startups, Denmark’s Basic Data Program [14], which has improved efficiency in land administration, saving an estimated €100 million annually [15], and interactive dashboards and data repositories developed for COVID-19 response across multiple countries which have improved public communication and facilitated rapid crisis response through co-created services [16]. Nevertheless, achieving these objectives hinges on the release of high-impact data to the public—a priority highlighted by Ubaldi [5].
Despite their transformative potential, our understanding of the precise impacts of OGD remains limited, largely due to the scarcity of systematic and comprehensive studies in this field [12,17,18,19,20,21,22]. The Open Data Maturity Report [23] offers insights into how OGD generate impact across four domains: governance, society, the economy, and the environment. It highlights that OGD can either be used in raw form or further processed to create enriched datasets, innovative solutions, and data-driven value chains. However, the successful realization of these benefits relies on effective data reuse, accessibility, and integration into decision-making processes [24]. Measuring and identifying the impact of OGD is a formidable challenge due to their diverse applications and lack of universal metrics. While previous research has explored specific cases of OGD utilization, such as data-driven urban planning, environmental monitoring, and public health improvements [11,12], these studies often focus on isolated domains and lack a comprehensive framework for assessing impact. The Open Data Maturity Report [23] assesses OGD adoption using over 150 survey-based metrics, covering areas such as policy, impact, data portals, and data quality. However, these assessments often reflect subjective perceptions and are constrained by limited government resources allocated to open data initiatives [18]. On another note, research on OGD impact assessment has revealed several systematic methodological limitations. Studies have highlighted a lack of empirical evidence regarding the effects of OGD initiatives and raised concerns about the methodological rigor of existing research [25]. There is a notable absence of design science methods and theoretical frameworks in OGD research [26]. Many studies focus on the opening of data rather than their utilization and impact, with a predominance of descriptive methods over empirical approaches [27]. Additionally, there is limited research on OGD for business benefits and in developing countries [26].
A complementary approach to impact measurement and identification involves analyzing OGD use cases, which provide real-world examples of data reuse [28]. The European Data Portal’s repository of use cases, overseen by the Publications Office of the European Union, serves as an invaluable dataset for examining OGD’s real-world effects [29]. Studies have shown that leveraging such repositories can improve our understanding of OGD’s societal, economic, and environmental contributions [30,31]. However, before effectively classifying and assessing these impacts, it is necessary to establish a systematic framework for categorizing OGD impact areas. Given that classification is an established data mining challenge, prior research highlights the need for preprocessing and taxonomy-based categorization to improve classification accuracy and ensure reliable insights [32].
A key step in addressing this challenge is the development of a structured taxonomy of OGD impact areas, similar to taxonomies already used to map research areas in OGD [33,34] and creating OGD solutions [30] such as interactive maps and dashboards. By introducing a standardized taxonomy, we can create a structured framework for systematically assessing OGD’s diverse impacts. Additionally, such a taxonomy facilitates domain-specific impact measurement, enabling policymakers and researchers to design targeted interventions that maximize the benefits of open data [35].
While OGD have demonstrated significant potential, a unified approach to systematically classify and assess their impact areas remains absent. Previous studies have either focused on individual sectors (e.g., governance, transportation, or health) or relied on predefined evaluation metrics rather than data-driven classifications [14,18]. To address this research gap, this study seeks to systematically categorize OGD impact areas using machine learning-driven taxonomy development. Specifically, we aim to answer the following research question:
How can open government data impact areas be systematically classified using machine learning techniques and taxonomy development?
To achieve this, we employed a combination of topic modeling and taxonomy development methodologies, creating a structured framework that organizes and categorizes OGD impact areas. This approach enables a data-driven classification process, allowing for scalability, adaptability, and improved impact assessment of OGD initiatives.
2. Literature Review
Our work is related to three main research pillars in OGD impact assessment: (1) benchmarking open government data, (2) OGD impact evaluation benchmarks, and (3) impact assessment with machine learning.
2.1. Benchmarking Open Government Data
Benchmarking OGD initiatives is crucial for understanding how governments, organizations, and industries adopt and utilize open data. Benchmarking involves evaluating OGD programs against established indicators, measuring progress, and comparing different nations or regions based on adoption, usability, and impact [2]. Studies have shown that benchmarking efforts often focus on technical aspects such as data quality, interoperability, and accessibility rather than measuring or assessing long-term economic and social benefits [36,37].
A variety of benchmarking initiatives exist, each with different focus areas. Some emphasize data availability and accessibility, such as the Open Data Index (OKFN) [38], Open Data Economy [39], and the Open Data Inventory (ODIN) [40]. Others measure policy readiness and impact, such as the Open Data Readiness Assessment (ODRA) [41], Open Data Barometer (ODB) [42], and the European Open Data Maturity Report [23]. Several studies highlight that many benchmarking systems lack direct assessments of OGD’s real-world applications, particularly in terms of their economic contributions, innovation potential, and impact on citizen engagement [18,43]. This gap presents a challenge in evaluating the tangible value of OGD beyond its availability and technical implementation. Moreover, research suggests that a comprehensive benchmarking approach should incorporate impact areas such as public participation, innovation, and cross-sector collaboration [3].
Despite the increasing interest in OGD-driven entrepreneurship and economic development, benchmarking efforts continue to prioritize technical assessments over measuring long-term impact. For example, Zeleti [31] argues that existing OGD benchmarks fail to evaluate secondary and tertiary effects of open data reuse, such as job creation and new business formation. While frameworks like the Open Data Barometer (ODB) acknowledge economic benefits, they do not track specific use cases that generate long-term financial value [29]. This study seeks to address this gap by developing a taxonomy that systematically categorizes OGD’s impact areas in the widest set of domains.
2.2. OGD Impact Evaluation Benchmarks
In recent years, several key global evaluation projects have been conducted to assess the impact of OGD initiatives across different levels, from municipalities to entire countries. These evaluation projects aim to measure the transparency, usability, and real-world impact of OGD, as well as their role in promoting governance, economic development, and social inclusion. Among the most significant evaluation frameworks are the Global Open Data Index [29], Open Data Barometer [33], European Open Data Maturity Report [34], Open Useful Reusable Government Data [38], and Open Data Inventory [31]. These evaluations have become essential tools in understanding the maturity of open data practices across the globe.
The Global Open Data Index (GODI) [29], conducted by the Open Knowledge Foundation, focuses solely on the publication of open data by national governments. It assesses how governments make data available across six categories: Finance and Economy, Politics and Election, Spatial Data, Law, Environment, and National Statistics. However, it does not evaluate the use or impact of the data, concentrating primarily on their availability. In contrast, the Open Data Barometer (ODB) [33], conducted by the World Wide Web Foundation, takes a more comprehensive approach by including three main indexes: Readiness, Implementation, and Impacts. The ODB evaluates the political, economic, and social impacts of open data through expert surveys, which assess factors like government transparency, economic growth, and social inclusion. It uses sources from online media, academic publications, and expert input to estimate the extent of these impacts.
The European Open Data Maturity Report [34], by the Publications Office of the European Union, evaluates the openness and quality of government data across European countries. Its goal is to identify best practices and provide guidance to enhance the open data landscape in Europe. Meanwhile, the Open Useful Reusable Government Data (OURdata) [38] evaluation, led by the Organisation for Economic Co-operation and Development (OECD), focuses on the accessibility and reusability of open government data. It emphasizes fostering innovation and creating economic value by promoting the reuse of open data. Similarly, the Open Data Inventory (ODIN) [31], conducted by Open Data Watch, focuses on evaluating official statistics and the practices of national statistical offices, with a strong emphasis on improving governance and economic development.
Despite their differences, these evaluations collectively provide important insights into the political, economic, and social impacts of open data. The ODB, for example, identifies the political impact of open data in terms of government efficiency, accountability, and transparency. In the economic domain, evaluations like ODB and OURdata show that open data can drive innovation, support entrepreneurship, and contribute to economic growth. Socially, these evaluations also highlight the role of OGD in fostering environmental sustainability and social inclusion, particularly in marginalized communities.
Despite their contributions, these evaluations and metrics have limitations [43]. For instance, GODI focuses exclusively on data publication and does not account for the broader impacts of open data on society or governance. Similarly, ODB’s reliance on expert surveys and secondary sources may not fully capture the nuances of OGD’s real-world effects.
2.3. Impact Assessment—Methods Used
The literature on OGD impact assessment employs a range of quantitative, qualitative, and mixed-methods approaches to evaluate socio-economic, political, and environmental outcomes. Evaluation frameworks such as Social Return on Investment (SROI) [44], value-generation models [45,46,47], and holistic ecosystem assessments [48] structure impact pathways through multi-dimensional categorizations. Systematic literature reviews and benchmark analyses [12,49,50,51,52,53] synthesize trends and identify gaps, with AI-assisted methods emerging to automate these evaluations [49,54,55]. Empirical validation studies frequently apply Partial Least Squares (PLS) models and regression analyses across cross-national datasets to establish causal relationships between OGD adoption and economic or governance benefits [45,46,48,56,57,58]. Surveys and stakeholder engagement methods [59,60,61,62,63] capture qualitative user perceptions of transparency, efficiency, and participation, while case studies and regional assessments adapt global frameworks to specific national or sectoral contexts [48,59,64,65]. Advanced analytical tools, including text mining for automated impact tracing [54] and longitudinal analyses for downstream effects [49], are beginning to address persistent challenges in capturing OGD’s indirect and long-term impacts. However, the field faces persistent challenges related to inconsistent metrics, difficulty in attributing long-term effects, and sectoral variability in OGD impacts. Many frameworks operate with different categorizations of impacts, making comparisons difficult and limiting their generalizability across domains [48,52,53]. Additionally, quantitative models struggle to isolate OGD’s effects from broader socio-technical influences, leading to overestimation or underestimation of impact [44,49]. The lack of standardized benchmarks means that while some studies focus on immediate economic gains [45,46], others prioritize transparency and governance outcomes [58,59], leading to fragmented assessments.
Despite these important contributions, previous studies suffer from several critical limitations in recognizing and quantifying OGD impacts comprehensively. First, many studies rely on isolated impact categories without establishing a cohesive, cross-domain framework that systematically assesses OGD across various initiatives [52,53]. Second, while some studies employ quantitative models, their findings remain highly context-dependent, with few contributions offering universally applicable methodologies for different national or sectoral contexts [48,64]. Additionally, many studies focus on single dimensions of OGD value, such as economic or transparency benefits, without integrating holistic multi-domain assessments, leaving out key areas like governance efficiency, environmental impacts, or citizen-driven innovation [12,49].
Another major challenge is the lack of standardization in OGD impact assessment metrics. The metrics used across studies vary significantly, making direct comparisons difficult and limiting replicability [52,66]. Moreover, due to the long-term and indirect nature of OGD effects, many studies struggle with impact attribution, making it difficult to isolate OGD’s specific contributions from broader socio-technical developments [44,49]. Finally, most studies do not integrate real-time data analytics, preventing existing models from dynamically reflecting changes in OGD implementation across evolving governmental policies and economic conditions [49,67].
A taxonomy-driven approach to OGD impact assessment provides the best solution because it offers a structured, standardized classification of impact areas, methodologies, and measurement indicators. Research that systematically organizes OGD evaluation frameworks into defined categories—such as readiness, usage, and outcomes-based assessments [50,52,53]—can unify disparate evaluation methods and improve comparability across studies and national contexts. Taxonomies also help identify underexplored areas, such as environmental impacts [49], and create consistent evaluation criteria that facilitate large-scale empirical validation. By categorizing OGD studies based on theoretical foundations, sectoral focus, and methodological rigor, taxonomies reduce conceptual ambiguity, enhance replicability, and provide a roadmap for future research on measuring OGD’s long-term benefits.
Furthermore, integrating an approach based on natural language processing (NLP), a subset of text mining [68], along with taxonomy frameworks allows for real-time classification and clustering of OGD impacts based on emerging trends in the academic literature, policy reports, and real-world OGD implementations. By leveraging NLP for knowledge extraction, taxonomies can continuously evolve, enabling dynamic and context-aware assessment models that can be adapted across different governance environments.
3. Materials and Methods
The research methodology employed in this study is rooted in design science research (DSR), as described by Hevner et al. [69]. DSR is a well-established framework that focuses on the creation and evaluation of artifacts, such as models, methods, and taxonomies, to address real-world problems. The DSR framework consists of the relevancy, rigor, and design cycle. While the relevancy and rigor cycle refers to problem identification, existing knowledge review, and research gap identification covered in the introduction, the design cycle provides the framework for artifact development and evaluation. Our research is focused on the development of a taxonomy for open government data topics—the artifact—which is guided by the principles of the Cross-Industry Standard Process for Data Mining (CRISP-DM). CRISP-DM is a six-phase methodology designed to offer a systematic and flexible approach to data mining projects and is, as outlined by Azevedo and Santos [70], widely adopted. Its comprehensive structure ensures the applicability of its methods across industries, providing a clear pathway for extracting meaningful insights from diverse datasets.
For this study, we applied the CRISP-DM framework to analyze 697 unstructured OGD use cases, sourced from the European Data Portal [29]. The one-page use case documents, ranging from 431 to 1353 words, typically begin with a header that displays the title of the use case, often accompanied by relevant logos or branding elements. This section is followed by an executive summary or abstract that provides an overview of the document’s purpose, context, and main outcomes. The next section then describes the challenges or needs that prompted the initiative and links the project to broader strategic goals or policies. The final sections define the objectives and a delineation of the project’s boundaries.
Given the unstructured nature of the data, our first step was to preprocess the text, ensuring it was suitable for machine learning analysis. This preprocessing involved several key tasks, including data extraction, cleaning, and normalization, as outlined in the following section. Following the data-preprocessing phase, we employed topic modeling techniques to uncover the thematic structure within use case documents. Specifically, we utilized five distinct machine learning methods for topic modeling, each offering unique advantages in identifying latent patterns within the text. These methods allowed us to capture the diversity of topics and group them into coherent themes.
It is important to note that while our approach utilizes the CRISP-DM framework to systematically extract topics from unstructured data, the development of the taxonomy itself is not a direct outcome of CRISP-DM. Considering that the primary artifact of this study is the taxonomy, the design cycle also includes a specific methodology dedicated to taxonomy development by Nickerson et al. [71]. In this context, based on the insights derived from the topic modeling analysis, we iteratively developed and refined a comprehensive taxonomy of OGD topics, which serves as an organized classification system, foundational for understanding the impact areas within the OGD domain and supporting further machine learning-driven analysis of OGD use cases.
The entire CRISP-DM framework process, results, and the detailed methodology and construction of the taxonomy are further explained in the sections that follow.
3.1. Data Extraction and Preprocessing
Unstructured text constitutes a prevalent form of data and, indeed, may constitute a substantial portion of the information accessible to a given research or data mining project [72]. When extracting data from unstructured documents, it was imperative to ensure the versatility of our code to handle various document formats beyond PDFs, and this is why we utilized the Textract package [73], which provides a single interface for extracting content from any type of file without any irrelevant markup.
The first step involved text normalization, where all text was converted to lowercase to maintain uniformity. Lemmatization, rather than stemming, was applied using the Natural Language Toolkit (NLTK) [74] to reduce words to their base forms while preserving semantic meaning. Common words, such as articles and conjunctions, were removed through stopword filtering, using an extended list that was manually refined based on domain-specific terms. Special characters, punctuation, numbers, email addresses, and URLs were eliminated to remove extraneous noise. The text was then tokenized into individual words to facilitate topic modeling, followed by word frequency analysis using term frequency-inverse document frequency (TF-IDF) scores, which helped identify the most relevant words for classification.
The rationale behind these preprocessing choices was driven by the need to enhance the quality of input data for topic modeling. Lemmatization was preferred over stemming to retain linguistic clarity, ensuring that similar words were grouped without distorting their meanings. TF-IDF weighting was applied to reduce the influence of common words that might skew topic identification. Stopword filtering was extended beyond standard lists by manually reviewing frequent yet uninformative terms. These steps ensured that the dataset was cleaned and structured for optimal topic extraction.
3.2. Topic Modeling
Topic modeling, a statistical modeling approach, leverages unsupervised machine learning to discern clusters or groups of comparable words within a text corpus. This method in text mining utilizes semantic structures within the text to comprehend unstructured data without the need for predefined tags or training data [75].
Several topic modeling methods exist, but we carefully selected a combination of five techniques—GPT-based topic extraction, Non-Negative Matrix Factorization (NMF), Latent Dirichlet Allocation (LDA), Hierarchical Dirichlet Process (HDP), and Latent Semantic Analysis (LSA)—based on their complementary strengths in structuring and refining the taxonomy. GPT-3.5 Turbo was used as an initial exploratory tool to generate high-level thematic structures from the dataset. It was chosen due to its context-aware text processing capabilities, allowing it to recognize implicit semantic relationships within OGD use cases. This step provided preliminary clusters of impact areas, which were later validated and refined through unsupervised topic modeling techniques. Next, we applied NMF to factorize the dataset into distinct topic components, helping identify non-overlapping thematic categories. Unlike probabilistic models, which assign documents to multiple topics, NMF creates clear separations, making it particularly useful for defining distinct OGD impact dimensions. We continued with LDA, a generative probabilistic model, that was employed to assign probability distributions over multiple topics within each OGD use case. This allowed us to capture multi-domain relationships, reflecting the fact that some OGD applications span across multiple sectors (e.g., open data in healthcare and governance). Compared to NMF, LDA provided a more flexible and nuanced representation of OGD themes. HDP was incorporated to automatically determine the number of topics, eliminating the need for arbitrary pre-specification. Unlike LDA, which requires manual input on the number of topics, HDP dynamically adjusts the topic count based on data patterns. This ensured that the taxonomy was not imposed but emerged naturally from the dataset. LSA was the final step, used for dimensionality reduction to refine and consolidate topics by detecting latent relationships between terms. By applying Singular Value Decomposition (SVD), LSA filtered out redundant or overly broad categories, improving the clarity of the final taxonomy.
The combined use of these models ensured that the taxonomy was both empirically driven and methodologically robust. Compared to alternative methods such as simple keyword clustering or manual annotation, our approach offered a scalable, reproducible, and objective way of categorizing OGD impact areas. The iterative application of unsupervised models and natural language processing allowed for greater flexibility in defining taxonomic structures while ensuring alignment with real-world OGD applications.
3.2.1. Generative Pre-Trained Transformer
We first applied topic modeling using the OpenAI Generative Pre-Trained Transformer (GPT) model [76]. These models demonstrate the ability to produce coherent and contextually relevant responses when presented with a prompt or input text [77]. GPT’s extensive pre-training on large text datasets enables it to understand complex language patterns and generate accurate responses, even in ambiguous contexts [78]. The GPT model is based on a transformer architecture that includes an encoder, decoder, feed-forward network, and cross-attention layer [79]. The encoder consists of multi-headed self-attention layers that process the input sequence, passing information between layers through interconnected blocks [80]. The decoder also uses multi-headed self-attention layers, focusing on generating the output sequence. Attention, first proposed by Bahdanau et al. [81], involves computing a context vector for each decoder step, which captures the most relevant information from all encoder states using a weighted average. The contribution of each encoder state is based on its alignment score, which measures its relevance to the previous decoder state. Self-attention applies this mechanism to every position in the input sequence, generating three vectors—query, key, and value—at each position. Using the query vector, the attention mechanism transforms the input sequence into a new sequence, with each element incorporating both the original input and its contextual relationship with other positions. These computations are performed across the entire sequence by grouping the queries, keys, and values into matrices [79]:
GPT’s transformer architecture also includes a feed-forward neural network (FFNN) that processes both input and output sequences. This network consists of several layers of interconnected neurons that allow information to flow through the model. At its core, the feed-forward network takes input values, multiplies them by corresponding weights, adds a bias term, and applies an activation function to produce the output. Additionally, a cross-attention layer connects the encoder and decoder. After the FFNN processes the input, the decoder’s multi-head attention block applies the same tokenization, word embedding, and attention mechanisms to generate attention vectors, which map the relationship between the source and target text. This information is then processed through another feed-forward layer to produce the final output.
The model was prompted with the phrase: “What domain is this text about in five keywords?” This approach allowed for rapid categorization of thematic areas without requiring labeled data. Two different temperature settings, 0.2 and 0.7, were tested based on OpenAI’s documentation [82]. The lower temperature of 0.2 favored deterministic responses, ensuring that topics remained stable across different runs, while the higher temperature of 0.7 introduced variability to detect potentially underrepresented topics. GPT was used as an initial topic exploration tool before applying unsupervised techniques. The model provided semantic-rich descriptions that helped refine topic groupings before further machine learning analysis.
3.2.2. Non-Negative Matrix Factorization
The second topic modeling technique employed was Non-Negative Matrix Factorization (NMF), which decomposes a document–word matrix into two lower-dimensional matrices to extract latent topics. NMF was selected because of its ability to identify clear, non-overlapping topics, making it useful for refining category distinctions. NMF as a technique is used to factorize a non-negative matrix X into two non-negative matrices, W and H, with the aim of approximating X by their product [83]. According to Lee and Seung [84], NMF is also a recognized mathematical method for dimensionality reduction.
NMF has been widely recognized as a powerful tool for topic modeling. Studies by Carbonetto [84] and Purpura [85] have demonstrated its potential in enhancing topic model performance, while Lee and Seung [83] originally proposed NMF as a method for uncovering latent structures, including its application to topic modeling.
The input data were vectorized using a TF-IDF transformation, ensuring that frequently occurring but non-informative words had reduced weight. The number of topics was set to five, as a single topic alone did not provide sufficient rationale or context for interpretation. However, when accompanied by four additional topics or keywords, the overall thematic structure became clearer, making it easier to understand the identified topics and their relevance. The choice of TF-IDF vectorization ensured that topic relevance was determined by meaningful term distributions rather than simple frequency.
3.2.3. Latent Dirichlet Allocation
Latent Dirichlet Allocation (LDA) was the third topic modeling technique used. LDA is a generative probabilistic model commonly used in natural language processing to uncover latent topics within a collection of documents. Developed by Blei et al. [86], LDA provides a framework for understanding the thematic structure of large text datasets. LDA assumes that each document is represented as a probability distribution over latent topics, with a shared Dirichlet prior for all documents. Similarly, each topic is modeled as a probability distribution over words, also governed by a Dirichlet prior.
As described by Blei et al. [86], for a corpus D of M documents, each with Nd words (d ∈ {1, …, M}), LDA’s generative process involves the following steps:
- Choose a multinomial distribution ϕt for topic t(t ∈ {1, …, T}) from a Dirichlet distribution with parameter β;
- Choose a multinomial distribution θd for document d(d ∈ {1, …, M}) from a Dirichlet distribution with parameter α;
- For a word wn (n ∈ {1, …, Nd}) in document d, select a topic zn from θd and select a word wn from ϕzn.
In this generative process, words in documents are observed variables, while other variables (such as ϕ and θ) and hyperparameters (α and β) are latent. The probability of the observed data D is computed for a corpus as follows:
Several studies have highlighted LDA’s effectiveness in topic modeling. Ostrowski [87] demonstrated its utility in identifying subtopics and classifying Twitter data. Christy et al. [88] proposed a hybrid model using LDA for feature extraction and selection, improving document clustering accuracy. Muchene et al. [89] employed a two-stage approach, combining LDA for per-document topic probabilities with hierarchical clustering for final topic clusters in scientific publications.
The implementation was carried with hyperparameters tuned as follows: α was set to 0.1, which encouraged sparsity and ensured that each document focused on a few dominant topics, and β was set to 0.01, reducing topic–word overlap to enhance category specificity. LDA was selected to identify thematic overlaps and distinguish between multi-domain use cases. The hyperparameter tuning ensured meaningful topic distributions without excessive dilution, while manual evaluation confirmed the interpretability of topic assignments.
3.2.4. Hierarchical Dirichlet Process
Hierarchical Dirichlet Process (HDP) was also applied to complement the LDA analysis. The Hierarchical Dirichlet Process (HDP), proposed by Teh et al. [90], is an extension of the Dirichlet Process that provides a flexible framework for hierarchical Bayesian modeling. Unlike models that require the number of topics or clusters to be set in advance, HDP adapts to the data and automatically determines the number of topics. This property made HDP a valuable tool for validating the stability and completeness of the LDA-derived topics. In HDP, random probability measures Gj are assigned to each group, and these are derived from a global random probability measure G0, which is sampled from a Dirichlet process with concentration parameter γ and base probability measure H:
Each Gj is then conditionally independent given G0 and follows another Dirichlet process with concentration parameter α0:
The hyperparameters include the baseline measure H and the concentration parameters γ and α0. H acts as a prior for the parameters θji, while the variability around G0 is controlled by γ, and the deviations of Gj from G0 are governed by α0. In some cases, different concentration parameters αj can be used for different groups to account for varying levels of variability. HDP is typically used as a prior distribution for grouped data, with each observation xji corresponding to a parameter θj2, sampled from Gj:
HDP is preferred over LDA for several reasons. First, HDP can automatically infer the number of topics, addressing a major limitation of LDA [91]. Second, HDP is more flexible and can incorporate supervision [91,92]. Lastly, HDP’s nonparametric nature and ability to handle an unknown number of mixture components make it ideal for online data clustering [93].
HDP was implemented using Gensim’s HDP model, which automatically determined topic numbers by adjusting hyperparameters during training. HDP was used to confirm that the predefined number of topics in LDA was appropriate, avoiding arbitrary topic segmentation and ensuring that topics emerged naturally from the dataset.
3.2.5. Latent Semantic Analysis
The final topic modeling technique used was Latent Semantic Analysis (LSA), which serves as a dimensionality reduction method to capture latent relationships between terms. LSA, introduced by Deerwester et al. [94], is a technique used in natural language processing and information retrieval to uncover the underlying structure and meaning in large text corpora. LSA represents words and documents in a high-dimensional space that captures latent semantic relationships. The key method used in LSA is Singular Value Decomposition (SVD), which is applied to a term–document matrix A, where aij represents the frequency of term i in document j.
SVD decomposes matrix A into three matrices U, Σ, and VT where
- U contains the left singular vectors;
- Σ a diagonal matrix with singular values; and
- VT is the transpose of the matrix with the right singular vectors.
Next, dimensionality reduction is performed by retaining only the top k singular values and their corresponding vectors to obtain reduced matrices Uk, Σk, and VkT. The reduced matrices represent terms and documents in a lower-dimensional semantic space where each document is represented as a vector in this semantic space (VkT), capturing the latent topics.
Dimensionality reduction is then performed by retaining only the top k singular values and their corresponding vectors, producing reduced matrices Uk, Σk, and VkT. This process results in a lower-dimensional representation of terms and documents, where documents are expressed as vectors in this semantic space, capturing the latent topics:
LSA has been widely used for topic modeling in various studies. Valdez et al. [95] demonstrated its effectiveness in identifying thematic patterns in large text collections. Gupta et al. [96] emphasized its role in revealing hidden patterns in big datasets, while Alghamdi and Alfalqi [97] provided a comprehensive review of different topic modeling methods, including LSA.
Using SVD, the document–term matrix was decomposed into orthogonal components, revealing deeper semantic structures. The number of retained components was set to five, ensuring that key patterns were preserved without excessive information loss. LSA was used to remove noisy topics and refine taxonomic clarity. The dimensionality reduction process improved topic coherence while retaining conceptual relationships between terms.
3.3. Taxonomy Development
Taxonomies provide a systematic way to classify and organize complex data into meaningful categories, enabling stakeholders to identify key areas of focus and assess the effectiveness of observed topics [98,99]. This is particularly critical for government and European Commission officials, who could benefit from efficient resource allocation and prioritization of impact areas with the purpose of maximizing the societal and economic benefits of open data. As per Nickerson et al. [71], taxonomy in mathematical representation consists of n dimensions Di (where i = 1, …, n), each comprising ki (with ki ≥ 2) mutually exclusive and collectively exhaustive characteristics Cij (where j = 1, …, ki). This structure ensures that each object being analyzed is associated with only one characteristic Cij for each dimension Di. In other words, we can express the taxonomy as follows:
In this context, the taxonomy development process proposed by Nickerson et al. [71] offers a rigorous methodological approach to constructing a well-defined classification system. Nickerson et al.’s [71] method combines both empirical and conceptual approaches, ensuring that the taxonomy is grounded in real-world data while also aligning with theoretical frameworks. This iterative process allows for continuous refinement of categories based on empirical evidence and expert input, making it particularly suitable for the dynamic and evolving nature of OGD impact areas.
In the following sections, we will outline the steps taken in the taxonomy development process, including the identification of meta-characteristics, ending conditions, and the iterative classification of impact areas. This structured approach ensures that the taxonomy is not only comprehensive but also adaptable to future developments in the field of open government data.
3.3.1. Meta-Characteristic
Following the approach of Nickerson et al. [71], we first had to define a meta-characteristic, which is a foundational concept in taxonomy development and serves as the primary guiding principle. It defines the scope and focus of the taxonomy, ensuring that the dimensions and characteristics are consistent and aligned with the overall purpose of the classification system. It is essentially the key attribute or perspective on which all other dimensions and characteristics of the taxonomy are based.
Selecting an appropriate meta-characteristic is one of the most important steps in taxonomy development, as it influences the entire structure. According to Nickerson et al. [71], there are a few key considerations to consider when choosing the meta-characteristic:
- Purpose of the taxonomy: The meta-characteristic should align with the objective of the taxonomy and must reflect the core purpose or objective of the taxonomy.
- Audience and use cases: The meta-characteristic should be relevant to the stakeholders and use cases, guiding the classification in a way that meets their needs.
- Scope of the domain: The meta-characteristic should capture the essential scope of the domain being studied. It should be broad enough to encompass all relevant dimensions but specific enough to ensure focus.
- Mutually exclusive and collectively exhaustive: The meta-characteristic should help guide the development of dimensions and characteristics that are mutually exclusive (no overlap between categories) and collectively exhaustive (covering all relevant aspects).
Given that our goal is to classify the impact areas of OGD, the meta-characteristic defined for our research is as follows: “The potential impact areas influenced by open government data initiatives and their use cases”.
3.3.2. Ending Conditions
Next, conditions that end the process must be determined. So-called ending conditions are criteria that define when the iterative process in the development of a taxonomy should be stopped. According to Nickerson et al. [71], taxonomy development, in general, is an iterative process involving empirical and/or conceptual steps, and it is essential to have clear criteria for when to stop iterating. Nickerson et al. [71] suggest that both objective and subjective ending conditions must be met before concluding the taxonomy development process. This ensures that the taxonomy is not only structurally complete (objective) but also practical, usable, and aligned with its intended purpose. Ending conditions that were proposed by Nickerson et al. [71] and are used in this research are presented in Table 1.

Table 1.
Ending conditions of taxonomy development, adapted from Nickerson et al. [71].
3.3.3. Approach Selection
As first defined by Bailey [100] and later expanded and proposed in their model by Nickerson et al. [71], two different approaches can be utilized for taxonomy development: empirical-to-conceptual and conceptual-to-empirical. In the empirical-to-conceptual approach, the researcher selects a subset of objects to classify, typically based on familiarity or accessibility, potentially through literature reviews. This subset may be sampled randomly, systematically, or conveniently. The researcher then identifies common characteristics of these objects, which must logically derive from the meta-characteristic while also effectively discriminating among the objects. The researcher may rely on their knowledge or consult with experts. In the conceptual-to-empirical approach, the researcher starts by conceptualizing the dimensions without examining actual objects. This deductive process relies on the researcher’s understanding of similarities and differences among objects, drawing on existing knowledge and judgment to determine relevant dimensions. Each dimension must have characteristics that logically stem from the meta-characteristic. The appropriateness of these dimensions is assessed by checking if they encompass objects with the proposed characteristics. As in the empirical approach, each dimension must also be mutually exclusive and collectively exhaustive.
As stated by Nickerson et al. [71], one can utilize both approaches while creating a taxonomy, depending on the specific goals of the research and the nature of the subject matter being studied. In developing our taxonomy, we have chosen to utilize both the empirical-to-conceptual and conceptual-to-empirical approaches. This dual methodology allows us to leverage the strengths of each approach to create a comprehensive and robust classification system.
3.3.4. Validation
The validation of the developed taxonomy was conducted by assessing whether it met the objective and subjective ending conditions as defined by Nickerson et al. [71]. The purpose of this validation was to ensure that the taxonomy is complete, practical, and sufficiently structured to classify OGD impact areas effectively.
To determine whether the taxonomy was finalized, we systematically evaluated it against a predefined set of objective and subjective criteria, ensuring that no further refinements were necessary. The objective ending conditions assessed whether all identified OGD impact areas were classified within a distinct category, with no new dimensions or characteristics emerging in the final iteration. The taxonomy was considered complete when every impact dimension had at least one representative use case, and no new categories were required in subsequent iterations. Additionally, dimensions were reviewed to confirm that they were mutually exclusive and collectively exhaustive, ensuring that no overlap existed between different categories while covering all relevant impact areas comprehensively.
The subjective ending conditions evaluated the practicality and usability of the taxonomy. It was confirmed that the taxonomy was concise and not overly complex, making it accessible for researchers and policymakers. The explanatory power of the taxonomy was also assessed to ensure that each category provided clear distinctions and meaningful classification of OGD impact areas.
Besides the validation by using ending conditions, Nickerson et al. [71] explain that currently there is no method to provide clear sufficient conditions for determining a taxonomy’s usefulness, other than stating that it is useful if it is actually used by others—a tautological condition. This aligns with design science research, which prioritizes utility over truth [69], and if this is the only sufficient condition, then the only way to assess a taxonomy’s usefulness is by observing its use over time. Ideally, we would prefer sufficient conditions that are easier to apply and could be evaluated before the taxonomy is put into use. However, such conditions are likely to vary depending on the intended purpose of the taxonomy.
3.3.5. Process Schema
Drawing from the methodology outlined by Nickerson et al. [71], we introduce a high-level process schema (Figure 1) that details the essential steps involved in developing a taxonomy. Each step in this schema will also be referenced in every iteration of the taxonomy development in the Results section to simplify and improve the reader’s understanding of the process.
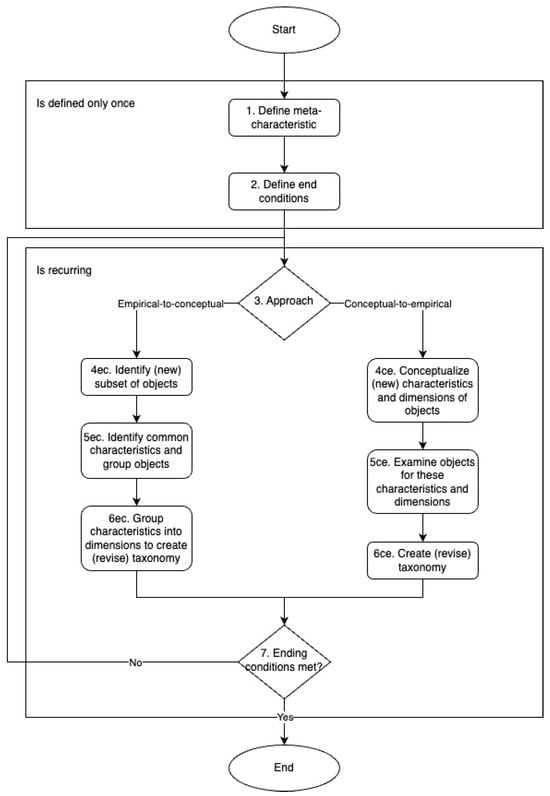
Figure 1.
High-level process schema for taxonomy development adapted from Nickerson et al. [71].
4. Results
The results of this study outline the iterative development of a taxonomy for OGD impact areas. The taxonomy was constructed using a combination of machine learning-based topic modeling and systematic iterative refinement, ensuring that each impact area was grounded in empirical evidence while remaining theoretically robust. The development process followed the structured methodology described in Section 3, progressing through multiple iterations that refined the classification structure based on both quantitative outputs from topic modeling and qualitative evaluation of coherence and completeness.
The rationale behind the selection of impact dimensions was guided by both data-driven insights and conceptual relevance. Initial topic modeling extracted thematic areas that frequently appeared in OGD use cases. These themes were cross-referenced with existing OGD impact frameworks, such as those in the Open Data Maturity Report [23] and other benchmarks, to ensure alignment with established domains. While some dimensions, such as Governance, Environment, and Society, emerged naturally from the data and corresponded with prior frameworks, others, such as Innovation, were explicitly included to capture areas where OGD is increasingly driving economic and technological progress. Additionally, dimensions that were initially considered but did not provide distinct, actionable categories were either merged into broader classifications or removed through further iterations. The final structure reflects a balance between empirical clustering and theoretical grounding, ensuring a comprehensive yet parsimonious classification of OGD impact areas.
We initially performed a hierarchical clustering on the preprocessed use cases to identify potential high-level impact areas and possibly align them with the ones proposed by the Publications Office of the European Union [29]. We first generated document embeddings using the Multilingual BERT model [101] and employed cosine similarity to calculate distances between rows in the dataset, following recommendations from previous studies addressing text mining challenges such as text classification, summarization, and information retrieval [102,103,104]. The results of the hierarchical clustering revealed four major groups in the data. Upon manual inspection of each cluster, we confirmed that most use cases were multi-domain, with three distinct clusters focused primarily on the environment, transport, and education, while the fourth and largest cluster encompassed all other domains. Defining this fourth area as either society or economy would lead to a disproportionate taxonomy, with the majority of taxons falling into this category. Therefore, while the clustering analysis did not show a direct correlation with the impact areas outlined by the Publications Office of the European Union [29], a manual review of the clusters better aligns with the initial four impact areas defined in the Open Data Maturity Report [23].
4.1. Iteration 1—Initial Taxonomy Draft Based on Predefined Domains
The first iteration focused on establishing a preliminary taxonomy using predefined impact categories drawn from the Open Data Maturity Report [23] and sectoral classifications in Data Europa use cases [29]. The aim of this phase was to create an initial framework that could then be tested and refined through empirical methods. Actions taken in this iteration that correspond to the Nickerson et al. [71] methodology are outlined in Table 2 and Table 3.
Table 3.
Data Europa use case sectors used in mapping to four broad dimensions of OGD impact.
Table 2.
Key actions and outcomes of the first iteration of taxonomy development.
Table 2.
Key actions and outcomes of the first iteration of taxonomy development.
| Step | Action | Outcome |
|---|---|---|
| 3ec | Approach: empirical-to-conceptual | Base taxonomy on existing classifications. |
| 4ec | Defined OGD use approaches | Identified 4 types of use: Everyday use, long-term use, direct use, indirect use |
| 5ec | Classified impact areas | Grouped into 4 broad dimensions: Governmental, Social, Environmental, Economic |
| 6ec | Created taxonomy matrix | Mapped 13 thematic areas to dimensions (see Table 3) |
| 7 | Evaluated taxonomy | Found lack of granularity, prompting machine learning integration |
The preliminary taxonomy included four broad impact dimensions: Governmental, Social, Environmental, and Economic. These dimensions were chosen based on their presence in existing benchmarks. Additionally, 12 thematic areas extracted from the Data Europa Portal (e.g., Agriculture, Economy, Health, Transport, etc.) were mapped to these four dimensions as outlined in Table 4. In all tables presented in the format of Table 4, the symbol “x” denotes a cross-section or an intersection between the given initiative focus and the respective dimensions and thematic areas in the matrix. It signifies that a particular initiative focus (row) is relevant to or associated with a specific dimension and thematic area.
Table 4.
Taxonomy draft of OGD impact areas after Iteration 1.
Upon evaluation, this initial structure was found to lack granularity. Many thematic areas overlapped, and some impact areas, particularly those related to innovation and cross-sectoral applications, were not distinctly captured. Furthermore, while the initial classification was useful as a baseline, it did not fully reflect the complexity and diversity of OGD applications observed in real-world use cases. This limitation led to the next iteration, where machine learning-based topic modeling was introduced to extract more nuanced thematic categories directly from the dataset.
4.2. Iteration 2—Refinement Using GPT-Based Topic Modeling
The second iteration integrated GPT-based topic modeling to identify emerging themes and refine the taxonomy’s structure. The use of GPT allowed for the automated extraction of thematic keywords, helping uncover new impact areas beyond those predefined in existing frameworks.
The analysis extracted 210 unique keywords, which were clustered into seven broad impact dimensions: Society, Health, Infrastructure, Education, Innovation, Governance, and Environment. Two new approaches for OGD use were also identified based on the analysis: Collaborative Use (involving multiple stakeholders in data reuse) and Individual Use (single-user applications). Actions conducted in this iteration are outlined in Table 5, and the refined dimensions with subcategories are presented in Table 6.
Table 5.
Key actions and outcomes of the second iteration of taxonomy development.
Table 6.
Refined dimensions with corresponding subdimensions identified by GPT-based topic modeling.
While this structure significantly improved the taxonomy, a key challenge arose in interpreting abstract terms generated by the model. Some extracted topics were vague or lacked direct relevance to OGD, requiring manual review and consolidation. As a result, additional machine learning techniques were employed in the next iteration to validate and refine the categories further.
4.3. Iteration 3—Refinement Through Additional Topic Modeling Techniques
The third iteration applied four additional topic modeling techniques—Non-Negative Matrix Factorization (NMF), Latent Dirichlet Allocation (LDA), Hierarchical Dirichlet Process (HDP), and Latent Semantic Analysis (LSA)—to compare and validate the taxonomy’s structure. Each of these models contributed uniquely to ensuring topic stability, coherence, and completeness.
The use of NMF helped identify distinct, non-overlapping themes, while LDA revealed probabilistic topic distributions, allowing for finer granularity in categorization. HDP dynamically adjusted the number of topics, ensuring that previously undefined categories were captured where necessary. LSA, as a dimensionality reduction technique, filtered out noisy and redundant topics that did not contribute to meaningful distinctions.
This process, as described in Table 7, resulted in the extraction of 453 additional keywords, most of which overlapped with the categories already identified. The taxonomy’s seven impact dimensions remained stable, confirming the robustness of the structure established in the previous iteration. However, additional refinements were made to subcategories within each dimension, ensuring that all terms were distinct and non-redundant.
Table 7.
Key actions and outcomes of the third iteration of taxonomy development.
Each technique used in this iteration offers unique advantages and limitations, influencing the quality of extracted topics and their relevance to OGD impact classification. The comparison of these techniques is summarized in Table 8, highlighting their strengths and weaknesses.
Table 8.
Comparison of topic modeling techniques used in this research (strengths and weaknesses).
At this stage, no new high-level dimensions emerged, and the taxonomy’s structure remained unchanged, reinforcing confidence in the framework’s validity. The remaining refinements involved adjusting wording and definitions to improve clarity and usability.
4.4. Iteration 4—Final Refinements and Conceptual Validation
The final iteration focused on conceptual validation by applying Nickerson et al.’s [71] ending conditions. The taxonomy was evaluated against key criteria to determine whether it was structurally complete, mutually exclusive, and practically applicable.
Each impact dimension was assessed to ensure that it contained at least one representative use case and that all categories were mutually exclusive and collectively exhaustive. As outlined in Table 9, no new dimensions or subcategories emerged in this stage, indicating that the taxonomy had reached a stable and complete form.
Table 9.
Key actions and outcomes of the fourth and final iteration of taxonomy development.
Conceptual validation also involved assessing the taxonomy’s explanatory power and extendibility. The final structure was reviewed to ensure that it could accommodate future refinements should new OGD use cases or impact areas emerge. The taxonomy was also tested for practical usability, ensuring that it could be easily interpreted by researchers and policymakers seeking to classify OGD impact areas.
At this stage, the taxonomy was considered fully validated, meeting both objective and subjective ending conditions. The final structure is visually presented in Table 10 and Table 11, identifying OGD use areas and providing comprehensive descriptions of each dimension, subcategory, and characteristic. Table 10 and Table 11 adhere to specific formatting conventions to convey distinct meanings. In Table 10, underlined text represents high-level taxons or first-level categories, while in both tables, a grey background highlights second-level taxons.
Table 10.
Taxonomy draft of OGD impact areas after Iteration 2, 3, and 4.
Table 11.
Final taxonomy of OGD impact areas with taxon description.
5. Discussion
The results of this study highlight the importance of developing a structured taxonomy for categorizing the impact areas of OGD. By employing a combination of empirical-to-conceptual and conceptual-to-empirical methodologies, along with machine learning-driven topic modeling techniques, this research successfully produced a taxonomy that classifies OGD impact into seven high-level dimensions. These include Society, Health, Infrastructure, Education, Innovation, Governance, and Environment, each containing subcategories that provide a more nuanced classification of OGD use cases. The findings indicate that the impact of OGD extends beyond traditional domains of governance and transparency, influencing areas such as education, sustainability, and public services. These results align with prior research on OGD impact, which underscores the need for structured classification systems to measure and evaluate open data initiatives effectively [12,18].
Compared to previous studies, which often focused on single-use cases or specific geographies, our approach applies a scalable methodology by leveraging machine learning for topic identification. This contrasts with previous research that either relied on predefined classifications or manually developed taxonomies [31], which can limit flexibility and adaptability.
One of the key contributions of this research is the practical applicability of the taxonomy in assessing and categorizing the effects of OGD initiatives. The structured classification system developed in this study has several important applications. For policymakers and government agencies, the taxonomy can be used as a framework to evaluate OGD initiatives, ensuring that open data are leveraged effectively to achieve measurable impacts across various different domains. Governments can use this taxonomy to identify gaps in current open data policies, prioritize high-impact datasets, and design targeted interventions to enhance OGD adoption. For researchers and data analysts, the taxonomy provides a standardized structure for studying OGD impact, enabling comparative analysis across regions and sectors. By classifying OGD use cases using a structured taxonomy, researchers can more effectively track trends, identify emerging areas of innovation, and assess the effectiveness of different data utilization strategies. For private sector organizations and startups, the taxonomy offers a tool for discovering economic opportunities in OGD utilization. Companies can use it to identify high-impact sectors where open data can be leveraged for innovation, business intelligence, and service development. By mapping business activities to specific OGD impact categories, private entities can better align their open data applications with market needs and policy incentives. Additionally, the taxonomy can serve as a decision-support tool for international organizations seeking to benchmark OGD maturity and impact across different countries. Since international open data frameworks often struggle with standardized impact measurement, this taxonomy can provide a structured way to evaluate cross-national differences in OGD adoption and effectiveness.
Beyond its applications in open data governance, the taxonomy is also inherently linked to sustainable development goals (SDGs), as each high-level dimension represents a critical area where OGD can support sustainable policies and long-term societal improvements. Society relates to inclusive governance and social equity (SDG 16: Peace, Justice, and Strong Institutions), while Health aligns with improving public health systems through data-driven decision-making (SDG 3: Good Health and Well-being). Infrastructure is closely associated with smart city planning and efficient resource allocation (SDG 9: Industry, Innovation, and Infrastructure), while Education contributes to knowledge accessibility and digital inclusion (SDG 4: Quality Education). The Innovation dimension supports economic growth and technological advancements (SDG 8: Decent Work and Economic Growth), while Governance reinforces transparency, accountability, and participatory decision-making (SDG 16). Finally, Environment is directly related to climate action, sustainability policies, and environmental protection efforts (SDG 13: Climate Action). The taxonomy’s structure provides a framework for governments and organizations to align their OGD initiatives with sustainability objectives, ensuring that open data supports long-term economic, social, and environmental goals. By categorizing OGD impact areas in a structured way, policymakers can better target open data applications to address key sustainability challenges, track progress on SDGs, and optimize resource allocation. The taxonomy can also assist international organizations in evaluating how open data contribute to sustainable development across different countries, enabling data-driven policymaking and impact assessment.
While the taxonomy provides a generalizable and scalable framework, its applicability may vary across different regions and data scales. The classification system was developed using a dataset of 697 OGD use cases from multiple sources, ensuring a broad representation of OGD initiatives. However, OGD adoption and maturity levels differ across countries and sectors. In regions with advanced open data policies, such as Estonia and the United Kingdom, the taxonomy aligns well with existing governance structures and sectoral classifications. However, in countries with emerging OGD ecosystems, certain impact areas, particularly those related to technology-driven innovations and advanced data applications, may be under-represented. In such cases, policymakers may need to adapt the taxonomy by consolidating categories that are less relevant while expanding those that align with regional priorities. This flexibility would allow the classification system to remain applicable in diverse governance models while maintaining its structured approach to OGD impact assessment.
Similarly, the taxonomy’s usability depends on dataset size and sector specificity. While it was designed to cover a broad spectrum of OGD applications, in cases where datasets are significantly smaller or focused on a particular domain, the taxonomy may require hierarchical adjustments. For instance, in datasets that primarily focus on a single sector, such as health or environmental data, a more granular subcategorization within the dominant impact dimension may be necessary to capture domain-specific nuances. Conversely, in contexts where limited OGD initiatives exist, the taxonomy may need to merge certain dimensions to maintain clarity and applicability. A possible refinement approach would involve implementing hierarchical clustering techniques, allowing for flexible aggregation or subdivision of categories based on the scale and focus of the OGD dataset.
To further enhance adaptability, future studies could explore the integration of real-time classification mechanisms using machine learning-based refinements. By training a classifier on new OGD use cases, the system could dynamically adjust category assignments based on evolving data trends and sectoral developments. This approach would ensure that the taxonomy remains responsive to new OGD applications and can be tailored to meet the diverse needs of regional and sector-specific implementations. Future work could also involve collaborations with government agencies and OGD practitioners to test the taxonomy in real-world decision-making settings, evaluating its effectiveness in policy planning, digital transformation initiatives, and international benchmarking efforts.
Despite its contributions, this study has several limitations that should be acknowledged. One key limitation, already mentioned, is the size and scope of the dataset used for taxonomy development. Expanding the dataset to include a larger and more representative sample of use cases would enhance the robustness of the taxonomy. Another limitation is the conciseness of some OGD use cases, which may have affected the depth of insights that could be extracted from topic modeling. Since many of the analyzed documents provided only high-level descriptions of OGD applications, some underlying contextual factors and detailed impacts may not have been fully captured. Future studies could incorporate a proposal of long-form reports or stakeholder interviews to provide a richer understanding of OGD impact. Additionally, the subjectivity of taxonomic classification presents a challenge. While the taxonomy was empirically derived using machine learning techniques, the final structure required human interpretation to refine and group similar themes. The classification process, therefore, remains partially subjective. Finally, the study did not assess the real-world implementation of the taxonomy. While the taxonomy has been validated against machine learning outputs and theoretical frameworks, its effectiveness in real-world decision-making scenarios remains untested. Future research should include case studies or pilot implementations where the taxonomy is applied in policy evaluation, business intelligence, or civic engagement initiatives to measure its practical impact.
Future research should focus on three key areas to enhance and expand the findings of this study. First, the dataset should be expanded to include a broader range of OGD use cases from multiple regions, languages, and domains. This would allow for the identification of regional or sector-specific trends in OGD impact, making the taxonomy more globally applicable. Collecting a larger dataset from diverse sources such as municipal open data portals, global OGD repositories, and sector-specific databases would improve the taxonomy’s coverage and generalizability. Second, the taxonomy should undergo further validation by domain experts to reduce subjectivity in classification. A structured validation process, such as Delphi studies or expert panel reviews, should be conducted to refine subcategories, merge overlapping themes, and improve category definitions. Third, the taxonomy should be integrated into an automated classification system that can process new OGD use cases dynamically. By developing a machine learning-based classifier trained on the taxonomy categories, researchers and practitioners could automatically categorize new OGD projects without manual intervention. This would enable real-time tracking of OGD trends, making it easier for governments and organizations to monitor how open data are being utilized and what sectors are benefiting the most.
6. Conclusions
This research successfully developed a structured taxonomy for classifying the impact areas of open government data. Our approach integrated empirical data-driven methodologies with conceptual reasoning to create a robust and scalable classification system. The initial research question guiding this study was the following: How can we systematically classify and assess the impact areas of OGD initiatives? In response, we utilized machine learning techniques such as Latent Dirichlet Allocation (LDA), Non-Negative Matrix Factorization (NMF), and Hierarchical Dirichlet Process (HDP) to extract meaningful topics from OGD use cases. Through an iterative process, we identified seven high-level impact dimensions—Society, Health, Infrastructure, Education, Innovation, Governance, and Environment—each comprising multiple subcategories.
The findings of this study have significant implications for policymakers, researchers, and industry stakeholders involved in OGD initiatives. For governments and policymakers, the taxonomy provides a structured framework for evaluating OGD initiatives, ensuring that open data policies align with measurable societal, economic, and environmental benefits. For academia and researchers, the taxonomy serves as a foundational structure for studying OGD impact across different domains, and for industry stakeholders and data-driven businesses, the taxonomy provides a practical tool for identifying economic opportunities related to OGD utilization.
Future research should build upon the findings of this study by expanding and refining the taxonomy in several ways. One key direction is broadening the dataset to include a larger and more diverse set of OGD use cases from multiple countries and sectors. Another critical direction is expert validation and refinement of the taxonomy. While this study relied on machine learning models and iterative refinements, further validation by OGD practitioners, policymakers, and domain experts would help ensure that the classification remains relevant, interpretable, and practically useful. An additional avenue for future work is automating OGD impact classification using machine learning-based classifiers trained on the taxonomy categories. Longitudinal studies should also be conducted to analyze how OGD impact evolves over time, and finally, future research should explore practical applications of this taxonomy within existing OGD evaluation frameworks.
This study makes a substantial contribution to the field of open government data research by providing a systematic, scalable, and empirically validated framework for classifying OGD impact areas. Unlike previous studies that have focused on predefined classifications, single-domain evaluations, or manual taxonomies, this research introduces a machine learning-driven approach that enables dynamic and data-driven classification. The integration of multiple topic modeling techniques ensures that the taxonomy is robust, comprehensive, and adaptable to evolving OGD applications.
By bridging data science methodologies with policy analysis, this study advances the understanding of how OGD impacts various sectors and how its benefits can be systematically assessed. The taxonomy lays the groundwork for further research in OGD classification, automation, and longitudinal impact tracking, positioning it as a critical tool for advancing open data scholarship and practice.
Author Contributions
Conceptualization, A.F. and M.K.B.; methodology, A.F.; software, A.F.; validation, A.F., M.K.B.; formal analysis, A.F.; investigation, A.F.; resources, A.F.; data curation, A.F.; writing—original draft preparation, A.F.; writing—review and editing, M.K.B.; visualization, A.F.; supervision, M.K.B.; project administration, M.K.B.; funding acquisition, M.K.B. All authors have read and agreed to the published version of the manuscript.
Funding
This research was funded by Slovenian Research and Innovation Agency and Ministry of Digital Transformation of Republic of Slovenia, grant number V5-2356, and Slovenian Research and Innovation Agency, grant number P5-0018.
Data Availability Statement
The data presented in this study are available on request from the corresponding author.
Conflicts of Interest
The authors declare no conflicts of interest.
References
- Organisation for Economic Co-operation and Development. Open Government Data Report: Enhancing Policy Maturity for Sustainable Impact; OECD Publishing: Paris, France, 2018; pp. 3–4. [Google Scholar] [CrossRef]
- Attard, J.; Orlandi, F.; Scerri, S.; Auer, S. A systematic review of open government data initiatives. Gov. Inf. Q. 2015, 32, 399–418. [Google Scholar] [CrossRef]
- Attard, J.; Orlandi, F.; Auer, S. Value Creation on Open Government Data. In Proceedings of the 2016 49th Hawaii International Conference on System Sciences (HICSS), Koloa, HI, USA, 5–8 January 2016; pp. 2605–2614. [Google Scholar] [CrossRef]
- Safarov, I.; Meijer, A.; Grimmelikhuijsen, S. Utilization of open government data: A systematic literature review of types, conditions, effects and users. Inf. Polity 2017, 22, 1–24. [Google Scholar] [CrossRef]
- Ubaldi, B. Open Government Data: Towards Empirical Analysis of Open Government Data Initiatives; OECD Publishing: Paris, France, 2013; pp. 4–17. [Google Scholar] [CrossRef]
- Yan, A.; Weber, N. Mining Open Government Data Used in Scientific Research. In Proceedings of the 13th International Conference, iConference 2018, Transforming Digital Worlds, Lecture Notes in Computer Science, Sheffield, UK, 25–28 March 2018; Volume 10766, pp. 303–313. [Google Scholar] [CrossRef]
- Jaeger, P.T.; Bertot, J.C. Transparency and technological change: Ensuring equal and sustained public access to government information. Gov. Inf. Q. 2010, 27, 371–376. [Google Scholar] [CrossRef]
- Buttow, C.V.; Weerts, S. Open Government Data: The OECD’s Swiss army knife in the transformation of government. Policy Internet 2022, 14, 219–234. [Google Scholar] [CrossRef]
- Fan, B.; Meng, X. Moderating Effects of Governance on Open Government Data Quality and Open Government Data Utilization: Analysis Based on the Resource Complementarity Perspective. J. Glob. Inf. Technol. Manag. 2023, 26, 300–322. [Google Scholar] [CrossRef]
- Nikiforova, A. Smarter Open Government Data for Society 5.0: Are Your Open Data Smart Enough? Sensors 2021, 21, 5204. [Google Scholar] [CrossRef]
- Jiang, H.; Duan, Y.; Zhu, Y. Citizens’ Continuous-Use Intention to Open Government Data: Empirical Evidence from China. In Proceedings of the 10th International Conference on Big Data, Big Data 2021, Virtual Event, 10–14 December 2021; Volume 12988, pp. 62–79. [Google Scholar] [CrossRef]
- Ruijer, E.H.J.M.; Martinius, E. Researching the democratic impact of open government data: A systematic literature review. Inf. Polity 2017, 22, 233–250. [Google Scholar] [CrossRef]
- Open Data Institute. Available online: https://theodi.org/ (accessed on 7 March 2025).
- European Commission. Danish Basic Data Program. Available online: https://ec.europa.eu/digital-building-blocks/sites/pages/viewpage.action?pageId=533365971 (accessed on 7 March 2025).
- Farhadloo, M.; Rosso, M.; Animesh, A. Open government data, innovation and diversification: The pursuit of economic value. Transform. Gov. People Process Policy 2024, 18, 722–743. [Google Scholar] [CrossRef]
- González-Zapata, F.; Rivera, A.; Chauvet, L.; Emilsson, C.; Zahuranec, A.; Young, A.; Verhulst, S. Open Data in Action: Initiatives during the Initial Stage of the COVID-19 Pandemic (Report); GovLab, Organisation for Economic Co-operation and Development (OECD): Paris, France, 2021. [Google Scholar] [CrossRef]
- Roa, H.N.; Loza-Aguirre, E.; Flores, P. A Survey on the Problems Affecting the Development of Open Government Data Initiatives. In Proceedings of the Sixth International Conference on eDemocracy & eGovernment (ICEDEG), Quito, Ecuador, 24–26 April 2019; pp. 157–163. [Google Scholar] [CrossRef]
- Zuiderwijk, A.; Janssen, M. Open data policies, their implementation and impact: A framework for comparison. Gov. Inf. Q. 2014, 31, 17–29. [Google Scholar] [CrossRef]
- Jamieson, D.; Wilson, R.; Martin, M. The (im)possibilities of open data? Public Money Manag. 2019, 39, 364–368. [Google Scholar] [CrossRef]
- Zhang, L.; Sok, S. The impact of government open data platform construction on corporate capital market performance: Evidence from stock liquidity. Pac. Basin Financ. J. 2025, 90, 102667. [Google Scholar] [CrossRef]
- Tan, L.; Pei, J. Open government data and the urban–rural income divide in China: An exploration of data inequalities and their consequences. Sustainability 2023, 15, 9867. [Google Scholar] [CrossRef]
- Peng, X.; Xiao, D. Can open government data improve city green land-use efficiency? Evidence from China. Land 2024, 13, 1891. [Google Scholar] [CrossRef]
- European Commission. 2024 Open Data Maturity Report; Publications Office of the European Union: Luxembourg, 2024; pp. 5–15. [Google Scholar] [CrossRef]
- European Commission. European Data Portal Report; Capgemini Invent: Luxembourg, 2020; pp. 10–16. [Google Scholar] [CrossRef]
- Tai, K. Open government research over a decade: A systematic review. Gov. Inf. Q. 2021, 38, 101566. [Google Scholar] [CrossRef]
- Ali Hassan, M.; Twinomurinzi, H. A Systematic Literature Review of Open Government Data Research: Challenges, Opportunities and Gaps. In Proceedings of the 2018 Open Innovations Conference (OI), Johannesburg, South Africa, 3–5 October 2018; pp. 299–304. [Google Scholar] [CrossRef]
- Zhang, H.; Zheng, L. Research on Open Government Data in China:: A Critical Assessment of 587 Papers. In Proceedings of the 15th International Conference on Theory and Practice of Electronic Governance, Guimaraes, Portugal, 4–7 October 2022; pp. 516–521. [Google Scholar] [CrossRef]
- Young, A.; Verhulst, S. The Global Impact of Open Data: Key Findings from Detailed Case Studies Around the World; O’Reilly Media: Sebastopol, CA, USA, 2016. [Google Scholar]
- Publications Office of the European Union. Use Cases. Available online: https://data.europa.eu/en/publications/use-cases (accessed on 15 February 2025).
- Crusoe, J.; Clarinval, A. Classification of Open Government Data Solutions’ Help: A Novel Taxonomy and Cluster Analysis. Electron. Gov. 2023, 14130, 230–245. [Google Scholar] [CrossRef]
- Zeleti, A.F. Analytical Frame for Open Data Impact Assessment—An Exploratory Research. SSRN 2023. [Google Scholar] [CrossRef]
- Cagliero, L.; Garza, P. Improving classification models with taxonomy information. Data Knowl. Eng. 2013, 86, 85–101. [Google Scholar] [CrossRef]
- Charalabidis, Y.; Alexopoulos, C.; Loukis, E. A taxonomy of open government data research areas and topics. J. Organ. Comput. Electron. Commer. 2016, 26, 41–63. [Google Scholar] [CrossRef]
- Mohamad, A.N.; Sylvester, A.; Campbell-Meier, J. Towards a taxonomy of research areas in open government data. Online Inf. Rev. 2024, 48, 67–83. [Google Scholar] [CrossRef]
- Zuiderwijk, A.; Reuver, M.D. Why open government data initiatives fail to achieve their objectives: Categorizing and prioritizing barriers through a global survey. Transform. Gov. People Process Policy 2021, 15, 377–395. [Google Scholar] [CrossRef]
- Hao-En, K. Between International Practice and Academia: Review and integration of Open Government Data Benchmarks. In Proceedings of the 24th Annual International Conference on Digital Government Research, Gdansk, Poland, 11–14 July 2023; pp. 73–89. [Google Scholar] [CrossRef]
- Zuiderwijk, A.; Pirannejad, A.; Susha, I. Comparing open data benchmarks: Which metrics and methodologies determine countries’ positions in the ranking lists? Telemat. Inform. 2021, 62, 101634. [Google Scholar] [CrossRef]
- Open Knowledge Foundation. Global Open Data Index. Available online: http://index.okfn.org/ (accessed on 8 July 2024).
- Open Data Economy. Available online: https://www.opendataeconomy.org/ (accessed on 8 July 2024).
- Open Data Inventory Network. Available online: https://odin.opendatawatch.com/ (accessed on 8 July 2024).
- World Bank Group. Readiness Assessment Tool. Available online: https://opendatatoolkit.worldbank.org/en/data/opendatatoolkit/odra (accessed on 8 July 2024).
- World Wide Web Foundation. Open Data Barometer. Available online: https://opendatabarometer.org/ (accessed on 9 July 2024).
- Janssen, M.; Charalabidis, Y.; Zuiderwijk, A. Benefits, Adoption Barriers and Myths of Open Data and Open Government. Inf. Syst. Manag. 2012, 29, 258–268. [Google Scholar] [CrossRef]
- Stuermer, M.; Dapp, M. Measuring the Promise of Open Data: Development of the Impact Monitoring Framework. In Proceedings of the 2016 Conference for E-Democracy and Open Government (CeDEM), Krems, Austria, 18–20 May 2016; pp. 197–203. [Google Scholar] [CrossRef]
- Jetzek, T.; Avital, M.; Bjorn-Andersen, N. The Sustainable Value of Open Government Data. J. Assoc. Inf. Syst. 2019, 20, 702–734. [Google Scholar] [CrossRef]
- Jetzek, T.; Avital, M.; Bjørn-Andersen, N. Generating Value from Open Government Data. In Proceedings of the International Conference on Information Systems, ICIS 2013, Milano, Italy, 15–18 December 2013. [Google Scholar]
- Jetzek, T.; Avital, M.; Bjørn-Andersen, N. Data-Driven Innovation through Open Government Data. J. Theor. Appl. Electron. Commer. Res. 2014, 9, 100–120. [Google Scholar] [CrossRef]
- Donker, F.; van Loenen, B. How to assess the success of the open data ecosystem? Int. J. Digit. Earth 2016, 10, 284–306. [Google Scholar] [CrossRef]
- Kao, H. Societal, Economic, Political and Environmental: A Review of Benchmarks and AI-assisted Systematic Literature Review of Impact of Open Government Data. In Proceedings of the 25th Annual International Conference on Digital Government Research, dg.o ’24, Taipei, Taiwan, 11–14 June 2024; pp. 574–593. [Google Scholar] [CrossRef]
- Dawes, S.; Vidiasova, L.; Trutnev, D. Approaches to assessing open government data programs: Comparison of common traits and differences at global context. In Proceedings of the 2015 2nd International Conference on Electronic Governance and Open Society: Challenges in Eurasia, EGOSE ’15, St. Petersburg, Russia, 24–25 November 2015; pp. 24–28. [Google Scholar] [CrossRef]
- Zheng, L.; Kwok, W.; Aquaro, V.; Qi, X.; Lyu, W. Evaluating global open government data: Methods and status. In Proceedings of the 13th International Conference on Theory and Practice of Electronic Governance, ICEGOV ’20, Athens, Greece, 23–25 September 2020; pp. 381–391. [Google Scholar] [CrossRef]
- Kawashita, I.M.; Baptista, A.A.; Soares, D.S. An Assessment of Open Government Data Benchmark Instruments. In Proceedings of the IFIP WG 8.5 International Conference EGOV-CeDEM-ePart, Linkoping, Sweden, 31 August–2 September 2020; pp. 29–40. [Google Scholar]
- Osorio-Sanabria, M.; Brito-Carvajal, J.; Astudillo, H.; Amaya-Fernàndez, F.; Gonzalez-Zabala, M. Evaluating Open Government Data Programs: A Systematic Mapping Study. In Proceedings of the 2020 Seventh International Conference on eDemocracy & eGovernment, ICEDEG, Buenos Aires, Argentina, 22–24 April 2020; pp. 157–164. [Google Scholar] [CrossRef]
- Ferencek, A. Impact assessment of open government data. In Proceedings of the 34th Bled eConference Digital Support from Crisis to Progressive Change, Bled, Slovenia, 27–30 June 2021; pp. 783–791. [Google Scholar] [CrossRef]
- Afful-Dadzie, E.; Afful-Dadzie, A. Liberation of public data: Exploring central themes in open government data and freedom of information research. Int. J. Inf. Manag. 2017, 37, 664–672. [Google Scholar] [CrossRef]
- Bilkova, R.; Machova, R.; Lnenicka, M. Evaluating the Impact of Open Data Using Partial Least Squares Structural Equation Modeling. Sci. Pap. Univ. Pardubic. Ser. D 2015, 22, 29–41. [Google Scholar]
- Machova, R.; Lnenicka, M. Modelling E-Government Development through the Years Using Cluster Analysis. JeDEM 2016, 8, 62–83. [Google Scholar] [CrossRef]
- Yerden, X.; Luna-Reyes, L. Promoting Government Impacts through Open Data: Key Influential Factors. In Proceedings of the 22nd Annual International Conference on Digital Government Research, dg.o ’21, Omaha, NE, USA, 9–11 June 2021; pp. 180–188. [Google Scholar] [CrossRef]
- Buteau, S.; Rao, P.; Mehta, A.; Kadirvell, V. Developing a Framework to Assess Socio-Economic Value of Open Data in India. In Proceedings of the 14th International Symposium on Open Collaboration, OpenSym ’18, Paris, France, 22–24 August 2018; pp. 1–6. [Google Scholar] [CrossRef]
- Viscusi, G.; Castelli, M.; Batini, C. Assessing Social Value in Open Data Initiatives: A Framework. Future Internet 2014, 6, 498–517. [Google Scholar] [CrossRef]
- dos Santos Brito, K.; da Silva Costa, M.; Cardoso Garcia, V.; de Lemos Meira, S. Assessing the benefits of open government data: The case of Meu Congresso Nacional in Brazilian elections 2014. In Proceedings of the 16th Annual International Conference on Digital Government Research, dg.o ’15, Phoenix, AZ, USA, 27–30 May 2015; pp. 89–96. [Google Scholar] [CrossRef]
- Tinati, R.; Carr, L.; Halford, S.; Pope, C. Exploring the impact of adopting open data in the UK government. In Proceedings of the Digital Futures 2012, Aberdeen, UK, 23–25 October 2012; p. 3. [Google Scholar]
- Meng, A. Investigating the Roots of Open Data’s Social Impact. JeDEM 2014, 6, 1–13. [Google Scholar] [CrossRef]
- Silva, P.N.; Pinheiro, M.M.K. DGABr: Metric for Evaluating Brazilian Open Government Data. Inf. Soc. 2018, 28, 225–243. [Google Scholar] [CrossRef]
- Vracic, T.; Varga, M.; Curko, K. Effects and evaluation of open government data initiative in Croatia. In Proceedings of the 2016 39th International Convention on Information and Communication Technology, Electronics and Microelectronics, MIPRO, Opatija, Croatia, 30 May–3 June 2016; pp. 1521–1526. [Google Scholar] [CrossRef]
- Silva, P.N.; Pinheiro, M.M.K. Metricas para Dados Governamentais Abertos. In Proceedings of the Encontro Nacional De Pesquisa Em Ciência Da Informação, ENANCIB, Sao Paulo, Brasil, 22–26 October 2018; pp. 314–332. [Google Scholar] [CrossRef]
- Wilson, B.; Cong, C. Beyond the supply side: Use and impact of municipal open data in the U.S. Telemat. Inform. 2021, 58, 101526. [Google Scholar] [CrossRef]
- Collobert, R.; Weston, J.; Bottou, L.; Karlen, M.; Kavukcuoglu, K.; Kuksa, P. Natural Language Processing (Almost) from Scratch. J. Mach. Learn. 2011, 12, 2493–2537. [Google Scholar] [CrossRef]
- Hevner, A.; March, S.; Park, J.; Ram, S. Design Science in Information Systems Research. MIS Q. 2004, 28, 75–105. [Google Scholar] [CrossRef]
- Azevedo, A.; Santos, M. KDD, SEMMA and CRISP-DM: A parallel overview. In Proceedings of the IADIS European Conference on Data Mining, Amsterdam, The Netherlands, 24–26 July 2008; pp. 182–185. [Google Scholar]
- Nickerson, R.; Varshney, U.; Muntermann, J. A method for taxonomy development and its application in information systems. Eur. J. Inf. Syst. 2013, 22, 336–359. [Google Scholar] [CrossRef]
- Miner, G.D.; Elder, J.F.; Nisbet, R. Practical Text Mining and Statistical Analysis for Non-structured Text Data Applications, 1st ed.; Academic Press: New York, NY USA, 2012. [Google Scholar]
- Textract. Available online: https://textract.readthedocs.io/en/stable/ (accessed on 24 September 2024).
- Bird, S.; Loper, E.; Klein, E. Natural Language Processing with Python: Analyzing Text with the Natural Language Toolkit, 1st ed.; O’Reilly Media: Sebastopol, CA, USA, 2009. [Google Scholar]
- Barde, B.V.; Bainwad, A.M. An overview of topic modeling methods and tools. In Proceedings of the 2017 International Conference on Intelligent Computing and Control Systems (ICICCS), Madurai, India, 15–16 June 2017; pp. 745–750. [Google Scholar] [CrossRef]
- OpenAI. ChatGPT. Available online: https://openai.com/chatgpt (accessed on 5 March 2024).
- Lund, B.; Wang, T. Chatting about ChatGPT: How may AI and GPT impact academia and libraries? Libr. Hi Tech News 2023, 40, 26–29. [Google Scholar] [CrossRef]
- Roumeliotis, K.I.; Tselikas, N.D. ChatGPT and Open-AI Models: A Preliminary Review. Future Internet 2023, 15, 192. [Google Scholar] [CrossRef]
- Vaswani, A.; Shazeer, N.M.; Parmar, N.; Uszkoreit, J.; Jones, L.; Gomez, A.N.; Kaiser, L.; Polosukhin, I. Attention is All you Need. In Proceedings of the 31st International Conference on Neural Information Processing Systems (NIPS’17), Long Beach, CA, USA, 4–9 December 2017; pp. 6000–6010. [Google Scholar]
- Ambartsoumian, A.; Popowich, F. Self-attention: A better building block for sentiment analysis neural network classifiers. In Proceedings of the 9th Workshop on Computational Approaches to Subjectivity, Sentiment and Social Media Analysis, Brussels, Belgium, 31 October 2018; pp. 130–139. [Google Scholar]
- Bahdanau, D.; Cho, K.; Bengio, Y. Neural Machine Translation by Jointly Learning to Align and Translate. In Proceedings of the 3rd International Conference on Learning Representations (ICLR 2015), San Diego, CA, USA, 7–9 May 2015. [Google Scholar] [CrossRef]
- OpenAI. API Reference Introduction. Available online: https://platform.openai.com/docs/api-reference/introduction (accessed on 5 March 2024).
- Lee, D.D.; Seung, H.S. Learning the parts of objects by non-negative matrix factorization. Nature 1999, 401, 788–791. [Google Scholar] [CrossRef]
- Carbonetto, P.; Sarkar, A.K.; Wang, Z.; Stephens, M. Non-negative matrix factorization algorithms greatly improve topic model fits. arXiv 2021, arXiv:2105.13440. [Google Scholar] [CrossRef]
- Purpura, A. Non-negative Matrix Factorization for Topic Modeling. In Proceedings of the Biennial Conference on Design of Experimental Search & Information Retrieval Systems, Bertinoro, Italy, 28–31 August 2018. [Google Scholar]
- Blei, D.M.; Ng, A.Y.; Jordan, M.I. Latent dirichlet allocation. J. Mach. Learn. Res. 2003, 3, 993–1022. [Google Scholar]
- Ostrowski, D. Using latent dirichlet allocation for topic modelling in twitter. In Proceedings of the 2015 IEEE 9th International Conference on Semantic Computing, Anaheim, CA, USA, 7–9 February 2015; pp. 493–497. [Google Scholar] [CrossRef]
- Christy, A.; Praveena, A.; Shabu, J. A Hybrid Model for Topic Modeling Using Latent Dirichlet Allocation and Feature Selection Method. J. Comput. Theor. Nanosci. 2019, 16, 3367–3371. [Google Scholar] [CrossRef]
- Muchene, L.; Safari, W. Two-stage topic modelling of scientific publications: A case study of University of Nairobi, Kenya. PLoS ONE 2021, 16, e0243208. [Google Scholar] [CrossRef]
- Teh, Y.; Jordan, M.; Beal, M.; Blei, D. Hierarchical Dirichlet processes. J. Am. Stat. Assoc. 2006, 101, 1566–1581. [Google Scholar] [CrossRef]
- Zhang, M.; He, T.; Li, F.; Peng, L. Incorporating Hierarchical Dirichlet Process into Tag Topic Model. Chin. Lex. Semant. 2013, 8229, 368–377. [Google Scholar] [CrossRef]
- Dai, A.; Storkey, A. The Supervised Hierarchical Dirichlet Process. IEEE Trans. Pattern Anal. Mach. Intell. 2015, 37, 243–255. [Google Scholar] [CrossRef]
- Fan, W.; Bouguila, N. Online Data Clustering Using Variational Learning of a Hierarchical Dirichlet Process Mixture of Dirichlet Distributions. In Proceedings of the 19th International Conference, DASFAA 2014, International Workshops: BDMA, DaMEN, SIM3, UnCrowd, Bali, Indonesia, 21–24 April 2014; pp. 18–32. [Google Scholar] [CrossRef]
- Deerwester, S.; Dumais, S.T.; Furnas, G.W.; Landauer, T.K.; Harshman, R. Indexing by latent semantic analysis. J. Am. Soc. Inf. Sci. 1990, 41, 391–407. [Google Scholar] [CrossRef]
- Valdez, D.; Pickett, A.C.; Goodson, P. Topic Modeling: Latent Semantic Analysis for the Social Sciences. Soc. Sci. Q. 2018, 99, 1665–1679. [Google Scholar] [CrossRef]
- Gupta, I.; Chatterjee, I.; Gupta, N. Latent Semantic Analysis based Real-world Application of Topic Modeling: A Review Study. In Proceedings of the 2022 Second International Conference on Artificial Intelligence and Smart Energy (ICAIS), Coimbatore, India, 23–25 February 2022; pp. 1142–1149. [Google Scholar] [CrossRef]
- Alghamdi, R.; Alfalqi, K. A Survey of Topic Modeling in Text Mining. Int. J. Adv. Comput. Sci. Appl. 2015, 6, 147–153. [Google Scholar] [CrossRef]
- Glass, R.; Vessey, I. Contemporary application-domain taxonomies. IEEE Softw. 1995, 12, 63–76. [Google Scholar]
- Miller, J.; Roth, A. A taxonomy of manufacturing strategies. Manag. Sci. 1994, 40, 285–304. [Google Scholar]
- Bailey, K. Typologies and Taxonomies—An Introduction to Classification Techniques; Sage: Thousand Oaks, CA, USA, 1994. [Google Scholar]
- Devlin, J.; Chang, M.; Lee, K.; Toutanova, K. BERT: Pre-training of Deep Bidirectional Transformers for Language Understanding. In Proceedings of the North American Chapter of the Association for Computational Linguistics: Human Language Technologies, Minneapolis, MN, USA, 2–7 June 2019; Volume 1, pp. 4171–4186. [Google Scholar] [CrossRef]
- Gunawan, D.; Sembiring, C.A.; Budiman, M.A. The implementation of cosine similarity to calculate text relevance between two documents. J. Phys. Conf. Ser. 2018, 978, 012120. [Google Scholar] [CrossRef]
- Li, B.; Han, L. Distance weighted cosine similarity measure for text classification. In Proceedings of the Intelligent Data Engineering and Automated Learning–IDEAL 2013: 14th International Conference, Hefei, China, 20–23 October 2013; pp. 611–618. [Google Scholar] [CrossRef]
- Muflikhah, L.; Baharudin, B. Document clustering using concept space and cosine similarity measurement. In Proceedings of the 2009 International Conference on Computer Technology and Development, Kota Kinabalu, Malaysia, 13–15 November 2009; Volume 1, pp. 58–62. [Google Scholar] [CrossRef]
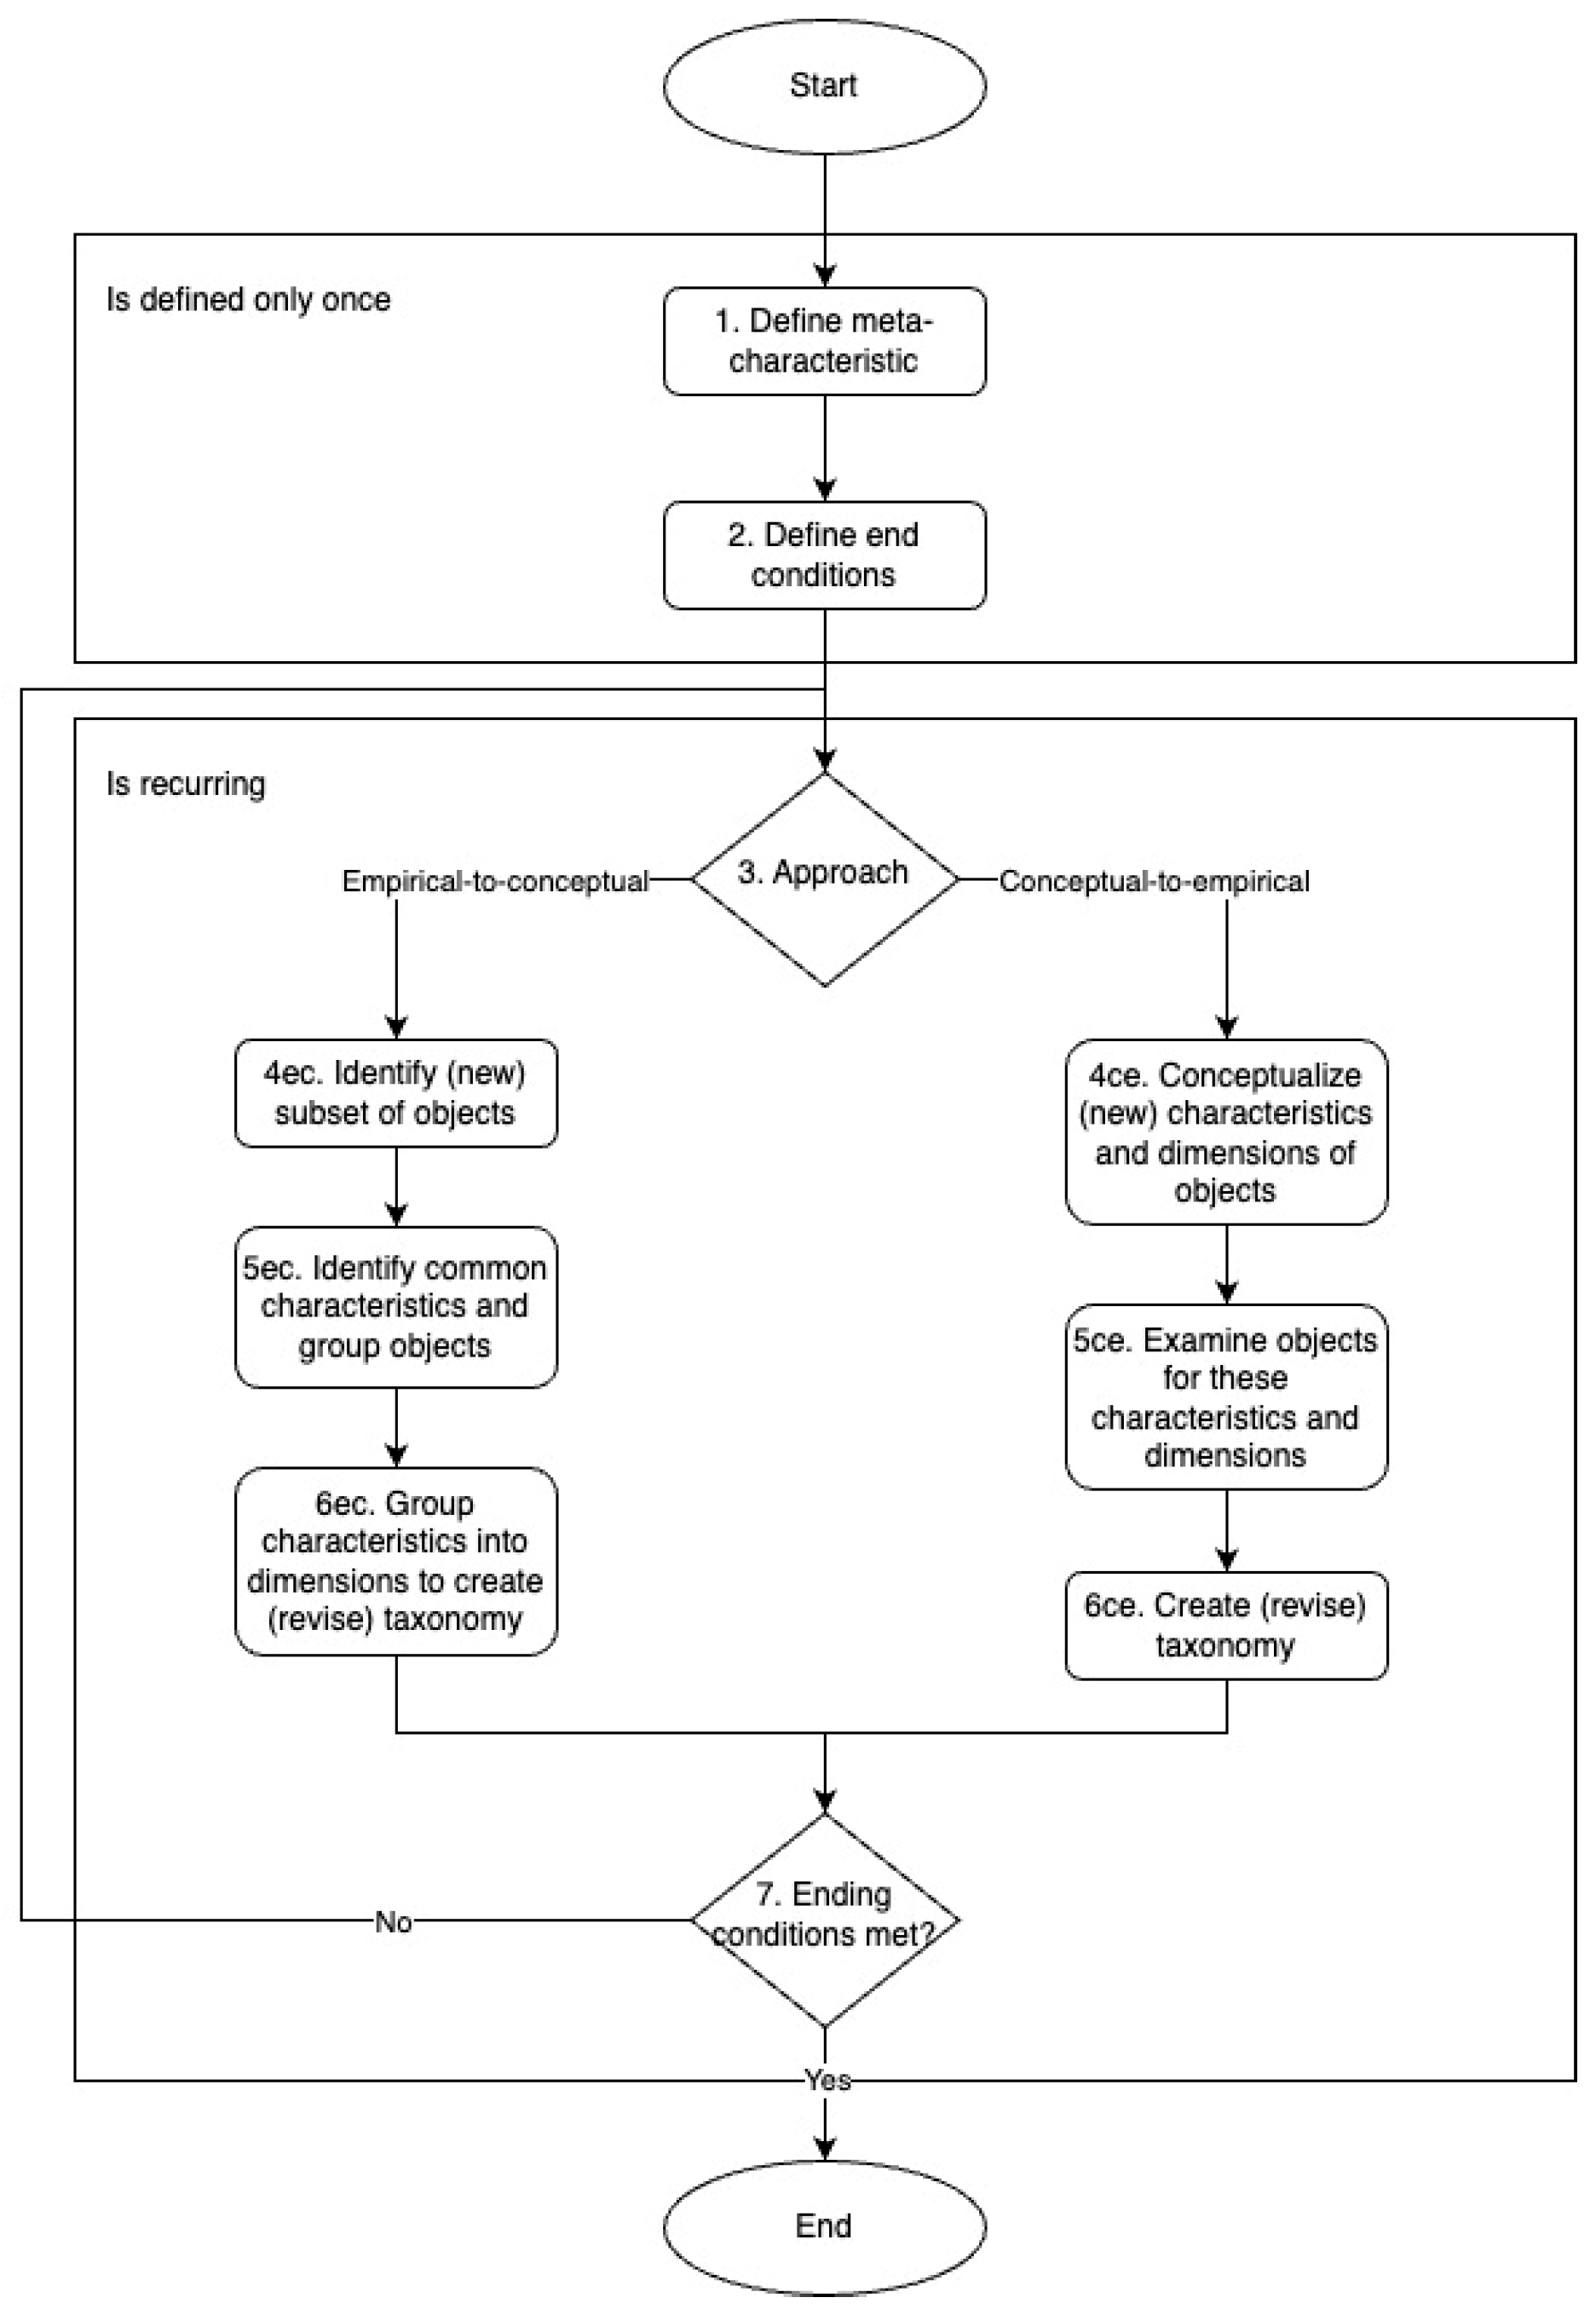
Disclaimer/Publisher’s Note: The statements, opinions and data contained in all publications are solely those of the individual author(s) and contributor(s) and not of MDPI and/or the editor(s). MDPI and/or the editor(s) disclaim responsibility for any injury to people or property resulting from any ideas, methods, instructions or products referred to in the content. |
© 2025 by the authors. Licensee MDPI, Basel, Switzerland. This article is an open access article distributed under the terms and conditions of the Creative Commons Attribution (CC BY) license (https://creativecommons.org/licenses/by/4.0/).