Abstract
With the increasing integration of digital technology in supply chains, manufacturers and suppliers are initiating complementary innovations in digital technology. Such digital technology complementary innovations (DTCIs) amplify synergistic effects, fostering cross-domain innovation. This raises significant inquiries about how firms undertake DTCI. In this study, we model a supply chain consisting of a buyer, a new supplier, and an existing supplier, exploring the impacts of the presence of mature technology and varying leadership relations on supply chain collaboration patterns. Our findings highlight several key insights: firstly, for the new supplier, their highest level of effort in DTCI is observed when they play a follower role, and yet attaining a leadership position results in heightened profits. Intriguingly, for the buyer, their position as a leader or follower does not impact their DTCI effort level, and they exhibit a preference for a leadership stance. Secondly, when the existing supplier possesses lower bargaining power, the buyer is inclined towards collaborating with them, anticipating higher profits. Under these circumstances, the new supplier’s DTCI effort level is diminished. Thirdly, the probability of DTCI success and the magnitude of digital technology complementarity between parties positively influence the DTCI effort levels of both the buyer and the new supplier but negatively impact the existing supplier.
1. Introduction
With the rapid advancement of digital technologies such as artificial intelligence, blockchain, big data, and cloud computing, firms are increasingly engaging in digital technology complementary innovation (DTCI). Unlike conventional technologies, digital technologies possess strong integrative and scalable capacities, enabling firms to collaborate across platforms and systems to develop novel products and services [1,2]. DTCI refers to the collaboration where enterprises with divergent resource strengths (technological, product-based, or knowledge-based) access digital technology systems or platforms via application programming interfaces (e.g., APIs) to collectively cultivate novel products and services [3,4]. From a supply chain perspective, manufacturers and retailers (buyers) often partner with new suppliers to leverage technological complementarity. These collaborations create synergistic effects that enhance innovation capabilities and competitiveness. For example, Xiaomi’s alliance with TCL in 2017 allowed it to enter the smart TV market, leading to industry leadership by 2019 [5], while Huawei’s partnership with Chint in 2021 accelerated digital energy solutions [6].
In the process of executing DTCI, both the buyer and the new supplier consistently invest significant efforts and funds in aspects such as development, testing, and capacity expansion. Moreover, the leadership relationship changes between the two parties and the influence of mature technology on DTCI necessitate careful consideration. On one hand, traditional supply chains feature a dominant leader, but in DTCI, leadership roles are more dynamic. The buyer or the new supplier may take the lead, impacting investment decisions and strategic outcomes. For instance, Huawei’s Matebook D(X) operates under Linux’s innovation framework, while Microsoft Surface retains full autonomy over its proprietary system. Leadership changes can also introduce risks, as seen in Nokia’s partnership with Microsoft, where misaligned innovation strategies led to Nokia’s decline [7]. Conversely, GE successfully managed leadership shifts in digital energy collaborations, achieving sustained innovation.
On the other hand, the presence of mature technology (provided by existing suppliers) available to the buyer stands as a pivotal element influencing both parties’ DTCI decisions. A survey conducted by Couchbase in the United States revealed that of the 450 enterprises surveyed, a mere 18% of the respondents expressed ‘high confidence’ in achieving their objectives. In contrast, a staggering 84% voiced concerns about potential adverse outcomes, leading many enterprises to gravitate towards established technology over pioneering digital innovations. Generally, mature technology offers stable technical backing, albeit possibly at reduced profits or performance margins [8]. Should DTCI fail to yield successful deliverables, the buyer has the option to persist with mature technology for production, negating the need for significant product redesigns.
At the theoretical research level, scholars have paid significant attention to complementary innovation and supply chain leadership independently. For instance, studies on complementary innovation predominantly focus on licensing cooperation equilibriums under its model [9], contract design [10], and resource allocation issues. The literature on supply chain leadership mainly explores aspects such as decision pricing [11,12] and non-price factors like value co-creation [13] and corporate social responsibility [14]. Some works also delve into the implications of varied leadership relationships on channel profit decisions [15] and supply chain performance [16]. However, these studies do not consider the ramifications introduced by the coexistence of complementary innovation and mature technology.
In summary, we explore how the buyer and the new supplier undertake DTCI in the presence of mature technology and under different leadership. Grounded in the aforementioned practical context and theoretical gaps, this paper aims to address the following three questions:
- How do leadership relationship changes influence the decisions of the buyer, the new supplier, and the existing supplier?
- What impact does the presence of mature technology have on the decisions of the buyer and the new supplier?
- How does the probability of DTCI success influence the decisions of the buyer, the new supplier, and the existing supplier?
2. Theoretical Foundation and Literature Review
2.1. Theoretical Foundation
This section integrates Schumpeter’s Innovation Theory, Diffusion of Innovation Theory, Supply Chain Theory, and Transaction Cost Economics to establish the theoretical foundation of this study.
Schumpeter’s Innovation Theory posits that economic growth is propelled by the process of “creative destruction,” wherein new technologies continuously disrupt existing market structures, thereby engendering novel forms of industrial organization and competitive advantage [17]. In the context of DTCI, digital technology functions as a catalyst for continuous innovation cycles, enabling firms to either replace or enhance their existing technological capabilities through digital platforms and ecosystems. Digital complementary innovation aligns with Schumpeter’s theory in two distinct ways: first, through disruptive innovation, where firms integrate advanced digital technologies such as artificial intelligence, blockchain, and the Internet of Things to fundamentally alter traditional business models [18,19]; and second, through incremental innovation, where firms gradually refine existing technologies while co-evolving with their supply chain partners [20]. This dual alignment underscores the transformative potential of digital technology in fostering both radical and evolutionary innovations within supply chains.
Similarly, the Diffusion of Innovation Theory provides a framework for understanding how new technologies propagate across organizations and industries, influenced by factors such as relative advantage, compatibility, complexity, trialability, and observability [21,22]. This theory is particularly germane to DTCI, as firms must navigate the decision to adopt emerging digital technologies or rely on mature technological solutions provided by existing suppliers. Early adopters of DTCI, exemplified by technology firms investing in blockchain-enabled supply chains, exhibit a high degree of risk tolerance and a propensity for innovation, thereby accelerating technological diffusion [23]. Conversely, late adopters—often constrained by transaction costs and uncertainty—tend to defer to existing technological solutions until market validation confirms the feasibility of digital technology investments [24,25]. Thus, DOI elucidates why firms adopt divergent strategies in balancing new technology adoption and reliance on mature technology within supply chain collaborations.
From a supply chain perspective, Supply Chain Theory emphasizes that supply chain structures, power asymmetries, and coordination mechanisms fundamentally influence innovation outcomes [26,27]. Within the DTCI framework, leadership dynamics significantly affect technology investments, knowledge-sharing efficiency, and bargaining power among supply chain participants. In buyer-led supply chains, dominant buyers such as Apple and Tesla exert substantial control over innovation by dictating technological standards and compelling suppliers to align with their digital transformation strategies. In contrast, supplier-led supply chains, prevalent in technology-intensive industries such as that of semiconductors, enable suppliers like Intel and TSMC to drive innovation while buyers adjust their production and investment strategies accordingly. In some cases, collaborative leadership models emerge, where buyers and suppliers jointly engage in co-innovation, as observed in cloud-based IoT platforms [28]. Understanding these leadership structures is essential for analyzing how power relationships shape decision-making in DTCI adoption.
Transaction Cost Economics offers an economic rationale for why firms opt for different collaboration structures when engaging in DTCI. Transaction Cost Economics posits that firms evaluate the costs of coordination, information asymmetry, and contractual risks when determining whether to integrate new technologies or rely on mature technological solutions [29]. Firms are inclined to form digital technology partnerships when the transaction costs of in-house development exceed the costs of outsourcing innovation to specialized suppliers [30]. Conversely, mature technology adoption is preferred when the risks of technology failure and investment uncertainty outweigh the potential benefits of radical innovation [31]. By incorporating Transaction Cost Economics into the DTCI discourse, this study provides a structured approach to understanding the economic rationale behind leadership structures and technology decision-making within supply chains.
2.2. Literature Review
2.2.1. Digital Technology and Complementary Innovations
The application of digital technology facilitates swift connections among multiple institutions and stakeholders, bolstering both internal and external collaboration and communication efficiencies for enterprises. This enhancement in operations streamlines business models, escalates user experience and engagement, reduces search costs continuously, and improves efficiency. Pioneering scholars, by summarizing the literature on enterprise digital innovation, have identified three pivotal characteristics of digital technology influencing enterprise innovation: Openness, Affordance, and Generativity. They emphasize that focusing on these three digital technology features ensures the central role of digital technology, linking analyses of different disciplines and levels and integrating digital technology research across various fields [32,33]. Research on complementary innovation predominantly zeroes in on its essence and unfolds in terms of vertical and horizontal collaboration models [34]. Complementary technological innovation is primarily manifested as a replacement with new technology of existing or old technology. This complementarity is not only evident in the lateral complementarity between different sub-modules of the same generation technology but also in the vertical complementarity between different generation technologies [35,36]. Primarily, since the end products of these industries comprise numerous complementary subsystems, these subsystems exist in a modular fashion during the production process, essentially serving as carriers for complementary knowledge [37]. Furthermore, complementary innovation exhibits a pronounced cumulative innovation characteristic [38]. In software developed based on digital technology, significant technological innovations typically forge an upstream and downstream ‘innovation chain’. Such innovations are built upon previous innovations and those of others, representing more of an upgrade of existing technological knowledge.
2.2.2. Leadership Relations in the Supply Chain
Although firms within a supply chain are interdependent and collaborate for mutual benefit, their relationships are often asymmetrical. Supply chains frequently feature channel leaders or core enterprises that exert significant influence over other entities in the chain [39,40]. These dominant enterprises possess substantial decision-making power, allowing them to leverage their advantages, set industry standards, and dictate strategic directions that have long-term implications for supply chain efficiency [41,42,43]. Scholarly research on leadership relations in supply chains primarily focuses on multi-party games, leadership asymmetry, and leader–follower adaptive behaviors. Within game-theoretic frameworks, common leadership structures include single-leader and dual-leader supply chains, typically analyzed in terms of decision sequencing and strategic control [44,45]. Leadership asymmetry, arising from imbalances in upstream–downstream relationships, often results in power disparities, which can either strengthen supply chain coordination or lead to conflict and instability [46,47]. In particular, power struggles between dominant firms can disrupt supply chain alliances and innovation collaborations. In the context of leader–follower adaptive behaviors, prior studies suggest that power asymmetry significantly influences firms’ strategic adjustments. Firms with weaker bargaining power tend to exhibit higher levels of adaptive behavior, adjusting their investment strategies, pricing, and technological choices to align with dominant partners [48]. When power disparities are minimal, both parties demonstrate similar adaptive behaviors, which increase as their overall power grows.
The analysis of leadership structures is critical for understanding how power dynamics influence innovation and decision-making processes. Power asymmetry plays a significant role in the adoption and diffusion of new technologies, as dominant firms can dictate technological standards and shape innovation trajectories across the supply chain [49]. In buyer-led supply chains, large buyers such as Apple and Tesla exert substantial control over technological innovation, compelling suppliers to align with their digital transformation strategies and design specifications [50,51]. Conversely, in supplier-led supply chains, leading technology providers such as Intel and TSMC drive technological advancements, requiring buyers to adjust their strategies to integrate supplier-driven innovations [52,53]. These dynamics highlight the critical role of leadership models in shaping the efficiency and effectiveness of innovation initiatives. However, recent research has increasingly highlighted alternative and more nuanced leadership structures, such as collaborative and dynamic leadership, within supply chains. Collaborative leadership, which is characterized by joint decision-making, shared governance, and mutual accountability among supply chain partners, has been recognized as effective in enhancing trust [54,55,56]. Collaborative supply chain arrangements encourage firms to jointly share both the risks and rewards associated with innovation projects, thereby enhancing resilience and adaptability in response to market uncertainties [57,58]. Additionally, dynamic leadership structures, where leadership roles shift flexibly in response to contextual factors such as evolving technological capabilities, changing market demands, and competitive pressures, have emerged as realistic models for contemporary supply chain collaboration [59,60,61]. In dynamic leadership scenarios, supply chain members continuously reassess and realign their roles based on situational advantages or strategic objectives, thereby improving responsiveness and facilitating more effective digital transformation.
Decision-making processes within supply chains are influenced by transaction costs, information asymmetry, and the risks associated with disruptive innovation. Firms must carefully evaluate these factors when deciding whether to adopt new digital technologies or rely on existing solutions [61,62]. From a Transaction Cost Economics perspective, leadership structures impact firms’ decisions to internalize innovation efforts or form strategic partnerships with external suppliers. Recent studies suggest that collaborative leadership models, in which buyers and suppliers jointly engage in co-innovation, can lead to more efficient technology development, improved risk-sharing, and enhanced supply chain resilience [63]. This indicates that a nuanced understanding of leadership relations is essential for analyzing how digital technology and complementary innovations reshape supply chain dynamics.
2.2.3. Literature Summary
From the aforementioned literature review, it is evident that existing research has delved into leadership and complementary innovation, respectively. However, no studies to date have considered the effects brought about by the presence of complementary innovation and mature technology. Taking into account the research objectives, content, and methodologies, the three studies most relevant to this paper are [8,19,31]. Table 1 provides a comparison between this study and the related literature.

Table 1.
Comparison of this study with the most relevant literature.
3. Methodology and Model Construction
Our model consists of a buyer (B), a new supplier (NS), and an existing supplier (ES). As discussed in the introduction, in a digital supply chain context, the buyer’s decision to collaborate with a new supplier for DTCI is driven by the recognition of the new supplier’s distinct digital technological capabilities. Unlike traditional supplier relationships, DTCI fosters an innovation-driven partnership where the new supplier’s technological expertise complements the buyer’s market reach and strategic objectives. This synergy enables the buyer and the new supplier to engage in complementary innovation, enhancing technological integration and market competitiveness [52,64].
This study adopts a non-cooperative game-theoretic approach to model the decision-making process between supply chain participants. The interactions are structured as a sequential game, where each player, whether a buyer, new supplier, or existing supplier, makes strategic decisions aimed at utility maximization. Following a Stackelberg-type framework, we analyze different leadership scenarios where either the buyer or the new supplier takes the lead, influencing the decision-making sequence and optimization strategies of the other players. By incorporating different leadership structures into the model, we assess how these variations impact supply chain profitability and DTCI investment strategies. Consequently, in this study, we theorize that the collaborative efforts in DTCI between the buyer and the new supplier follow a complementary relationship rather than a purely substitutive one. This implies that while both parties contribute to innovation, their technological advancements reinforce each other rather than replace one another. At the same time, the buyer maintains an ongoing collaboration with the existing supplier, who specializes in cost-efficient improvements related to mature technology. This dual collaboration model creates a dynamic competitive landscape where the buyer must strategically allocate their efforts between fostering innovation with the new supplier and maintaining operational stability with the existing supplier. To explore these strategic interactions, we examine the following three primary leadership scenarios, as depicted in Figure 1.
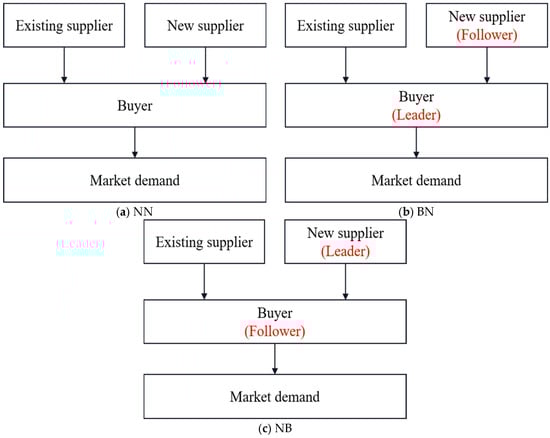
Figure 1.
Illustration of three different scenarios: (a) buyer and new supplier make decisions at same time; (b) buyer as leader; (c) new supplier as leader.
3.1. Model Setup
Drawing from [14,52], we assume that when the buyer and the new supplier engage in DTCI, the incremental market demand takes the Cobb–Douglas form , where is the price of the new product and represents the enhanced digital technology level achieved through collaboration between the new supplier and the buyer. Following the approach in [52], we posit , where is the DTCI effort level determined by the new supplier with an associated cost function , which signifies the degree of digital technology complementarity between the buyer and the new supplier, with . is the DTCI effort level decided by the buyer, with the associated cost function . and represent the impact magnitudes of their interactions, where , . It can easily be derived that , indicating that neither party can fully replace the innovative efforts of the other. In the absence of innovation from one party, the DTCI is doomed to fail. Moreover, the condition implies that an increase in DTCI effort by one party enhances the marginal output of the other. Given this, using the Cobb–Douglas form to represent incremental market demand captures the complementary relationship between the DTCI efforts of the two parties in vertical collaboration. For computational convenience, following the approach of [31], we assume , suggesting that the complementary resources in digital technology from both parties have equal effects.
The existing supplier can continue to improve their mature technology because if the buyer’s DTCI research and development with the new supplier fails, the buyer will maintain cooperation with the existing supplier. After learning about the buyer’s cooperation strategy with the new supplier through their public information, the existing supplier will make additional efforts () to reduce costs on mature technology. Referring to [8], we assume that the cost function of the existing supplier is , that is, the greater the improvement effort , the smaller the cost . We assume that the buyer is aware of the existing supplier’s default unit production cost because the buyer and the existing supplier have previously cooperated, where and .
If the DTCI between the new supplier and the buyer fails, the buyer and the existing supplier will determine the purchase price through bargaining. Let represent the buyer’s relative bargaining power, and represent the bargaining power of the existing supplier. Let and denote the demand and price of the existing product, respectively. Under these conditions, the total profit of the supply chain is . Of this total, is allocated to the existing supplier, and the remaining is allocated to the buyer.
In summary, we present the profit functions for the buyer, the new supplier, and the existing supplier, where denotes the probability of DTCI success.
3.2. Equilibrium Solutions Under Three Scenarios
In the NN scenario, both the buyer and the new supplier concurrently determine their levels of effort towards DTCI, while the existing supplier decides upon the level of effort to improve mature technology. Subsequently, the new supplier sets the wholesale price, and the buyer establishes the retail price.
In the BN model, the buyer engages with the new supplier in DTCI, with the buyer acting as the leader in DTCI and the new supplier as the follower. An example of this dynamic is seen in 2020 when Huawei entered the smart car industry, announced their three major HarmonyOS car systems, and revealed new partnerships based on innovation with HarmonyOS. The decision sequence under the BN scenario is as follows: the buyer first determines the level of effort for DTCI, followed by the new supplier’s decision on their DTCI effort level and the existing supplier’s effort to improve mature technology, and finally, the new supplier decides on the wholesale price while the buyer sets the retail price.
In the NB model, the buyer and new supplier collaborate on DTCI, with the new supplier taking the lead and the buyer following. For instance, in June 2021, EXOR International established an end-to-end smart factory leveraging Intel’s digital technology. This smart factory utilized a vast array of Intel products, including Intel Atom processors, Intel FPGAs, Intel Edge Controls for industrial software, and Intel Edge Insights for industrial software. Intel’s software innovations were instrumental in guiding the innovative direction of the smart factory. The decision sequence in the NB scenario is as follows: The new supplier first decides on their DTCI effort level, then the buyer determines its DTCI effort level, followed by the existing supplier’s decision on the effort to improve mature technology. Finally, the new supplier sets the wholesale price, with the buyer deciding on the retail price.
Table 2 shows the equilibrium solutions for the three scenarios.
Table 2.
The equilibrium solution of NN, BN, and NB.
4. Result Analysis
In this section, we will sequentially address the three questions mentioned in the Introduction.
4.1. Propositions of Three Scenarios
To address the first question raised in the introduction regarding the impact of leadership relationship changes on the decisions of the buyer, the new supplier, and the existing supplier, we specifically compare the effort levels (Proposition 1) and pricing decisions (Proposition 2) of these supply chain members. In this section, by comparing the effort levels of the buyer, the new supplier, and the existing supplier across the NN, BN, and NB scenarios, we arrive at Proposition 1, see Appendix A.1.
Proposition 1.
(i) For the new supplier, the effort level for DTCI is highest under the scenario where the buyer is the leader, denoted as .
- (ii)
- For the buyer, the effort level for DTCI remains unaffected by either leadership scenario, denoted as .
- (iii)
- For the existing supplier, the effort level to improve mature technology is the same across all scenarios, denoted as .
Proposition 1 (i) suggests that for the new supplier, the level of effort in DTCI is higher when acting as a follower compared to when leading. This is attributed to the new supplier’s relatively weaker grasp on market positioning and future development directions compared to the buyer [8], which would exacerbate the uncertainty of DTCI success under the new supplier’s leadership. Moreover, from the equilibrium solutions (e.g., and ), it is evident that the new supplier’s effort level in DTCI is more sensitive to the probability of success ( and ) than the buyer’s. Hence, the new supplier exerts a higher level of effort in DTCI when the buyer leads. Interestingly, whether the buyer or the new supplier leads has no impact on the buyer’s effort level in DTCI. This is because the buyer, with their established and stable technology through their existing supplier relationships, primarily aims to explore new markets and possibilities with DTCI. Whichever party leads, this represents an opportunity for the buyer to experiment with DTCI efforts. Furthermore, the buyer can always revert to the existing mature technology if the DTCI with the new supplier does not succeed. For example, although Apple’s innovation attempt with GTAT to produce sapphire screens failed, they continued to cooperate with their existing supplier, Corning, to produce regular screens for their iPhones (as opposed to sapphire screens) [8]. As for the existing supplier, having already established production scales and supply chain systems enables them to achieve certain economies of scale. In this context, to reduce production costs further, they would need a significant investment or transformation, which may not be desirable for them. Additionally, as traditional products have been on the market for a considerable time and competition among suppliers is relatively fierce, it is challenging to gain a significant advantage through price competition; thus, the effort levels among existing suppliers tend to remain consistent.
As illustrated in Figure 2a,b, the effort levels of both the NS and the ES exhibit an increasing trend as technological complementarity rises. This increase is observed not only for the NS but also for the buyer, as both parties recognize the potential value of DTCI. Higher levels of complementarity enhance the synergy between their technological capabilities, leading to the development of more competitive products and services, improving market appeal, and ultimately expanding market share. This mutual benefit motivates both the buyer and the NS to intensify their efforts in DTCI, fostering greater collaboration and innovation investment. It is essential to emphasize that these figures are not derived from empirical statistical data but are the results of numerical simulations based on equilibrium conditions. The values presented are computed by solving the equilibrium strategies within our game-theoretic model, capturing the strategic decision-making process of supply chain participants under different leadership structures. The shaded regions in the figures highlight the divergence in effort levels between the BN and NB scenarios, illustrating the significant role of leadership structure in shaping innovation incentives. Since this study is rooted in a game-theoretic framework, all figures represent numerical analysis outcomes obtained by solving equilibrium conditions rather than relying on empirical estimations.
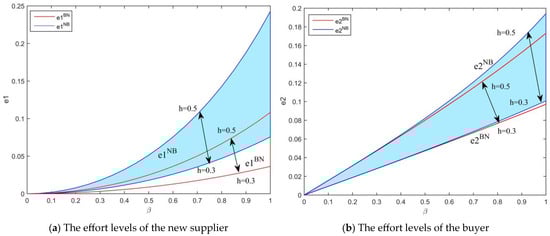
Figure 2.
The impact of complementarity on the effort levels of the new supplier and buyer: (a) the effort levels of the new supplier and (b) the effort levels of the buyer. Notes: ; ;
Furthermore, complementary innovation opens new opportunities for both the buyer and the new supplier, encouraging them to actively participate in innovative activities. These opportunities may include developing new products, expanding into new market domains, and responding more effectively to evolving consumer demands. As technological complementarity increases, the market demand for innovative products and services also rises, further incentivizing both the buyer and the new supplier to allocate more resources towards innovation. Additionally, as the probability of DTCI success grows, both parties are likely to increase their effort levels, aiming to maximize their competitive advantages. To reinforce the robustness of our findings, we conducted an extensive sensitivity analysis on the probability of DTCI success and technological complementarity, as presented in Section 6. These additional analyses confirm that the observed trends remain consistent and theoretically valid across varying model parameters, further strengthening the reliability and applicability of our results.
Lemma 1.
In all three scenarios, the buyer’s effort level is greater than that of the new supplier’s innovation effort, i.e., .
Lemma 1 examines the game situation of DTCI effort levels between the buyer and new supplier under three different scenarios. Through equilibrium analysis, it was found that the effort level of the new supplier in DTCI is generally lower than that of the buyer for several reasons. First, the buyer is usually closer to the market and end customers compared to the new suppliers. Due to this advantageous market position, the buyer can grasp market dynamics and customer needs more directly and accurately, thus showing greater initiative and higher effort levels in the DTCI process to develop products or services that better meet market demands. Secondly, according to the analysis of Proposition 1, the effort level of new suppliers in DTCI is quite sensitive and is especially reactive to changes in the complementarity of digital technology and the probability of DTCI success. The innovation success of a new supplier relies more on the synergy between technology and overall market acceptance. At the same time, due to the possible lack of a mature and stable technological foundation, the new supplier faces relatively greater risks and uncertainties in the DTCI process. Finally, compared to the new supplier, the buyer often has a more mature and stable technological foundation (steady cooperation with existing supplier), which allows them to maintain market competitiveness even if they encounter failure in the DTCI process. This relatively stable technological base also makes the buyer more willing to take risks and make efforts in the DTCI process.
Proposition 2.
In terms of optimal pricing, when the buyer acts as the leader, the pricing for both parties is higher than in the other two scenarios, that is , .
In terms of optimal pricing, for the new supplier, the level of effort in complementary innovation is higher in the BN scenario; therefore, their decision will involve higher wholesale prices than in the other two scenarios. This implies that when a new supplier enters the market, they are more motivated to offer innovative products with high complementarity, as this allows them to realize higher wholesale prices. For the buyer, since the new supplier sets a higher wholesale price, to ensure profit, the buyer is also compelled to set a higher retail price. This is because the buyer needs to ensure their retail price is higher than the cost of purchasing the products to obtain a profit. Therefore, the pricing strategy of new suppliers directly affects the retail pricing strategy of buyers.
Additionally, according to Figure 3, we can observe that the pricing of both the new supplier and the buyer increases with increases in complementarity. This is because as the digital technology complementarity between the two parties increases, the market appeal and potential profits also increase. This may attract more participants, including new suppliers and buyers, as they wish to share this more attractive market. To enter the market or maintain market share, they may be willing to increase the pricing of products to achieve higher profits. At the same time, as complementarity increases, innovations in DTCI may require more R&D and resource input, which may increase production costs, and thus suppliers may need to increase product prices to compensate for these increased costs. The detailed calculation process can be found in Appendix A.2.
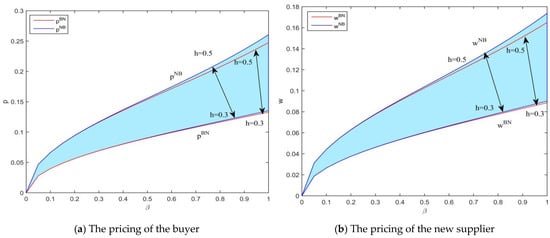
Figure 3.
The impact of complementarity on the pricing of the new supplier and buyer: (a) the pricing of the buyer and (b) the pricing of the new supplier. Notes: ; ;
4.2. Impact of Mature Technology on Decisions of Buyer and New Supplier
In constructing our model, we adopted the approach of [8], choosing to characterize the market influence of mature technology through the bargaining power of the existing supplier. The rationale for this choice is mainly based on the central position of the existing supplier in the market. Specifically, existing suppliers often hold significant market shares in certain technological areas, especially in some mature technology fields. Since their products or technology have been widely accepted and adopted by the market, they possess strong bargaining power. Here, bargaining power is used as an indicator that reflects a supplier’s influence in the market and the market recognition of mature technology. The stronger the bargaining power of the supplier, the more influence in the market’s acceptance of the mature technology they hold. Therefore, in our model, the bargaining power of the existing supplier is taken as an important criterion for assessing the market influence of mature technology. First, lets us explore the impact of the presence of mature technology on a buyer’s decision-making, the detailed calculation process can be found in Appendix A.3.
Proposition 3.
In the NN scenario, when , the buyer’s effort level is higher than that of the existing supplier. In the NB scenario, when , the buyer’s effort level is higher than that of the existing supplier. In the BN scenario, when , the buyer’s effort level is higher than that of the existing supplier, and , where , , .
Due to the setup of our model, the buyer faces the challenge of how to balance and choose between mature technology and new technology, which is also a decision that buyers must make in practice. Proposition 3 indicates that the presence of mature technology will, to a certain extent, influence the buyer’s choices and decisions in cooperative and innovation strategies. According to Proposition 3, when the bargaining power of the existing supplier is strong, the buyer tends to put more effort into developing DTCI with the new supplier, trying to surpass the mature technology and jointly develop more competitive products or services with the new supplier. The buyer’s goal is to surpass the mature technology and develop more competitive products or services with the new supplier. This requires the buyer to be more inclined towards supporting and promoting new technology and innovations in strategy formulation and resource allocation.
Figure 4 illustrates the relationship between bargaining power and technological complementarity under different leadership structures (NN vs. NB). The results confirm Proposition 3, demonstrating how increasing complementarity impacts the bargaining power of the existing supplier and shows the buyer’s preference shift between new and existing technology.

Figure 4.
Relationship between bargaining power and DTCI success probability (buyer’s effort level). Notes: ; ; ; .
As increases, indicating stronger complementarity in digital technology, the bargaining power of the existing supplier declines. This trend is observed in both the NN (red line) and NB (blue line) leadership structures, showing that when complementary innovation becomes more effective, the buyer is more inclined to collaborate with the new supplier, reducing the leverage of the existing supplier.
A key observation from Figure 4 is the non-linear nature of this decline. While bargaining power gradually decreases at lower levels of , there is a noticeable acceleration in the rate of decline as increases beyond a certain point, as highlighted by the zoomed-in inset. This suggests that the transition does not follow a purely linear pattern but exhibits threshold-dependent behavior. Initially, the buyer remains partially reliant on the existing supplier, but as surpasses a critical range, the preference for DTCI strengthens, leading to a more rapid reduction in the existing supplier’s bargaining power. This finding aligns with real-world observations, where firms gradually test and integrate emerging technologies but shift decisively once a critical level of technological complementarity is reached. The difference between the NN and NB structures is relatively small, but in the NB scenario (blue line), the existing supplier’s bargaining power decreases slightly faster, indicating that when the new supplier leads the innovation process, the buyer transitions towards DTCI more aggressively.
Proposition 4.
In the NN scenario, when , the effort level of the new supplier is higher than that of the existing supplier. In the NB scenario, when , the effort level of the new supplier is higher than that of the existing supplier. In the BN scenario, when , the effort level of the new supplier is higher than that of the existing supplier. And , where , , .
Proposition 4 addresses the relationship between the effort levels of the new supplier and existing supplier in different scenarios and the bargaining power of the existing supplier, with a particular focus on the trade-off between the effort level of the new supplier and the bargaining power of the existing supplier. We find that the presence of mature technology has a significant impact on the effort level of the new supplier. The market pressure brought about by mature technology forces the new supplier to work harder and innovate to maintain competitiveness. Under different market structures and statuses, the new supplier needs to adopt different strategies and effort levels to meet the challenges from mature technology. Furthermore, we discover that when the new supplier is in a leading position, there exists a smaller threshold that can make the effort level of the new supplier higher than that of the existing supplier. This is because when new suppliers are in a leading position, they can dominate market trends. However, since mature technology already has a solid market share and customer base, the new supplier needs to invest more in innovation and in improving the quality of their products or services to ensure a competitive advantage over mature technology. The detailed calculation process can be found in Appendix A.4. Figure 5 also confirms the conclusion of Proposition 4.

Figure 5.
Relationship between bargaining power and DTCI success probability (new supplier’s effort level). Notes: ; ; ; .
4.3. Optimal Decision-Making of Buyer and New Supplier
Proposition 5.
(i) Comparing the new demand functions under the three scenarios, the new market demand under the leadership of the new supplier is higher than the other two scenarios, that is, .
- (ii)
- Among the three scenarios, the new supplier prefers the NB scenario, the buyer prefers the BN scenario, and both are preferable to the NN scenario, that is, , .
Proposition 5 (i) compares the new demand functions under the three scenarios and finds that the new market demand under the NB scenario is the highest. Although in the BN scenario the DTCI effort level of the new supplier is the highest, the new supplier also demands a higher wholesale price for this effort level, which leads to the buyer raising their prices; hence, the new market demand under the BN scenario is lower than that under the NB scenario. For example, in 2019, Huawei officially announced its entry into the television industry, and its subsidiary Cool Open launched the Smart Screen. Although the Smart Screen had a significant performance advantage, due to its higher pricing (about 1.7 times that of Xiaomi), its sales were not as high as Xiaomi, which also entered the television industry that year, with Xiaomi’s sales being 30 times that of Huawei’s. Proposition 4 (ii) compares the profit functions of the new supplier and the buyer under the three scenarios. For the new supplier, because the new market demand under the NB scenario is the highest, and the new supplier does not put in more effort (), the new supplier obtains higher profits. For the buyer, in the BN scenario, both the DTCI effort level of the new supplier and the buyer’s market price are the highest, which also drives an increase in the buyer’s profits. Through Figure 6, we find that as the complementarity innovation coefficient increases, the market demand for digital products continues to grow. This is because a higher level of complementarity innovation usually arouses market interest, attracting more customers. This increase in market demand gives new suppliers and buyers more opportunities to sell their products and services, thereby increasing their profits. The detailed calculation process can be found in Appendix A.5.
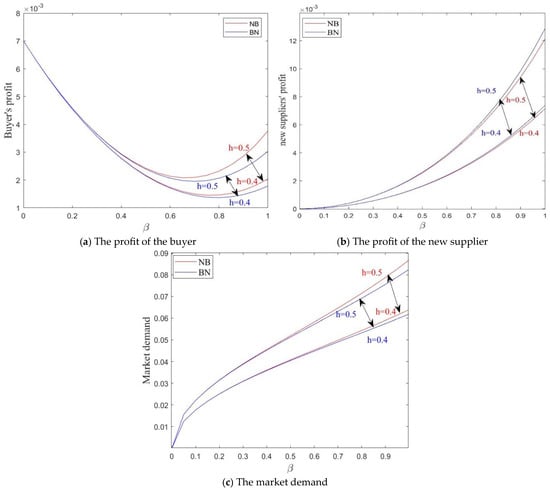
Figure 6.
The impact of complementarity on demand and profit: (a) the profit of the buyer; (b) the profit of the new supplier; (c) the market demand. Notes: ; ; ; .
5. Model Extension
In this section, we explore the scenario where the buyer can vertically integrate with the new supplier for internal DTCI development. In particular, we examine the interactions between this ‘partially integrated’ firm (i.e., the buyer and the new supplier) and the existing supplier and compare it to decisions under different leadership relationships. From a theoretical perspective, vertical integration can be explained through the Resource-Based View (RBV), which argues that firms achieve a sustained competitive advantage by controlling valuable, rare, inimitable, and non-substitutable (VRIN) resources. In this context, the buyer’s decision to integrate the new supplier is driven by the need to secure technological capabilities that serve as a foundation for complementary innovation. Unlike arms-length transactions with independent suppliers, vertical integration allows the firm to internalize critical knowledge flows, reduce the risks of technology leakage, and create synergies that enhance the efficiency of innovation investments. RBV also suggests that resource immobility, the idea that certain strategic resources cannot be easily traded or transferred, further justifies integration. When complementary innovation efforts require the deep integration of specialized knowledge, merely contracting with an external supplier may not be sufficient. By acquiring the new supplier, the buyer ensures direct access to its technological assets, aligns incentives for innovation, and eliminates potential opportunistic behaviors that may arise in a loosely coupled supplier relationship. This results in a higher level of investment in complementary innovation compared to non-integrated settings.
We denote this with the superscript PI, and the profit function in this case is as follows.
We obtained the following results: , , , , , , where .
Through the analysis of the PI, NN, BN, and NB scenarios, we formulate Proposition 6.
Proposition 6.
(i) In terms of the level of complementary innovation, in the PI scenario, the digital effort level of the new supplier is higher than in the other scenarios (), and the level of the buyer’s complementary innovation is also higher than in the other scenarios ().
- (ii)
- In terms of profit, the profit under the PI scenario is higher than the total profit of the supply chain under the other three scenarios, that is, .
Proposition 6 indicates that internalizing the new supplier can increase their level of complementary innovation effort and that the buyer will also increase their level of complementary innovation effort, which can enhance the overall profit of the supply chain. This is also in line with the actual situation. In practice, buyers often choose to acquire suppliers to motivate them to innovate and maximize the profits of both parties. For example, in 2020, Intel’s acquisition and integration of Altera meant that Intel was considering new technological applications beyond CPUs. FPGAs, which can be integrated into processor products as acceleration technology similar to GPUs, became Intel’s new underlying technological driving force in the next step towards the future IoT era. This move was not merely about cost efficiency but also about securing long-term technological leadership, a concept directly aligned with the RBV framework. Thus, our model extension highlights that vertical integration is not just a structural decision but also a resource-driven strategic move that enhances technological complementarity, reinforcing the theoretical and practical significance of our findings.
6. Numerical Analysis
In this section, MATLAB R2014b is used to perform numerical simulation on the model to explore the impact of the probability of success of DTCI on the optimal decisions and profits of supply chain members. Referring to the parameter settings of [14], the basic data are set as follows: D = 1.3; K = 0.1; k = 0.1; s = 0.3; c = 0.1.
6.1. The Impact of DTCI Success Probability on Supply Chain Member Decisions
Figure 7, through its different subfigures (a) and (b), provides a detailed demonstration of the optimal effort levels in DTCI of the buyer and the new supplier under four different scenarios: PI, NN, NB, and BN. Through analysis, we observe the following trends: Firstly, a comparison of the DTCI effort levels of the buyer and new supplier shows that in all four scenarios, their DTCI effort levels increase as the success probability of DTCI and the complementary nature of their technology are enhanced. When the success probability of DTCI increases and the technology becomes more complementary, both the buyer and the new supplier are willing to put in more effort to make their products more attractive and competitive. Secondly, regarding the impact on prices, as shown in Figure 7c,d, as the DTCI success probability increases, both the buyer and new supplier raise their respective prices. At the same time, we also note that the effort cost for the existing supplier increases as the DTCI success probability and technological complementarity increase, as shown in Figure 7e. This is because, as the likelihood of DTCI success grows, the competitive advantage of mature technology in the market diminishes, increasing the existing supplier’s motivation and effort to improve and optimize mature technology.
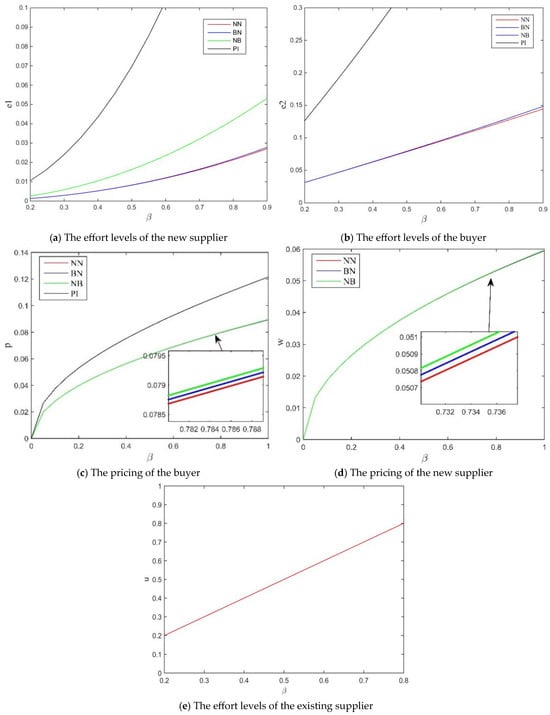
Figure 7.
The impact of DTCI success probability on supply chain member decisions.
6.2. The Impact of DTCI Success Probability on Profits
Figure 8a–c illustrate in detail how the profits of the buyer and the new supplier change with the increase in the DTCI success probability. Firstly, concerning the profits of the buyer and the new supplier, it can be clearly seen from the figures that as the DTCI success probability increases, the profits of both the buyer and the new supplier show an upward trend. This growth is primarily due to the fact that the successful innovation of new technology may expand market demand, thereby driving an increase in profits for both parties. As for the profits of the existing supplier, they may be somewhat impacted and show a downward trend. This is because as digital technology succeeds, the competitive edge of mature technology declines, potentially compressing the existing supplier’s market position.
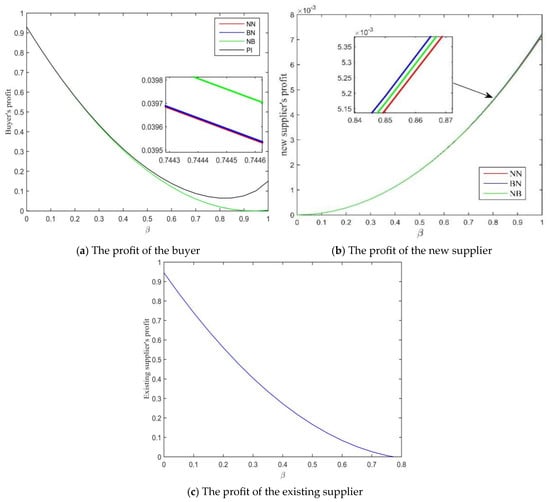
Figure 8.
The impact of DTCI success probability on profits.
7. Conclusions and Management Implications
This paper constructs a supply chain model consisting of a buyer, a new supplier, and an existing supplier to explore the impact of mature technology and different leadership structures on DTCI cooperation models. The main conclusions are as follows:
Firstly, we find that for new suppliers, their effort level in DTCI is highest when they act as followers, as they have greater incentives to invest in complementary innovation when guided by the buyer. However, when they take on a leadership role, they achieve higher profitability, although their effort level is relatively lower. Interestingly, for the buyer, whether in a leadership position or as a follower, their effort level in DTCI remains unchanged, but they prefer a leadership role to maintain strategic control over the innovation process. Secondly, as the complementarity of digital technology between the buyer and the new supplier increases, both parties invest more effort into DTCI, leading to higher overall profitability. Additionally, as the probability of DTCI success increases, both the buyer and new supplier are more willing to increase their effort, enhancing the competitiveness of the final product. This improvement in market position also allows both firms to adjust their pricing strategies accordingly. However, the increased probability of DTCI success and stronger technological complementarity negatively impact the existing supplier. As complementary innovation becomes more effective, mature technology loses its competitive advantage, leading to a decline in the existing supplier’s effort level. This finding aligns with prior research on technology substitution and market-driven innovation adaptation [7]. Thirdly, we find that bargaining power plays a crucial role in shaping DTCI strategies. When the existing supplier has low bargaining power, the buyer prefers to continue purchasing from them, leading to a lower level of DTCI effort from the new supplier. Conversely, when the existing supplier has strong bargaining power, the buyer is more inclined to collaborate with the new supplier, which increases DTCI investment levels. Finally, we extend our analysis to examine a vertical integration scenario, where the buyer internalizes the new supplier for in-house technology development. Our findings suggest that vertical integration enhances the level of effort in DTCI for both parties and increases overall supply chain profitability. However, while vertical integration can provide firms with greater control over innovation and reduce dependency on external suppliers, it may not always be the optimal strategy. Firms may also consider alternative approaches such as strategic alliances or long-term technology partnerships to balance innovation flexibility and risk management.
This study provides valuable insights for business leaders and decision-makers engaging in DTCI collaborations. Firstly, our findings emphasize that leadership structures between buyers and new suppliers significantly influence collaborative innovation outcomes. Specifically, new suppliers invest greater effort in DTCI when acting as followers, benefiting from the clear strategic guidance provided by the buyer. Conversely, taking a leadership role enables new suppliers to achieve higher profitability despite relatively lower innovation efforts. Therefore, managers must thoroughly assess the technological capabilities, innovation potential, and strategic priorities of their suppliers when establishing collaborative leadership roles. Secondly, our results underscore that technological complementarity critically influences optimal innovation strategies. When new suppliers offer substantial digital technology complementarity, active engagement in DTCI collaboration helps buyers enhance their competitive advantage, drive innovation growth, and create new market opportunities. However, in cases of limited technological complementarity, firms may benefit from maintaining stable partnerships with their existing suppliers, leveraging mature technology to achieve greater cost-efficiency and operational stability. Thus, it is essential for firms to strategically evaluate the degree of complementarity before deciding between aggressive DTCI investments or reliance on established technologies. Thirdly, we highlight that bargaining power dynamics are crucial factors in supply chain decision-making. Buyers facing high bargaining power from existing suppliers are more inclined to engage with new suppliers, fostering enhanced innovation incentives. In contrast, when existing suppliers hold weaker bargaining positions, ongoing relationships with these suppliers may lead to higher profitability. Hence, firms should carefully analyze bargaining dynamics and strategically align their innovation initiatives to optimize supply chain outcomes.
Finally, our study also provides meaningful implications at the policymaking level. Policymakers and government agencies have a critical role to play in facilitating the widespread adoption of digital technology innovations by implementing targeted incentives, such as financial grants and innovation subsidies, and establishing collaborative industry platforms or innovation hubs. For instance, targeted tax incentives or government subsidies specifically designed to support collaborative digital innovation projects can significantly reduce financial barriers and encourage stronger cooperation between buyers and suppliers. Furthermore, policies supporting public–private innovation networks or regional innovation clusters can foster knowledge-sharing, strengthen technological complementarity among firms, and promote industry-wide digital transformation. These initiatives can generate substantial macroeconomic ripple effects, accelerating the diffusion of advanced digital technologies, enhancing industrial competitiveness, and ultimately contributing to broader economic growth and increased innovation capacities at national and regional scales.
Although this study offers significant insights into the influence of leader–follower structures on DTCI strategies, we acknowledge certain simplifications in our leadership assumptions. Specifically, we modeled the leadership relationship as static and unidirectional. However, in practice, supply chains may involve collaborative leadership, characterized by shared governance and cooperative decision-making processes, or dynamic leadership structures, in which roles alternate based on contextual factors such as technology maturity and shifting market conditions. Future research could expand our analysis by explicitly incorporating these alternative leadership frameworks, exploring how collaborative or dynamic leadership arrangements affect innovation outcomes, risk-sharing mechanisms, and overall supply chain resilience.
Author Contributions
Conceptualization, J.C. and S.W.; methodology, J.C., S.W. and Q.W.; validation, Q.W. and K.N.; formal analysis, S.W. and Q.W.; investigation, K.N.; writing—original draft preparation, J.C. and S.W.; writing—review and editing, Q.W. and K.N.; supervision, S.W.; project administration, S.W. and Q.W.; funding acquisition, S.W. and Q.W. All authors have read and agreed to the published version of the manuscript.
Funding
This research was funded by the Ministry of Education Humanities and Social Sciences Research Youth Project, grant number 24YJC630227; Hebei Natural Science Foundation, grant number G2024502006; Beijing Natural Science Foundation, grant number 4254105; Social Science Foundation Project of Inner Mongolia Autonomous Region, grant number 2024QY10; and Fundamental Research Funds for the Central Universities, grant number 2024MS159 and 2023MS138.
Institutional Review Board Statement
Not applicable.
Informed Consent Statement
Not applicable.
Data Availability Statement
Data will be provided upon request.
Conflicts of Interest
The authors declare no conflicts of interest.
Appendix A
Appendix A.1
Proof of Proposition 1.
The effort levels of the new supplier in the three scenarios are compared as follows:
, , it can be obtained .
, , where can be obtained . From this, we can infer . From this, we can infer . The effort level of the buyer in the three scenarios is compared as follows: . From this, we can infer . □
Appendix A.2
Proof of Proposition 2.
The price of the buyer in the three scenarios is compared as follows: , .
From this, we can infer . The price of the new supplier in the three scenarios is compared as follows: , . From this, we can infer . □
Appendix A.3
Proof of Proposition 3.
The buyer’s bargaining power in the three scenarios is compared as follows: . From this, we can infer . □
Appendix A.4
Proof of Proposition 4.
The of the new supplier in the three scenarios is compared as follows: , . From this, we can infer . □
Appendix A.5
Proof of Proposition 5.
The profit of the buyer in the three scenarios is compared as follows: , . From this, we can infer . The profit of the new supplier in the three scenarios is compared as follows: , . From this, we can infer . □
References
- Yoo, Y.; Henfridsson, O.; Lyytinen, K. Research commentary—The new organizing logic of digital innovation: An agenda for information systems research. Inf. Syst. Res. 2010, 21, 724–735. [Google Scholar]
- Liu, Y.; Dong, J.; Mei, L.; Shen, R. Digital innovation and performance of manufacturing firms: An affordance perspective. Technovation 2023, 119, 102458. [Google Scholar]
- Kwak, K.; Kim, W.; Park, K. Complementary multiplatforms in the growing innovation ecosystem: Evidence from 3D printing technology. Technol. Forecast. Soc. Chang. 2018, 136, 192–207. [Google Scholar]
- Cenamor, J.; Frishammar, J. Openness in platform ecosystems: Innovation strategies for complementary products. Res. Policy 2021, 50, 104148. [Google Scholar]
- Sohu. Xiaomi and TCL Join Forces! A Record-Breaking Domestic Collaboration with 7 Million Units Shipped in Two Years. Sohu. 12 July 2019. Available online: https://www.sohu.com/a/326337534_82439 (accessed on 7 January 2025).
- Huawei. Chint and Huawei Signed a Cooperation Agreement. Huawei. 12 December 2021. Available online: https://solar.huawei.com/cn/news-room (accessed on 26 March 2025).
- Liu, W.; Long, S.; Liang, Y.; Wang, J.; Wei, S. The influence of leadership and smart level on the strategy choice of the smart logistics platform: A perspective of collaborative innovation participation. Ann. Oper. Res. 2021, 324, 893–935. [Google Scholar]
- Zhang, W.; Lee, H.H. Investment strategies for sourcing a new Technology in the presence of a mature technology. Manag. Sci. 2022, 68, 4631–4644. [Google Scholar]
- Chen, X.; Wang, X.; Jing, H. Technology licensing strategies for three cost-differential manufacturers. Eur. J. Oper. Res. 2023, 308, 622–635. [Google Scholar]
- Xiao, Q.; Chen, L.; Xie, M.; Wang, C. Optimal contract design in sustainable supply chain: Interactive impacts of fairness concern and overconfidence. J. Oper. Res. Soc. 2021, 72, 1505–1524. [Google Scholar]
- Chung, H.; Lee, E. Asymmetric relationships with symmetric suppliers: Strategic choice of supply chain price leadership in a competitive market. Eur. J. Oper. Res. 2017, 259, 564–575. [Google Scholar]
- Li, P.; Rao, C.; Goh, M.; Yang, Z. Pricing strategies and profit coordination under a double echelon green supply chain. J. Clean. Prod. 2021, 278, 123694. [Google Scholar]
- Al-Omoush, K.S.; de Lucas, A.; del Val, M.T. The role of e-supply chain collaboration in collaborative innovation and value-co creation. J. Bus. Res. 2023, 158, 113647. [Google Scholar]
- Liu, W.; Wei, W.; Choi, T.M.; Yan, X. Impacts of leadership on corporate social responsibility management in multi-tier supply chains. Eur. J. Oper. Res. 2022, 299, 483–496. [Google Scholar]
- Xia, Q.; Zhi, B.; Wang, X. The role of cross-shareholding in the green supply chain: Green contribution, power structure and coordination. Int. J. Prod. Econ. 2021, 234, 108037. [Google Scholar]
- Benitez, J.; Arenas, A.; Castillo, A.; Esteves, J. Impact of digital leadership capability on innovation performance: The role of platform digitization capability. Inf. Manag. 2022, 59, 103590. [Google Scholar]
- Peng, Y. An Analysis of Entrepreneurial Leadership Based on Schumpeter’s Theory of Innovation. Acad. J. Bus. Manag. 2023, 5, 34–37. [Google Scholar]
- Mithas, S.; Chen, Z.L.; Saldanha, T.J.; De Oliveira Silveira, A. How will artificial intelligence and Industry 4.0 emerging technologies transform operations management? Prod. Oper. Manag. 2022, 31, 4475–4487. [Google Scholar]
- Khan, A.A.; Laghari, A.A.; Li, P.; Dootio, M.A.; Karim, S. The collaborative role of blockchain, artificial intelligence, and industrial internet of things in digitalization of small and medium-size enterprises. Sci. Rep. 2023, 13, 1656. [Google Scholar]
- Fu, W.; Diez, J.R.; Schiller, D. Interactive learning, informal networks and innovation: Evidence from electronics firm survey in the Pearl River Delta, China. Res. Policy 2013, 42, 635–646. [Google Scholar]
- Moghavvemi, S.; Hakimian, F.; Feissal, T.M.F.T. Competitive advantages through IT innovation adoption by SMEs. Soc. Technol. 2012, 2, 24–39. [Google Scholar]
- Patnaik, P.; Bakkar, M. Exploring determinants influencing artificial intelligence adoption, reference to diffusion of innovation theory. Technol. Soc. 2024, 79, 102750. [Google Scholar]
- Sunday, C.E.; Vera, C.C.E. Examining information and communication technology (ICT) adoption in SMEs: A dynamic capabilities approach. J. Enterp. Inf. Manag. 2018, 31, 338–356. [Google Scholar]
- Lee, S.G.; Trimi, S.; Kim, C. Innovation and imitation effects’ dynamics in technology adoption. Ind. Manag. Data Syst. 2013, 113, 772–799. [Google Scholar]
- Milliou, C.; Petrakis, E. Timing of technology adoption and product market competition. Int. J. Ind. Organ. 2011, 29, 513–523. [Google Scholar]
- Carter, C.R.; Rogers, D.S.; Choi, T.Y. Toward the theory of the supply chain. J. Supply Chain Manag. 2015, 51, 89–97. [Google Scholar]
- Flynn, B.B.; Koufteros, X.; Lu, G. On theory in supply chain uncertainty and its implications for supply chain integration. J. Supply Chain Manag. 2016, 52, 3–27. [Google Scholar]
- Stoian, C.A.; Tohanean, D. Platform business models–a case study of the technology industry. J. Econ. Manag. Sci. 2021, 4, 8–18. [Google Scholar]
- Roeck, D.; Sternberg, H.; Hofmann, E. Distributed ledger technology in supply chains: A transaction cost perspective. Int. J. Prod. Res. 2020, 58, 2124–2141. [Google Scholar]
- Tsay, A.A.; Gray, J.V.; Noh, I.J.; Mahoney, J.T. A review of production and operations management research on outsourcing in supply chains: Implications for the theory of the firm. Prod. Oper. Manag. 2018, 27, 1177–1220. [Google Scholar]
- Bergek, A.; Berggren, C.; Magnusson, T.; Hobday, M. Technological discontinuities and the challenge for incumbent firms: Destruction, disruption or creative accumulation? Res. Policy 2013, 42, 1210–1224. [Google Scholar]
- Nambisan, S.; Wright, M.; Feldman, M. The digital transformation of innovation and entrepreneurship: Progress, challenges and key themes. Res. Policy 2019, 48, 103773. [Google Scholar]
- Hilbolling, S.; Berends, H.; Deken, F.; Tuertscher, P. Sustaining Complement Quality for Digital Product Platforms: A Case Study of the Philips Hue Ecosystem. J. Prod. Innov. Manag. 2020, 38, 21–48. [Google Scholar] [CrossRef]
- Feng, X.; Chen, L. Can external knowledge search enhance the collaborative innovation capabilities of small, medium and micro enterprises?—The mediating role of complementary and complementary knowledge integration. Sci. Sci. Manag. Sci. Technol. 2015, 36, 105–117. [Google Scholar]
- Zhang, Y.; Tong, T.W. How vertical integration affects firm innovation: Quasi-experimental evidence. Organ. Sci. 2021, 32, 455–479. [Google Scholar]
- Zahoor, N.; Khan, Z.; Wu, J.; Tarba, S.Y.; Donbesuur, F.; Khan, H. Vertical alliances and innovation: A systematic review of the literature and a future research agenda. Technovation 2023, 122, 102588. [Google Scholar]
- Beltagui, A.; Rosli, A.; Candi, M. Exaptation in a digital innovation ecosystem: The disruptive impacts of 3D printing. Res. Policy 2020, 49, 103833. [Google Scholar] [CrossRef]
- Dahlander, L.; Gann, D.M.; Wallin, M.W. How open is innovation? A retrospective and ideas forward. Res. Policy 2021, 50, 104218. [Google Scholar]
- Chen, L.; Li, T.; Zhang, T. Supply chain leadership and firm performance: A meta-analysis. Int. J. Prod. Econ. 2021, 235, 108082. [Google Scholar] [CrossRef]
- Shin, N.; Park, S. Supply chain leadership driven strategic resilience capabilities management: A leader-member exchange perspective. J. Bus. Res. 2021, 122, 1–13. [Google Scholar] [CrossRef]
- Nurhayati, K.; Rezaei, J.; Tavasszy, L. The interplay between power structure and decision-making in supply chains: A systematic review. J. Supply Chain Manag. Sci. 2021, 2, 85–114. [Google Scholar] [CrossRef]
- Mosch, P.; Schweikl, S.; Obermaier, R. Trapped in the supply chain? Digital servitization strategies and power relations in the case of an industrial technology supplier. Int. J. Prod. Econ. 2021, 236, 108141. [Google Scholar] [CrossRef]
- Wang, Y.; Yu, Z.; Jin, M.; Mao, J. Decisions and coordination of retailer-led low-carbon supply chain under altruistic preference. Eur. J. Oper. Res. 2021, 293, 910–925. [Google Scholar]
- Kulas, J.T.; Komai, M.; Grossman, P.J. Leadership, information, and risk attitude: A game theoretic approach. Leadersh. Q. 2013, 24, 349–362. [Google Scholar]
- Pakseresht, M.; Mahdavi, I.; Shirazi, B.; Mahdavi-Amiri, N. Co-reconfiguration of product family and supply chain using leader–follower Stackelberg game theory: Bi-level multi-objective optimization. Appl. Soft Comput. 2020, 91, 106203. [Google Scholar]
- Michalski, M.; Montes-Botella, J.L.; Narasimhan, R. The impact of asymmetry on performance in different collaboration and integration environments in supply chain management. Supply Chain. Manag. Int. J. 2018, 23, 33–49. [Google Scholar]
- Matsui, K. Asymmetric product distribution between symmetric manufacturers using dual-channel supply chains. Eur. J. Oper. Res. 2016, 248, 646–657. [Google Scholar] [CrossRef]
- Pu, X.; Cai, Z.; Chong, A.Y.L.; Paulraj, A. Dependence structure, relational mechanisms and performance: Teasing out the differences between upstream and downstream supply chain partners. Int. J. Oper. Prod. Manag. 2023, 43, 1009–1039. [Google Scholar]
- Ulstrup Hoejmose, S.; Grosvold, J.; Millington, A. Socially responsible supply chains: Power asymmetries and joint dependence. Supply Chain Manag. Int. J. 2013, 18, 277–291. [Google Scholar]
- Pan, K.; Cui, Z.; Xing, A.; Lu, Q. Impact of fairness concern on retailer-dominated supply chain. Comput. Ind. Eng. 2020, 139, 106209. [Google Scholar]
- Zhao, J.; Zhou, Y.W.; Cao, Z.H.; Min, J. The shelf space and pricing strategies for a retailer-dominated supply chain with consignment based revenue sharing contracts. Eur. J. Oper. Res. 2020, 280, 926–939. [Google Scholar]
- Liu, B.; Ma, S.; Guan, X.; Xiao, L. Timing of sales commitment in a supply chain with manufacturer-quality and retailer-effort induced demand. Int. J. Prod. Econ. 2018, 195, 249–258. [Google Scholar] [CrossRef]
- Shen, B.; Xu, X.; Chan, H.L.; Choi, T.M. Collaborative innovation in supply chain systems: Value creation and leadership structure. Int. J. Prod. Econ. 2021, 235, 108068. [Google Scholar] [CrossRef]
- Gosling, J.; Jia, F.; Gong, Y.; Brown, S. The role of supply chain leadership in the learning of sustainable practice: Toward an integrated framework. J. Clean. Prod. 2016, 137, 1458–1469. [Google Scholar] [CrossRef]
- Solaimani, S.; van der Veen, J. Open supply chain innovation: An extended view on supply chain collaboration. Supply Chain Manag. Int. J. 2022, 27, 597–610. [Google Scholar] [CrossRef]
- Scholten, K.; Schilder, S. The role of collaboration in supply chain resilience. Supply Chain Manag. Int. J. 2015, 20, 471–484. [Google Scholar] [CrossRef]
- Dalporto, A.; Venn, R. Supply chain leadership, transparency, workforce development and collaboration through control tower implementation. J. Supply Chain Manag. Logist. Procure. 2020, 3, 66–76. [Google Scholar] [CrossRef]
- Birasnav, M.; Bienstock, J. Supply chain integration, advanced manufacturing technology, and strategic leadership: An empirical study. Comput. Ind. Eng. 2019, 130, 142–157. [Google Scholar] [CrossRef]
- Pitelis, C.N.; Wagner, J.D. Strategic shared leadership and organizational dynamic capabilities. Leadersh. Q. 2019, 30, 233–242. [Google Scholar] [CrossRef]
- Hanna, A.A.; Smith, T.A.; Kirkman, B.L.; Griffin, R.W. The emergence of emergent leadership: A comprehensive framework and directions for future research. J. Manag. 2021, 47, 76–104. [Google Scholar] [CrossRef]
- Ford, J.; Ford, L.; Polin, B. Leadership in the implementation of change: Functions, sources, and requisite variety. J. Chang. Manag. 2021, 21, 87–119. [Google Scholar] [CrossRef]
- Yang, M.; Fu, M.; Zhang, Z. The adoption of digital technologies in supply chains: Drivers, process and impact. Technol. Forecast. Soc. Chang. 2021, 169, 120795. [Google Scholar] [CrossRef]
- Al-Emran, M.; Griffy-Brown, C. The role of technology adoption in sustainable development: Overview, opportunities, challenges, and future research agendas. Technol. Soc. 2023, 73, 102240. [Google Scholar] [CrossRef]
- Cennamo, C.; Santalo, J. Generativity tension and value creation in platform ecosystems. Organ. Sci. 2019, 30, 617–641. [Google Scholar] [CrossRef]
Disclaimer/Publisher’s Note: The statements, opinions and data contained in all publications are solely those of the individual author(s) and contributor(s) and not of MDPI and/or the editor(s). MDPI and/or the editor(s) disclaim responsibility for any injury to people or property resulting from any ideas, methods, instructions or products referred to in the content. |
© 2025 by the authors. Licensee MDPI, Basel, Switzerland. This article is an open access article distributed under the terms and conditions of the Creative Commons Attribution (CC BY) license (https://creativecommons.org/licenses/by/4.0/).