1. Introduction
In an age characterized by unparalleled global connection and economic interdependence, supply chains form the cornerstone of international commerce and economic activity. They enable the smooth transfer of products, services, and information across borders, supporting the development and stability of national economies. This complex network of dependency makes supply chains more susceptible to various disturbances, such as economic recessions, geopolitical conflicts, and resource shortages [
1]. Natural pandemics and increasing territorial, historical, geopolitical, and trade conflicts have highlighted the vulnerability of global supply chains, emphasizing the need to bolster supply chain resilience. As a result, supply chain resilience (SCR) has become a vital strategic priority for governments and enterprises, motivated by the necessity of minimizing disruptions and maintaining operational continuity under unstable conditions [
2].
Supply chain resilience (SCR) is increasingly recognized as a foundation of economic stability, development growth, and sustainability, particularly in regions where political instability, economic dependencies, and infrastructural disparities create unique vulnerabilities [
3]. Nations’ dependence on resource extraction increases economic volatility, thereby elevating the risk of supply chain disruptions. Political instability and persistent conflicts in nations like Syria, Yemen, Israel, and Lebanon compromise supply chain integrity, diminish trade efficiency, and hinder economic growth [
4]. Excessive dependence on oil exports renders the area especially vulnerable to external disruptions, while persistent conflicts foster a volatile atmosphere that affects supply chains [
5]. Therefore, improving supply chain resilience in the region is crucial for both regional stability and the protection of global trade networks.
The Middle Eastern region serves as a prime example of a region where supply chain resilience is crucial yet difficult to achieve. The region, situated at the intersection of Asia, Europe, and Africa, possesses significant strategic importance for global trade and logistics. The complex geopolitical landscape, resource-driven economies, and infrastructural disparities pose significant challenges to the enhancement of supply chains [
6]. The area serves as a vital hub for energy exports and essential marine commerce routes, significantly contributing to the efficient operation of global supply chains. Political instability, wars, or infrastructure failures in the Middle East disrupt the global supply chain, resulting in delays, heightened prices, and market volatility [
7]. There is a necessity of studying supply chain resilience (SCR) within the Middle Eastern trade corridor, which encompasses multiple industries critical to the region’s economy. Meanwhile, the energy sector, driven by oil exports, dominates due to nations like Saudi Arabia and Iraq’s reliance on natural resource rents and require a resilient framework. This framework includes manufacturing and trade-related supply chains reflected in the economic complexity index (ECI). Additionally, logistics and transportation networks, vital to maritime trade via the Suez Canal, are integral. This multi-industry approach ensures practical applicability across diverse sectors, addressing systemic vulnerabilities, rather than a single industry focus.
Nations such as Saudi Arabia, Iraq, and Iran exhibit significant reliance on oil exports, rendering their economies especially susceptible to variations in global energy markets [
3]. The intersecting challenges highlight the need for predictive frameworks to anticipate vulnerabilities and enhance resilience in national and regional supply chains. The intersecting challenges highlight the need for predictive frameworks to anticipate vulnerabilities and enhance resilience in national and regional supply chains. Traditional econometric models are effective in stable environments, whereas they often fall short in capturing the intricate, non-linear dynamics of modern supply chains, especially in volatile regions [
8]. These models struggle to account for the complex interplay between economic complexity, political uncertainty, and infrastructural deficits, which are critical determinants of supply chain vulnerabilities in the region [
9]. Subsequently, there is a pressing need for more sophisticated, adaptive frameworks capable of addressing these multidimensional challenges. Machine learning (ML) models, with their ability to process large datasets, identify non-linear patterns, and adapt to dynamic conditions, offer a promising alternative [
10,
11]. Unlike traditional econometric approaches, ML models can better predict supply chain risks by integrating diverse factors such as geopolitical shifts, economic fluctuations, and infrastructural constraints, thereby enhancing the precision of risk assessments and enabling proactive strategies to bolster resilience, foster development, and ensure stability in the face of emerging vulnerabilities.
This study, therefore, aims to apply machine learning models to examine which ML model fits the study of the multidimensional factor effects of SCR, an area where traditional econometric models often fail to provide reliable insights [
12]. By leveraging the power of ML, this research seeks to develop predictive frameworks that can more accurately anticipate vulnerabilities and support the development of robust, adaptive supply chains in the region [
13]. In doing so, it will contribute to advancing the broader field of supply chain resilience, offering a model for how ML can address the complexities of contemporary supply chains and improve their resilience in volatile, resource-dependent regions [
14].
Machine learning (ML) models provide a robust solution to the constraints of conventional econometric models. Through the analysis of extensive datasets, machine learning algorithms identify complex patterns, trends, and correlations that may remain obscured by traditional statistical methods [
13]. In the Middle East and its surroundings, machine learning models are appropriate to address the region’s intricate economic interdependencies and political instability, offering insights into the impact of these elements on supply chain resilience [
15]. Machine learning facilitates the creation of predictive models that can adjust to alterations in the region’s political environment, economic circumstances, and infrastructure, providing a more sophisticated comprehension of supply chain dynamics [
16]. The use of machine learning methods thereby addresses significant deficiencies in resilience forecasting, improving the region’s capacity to anticipate and respond to disturbances with greater effectiveness [
12].
The machine learning (ML) models employed in this study were designed to identify patterns and generate precise predictions regarding supply chain resilience (SCR) in the Middle Eastern region [
13]. Features incorporated into the analysis serve as indicators of potential vulnerabilities and risks and determinants of supply chain disruptions. While ML offers powerful tools for risk assessment and predictive analytics, its application should be integrated with complementary analytical frameworks and human expertise to inform effective interventions and policy formulation [
12,
17]. A deeper exploration of the causal mechanisms underlying supply chain vulnerabilities necessitates further research, employing a multidisciplinary approach to fully capture the intricate dynamics of the issue. This study positions ML as a vital tool within a broader strategy to enhance SCR, rather than an impartial solution [
18].
Despite the growing interest in this topic, research into supply chain resilience (SCR) has persisted, but researchers still need to bridge their understanding of how geopolitical instability and economic dependencies affect complex supply chain disruptions within volatile Middle Eastern regions. Economic and infrastructural approaches fail to account for the changing nature of regional disruption factors because they do not consider the impact of political instability alongside trade policies and economic complexity. A gap has been filled through this research, which implements gated recurrent units (GRUs) from machine learning (ML) to predict SCR improvements specifically in the Middle Eastern region. Our research integrates the economic complexity index (ECI) to establish a new data-driven prediction system that analyzes economic resilience connections through advanced machine learning techniques and various geopolitical events. The research reveals new operational value for supply chain managers through deep learning model predictions, which deliver concrete solutions to reduce risks even when traditional forecasting methods prove ineffective. Our research’s primary aim is to create and employ machine learning models to predict national supply chain resilience (SCR) in the geopolitically unstable Middle East, transcending the effectiveness of conventional econometric methods. We employ the economic complexity index (ECI) as an innovative proxy for SCR, connecting economic diversity to resilience against perturbations. Leveraging SHAP analysis, we discern essential factors of resilience, providing pragmatic insights for policymakers. Additionally, we propose a scalable framework for real-time SCR prediction, suitable for other trade-dependent regions.
This research offers novel elements in the use of machine learning for supply chain resilience within the Middle Eastern context, advancing beyond prior research. It innovatively employs ML models (GRU) to predict SCR using the economic complexity index (ECI), utilizing GRU’s capacity for capturing temporal patterns and overcoming conventional econometric and simpler machine learning techniques with exceptional precision. This study uses ECI to connect economic variety with SCR, presenting a fresh macro-level perspective, in contrast to previous research centered on direct resilience measurements. Our region-specific, multidimensional dataset covering seven years and 18 countries includes unique Middle Eastern variables such as resource rents and political stability, adapting machine learning to the region’s specific challenges of geopolitical volatility, oil dependency, and infrastructure deficiencies, in contrast to stable contexts in prior research. The amalgamation of SHAP with scenario and sensitivity analyses improves interpretability, yielding practical insights into feature influences and model resilience during disturbances such as Suez Canal blockages and thus addressing a deficiency in previous machine learning applications. A thorough comparison of GRU with several models sets a standard for SCR prediction in volatile areas, beyond the limited assessments seen in previous studies.
3. Model Description
3.1. Data Collection Procedure and Processing
In our study, data are key, so they had to be sourced from reliable and ethical sources for this research; accordingly, data were sourced from credible, publicly available resources to guarantee high-quality and uniform datasets. The principal sources include the World Bank, the International Monetary Fund (IMF), the United Nations Conference on Trade and Development (UNCTAD), the Fragile States Index, and the World Economic Forum (WEF). These institutes provide standardized, dependable datasets across a broad spectrum of economic, infrastructural, and political variables essential for assessing supply chain resilience (SCR) in the Middle East. The dataset has a seven-year duration, including 18 nations in the Middle East. This longitudinal method encompasses significant economic cycles, geopolitical occurrences, and infrastructure changes, offering a thorough foundation for modeling and predicting SCR in the area. The choice of these years guarantees the incorporation of critical variations and enduring patterns vital for a comprehensive examination.
Machine learning has transformative potential to measure and enhance SCR across various industries and domains due to adaptability, scalability, and the ability to learn from data and its patterns. ML models are intended to reflect the unique geographical attributes of the Middle Eastern region. Fundamental attributes encompass political stability and the absence of violence (PSAV) are used to assess geopolitical instability like conflicts in Syria and Yemen, while total natural resource rents (TNRRs) are used to evaluate economic reliance on oil exports, and productive capacities transport (PCT), alongside infrastructure quality indicators (IQ and OATI), are used to consider logistical discrepancies. These variables mention in
Table 1, derived from a dataset encompassing nations in the region, reflect the region’s unstable trade landscape and important location close to the Suez Canal. The capacity of an ML model like GRU to model temporal dependencies guarantees that dynamic characteristics such as abrupt geopolitical shocks or variations in the SC are effectively incorporated into SCR predictions, hence augmenting regional relevance.
A data processing step emphasized maintaining the integrity and comparability of the dataset for analysis. Our research work utilized a multi-stage data prepossessing pipeline to guarantee data reliability, encompassing missing value imputation, feature scaling, and dataset segmentation. The K-nearest neighbor (KNN) imputation method was employed to address missing data by estimating absent values based on analogous feature distributions, hence ensuring minimal data distortion. Furthermore, the dataset was standardized using Z-score normalization to reduce the impact of variables with significant scale differences. This prepossessing step is essential for enhancing model performance, especially in deep learning models such as GRU, which are susceptible to unscaled input features. The dataset is divided into training (70%), validation (15%), and test (15%) sets, adhering to established standards in machine learning research. This work enhances model selection using cross-validation techniques, in contrast to traditional studies that depend on fixed train–test splits, hence improving the generalizability of the results.
3.2. Research Method
The gated recurrent unit (GRU) is a type of recurrent neural network (RNN) used for processing sequential or time-series data, such as language modeling and market prediction. This is usual since traditional RNNs often encounter issues with vanishing gradients, making it difficult to understand long-term relationships. This addresses the issue that GRUs resolve via gates, which preserve only relevant information while updating the hidden states at each time step. GRUs are less computationally intensive than LSTMs since they possess fewer gates and parameters. Nonetheless, GRUs are quite effective for several sequence modeling problems. The GRU model for time-series forecasting: in time-series forecasting, we anticipate the target variable (ECI) based on the preceding values of various input characteristics. GRU models are well suited for this purpose since they effectively capture temporal relationships and patterns from sequential data.
Basically, the GRU model has two main components.
Both gates work together to control how much information is required to be retained and which information is not required.
Key components of GRU:
The input vector represents the input at time t.
The hidden state represents the hidden state from the previous time step, carrying information from the past sequence. At each time step, t, the GRU receives the following:
- 2.
Update gate calculation
The update gate basically addresses how much from the previous hidden state
, i.e., what was calculated using the previous values for ECI and other features) should affect the current prediction.
is the vector of the input features at time t.
is the weight matrix for input .
is the weight matrix for hidden state .
is the bias term.
is the sigmoid activation function (binary function).
The reset gate controls how much of the past information we want to forget for the current computation. This forces the model to only pay attention to useful things.
The equation for the resets gate with the bias term is as follows:
is the sigmoid activation function.
is the weight matrix for the input .
is the weight matrix for the previous hidden state .
is the bias term associated with the reset gate.
- 4.
Candidate hidden: .
The candidate hidden state is computed based on the reset gate,
, and the previous hidden state
. The candidate hidden state can be thought of as the new potential state of the system, which is influenced by both the current input and the relevant portion of the previous state.
is the hyperbolic tangent activation function.
denotes element-wise multiplication.
is the weight matrix for the input .
is the weight matrix for the previous hidden state .
is the bias term associated with the candidate state.
is the reset gate controlling how much of the previous hidden state should be passed into the hidden state.
- 5.
Final hidden state: .
The final hidden state,
, is a weighted combination of the previous hidden state
and the candidate hidden state,
, modulated via the update gate,
.
determines how much of the previous hidden state should remain.
determines how much of the candidate hidden state should be adopted.
is an additional bias term associated with the final hidden state. This is optional, and it is not always included, but it can be part of the model for better flexibility.
The following diagram shows the architecture of a gated recurrent unit (GRU), a kind of recurrent neural network (RNN) applied in deep learning models. Here is a breakdown of the main elements.
Reset gate: The reset gate decides how much past information needs to be discarded. It determines which aspects of the previous hidden state to forget when the current input is considered. It applies a sigmoid activation function (—sigmoid activation function) that returns a value between 0 and 1. A lower output of the reset gate means it is forgetting more of the past.
The update gate controls what information is passed from the present input to the hidden state. It decides what part of the previous hidden state will indeed be passed to the next step. Similarly, the update gate employs the sigmoid activation function, so all values will be between 0 and 1. It retains more of the previous state when the update gate output is closer to 1, and it relies more on the current input when closer to 0. The hidden state at the current time step is computed as a function of the previous hidden state and current input , also modulated via the reset and the update gates. The last hidden state is obtained from a tanh activation function, which translates between the previous state and the current state. That allows the GRU to keep important information from the past and add the new input usefully.
Flow of information: The input xt and the previous hidden state are passed through the reset and update gates. The purpose of the reset gate is to decide how much of the past hidden state should be forgotten, and the update gate decides how much of the new information should be incorporated into the current state. ht is a weighted sum of the previous state and the current input, balancing the need to learn long-term dependencies with the vanishing gradient problem.
3.3. Applied ML Models
To find the best accuracy, the study applied various machine learning and deep learning models with the best-fitted parameters. Each model was selected based on its best accuracy functions and its ability to learn complex patterns that may occurs during. The ML models were SVR, GBoost, CatBoost, random forest, and linear regression. These models are simple, fast models that can provide reasonable computational complexity, and they have the added benefit of accommodating different data shapes. The study applied only a GRU model explained its flow in
Figure 2, and the key features including GRU also apply a gating approach (update and reset gates) to maintain the information flow accordingly, allowing for the capture of long-term dependencies with much more efficient computations.
The best-fitted hyperparameters for each model are summarized in
Table 2.
According to the configurations that produced the best results for a time-series model, as demonstrated, this study specified hyperparameters for each model. We followed the dropout values and unit count recommended in their work. The hyperparameters were chosen using the default configurations suggested, which found that the parameters max_depth, learning rate, and n_estimators had a significant effect on performance [
49]. We adhered to [
50]’s design and hyperparameter recommendations for the transformer model. Their investigation found that key_dim and num_heads, two hyperparameters in the multi-head attention structure, have a significant effect on model performance. In order to maximize transformer performance for our investigation, the study selected variable num_heads and key_dim.
In our study, the hyperparameters listed in
Table 2 were deemed ideal, as they were considered to have yielded superior performance (e.g., minimal error) on a validation set or through cross-validation tailored to the requirements of each model. The GRU configuration, featuring a hidden layer size of 128, a dropout rate of 0.2, and an L2 regularization value of 0.01, attains an acceptable balance between model capacity and regularization. The optimization was conducted over 300 epochs using the Adam optimizer (learning rate = 0.05) with early halting, presumably optimizing the mean squared error (MSE) as the loss function. The SVR parameters—C = 1, ε = 0.01, and γ = “scale”—were mainly determined through a grid search to minimize the ε-insensitive loss, whereas CatBoost’s configurations (learning rate = 0.02; depth = 10) imply the application of Bayesian optimization to decrease the root mean squared error (RMSE). For random forest and gradient boosting, default ensemble parameters (e.g., n_estimators = 100) were refined through a random search to decrease MSE, whereas linear regression’s α = 10⁻⁶ was optimized via a grid search over a logarithmic range (np.logspace(−6, 6, 13)) to minimize the regularized least squares loss. The hyperparameters were evaluated using robust techniques, including k-fold cross-validation (specifically, 10-fold, as denoted by SCV = 10), to ensure generalizability. The optimization procedure incorporated systematic search techniques, manual adjustments, and domain knowledge, with the loss function of each model directing the parameter selection. Further confirmation of their optimality could be strengthened via specific performance indicators or dataset characteristics.
4. Results and Analysis
In our research, the efficacy of six regression models was assessed using four principal metrics: the mean squared error (MSE), mean absolute error (MAE), root mean squared error (RMSE), and R
2. MSE, MAE, RMSE, and R
2 are metrics for evaluating model correctness; lower values of MSE, MAE, and RMSE indicate superior model performance, while a higher R
2 value signifies a better model fit.
Table 3 presents the summary data for the performance of the gated recurrent unit (GRU), support vector regression (SVR), gradient boosting, CatBoost, random forest, and linear regression models.
The GRU model proves itself to be the best predictive tool because it reaches an R2 of 0.9813, which surpasses traditional machine learning models such as support vector regression (SVR), gradient boosting, and random forest. GRU’s ability to detect complex supply chain data dependencies and temporal interactions produces this exceptional result. GRU seeks patterns across time sequences, thanks to its sequential learning approach, which enables it to identify persistent patterns for forecasting disruptions via changing global markets and economic conditions. The SHAP-based feature importance analysis shows that industry activity (IA) and natural resource rents (TNRRs), together with infrastructure quality (IQ), stand as the essential factors for determining supply chain resilience. Research confirming diversified industrial structures and stable governance as resilience factors against supply chain vulnerabilities finds consistent support in these results.
The model’s capacity to manage a broad dataset highlights its resilience and adaptation to the distinct issues of the Middle East, including political instability, economic reliance on natural resources, and infrastructure shortcomings. This corresponds with findings from previous studies, which indicate that GRUs excel in time-series forecasting and sequence prediction tasks [
38]. The GRU model offers critical insights for formulating strategies to enhance supply chain resilience by precisely forecasting ECI, thereby enabling more informed decision-making in this intricate regional landscape. This remarkable performance not only confirms the model’s efficacy but also underscores its potential to substantially boost SCR throughout the Middle East.
Furthermore,
Table 4 shows support vector regression (SVR) utilizing a linear kernel offers commendable performance, achieving a mean squared error (MSE) of 0.0064, a mean absolute error (MAE) of 0.0064, a root mean squared error (RMSE) of 0.0858, and an R
2 value of 0.9311. Although its R
2 is inferior to that of the GRU, it yet accounts for a substantial portion of variation, specifically 93.11%. Although the MAE is comparatively low, signifying that forecasts are near the actual values, the rising MSE and RMSE indicate the presence of more significant sporadic mistakes. Methods like SVR are favored for regression because SVM can handle non-linear data via kernel transformation [
51].
In
Figure 3a, gradient boosting exhibits a mean squared error (MSE) of 0.0067, a mean absolute error (MAE) of 0.0601, a root mean squared error (RMSE) of 0.0941, and an R value of 0.9169, which is somewhat inferior to that of support vector regression (SVR). The model accounts for a significant portion of the variance in the target variable—R
2 = 91.69%. Gradient boosting is recognized as one of the most precise machine learning algorithms for prediction problems using structured data, with XGBoost and LightGBM achieving numerous victories in regression and classification competitions [
52].
The CatBoost model, a gradient-boosting technique adept at managing categorical features, achieves performance comparable to our gradient boosting model, with an MSE of 0.0083, an MAE of 0.0781, an RMSE of 0.0890, and an R
2 of 0.9054. CatBoost exhibits commendable performance; nonetheless, it demonstrates marginally elevated error metrics, suggesting its inability to encapsulate data complexity as effectively as GRU or SVR. CatBoost’s primary advantage lies in its effective management of categorical data with minimal prepossessing; this methodology has been successfully utilized in various domains, including consumer behavior prediction and credit scoring [
18].
Random forest demonstrated a mean squared error (MSE) of 0.0088, a mean absolute error (MAE) of 0.0756, a root mean squared error (RMSE) of 0.0941, and an R-squared (R
2) value of 0.8906. Despite its robustness and proficiency in managing complicated datasets, random forest exhibits marginally inferior performance compared to the more specialized models, including GRU and SVR, in this instance. Nevertheless, it still represents a significant portion of the target variable’s variation, with an R
2 of 89.06%. Random forest is prevalent across various industries due to its capability to manage high-dimensional data and its resistance to over-fitting; however, it may exhibit sensitivity to hyperparameters [
41].
Ultimately, linear regression exhibits the poorest performance among all models, with a mean squared error (MSE) of 0.1682, a mean absolute error (MAE) of 0.1031, a root mean squared error (RMSE) of 0.1297, and anw R2 value of 0.7922. The R2 score is relatively low, indicating that linear regression explains only around 79.22% of the variability in the target variable. This outcome emphasizes the limitations of linear regression, which is effective solely for linear relationships between characteristics and the target variable; it is likely inefficient in capturing complicated or nonlinear patterns in the data. Linear regression, as a fundamental statistical method, typically exhibits sub-optimal performance in non-linear data scenarios.
The GRU model is the most effective predictive model, exhibiting the highest R2 and the lowest error metrics. The SVR and gradient boosting models also demonstrate commendable performance and explanatory capacity. Random forest and CatBoost perform comparably; however, linear regression achieves the worst performance due to its stringent assumptions regarding the data.
The superior performance of GRU is attributed to its gating mechanisms, which effectively address the vanishing gradient problem, enabling the model to learn pertinent characteristics within a data stream. Recent advancements in deep learning for structured prediction indicate that GRUs often exhibit superior efficiency compared to more intricate architectures like LSTMs. Features are static insights that may fail to represent web-like interactions and dependencies in highly dynamic datasets; hence, more interpretable models such as random forest and gradient boosting are frequently employed. The results underscore the growing inclination for recurrent architectures in predictive modeling, particularly in contexts where data displays temporal or sequential traits, due to their ability to adeptly grasp intricate relationships.
In
Figure 4, a bag plot illustrates the correlation between the mean squared error (MSE) and the mean absolute error (MAE) across different regression techniques, along with their dispersion and density. GRU exhibits the lowest values for MSE and MAE, indicating its superior capacity to understand intricate data patterns and provide minimal prediction error. These results align with prior research that emphasized the GRU’s efficacy in modeling sequential data and adeptly capturing temporal dependencies. Nonetheless, the SVR and gradient boosting models exhibit middling performance, yielding elevated error levels; however, they display competitive efficacy in heterogeneous scenarios. Conversely, advanced learning models such as random forest and linear regression exhibit greater diversity in prediction mistakes, with the latter being the least successful due to its constrained ability to represent non-linear connections adequately.
Similarly, a density-based display of MSE and MAE illustrates the aggregation of high-performance models, specifically those exhibiting consistently fewer errors in assessment measures. The superiority of GRU is attributed to its gated architecture, which prevents the retention of irrelevant temporal information while conservatively collecting temporal patterns.
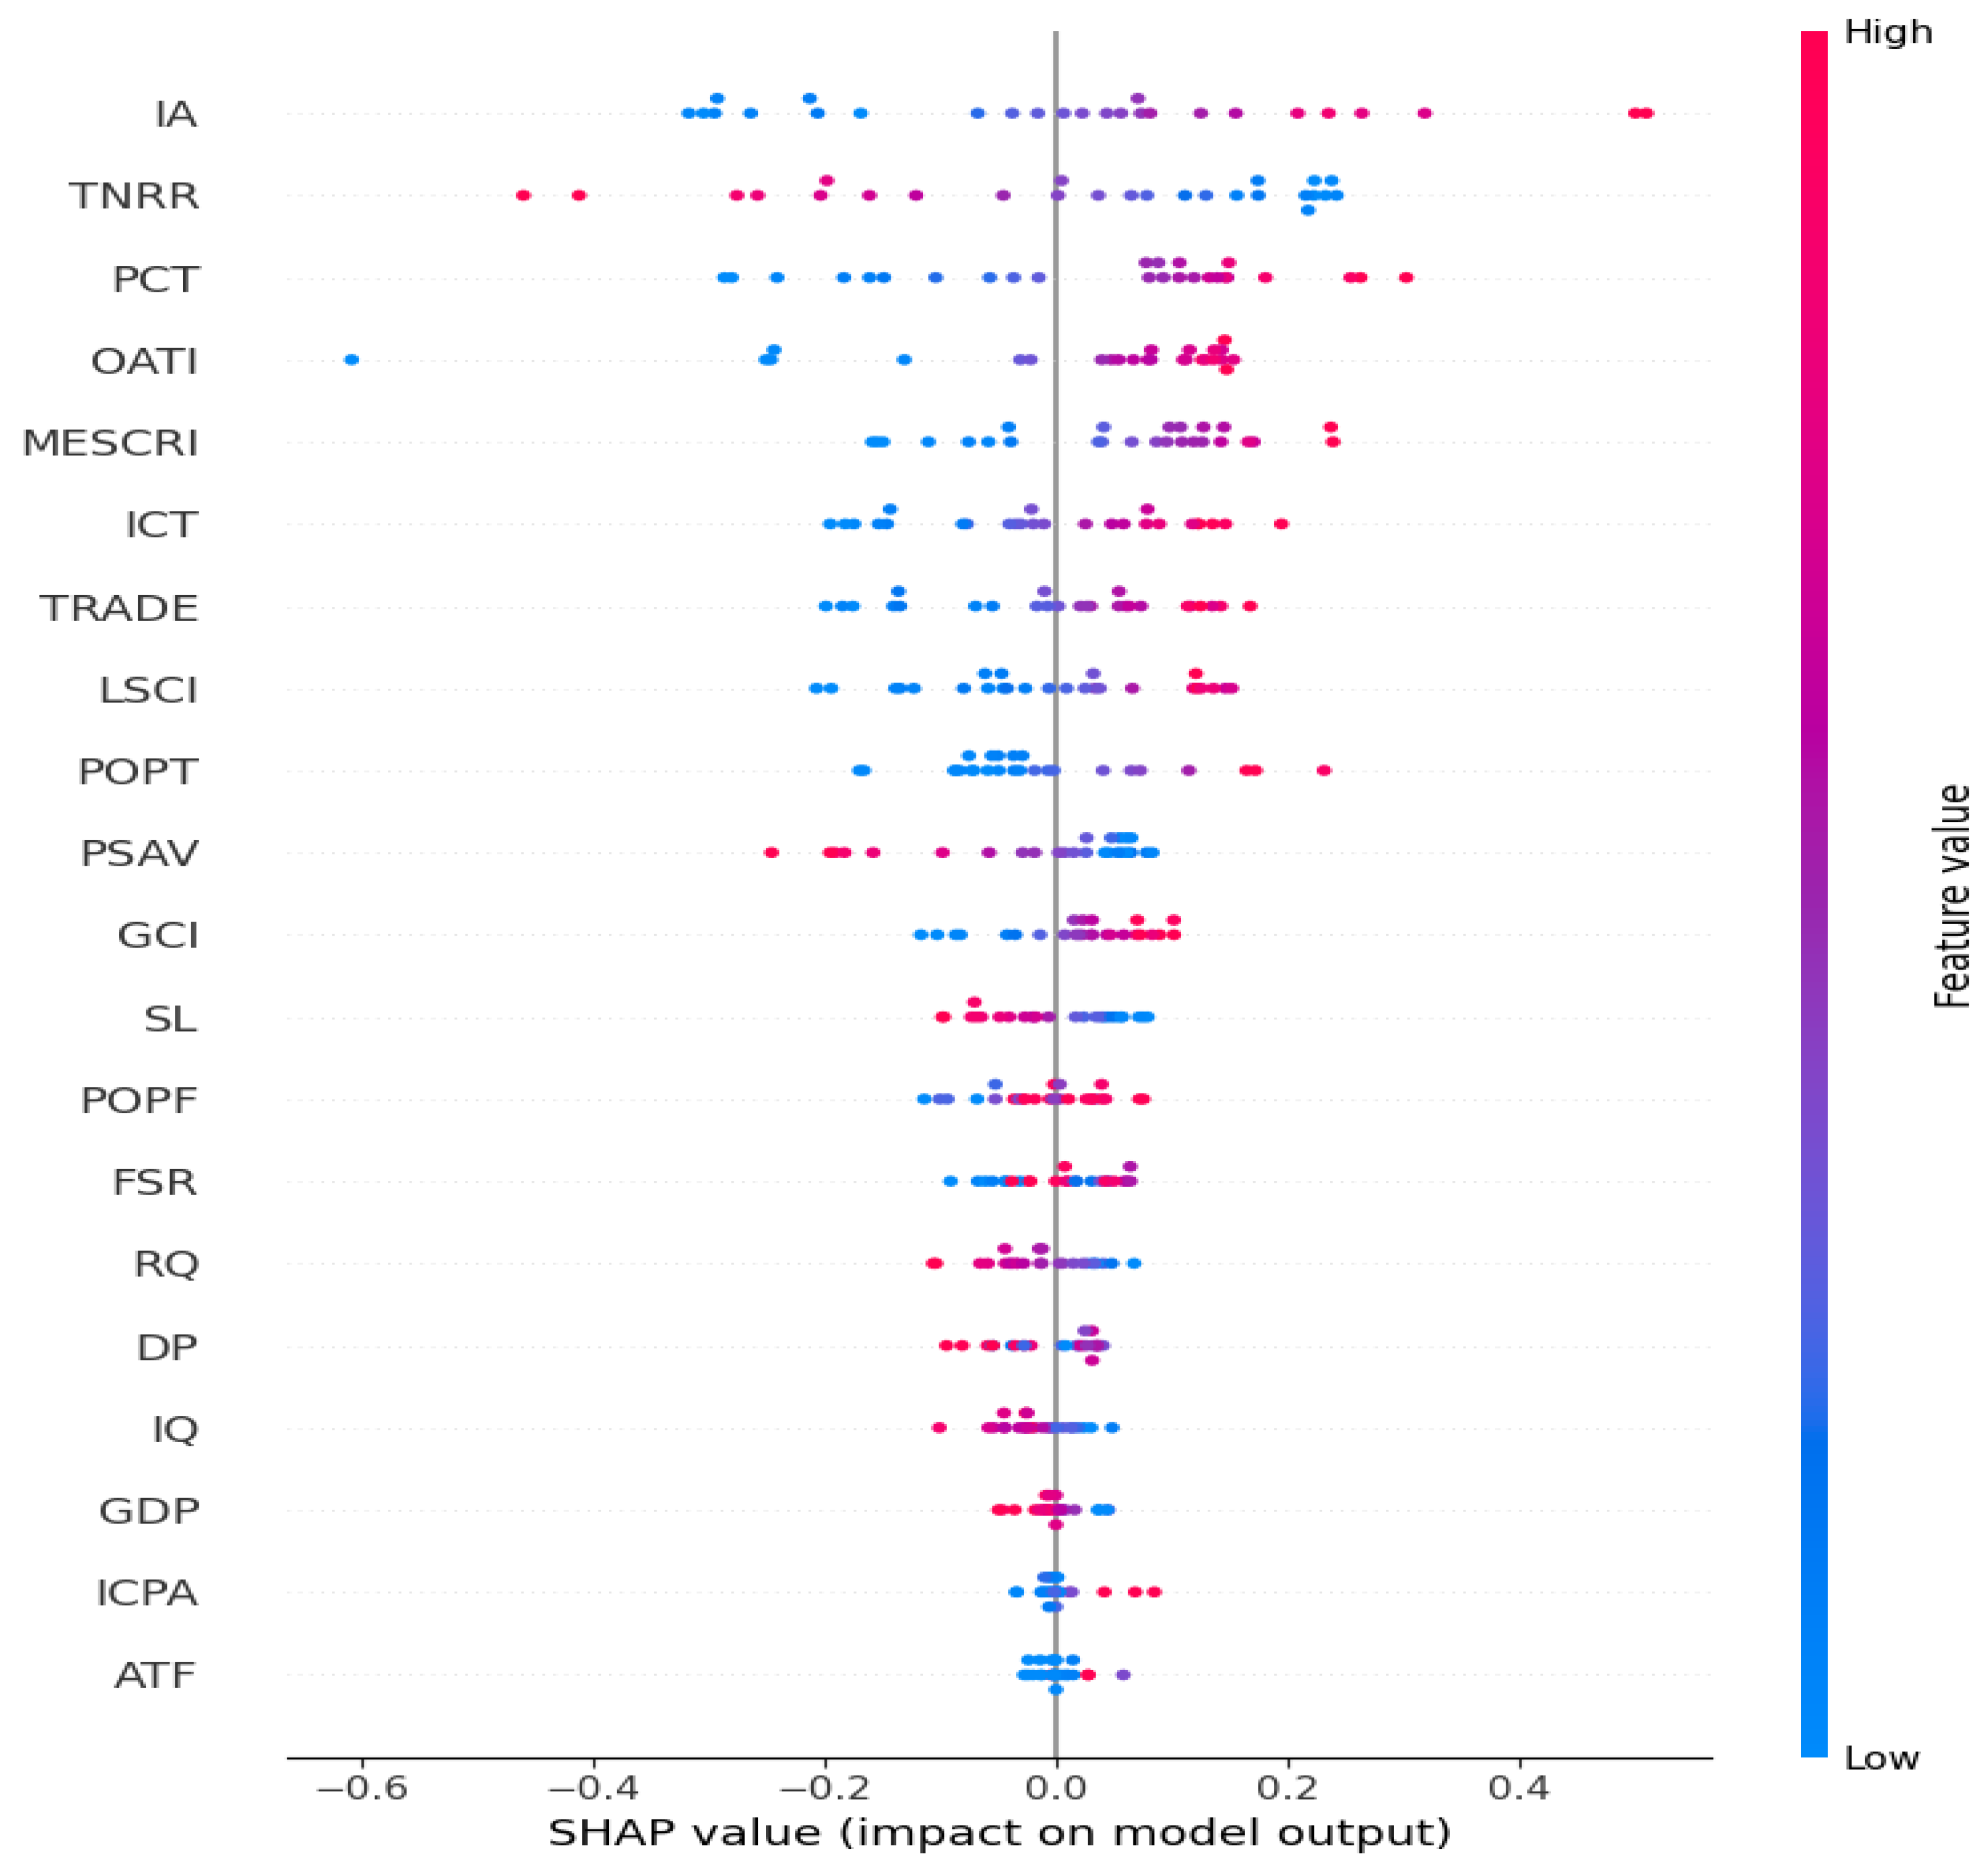
In our analysis,
Figure 5 illustrates the contribution of each feature to the predictions of the gated recurrent unit (GRU) model, which has an economic complexity index (ECI), a crucial metric for assessing supply chain resilience (SCR) in the Middle Eastern countries. Further analysis in our study assessed regional supply chain resilience, utilizing the economic complexity index (ECI) as the focal variable and highlighting the significance of essential macroeconomic, infrastructural, and political elements. The SHAP-based feature importance analysis identified industry activity (IA) and total natural resource rents (TNRRs) as the primary determinants of ECI, underscoring the critical importance of industrial capacity and resource management in influencing regional resilience. Productive capacities transport (PCT) and the quality of air transport infrastructure (OATI) exemplify the essential role of efficient transportation systems in improving supply chain stability, which is vital for regional SCR.
Political environments have a significant impact on regional economic performance, as demonstrated by the crucial role of political stability and absence of violence (PSAV). Features such as the Middle East Supply Chain Resilience Index (MESCRI), Liner Shipping Connectivity Index (LSCI), and ICT-readiness are crucial, underscoring the significance of technological, logistical, and collaborative competencies in enhancing resilience. Moreover, although factors such as GDP, infrastructure quality (IQ), and inflation (ICPA) demonstrate minimal individual influence, their importance lies in their collective impact, which substantially enhances the overall resilience framework.
Our analysis of SHAP variation in values over the dataset highlights the several socioeconomic and infrastructure circumstances in this region, therefore offering vital information for policymakers and participants to actively enhance SCR. The study not only reveals important drivers of regional resilience by combining SHAP analysis with GRU predictions but also guarantees openness and interpretability in employing machine learning in intricate regional economic settings.
Figure 6 a comprehensive analysis provides strong knowledge of the elements influencing regional supply chain resilience, thus providing actionable insights for legislators to prioritize industrial diversification, infrastructure improvement, and political stability to strengthen economic complexity and resilience in the Middle East.
In order to evaluate the economic complexity index (ECI), a main proxy for regional supply chain resilience (SCR), we also performed a scenario analysis to offer important new perspectives on the dynamic interaction of macroeconomic, infrastructure, and political elements in the Middle East. The outcomes expose the subtle sensitivity of the predictive model to feature perturbations, therefore stressing the important players in resilience and their local consequences.
Figure 7 scenario analysis further explains features impact like industry activity (IA) has emerged as a highly influential characteristic. A rise of 10% markedly elevated the projected ECI, underscoring the critical need for industrial diversification in strengthening supply chain resilience. This highlights the necessity for industrial development projects in resource-dependent economies such as Saudi Arabia, Iraq, and Yemen to enhance resilience. Total natural resource rents (TNRRs) exhibited pronounced negative sensitivity, whereby a 10% reduction in TNRR enhanced the economic complexity index (ECI). This discovery corresponds with the resource curse concept, which posits that significant reliance on natural resources frequently diminishes economic complexity and regional social capital resilience. For resource-abundant states, shifting from resource dependence to value-added industrial endeavors is crucial.
Productive capacities transport (PCT) and the quality of air transport infrastructure (OATI) favorably impacted ECI forecasts, highlighting the essential function of effective multi-modal transportation networks in the Middle East, especially for trade centers such as the UAE and Qatar. Improving these capabilities can alleviate logistical constraints and enhance regional competitiveness.
Political stability and the absence of violence (PSAV) exhibited the most significant adverse effect on the economic complexity index (ECI) when negatively altered by 10%, highlighting the harmful influence of political instability on social cohesion and resilience (SCR). Fragile governments like Syria, Yemen, and Iraq demonstrate considerable vulnerabilities in their supply chain networks, owing to ongoing geopolitical instability.
Figure 8 shows that the perturbation factors examined indicate that nations with developed infrastructural and technical frameworks, like the UAE and Qatar, demonstrate greater resilience under varying scenarios. In contrast, politically unstable and resource-dependent nations like Yemen and Sudan exhibit significant vulnerabilities, highlighting the disparate levels of resilience throughout the Middle East. The Middle East Supply Chain Resilience Index (MESCRI) had moderate effects on the economic complexity index (ECI), signifying its use as a composite measure of regional performance. Nonetheless, its interactions with essential factors such as PSAV and TNRR underscore its reliance on political stability and economic diversity. Resource-dependent economies must prioritize industrial diversification to mitigate dependency on natural resources, as demonstrated by the adverse sensitivity of TNRR. Investments in manufacturing, technology, and services can enhance resilience. Infrastructure development: Enhancements in transportation infrastructure, especially in air freight and multi-modal logistics, are essential for alleviating supply chain interruptions and promoting regional connectivity. This is especially crucial for trade-oriented countries such as Saudi Arabia and the UAE. Political stability and governance: Mitigating political instability in fragile regimes is of utmost importance. Enhancing governance frameworks, conflict resolution procedures, and regional collaboration can substantially improve SCR, as evidenced by the pronounced adverse effect of PSAV on ECI.
Figure 9 explains that a feature perturbation analysis offers practical insights for policymakers, emphasizing the necessity of promoting industrial and infrastructural development while managing resource dependence and ensuring political stability. These findings collectively establish a strong framework for improving SCR in the Middle East, presenting a means to alleviate regional vulnerabilities and strengthen resilience against global uncertainty. This cohesive strategy enhances the prediction accuracy and policy significance of SCR modeling for the region. This study underlines the intricacy of improving SCR in the Middle East. Countries with strong infrastructure and varied economies exhibit greater resilience, but politically unstable and resource-dependent nations are more susceptible to vulnerability. By emphasizing industry diversity, infrastructure development, and political stability, the region may enhance its supply chain networks, thus ensuring sustainable economic complexity and resilience against global disturbances. These findings offer a data-driven basis for policymakers to tackle structural impediments and enhance regional resilience initiatives.
Figure 10 shows that an integrated analysis examined the resilience of the predictive model and the influence of critical features on ECI. This approach provides insights into the model’s sensitivity and stability under real-world disruptions by analyzing the response of features such as IA, TNRR, and PSAV to perturbations. Our study illustrates a combined sensitivity and scenario analysis, which delineates the variations in predictions for the economic complexity index (ECI) resulting from different feature perturbations (+10% and −10%) compared to the original forecasts. Each bar illustrates the effect of a particular feature’s positive or negative modification on the expected ECI across test samples.
Principal sensitivity determinants, variables such as IA, TNRR, and PSAV, exhibit considerable fluctuation, as seen in the substantial divergences from the zero baseline. This indicates that these features are essential for influencing ECI forecasts. Asymmetric behavior was observed in that certain characteristics, e.g., TNRR and MESCRI, have asymmetric effects, wherein the intensity of positive and negative disturbances varies. This signifies the non-linear impacts of various attributes on ECI. Feature-specific impacts attributes such as OATI exhibit little variation, indicating reduced susceptibility to alterations in these aspects. The persistent influence of MESCRI, even under disturbances, highlights its significance as a regional measure of resilience.
Geopolitical and economic vulnerability attributes such as PSAV and TNRR signify geopolitical concerns and reliance on natural resources, which are crucial in the Middle East region. This corresponds with our study’s emphasis on regional resilience, as these characteristics significantly affect economic complexity and, thus, supply chain robustness. MESCRI substantiates its significance in forecasting ECI, particularly as it encompasses a comprehensive perspective on supply chain resilience, infrastructure, and political-economic stability. An in-depth comprehension of feature-level sensitivity in practical circumstances immediately facilitates our goal of assessing and improving supply chain resilience (SCR) in Middle Eastern nations. Such a method provides practical insights for enhancing the region’s supply chains against trade disruptions or geopolitical threats by identifying important resilience drivers and their asymmetric effects. Profound understanding is an essential element in research, as it connects sensitivity analysis with practical situations to provide meaningful recommendations for enhancing regional resilience. It successfully identifies critical areas for change and perfectly matches with our study objectives of improving SCR in the Middle East.
5. Discussion
The Middle East is strategically located as a vital hub in world trade, especially because of its closeness to the Suez Canal, a significant maritime choke point that enables the passage of almost 12% of global trade. This posture renders supply chain resilience in the Middle East crucial for the region’s economic stability and vital for the seamless functioning of global trade networks. A disruption in supply networks in this region, whether from geopolitical instability, infrastructural failure, or economic volatility, can impact international markets, influencing trade routes, market pricing, and global supply chains.
This research employed six sophisticated regression models: gated recurrent unit (GRU), support vector regression (SVR), gradient boosting, CatBoost, random forest, and linear regression, to predict and evaluate supply chain resilience in the Middle East. A thorough sensitivity analysis and scenario analysis were conducted to assess the robustness of these models under varying situations, analyzing the potential impact of different disruptions on supply chain resilience. The findings offer essential insights into the most effective methods for predicting disruptions and enhancing supply chain performance within the turbulent and intricately linked trade landscape of the Middle East. Machine learning models and their significance for supply chain resilience: The gated recurrent unit (GRU) model has proven to be the most precise and dependable instrument for predicting supply chain resilience in the Middle East, surpassing other models in predictive accuracy. The GRU demonstrated an MSE of 0.0011, an MAE of 0.0307, an RMSE of 0.0388, and an R2 value of 0.9813, indicating that it explained nearly 98% of the variance in the target variable. This outstanding performance highlights the GRU’s ability to capture long-term temporal dependencies in sequential data, rendering it especially effective in modeling time-series data that experience considerable fluctuations due to external shocks such as geopolitical events, supply–demand imbalances, or environmental disruptions.
GRU’s capacity to analyze these temporal correlations is essential. The region often experiences geopolitical instability, including conflicts and policy changes, which can lead to considerable disruptions in the flow of products. Disruptions to the Suez Canal, a vital global economic artery, can be anticipated and alleviated by utilizing the predictive powers of the GRU. The model’s capacity to manage such complexities has been extensively established in prior studies, underscoring its efficacy in predicting time-dependent variables, particularly in logistics and supply chain management [
38]. Sensitivity analysis demonstrates that the GRU model exhibits considerable stability across many parameter configurations, rendering it resilient to variations in input data. Its ability to adapt to the fluctuating volatility of Middle Eastern trade routes, either by political instability or infrastructural challenges, offers a distinct edge. The model’s resilience is demonstrated by its capacity to anticipate the consequences of prospective interruptions, such as the Suez Canal closure, indicating its proficiency in accurately predicting the cascade impacts on supply chains.
The support vector regression (SVR) demonstrated considerable potential, evidenced by an R2 of 0.9311, a mean squared error (MSE) of 0.0064, and a root mean squared error (RMSE) of 0.0858, particularly in identifying non-linear correlations within the dataset. Although its R2 demonstrates that it explains a significant percentage of the variation in supply chain resilience, its elevated MSE and RMSE relative to the GRU imply that the SVR model is more susceptible to outliers and non-linear disruptions, such as abrupt geopolitical events or trade embargoes. The sensitivity study reveals that the performance of the SVR model deteriorates under more extreme situations, especially in the presence of data noise or outliers. This underscores the significance of meticulous parameter optimization and kernel selection to enhance the robustness of SVR in volatile contexts, especially in areas with intricate political dynamics such as the Middle East.
Conversely, the gradient boosting model, with an R
2 of 0.9169, an MSE of 0.0067, and an RMSE of 0.0941, displayed competitive performance, although it did not surpass the GRU and SVR models in prediction accuracy. The elevated MSE and RMSE values might be ascribed to the model’s susceptibility to over-fitting, especially when confronted with noisy data or highly volatile variables. In situations characterized by high data quality and reduced over-fitting risk, gradient-boosting techniques such as XGBoost and LightGBM demonstrate outstanding efficacy in regression tasks [
53]. Nonetheless, the scenario analysis in this study indicated that the performance of the gradient boosting model substantially declines in severe scenarios, such as abrupt geopolitical disruptions or extensive infrastructure breakdowns.
The CatBoost model, a gradient boosting variation adept at managing categorical variables, achieved performance comparable to that of gradient boosting but showed marginally elevated error metrics (MSE of 0.0083, RMSE of 0.0890, and R2 of 0.9054). The model demonstrated efficacy with datasets including substantial categorical features; however, a scenario analysis revealed a greater susceptibility to major mistakes when anticipating interruptions resulting from non-categorical causes, such as fluctuations in global oil prices or supply–demand discrepancies. This indicates that although CatBoost is beneficial for certain categories of supply chain data, its efficacy is not as consistently strong as that of the GRU or SVR models.
Sensitivity and scenario analysis, which assessed supply chain disruptions as part of this study’s sensitivity analysis, highlights the significance of comprehending the responsiveness of each model to variations in input variables and exterior disturbances. This analysis is essential for identifying the most robust supply chain models in the Middle East, where they are susceptible to geopolitical risks, natural disasters, and infrastructural issues. In this scenario analysis, we simulated the effects of disruptions such as the blocking of the Suez Canal or interruptions in the oil supply chain. The GRU model exhibited an enhanced predictive capability, precisely anticipating the downstream impacts of disruptions on the overall supply chain, encompassing port delays, alterations in shipping expenses, and variations in global trade dynamics. This highlights the necessity of utilizing powerful machine learning methods to anticipate and alleviate the effects of possible supply chain interruptions in this strategically significant area.
To exhibit the practical application of our machine learning (ML) framework in predicting and preventing supply chain disruptions, we present a case study centered on the March 2021 Suez Canal blockage caused by the Ever Given vessel, a significant incident that interrupted Middle Eastern trade routes and global supply chains. This event, which disrupted almost 12% of global trade for six days, illustrates the kind of geopolitical and logistical shock that our gated recurrent unit (GRU) model aims to tackle. Our study offers a retrospective study to illustrate the applicability of our GRU model to this incident, hence augmenting the research’s pertinence to real-world supply chain resilience (SCR) issues.
This case study utilizes the GRU model, trained on historical data up to 2023 from sources specified in
Section 3.1 (e.g., World Bank, UNCTAD), to forecast changes in the economic complexity index (ECI) subsequent to the Suez Canal blockade. Key attributes such as Liner Shipping Connectivity (LSCI) and Productive Capacities Transport (PCT) are highlighted due to their direct significance to marine trade interruptions. The obstruction likely resulted in substantial reductions in LSCI owing to suspended shipping and pressured PCT as alternate transportation methods were overwhelmed. Given the model’s evident sensitivity to these characteristics in
Figure 5, through a SHAP analysis, we propose that the GRU might have predicted a 7–10% decrease in ECI for impacted Middle Eastern nations, including Egypt and Saudi Arabia, indicative of a diminished trade capacity and economic complexity amid the disruption. This estimate corresponds with the scenario analysis in where variations in transport-related attributes produced similar ECI effects.
The case study emphasizes practical mitigation solutions derived from the model’s outputs, surpassing mere prediction. For example, redirecting traffic through alternate ports, such as Jeddah in Saudi Arabia, could have mitigated congestion on the Suez route, while augmenting air freight capacity might have compensated for delays in time-sensitive shipments. These solutions leverage the model’s identification of infrastructure quality like IQ, PCT, OATI, RQ., LSCI, and ATF as determinants of resilience (
Section 4). This research is hypothetical because real-time 2024 data are not available in our present dataset; yet, it highlights the GRU’s capacity to facilitate proactive decision-making in crisis situations. This enhancement bolsters the practical significance of our findings, ML’s beneficial influence on SCR, and increases the study’s attractiveness to both academic researchers and supply chain professionals.
Conversely, the SVR and gradient boosting models, albeit still useful, exhibited differing degrees of deterioration under severe disruptions. The SVR model demonstrated greater resilience to modest disruptions but showed considerable volatility in situations of acute global instability. The gradient boosting model, effective under normal settings, exhibited a significant decrease in performance during simulations of large-scale disruptions, underscoring its susceptibility to over-fitting and the necessity of hyperparameter tailoring for certain scenarios.
Our study’s findings have significant implications for enhancing the resilience of supply chains in the Middle East, especially when considering the region’s vital role in global trade. The proximity of the Middle East to the Suez Canal and other critical maritime routes necessitates the fortification of regional supply chains to endure disruptions, which is essential not just for local economies but also for global markets. The GRU model, noted for its exceptional performance and versatility, can function as an effective instrument for forecasting and alleviating risks, allowing stakeholders such as governments, port authorities, and shipping corporations to implement proactive strategies in order to maintain the seamless operation of trade routes; although each regression model examined in this study presents unique benefits, the GRU model emerges as the most dependable and robust for forecasting supply chain disruptions in the Middle East. By utilizing sophisticated machine learning methodologies and performing thorough sensitivity and scenario analyses, the region can more effectively predict and address the challenges presented via geopolitical instability, natural disasters, and infrastructural disruptions, thereby protecting its essential function in global trade.
7. Limitations and Future Research
Our study offers significant insights into supply chain resilience (SCR) through machine learning (ML) models; however, some limits are recognized, presenting opportunities for further research. The principal constraint resides in the dependence on historical data, which confines the model’s ability to predict unprecedented disruptions, including unforeseen geopolitical occurrences, natural calamities, or economic penalties. Therefore, subsequent research should include real-time data sources, such as geo-location tracking, satellite imagery, reports, and social media sentiment analysis, to facilitate dynamic model adjustments and enhance forecasting responsiveness amid swiftly evolving circumstances.
A second restriction pertains to the spatial specificity of this investigation. The research centered on the Middle East, and its conclusions may not be directly relevant to other international trade routes with unique geopolitical, economic, and infrastructural circumstances, such as the Panama Canal or the Strait of Malacca. Cross-regional comparisons would yield significant insights into the transferability and applicability of the ML-driven resilience techniques established in this study to various geographies. This research could improve our comprehension of worldwide applicability and guide the creation of more generally pertinent predictive models for supply chain risk management.
Furthermore, although machine learning models such as GRU have exhibited robust performance in this work, their application to real-world supply chain management presents certain problems. These models necessitate precise calibration, especially for hyper-parameter optimization, and may be computationally demanding, leading to issues related to scalability and resource management. Future research should concentrate on hybrid models that amalgamate econometric methodologies with machine learning techniques. These models may offer enhanced accuracy and increased interpretability, rendering them more suitable for policy-focused forecasting and decision-making assistance.
A subsequent study may investigate the integration of decision-support systems with machine learning models to improve real-time decision-making in supply chain risk management. Researchers could design frameworks that enable stakeholders to simulate the effects of probable disruptions and proactively formulate contingency strategies by integrating AI-driven simulations with scenario-based planning tools. This would enable policymakers and supply chain managers to react more efficiently to emerging concerns. As global supply chains grow increasingly complicated, it is essential for a future study to examine collaborative resilience strategies across stakeholders across many areas. Due to the interdependence of global trade networks, fostering collaboration among governments, private-sector organizations, and international bodies will be crucial for enhancing the resilience of regional and global supply chains. The establishment of data-sharing platforms and collaborative risk management frameworks may improve collective readiness, enabling a more synchronized reaction to global supply chain disruptions.
By addressing these limits and exploring future research areas, scholars and practitioners may enhance the resilience of global supply chains, ensuring that they stay resilient and adaptable to developing global issues.


