
Exploring Consumers’ Technology Acceptance Behavior Regarding Indoor Smart Farm Restaurant Systems: Focusing on the Value-Based Adoption Model and Value–Attitude–Behavior Hierarchy


Abstract
1. Introduction
2. Literature Review and Hypothesis Development
2.1. ISFR System
2.2. Value–Based Adoption Model (VAM)
2.3. Benefit Aspects of the ISFR System
2.3.1. Perceived Naturalness
2.3.2. Psychological Benefit
2.3.3. Healthy Well-Being
2.3.4. Enjoyment
2.4. Sacrifice Aspects of ISFR
2.4.1. Perceived Cost
2.4.2. Perceived Risk
2.4.3. Food Technophobia
2.5. Value–Attitude–Behavior Hierarchy (VAB)
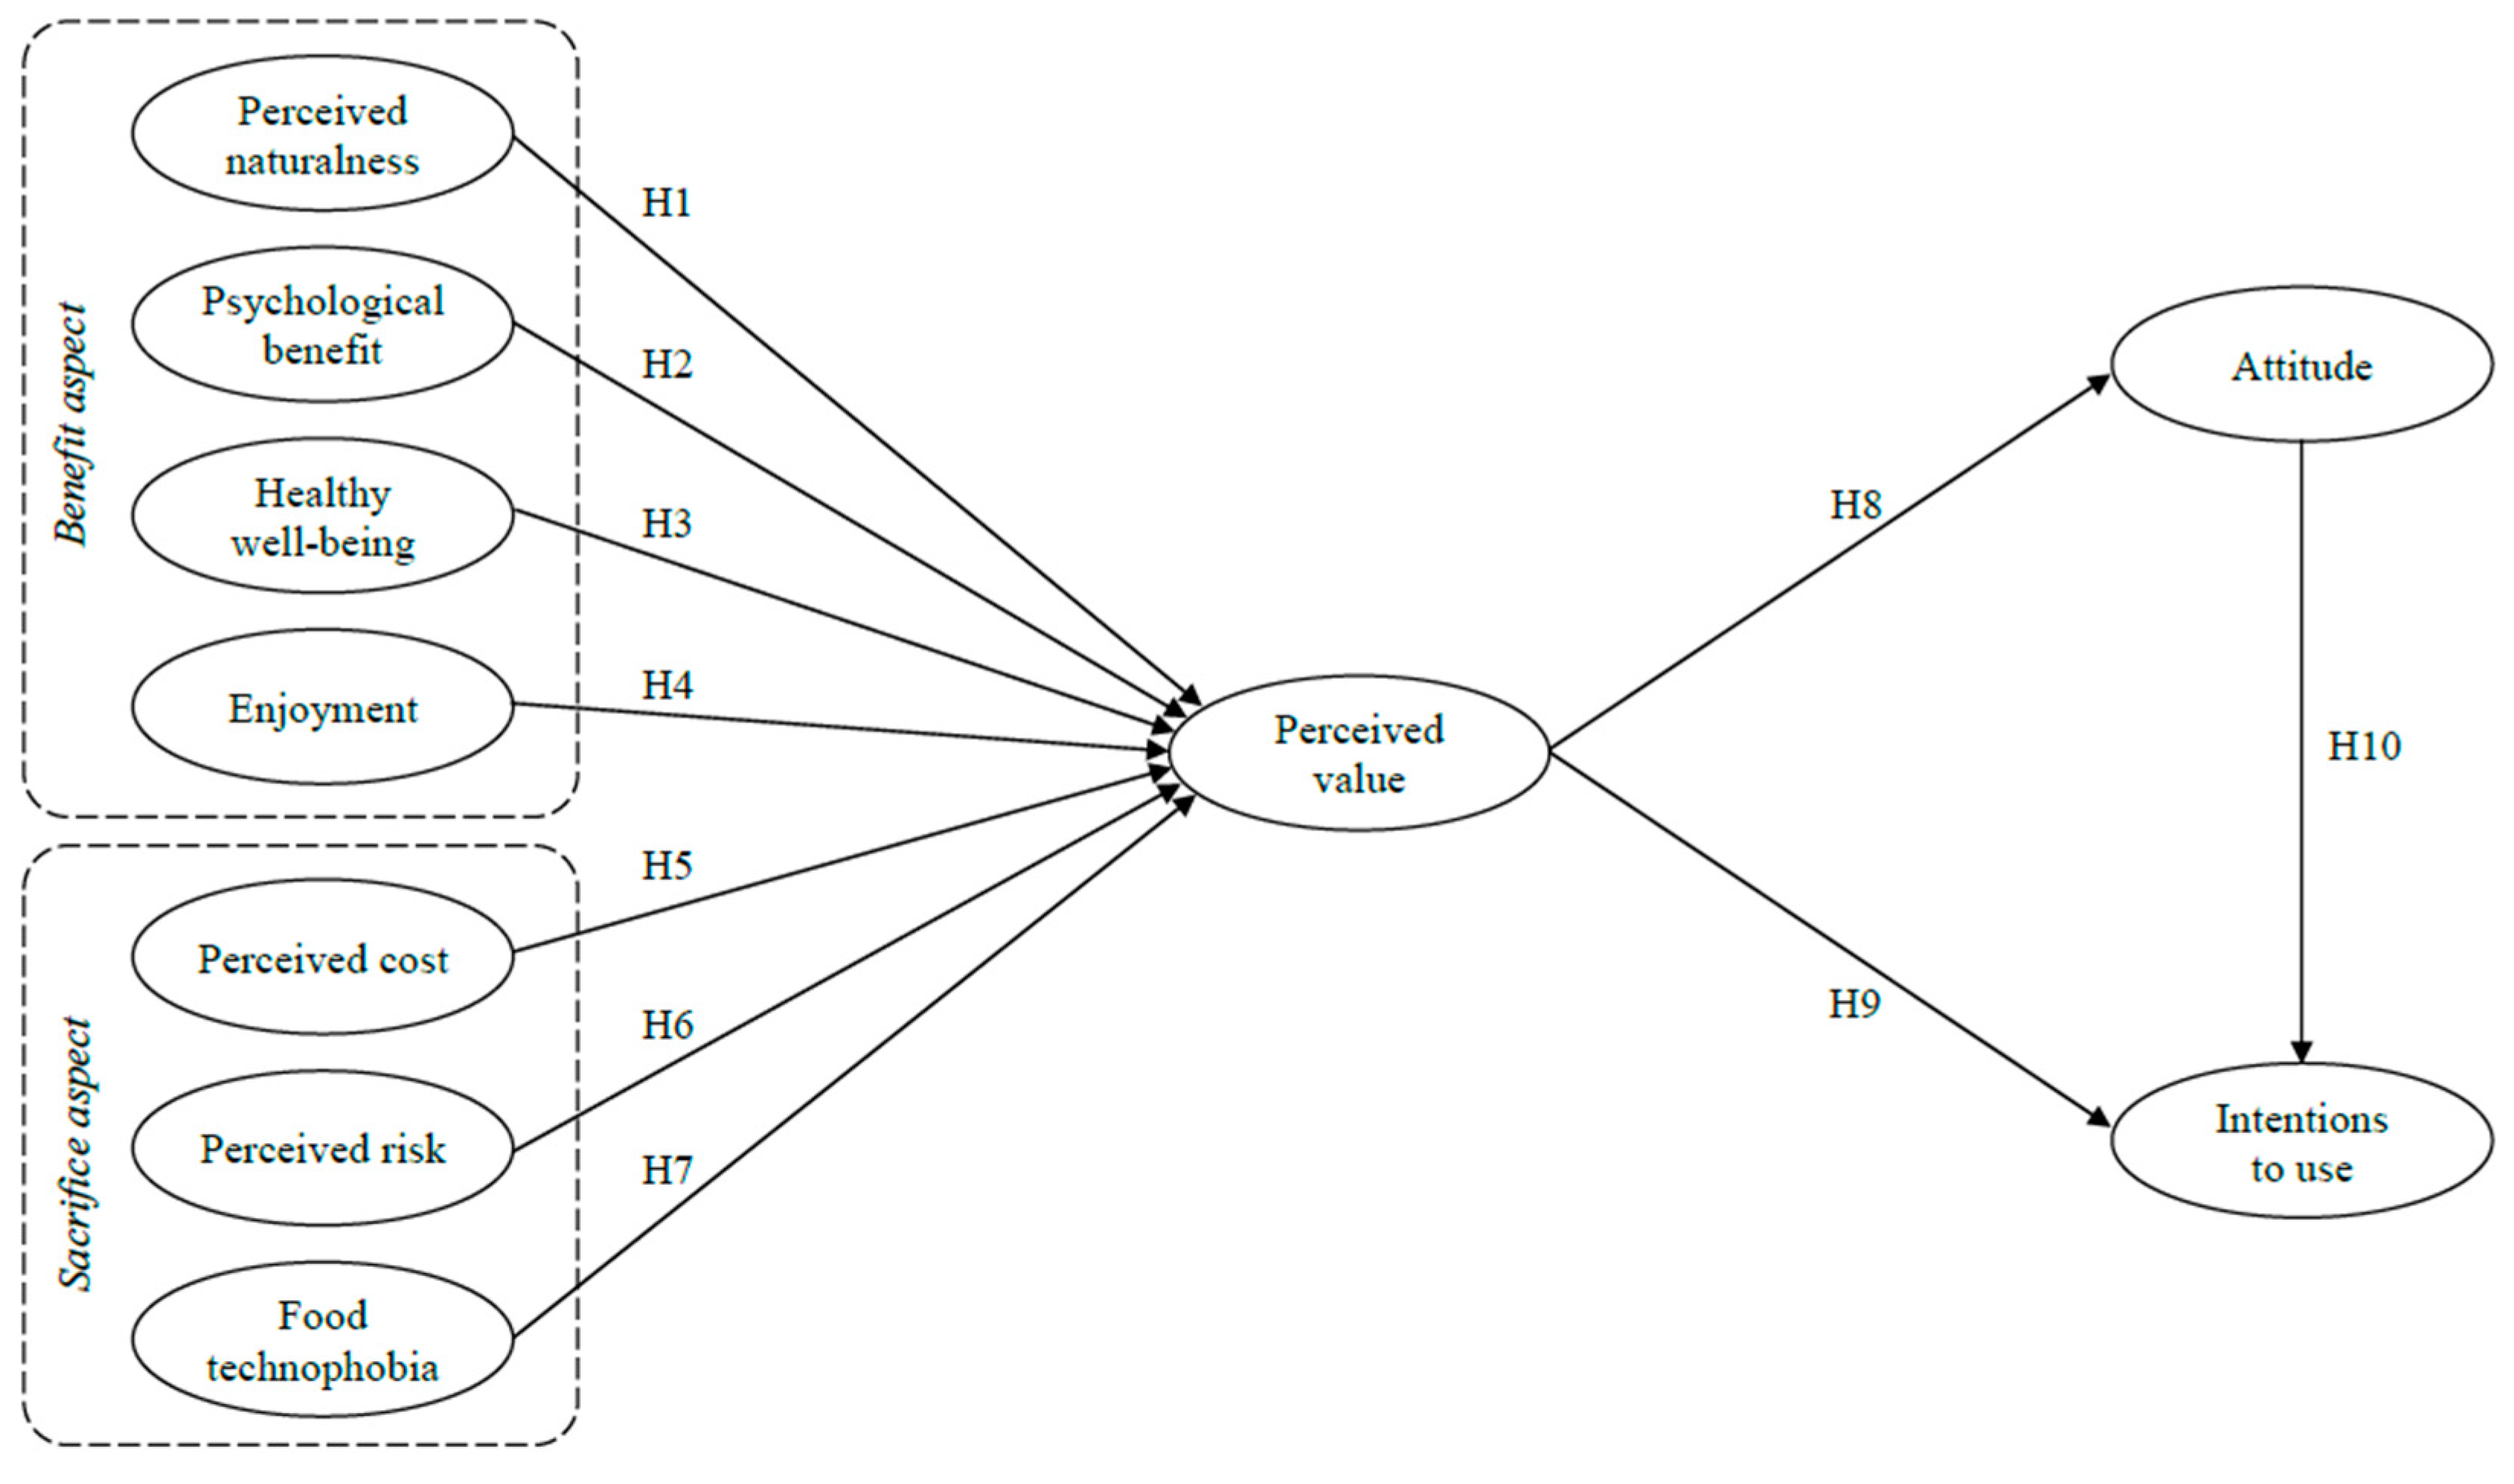
2.6. Proposed Research Model
3. Methods
3.1. Instruments
3.2. Sampling
4. Data Analysis
4.1. Descriptive Statistics
4.2. Confirmatory Factor Analysis (CFA)
4.3. Structural Equation Modeling (SEM)
5. Conclusions and Discussions
5.1. Discussions
5.2. Theoretical Contributions
5.3. Practical Implications
5.4. Limitations and Further Study Opportunities
5.5. Conculsions
Author Contributions
Funding
Institutional Review Board Statement
Informed Consent Statement
Data Availability Statement
Acknowledgments
Conflicts of Interest
References
- Joo, K.; Lee, J.; Hwang, J. NAM and TPB approach to consumers’ decision-making framework in the context of indoor smart farm restaurants. Int. J. Environ. Res. Public Health 2022, 19, 14604. [Google Scholar] [CrossRef] [PubMed]
- Lin, X.; Sun, S.; Manogaran, C.; Rawal, B.S. Advanced energy consumption system for smart farm based on reactive energy utilization technologies. Environ. Impact Assess. Rev. 2021, 86, 106496. [Google Scholar] [CrossRef]
- Lykogianni, M.; Bempelou, E.; Karamaouna, F.; Aliferis, K.A. Do pesticides promote or hinder sustainability in agriculture? The challenge of sustainable use of pesticides in modern agriculture. Sci. Total Environ. 2021, 795, 148625. [Google Scholar] [CrossRef]
- Dhiman, S.; Yadav, A.; Debnath, N.; Das, S. Application of core/shell nanoparticles in smart farming: A paradigm shift for making the agriculture sector more sustainable. J. Agric. Food Chem. 2021, 69, 3267–3283. [Google Scholar] [CrossRef] [PubMed]
- O’Shaughnessy, S.A.; Kim, M.; Lee, S.; Kim, Y.; Kim, H.; Shekailo, J. Towards smart farming solutions in the US and South Korea: A comparison of the current status. Geogr. Sustain. 2021, 2, 312–327. [Google Scholar]
- BBC. A Subterranean Farm Deep Inside a South Korean Subway Station May Unlock the Secret to Food Sustainability. Available online: https://www.bbc.com/travel/article/20200723-is-underground-farming-the-future-of-food (accessed on 10 January 2023).
- Gastgewerbe. Ein Quadratmeter Genügt: Vertical Farming in Hotel and Restaurant. Available online: https://gastgewerbe-magazin.de/ein-quandratmeter-genuegt-vertical-farming-in-hotel-und-restaurant-42198 (accessed on 10 January 2023).
- Williams, S. Vertical Farms Nailed Tiny Salads. Now They Need to Feed the World. Available online: https://www.wired.co.uk/article/vertical-farms (accessed on 10 January 2023).
- Yépez-Ponce, D.F.; Salcedo, J.V.; Rosero-Montalvo, P.D.; Sanchis, J. Mobile robotics in smart farming: Current trends and applications. Front. Artif. Intell. 2023, 6, 1213330. [Google Scholar] [CrossRef] [PubMed]
- Gopal, S.R.; Prabhakar, V.S.V. Intelligent edge based smart farming with LoRa and IoT. Int. J. Syst. Assur. Eng. Manag. 2024, 15, 21–27. [Google Scholar] [CrossRef]
- Davis, F.D. Perceived usefulness, perceived ease of use, and user acceptance of information technology. MIS Q. 1989, 13, 319–340. [Google Scholar] [CrossRef]
- Kim, H.W.; Chan, H.C.; Gupta, S. Value-based adoption of mobile internet: An empirical investigation. Decis. Support Syst. 2007, 43, 111–126. [Google Scholar] [CrossRef]
- Thaler, R. Mental accounting and consumer choice. Mark. Sci. 1985, 4, 199–214. [Google Scholar] [CrossRef]
- Homer, P.M.; Kahle, L.R. A structural equation test of the value-attitude-behavior hierarchy. J. Personal. Soc. Psychol. 1988, 54, 638. [Google Scholar] [CrossRef]
- Al-Chalabi, M. Vertical farming: Skyscraper sustainability? Sustain. Cities Soc. 2015, 18, 74–77. [Google Scholar] [CrossRef]
- Banerjee, C.; Adenaeuer, L. Up, up and away! The economics of vertical farming. J. Agric. Stud. 2014, 2, 40–60. [Google Scholar] [CrossRef]
- Musa, S.F.P.D.; Basir, K.H. Smart farming: Towards a sustainable agri-food system. Br. Food J. 2021, 123, 3085–3099. [Google Scholar] [CrossRef]
- Joo, K.; Kim, H.M.; Hwang, J. Consequences of psychological benefits in the context of eco-friendly indoor smart farm restaurants: The moderating role of curiosity. Sustainability 2023, 15, 15496. [Google Scholar] [CrossRef]
- Tendolkar, A.; Ramya, S. CareBro (Personal Farm Assistant): An IoT based smart agriculture with edge computing. In Proceedings of the International Conference on Multimedia Processing, Communication & Information Technology, Dubai, United Arab Emirates, 26–28 February 2020; pp. 97–102. [Google Scholar]
- Joo, K.; Kim, H.M.; Hwang, J. How to enhance behavioral intentions in the context of indoor smart farm restaurants: Focusing on internal environmental locus of control. J. Travel Tour. Mark. 2023, 40, 260–274. [Google Scholar] [CrossRef]
- Venkatesh, V.; Morris, M.G.; Davis, G.B.; Davis, F.D. User acceptance of information technology: Toward a unified view. MIS Q. 2003, 27, 425–478. [Google Scholar] [CrossRef]
- Zeithaml, V.A. Consumer perceptions of price, quality, and value: A means-end model and synthesis of evidence. J. Mark. 1988, 52, 2–22. [Google Scholar] [CrossRef]
- Davis, F.D.; Bagozzi, R.P.; Warshaw, P.R. User acceptance of computer technology: A comparison of two theoretical models. Manag. Sci. 1989, 35, 982–1003. [Google Scholar] [CrossRef]
- DeLone, W.H.; McLean, E.R. Information systems success: The quest for the dependent variable. Inf. Syst. Res. 1992, 3, 60–95. [Google Scholar] [CrossRef]
- Jacoby, J.; Olson, J.C. Consumer response to price: An attitudinal, information processing perspective. In Moving Ahead with Attitude Research; Wind, Y., Greenberg, M., Eds.; American Marketing Association: Chicago, IL, USA, 1977; pp. 73–86. [Google Scholar]
- Li, H.; Han, J.; Lee, I. Predicting consumption behavior of sport O2O service in Korea and China: Applying value-based adoption model (VAM). Korean J. Phys. Educ. 2022, 61, 1–17. [Google Scholar] [CrossRef]
- Sung, H.A.; Lee, A.J. A study of factors affecting intention to continuous use on smart order service in coffee shop: Focused on value-based adoption model. FoodService Ind. J. 2020, 16, 203–218. [Google Scholar]
- Kim, S.H.; Bae, J.H.; Jeon, H.M. Continuous intention on accommodation apps: Integrated value-based adoption and expectation-confirmation model analysis. Sustainability 2019, 11, 1578. [Google Scholar] [CrossRef]
- Aliperti, G.; Cruz, A.M. Promoting built-for-disaster-purpose mobile applications: An interdisciplinary literature review to increase their penetration rate among tourists. J. Hosp. Tour. Manag. 2020, 44, 193–210. [Google Scholar] [CrossRef]
- Dodds, W.B.; Monroe, K.B.; Grewal, D. Effects of price, brand, and store information on buyers’ product evaluations. J. Mark. Res. 1991, 28, 307–319. [Google Scholar]
- Vishwakarma, P.; Mukherjee, S.; Datta, B. Travelers’ intention to adopt virtual reality: A consumer value perspective. J. Destin. Mark. Manag. 2020, 17, 100456. [Google Scholar] [CrossRef]
- Sung, H.J.; Jeon, H.M. Robot barista service in coffee shops-using expanding the value-based adoption model. FoodService Ind. J. 2022, 18, 7–23. [Google Scholar]
- Badu-Baiden, F.; Kim, S.; Ahn, S.W.; Wong, A.K.F.; Agrusa, J. Analysis of Vegan Restaurant Diners’ Hierarchical Experience Structure by Examining a Vegan Food attribute-benefit-value-intention Linkage. Int. J. Hosp. Tour. Adm. 2022, 25, 505–532. [Google Scholar] [CrossRef]
- Govaerts, F.; Olsen, S.O. Consumers’ values, attitudes and behaviours towards consuming seaweed food products: The effects of perceived naturalness, uniqueness, and behavioural control. Food Res. Int. 2022, 165, 112417. [Google Scholar] [CrossRef]
- Kim, H.M.; Lee, I.H.; Joo, K.; Lee, J.; Hwang, J. Psychological benefits of purchasing home meal replacement in the context of eco-friendly TV home shopping broadcast: The moderating role of personal norm. Int. J. Environ. Res. Public Health 2022, 19, 7759. [Google Scholar] [CrossRef]
- Wilson, E.O. Biophilia; Harvard University Press: Cambridge, MA, USA, 1984. [Google Scholar]
- Roman, S.; Sánchez-Siles, L.M.; Siegrist, M. The importance of food naturalness for consumers: Results of a systematic review. Trends Food Sci. Technol. 2017, 67, 44–57. [Google Scholar] [CrossRef]
- Rozin, P.; Fischler, C.; Shields-Argelès, C. European and American perspectives on the meaning of natural. Appetite 2012, 59, 448–455. [Google Scholar] [CrossRef]
- Etale, A.; Siegrist, M. Food processing and perceived naturalness: Is it more natural or just more traditional? Food Qual. Prefer. 2021, 94, 104323. [Google Scholar] [CrossRef]
- Tenbült, P.; De Vries, N.K.; Dreezens, E.; Martijn, C. Perceived naturalness and acceptance of genetically modified food. Appetite 2005, 45, 47–50. [Google Scholar] [CrossRef]
- Hartmann, P.; Apaolaza-Ibáñez, V. Virtual nature experiences as emotional benefits in green product consumption: The moderating role of environmental attitudes. Environ. Behav. 2008, 40, 818–842. [Google Scholar] [CrossRef]
- Hartmann, P.; Apaolaza-Ibáñez, V. Consumer attitude and purchase intention toward green energy brands: The roles of psychological benefits and environmental concern. J. Bus. Res. 2012, 65, 1254–1263. [Google Scholar] [CrossRef]
- Hwang, J.; Cho, S.B.; Kim, W. Consequences of psychological benefits of using eco-friendly services in the context of drone food delivery services. J. Travel Tour. Marketing 2019, 36, 835–846. [Google Scholar] [CrossRef]
- Wichers, G. OCN’s Smart Farm Is a Source of Physical and Mental Health. Available online: https://www.manitobacooperator.ca/farm-it-manitoba/ocns-smart-farm-is-a-source-of-physical-and-mental-health/ (accessed on 4 April 2023).
- Block, L.G.; Grier, S.A.; Childers, T.L.; Davis, B.; Ebert, J.E.; Kumanyika, S.; Laczniak, R.N.; Machin, J.E.; Motley, C.M.; Peracchio, L.; et al. From nutrients to nurturance: A conceptual introduction to food well-being. J. Public Policy Mark. 2011, 30, 5–13. [Google Scholar] [CrossRef]
- Kim, H.J.; Park, J.; Kim, M.J.; Ryu, K. Does perceived restaurant food healthiness matter? Its influence on value, satisfaction and revisit intentions in restaurant operations in South Korea. Int. J. Hosp. Manag. 2013, 33, 397–405. [Google Scholar] [CrossRef]
- Seo, H.M. A study on the intention to use metaverse services of professional sports fans using value-based adoption model. Korean J. Phys. Educ. 2022, 61, 151–166. [Google Scholar] [CrossRef]
- Onwezen, M.C.; Bouwman, E.P.; Reinders, M.J.; Dagevos, H. A systematic review on consumer acceptance of alternative proteins: Pulses, algae, insects, plant-based meat alternatives, and cultured meat. Appetite 2021, 159, 105058. [Google Scholar] [CrossRef] [PubMed]
- Cox, D.F.; Rich, S.U. Perceived risk and consumer decision-making the case of telephone shopping. J. Mark. Res. 1964, 1, 32–39. [Google Scholar]
- Dowling, G.R. Perceived risk: The concept and its measurement. Psychol. Mark. 1986, 3, 193–210. [Google Scholar] [CrossRef]
- Mitchell, V.W.; Greatorex, M. Consumer risk perception in the UK wine market. Eur. J. Mark. 1988, 22, 5–15. [Google Scholar] [CrossRef]
- Jiang, G.; Zhang, M.; Cai, X.; Feng, X. Collaborative governance in shared accommodation platform: Moderating role of perceived risk. J. Hosp. Tour. Manag. 2021, 49, 112–128. [Google Scholar] [CrossRef]
- Klerck, D.; Sweeney, J.C. The effect of knowledge types on consumer-perceived risk and adoption of genetically modified foods. Psychol. Mark. 2007, 24, 171–193. [Google Scholar] [CrossRef]
- Sheng, J.; Su, W.; Jin, S.; Chen, S.; Wall, P.; Yue, Y. Assessing moderated mediation effects influencing consumer acceptance of cell-cultured meat: A PLS-SEM modeling approach. Food Qual. Prefer. 2025, 123, 105331. [Google Scholar] [CrossRef]
- Coppola, A.; Verneau, F. An empirical analysis on technophobia/technophilia in consumer market segmentation. Agric. Food Econ. 2014, 2, 1–16. [Google Scholar] [CrossRef]
- Ronteltap, A.; Van Trijp, J.C.M.; Renes, R.J.; Frewer, L.J. Consumer acceptance of technology-based food innovations: Lessons for the future of nutrigenomics. Appetite 2007, 49, 1–17. [Google Scholar] [CrossRef]
- Biltekoff, C. Consumer response: The paradoxes of food and health. Ann. Acad. Sci. 2010, 1190, 174–178. [Google Scholar] [CrossRef]
- La Barbera, F.; Amato, M.; Sannino, G. Understanding consumers’ intention and behaviour towards functionalised food: The role of knowledge and food technology neophobia. Br. Food J. 2016, 118, 885–895. [Google Scholar] [CrossRef]
- Gorgitano, M.T.; Verneau, F.; Sodano, V. Sustainable food innovation: Finding the right balance between technological determinism and technophobia. Calitatea 2017, 18, 231–236. [Google Scholar]
- Sodano, V.; Gorgitano, M.T.; Verneau, F.; Vitale, C.D. Consumer acceptance of food nanotechnology in Italy. Br. Food J. 2016, 118, 714–733. [Google Scholar] [CrossRef]
- Cattaneo, C.; Lavelli, V.; Proserpio, C.; Laureati, M.; Pagliarini, E. Consumers’ attitude towards food by-products: The influence of food technology neophobia, education and information. Int. J. Food Sci. Technol. 2019, 54, 679–687. [Google Scholar] [CrossRef]
- Stern, P.C. New environmental theories: Toward a coherent theory of environmentally significant behavior. J. Soc. Social Issues 2000, 56, 407–424. [Google Scholar] [CrossRef]
- Fishbein, M.; Ajzen, I. Belief, attitude, intention, and behavior: An introduction to theory and research. Philos. Rhetor. 1977, 10, 177–189. [Google Scholar]
- Bentler, P.M.; Speckart, G. Models of attitude-behavior relations. Psychol. Rev. 1979, 86, 452. [Google Scholar] [CrossRef]
- Perugini, M.; Bagozzi, R.P. The role of desires and anticipated emotions in goal-directed behaviors: Broadening and deepening the theory of planned behavior. Br. J. Soc. Social. Psychol. 2001, 40, 70–98. [Google Scholar]
- Ajzen, I. The theory of planned behavior. Organ. Behav. Hum. Decis. Process. 1991, 50, 179–211. [Google Scholar] [CrossRef]
- Han, H.; Hwang, J.; Lee, M.J.; Kim, J. Word-of-mouth, buying, and sacrifice intentions for eco-cruises: Exploring the function of norm activation and value-attitude-behavior. Tour. Manag. 2019, 70, 430–443. [Google Scholar] [CrossRef]
- Lee, K.H.; Hwang, K.H.; Kim, M.; Cho, M. 3D printed food attributes and their roles within the value-attitude-behavior model: Moderating effects of food neophobia and food technology neophobia. J. Hosp. Tour. Manag. 2021, 48, 46–54. [Google Scholar] [CrossRef]
- Lin, I.Y.; Mattila, A.S. The value of service robots from the hotel guest’s perspective: A mixed-method approach. Int. J. Hosp. Manag. 2021, 94, 102876. [Google Scholar] [CrossRef]
- Shin, Y.H.; Moon, H.; Jung, S.E.; Severt, K. The effect of environmental values and attitudes on consumer willingness to pay more for organic menus: A value-attitude-behavior approach. J. Hosp. Tour. Manag. 2017, 33, 113–121. [Google Scholar] [CrossRef]
- Jeon, S.; Lee, S.; Hwang, J. The consumer perceptions of smart farm ingredients and their influence on willingness to pay a premium: Food labeling and food technophobia. J. Tour. Sci. 2022, 46, 31–54. [Google Scholar] [CrossRef]
- Hwang, J.; Lee, J.S.; Kim, H. Perceived innovativeness of drone food delivery services and its impacts on attitude and behavioral intentions: The moderating role of gender and age. Int. J. Hosp. Manag. 2019, 81, 94–103. [Google Scholar] [CrossRef]
- Park, J.; Park, Y.; Yu, J. Can multiple attributes of vegan restaurants affect the behavioral intentions by customer psychological factors. Front. Nutr. 2022, 9, 902498. [Google Scholar] [CrossRef]
- Hwang, J.; Choe, J.Y.J. Exploring perceived risk in building successful drone food delivery services. Int. J. Contemp. Hosp. Manag. 2019, 31, 3249–3269. [Google Scholar] [CrossRef]
- Anderson, J.C.; Gerbing, D.W. Structural equation modeling in practice: A review and recommended two-step approach. Psychol. Bull. 1988, 103, 411–423. [Google Scholar] [CrossRef]
- Ford, J.K.; MacCallum, R.C.; Tait, M. The application of exploratory factor analysis in applied psychology: A critical review and analysis. Pers. Psychol. 1986, 39, 291–314. [Google Scholar] [CrossRef]
- Hair, J.F.; Anderson, R.E.; Tatham, R.L.; Black, W.C. Multivariate Data Analysis, 8th ed.; Prentice-Hall: Upper Saddle River, NJ, USA, 1998. [Google Scholar]
- Bagozzi, R.P.; Yi, Y. On the evaluation of structural equation models. J. Acad. Mark. Sci. 1988, 16, 74–94. [Google Scholar] [CrossRef]
- Fornell, C.; Larcker, D.F. Structural equation models with unobservable variables and measurement error: Algebra and statistics. J. Mark. Res. 1981, 18, 382–388. [Google Scholar] [CrossRef]
- Podsakoff, P.M.; Organ, D.W. Self-reports in organizational research: Problems and prospects. J. Manag. 1986, 12, 531–544. [Google Scholar] [CrossRef]
- Herzberg, F.; Mausner, B.; Snyderman, B. The Motivation to Work, 2nd ed.; John Wiley: New York, NY, USA, 1959. [Google Scholar]
- Rozekhi, N.A.; Hussin, S.; Siddiqe, A.S.K.A.R.; Rashid, P.D.A.; Salmi, N.S. The influence of food quality on customer satisfaction in fine dining restaurant: Case in Penang. Int. Acad. Res. J. Bus. Technol. 2016, 2, 45–50. [Google Scholar]

| Variables | n | % |
|---|---|---|
| Gender | ||
| Male | 177 | 49.2 |
| Female | 183 | 50.8 |
| Age (Mean = 36.89) | ||
| 20s | 111 | 30.8 |
| 30s | 104 | 28.9 |
| 40s | 107 | 29.7 |
| More than 50 | 38 | 10.6 |
| Monthly income (KRW) | ||
| Under 2 million | 72 | 20.0 |
| 2 to 3 million | 127 | 35.3 |
| 3 to 4 million | 79 | 21.9 |
| 4 to 5 million | 34 | 9.5 |
| Over 5 million | 48 | 13.3 |
| Marital status | ||
| Single | 206 | 57.2 |
| Married | 148 | 41.1 |
| Widowed/Divorced | 6 | 1.7 |
| Education level | ||
| Less than a high school diploma | 31 | 8.7 |
| Associate degree | 62 | 17.2 |
| Bachelor’s degree | 224 | 62.2 |
| Graduate degree | 43 | 11.9 |
| Frequency of dining out | ||
| Below to once per week | 156 | 43.3 |
| Once to twice per week | 105 | 29.2 |
| More than twice per week | 99 | 27.5 |
| The average check per person (KRW) | ||
| Less than 10 thousand | 19 | 5.3 |
| 10 to 30 thousand | 246 | 68.3 |
| 30 to 60 thousand | 78 | 21.7 |
| Over 60 thousand | 17 | 4.7 |
| Type of companions | ||
| Family | 197 | 54.7 |
| Friends | 72 | 20.1 |
| Lover | 52 | 14.4 |
| Alone | 22 | 6.1 |
| Workfellow or acquaintance, etc. | 17 | 4.7 |
| Constructs and Instruments | Standardized Loading |
|---|---|
| Perceived naturalness | |
| Non-organic–Organic | 0.846 |
| Not fresh–Fresh | 0.777 |
| Psychological benefit | |
| I feel positive about ISFRs as they help environmental protection. | 0.867 |
| ISFRs make me feel like I contribute to environmental protection. | 0.909 |
| ISFRs make me happy because they don’t harsh the environment. | 0.906 |
| Healthy well-being | |
| Eating at ISFRs helps me to avoid eating unhealthy ingredients. | 0.853 |
| Eating at ISFRs makes me feel nutritional balanced. | 0.894 |
| Eating at ISFRs helps me to be healthier. | 0.894 |
| Enjoyment | |
| Using ISFRs seems like an interesting experience. | 0.875 |
| Using ISFRs seems like a cheerful experience. | 0.906 |
| Using ISFRs seems like a pleasant experience. | 0.851 |
| Perceived cost | |
| It seems like a waste of opportunity costs (time, effort, etc.) to use ISFRs. | 0.853 |
| I worry about the menu price of ISFRs may be more expensive than I thought. | 0.614 |
| It seems like that the unreasonable cost of meals at ISFRs than at other restaurants. | 0.673 |
| Perceived risk | |
| I’m anxious that the menu at ISFRs might have lower quality than expected. | 0.873 |
| I have concerns regarding the quality of the menu at ISFRs. | 0.891 |
| I’m concerned that ISFRs’ menu might be of lower quality compared to other restaurants. | 0.886 |
| Food technophobia | |
| Switching too quickly to new technology-based foods may be dangerous. | 0.770 |
| New technology-based foods are unlikely to be better than traditional food. | 0.798 |
| I cannot trust new technology-based foods. | 0.895 |
| Perceived value | |
| ISRF would provide me with positive value. | 0.799 |
| Using ISFR is a valuable dining-out behavior. | 0.904 |
| Overall, using ISFR is worth me. | 0.940 |
| Attitude | |
| Unfavorable–Favorable | 0.921 |
| Bad–Good | 0.921 |
| Negative–Positive | 0.890 |
| Intentions to use | |
| I would choose ISFRs when dining out. | 0.925 |
| I’m inclined to visit ISFRs when eating out. | 0.925 |
| I’m likely to choose ISFRs for dining out. | 0.896 |
| AVE | (1) | (2) | (3) | (4) | (5) | (6) | (7) | (8) | (9) | (10) | |
|---|---|---|---|---|---|---|---|---|---|---|---|
| (1) Perceived naturalness | 0.66 | 0.80 a | 0.45 b | 0.58 | 0.51 | 0.52 | –0.28 | –0.18 | 0.51 | 0.51 | 0.45 |
| (2) Psychological benefit | 0.80 | 0.21 c | 0.92 | 0.72 | 0.72 | 0.07 | –0.38 | –0.37 | 0.75 | 0.67 | 0.70 |
| (3) Healthy well-being | 0.76 | 0.33 | 0.52 | 0.91 | 0.71 | 0.22 | –0.40 | –0.32 | 0.71 | 0.64 | 0.64 |
| (4) Enjoyment | 0.77 | 0.26 | 0.52 | 0.50 | 0.91 | 0.16 | –0.46 | –0.26 | 0.74 | 0.66 | 0.79 |
| (5) Perceived cost | 0.52 | 0.29 | 0.01 | 0.05 | 0.03 | 0.76 | 0.19 | 0.27 | 0.05 | 0.13 | –0.02 |
| (6) Perceived risk | 0.78 | 0.08 | 0.14 | 0.16 | 0.21 | 0.04 | 0.91 | 0.68 | –0.48 | –0.44 | –0.55 |
| (7) Food technophobia | 0.68 | 0.03 | 0.14 | 0.10 | 0.07 | 0.08 | 0.46 | 0.86 | –0.50 | –0.46 | –0.50 |
| (8) Perceived value | 0.78 | 0.26 | 0.56 | 0.50 | 0.55 | 0.00 | 0.23 | 0.25 | 0.90 | 0.71 | 0.75 |
| (9) Attitude | 0.83 | 0.26 | 0.44 | 0.41 | 0.44 | 0.02 | 0.20 | 0.21 | 0.51 | 0.94 | 0.73 |
| (10) Intentions to use | 0.84 | 0.22 | 0.49 | 0.42 | 0.62 | 0.00 | 0.30 | 0.25 | 0.57 | 0.53 | 0.94 |
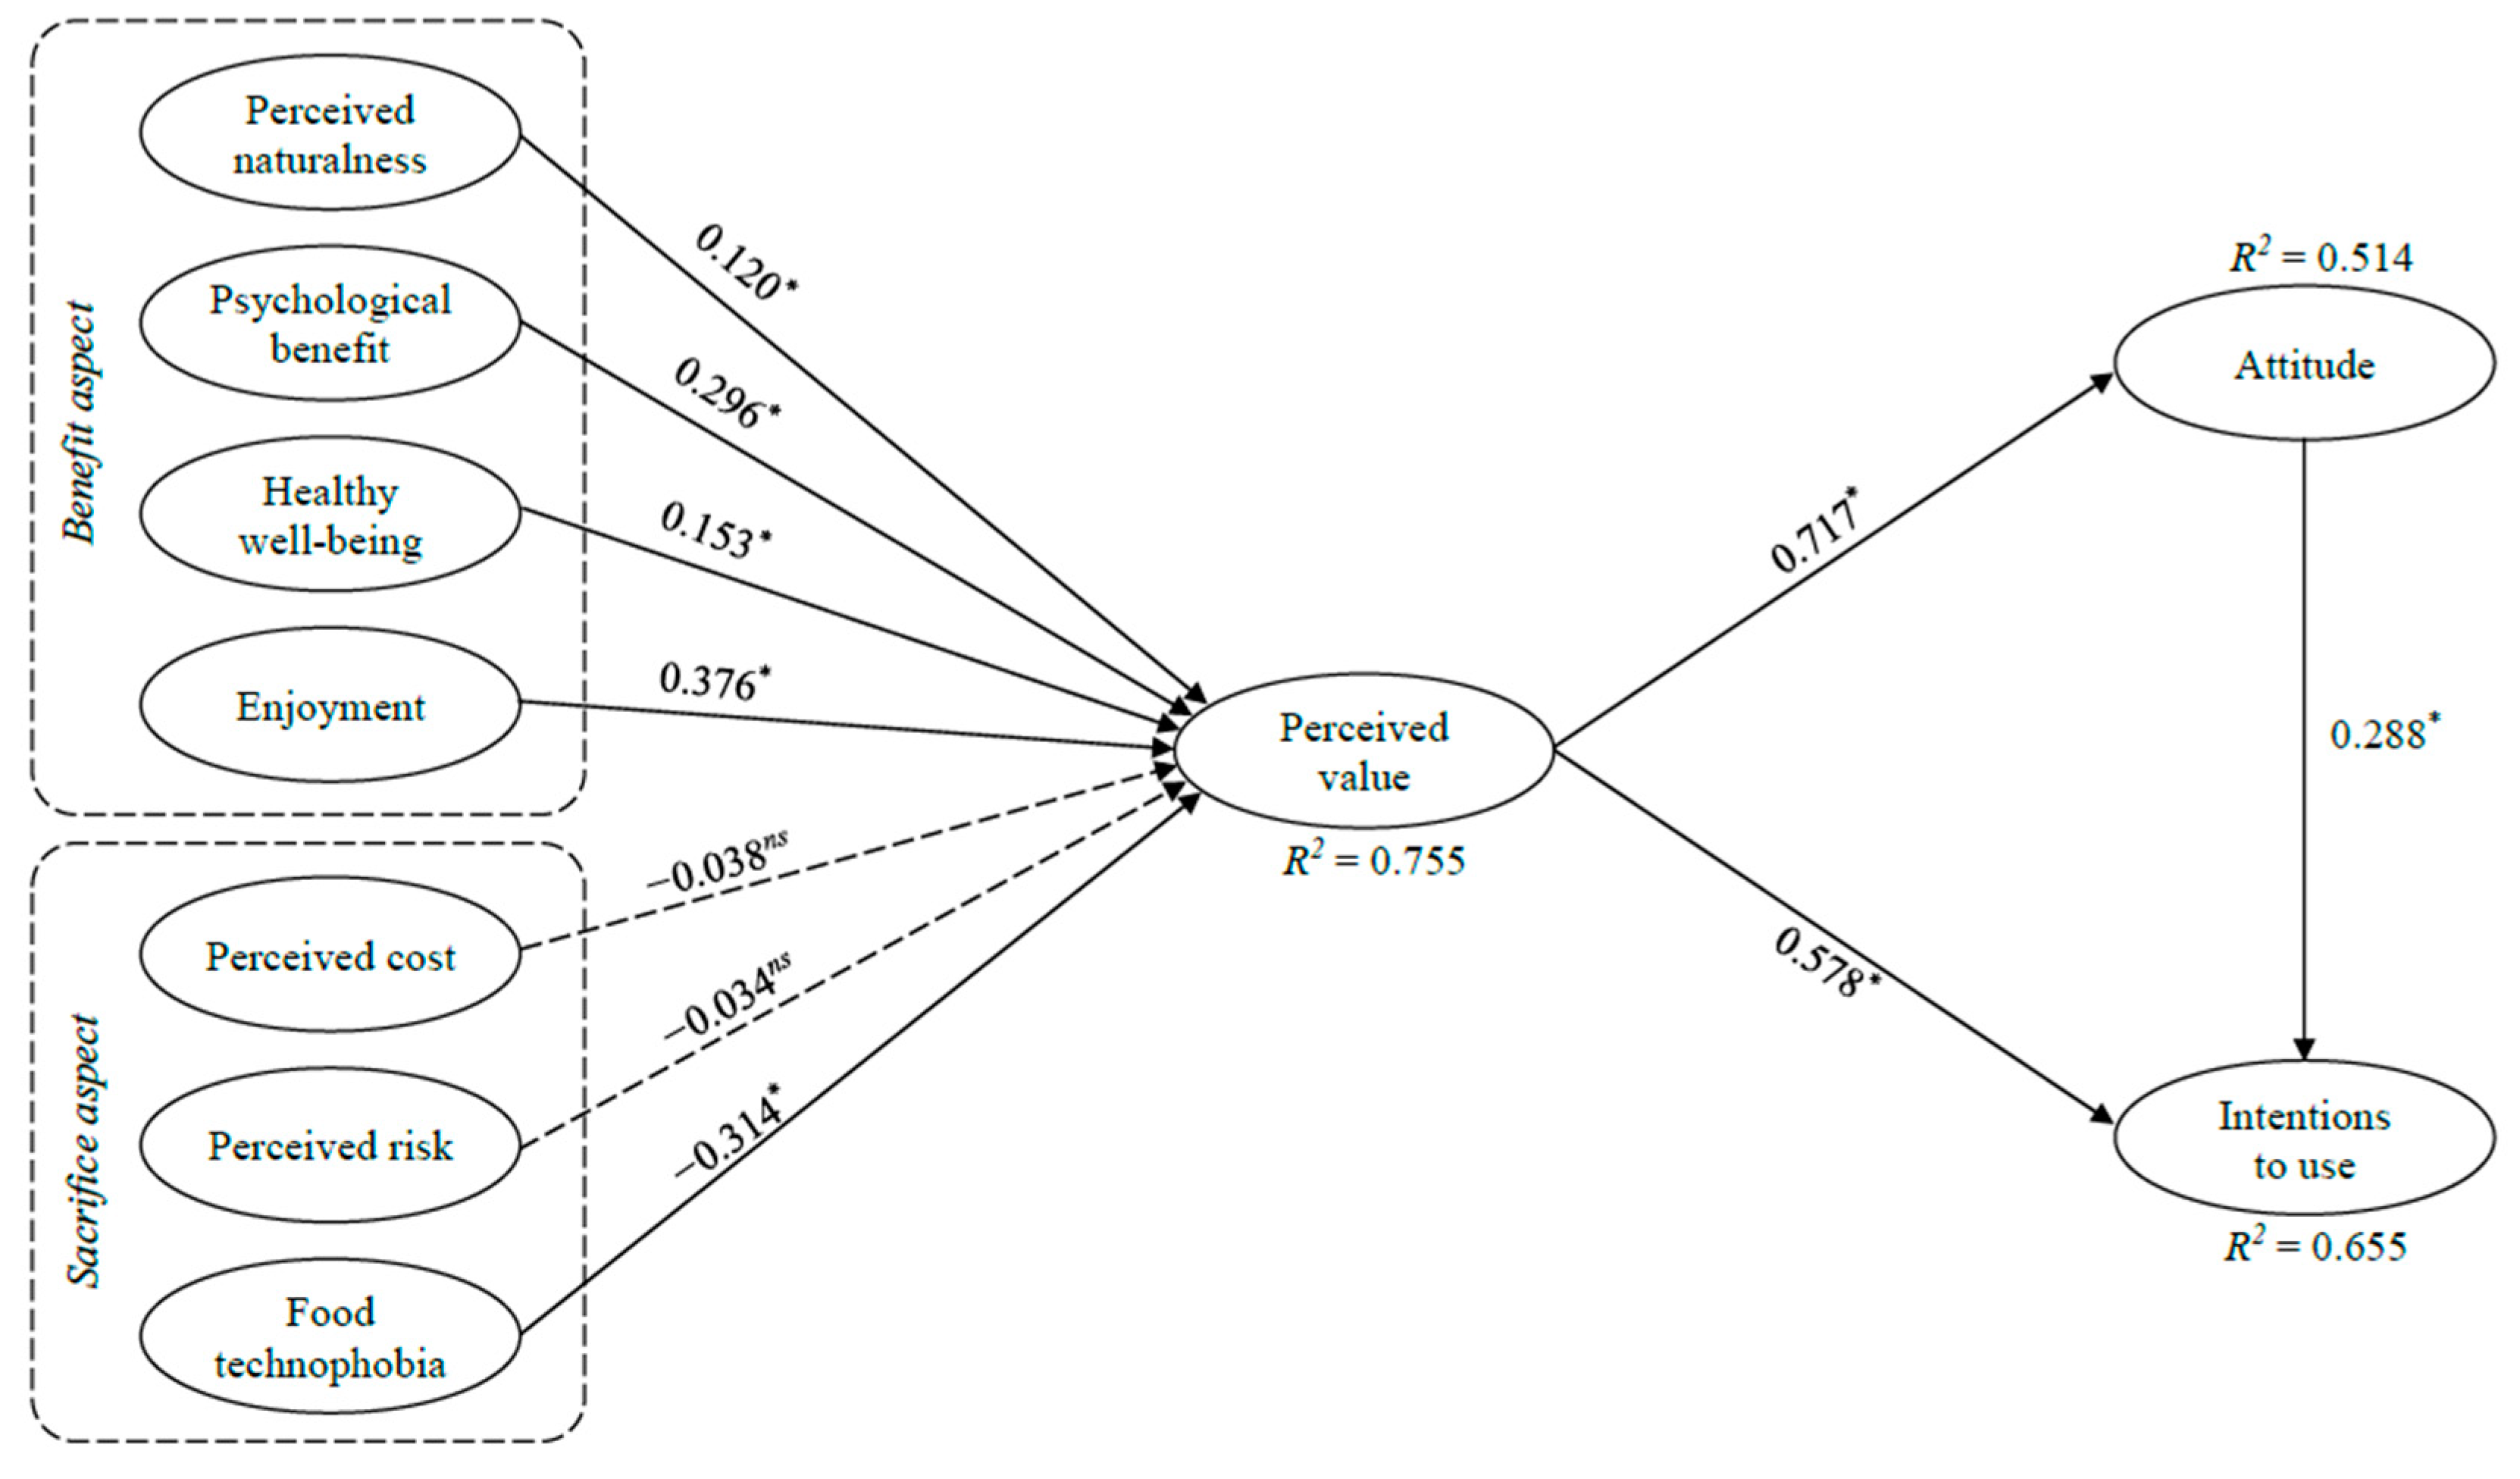
| Coefficients | t-Value | Hypothesis | ||||
|---|---|---|---|---|---|---|
| H1 | Perceived naturalness | → | Perceived value | 0.120 | 2.280 * | Supported |
| H2 | Psychological benefit | → | Perceived value | 0.296 | 4.986 * | Supported |
| H3 | Healthy well-being | → | Perceived value | 0.153 | 2.563 * | Supported |
| H4 | Enjoyment | → | Perceived value | 0.376 | 6.216 * | Supported |
| H5 | Perceived cost | → | Perceived value | –0.038 | –1.137 ns | Not supported |
| H6 | Perceived risk | → | Perceived value | 0.034 | –0.664 ns | Not supported |
| H7 | Food technophobia | → | Perceived value | –0.312 | –5.616 * | Supported |
| H8 | Perceived value | → | Attitude | 0.717 | 12.234 * | Supported |
| H9 | Perceived value | → | Intentions to use | 0.578 | 9.285 * | Supported |
| H10 | Attitude | → | Intentions to use | 0.288 | 4.890 * | Supported |
Disclaimer/Publisher’s Note: The statements, opinions and data contained in all publications are solely those of the individual author(s) and contributor(s) and not of MDPI and/or the editor(s). MDPI and/or the editor(s) disclaim responsibility for any injury to people or property resulting from any ideas, methods, instructions or products referred to in the content. |
© 2025 by the authors. Licensee MDPI, Basel, Switzerland. This article is an open access article distributed under the terms and conditions of the Creative Commons Attribution (CC BY) license (https://creativecommons.org/licenses/by/4.0/).
Share and Cite
Joo, K.; Hwang, J. Exploring Consumers’ Technology Acceptance Behavior Regarding Indoor Smart Farm Restaurant Systems: Focusing on the Value-Based Adoption Model and Value–Attitude–Behavior Hierarchy. Systems 2025, 13, 189. https://doi.org/10.3390/systems13030189
Joo K, Hwang J. Exploring Consumers’ Technology Acceptance Behavior Regarding Indoor Smart Farm Restaurant Systems: Focusing on the Value-Based Adoption Model and Value–Attitude–Behavior Hierarchy. Systems. 2025; 13(3):189. https://doi.org/10.3390/systems13030189
Chicago/Turabian StyleJoo, Kyuhyeon, and Jinsoo Hwang. 2025. "Exploring Consumers’ Technology Acceptance Behavior Regarding Indoor Smart Farm Restaurant Systems: Focusing on the Value-Based Adoption Model and Value–Attitude–Behavior Hierarchy" Systems 13, no. 3: 189. https://doi.org/10.3390/systems13030189
APA StyleJoo, K., & Hwang, J. (2025). Exploring Consumers’ Technology Acceptance Behavior Regarding Indoor Smart Farm Restaurant Systems: Focusing on the Value-Based Adoption Model and Value–Attitude–Behavior Hierarchy. Systems, 13(3), 189. https://doi.org/10.3390/systems13030189