Abstract
Road freight e-commerce platforms, as a specialized form of e-commerce in the road transportation sector, face complex operational risks due to their unique service positioning and business models. This study employs a comprehensive methodology to examine the risk framework of these platforms. Through the development of three distinct questionnaires, 20 critical risk factors are identified, which were subsequently analyzed using a combination of Decision-making Trial and Evaluation Laboratory (DEMATEL) and Interpretive Structural Modeling (ISM) approaches. Furthermore, a systematic risk assessment is conducted by integrating the Analytic Hierarchy Process (AHP) with Fuzzy Comprehensive Evaluation (FCE) methods. The research reveals that the 20 core risk factors affecting road freight e-commerce platforms exhibit a systematic and hierarchical structure, with clearly defined transmission pathways between different levels of risk factors. This investigation uncovers the internal interaction mechanisms among these risk factors. The study demonstrates that a thorough consideration of risk factor mechanisms, coupled with a systematic risk assessment, can significantly enhance the effectiveness and precision of risk control strategy formulation. This methodological approach not only provides a robust framework for understanding the complex risk landscape of online freight platforms but also offers practical insights for developing targeted risk mitigation strategies in this evolving sector.
1. Introduction
The road freight market in China is characterized by a mismatch between the scale of the transport capacity market and the size of transport capacity enterprises. Currently, China is home to 27,374 small-scale transportation enterprises, which constitute 84.52% of the nation’s highway transportation capacity and are responsible for handling 77.9% of the highway freight volume [1]. This disparity intensifies the challenges faced by cargo owners in terms of freight timeliness and cost control, and it also increases the complexity of managing regulatory oversight and resource allocation efficiency in the freight industry.
Against this backdrop, the operational model of road freight e-commerce platforms has emerged as a solution. These platforms are specialized e-commerce platforms devoted to cargo transportation services. They integrate the cargo demand with the fragmented transportation capacity and enhance the efficiency of highway freight services through the efficient organization of the transportation capacity and the application of advanced vehicle-to-cargo matching algorithms [2].
Unlike traditional e-commerce platforms [3], the unique characteristics of road freight e-commerce platforms in terms of service targets, models, and business processes introduce a complex array of interrelated risk factors, including technological, environmental, and business-related elements [4]. The emergence of these risks during platform development is inevitable. The failure to accurately identify and manage these risks can result in fiscal and tax violations, severe market homogenization, transformation failures, and even the exit from the market for current road freight e-commerce platforms. In the actual transportation market, these platforms assume a dual role as both information service providers and bearers of responsibility. The peculiarity of this dual role is the primary source of their risks [5]. Consequently, both road freight e-commerce platform enterprises and government regulatory bodies have engaged in substantial practical exploration to facilitate the rapid development of new network freight models.
For instance, to pre-empt potential monopolization in the operation of road freight e-commerce platforms, there is a need to develop scientifically sound and rational regulatory policies [6,7]. To enhance the efficiency of resource allocation within these platforms, this paper examines how to achieve effective vehicle-to-cargo matching and improve transportation timeliness [8,9]. It also addresses the need for the normalization and standardization of business practices and processes to ensure the sustainable development and service provision of the platforms [10,11,12]. However, these studies tend to address individual aspects of the problem from a singular perspective, rather than offering a comprehensive risk management and development strategy for road freight e-commerce platform enterprises. Increased vulnerability to risks across various dimensions—technology, services, policies, operational practices, and the demand environment—can precipitate crises or even bankruptcy for these enterprises, similar to the weaknesses exposed by the barrel principle.
In light of these considerations, the objective of this paper is to develop a systematic methodology for identifying and assessing risk factors within the road freight e-commerce platform sector. It seeks to delve into the interplay and the pathways through which various risk factors exert their influence, thereby aiding operators and industry regulators in devising precise, potent, and comprehensive risk management strategies. The paper’s contributions can be encapsulated within two pivotal areas. Firstly, it establishes a multi-dimensional, multi-tiered approach to risk factor identification for road freight e-commerce platforms. This method not only comprehensively identifies risk factors, but also elucidates the interplay among them, enabling operators to gain a profound understanding of the operational risks they face. Secondly, building upon this foundation, the paper constructs a risk assessment framework and a method for determining risk weights that are tailored to the business characteristics of road freight e-commerce platforms. This framework and method are designed to guide operators and managers in formulating systematic and effective control strategies.
This paper is organized into six main sections. Section 2 offers a concise literature review focusing on the risk factors associated with road freight e-commerce platforms. Section 3 provides a detailed description of the research methods and computational steps used for risk identification and assessment. Section 4 utilizes data collected from questionnaires to obtain results using the methods described in Section 3, and interprets and explains these results. Section 5 discusses the research findings and evaluates the applicability and limitations of the proposed methods. The final section summarizes the research conclusions and analyzes the contributions and practical value of the study.
2. Literature Review
A multitude of scholars and industry practitioners have conducted extensive research on the operational risks inherent in road freight e-commerce platforms. The existing literature primarily concentrates on three key areas: risk identification, risk assessment, and risk control.
2.1. Specifics of Road Freight E-Commerce Platforms
Road freight e-commerce platforms, which have evolved from the freight forwarder model, represent an Internet-based iteration of the traditional carrier-free transportation model [2]. At their core, these platforms function as e-commerce systems specifically designed for freight services. They utilize Internet technology to optimize the matching process between shippers (cargo sources) and carriers (transportation companies), operating in a manner analogous to the Uber model for freight transportation. The service framework of these platforms is illustrated in Figure 1 [4].
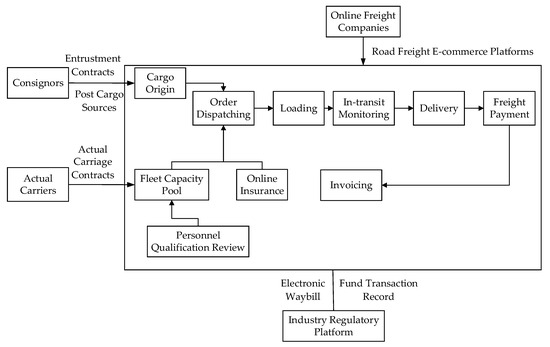
Figure 1.
The service framework of road freight e-commerce platforms.
This innovative model has transformed the logistics landscape by leveraging digital technologies to enhance operational efficiency and resource allocation in the freight transportation sector. The platform’s architecture facilitates the real-time matching and optimization of transportation resources, representing a significant advancement over traditional freight forwarding systems.
However, due to the distinctive nature of freight transportation services, these platforms exhibit several significant differences compared to conventional e-commerce platforms, as detailed in Table 1.

Table 1.
Distinctions between road freight e-commerce platforms and conventional platforms.
Online freight platforms possess a dual identity, functioning both as information service providers and liability bearers. Simultaneously, they must manage critical aspects of freight services, including transportation planning, cargo safety management, and delivery assurance, which are influenced by multiple factors such as driver behavior, natural conditions, policy regulations, vehicle reliability, and market stability. Consequently, compared to conventional e-commerce platforms, online freight platforms are exposed to more systematic and complex operational risks [5]. This inherent complexity stems from their multifaceted operational environment and the interdependent nature of risk factors in the logistics ecosystem, making their risk profile substantially more challenging than that of traditional e-commerce platforms.
2.2. Risk Identification of Road Freight E-Commerce Platforms
The pioneering research on risk identification within transportation platforms was predominantly aimed at the Non-Vessel Operating Common Carrier (NVOCC) mode, with the goal of devising pre-emptive contingency plans to mitigate potential risks and safeguard the interests of both customers and carriers [16]. This research can be categorized into five primary areas: contract carriage risk, carrier liability and credit risk, cargo security risk, and information management risk [17]. Building on this foundation, Zhang [18] presented a comprehensive risk management solution, identifying the risks associated with NVOCC in business processes, vehicle–cargo matching, and dedicated line transportation within the system platform. The paper enhances the business process framework, goods source integration organization, private line alliance, service quality management, and operation scheme implementation, and proposes an operational scheme for NVOCC from a technical perspective. As the NVOCC evolved through optimization and innovation, it transitioned into a road freight e-commerce platform. During the logistics transportation facilitated by the road freight e-commerce platform, various risk factors can subtly and variably impact platform enterprises [19], including but not limited to financial and tax risks [20]. Notably, Kun [21] innovatively introduced the LAS-STACK model to enhance the platform’s and regulators’ capabilities in the early warning and management of default risk, effectively safeguarding the interests of investors.
2.3. Risk Assessment of Road Freight E-Commerce Platforms
In the realm of risk assessment for traditional road freight transportation, Sand [22], in his book “Comparing Risks in Supply Chain Management”, introduced the TransIn and TransSoc methodologies to evaluate the internal and external risks faced by freight transport enterprises. These methodologies measure the impact of various risk factors on the performance of road freight transport companies and conclude that external factors, such as market policies, weather conditions, and road environments, primarily influence enterprise development, while internal factors are predominantly the risks inherent in the operational processes of the enterprises. To further refine the risk factor system for road freight transport, Chen [23] discovered that population density and traffic distance on transport routes significantly impact road freight safety, offering a novel perspective for the quantitative assessment of road freight risks. Additionally, Sakhapov [24] expanded the scope of road freight risk research to the societal level, developing a model that integrates road safety indicators, motorization levels, and social risks, enabling the precise assessment of social risk levels and evaluating the economic impact of safety improvements. Multi-dimensional and multi-subject risk assessment methods are frequently employed in the risk assessment of NVOCC, such as the multi-dimensional risk index warning system based on the PCA-Logit model [25] and the partner selection evaluation method based on the PCA-BP neural network model [26]. Moreover, an increasing number of quantitative methods and intelligent prediction techniques are being widely used in the risk assessment of new network freight transportation modes, including the combination of Bayesian Network and fuzzy reasoning methods [27]. The determination of weights is a critical component in the risk assessment of road freight e-commerce platforms, with fuzzy evaluation and the AHP being widely utilized methods [28].
Considering that road freight e-commerce platforms integrate multiple attributes such as e-commerce, logistics, and big data, the current mainstream methods for studying their complex risks primarily combine qualitative and quantitative approaches. A brief introduction to these methods is provided in Table 2.
Table 2.
Mainstream methods for risk assessment of road freight e-commerce platforms.
2.4. Risk Control of Road Freight E-Commerce Platforms
Given the distinct risk profiles of road freight e-commerce platforms, the control strategies must be tailored accordingly and can be encapsulated as follows: financial and tax management risk control, platform competition risk control, personnel and organizational management risk control, and freight business risk control. Regarding fiscal and tax management, tax planning models, such as mixed integer nonlinear programming [33], are employed to standardize data control and mitigate platform tax risks. Concurrently, addressing tax-related issues like false invoicing, white stripe entries, and the misallocation of oil and gas tickets and toll tickets in road freight e-commerce platforms, the paper proposes control strategies from the systemic, policy, and supervisory perspectives [34]. In the realm of platform competition, Halaburda [35] concluded that the volume of information significantly influences competitive risks, with smaller platforms potentially achieving higher profits due to users having access to less information. More systematically, considering monopoly risks, Ma [36] developed a four-way evolutionary game model involving super-platforms, existing platforms, entrepreneurial platforms, and government regulators to study the micro-dynamics and evolutionary mechanisms among these parties. Furthermore, efficient human and organizational risk management is crucial for the operation of a road freight e-commerce platform, particularly in special scenarios like business crises and disaster emergencies [37]. To manage organizational risks, it is essential that we first provide clear legal attribute positioning for road freight e-commerce platforms and define the rights and responsibilities of multiple roles in the operational process [38]. Equally important is the establishment of a robust credit system to address credit risks that commonly arise during contract signing, document production, and the collection and payment of expenses [39]. In terms of business risk control, while traffic accidents are generally considered the primary factors affecting transportation business risks, driver behavior significantly impacts traffic accidents. Enhancing driver quality, reducing accident frequency, and mitigating accident consequences are the primary control strategies [40,41].
2.5. Research Gap Identification
Risk management in road freight transportation is a well-established research domain, encompassing perspectives from enterprise management, commercial services, and industry governance. However, the risk management of emerging road freight e-commerce platforms remains insufficiently explored. Current research predominantly follows traditional business model frameworks, which assume a one-to-one correspondence between risk factors and control strategies, as discussed in Section 2.4 and exemplified by [33,34]. As revealed by the analysis in Table 1, road freight e-commerce platforms integrate three distinct attributes, e-commerce, logistics transportation, and big data, resulting in risks that are inherently complex, dynamic, and transmissible.
Firstly, the complexity arises from multiple stakeholders and operational layers: shippers prioritize transportation efficiency and cost, carriers face operational risks, while platform operators must ensure transaction fluidity, manage information and capital flows, and address data security threats. Secondly, these platforms must navigate dynamic risks stemming from rapid technological evolution, market fluctuations, and policy changes. Finally, the unique business chain model of online freight platforms creates significant risk transmission effects. For instance, the synchronization of online and offline operations in freight services creates an interdependence between the online financial chain and offline business chain. A carrier’s credit or financial issues could consequently impact the online financial chain, disrupt delivery processes, lead to customer attrition, or necessitate transportation compensation, thereby transforming financial risks into operational risks in transportation.
Existing risk management methodologies may fail to identify these complex interdependencies. Therefore, a significant research gap exists in systematically examining the interaction and transmission mechanisms of risk factors within road freight e-commerce platforms and developing a more appropriate risk assessment model. Such a model would facilitate the digital transformation and operational efficiency improvement of the online freight industry. These considerations have largely motivated the present study, which aims to address these critical gaps in the current understanding of risk management in this evolving sector.
3. Methodology
3.1. The Overall Process
To accurately identify risk factors, reveal their transmission mechanisms in road freight e-commerce platforms, and systematically assess the risks faced during their operations, we conducted three rounds of questionnaires targeting different personnel and stages. Based on the survey data, we integrated the DEMATEL, ISM, AHP, and FCE methods.
First, through policy interpretation, literature review, field visits to road freight e-commerce platforms in the Ningbo region, and interviews with platform operators, technical maintenance personnel, and freight drivers, we initially identified all potential risk factors affecting platform operations. To identify key factors, we conducted the first questionnaire survey, titled “Questionnaire 1—Risk Rating Scale” (detailed in Appendix A), targeting platform operations departments, technical development departments, actual carriers, and shippers. Through expert scoring, we eliminated less significant or negligible risk factors, obtaining core risk factors as the basis for subsequent research and evaluation.
Intuitively, these risk factors in road freight e-commerce platforms exhibit interrelationships. To reveal these interactions, we conducted a second questionnaire survey targeting platform operators, transportation industry regulatory authorities, and shippers (details in Appendix B). We applied the DEMATEL and ISM models for analysis. The DEMATEL method, a systematic analysis approach, calculates the influence and affectedness degrees of each risk factor, determining their causality and centrality within the system. Based on the comprehensive influence matrix derived from DEMATEL, we input the data into the ISM model, decomposing the complex risk factors in the road freight e-commerce platform system and constructing a multi-level structural model. This reveals the transmission mechanisms among risk factors at different levels, providing precise decision-making support for risk control strategies.
The Fuzzy Comprehensive Evaluation method is adopted to systematically evaluate the operational risks of road freight e-commerce platforms. The core challenge was determining the comprehensive weights of evaluation elements. To balance subjective expert experience with objective industry realities, the AHP and DEMATEL methods are combined for weight determination. A third questionnaire was conducted to obtain the judgment matrix required for AHP (see Appendix C). By integrating the centrality and causality values from DEMATEL with the scoring weights from AHP, we derived the comprehensive weights for FCE, ultimately obtaining the risk assessment results.
The overall process is illustrated in Figure 2.
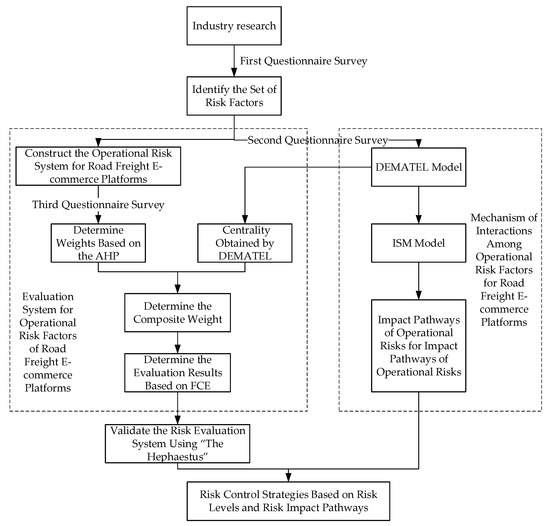
Figure 2.
The overall process.
The parameters used in the following sections are presented in Table 3.
Table 3.
The parameters and descriptions.
3.2. Identification of Risk Factors and Systematic Structural Analysis
3.2.1. Overview of Identification and Analysis Approach
To precisely identify the risk factors of the road freight e-commerce platform and uncover the interrelationships among them, two questionnaires were administered, and the DEMATEL and ISM methods were subsequently applied.
The first survey aimed to filter out the core risk factors from the pool of proposed risks. The second survey was designed to establish the correlations between these factors and to determine the impact weights necessary for the application of the DEMATEL and ISM models. The DEMATEL method was employed to analyze the centrality and causal relationships of the selected risk factors, thereby identifying the pivotal elements within the risk system. Concurrently, the centrality calculation results served as a foundation for subsequent analyses, which aimed to ascertain the weight of each risk factor.
Building upon the comprehensive influence matrix derived from the DEMATEL method, the ISM accessibility matrix was obtained, and the ISM model was constructed. This model is instrumental in translating the complex and ambiguous risk factors of the network freight mode into a topological hierarchy that is both observable and analyzable. It reflects the causal relationships among different risk factors and uncovers the fundamental factors that precipitate risk phenomena. The overall process is depicted in Figure 3 and will be elaborated upon in the subsequent subsection.
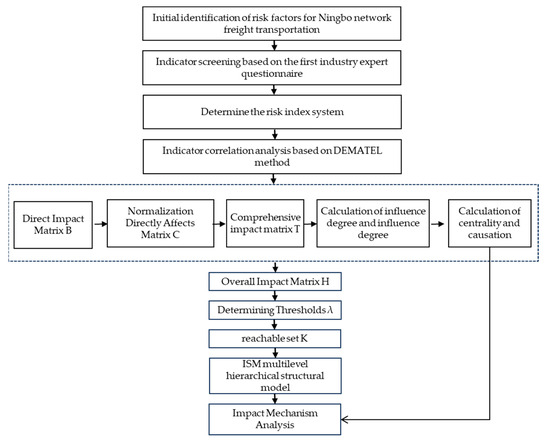
Figure 3.
Comprehensive process for identifying and analyzing risk factors.
3.2.2. Preliminary Risk Factor Screening
Considering the novel features of both traditional freight transportation and network freight transportation, an investigation was conducted among network freight transportation enterprises, goods source enterprises, and management departments. This led to the initial listing of 27 proposed risk factors across four distinct levels: external environmental risk, platform technology and service risk, platform organization and management risk, and cargo transportation risk. A questionnaire titled “Questionnaire 1—Risk Rating Scale” (detailed in Appendix A) was crafted for this purpose. Within the Ningbo region, 40 copies of the questionnaire were distributed to a variety of entities, including operational departments of road freight e-commerce platforms, technical development departments, actual carriers, and consignors. The respondents were asked to rate the risk level of each factor on a scale from 0 to 20, where 0 represents the lowest risk and 20 the highest. The risk level for each factor was then determined by calculating the average score across all 40 respondents. In accordance with the risk value criteria outlined in Appendix A, risk factors with an average score of 5 or below (classified as “Very Low Risk”, indicating negligible risk hazards) were excluded from further analysis.
3.2.3. Structural Analysis of Risk Factors Employing DEMATEL–ISM Methodology
- (1)
- Comprehensive procedure for constructing the DEMATEL method
Determine the risk factor set based on the outcomes of the initial risk factor identification: .
Using Formula (1), the functional relationship between two risk factors is established. The average value of the data corresponding to each risk factor is then calculated based on the number of experts participating in the questionnaire scoring. This average is rounded to reduce the error introduced by the subjective opinions of individual experts, thereby obtaining the direct relation matrix .
Normalization processing is applied to matrix to derive matrix , which represents the direct relation matrix after normalization. The formula for this process is as follows:
Calculate the total relation matrix , where represents the identity matrix. The formula is presented as follows:
Calculate the influence degree and affected degree . In the total relation matrix , these can be determined by summing the rows and columns of the total relation matrix . The formulas for these calculations are as follows:
Calculate the centrality , causality , and subjective weight of each index. Centrality is the sum of the influence degree and affected degree, indicating the importance of the factor within the system. A higher centrality degree signifies a more critical role of the factor in the index system. The causality degree is the difference between the influence degree and affected degree, used to identify whether a factor is a cause or an effect. A positive causality degree suggests that the factor exerts more influence on other elements than it receives, classifying it as a causal factor. Conversely, a negative causality degree indicates that the factor is more influenced by other elements, classifying it as an outcome factor. The calculation formulas are as follows:
Construct influence-affected diagrams. Utilize the centrality and causality of each factor as Cartesian coordinates. Systematically analyze the interrelations among risk factors to filter out the non-essential risks.
- (2)
- Comprehensive procedure for constructing the ISM method
Utilizing the total relation matrix derived from the DEMATEL method, compute the global influence matrix :
Compute the reachability matrix and establish the threshold . This threshold is determined by research experts based on the specific context of the study. The aim is to minimize the influence of less significant factors and to clarify the hierarchical structure within the ISM model:
Partition into a reachability set , an antecedent set , and a common set . The reachability set consists of elements where the row element in . The antecedent set includes elements where the column element in . The common set is the intersection of the reachable set and the antecedent set, and it can be expressed as .
Divide the ISM hierarchy and verify whether . If the condition is valid, designate as the highest-level element. Remove the stratified factors from , , and , and identify the subsequent levels until all factors are categorized. This process forms the final factor hierarchy, upon which a multi-level recursive structure is constructed.
3.3. A Comprehensive Systematic Approach to Risk Assessment Based on FCE
In this section, the FCE method is deployed to carry out a systematic risk assessment. The centrality derived from the DEMATEL model in the preceding section facilitates the assignment of more rational weights. The steps are as follows:
Step 1: Define the factor domain and the rating scale for the evaluation object
The factor domain and the evaluation grade domain are established, where represents an individual index and denotes the evaluation level of . In this study, a five-tiered scale is employed to assess the risk level of each index, defined as .
Step 2: Establishing a membership matrix
The factors within the factor domain are scored and evaluated based on the five-tiered scale mentioned previously, yielding the quantified outcomes of individual factor assessments. This quantification framework is utilized to construct the membership matrix :
In the formula, represents the degree of membership of factor to the fuzzy subset of grade .
Step 3: Determine the weight vector of an evaluation factor
The core of risk assessment lies in determining the weights of each risk factor. To achieve this, we employed a comprehensive weighting approach that combines the AHP method and the DEMATEL model. The AHP method, a widely recognized and extensively utilized weighting technique [42], was applied through a third questionnaire survey to determine the weights of risk factors based on its computational procedures. As AHP is a well-established methodology, this paper will not elaborate on its calculation process. Furthermore, to incorporate the transmission and interaction relationships among risk factors into the evaluation system, we integrated the centrality measures derived from the DEMATEL model as an additional weighting consideration. This combined approach not only enhances the systematic nature of the assessment but also aligns more closely with the complex characteristics of road freight e-commerce platforms, providing a more robust and contextually appropriate framework for risk evaluation.
The weight vector for each factor is derived by integrating the centrality from the DEMATEL model () and the weight from the AHP (), and is recorded as follows:
Step 4: Synthesis of the fuzzy comprehensive evaluation result vector
The membership degree is determined through a weighted average calculation, employing the “weighted average type” fuzzy synthesis operator on the membership degree matrix and weight vector . This process normalizes the data. Ultimately, the fuzzy comprehensive evaluation result vector is obtained:
Step 5: Determining the fuzzy comprehensive evaluation result
Once the fuzzy comprehensive evaluation result vector has been established, the final evaluation structure for each target level is also ascertained. This study employs the maximum membership degree method to ascertain the evaluation outcome for each factor. This method selects the maximum membership degree value among the elements at the target level as the evaluation result.
The evaluation steps are detailed in Figure 4.
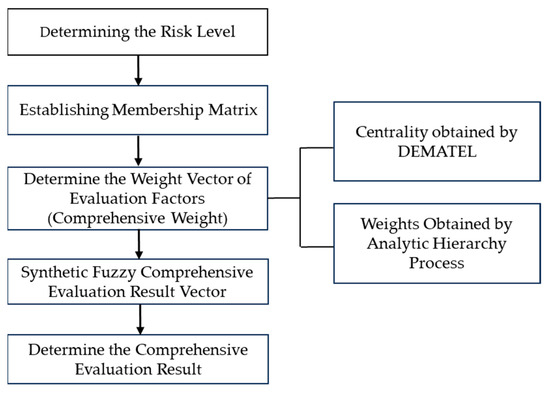
Figure 4.
Risk factor evaluation steps.
4. Findings
4.1. Analysis of Interaction Mechanisms Among Risk Factors
4.1.1. Risk Factor Identification Results
Based on the scoring results of the risk factor identification survey (first questionnaire), 20 risk factors were selected from the initial 27, as detailed in Table 4.
Table 4.
Preliminary screening outcomes of risk factors.
The implications of the risk factor screening are detailed in Table 5 below.
Table 5.
Interpretation of risk factor significance.
4.1.2. Interconnections Among Diverse Factors
In this subsection, we conducted the second questionnaire, specifically an association analysis survey on the operational risks of online freight platforms. The survey targeted three distinct groups: 20 companies operating network freight transportation platforms, 10 departments overseeing the freight transportation industry and 20 shippers. Based on the number of experts who participated in the questionnaire, we calculated the average value of the data corresponding to each risk factor and rounded it to minimize the impact of subjective opinions to the greatest extent possible. This process yielded the direct impact matrix. Subsequently, the normalized impact matrix and the integrated impact matrix were calculated in accordance with the DEMATEL method. Further details can be found in Appendix B. Following this, we calculated the centrality and causality degrees, assessed the attributes of each risk factor based on the sign of the causality degree, and identified key risk factors according to the ranking of the centrality degree. To facilitate the calculations, SPSS Statistics 29.0 was utilized, and the results are presented in Table 6.
Table 6.
Correlation analysis of the results.
The x-axis represents the centrality of the influencing factor, while the y-axis represents the causality of the influencing factor. Table 6 can be translated into a coordinate graph, as depicted in Figure 5.
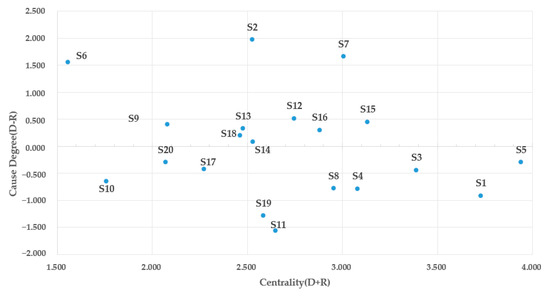
Figure 5.
Root causes and consequences of operational risks in road freight e-commerce platforms.
The centrality gauges the extent to which a risk factor influences other factors and the extent to which it is influenced by them, thereby reflecting the systematic importance of this risk factor to the overall risk profile of the road freight e-commerce platform. Based on the results presented in Table 6, the top 10 centrality factors are S5—Supply Stability, S1—Platform Competition, S3—Demand Change, S15—Owner Credibility Level, S4—Freight Rate Change, S7—Policy Influence, S8—Vehicle–Cargo Matching Efficiency, S16—Owner Credibility Level (note: it appears twice in the list, which may need clarification), S12—Capital Chain Stability, and S11—Customer Relationship Management. S5, with the highest centrality score for supply stability, is deemed the most critical factor within the overall road freight e-commerce platform’s operational risk system. Consequently, ensuring supply stability is essential in risk management to sustain the platform’s normal operations. The lowest centrality score for S6—Natural Environment indicates that, relative to other factors, it has a less direct impact on the operation of the road freight e-commerce platform and on the overall risk structure.
The causality signifies the relative value of a risk factor’s influence compared to its being influenced by other factors. When , it suggests that the risk factor exerts a greater influence on other factors than it receives; thus, it is termed a cause factor. Conversely, when , it indicates that the risk factor is more influenced by other factors than it influences them; hence, it is called an outcome factor. According to the results in Table 6, the operational risks of the road freight e-commerce platform encompass 10 cause factors and 10 result factors. The three factors with the highest causation degrees are S2—Economic Level, S7—Policy Influence, and S6—Natural Environment; these risk factors not only impact other risk factors but also affect the 10 outcome factors. Among the causal factors, those most related to the external environment, such as market, policy, and natural conditions, are particularly influential. This indicates that the fluctuations in the market economy, changes in industry-related policies, and uncertainties in external natural conditions significantly affect the operational stability of the platform. It is imperative that we develop predictive measures and contingency plans for these risk factors to mitigate the likelihood of them indirectly or directly triggering other risk factors.
Sort the causes of the outcome factors by their absolute values, which are S11—Customer Relationship Management, S19—Transportation Timeliness, S1—Platform Competition, S4—Freight Rate Change, S8—Vehicle–Goods Matching Efficiency, S10—Order Feedback Management, S3—Demand Change, S17—Goods Security, S5—Goods Source Stability, and S20—Vehicle Status. These factors can be directly or indirectly triggered by other factors that impact the operation of the road freight e-commerce platform. Among the outcome factors, Customer Relationship Management, Transportation Timeliness, and Platform Competition, are the most vulnerable to influences from other factors and are key triggers. Therefore, maintaining customer relationships, enhancing customer loyalty, ensuring the timeliness of freight transportation, efficiently assigning drivers, and allocating goods should be the central focus in the actual operation of the road freight e-commerce platform to enhance the service quality and platform competitiveness. In daily operations, we should anticipate and mitigate such risks at critical junctures to prevent external factors from adversely affecting overall operational efficiency.
4.1.3. Systemic Structure of Risk Factors
Subsequently, following the ISM-model-building process outlined in Section 3.2.3, calculate the overall impact matrix, the reachable matrix, the reachable set, the precondition set, and their intersection. The outcome is a multi-level hierarchical structure of the 20 selected risk factors, as illustrated in Figure 6.
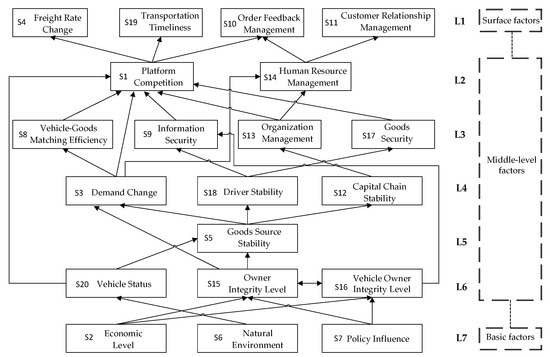
Figure 6.
Multi-level hierarchical risk factor structure model.
The risk factors impacting the road freight e-commerce platform constitute a complex system characterized by a seven-layer recursive structure. Figure 6 vividly delineates the interrelationships among risk factors and their hierarchical organization.
4.2. Analysis of FCE Risk Evaluation Results
4.2.1. Composite Weight Calculation Results
To obtain the judgment matrix for AHP, the third survey was conducted. The questionnaire, as shown in Appendix C, was distributed to three managers, four technicians from road freight e-commerce platforms, and three officials from the supervisory industry bureau, totaling ten questionnaires. Experts provided scores for the indicator layer factors under the same criterion level. The judgment matrix was ultimately derived using the geometric mean method for each set of scoring results by SPSS Statistics 29.0, as presented in Table 7.
Table 7.
Weights of criteria layer indicators.
Next, the weights of the secondary indicators within each primary indicator were calculated separately, resulting in the judgment matrices , , , and . The calculation results are presented in Table 8, Table 9, Table 10 and Table 11.
Table 8.
Weights of indicators for various factors of external environmental risk.
Table 9.
Weights of indicators for various factors of platform technical service risk.
Table 10.
Weights of indicators for various factors of platform organizational management risk.
Table 11.
Weights of indicators for various factors of cargo transportation risk.
Furthermore, the composite weights of the secondary indicator factors with respect to the target layer are derived through a comprehensive ranking of the hierarchy and a consistency check, as illustrated in Table 12.
Table 12.
Combined weights of secondary indicator factors for the objective layer.
A comprehensive consistency check was performed on the overall results, yielding a CR value of 0.0498, which is below the threshold of 0.1000. This indicates that the secondary indicators have successfully passed the consistency test, and the weight distribution among the indicators is statistically valid and reasonable.
By integrating the AHP weight results with the centrality measures derived from the DEMATEL method and applying Equation (11), we calculated the comprehensive weights for each risk factor in the FCE. The detailed computational results are presented in the Table 13. This combined approach ensures a robust and systematic weighting scheme that captures both the hierarchical structure of the indicators and their interrelationships within the network freight platform context.
Table 13.
Comprehensive weights summary of indicators at all levels.
4.2.2. Fuzzy Comprehensive Evaluation Results
To validate the application of the comprehensive evaluation methodology, it is essential that we select a specific evaluation subject and test the approach using real-world operational data. For this purpose, this study employs a case study approach, focusing on “The Hephaestus”, a representative road freight e-commerce platform based in Ningbo, as the evaluation subject. This platform serves as an ideal candidate for assessment due to its typical operational characteristics and comprehensive data availability, which align closely with the research objectives of this study. “The Hephaestus” is recognized as the largest and most rapidly expanding online freight platform in Ningbo. To date, the platform has registered 55,000 vehicles and successfully completed 1.35 million orders. Leveraging the capabilities of its online platform, the company’s business output has tripled since 2021. In light of this growth, the risk assessment methodology previously proposed is applied to conduct a comprehensive and systematic evaluation of risks for “The Hephaestus” along with recommendations for risk control strategies.
To complete this process, we engaged 45 professionals involved in the development, operation, and management of the platform, including industry experts and relevant administrative personnel, to conduct a fuzzy evaluation of the 20 risk factors associated with “The Hephaestus” platform. For each risk factor, evaluators were asked to select a single risk level from five predefined categories: “Very High”, “High”, “Medium”, “Low”, and “Very Low”. A total of 45 questionnaires were distributed, with 40 valid responses collected. The distribution of votes across the risk levels for each risk factor is presented in Table 14. This approach ensures a comprehensive and representative assessment of the platform’s risk profile, leveraging the collective expertise of stakeholders directly involved in its operations.
Table 14.
Risk level ratings for various operational factors of Ningbo’s “The Hephaestus” platform.
(1) Determination of Membership Degrees
The data from the table above were normalized using Equation (10) to calculate the fuzzy membership degrees for each indicator. The results are presented in Table 15. This normalization process ensures a standardized representation of the risk levels, facilitating a more accurate and consistent evaluation of the platform’s risk profile.
Table 15.
Fuzzy indicator membership degree evaluation table.
Based on the evaluation results, the fuzzy matrices , , , and were constructed for the subsets of External Environmental, Platform Technology and Service, Platform Organization and Management, and Cargo Transportation, respectively.
The weighted average method was employed to determine the membership degrees. According to Equation (12), the membership degree matrix was combined with the weight vector of the factors through fuzzy operations. This process was applied to evaluate the External Environmental, Platform Technology and Service, Platform Organization and Management, and Cargo Transportation factors separately, yielding the corresponding fuzzy comprehensive evaluation results , , , and , and the comprehensive evaluation results .
The maximum value for External Environmental is 0.1458, categorizing it as “high risk”. For Platform Technology and Service, the maximum value is 0.0409, falling under the “low risk” category. The Platform Organization and Management factor has a maximum value of 0.0930, also classified as “high risk”. Meanwhile, Cargo Transportation shows a maximum value of 0.0380, placing it in the “medium risk” category. These results highlight the varying risk levels across different dimensions, with external environmental factors and organization management posing the most significant challenges, while platform technology and cargo transportation present relatively lower but still notable risks.
From a comprehensive perspective, the numerical value of 0.1012, which corresponds to “high risk”, is the largest. This indicates that the overall operational risk level of the platform is classified as “high risk”. This assessment reflects the cumulative impact of various risk factors across different dimensions, highlighting the need for targeted risk mitigation strategies to enhance the platform’s operational resilience and sustainability.
(3) Analysis of Evaluation Results
Overall, adhering to the principle of maximum membership degree, the fuzzy comprehensive evaluation reveals that, according to the evaluation matrix , the platform’s operations are characterized by a “high” level of risk.
Table 16 presents the fuzzy comprehensive evaluation results for the operational risk indicators of the “The Hephaestus” online platform, following the evaluation procedures.
Table 16.
Evaluation results of operational risk indicators for “The Hephaestus”.
External environmental risks are categorized as “High”. Within the DEMATEL–ISM hierarchical model of overall risks, the second-level risk factors of this category are predominantly located in the middle and lower tiers, with the policy regime, economic level, and natural environment being the pivotal factors at the base of the model. These three factors rank among the top three in the risk system, indicating their role as core drivers of the entire risk system and their indirect influence on the operational performance of the online freight platform.
Platform technical service risk factors are assessed as “lower” risks. Vehicle–goods matching efficiency and information security are rated as high and extremely high risks, respectively. Order feedback management and customer relationship management are considered lower risks. According to the DEMATEL–ISM model analysis, the four level-two risk factors under this category are primarily found in the middle and upper layers of the model, exerting a direct impact on the overall platform. As the core differentiator of online freight transportation platforms from traditional models, the vehicle–cargo matching function is the most central factor, aside from external environmental factors, playing a significant role in the overall service quality of the online freight platform. However, its matching accuracy is affected by multiple dynamic factors such as the demand, personnel, and environment, increasing the uncertainty and complexity of the matching process. Therefore, the efficiency factor of matching is classified as a “higher” risk level. Information security, despite presenting low centrality and high causation, is rated very high due to the platform’s large volume of sensitive data, including user information and transaction records. Information security issues, though infrequent, can cause significant damage to the platform’s reputation and finances. Given the platform’s early developmental stage and small customer scale, the risks in order management and customer relationship management are relatively minor. However, as surface factors in the DEMATEL–ISM model, they directly affect customer experience, necessitating attention to ensuring service quality.
Platform organization management risk factors are classified as “higher” risks. Observing the five secondary factors under its purview, it is evident that the risks associated with the owner’s credit level, the stability of the capital chain, and owner’s credit level are higher, while the risks of organizational management and human resource management are lower. Utilizing the DEMATEL–ISM model, we find that organizational management risk impacts overall risk mainly through indirect channels, spanning multiple levels from L6 to L2. The risk transmission path is as follows: the trustworthiness level of the owner and vehicle owner → stability of the fund chain → organization management → human resource management. The trustworthiness of the owner and vehicle owner and the stability of the fund chain are in the middle-end position of the risk transmission chain. Cargo owners and vehicle owners, being the front and end of freight transactions, are at a high level, key to a deal conclusion. However, most cargo owners and vehicle owners connected to the online freight platform still rely on the nepotism of “acquaintances” under the traditional freight mode. The lack of specific customer inspection standards and scrutiny in actual customer organization management increases the instability of business transactions. The stability of the platform’s capital chain is also a crucial factor determining the platform’s normal operation. More sufficient capital investment can support the platform in recruiting high-level talent and conducting post-training. However, to maintain this stability, a supervision mechanism for each channel of use is required, and current feedback indicates weak supervision, which may make the platform vulnerable to market fluctuations.
Freight transportation risk factors are rated as “medium” risks. Through the analysis of the DEMATEL–ISM model, it is found that freight transportation risk has both indirect and direct impacts on the overall platform operation performance. The freight transportation process, being at the end of the business chain, has a simple influence structure for each factor. The risk transmission path is mainly reflected in internal factors: vehicle status → driver stability → cargo safety → transportation timeliness. Good vehicle performance and safety can improve driver job satisfaction and reduce personnel change rates. A stable driver can more effectively ensure cargo safety, reducing loss or damage. Cargo safety is the key premise for ensuring transportation timeliness. The risk of the vehicle condition is relatively low, given that the current freight market technology and maintenance measures can effectively control vehicle failures, which can be quickly remedied. Although driver stability impacts cargo safety and transport time, the impact is controllable; hence, the risk is rated as medium. The loss of goods will directly cause economic and reputational losses, so cargo security is considered a high risk. A reduced transportation time is considered a high risk because it harms customer satisfaction and market competitiveness.
4.2.3. Strategic Recommendations for “The Hephaestus”
The comprehensive analysis reveals that the operational risk of Ningbo’s “The Hephaestus” road freight e-commerce platform is considerable, with the majority of risk factors classified as high or medium risk levels. Based on these risk characteristics, this paper proposes corresponding risk control recommendations, as shown in Table 17.
Table 17.
Evaluation results of operational risk indicators for “The Hephaestus”.
5. Discussion
5.1. Hierarchical Structure Analysis of Risk Factors
5.1.1. Analysis of the Influence Path of Surface Factors
The surface factors of the structural model are the initial factors, specifically, S4—Freight Rate Change, S10—Order Feedback Management, S11—Customer Relationship Management, and S19—Transportation Timeliness. These four factors are the immediate influencers of the road freight e-commerce platform’s operational quality, with other factors being indirectly affected and triggered by them.
5.1.2. Analysis of the Influence Path of Middle-Level Factors
The middle-level factors are positioned from L2 to L6 within the recursive structure. The L2 layer comprises S1—Platform Competition and S14—Human Resource Management. Due to competition among similar online freight platforms, a platform may need to lower service fees to attract customers, potentially leading to an increase in order volume that surpasses the platform’s processing capacity, thereby affecting the accuracy of order entry. Additionally, the platform’s human resource management is tasked with training for customer order information entry and job allocation, making the platform’s human resource management a potential source of order entry risk.
The L3 factors encompass S8—Vehicle–Goods Matching Efficiency, S9—Information Security, S13—Organization Management, and S17—Goods Security. The operations of the road freight e-commerce platform comprise various departments, including human resources, technology, and transportation. If the organizational structure is ambiguous and the decision-making mechanism is flawed, roles may become ill-defined, and staff may be redundant, leading to internal human resource risks. The platform’s services largely depend on technical means to facilitate vehicle-to-goods matching to complete freight orders. Thus, the efficiency of vehicle-to-goods matching and the platform’s information security are pivotal. These two factors determine the timeliness of order fulfillment, the security of customer information and the quality of services. Concurrently, the emergence of the aforementioned five risk factors can tarnish the platform’s reputation and market image, diminishing its market competitiveness.
Risk factors at L4 and L5 include S3—Demand Change, S12—Capital Chain Stability, S18—Driver Stability, and S5—Supply Stability. If the supply of goods is not sustained, it impedes the forecasting of market demand and the realization of the road freight e-commerce platform’s economies of scale, increasing unit costs. An unstable supply can affect the market demand for our platform’s services and may force our platforms to bear higher transition costs. Supply stability is also a crucial indicator for platform investors to consider the platform’s development prospects and the return on investment. The risk of supply instability can weaken the platform’s ability to attract investment, leading to a lack of necessary funds for organizational management and after-sales service.
The factors at the L6 layer include S20—Vehicle Status, S15—Owner Credit Level, and S16—Owner Credit Level. A poor vehicle status can disrupt the normal development of a freight business, causing delivery delays, cargo damage, and other issues. This can erode shippers’ trust in the road freight e-commerce platform, leading them to choose alternative platforms, which, in turn, leads to instability in the platform’s cargo source and a reduction in market competitiveness. The credibility levels of the owner and the owner are in a dynamic equilibrium. Through investigations involving the owner and the owner, it has been found that issues such as the quality of goods and the transportation of non-compliant goods during transactions increase additional handling costs for the owner and lead to delays or refusals in signing collection orders after the transport operation is completed, which also makes it difficult to establish a stable supply. However, the provision of false information by the owner and the mismatch between the driver and the vehicle also affect the safety and efficiency of the cargo. The presence of trust risk also makes the dynamic relationship between the owner, platform, and cargo owner easily unbalanced.
5.1.3. Analysis of the Influence Path of Basic Layer Factors
The basic layer, situated at the L7 level in the hierarchical structure, comprises S2—Economic Level, S6—Natural Environment, and S7—Policy Influence. Economic fluctuations can readily induce unstable market demand, impacting the operational status of both vehicle and cargo owners and potentially leading to non-compliant and dishonest practices such as “overloading and speeding” in an effort to reduce costs. The natural environment is also a critical determinant of transportation timeliness. Adverse weather conditions like rain, snow, and strong winds not only increase the risk of traffic accidents but can also delay transportation, thereby affecting the platform’s operational efficiency. The management policies issued by the industry regulatory bodies not only regulate the industry’s normal operations but also guide the platform’s operations, establishing the primary management systems and operational modes of the road freight e-commerce platform.
5.2. Comprehensive Weight Analysis
Based on the weight values of each indicator, the comprehensive weights can be ranked in descending order as follows: Political Influence, Demand Changes, Vehicle–Cargo Matching Efficiency, Economic Level, Owner’s Integrity Level, Platform Competition, Vehicle Owner Integrity Level, Timeliness of Transportation, Stability of Capital Chain, Cargo Security, Organization Management, Source Stability, Driver Stability, Human Resource Management, Freight Rate Change, Customer Relationship Management, Information Security, Vehicle Status, Natural Environment, and Order Feedback Management. By analyzing the comprehensive weight values and their rankings, the primary risk categories can be ordered by their total weight contributions as follows: External Environmental (45.97%) > Platform Organization and Management (25.53%) > Platform Technology and Service (14.98%) > Cargo Transportation (13.51%). As illustrated in Figure 7 and Figure 8, the combined weight of External Environmental and Platform Organization and Management factors exceeds 72%, making them the most critical risk categories. This is primarily because road freight e-commerce platforms, as an emerging business model that has only appeared in the last three years, are still in their developmental infancy and heavily rely on external factors such as policies and economic conditions to drive their growth. Additionally, as a new component of the platform economy, road freight e-commerce platforms integrate the operational aspects of platform management with traditional freight logistics, necessitating new demands in internal organization management. This includes not only optimizing staff roles and workflows but also establishing mechanisms to assess the integrity levels of shippers and carriers to ensure operational reliability.
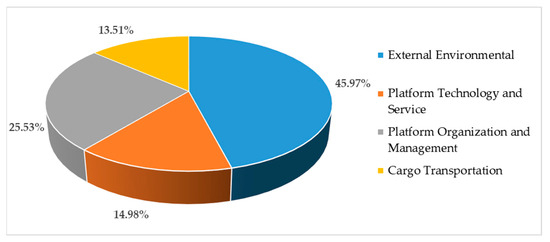
Figure 7.
Comprehensive weight of primary indicators.
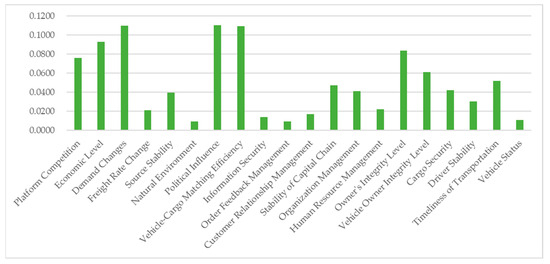
Figure 8.
Comprehensive weight of secondary indicators.
The combined weight of Platform Technology and Service and Cargo Transportation factors accounts for 28%, classifying them as secondary risk categories. This is because platform technologies primarily serve as operational tools, enhancing service quality through functions such as route planning and cargo tracking. However, the effectiveness of these technologies fundamentally depends on high-level organization management and favorable market and natural environmental conditions. Compared to the unpredictability of external environments and the uncertainties in organization management, the cargo transportation process involves fewer stakeholders and simpler workflows, and its management can be effectively supported by freight technologies. Therefore, these two primary risk categories have relatively lower weights. Nevertheless, among the top ten secondary risk factors, two belong to the Platform Technology and Service and Cargo Transportation categories: “Vehicle–Cargo Matching Efficiency” and “Timeliness of Transportation”. These factors are critical indicators of operational efficiency and service quality, directly influencing the platform’s market competitiveness and user experience. Despite the lower weight of their primary risk categories, these specific factors are assigned higher weights due to their significant impact on the platform’s core operations.
5.3. Applicability and Limitations
The survey respondents encompassed a diverse range of stakeholders, including online freight platform operators, transportation consignors, transportation executors (drivers), industry regulatory authorities, and platform technical developers. As a result, the hierarchical risk structure and evaluation methodology identified in this study are applicable to all road freight e-commerce platforms operating under mainstream service models (as shown in Figure 2). However, specific evaluation results must be tailored to the operational data of individual online freight enterprises.
Although the survey covered multiple entities involved in road freight e-commerce platforms and employed statistical and systematic analysis methods to mitigate subjective biases, the questionnaire-based data collection process inevitably retained some degree of individual subjectivity. Currently, more objective data collection methods are available, such as automated data acquisition from systems tracking order and delivery status, credit systems, quality evaluations, and industry management. These methods enable big-data-based risk factor mining and in-depth analysis. However, they require sophisticated data processing capabilities and stringent data quality assurance protocols. As road freight e-commerce platforms continue to mature, big-data-driven risk research is expected to yield more optimal outcomes, providing a more robust foundation for risk assessment and management in this evolving sector.
6. Conclusions
Taking into full account the distinctive operational positioning, business environment, and service model differences between road freight e-commerce platforms and conventional e-commerce platforms, we have identified four major categories of operational risk factors, external environment, technology and services, organizational management, and freight transportation, encompassing a total of 20 specific indicators. Furthermore, through the combined application of the DEMATEL and ISM systematic analysis methods, we discovered that these factors can be stratified into a seven-level hierarchical structure, with evident interaction and transmission pathways between different levels. Our results demonstrate a new perspective on the internal architecture of the risk framework of e-commerce platforms, which has not been fully explored in previous research (e.g., [21,47]). By doing so, we contribute to the broader understanding of operational risks associated with platform logistics proposed in [5] and provide a foundation for a more accurate assessment and control.
Building upon this foundation, we developed a risk evaluation methodology for road freight e-commerce platforms based on FCE. By integrating AHP and DEMATEL to derive comprehensive weights, our approach not only incorporates qualitative expert experience but also considers the previously identified interactions among risk factors. This integration enhances the systematic nature and accuracy of risk assessment. Our methodology provides valuable guidance and reference for the healthy development of road freight e-commerce platforms, which represent an emerging, specialized and critically important vertical segment within the e-commerce domain.
Author Contributions
Conceptualization, R.H. and X.Z.; investigation, W.X.; data curation, Z.C.; writing—original draft preparation, R.H.; writing—review and editing, R.H. and Z.C.; supervision, X.Z. All authors have read and agreed to the published version of the manuscript.
Funding
This research was funded by a research grant from the Ningbo Philosophy and Social Science Planning Project (No. G2024-1-12).
Data Availability Statement
The data presented are not publicly accessible due to privacy concerns, but can be obtained upon request from the corresponding author.
Conflicts of Interest
The authors declare no conflicts of interest.
Appendix A
Questionnaire for Initial Identification of Risks in Ningbo Network Freight Industry
This questionnaire aims to identify the risk factors present within Ningbo’s network freight industry for the first time. We invite experts to assess the proposed risk factors using the Risk Hazard Rating Scale, as shown in Table A1.
Table A1.
The risk factor scoring table.
Table A1.
The risk factor scoring table.
| Risk Hazard Degree | Fraction | Scoring Description |
|---|---|---|
| High Risk | (15,20] | The risk is extremely serious |
| Medium Risk | (10,15] | The risk is medium, causing certain losses |
| Low Risk | (5,10] | Low-risk hazard |
| Very Low Risk | [0,5] | Risk hazards are negligible |
| Primary Factor | Secondary Factor | Score |
| External Environmental Risks | Platform Competition | |
| Economic Level | ||
| Demand Changes | ||
| Freight Rate Change | ||
| Source Stability | ||
| Natural Environment | ||
| Policy Implications | ||
| Platform Technology and Service Risks | Location Status Monitoring | |
| Actual Carrier Qualification Review | ||
| Platform Process Design | ||
| Vehicle–Cargo Matching Efficiency | ||
| Information Security | ||
| Order Feedback Management | ||
| Customer Relationship Management | ||
| Value-added Service Operation | ||
| Platform Organization and Management Risks | Platform Development Strategy Level | |
| Stability of Capital Chain | ||
| Organization Management | ||
| Human Resource Management | ||
| Owner’s Integrity Level | ||
| Vehicle Owner Integrity Level | ||
| Carriage Contract Risks | ||
| Consignment Contract Risk | ||
| Cargo Transportation Risk | Cargo Security | |
| Driver Stability | ||
| Timeliness of Transportation | ||
| Vehicle Status |
Appendix B
Association Analysis Questionnaire on Operational Risk in Ningbo Network Freight Industry
Thank you for your dedicated research into the operational risks within Ningbo’s network freight industry and for providing your insightful comments. This questionnaire has been designed to pinpoint the risk factors within Ningbo’s network freight sector. We greatly appreciate the time you have taken to complete this survey.
Experts are cordially invited to evaluate the following 20 risk factors in accordance with the judgment matrix scale, as shown in Table A2.
Table A2.
Judgment matrix assessment.
Table A2.
Judgment matrix assessment.
| Scale | Meaning of Scale of Judgment Matrix | |||||||||||||||||||
|---|---|---|---|---|---|---|---|---|---|---|---|---|---|---|---|---|---|---|---|---|
| 4 | Indicates that the former has a significant impact on the latter when compared with the two factors | |||||||||||||||||||
| 3 | Indicates that the former has a greater influence on the latter than the two factors | |||||||||||||||||||
| 2 | Indicates the comparison of two factors; indicates that the former has a moderate impact on the latter | |||||||||||||||||||
| 1 | Indicates that the former has less influence on the latter than the two factors | |||||||||||||||||||
| 0 | Indicates that two factors have no influence on each other | |||||||||||||||||||
| S1—Platform Competition, S2—Economic Level, S3—Demand Changes, S4—Freight Rate Change, S5—Source Stability, S6—Natural Environment, S7—Policy Implications, S8—Vehicle–Cargo Matching Efficiency, S9—Information Security, S10—Order Feedback Management, S11—Customer Relationship Management, S12—Stability of Capital Chain, S13—Organization Management, S14—Human Resource Management, S15—Vehicle Owner Integrity Level, S16—Vehicle Owner Integrity Level, S17—Cargo Security, S18—Driver Stability, S19—Timeliness of Transportation, and S20—Vehicle Status | ||||||||||||||||||||
| S1 | S2 | S3 | S4 | S5 | S6 | S7 | S8 | S9 | S10 | S11 | S12 | S13 | S14 | S15 | S16 | S17 | S18 | S19 | S20 | |
| S1 | ||||||||||||||||||||
| S2 | ||||||||||||||||||||
| S3 | ||||||||||||||||||||
| S4 | ||||||||||||||||||||
| S5 | ||||||||||||||||||||
| S6 | ||||||||||||||||||||
| S7 | ||||||||||||||||||||
| S8 | ||||||||||||||||||||
| S9 | ||||||||||||||||||||
| S10 | ||||||||||||||||||||
| S11 | ||||||||||||||||||||
| S12 | ||||||||||||||||||||
| S13 | ||||||||||||||||||||
| S14 | ||||||||||||||||||||
| S15 | ||||||||||||||||||||
| S16 | ||||||||||||||||||||
| S17 | ||||||||||||||||||||
| S18 | ||||||||||||||||||||
| S19 | ||||||||||||||||||||
| S20 | ||||||||||||||||||||
Appendix C
Questionnaire for Classification of Operation Risks of Ningbo Network Freight Transport Platform
We extend our sincere gratitude to all experts for their contributions to the research on operational risk management within Ningbo’s network freight platform, as well as for their invaluable feedback. The purpose of this questionnaire is to investigate the significance and risk levels of various risk factors associated with the operation of Ningbo’s network freight platform, ultimately to facilitate a comprehensive risk assessment. We appreciate your dedication in taking the time to complete this questionnaire.
We kindly request that experts evaluate and compare the importance of the risk factors to complete the filling of Table A4, Table A5, Table A6, Table A7, Table A8, using a scale ranging from 1 to 9 in Table A3.
Table A3.
Scale criteria and descriptions.
Table A3.
Scale criteria and descriptions.
| Scale | Meaning |
|---|---|
| 1 | Equally important |
| 3 | Slightly important |
| 5 | Strong and important |
| 7 | Strongly important |
| 9 | Extremely important |
| 2, 4, 6, 8 | Intermediate value of two adjacent judgments |
| Countdown | Indicator i is less important than indicator j (kij = 1/kji) |
Table A4.
The judgment matrix for evaluating the operational risk criteria levels of Ningbo’s network freight platform.
Table A4.
The judgment matrix for evaluating the operational risk criteria levels of Ningbo’s network freight platform.
| External Environmental Risks | Platform Technology Risks | Platform Organization Management Risks | Platform Business Risks | |
|---|---|---|---|---|
| External Environmental Risks | 1 | |||
| Platform Technology Risks | - | 1 | ||
| Platform Organization Management Risks | - | - | 1 | |
| Cargo Transportation Risk | - | - | - | 1 |
Table A5.
Weighted judgment matrix for each sub-factor of external environmental risks.
Table A5.
Weighted judgment matrix for each sub-factor of external environmental risks.
| Platform Competition | Economic Level | Demand Changes | Freight Rate Change | Source Stability | Natural Environment | Policy Implications | |
|---|---|---|---|---|---|---|---|
| Platform Competition | 1 | ||||||
| Economic Level | - | 1 | |||||
| Demand Changes | - | - | 1 | ||||
| Freight Rate Change | - | - | - | 1 | |||
| Source Stability | - | - | - | - | 1 | ||
| Natural Environment | - | - | - | - | - | 1 | |
| Policy Implications | - | - | - | - | - | - | 1 |
Table A6.
Weighted judgment matrix for sub-factors of platform technology and service risks.
Table A6.
Weighted judgment matrix for sub-factors of platform technology and service risks.
| Vehicle–Cargo Matching Efficiency | Information Security | Order Feedback Management | Customer Relationship Management | |
|---|---|---|---|---|
| Vehicle–Cargo Matching Efficiency | 1 | |||
| Information Security | - | 1 | ||
| Order Feedback Management | 1 | |||
| Customer Relationship Management | 1 |
Table A7.
Weighted judgment matrix for each sub-factor of platform organization and management risks.
Table A7.
Weighted judgment matrix for each sub-factor of platform organization and management risks.
| Stability of Capital Chain | Organization Management | Human Resource Management | Vehicle Owner Integrity Level | Vehicle Owner Integrity Level | |
|---|---|---|---|---|---|
| Stability of Capital Chain | 1 | ||||
| Organization Management | - | 1 | |||
| Human Resource Management | - | - | 1 | ||
| Vehicle Owner Integrity Level | - | - | - | 1 | |
| Vehicle Owner Integrity Level | - | - | - | - | 1 |
Table A8.
Weighted judgment matrix for each sub-factor of freight transportation risks.
Table A8.
Weighted judgment matrix for each sub-factor of freight transportation risks.
| Cargo Security | Driver Stability | Timeliness of Transportation | Vehicle Status | |
|---|---|---|---|---|
| Cargo Security | 1 | |||
| Driver Stability | - | 1 | ||
| Timeliness of Transportation | - | - | 1 | |
| Vehicle Status | - | - | - | 1 |
References
- Beijing Zhongjiao Xinglu Information Technology Co., Ltd. Big Data Analysis Report on China’s Highway Freight Operations; Beijing Zhongjiao Xinglu Information Technology, Co., Ltd.: Beijing, China; Chang’an University: Xi’an, China, 2023. [Google Scholar]
- Leon, F.; Bădică, C. An optimization web service for a freight brokering system. Serv. Sci. 2017, 9, 324–337. [Google Scholar] [CrossRef]
- Su, J.; Wang, D.; Zhang, F.; Xu, B.; Ouyang, Z.A. Multi-criteria group decision-making method for risk assessment of live-streaming e-commerce platform. J. Theor. Appl. Electron. Commer. Res. 2023, 18, 1126–1141. [Google Scholar] [CrossRef]
- Xu, X.; Yang, Y. Analysis and countermeasure on evolutionary competition of freight platform development dilemma. J. Highway Transp. Res. Dev. 2024, 41, 186–194. [Google Scholar]
- David, H. The injuries of platform logistics. Media. Cult. Soc. 2020, 42, 521–536. [Google Scholar]
- Monahan, T. Monopolizing Mobilities: The data politics of ride-hailing platforms in US cities. Telemat. Inform. 2020, 55, 101436. [Google Scholar] [CrossRef]
- Sun, P.; Gu, L. Optimization of cross-border e-commerce logistics supervision system based on internet of things technology. Complexity 2021, 12, 12–17. [Google Scholar] [CrossRef]
- Wang, Z.; Li, Y.; Gu, F.; Guo, J.; Wu, X. Two-sided matching and strategic selection on freight resource sharing platforms. Phys. A Stat. Mech. Appl. 2020, 559, 125014. [Google Scholar] [CrossRef]
- Arim, P.; Roger, C.; Soohyun, C.; Zhao, Y. The determinants of online matching platforms for freight services. Transp. Res. E Logist. Transp. Rev. 2023, 179, 103284. [Google Scholar]
- Soumya, C.; Parvathi, J.S.; Srinivas, S.; Sowmya, S.; Shah, T. A blockchain platform for the truck freight marketplace in India. Oper. Manage. Res. 2023, 16, 694–704. [Google Scholar]
- Hu, S.; Shu, S.; Chen, Z.; Shao, Y.; Na, X.; Xie, C.; Stettler, M.; Lee, D.-H. Sustainable impact analysis of freight pooling strategies on city crowdsourcing logistics platform. Transp. Res. D Transp. Environ. 2024, 130, 104167. [Google Scholar] [CrossRef]
- Benli, D.; Çimen, M.; Soysal, M. Sustainable vehicle allocation decisions under a vertical logistics collaboration setting. J. Clean. Prod. 2024, 453, 142226. [Google Scholar] [CrossRef]
- Chen, L. Research on the current development status and countermeasures of Ningbo’s online freight platforms. Ningbo Econ. (Sanjiang Forum) 2022, 8, 19–21. [Google Scholar]
- Bro, P.; Wallberg, F. Gatekeeping in a digital era: Principles, practices and technological platforms. J. Pract. 2015, 9, 92–105. [Google Scholar] [CrossRef]
- Yang, Y.; Li, J. Study on dynamic development mechanism and simulation of network freight transport based on tripartite evolutionary game. J. Highw. Transp. Res. Dev. 2022, 39, 180–190. [Google Scholar]
- Han, X.F. Analysis of questionnaire survey on carless carriers. China Storage Transp. 2017, 6, 40–41. [Google Scholar]
- Li, J.Q. Research on the Development of Carless Carriers in China; Nanjing University Press: Nanjing, China, 2017; pp. 42–43. [Google Scholar]
- Zhang, W. Study on Systematic Solution of Carless Carrier in German Dry Port; Jilin University: Changchun, China, 2017; pp. 28–35. [Google Scholar]
- Giaglis, G.; Minis, I.; Tatarakis, A. Minimizing logistics risk through real-time vehicle routing and mobile technologies: Research to date and future trends. Int. J. Phys. Distrib. Logist. Manag. 2004, 34, 749–764. [Google Scholar] [CrossRef]
- Kim, M.; Hong, K.; Lee, C. Analysis of the risks of overseas advancement by logistics companies applying AHP. Fut. Inf. Technol. 2014, 276, 391–398. [Google Scholar]
- Liang, K.; Zhang, C.; Jiang, C. Analyzing default risk among P2P platforms based on the LAS-STACK method by considering multidimensional signals under specific economic contexts. Electron. Commer. Res. 2021, 22, 77–111. [Google Scholar] [CrossRef]
- Filipsson, A.F.; Sand, S.; Nilsson, J. The benchmark dose method—Review of available models and recommendations for application in health risk assessment. Crit. Rev. Toxicol. 2003, 34, 55–64. [Google Scholar]
- Chen, K.; Chen, H.; Che, Z. Simulation of production and transportation planning with uncertainty and risk. WSEAS Trans. Comput. 2008, 7, 1521–1530. [Google Scholar]
- Sakhapov, R.L.; Nikolaeva, R.V.; Gatiyatullin, M.H. Risk management model in road transport systems. J. Phys. Conf. Ser. 2016, 738, 12008. [Google Scholar] [CrossRef]
- Chang, L.Y.; Hu, D.W.; Chen, H.Y. Risk Warning of Carless Carriers Based on PCA-Logit Model. J. Jiangsu Univ. (Nat. Sci. Ed.) 2017, 38, 273–279. [Google Scholar]
- Liu, S.; Jiang, L. Research on partner selection of carless carriers based on PCA-BP neural network. Railw. Transp. Econ. 2018, 40, 45–50. [Google Scholar]
- Mohammadfam, I.; Kalatpour, O.; Gholamizadeh, K. Quantitative assessment of safety and health risks in HAZMAT road transport using a hybrid approach: A case study in Tehran. ACS Appl. Energy Mater. 2020, 27, 240–250. [Google Scholar] [CrossRef]
- Chen, C. Risk Analysis and assessment of network freight platform model construction. Logist. Eng. Manag. 2021, 43, 175–177. [Google Scholar]
- Abdullah, R.; Xavier, B.D.; Namgung, H.; Varghese, V.; Fujiwara, A. Managing transit-oriented development: A comparative analysis of expert groups and multi-criteria decision-making methods. Sustain. Cities Soc. 2024, 115, 105871. [Google Scholar] [CrossRef]
- Li, H.; Wang, Y.; Chong, D.; Rajendra, D.; Skitmore, M. Fine-Kinney fuzzy-based occupational health risk assessment for workers in different construction trades. Automat. Constr. 2024, 168, 105738. [Google Scholar] [CrossRef]
- Luo, Y.; Hou, W.; Li, B. Construction and implementation path of evaluation system for Chinese path to economic modernization. J. Manag. 2024, 37, 52–69. [Google Scholar]
- Schäfer, M.; Glotzbach, P.J.; Pereira, J.S.; Sharma, V.; Goodwin, M.L.; Cleveland, J.C.; Selzman, C.H.; Carroll, A.; Barker, A.J.; Aftab, M.; et al. Aortic shape with high-acute isthmic angle post frozen elephant trunk reconstruction is associated with worse postoperative outcomes: Multisite, principal component analysis, retrospective study. JTCVS Struct. Endovasc. 2024, 3, 100025. [Google Scholar] [CrossRef]
- Frias, L.F.; Farias, I.A.; Wanke, P.F. Tax-related aspects of logistics network planning: A case study in the Brazilian petrochemical industry. Int. J. Logist. Res. Appl. 2014, 17, 114–135. [Google Scholar] [CrossRef]
- Luo, J.H. Tax-related risks of network freight operation and countermeasures. China Logist. Procure. 2020, 23, 88–89. [Google Scholar]
- Halaburda, H.; Oberholzer-Gee, F. The limits of scale. Harvard Bus. Rev. 2014, 11, 32–47. [Google Scholar]
- Ma, X.F.; Zhang, X.Y.; Guo, L.Y. Study on the evolutionary mechanism of double-round monopoly of super platforms in China—Based on four-party evolutionary game. Systems 2023, 11, 492. [Google Scholar] [CrossRef]
- Choi, T.; Chiu, C.; Chan, H. Risk management of logistics systems. Transp. Res. Part E Logist. Transp. Rev. 2016, 90, 1–6. [Google Scholar] [CrossRef]
- Jiang, X. Liability Risks Faced by NVOCCs: Forum for Decision-Making: Symposium on Decision Theory and Methodology; Decision & Information Publishing House: Beijing, China, 2016. [Google Scholar]
- Zhang, L.W.; Zhao, Q.M. On the credit risk of NVOCC and its avoidance methods. Insur. Res. 2010, 1, 82–87. [Google Scholar]
- Cheng, G.Z.; Gang, J.; Cheng, R. Identification and alignment design of roadside accident-prone sections in highway freight passage. J. Harbin Inst. Technol. 2022, 54, 131–138. [Google Scholar]
- Sarsangi, V.; Karimi, A.; Hadavandi, E. Prioritizing risk factors of hazardous material road transportation accidents using the fuzzy AHP method. Work 2023, 75, 275–286. [Google Scholar] [CrossRef]
- Vaidya, O.S.; Kumar, S. Analytic hierarchy process: An overview of applications. Eur. J Oper. Res. 2006, 169, 1–29. [Google Scholar] [CrossRef]
- Grossmann, M. A Dynamic contest model of platform competition in two-sided markets. J. Theor. Appl. Electron. Commer. Res. 2021, 16, 2091–2109. [Google Scholar] [CrossRef]
- Miller, J. The effect of truckload driver turnover on truckload freight pricing. J. Bus. Logist. 2020, 41, 294–309. [Google Scholar] [CrossRef]
- Read, G. Managing the risks associated with technological disruption in the road transport system: A control structure modelling approach. Ergonomics 2024, 67, 498–514. [Google Scholar] [CrossRef] [PubMed]
- Tian, R.; Wang, C.; Ma, Z.; Liu, Y.; Gao, S. Research on vehicle-cargo matching algorithm based on improved dynamic Bayesian network. Comput. Ind. Eng. 2022, 168, 108039. [Google Scholar] [CrossRef]
- Li, X. An evolutionary game-theoretic analysis of enterprise information security investment based on information sharing platform. Manag. Decis. Econ. 2022, 43, 595–606. [Google Scholar] [CrossRef]
- Xiang, L.; Hou, R. Research on innovation management of enterprise supply chain digital platform based on blockchain technology. Sustainability 2023, 15, 10198. [Google Scholar] [CrossRef]
- Sun, F.; Wang, J.; Cheng, R. An improved anisotropic continuum model considering the driver’s desire for steady driving. Phys. A Stat. Mech. Its Appl. 2019, 525, 1449–1462. [Google Scholar] [CrossRef]
- Villarreal, B. Lean road transportation—A systematic method for the improvement of road transport operations. Prod. Plan. Control 2016, 27, 865–877. [Google Scholar] [CrossRef]
- Quan, L.; Chang, R.; Guo, C.; Li, B. Vehicle state joint estimation based on lateral stiffness. Sensors 2023, 23, 8960. [Google Scholar] [CrossRef]


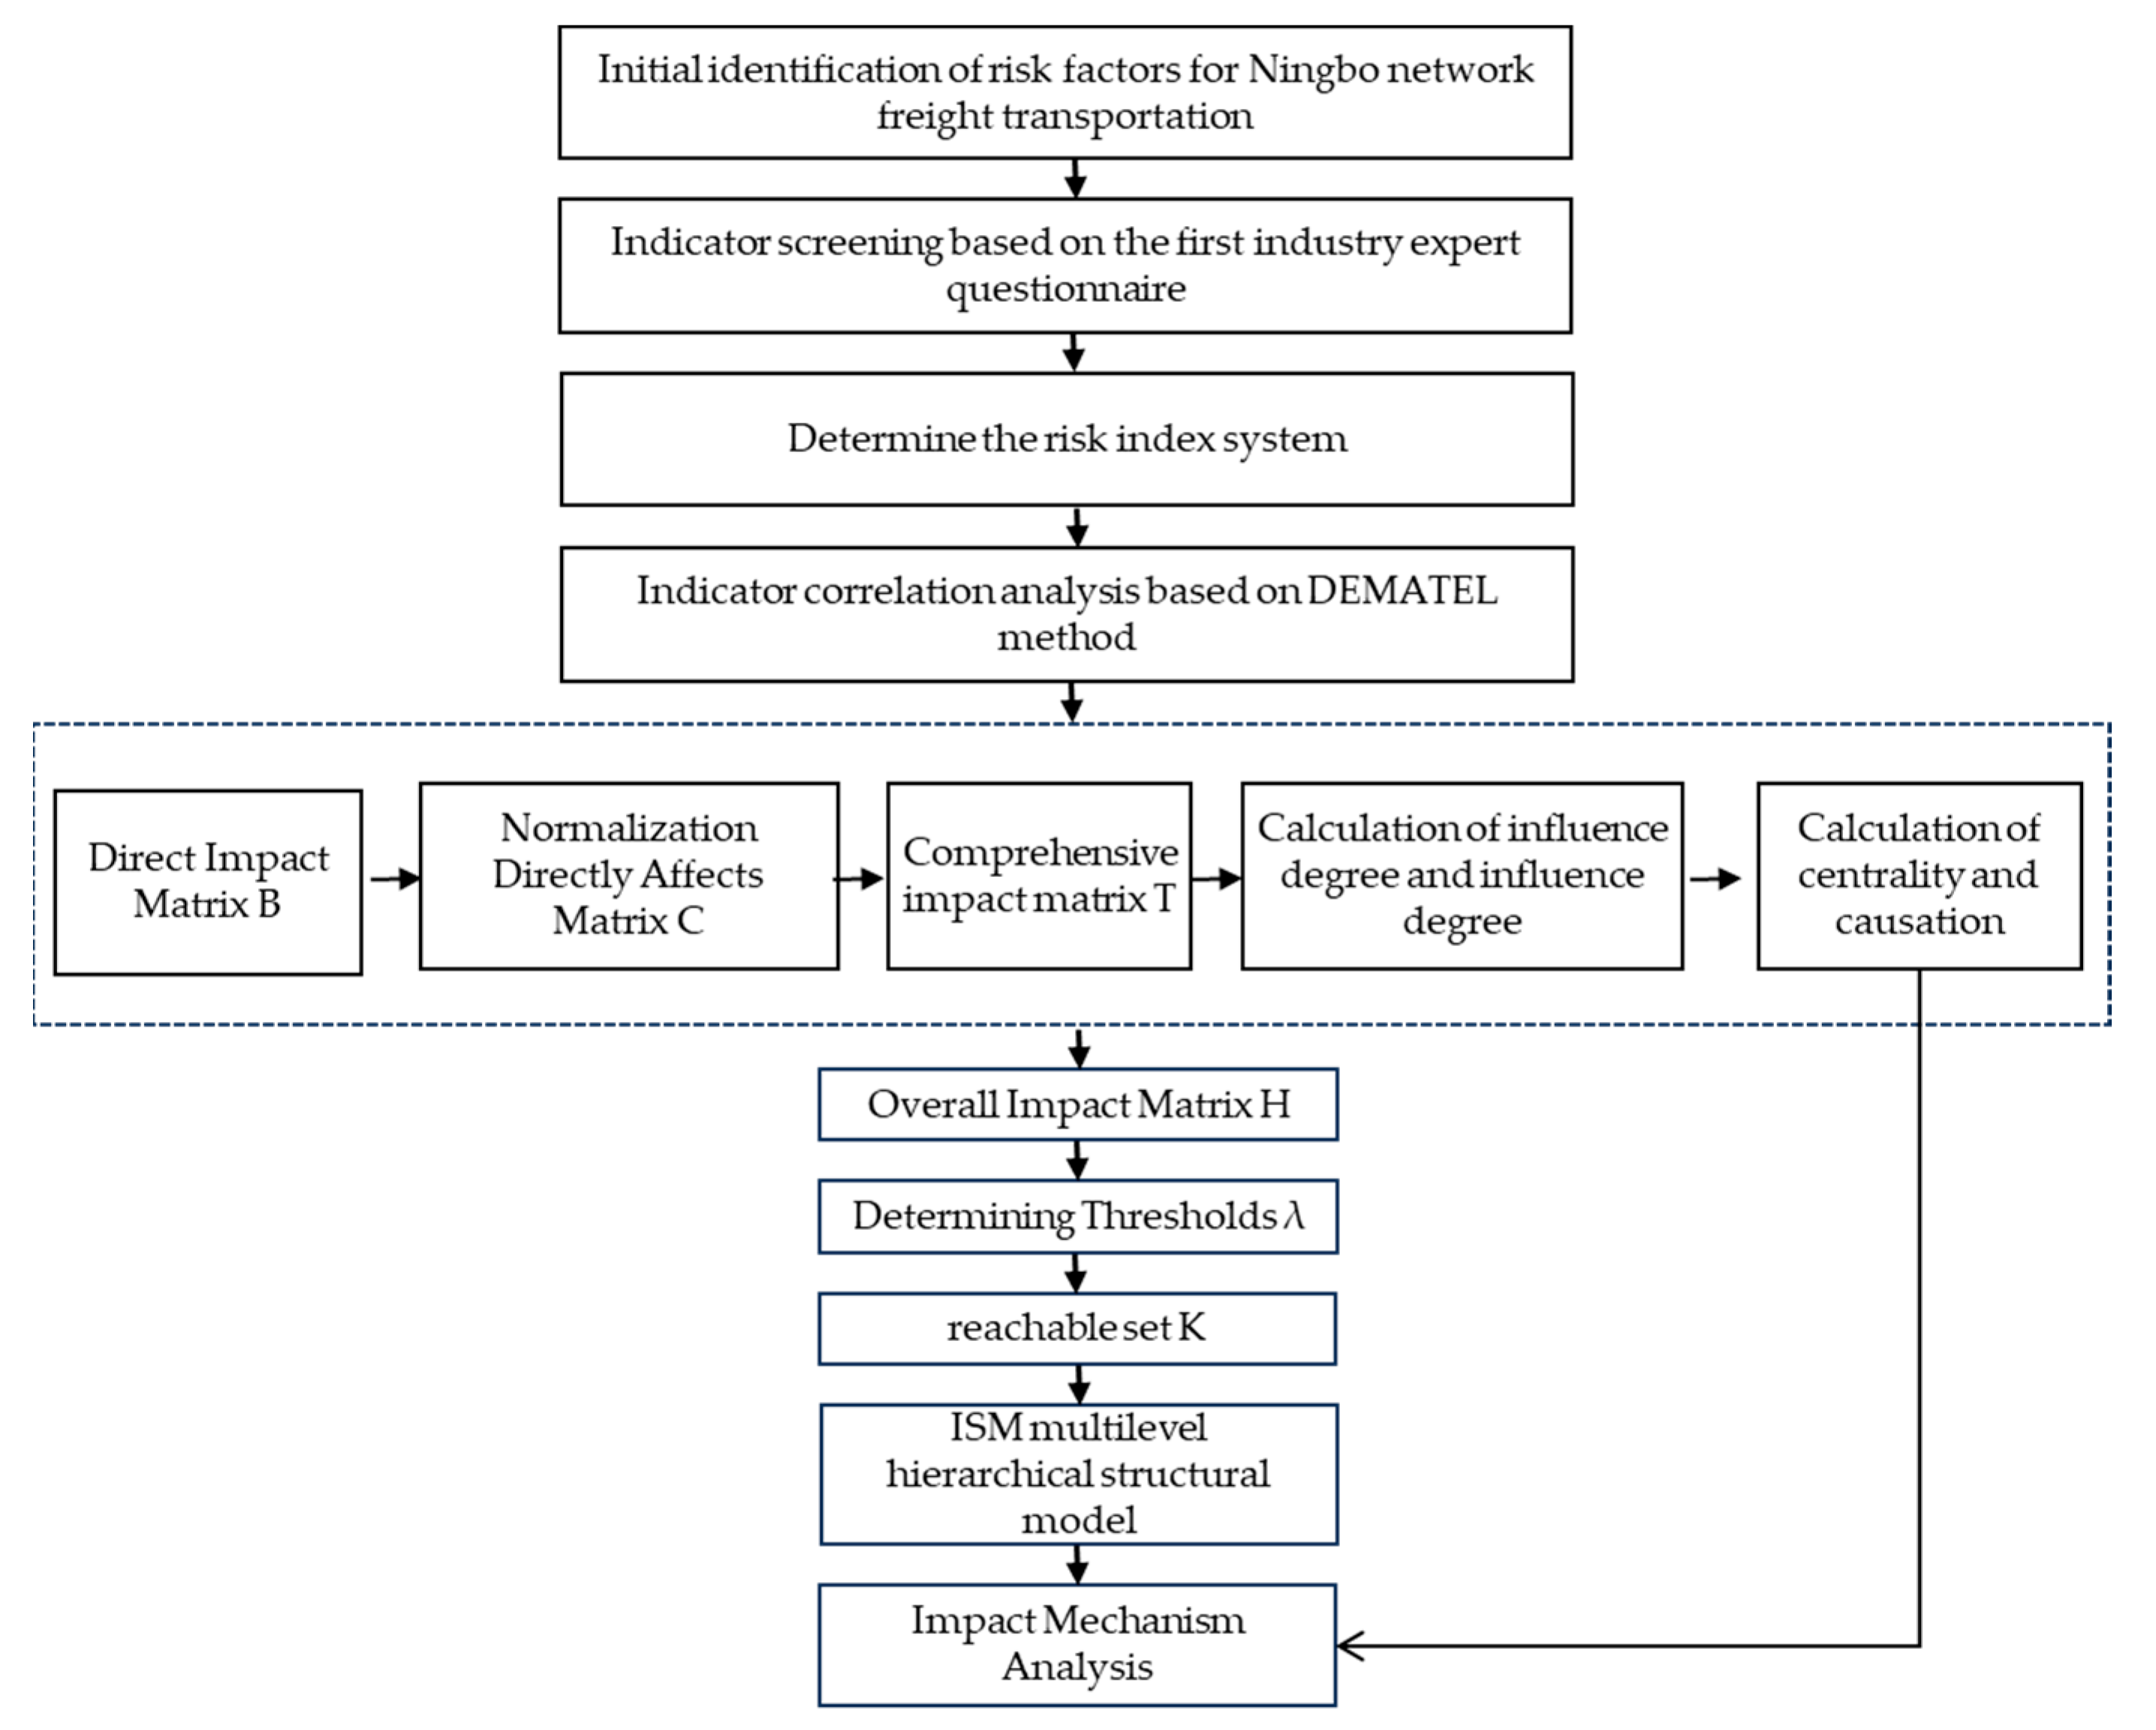
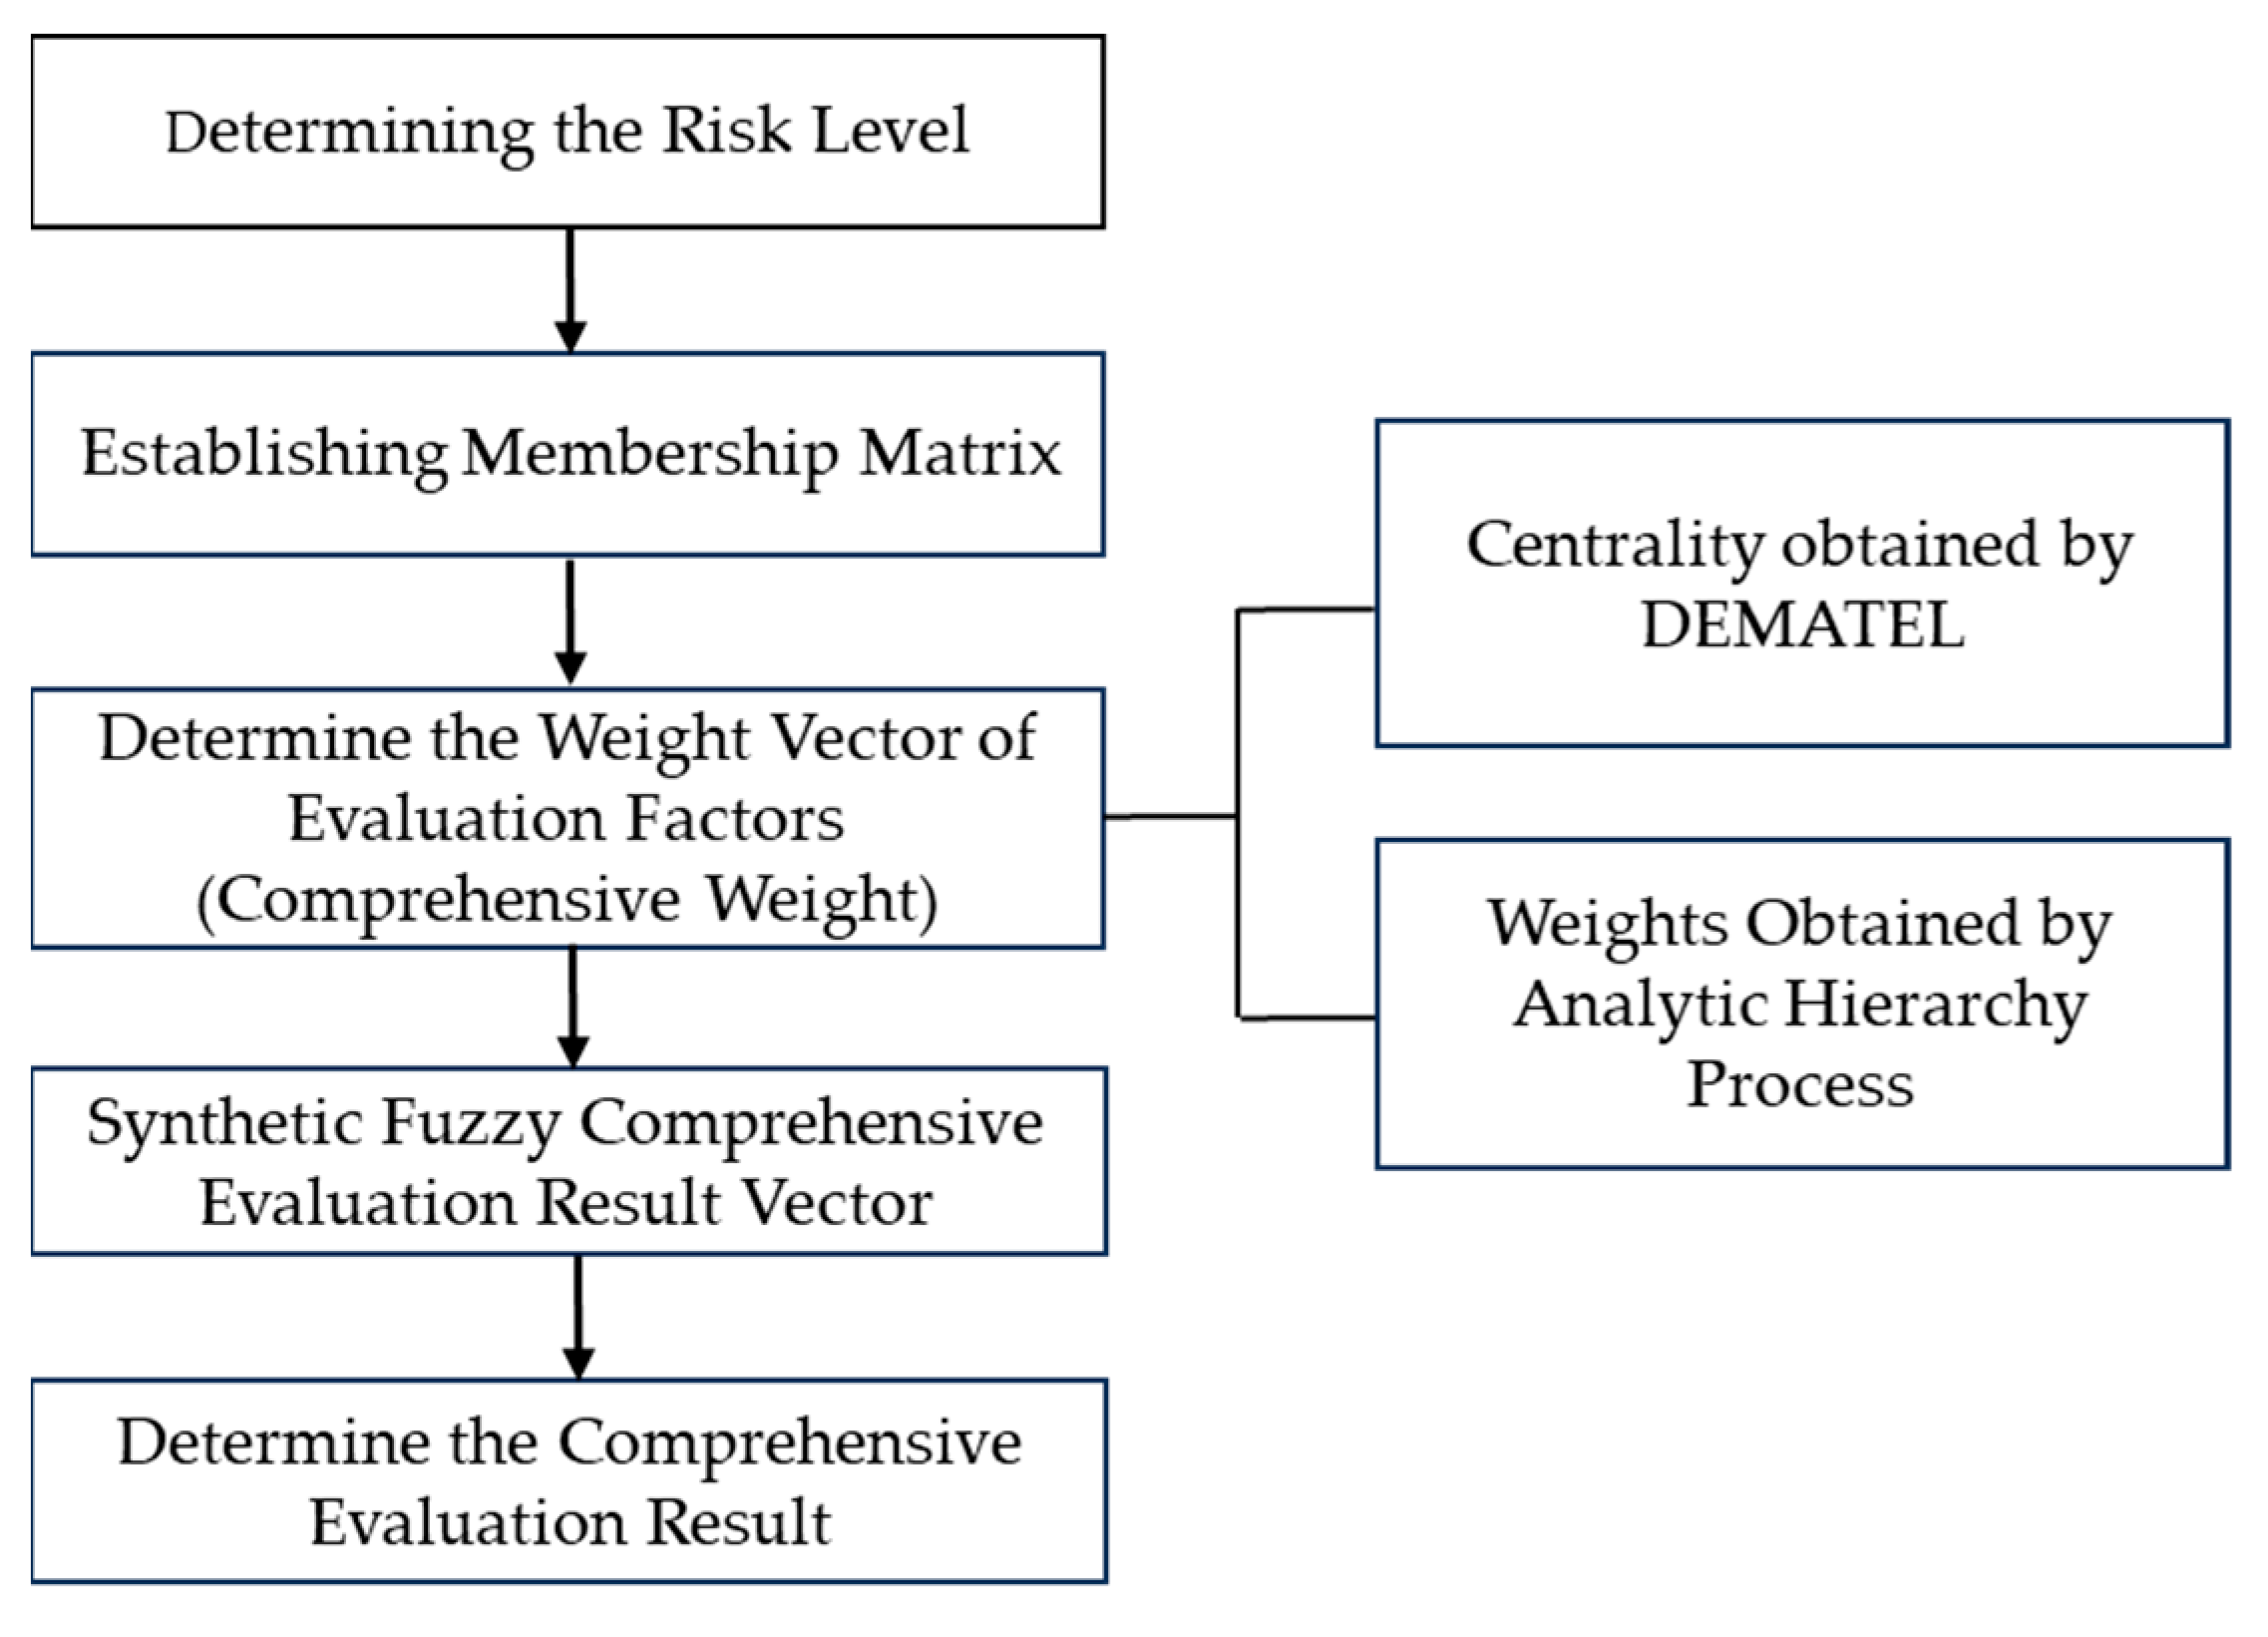
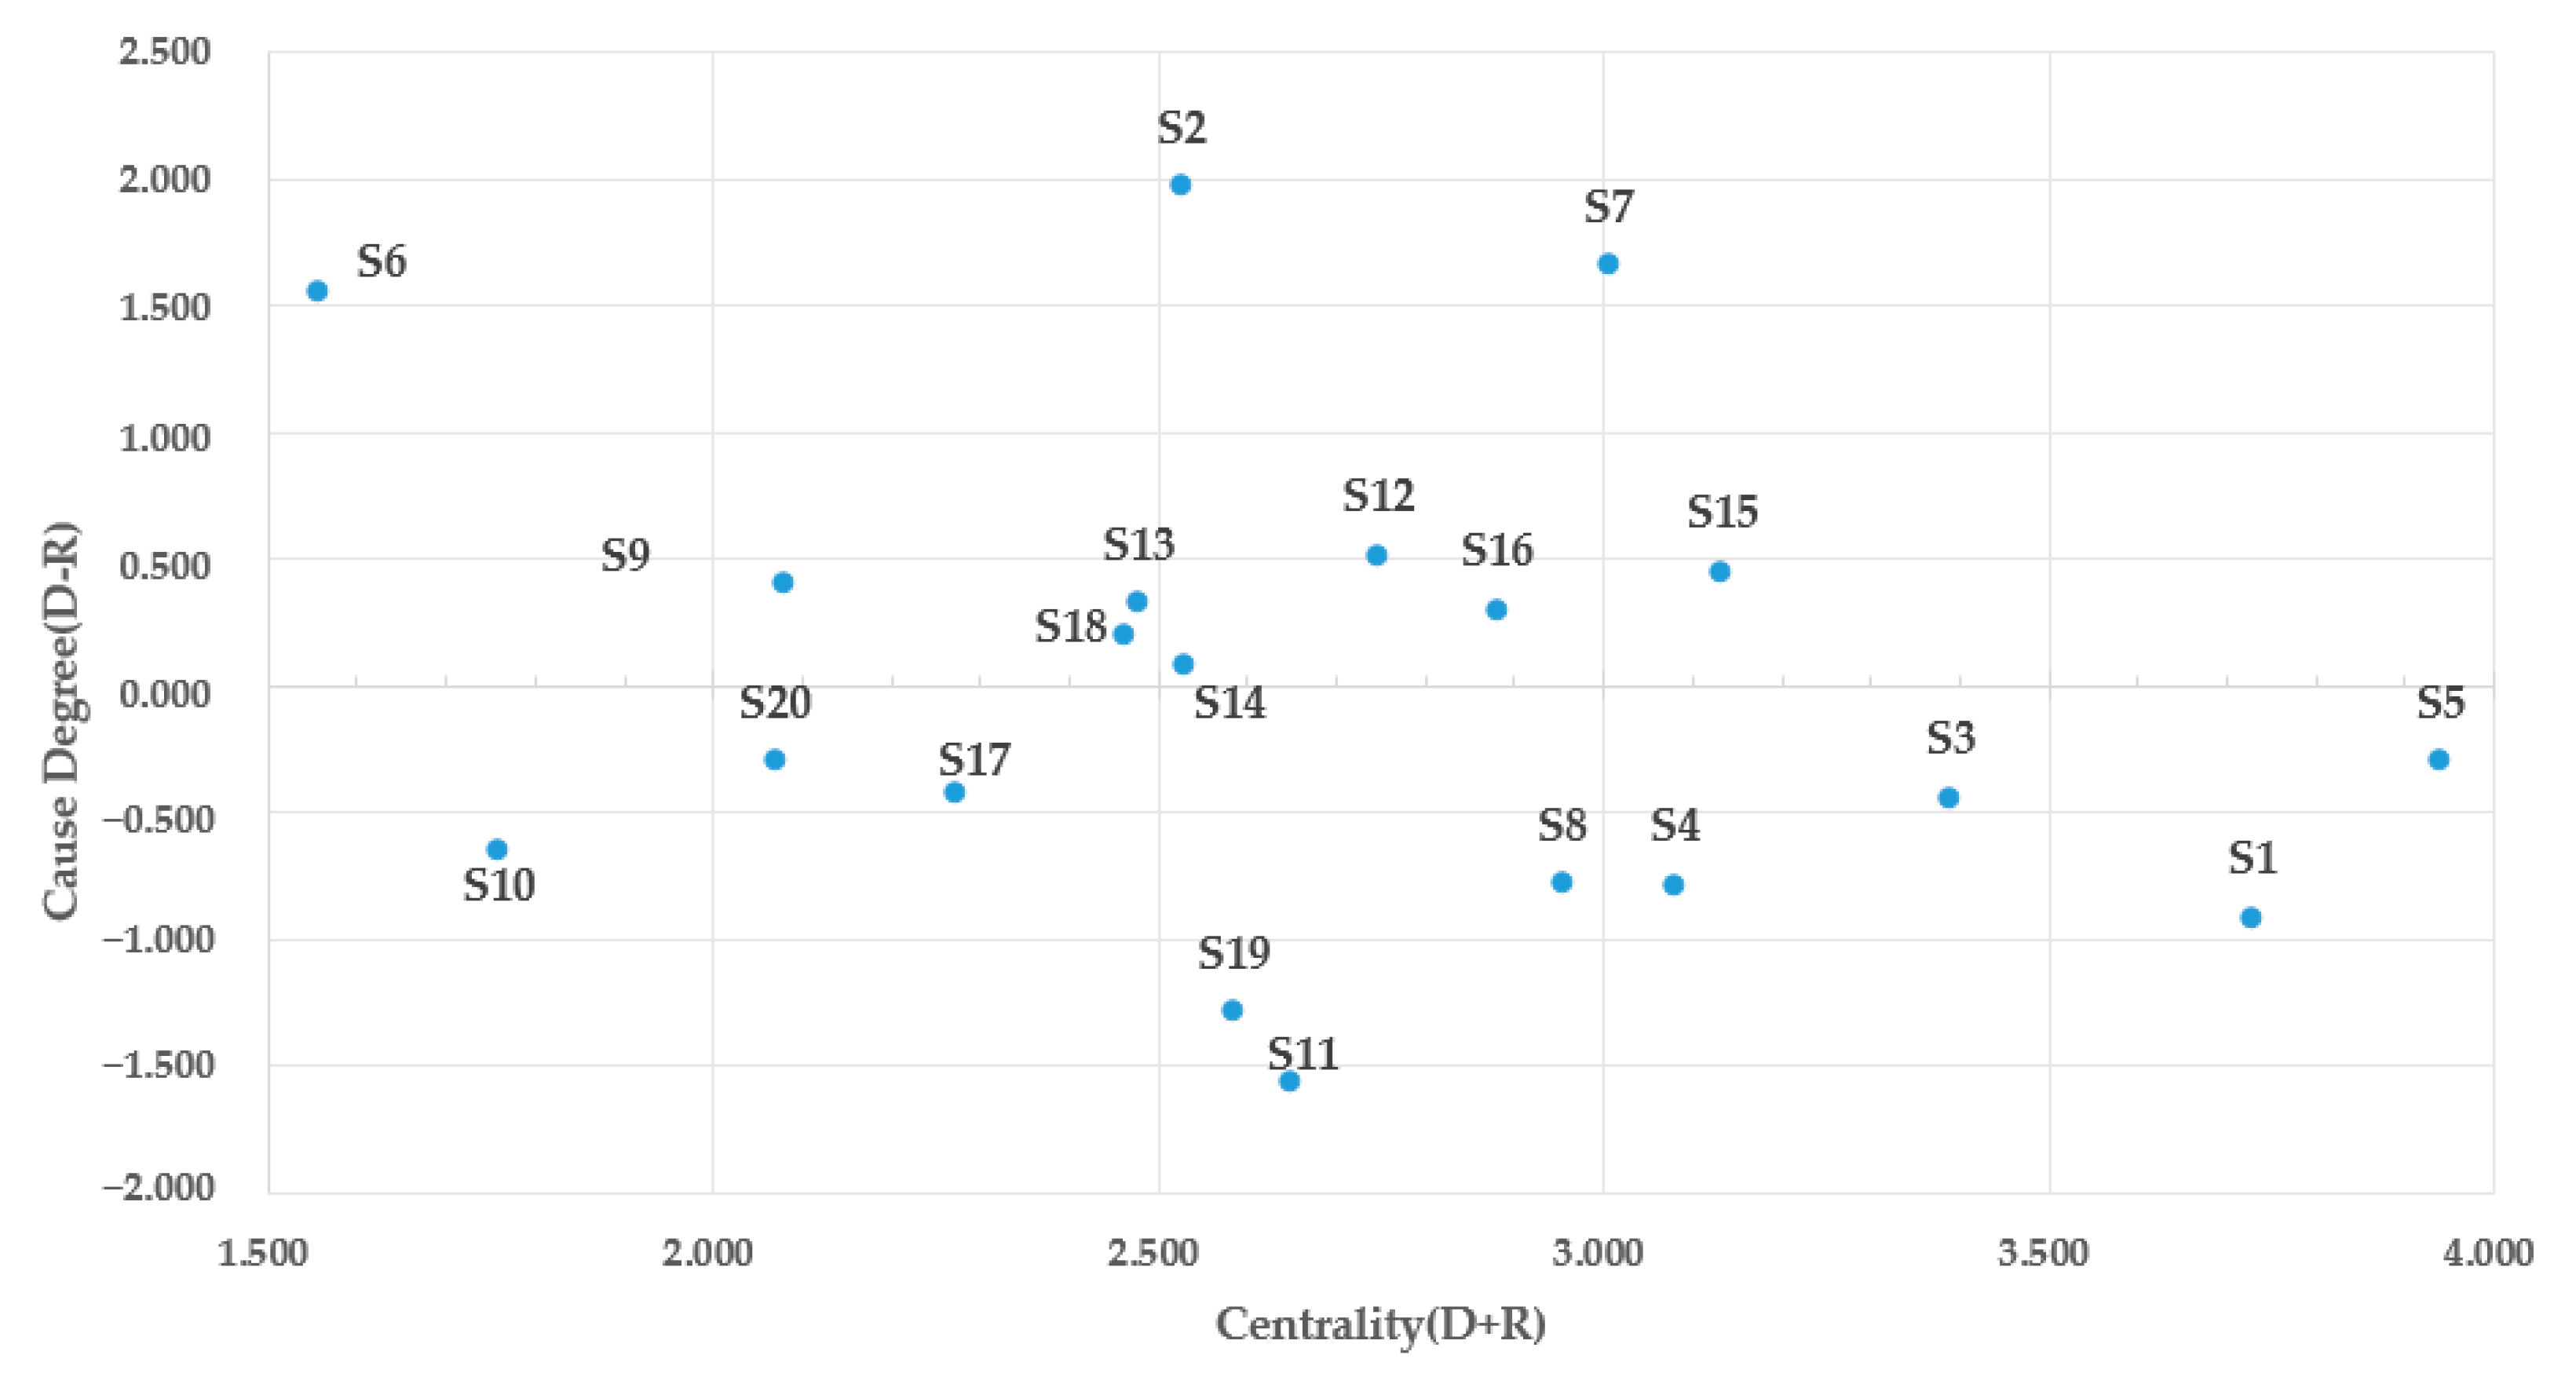
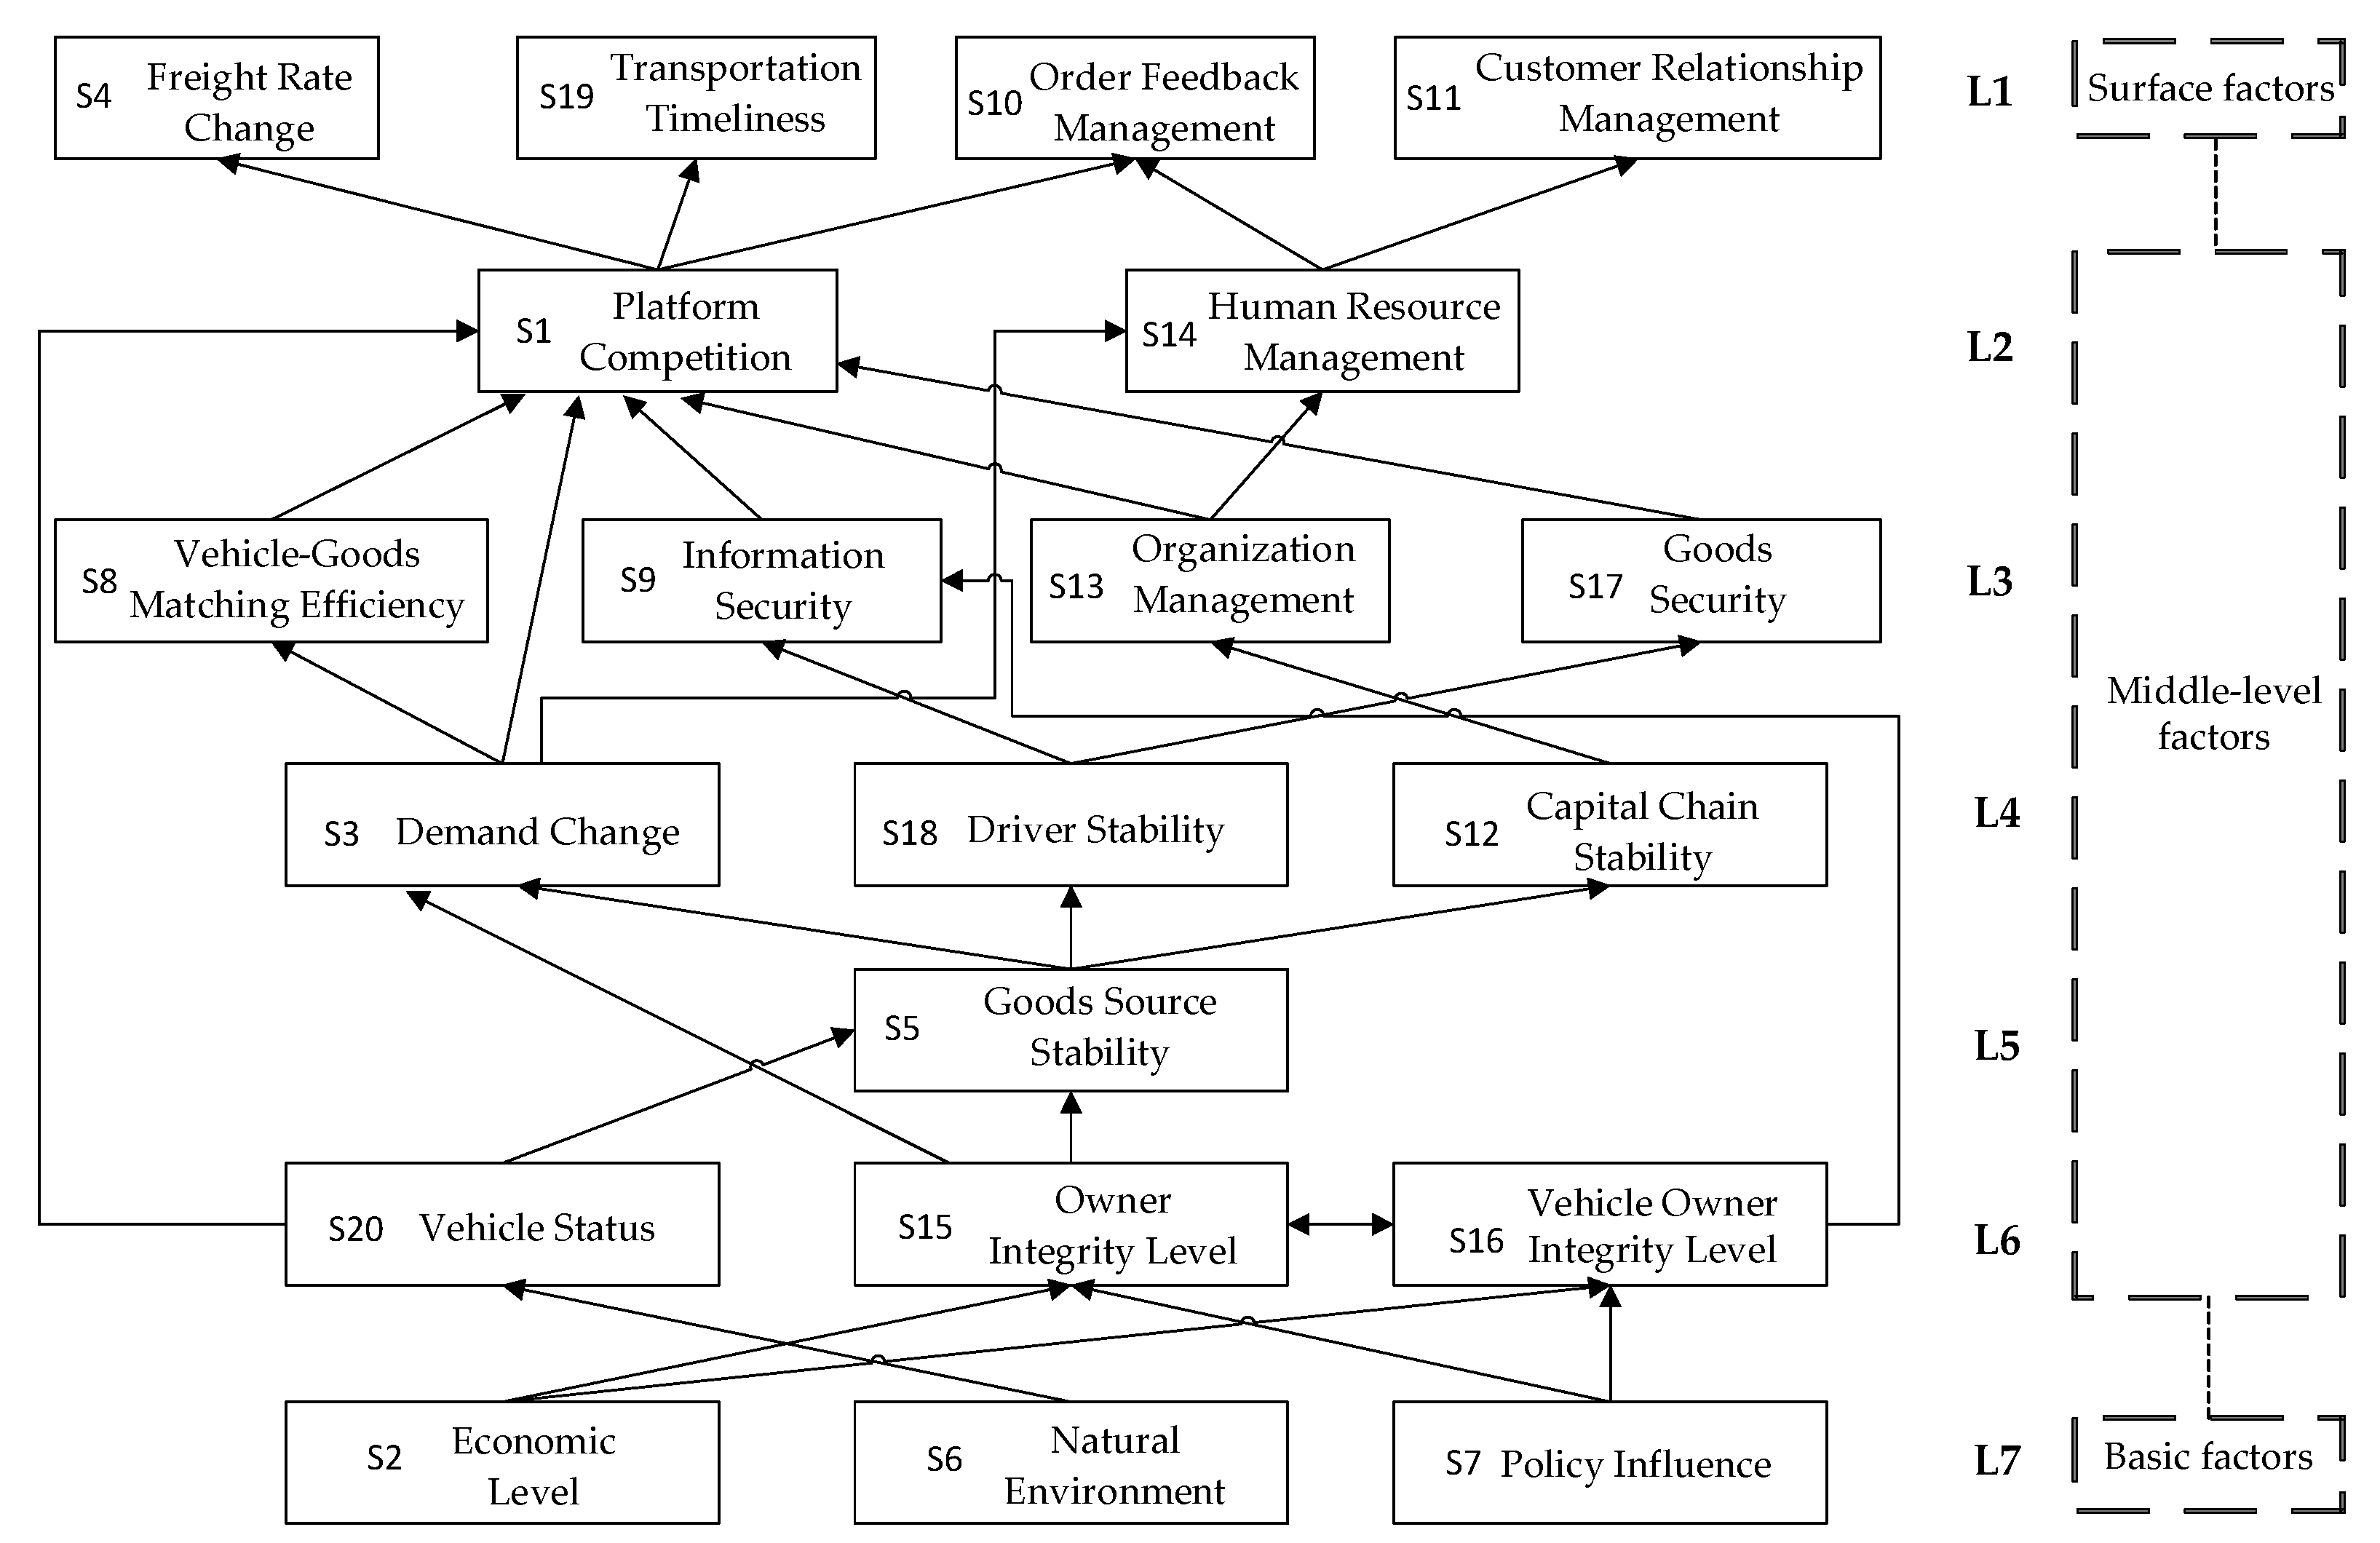
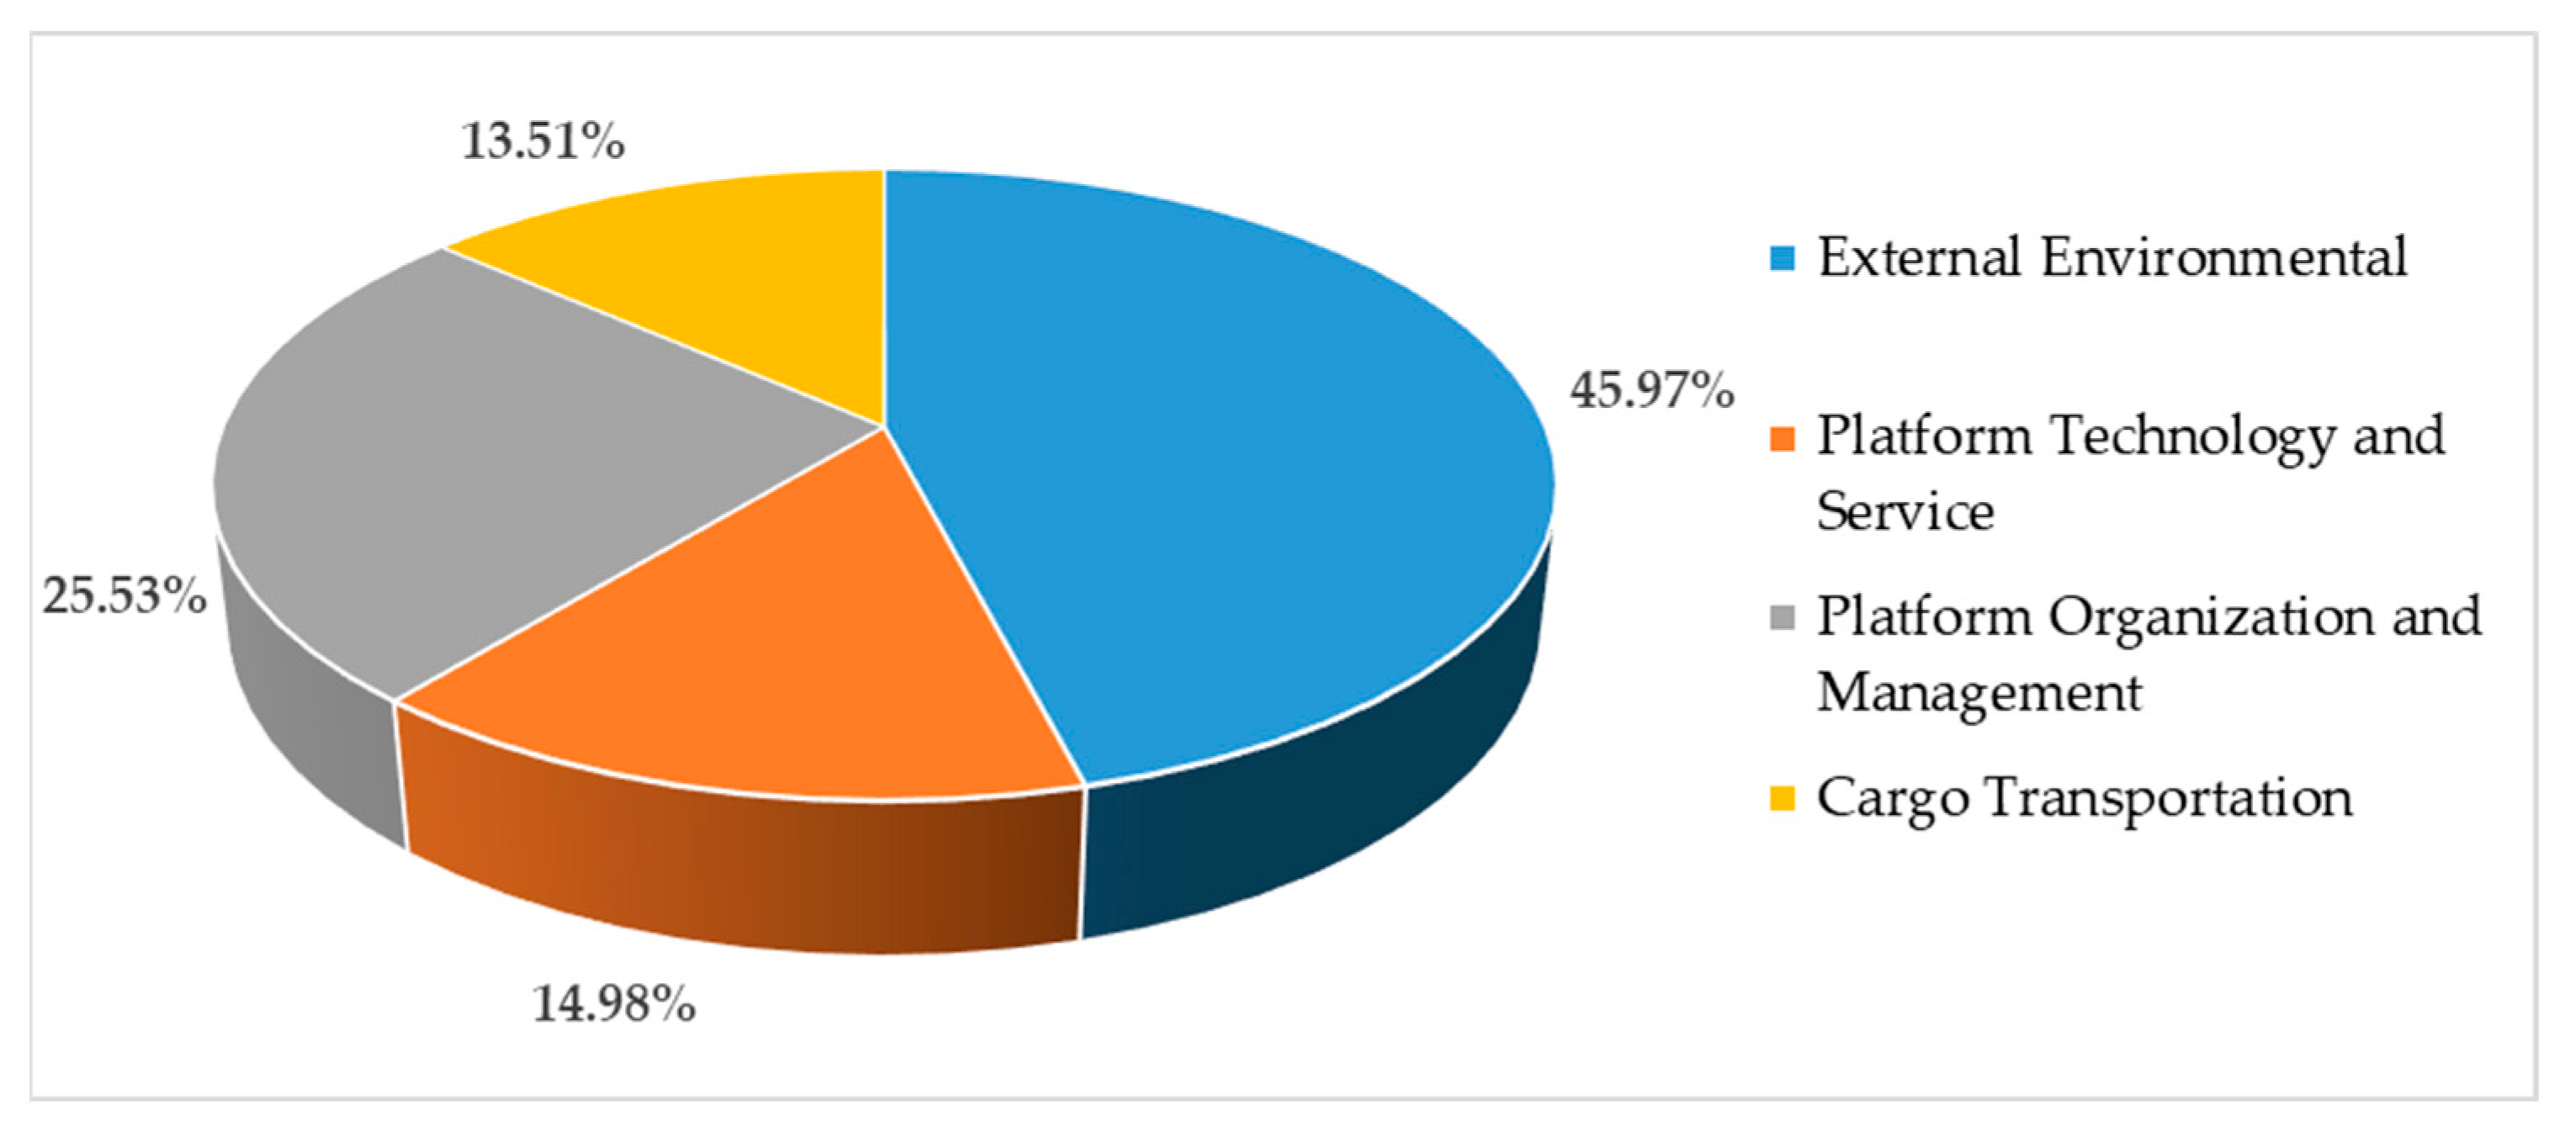
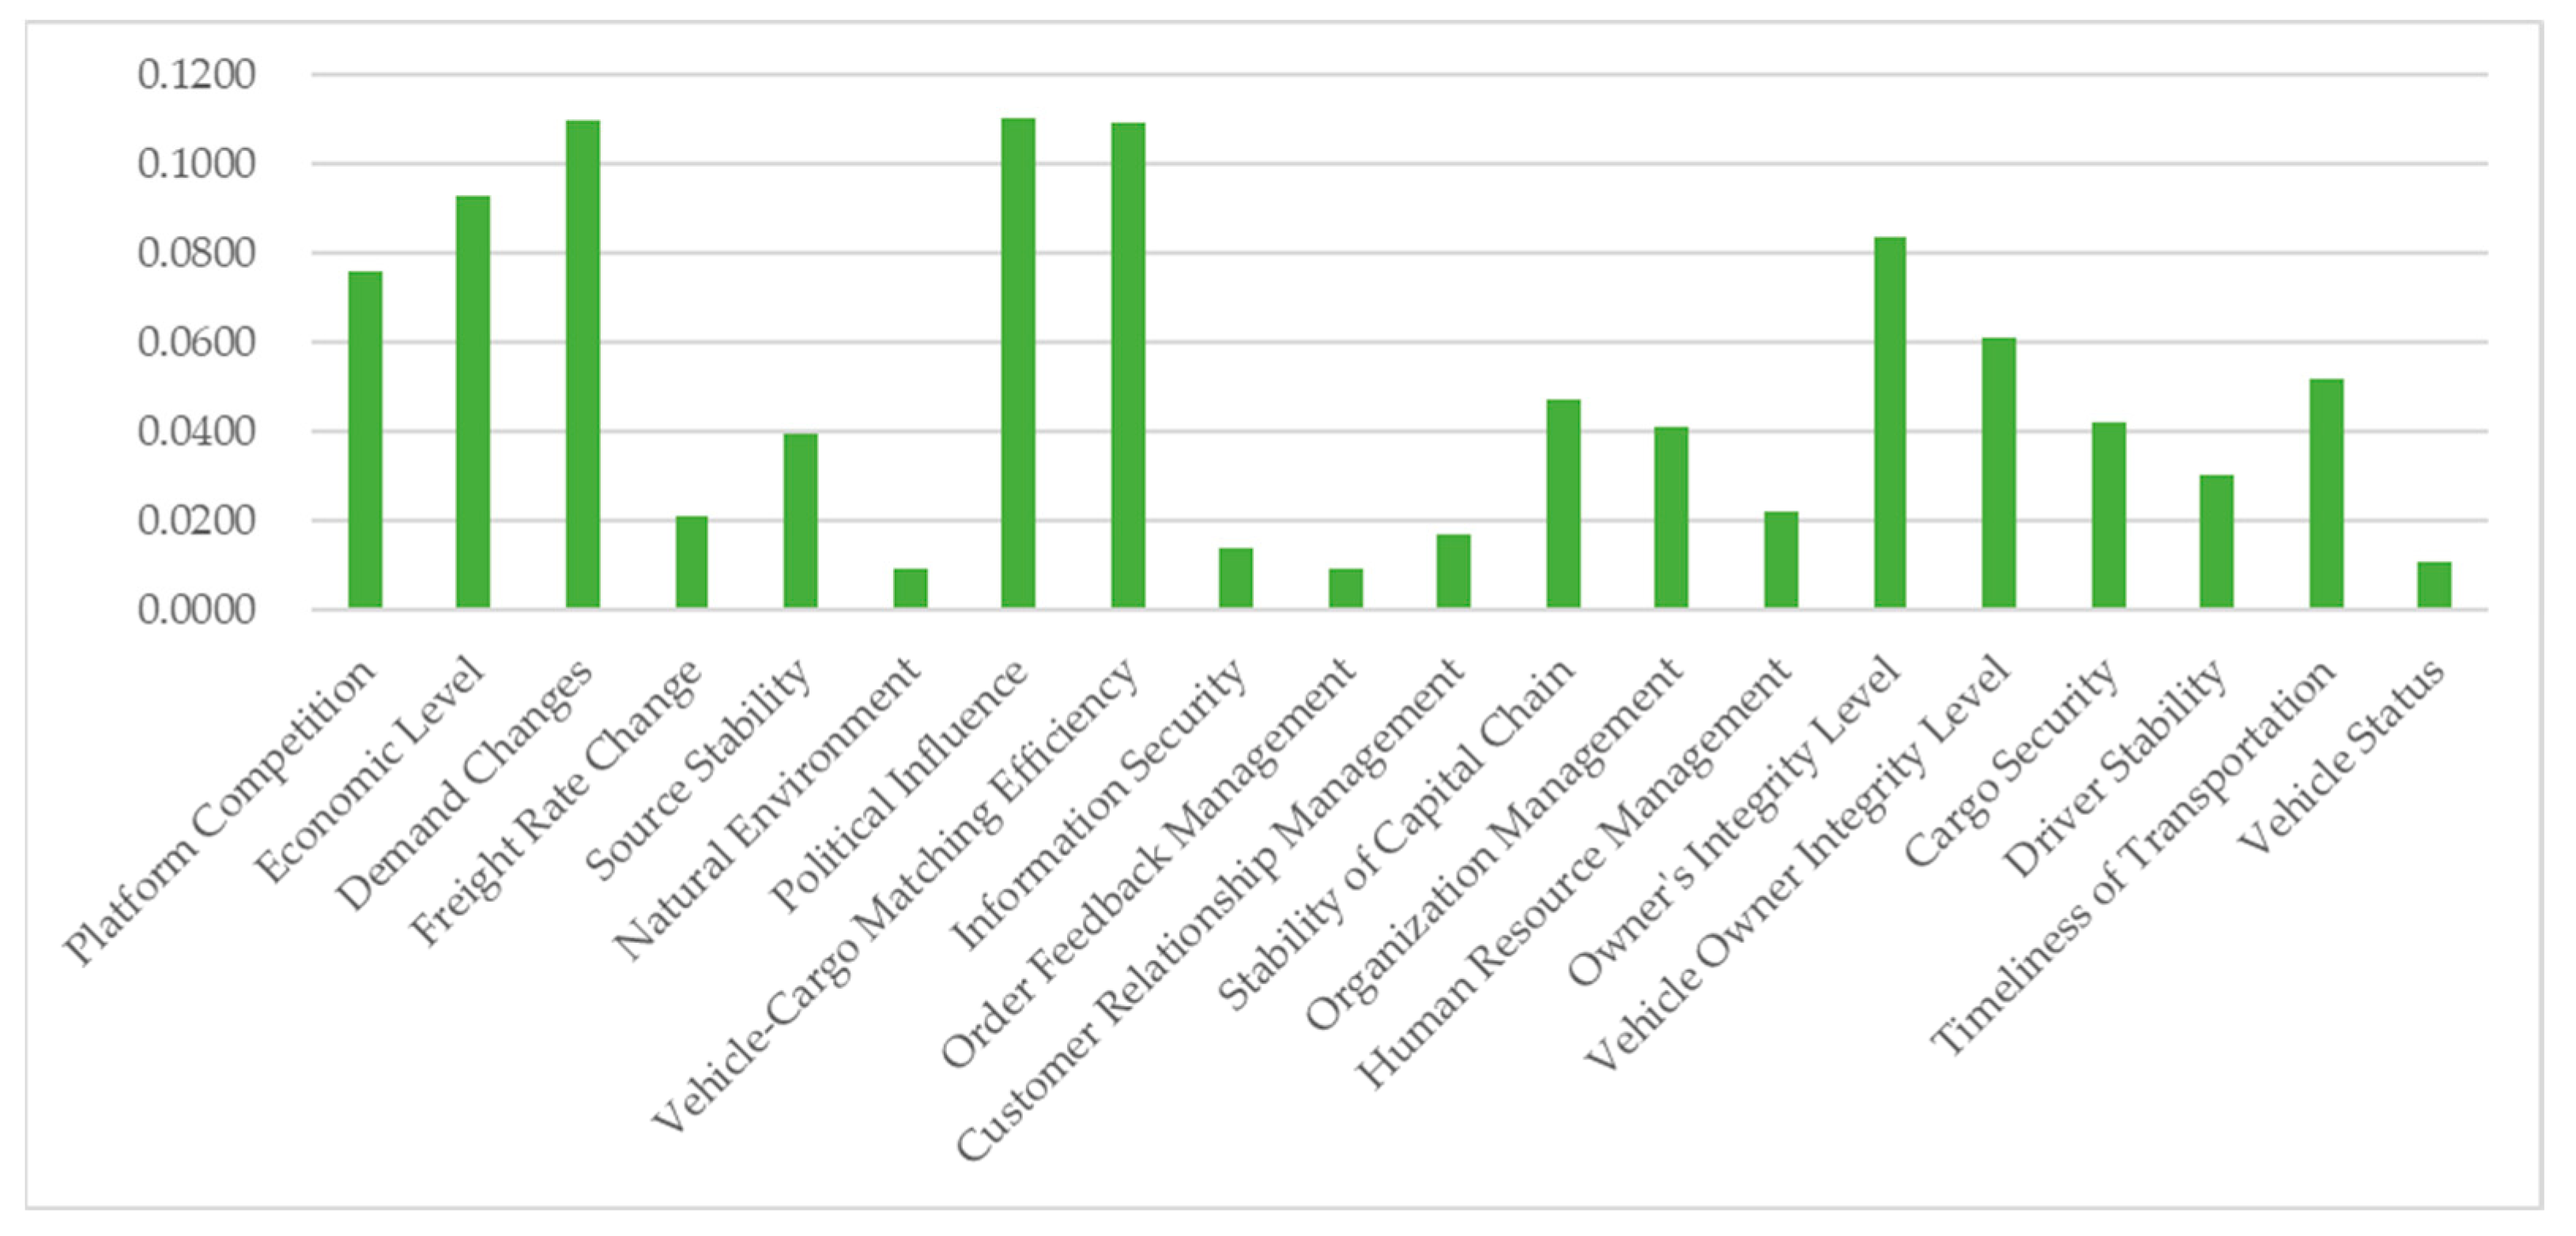
Disclaimer/Publisher’s Note: The statements, opinions and data contained in all publications are solely those of the individual author(s) and contributor(s) and not of MDPI and/or the editor(s). MDPI and/or the editor(s) disclaim responsibility for any injury to people or property resulting from any ideas, methods, instructions or products referred to in the content. |
© 2025 by the authors. Licensee MDPI, Basel, Switzerland. This article is an open access article distributed under the terms and conditions of the Creative Commons Attribution (CC BY) license (https://creativecommons.org/licenses/by/4.0/).