Article

Patent Openness Decisions and Investment Propensities of Frontier Enterprises in Asymmetric Competition

1
School of Management, Harbin Institute of Technology, Harbin 150001, China
2
School of Public Economics and Administration, Shanghai University of Finance and Economics, Shanghai 200433, China
3
School of Business, Singapore University of Social Sciences, Singapore 599491, Singapore
*
Author to whom correspondence should be addressed.
Systems 2025, 13(3), 146; https://doi.org/10.3390/systems13030146
Submission received: 31 December 2024 / Revised: 12 February 2025 / Accepted: 18 February 2025 / Published: 21 February 2025

Abstract

:
The patent openness decisions of frontier enterprises and the consequent investment tendencies of laggard enterprises play a significant role in their profitability. Despite the benefits resulting from directly using open patents, in order to capture market share and surpass frontier enterprises, laggard enterprises must decide whether they are going to invest in R&D or expansion. In this context, based on evolutionary game theory and the operational behaviors of both frontier and laggard enterprises, this study constructed a model of enterprise revenue under asymmetric competition, exploring the impact of patent openness with and without government subsidies on enterprise revenue. This study discovered that: (1) when the industry scale is small, frontier enterprises gain significant social effects through patent openness, while laggard enterprises invest in expansion; (2) as the industry scale gradually expands, frontier enterprises tend to prefer not to open their patents, and laggard enterprises gradually shift from imitation to independent innovation when the return on R&D investment increases more than that on expansion investment; and (3) when the R&D costs of laggard enterprises are high, frontier enterprises usually choose not to open their patents, forcing laggard enterprises to turn to investment in expansion. This allows frontier enterprises to reduce the losses from patent openness while enjoying the benefits of reduced industry production costs. This study provides new perspectives on patent openness and investment tendencies with the help of an evolutionary game mechanism and offers managerial policy recommendations.

1. Introduction

In the current global economic landscape, asymmetric competition has become a predominant characteristic of enterprise rivalry. Frontier enterprises, leveraging their accumulated patent advantages, have formed market barriers, while laggard enterprises seek breakthroughs in their pursuit [1,2]. As a special form of intellectual property, patents protect important knowledge [3] while maintaining a balance between exclusivity and openness, providing other researchers with opportunities to learn from them [4]. Generally, this exclusivity is obtained by paying the owner patent licensing fees before applying for related patents. By contrast, the patent openness strategy involves frontier enterprises sharing some of their technologies with laggard enterprises without requiring them to pay certain fees. As a result, laggard enterprises can take advantage of the open technologies on their own [5]. However, this does not necessarily mean that laggard enterprises can use open patents completely at will or that frontier enterprises no longer own their patents legally. In fact, during their application, laggard enterprises are still constrained by certain agreements with the patent-holding enterprises [6]. Still, opening patents promotes the dissemination of technology while likely triggering a wave of innovation within the industry. Particularly in the fields of green energy and sustainable development, patent openness is seen as a key pathway to accelerating technological progress and addressing global challenges [7]. As the industry develops, the pursuit of patent openness advantages or the shift of competitive pressures by frontier enterprises affects their choice of patent openness strategy. Tesla, in the new energy vehicle market, has established a significant competitive advantage through its innovative product design and robust ecosystem. This frontier advantage allows Tesla to occupy a leading position in the market, while laggard enterprises need to innovate in technology and market strategy to close the gap. However, as competition intensified and market shares fluctuated, Tesla chose to open its patents, promoting the unification of technical standards in the new energy industry and continuing to ensure the development of the entire electric vehicle industry.
From a governmental perspective, the patent openness policy of frontier enterprises undoubtedly propels the progress of the entire industry, but this comes at the cost of diminishing the technological edge of these frontier enterprises [8]. The government plays a crucial regulatory role in this process. A well-structured subsidy policy can balance the industry’s losses due to the reduction in the technological advantages of frontier enterprises. This is of significant importance for enhancing the motivation of frontier enterprises to open their patents and for promoting market stability. China’s patent open licensing system [9] is a typical patent openness policy document under which the government implements a reduction in annual patent fees for patent owners who open their patents to small and medium-sized enterprises (SMEs) to reduce costs.
Globally, the transition to green and low-carbon practices has become an overarching trend. China has played a significant role in driving global innovation in green and low-carbon technologies. According to the “Global Green and Low-Carbon Technology Patent Statistics and Analysis Report,” from 2016 to 2022, the proportion of green and low-carbon technology invention patents authorized in China reached 31.9% of the global total, with an average annual growth rate of 12.5%, significantly higher than the global average of 2.5%. The development trend of green technology patents reflects the global emphasis on green technologies and sustainable development. Therefore, this article focuses on how to ensure the sustainable development of green technology and how to promote the continuous development of green technology.
This study focuses on the field of green technology, aiming to explore the patent openness strategies of frontier enterprises in asymmetric competition and the speculative tendencies of laggard enterprises, as well as their dynamic evolution process. It analyzes how factors such as the benefits of technological advantages and market expansion effects impact the profits of both frontier and laggard enterprises. Therefore, this research mainly pays attention to the decision-making processes of enterprises at a more micro level, in a scenario where supply equals demand when faced with patent openness and investment strategies within the context of profitability. This research also emphasizes examining how government subsidies can serve as an incentive mechanism to encourage enterprises to open their patents and how such policies affect the innovation motivation and market competitiveness of enterprises. In conclusion, this study primarily focuses on the decision-making process of enterprises within the long-term equilibrium, particularly examining decision-making at the micro level in a scenario of supply–demand balance, considering patent openness and investment strategies under the premise of profitability. Therefore, short-term phenomena are not included in the scope of this paper for the time being. Extensive research has analyzed enterprises that have opened their patents under asymmetric competition and summarized the reasons for their success. However, there is a lack of in-depth research into the core mechanisms underlying their success and the research and production behaviors of laggard enterprises. Most studies have remained at the level of case analysis, neglecting the many frontier enterprises that have not adopted patent openness or laggard enterprises that have not invested in research and development, thus lacking a study of the behavioral relationship between frontier and laggard enterprises. Based on the above analysis, the core research questions of this study are as follows: (1) How do frontier and laggard enterprises influence each other’s business strategic decisions, and through what mechanisms? (2) How do frontier and laggard enterprises in asymmetric competition continuously profit by adjusting their strategies? (3) How does government subsidy serve as a regulatory mechanism to influence the strategies of frontier and laggard enterprises?
Compared with existing research, the innovative aspects of this study lie in the following: (1) approaching the topic from the perspective of asymmetric competition, where laggard enterprises can utilize the patent openness of frontier enterprises to reduce imitation costs and shift from imitation to independent research and development, gaining a competitive advantage as the industry expands, while frontier enterprises tend to prefer not to open their patents during this stage; (2) clarifying the evolutionary game mechanism of patent openness and investment tendencies of frontier and laggard enterprises under changing conditions such as research and development costs and technological advantage benefits (for instance, when research and development costs are high, frontier enterprises may choose not to open their patents to enjoy the benefits of reduced production costs brought about by the investment expansion of laggard enterprises); (3) providing policy recommendations from the perspective of government subsidies to guide frontier enterprises in opening patents, promoting the development of green technology and industry progress. When the technological advantage benefits from not opening patents are negligible, the government can compensate for the technological advantage benefits of frontier enterprises by providing financial subsidies, incentivizing them to open patents and thus promoting the development of green technology.
Based on the aforementioned issues and hypotheses derived from the relevant literature, we constructed an evolutionary game model to analyze the patent openness decisions of frontier enterprises and the investment tendencies of laggard enterprises in asymmetric competition. We then conducted simulation calculations based on numerical values from the existing literature to analyze the core mechanisms influencing the commercial behaviors of frontier and laggard enterprises under asymmetric competition conditions. This study employed evolutionary game theory to study the impact of patent openness strategies and investment tendencies on the actual revenues of enterprises, providing an in-depth and objective analysis of the external conditions affecting the relationship between patent openness policies and enterprise revenues. Evolutionary game theory not only seeks strategies that maximize enterprise gains but also emphasizes whether short-term profit strategies can lead to stable long-term profits in a complex industrial chain environment.

2. Literature Review

2.1. Patent Openness of Frontier and Laggard Enterprises

The impact of patent openness on enterprises tends to be bidirectional. For frontier enterprises, patent openness can bring advantages such as improved brand value [10] and reduced financing costs [11]. However, along with risks such as lower barriers to entry, frontier enterprises also bear potential consequences such as increased competition, reduced market share [12], and less investment in research and development [13]. Therefore, it is argued that frontier enterprises will choose to open their patents only when the expected benefits outweigh the costs. This decision is based on the rational actor assumption [14]. Patent opening by frontier enterprises often leads to different degrees of technological spillovers [15] and affects laggard enterprises through FDI [16], imitation, or dependence [17]. For laggard enterprises, patent openness favors the reduction in their production costs and access to market opportunities [18] and creates a leapfrogging effect for laggard enterprises [19], accelerating technological catch-up or even surpassing the frontier enterprises [20]. However, patent openness can also increase learning costs for laggard enterprises [2] and even lead to reduced willingness to innovate [21] and weakened in-house R&D capabilities due to over-reliance on patents of frontier enterprises [22]. In addition, some scholars have explored the impact of technological spillovers, focusing on how patent openness affects enterprise performance and the innovation performance of laggard enterprises. Many studies have revealed the complexity of the results. These studies have shown different outcomes under various conditions [23,24]. At the same time, some scholars have argued that the impact of patent openness on laggard enterprises is constrained by conditions such as technological reconnaissance capabilities [25] and relational capabilities [15].
To date, most studies have explored the impact of patent openness on frontier and laggard enterprises in depth. However, there are relatively few studies on how patent openness affects the cross-relationship between these two types of enterprises. Specifically, patent openness influences the investment propensity of laggard enterprises, which subsequently impacts frontier enterprises and the entire industry. Therefore, our research expands into this area. Laggard enterprises can progressively develop technological innovations based on imitating the patents of frontier enterprises [26], or they can develop new technologies by exploiting market opportunities by drawing on the patent openings of frontier enterprises [27,28]—and sometimes, imitating patents is more costly than developing original innovations [29]. The imitation or independent innovation of laggard enterprises, in turn, has an impact on the product quality and production cost of the whole industry, meaning that the strategies of first-mover and laggard enterprises tend to play and interact with each other. This study focuses on analyzing the impact of the patent opening strategy of frontier enterprises on the investment tendency of laggard enterprises and the impact of the difference in the investment tendency of laggard enterprises on the industry costs and other factors when the factors of technological superiority gain and market competition effect are at different levels, which illustrates the evolutionary game mechanism between the strategies of frontier and laggard enterprises. At the same time, this study hopes to provide valuable insights into what strategies frontier and laggard enterprises can adopt to sustainably benefit from their operations in the short or medium term.

2.2. Green Patent Openness in Asymmetric Competition

Studying the application of green innovation technology patent opening in asymmetric competition is of great theoretical and practical significance. At the theoretical level, green innovation technologies are seen as an important way to promote sustainable development and can realize their potential to a greater extent when frontier enterprises’ patents are opened [30], accelerating the diffusion and application of environmentally friendly technologies in the industry [7] and facilitating the optimization of industrial structure [31], thus bringing significant social benefits. On a practical level, the existence of varying degrees of patent openness means that real-life cases are widespread, such as Tesla’s open-source patent strategy [32], IBM’s patent openness strategy [33], and China’s patent open licensing system [9], along with other commercial activities and institutional arrangements. The patent opening of green innovation technology is most typical of the tram industry. As a pioneer in the tram manufacturing industry, Tesla’s initiative to open up its core patent source code provides learning opportunities for laggard enterprises in green innovation technology, increases the investment of laggard enterprises in the tram industry [34], and leads to the improvement of the quality of the product [35], as well as the expansion of the industry’s scale [36], which, in turn, increases the penetration of electric vehicles. In turn, the fierce competition between laggard car companies and Tesla is able to force the continuous transformation and upgrading of Tesla’s green innovation technology [37]. However, as mentioned above, first, existing studies have paid too much attention to Tesla as the leading pioneer and less attention to its games and interactions with latecomers. Second, Tesla’s strategy can be regarded as a larger degree of patent opening, and the impact of the degree of patent opening on the investment tendency of laggards is worth exploring. At the same time, analyzing the opening of patents on green innovation technology by focusing solely on the tram industry may lack a certain degree of universality and scalability. In this study, we use evolutionary game theory to expand our analysis. We focus on the impact of different degrees of patent opening. This impact is on the optimal strategies of green innovation technology of frontier enterprises. We also look at how these strategies affect the investment propensity of laggard enterprises. Our goal is to provide valuable suggestions for the development of green innovation technology in different industries. This is of great significance, and it contributes to our understanding of the application of business strategies of enterprises from the perspective of management. It also contributes to understanding the competitive and cooperative relationship between enterprises in the field of economics.

2.3. Application of Evolutionary Game Theory to Industry Competition

The evolutionary game model provides theoretical support for this study of the strategy problem of open patents of upstream and downstream enterprises. The model takes into account the interactions between different groups that use various strategies. Over time, the strategies used by individuals within these groups evolve. More adaptive strategies come to dominate, replacing those that are less adaptive. This process leads to a state of equilibrium where the strategies are stable. At this point, if mutants with different strategies appear, they will not disrupt the strategies of the other subjects. Essentially, the system has reached a point where it is resilient to the influence of new, different strategies [38]. Evolutionary game models emphasize finite rationality. This concept is an extension of the perfect rationality assumption found in traditional game models. In both types of models, the strategies of all individuals in equilibrium are mutually optimal [39]. In contrast, this study deals with the short- and medium-term dynamic processes of the patent opening and investment strategies of two groups of frontier and lagged enterprises, with the intention of exploring the impact of these strategies on enterprise profitability, the economy, and society. This theory is widely used in collaborative innovation [40], low-carbon management [41], food safety [42], product pricing [43], logistics [44], and other fields. Therefore, evolutionary game theory can help us study the patent opening decisions of frontier enterprises and the investment tendency of laggard enterprises.
In summary, this study applies evolutionary game theory to establish an evolutionary game system. The system includes a frontier enterprise and laggard enterprises. This study uses numerical simulation to further simulate the evolution of these enterprises’ short- and medium-term business strategy processes. This simulation takes place when the conditions change. It focuses on the influence of various factors, such as technological advantage, scale effect, production cost, social effect, and government subsidy. The aim is to provide valuable advice that is intended to promote the patent openness of green innovation technology. It also aims to enhance the industry’s green technology application and improve green benefits across the whole of society.

3. Basic Model Construction and Hypothesis

3.1. Problem Description

Green innovation research and development in industrial competition is important to the development of the social economy and the stability of the industry. Frontier enterprises in an industry can expand the market by implementing open licensing for green innovation technologies, thereby increasing the overall market size. However, this is accompanied by an important issue: intensified competition within the industry. Open licensing for green technology patents attracts more followers to enter the industry, expands the market, and increases overall market demand. At the same time, this increase in competitors leads to a decrease in demand. Open licensing for patents by frontier enterprises promotes the improvement of product quality in laggard enterprises. Furthermore, the expansion of investment by laggard enterprises also leads to a decrease in manufacturing costs.

3.2. Basic Assumptions Under Pure Market Operation

Assumption 1.
Frontier and laggard enterprises in the manufacturing industry act as the main bodies in the game. Under a system with government innovation policies, the main bodies in the game include the government, frontier enterprises, and laggard enterprises.
Assumption 2.
In the supply chain of patent disclosure strategy, frontier enterprises can choose whether to disclose patents of green innovation technologies, and laggard enterprises can choose whether to increase investment. Frontier enterprises decide whether to open patents, and laggard enterprises decide on additional investment, including investment in production and investment in research and development. The cost of investment in production is I p , and the cost of investment in research and development is I r .
Assumption 3.
Technological advantage benefits. A technological advantage can help enterprises maintain a leading position in the market, making their products superior to competitors in performance, quality, and innovation. Thus, they can attract more customers and increase market share. Moreover, enterprises with technological advantages can sell their products at higher prices in the market because the added value brought by their technology allows consumers to accept higher premiums. In addition, a technological advantage can enhance the brand image and visibility of an enterprise, becoming seen as an industry leader. This increase in brand value can bring more customer loyalty and market recognition. Therefore, it is assumed that the technological advantage intensity coefficient of frontier enterprises (relative to other enterprises) is t f , and the technological base of laggard enterprises is 1. The benefits brought by the technological advantage of frontier enterprises are represented by R f t f .
When frontier enterprises disclose their technology patents to society, their technological advantage relatively diminishes due to the technological progress of other enterprises, with a decrease in s f . Therefore, the technological benefits of frontier enterprises after public disclosure of technology patents are referred to as R f t f s f . At the same time, laggard enterprises can also reduce the technology gap by investing in research and development. If laggard enterprises invest in research and development, the benefits brought by technological advantage are represented by R f t f s f s a .
Assumption 4.
Market expansion effect. When frontier enterprises do not disclose patents, the quality of the product sold to customers is M . When frontier enterprises disclose patents, the proportion of product quality increase is s f , and when laggard enterprises choose to invest in research and development, the proportion of product quality increase is s a . Therefore, if upstream enterprises disclose patents, the product quality obtained by downstream enterprises and, ultimately, consumers is 1 + s f + s a M . It is assumed that for each unit increase in product quality, consumer demand increases by λ . Additionally, for each unit increase in demand, the increase in revenue is r ; thus, the industry scale can be represented as r λ M .
The premise of market expansion is the need for a large amount of external investment, and these external investments join the group of laggard enterprises in the form of establishing new companies. Therefore, when laggard enterprises do not invest, there is no market expansion effect. If laggard enterprises choose to expand investment, there will be a cost reduction due to the scale effect. When laggard enterprises choose not to expand investment, the production cost is C , and it is assumed that the production cost initially accounts for ( 1 C ) . When laggard enterprises choose to increase investment, the production cost of the entire industry decreases by g , and the production cost is ( 1 C + g ) .
Assumption 5.
Market competition effect. It is assumed that the original market share ratio of frontier enterprises is θ , and that of laggard enterprises is ( 1 θ ) . When frontier enterprises choose to open patents, the reduction in the quality gap narrows the technology gap and reduces the market share by δ o . When laggard enterprises choose to invest more in production, they seize the original market share of frontier enterprises, with a decrease in δ p ; if laggard enterprises choose to invest in research and development, the change in market share due to the reduction in the product gap is δ r .
Assumption 6.
Social benefits. Compared to other technologies, green innovation technology has unique social effect characteristics. The public pays attention to the continuous development of this green technology and the improvement of social benefits it brings. When frontier enterprises that originally have a relative advantage in innovative technology choose to disclose green innovation technology patents, they can enhance the brand image and market visibility of the enterprise. As pioneers of green innovation, these enterprises can gain more social attention and recognition, thereby increasing brand value and market influence. Therefore, the additional benefits brought are represented by F = f t f .
Notes: The study is based on the hypothesis that supply equals demand in the long run. However, short-term situations like liquidity increases are not considered. On the one hand, an increase in liquidity has artificially raised aggregate demand [45,46]. For instance, demand for green technologies is aroused [47] and thus causes enterprises to invest more in R&D [48]. However, investment increase is more related to their adaptability rather than their positions within the industry [49]. In addition, government subsidy increases resulting from liquidity do not necessarily lead to more cooperation [50]. On the other hand, recent monetary expansionary policies, which increased liquidity after the subprime crisis and during the pandemic, have distorted interest rates and equilibrium exchange rates, thereby influencing enterprises’ investment decisions [51,52,53,54]. Monetary expansion, by affecting exchange rates and the expected return rates of frontier enterprises, could further influence their patent openness decisions [53]. However, since this study primarily aims to explore the issue of patent openness from a long-term equilibrium perspective and to simplify the analysis while highlighting the key points, monetary policy and liquidity-driven factors have not been incorporated into the model. Nevertheless, this issue will be an important direction for future research, which is of significant value for expanding and extending research in related fields.
In this study, we analyzed the endogenous behavior of firms from R&D investment and patent openness perspectives, but other factors influencing decision-making were overlooked. For example, first-movers can benefit through voluntary information-sharing agreements and “killer acquisitions” to maintain patent leadership and increase market share [55]. Wang [56] showed that partial acquisitions and patent licensing can improve production allocation and reduce royalties. Thus, a more comprehensive discussion should consider the benefits and costs of acquisitions by first-movers of latecomer firms if patents are kept open. For latecomers, the uncertain benefits of being acquired after R&D investment need specific analysis.
The model also neglects the situation in which the government intervenes and may thus force frontier green enterprises to open patents for social values [57]. However, since the study is under the premise of pure market operation and independent enterprises’ profitability pursuit, while government intervention tends to consider the overall profit [58], government intervention is not included. Still, given its importance and authenticity, government intervention needs to be considered in future studies where the hypotheses and premises are extended.

4. Decision Mechanism in the Pure Market Supply Chain

4.1. Model Construction

After obtaining the return functions of the frontier and laggard enterprises in each of the above scenarios, their expected returns were represented. The earnings of the frontier enterprises are expressed as U f , and the earnings of the laggard enterprises are expressed as U a . Table 1 shows the payoff matrix for frontier enterprises and laggard enterprises.
The expected return function of laggard enterprises choosing to invest in R&D can be expressed as follows:
U ¯ r a = r λ 1 θ + δ r 1 + y s f + s a + y δ o 1 + s f + s a 1 C M I r
The expected return function that laggard enterprises can obtain by choosing to invest in expansion is then given by
U ¯ p a = r λ 1 θ 1 + y s f + y ( δ o + δ p ) 1 + s f 1 C + g M I p
Thus, the average return of laggard enterprises is
U ¯ r f = r λ θ δ p δ o + x δ p t f 1 C + g M r λ x δ r t f 1 C M r λ x θ δ o t f g M   + R f t f s f x s a + f t f
In contrast, the expected payoff function for frontier enterprises that choose not to open their patents is given by
U ¯ p f = r λ θ t f 1 C + g M r λ x δ r t f 1 C M r λ x θ t f g M + R f t f x s a
Thus, the average return of frontier enterprises is
U f ¯ = y U ¯ r f + 1 y U ¯ p f = y { r λ θ δ p δ o + x δ p t f 1 C + g M r λ x δ r t f 1 C M r λ x θ δ o t f g M + R f t f s f x s a + f t f } + 1 y   r λ θ t f 1 C + g M r λ x δ r t f 1 C M r λ x θ t f g M + R f t f x s a

4.2. Evolutionary Game Stability Analysis

Based on the expected return model above, the dynamic replication equation for laggard enterprises’ choice of investment strategy can be derived as follows:
F x = d x d t = x U ¯ r a U ¯ a = x ( 1 x ) [ U ¯ r a U ¯ p a ] = x 1 x { r λ 1 θ + δ r 1 + y s f + s a + y δ o 1 + s f + s a 1 C M r λ 1 θ 1 + y s f + y δ o + δ p 1 + s f ( 1 C + g ) M + I p I r }
Let   G y = r λ 1 θ + δ r 1 + y s f + s a + y δ o 1 + s f + s a 1 C M r λ 1 θ 1 + y s f + y δ o + δ p 1 + s f ( 1 C + g ) M + I p I r
In contrast, the dynamic replication equation for frontier enterprises’ choice to open their patents is
F y = d y d t = y U ¯ r f U ¯ f = y ( 1 y ) [ U ¯ r f U ¯ p f ]
= y 1 y { r λ δ p δ o + x δ p t f 1 C + g M + r λ x δ o t f g M R f s f + f t f }
Let H x = r λ δ p δ o + x δ p t f 1 C + g M + r λ x δ o t f g M R f s f + f t f . By linking the above equations, we can obtain the replication dynamics equations for laggard and frontier enterprises:
F x = d x d t = x ( 1 x ) [ U ¯ r a U ¯ p a ] F y = d y d t = y ( 1 y ) [ U ¯ r f U ¯ p f ]
To solve the above dynamic equations, we let ( x ) = F ( y ) = 0 . Additionally, there are four equilibrium points: (0, 0), (0, 1), (1, 0), and (1, 1) within the region { ( x , y ) | 0 x 1,0 y 1 } . In evolutionary game theory, if all of the eigenvalues of the Jacobian matrix are non-positive, the equilibrium point is considered evolutionarily stable. The Jacobian matrix can be represented as follows:
J = d F x d x d F x d y d F y d x d F y d y = 1 2 x G ( y ) x 1 x A + B g M y ( 1 y ) { r λ δ p t f 1 C + g M + r λ δ o t f g M } 1 2 y H x
among which A = r λ δ o s a + δ r s f δ p 1 + s f 1 C ,   B = r λ [ 1 θ s f + δ o + δ p 1 + s f ] .
The determinant and trace of the Jacobian matrix at the evolutionary equilibrium points (0, 0), (0, 1), (1, 0), and (1, 1) were calculated. The results are shown in the table below. Table 2 shows the eigenvalues of the Jacobian matrix at the equilibrium point of the system.
Proposition 1.
When  r λ 1 θ + δ r + δ o 1 + s f + s a 1 C M + I p < r λ 1 θ + δ o + δ p 1 + s f 1 C + g M + I r  and  f t f > r λ δ p + δ o t f 1 C + g M + R f s f , the equilibrium point (0, 1) is an evolutionary game stable strategy (ESS).
r λ 1 θ + δ r + δ o 1 + s f + s a 1 C M + I p and f t f can be viewed as the incremental gains from investing in R&D by laggard enterprises and opening patents by frontier enterprises, respectively. r λ 1 θ + δ o + δ p 1 + s f 1 C + g M + I r and r λ δ p + δ o t f 1 C + g M + R f s f can be viewed as incremental gains from investment in production expansion by laggard enterprises (loss of gains from investment in R&D) and loss of gains from opening patents by frontier enterprises, respectively. At this point, frontier enterprises choose to open their patents, and laggard enterprises choose to invest in production expansion. For frontier enterprises, the incremental social gains from opening their patents at this point are enough to make up for the sum of the loss of gains from technological advantage and the loss of market share. It is worth mentioning that the market share is affected comprehensively by the size of the industry, technological advantage, and production costs. Laggard enterprises are more concerned about the magnitude of technological advantage brought about by investment in R&D. Laggard enterprises also care more about the cost of investment in R&D and production at the early stage of the industry’s development. When laggard enterprises’ investment in R&D only brings about a smaller increase in technological advantage, or when imitation of the patents of frontier enterprises reduces the production costs, laggard enterprises will be more inclined to invest in production expansion.
Proposition 2.
When r λ 1 θ + δ r + δ o 1 + s f + s a 1 C M + I p > r λ 1 θ + δ o + δ p 1 + s f 1 C + g M + I r and f t f > r λ δ o t f 1 C M + R f s f , the equilibrium point (1, 1) is an evolutionary game stable strategy (ESS).
r λ 1 θ + δ r + δ o 1 + s f + s a 1 C M + I p and f t f can be viewed as the incremental revenue from investments in R&D by laggard enterprises and open patents by frontier enterprises, respectively. r λ 1 θ + δ o + δ p 1 + s f 1 C + g M + I r and r λ δ o t f 1 C M + R f s f can be, respectively, viewed as the loss of revenue from investment in R&D by laggard enterprises and the loss of revenue from opening patents by frontier enterprises. At this point, frontier enterprises opt to open their patents, while laggard enterprises choose to invest in R&D. For frontier enterprises, the laggard enterprises’ shift to investing in R&D reduces their loss of market share gains from opening their patents. This suggests that, at this point, autonomous innovation by laggard enterprises is less likely to threaten the position of frontier enterprises in the industry than imitation. For laggard enterprises, when the size of the industry is gradually expanding but still within a certain threshold, it shifts from initial imitation to independent innovation. This only happens when the incremental revenue of laggard enterprises’ investment in R&D is larger than the incremental revenue of their investment in production expansion. This contributes to the development and diffusion of green innovative technologies across the industry.
Proposition 3.
When  r λ 1 θ + δ r + δ o 1 + s f + s a 1 C M + I p > r λ 1 θ + δ o 1 + s f 1 C + g M + r λ 1 θ g M + r λ δ o s a 1 C M + r λ δ r s f 1 C M + I r  and  f t f < r λ δ o t f 1 C M + R f s f , the equilibrium point (1, 0) is an evolutionary game stable strategy (ESS).
r λ 1 θ + δ r + δ o 1 + s f + s a 1 C M + I p and f t f can be viewed as the incremental revenue from investments in R&D by laggard enterprises and open patents by frontier enterprises, respectively. r λ 1 θ + δ o 1 + s f 1 C + g M + r λ 1 θ g M + r λ δ o s a 1 C M + r λ δ r s f 1 C M + I r and r λ δ p + δ o t f 1 C + g M + R f s f can be viewed as the incremental gains of laggard enterprises’ investment in production expansion (the loss of gains from investment in R&D) and the loss of gains from opening patents by frontier enterprises, respectively. At this point, frontier enterprises do not open their patents, while laggard enterprises invest in R&D. For frontier enterprises, the independent innovation of laggard enterprises indeed reduces the loss of free-rider gains resulting from their patent openness strategies to a certain extent. However, it is still difficult for the social effect gains to make up for the sum of the loss of gains from technological advantage and the loss of gains from market share. For laggard enterprises, they choose to invest in R&D when they are still able to obtain higher R&D returns, while frontier enterprises no longer open their patents. This may be because laggard enterprises have achieved certain improvements and unprecedented breakthroughs in R&D based on the open patents of frontier enterprises. Additionally, extra gains from self-innovation may have encouraged laggard enterprises to continue investing in R&D. Conclusively, in this case, laggard enterprises may have the confidence to gain more revenue through investment in R&D, while frontier enterprises feel the pressure and stop opening their patents.
Proposition 4.
When  r λ 1 θ + δ r + δ o 1 + s f + s a 1 C M + I p < r λ 1 θ + δ o 1 + s f 1 C + g M + r λ 1 θ g M + r λ δ o s a 1 C M + r λ δ r s f 1 C M + I r  and  f t f < r λ δ 0 t f 1 C M + R f s f + r λ δ 0 t f g M + r λ δ p t f 1 C + g M , the equilibrium point (0, 0) is an evolutionary game stable strategy (ESS).
r λ 1 θ + δ r 1 + s a 1 C M + I p and f t f can be viewed as the incremental revenue from investments in R&D by laggard enterprises and open patents by frontier enterprises, respectively. r λ 1 θ 1 C + g M + I r and r λ δ 0 t f 1 C M + R f s f + r λ δ 0 t f g M + r λ δ p t f 1 C + g M can be viewed as incremental gains from investment in production expansion by laggard enterprises (loss of gains from investment in R&D) and loss of gains from open patents by frontier enterprises, respectively. When the incremental gain is less than the loss of gain, frontier enterprises choose not to open their patents, and laggard enterprises choose to invest in production expansion. For frontier enterprises, r λ δ 0 t f g M + r λ δ p t f 1 C + g M can be viewed as the loss of revenue from the free-riding behavior of laggard enterprises when frontier enterprises open their patents. At this point, laggard enterprises have already achieved a certain market share and technological improvements because of their constant investment in R&D. Therefore, unless the incremental benefit of opening patents is greater than the incremental benefit of the choice to piggyback on patents, frontier enterprises will not open their green innovation patents. As a result, they are able to maintain their market share and technological advantage. For laggard enterprises, however, they choose to invest in production expansion when the gains of investment in R&D cannot match the expected gains of production expansion. This may be because laggard enterprises have come across a technological bottleneck during R&D and are unable to overcome the difficulty without the help of the open patents of frontier enterprises. Additionally, when investment in R&D reaches a certain level, the marginal cost of R&D may be higher than that of the marginal revenue. In conclusion, under this scenario, frontier enterprises still stop opening their patents for fear of losing more market share and technological advantage to laggard enterprises. Additionally, laggard enterprises invest in production expansion to take advantage of the technological improvement resulting from former investments in R&D.

5. Numerical Simulation Analysis

In order to visually present the evolutionary results of the choice of frontier and laggard enterprises, the following simulation was carried out using MATLAB2022 software. Taking into account the studies in the related literature, as well as actual operation cases [59,60,61], the parameters were set as follows: r = 2 , λ = 1.05 , θ = 0.7 , δ r = 0.15 , δ p = 0.1 , δ 0 = 0.2 , s f = 0.5 , s a = 0.2 , C = 0.8 , M = 2 , g = 0.1 , I p = 1.2 , I r = 1.7 , t f = 2 , R f = 1 , f = 0.5 . On the basis of the above values, we analyzed the effect of parameter changes and subject behavioral logic changes on the results of the evolutionary game.

5.1. Impact of Changes in Initial Product Quality

To study the effect of product quality changes on the system evolution results under pure market operation when the other parameters remained unchanged, we let the values of M be 1, 2, and 4, respectively, and the simulation results are shown in Figure 1. In order to show the effect of differences in the strength of technological advantage coefficients on evolutionary outcomes and to form a contrast, we let t f = 1 and continued letting the values of M be 1, 2, and 4, respectively. The simulation results are shown in Figure 2.
The strength of the technological advantage coefficient plays an important role in the choice of patent openness strategy for frontier enterprises. When this coefficient is high, the improvement in the initial quality of the product provides an incentive for laggard enterprises to invest in R&D while discouraging the willingness of frontier enterprises to open their patents. Moreover, a technological advantage coefficient of a lower strength, accompanied by an increase in the initial quality of the product, inhibits the decision of frontier enterprises to open their patents more significantly. When the initial quality of the product is low, laggard enterprises obtain benefits of investment based on the open patents of frontier enterprises. Thus, laggard enterprises are more likely to consider the costs of R&D and expansion. However, as the initial quality of the product improves, laggard enterprises are able to gain significant technological advantages and marginal market gains from R&D investments. This can quickly cover R&D costs and may outweigh the returns on expansion investments. For frontier enterprises, when the initial quality of the product is low, opening patents may lose some of their market and technological advantage due to the free-riding behavior of laggard enterprises. However, this loss can be compensated by social effect gains. If frontier enterprises are able to gain significantly from high-quality patents, the social effect gains will not be sufficient to compensate for the loss of technological advantage from opening their patents. Through comparative analysis, it can be clearly seen that the weakening of technological advantage impacts the decisions of frontier enterprises to open their patents both significantly and negatively. When the technological advantage is low, even if the quality of the product is high, it may not be able to generate sufficient added value and social acceptance. This will lead to a preference for frontier enterprises to keep their patents and not to open them.
M can be understood as the regulation of the size of the industry or the total market demand. When the size of the industry is small, laggard enterprises tend to utilize the open patents of frontier enterprises for expansion investment. In this way, they may obtain a larger market share and technological advantage in the future through independent R&D when the industry scales up. Therefore, laggard enterprises will gain more revenue when the market expands. By opening their patents, frontier enterprises are able to achieve a greater social effect and promote the development of the industry as a whole. However, as the industry grows in size, frontier enterprises are more likely to choose not to open their patents in order to maintain their technological advantage and earnings. In this way, frontier enterprises can prevent a reduction in the size of the market from undermining their earnings. A reduction in the coefficient of technological advantage t f will make frontier enterprises more inclined not to open their patents when the industry is smaller. In this case, frontier enterprises may retain their patents altogether to preserve their competitive advantage in the market. This shift in strategy reflects the trade-offs that enterprises make between patent openness and protection under different market conditions.

5.2. Impact of Changes in Market Share Due to Production Expansion

To study the impact of changes in market share due to investment in production by laggard enterprises on the evolutionary outcome of the system under pure market operations, with other parameters held constant, we let the values of δ p be 0.1, 0.15, and 0.2, respectively. The simulation results are shown in Figure 3 To show the impact of differences in the initial market size of frontier enterprises on the evolutionary outcomes and form a contrast, we let θ = 0.4 . We continued letting the values of δ p be 0.1, 0.15, and 0.2, respectively. The simulation results are shown in Figure 4.
By comparing Figure 3 and Figure 4, we can observe that in the case where frontier enterprises have a high initial market share, although the final evolutionary trend shows that the laggard enterprise is more inclined to invest in R&D, frontier enterprises are more inclined to open their patents. However, the tendency of laggard enterprises to invest in production expansion increases when they have a large change in their market share. In this case, frontier enterprises will be less willing to open their patents. This suggests that changes in market share have a significant impact on the strategic choices of laggard enterprises, which are more likely to consolidate or increase their market share by expanding production. In contrast, when the initial market share of frontier enterprises is low, laggard enterprises are more determined to choose to expand their investment due to the change in market share. However, frontier enterprises tend not to open their patents. This strategic choice reflects frontier enterprises’ preference for protecting their patents in the face of lower market share. In this way, frontier enterprises can maintain their technological advantage and prevent laggard enterprises from gaining a competitive advantage through the patent openness strategy. Laggard enterprises, on the contrary, rapidly capture the market by expanding production so as to gain a favorable position in the competition. These findings reveal the profound impact of changes in market share on enterprises’ strategic choices and how firms adjust their patent openness and expansion strategies under different market conditions.
When frontier enterprises have a large initial market share, laggard enterprises may opt to increase their market share by investing in production. This may slow down the shift of frontier enterprises to patent openness and laggard enterprises to R&D investment. This may be due to the fact that when frontier enterprises weigh the social effect gains from the patent openness strategy against the gains from maintaining market share and technological superiority, they will find the former to be more attractive, while the threat of R&D from laggard enterprises is relatively low. Laggard enterprises are more inclined to prioritize the upgrading of science and technology to achieve long-term development. This is because the investment in production is less profitable compared to the enhancement of market size and technological advantages brought about by R&D. Additionally, investment in production may reduce the industry’s cost of production, which benefits frontier enterprises.
When the initial market share of frontier enterprises is small, even small changes in market share may cause both laggard enterprises and frontier enterprises to forego the option of investment in expansion and patent openness. This is because, in this case, the patent openness of frontier enterprises may lead to a significant reduction in their market share. By contrast, laggard enterprises can significantly encroach on the market share of frontier enterprises by investing in production. As a result, frontier enterprises are more likely to choose not to open their patents in order to retain their technological advantage and protect their market position through technical barriers. This strategy reflects how enterprises adjust their strategic decisions to market dynamics and competitive dynamics under conditions of different market sizes.

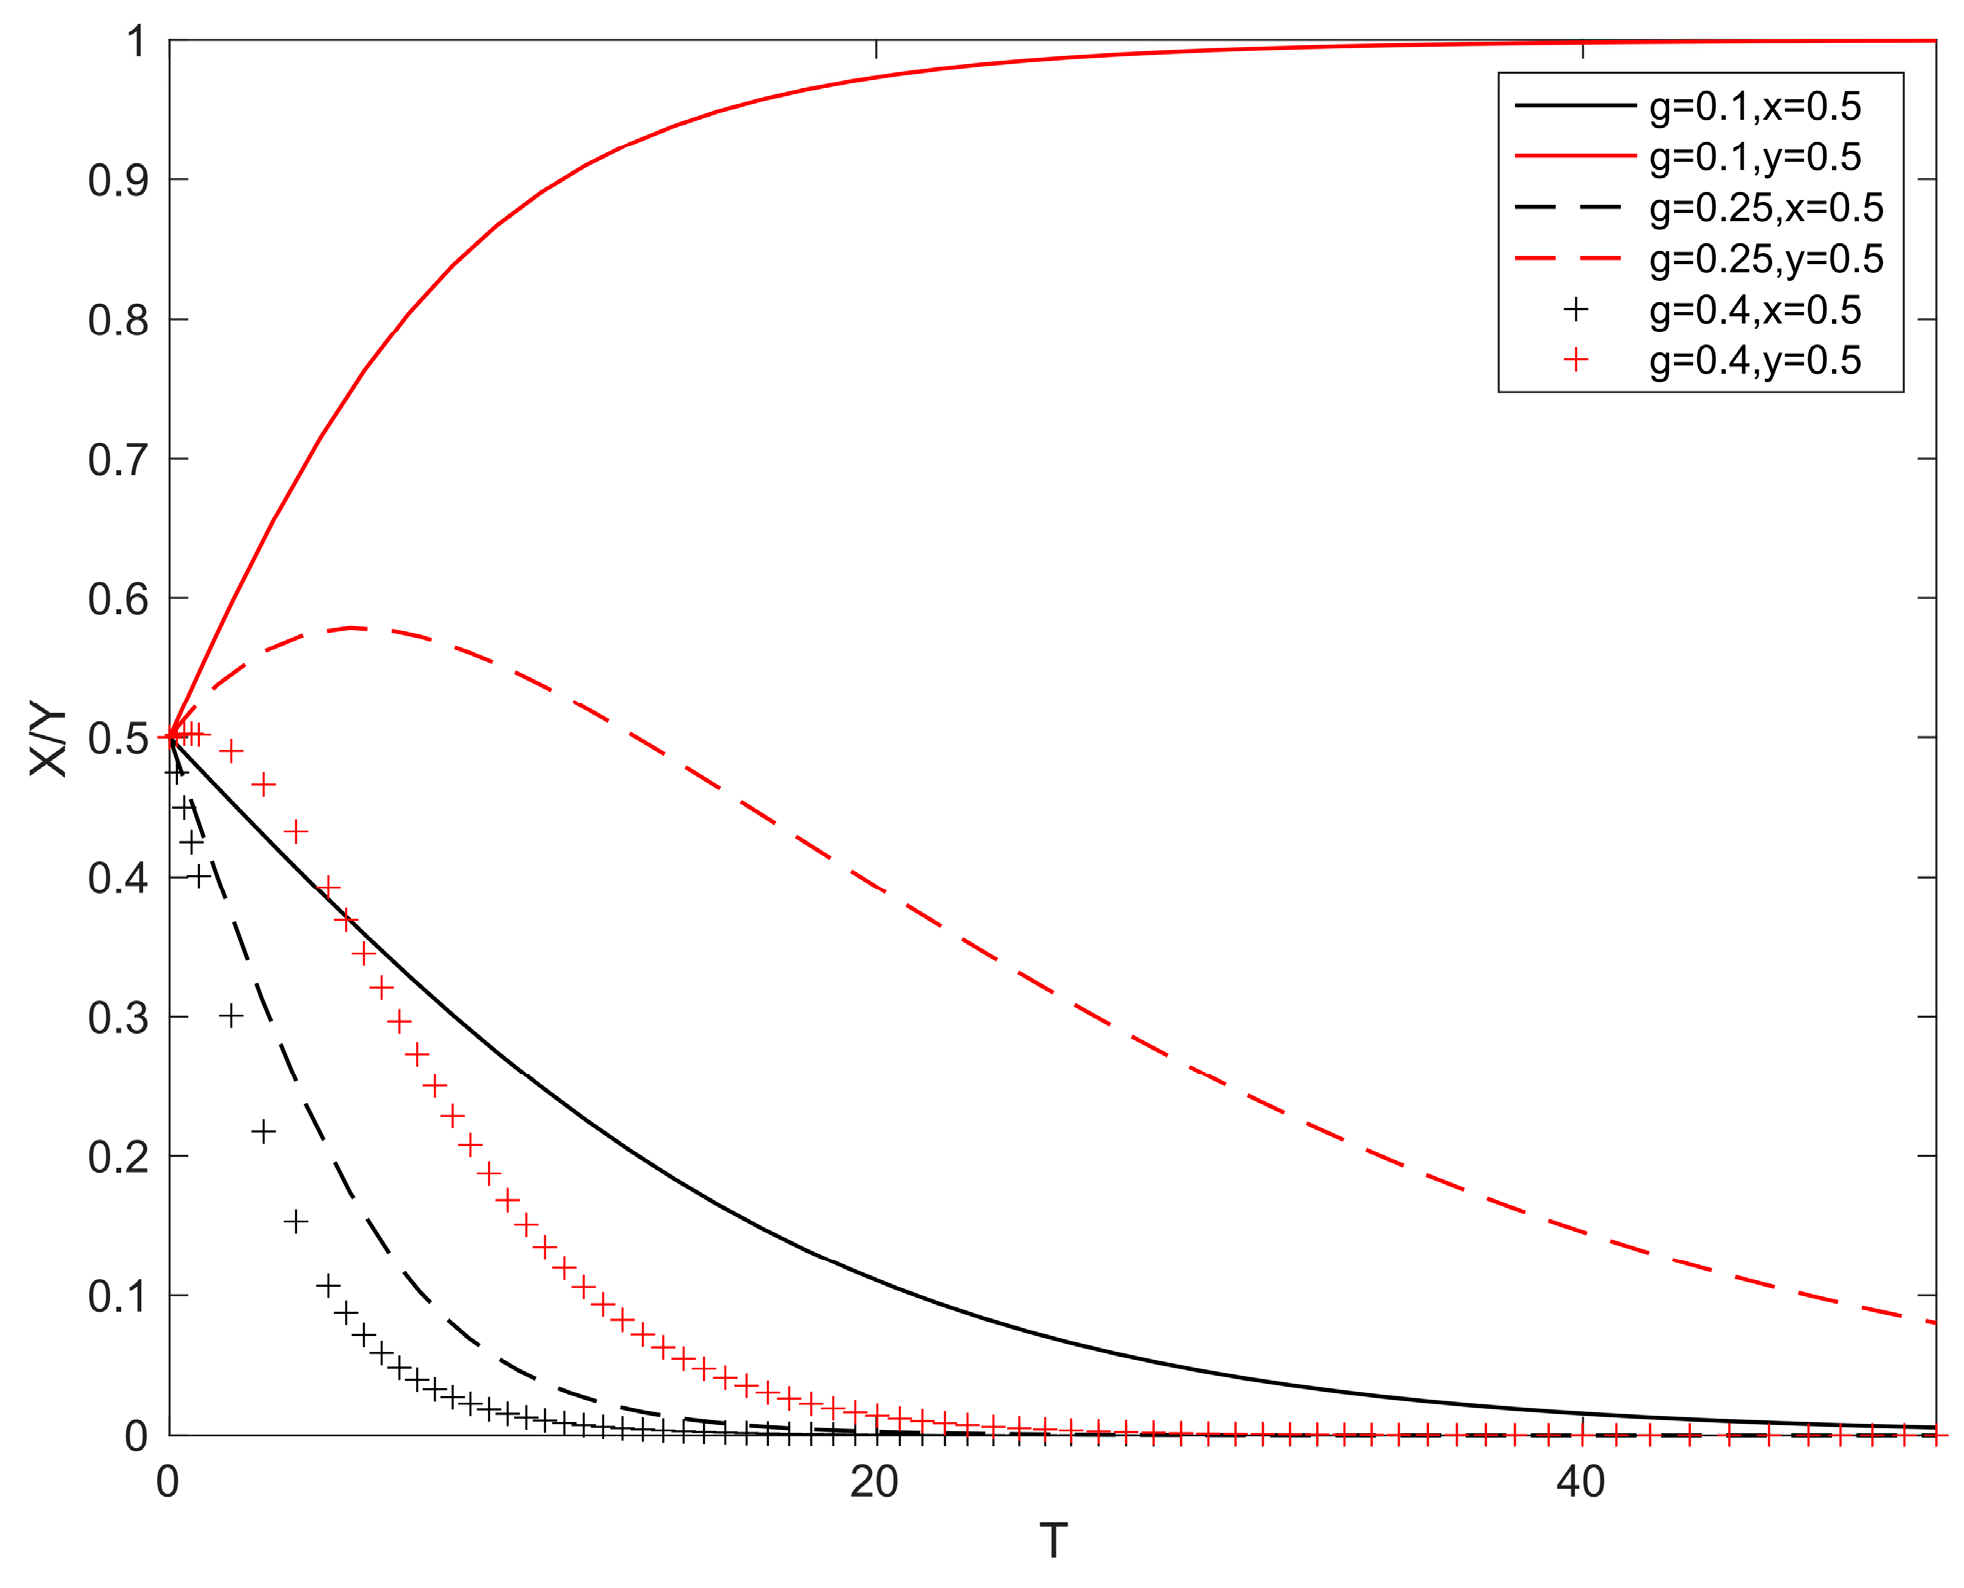
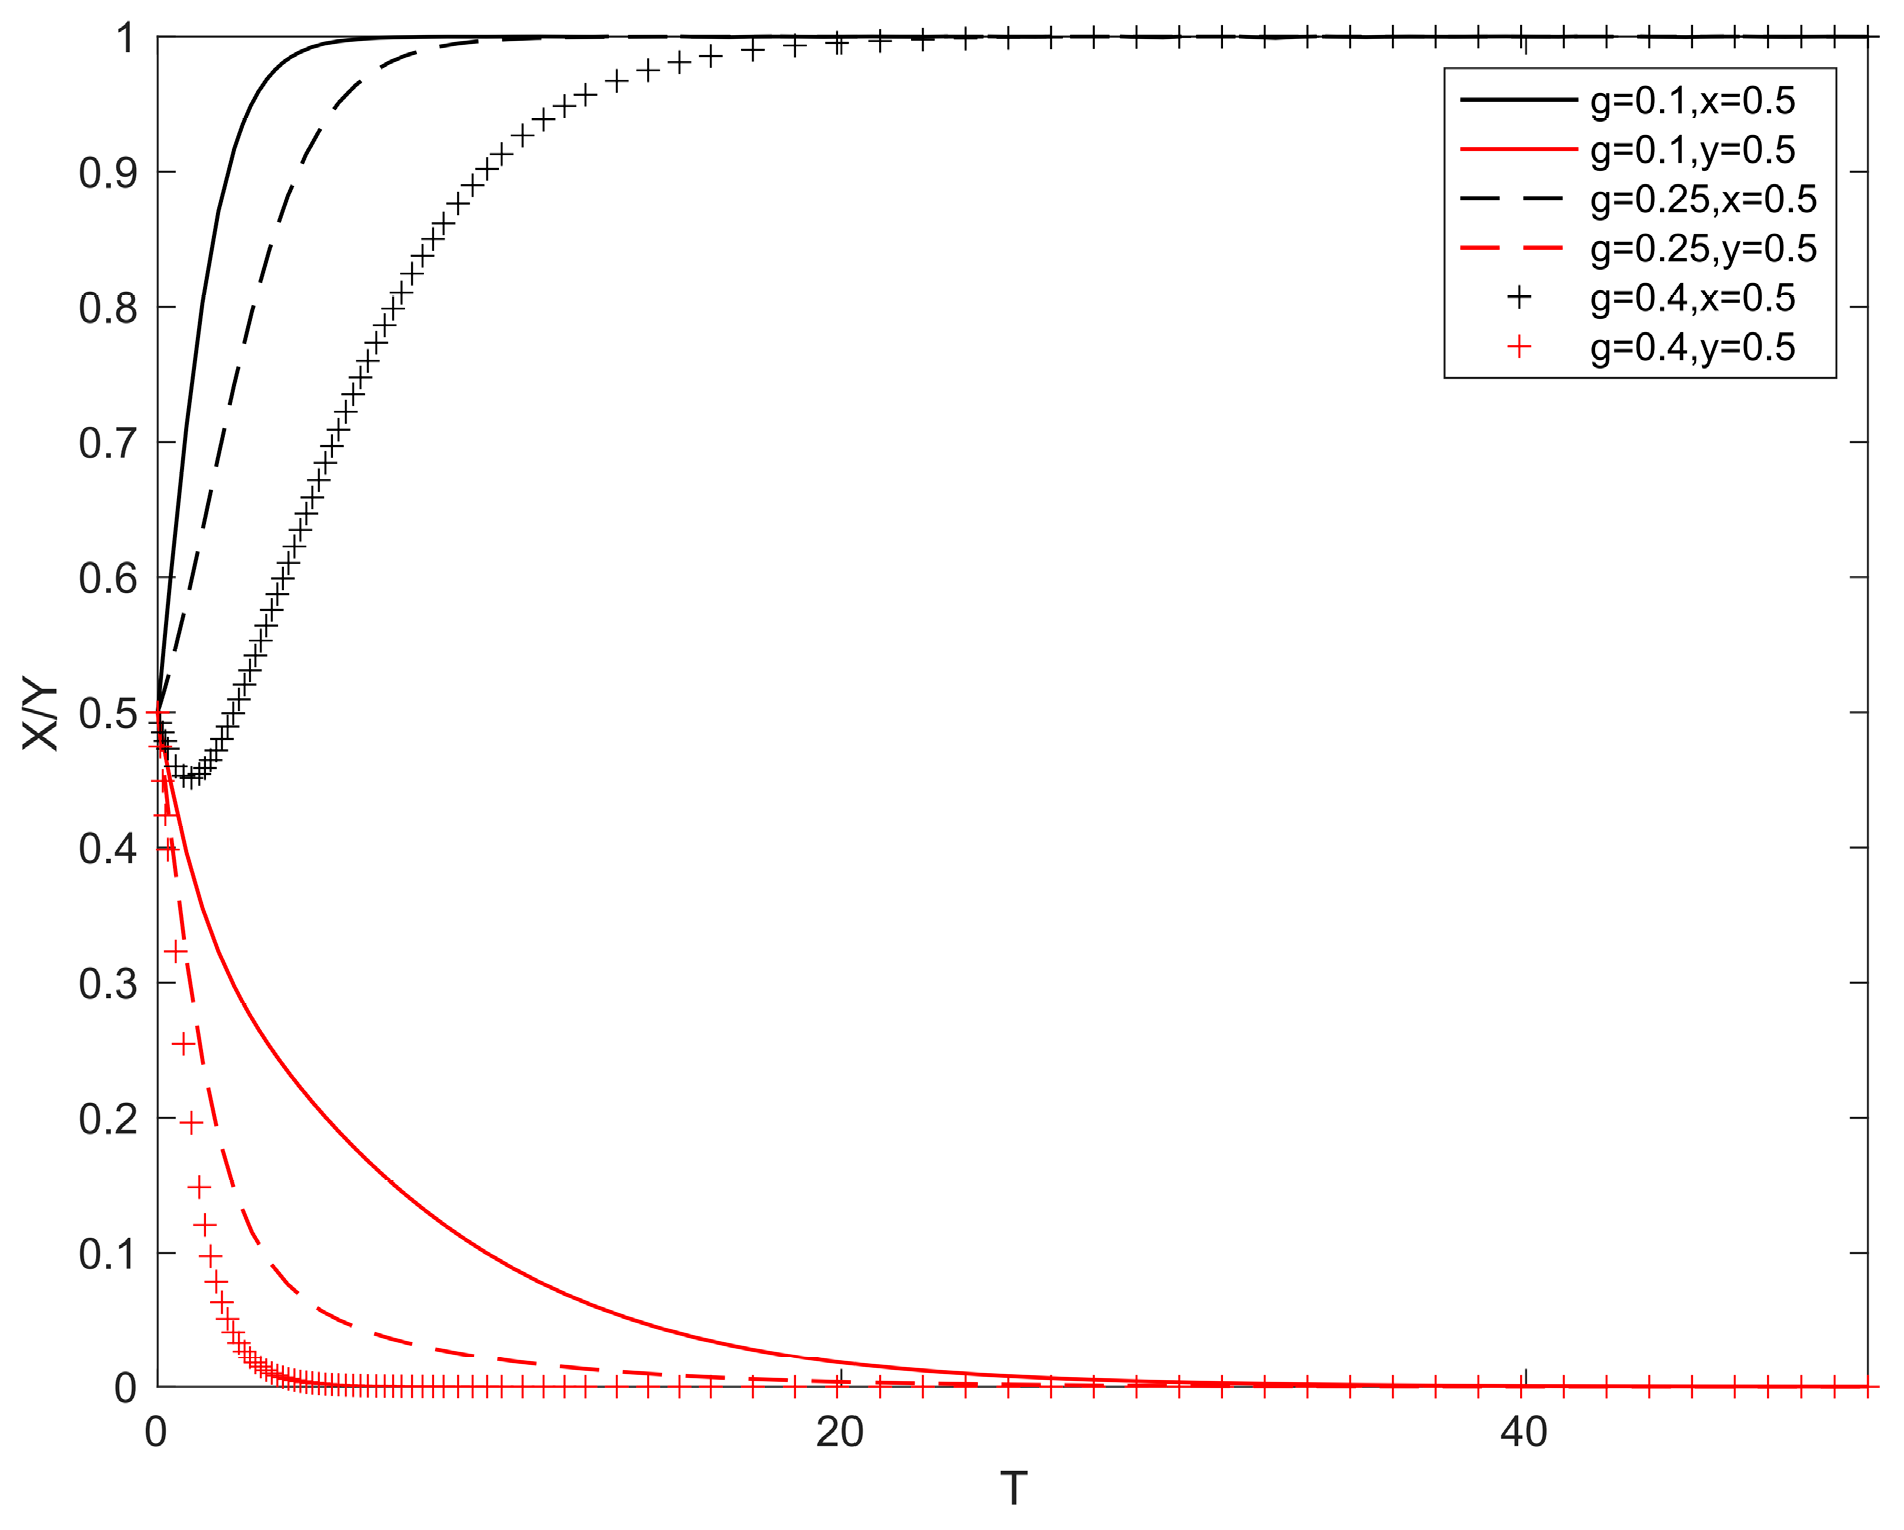
5.3. The Impact of Changes in Industry Production Costs

Based on laggard enterprises boosting their investment, we studied how it lowers industry costs and affects system evolution. With all other parameters held constant, we let the values of g be 0.1, 0.2, and 0.4, and the simulation results are shown in Figure 5. Based on frontier enterprises not opening their patents, we studied how different levels of product quality M impact the game dynamics. This analysis formed a comparison. We set M = 4 and let the values of g be 0.1, 0.2, and 0.4. The simulation results are shown in Figure 6.
As industry costs drop significantly, laggard enterprises find investment expansion more appealing. This is because the benefits of scale expansion grow due to cost advantages. Meanwhile, as production costs fall, open patents could lessen their market advantage, and early enterprises might rethink their patent policies. Especially when product quality M reaches a critical threshold, frontier enterprises are more likely to retain patents to protect their product differentiation and high-added value. In the scenario shown in Figure 5, we can see that as government subsidies g go up, frontier enterprises prefer not to open their patents. They use their technological advantages and product quality to keep their market position. Laggard enterprises, on the contrary, are more likely to expand production. They capitalize on the cost reductions and market opportunities. Figure 6 demonstrates that under different conditions, laggard enterprises invest in R&D to improve their technical capabilities and market competitiveness. Conversely, frontier enterprises retain their patents to preserve their technological edge and market share. These evolutionary outcomes reveal the strategic choices of enterprises under different market dynamics and policy environments.
In the realm of asymmetric competition, the investment decisions of enterprises are influenced by various factors. Notably, changes in industry production costs play a role, and so do the dynamics of product quality. Facing low initial product quality, laggard enterprises can seize opportunities from falling industry costs. This allows them to expand investments and production. As a result, their profit margins can increase significantly. In this scenario, laggard enterprises must act quickly. They should effectively invest funds into expanding production to achieve added value. For frontier enterprises, high government subsidies g mean they gain more from falling industry production costs. Thus, they might choose to keep their patents closed. This way, they maintain their market and technological advantages. At the same time, the potential loss of market share due to patent opening is also an important consideration. However, when initial product quality is high, frontier enterprises, gaining more from subsidies, tend to keep their patents closed. This helps them preserve their market position and profits. Laggard enterprises, facing potential cost reductions and increased profits from expansion, are more likely to invest in R&D. They aim to boost product quality and competitiveness, securing a more advantageous position in the market. Thus, over time, frontier enterprises may directly choose not to open patents when facing high-quality products. Meanwhile, laggard enterprises might directly lean toward investing in R&D to achieve long-term market competitiveness. These choices reflect strategic decisions. Enterprises adapt based on market conditions and policies, and they make dynamic adjustments accordingly.

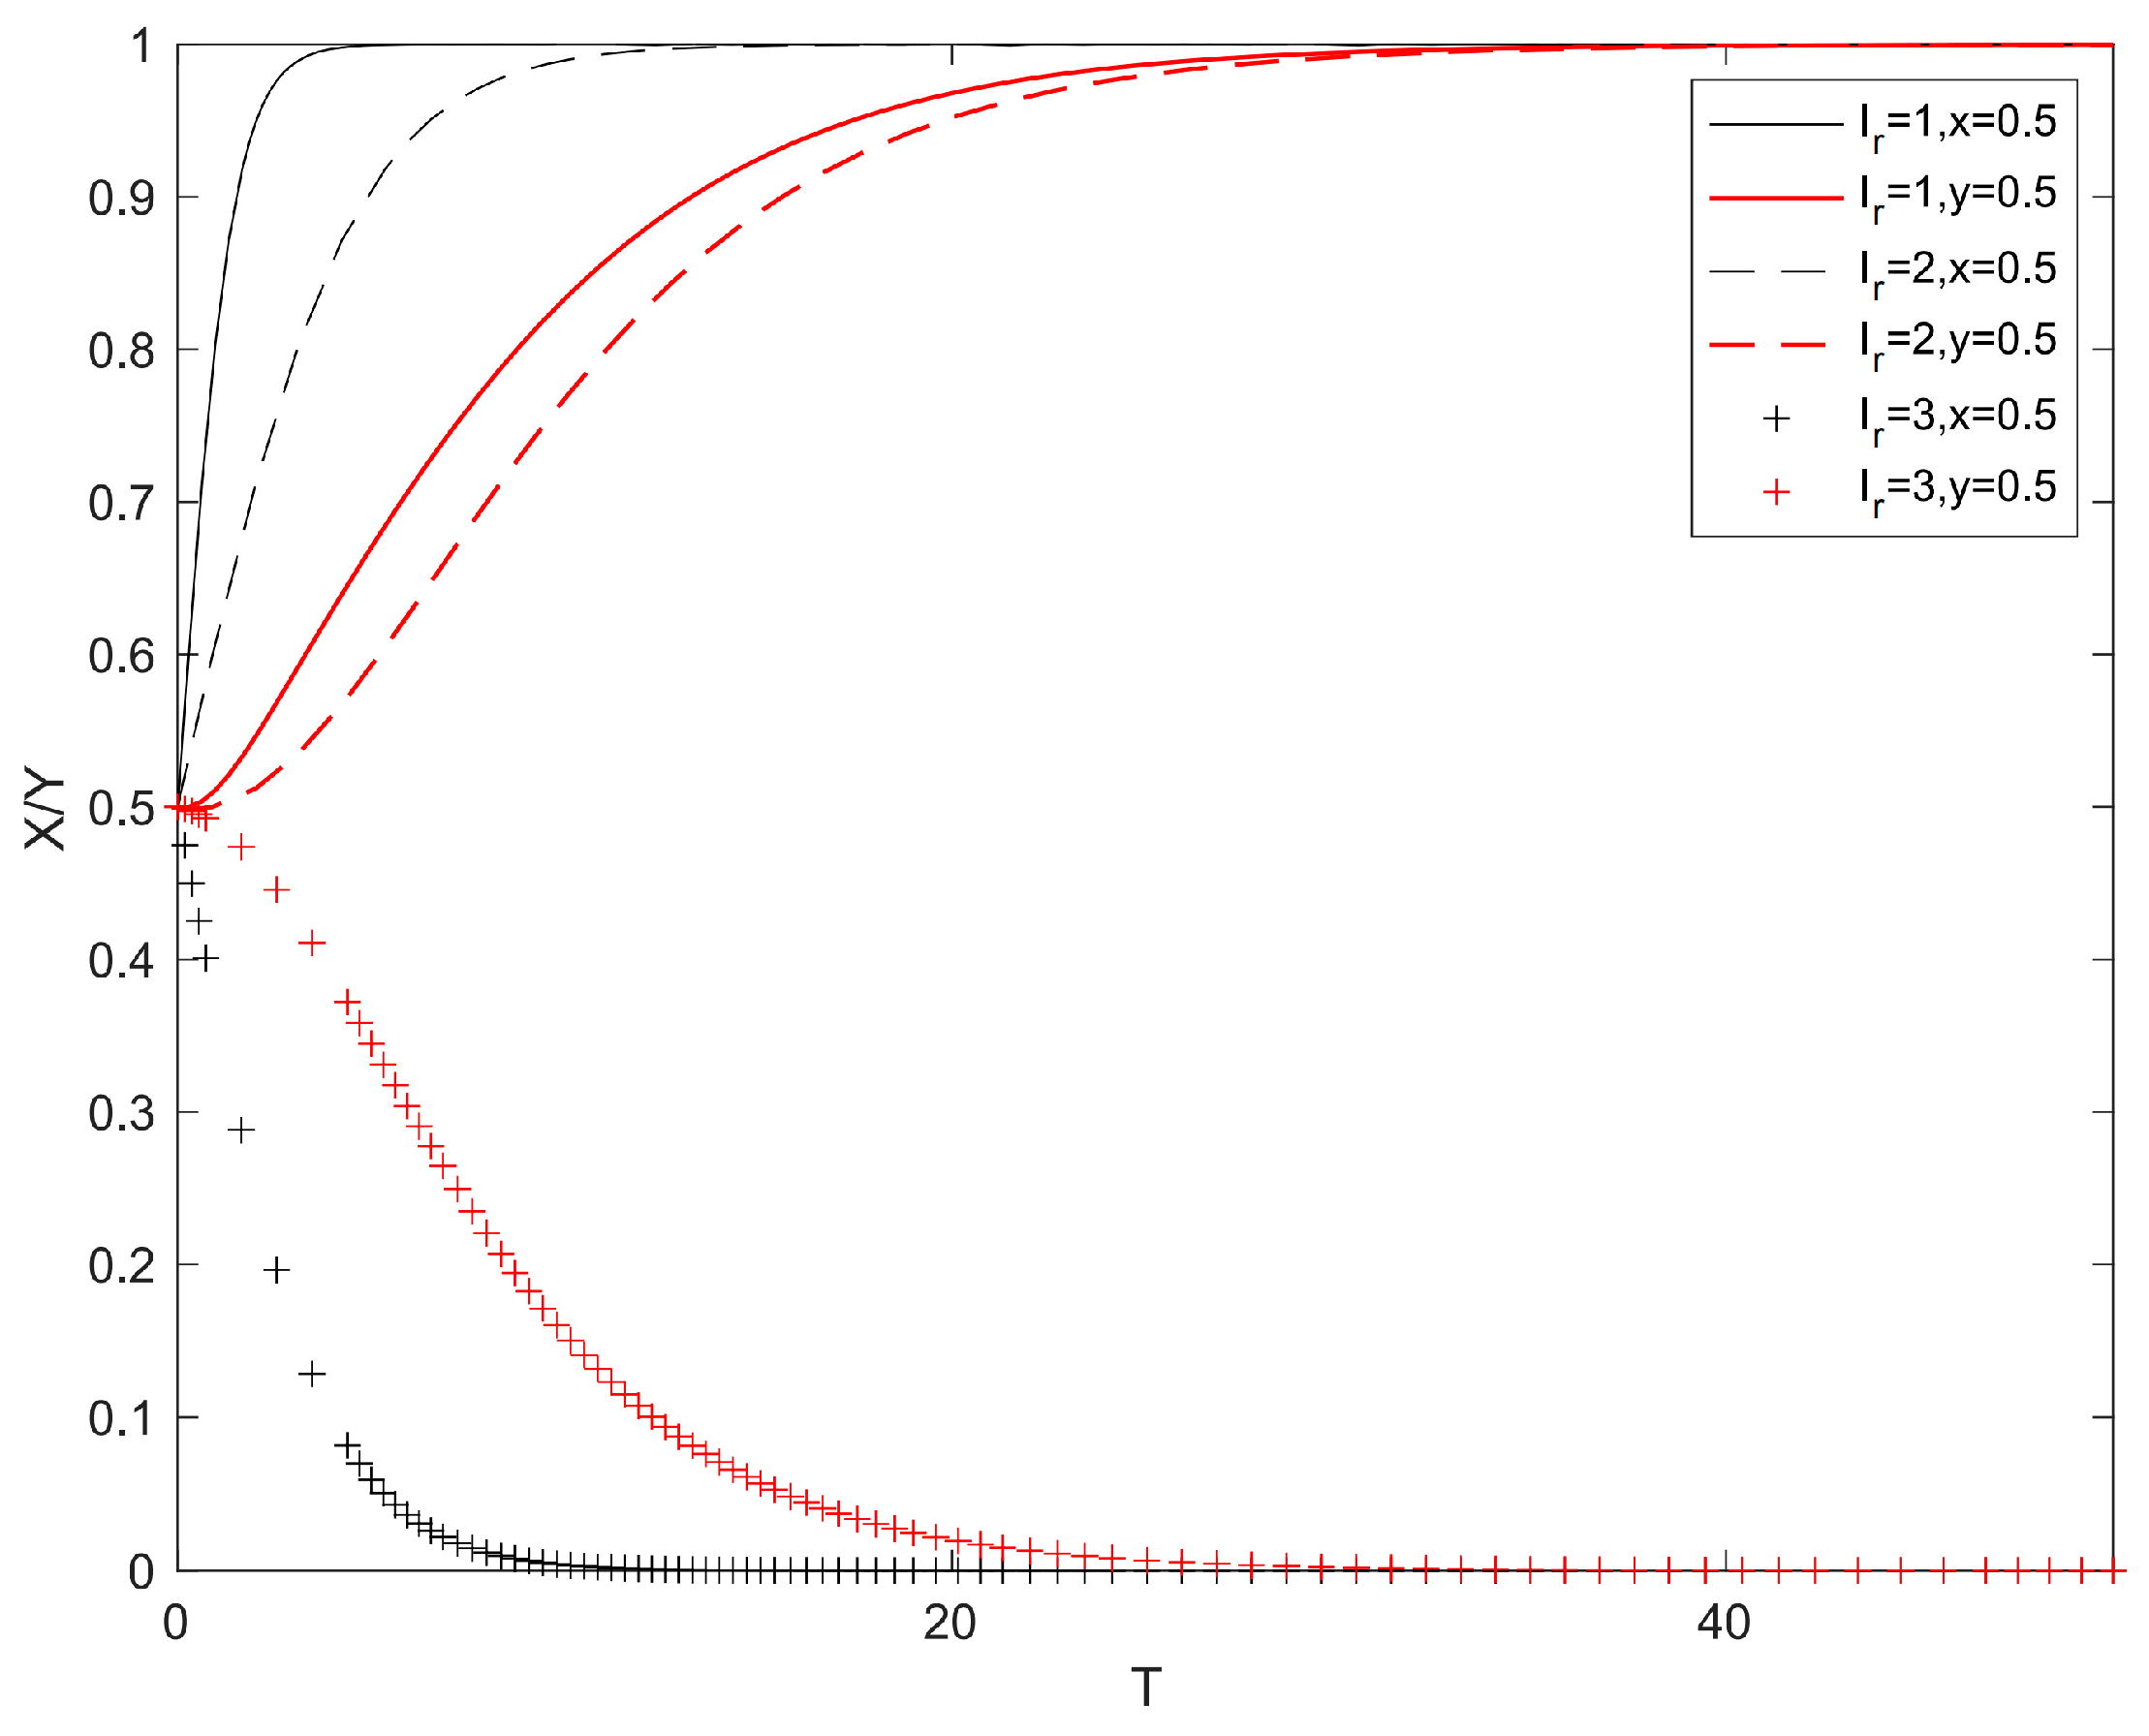
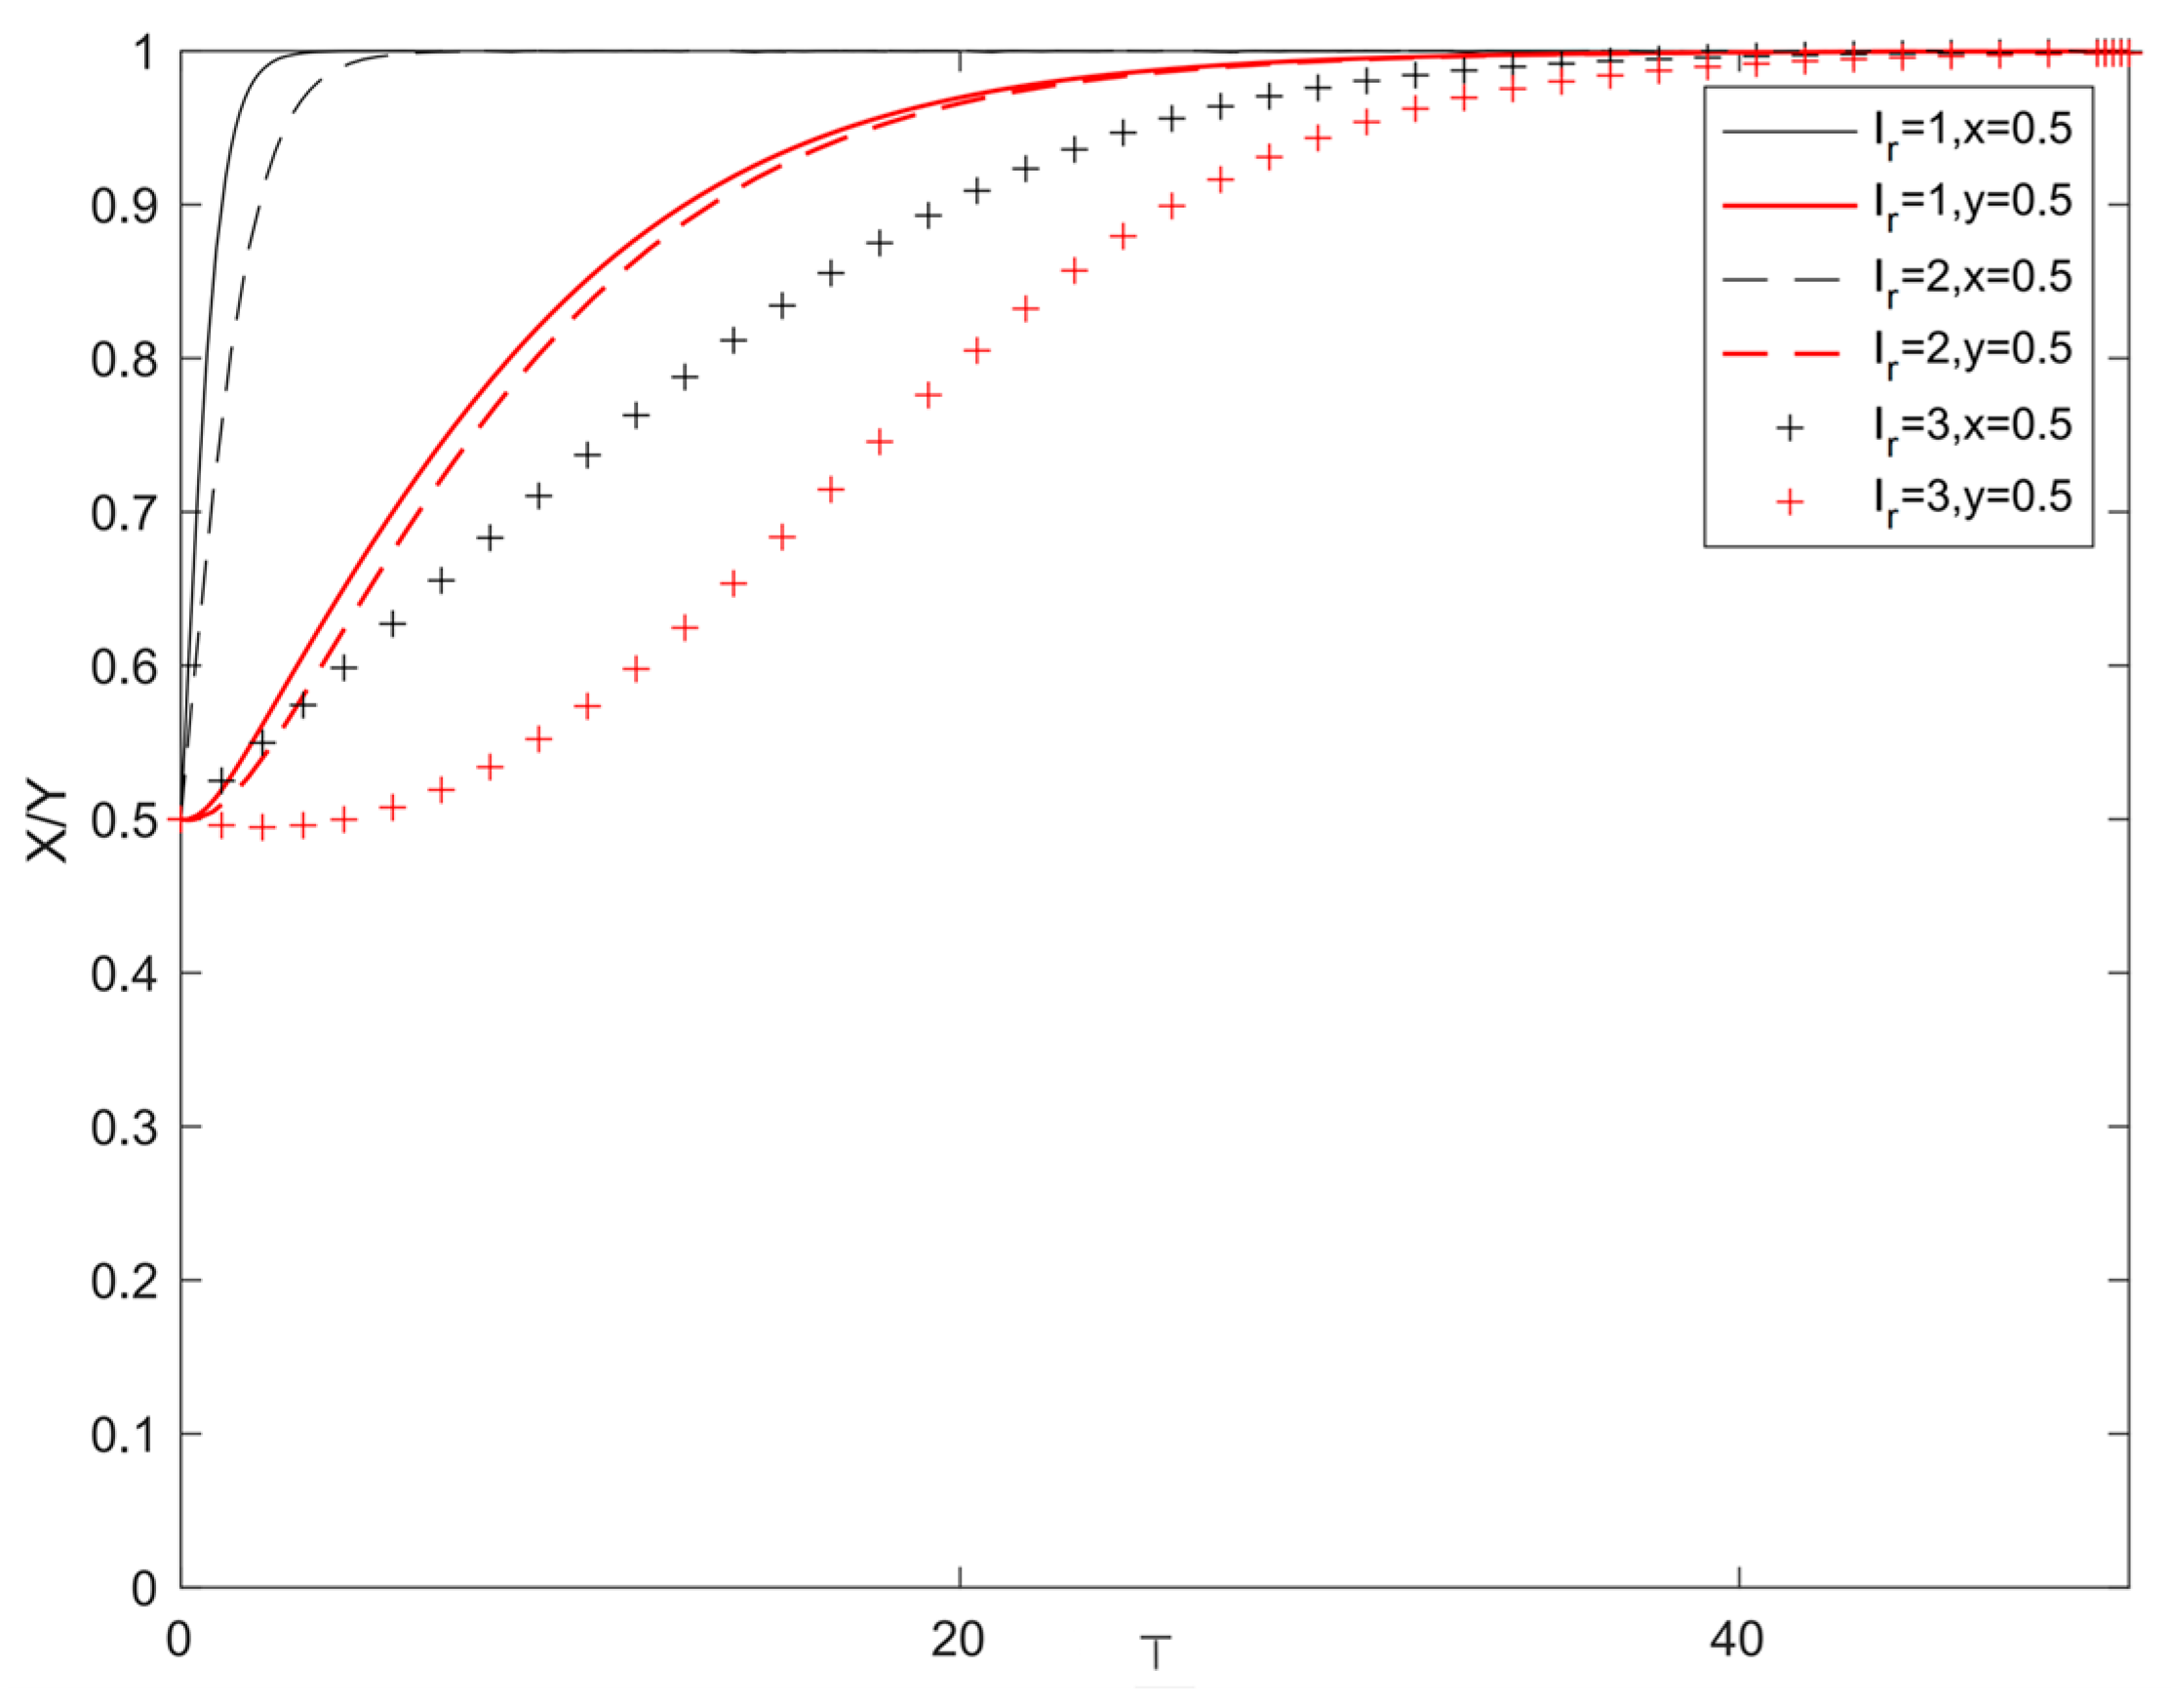
5.4. The Impact of Changes in Research and Development Costs

To study the impact of investment cost changes on system evolution outcomes for laggard enterprises in pure market operation, we kept the other parameters constant. We assigned values of 1, 2, and 3 to the variable I r . The simulation results are shown in Figure 7 To illustrate the effects of R&D on market share and technological advantage, we conducted a simulation. We varied the parameters δ r = 0.3 and s a = 0.4 . Additionally, we set I r to 1, 2, and 3. The results are presented in Figure 8.
Figure 7 and Figure 8 illustrate the effect of rising R&D costs. They curb patent openness in first-mover enterprises and reduce R&D investment in laggard enterprises. This aligns with common sense. In our model, I r is not influenced by other factors. Figure 8 shows a clear contrast between the two. An increase in I r only prolongs the time for both frontier and laggard enterprises to reach the (1, 1) pure strategy point through evolutionary gameplay. It does not lead to an outcome where both enterprises evolve to the (0, 0) pure strategy point.
Laggard enterprises invest in R&D, and each unit of investment effectively increases their market share and technological edge. As total demand grows, this strategy can significantly boost their R&D returns. Their success can undoubtedly boost market share and strengthen technological advantages. The changes in the values of δ r and s a can also be understood as a shift in the marginal utility of R&D costs for I r . When laggard enterprises have higher R&D costs, frontier enterprises also tend not to open their patents or extend the time for the stability of the patent opening strategy. This can be interpreted as a continuous increase in R&D costs. It forces laggard enterprises to invest and expand production while also allowing frontier enterprises to free-ride. They not only avoid the loss of technological advantage from opening patents but also benefit from the reduction in the industry’s production costs. However, this is not conducive to the spread and development of green innovation technologies.

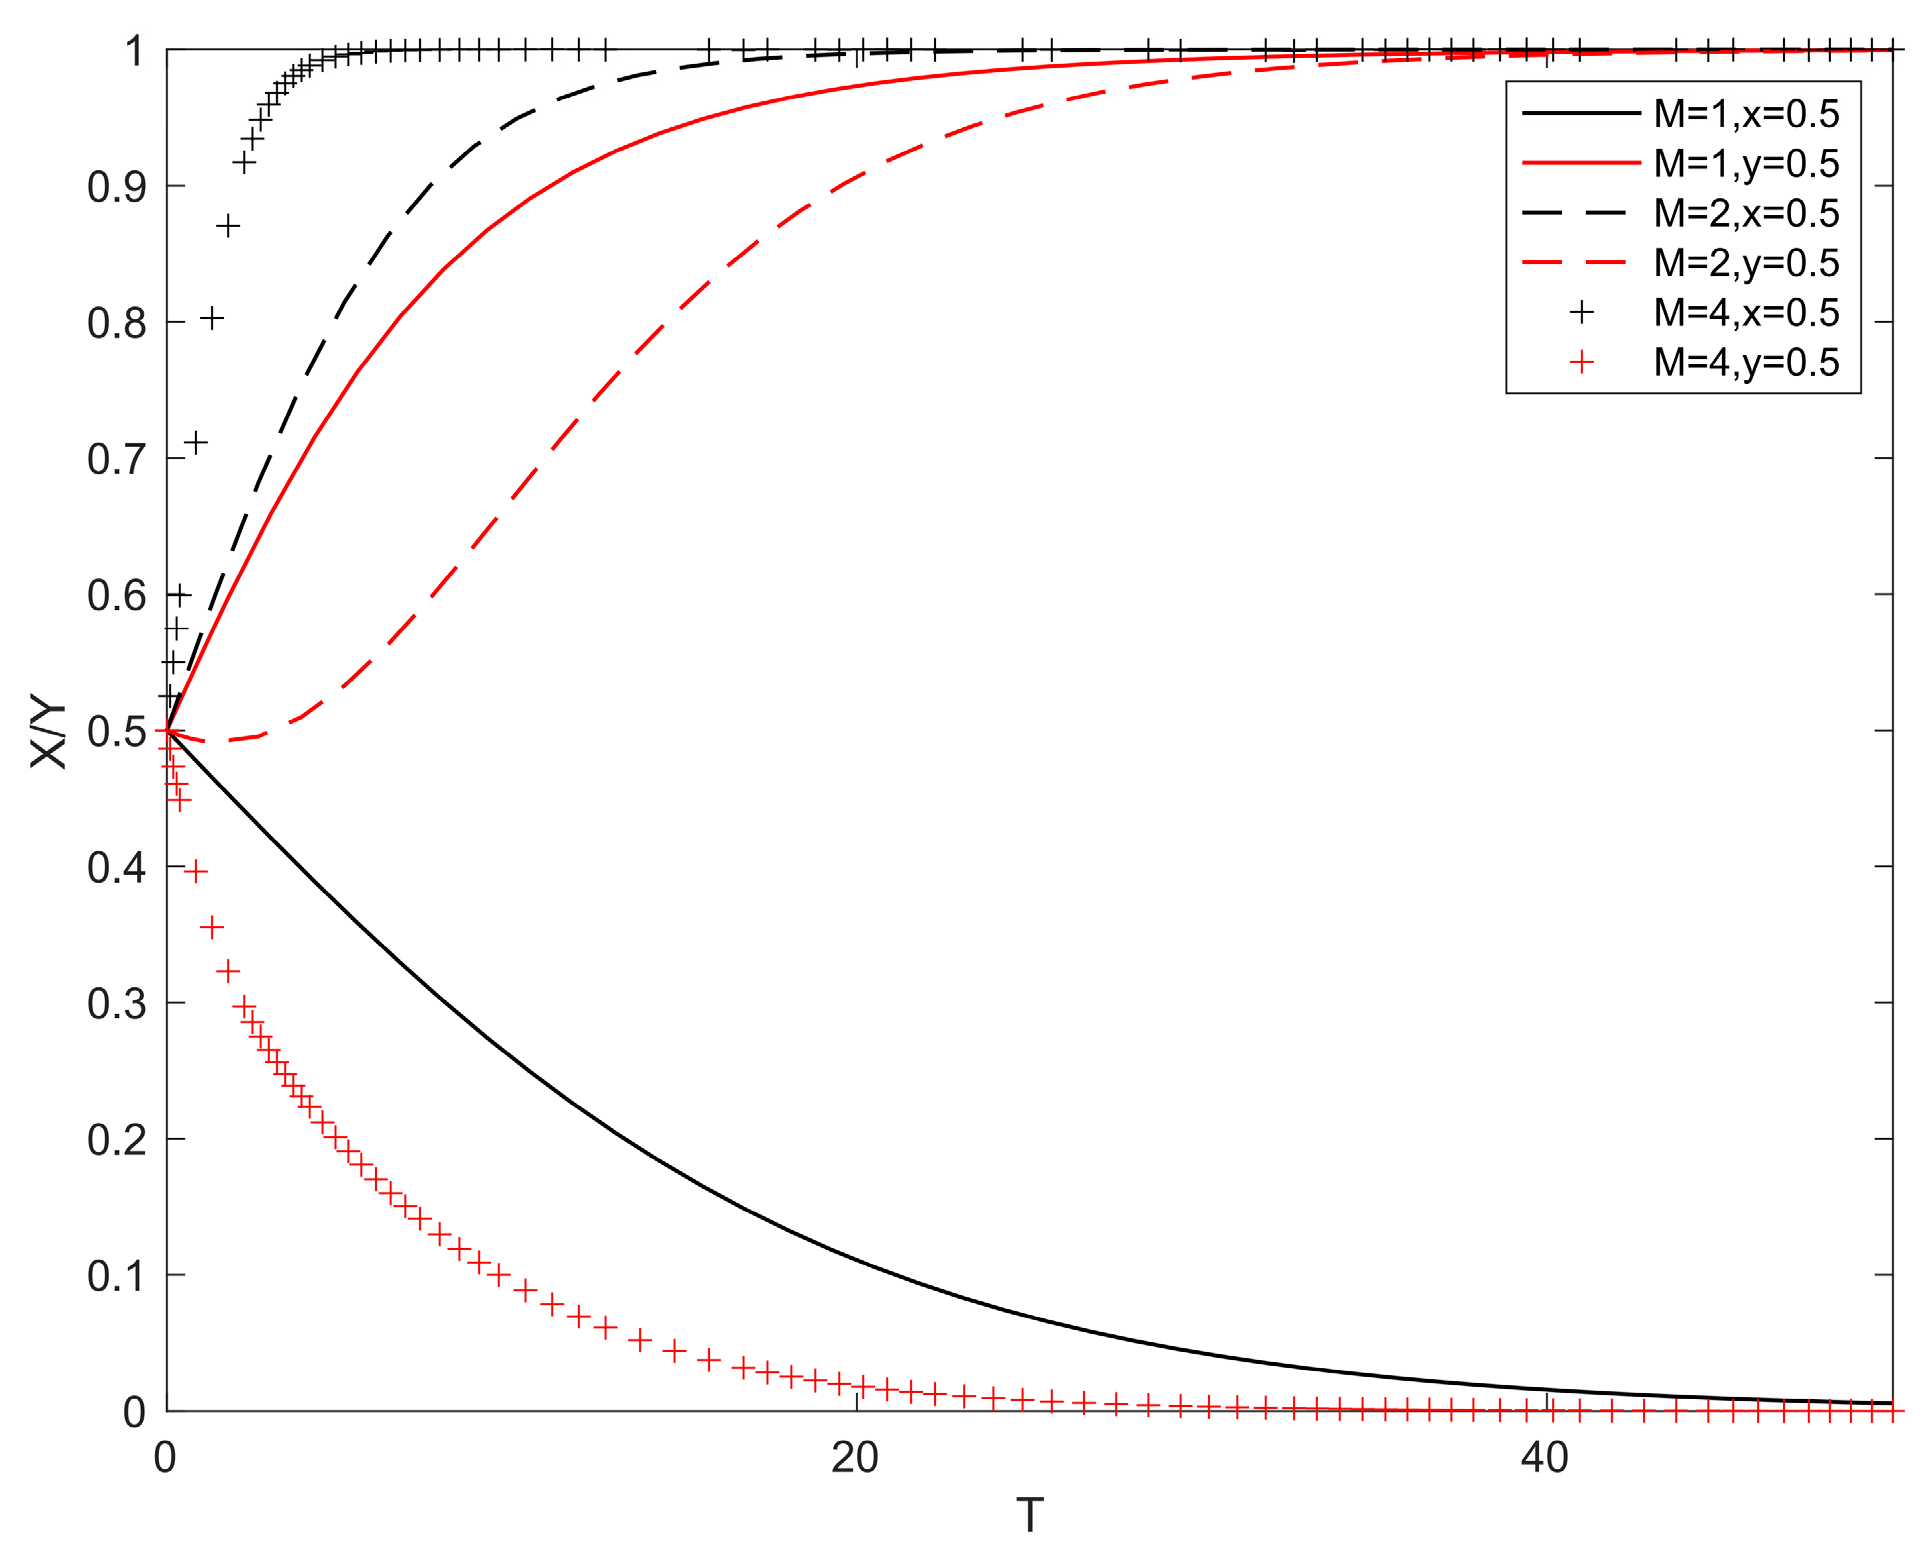
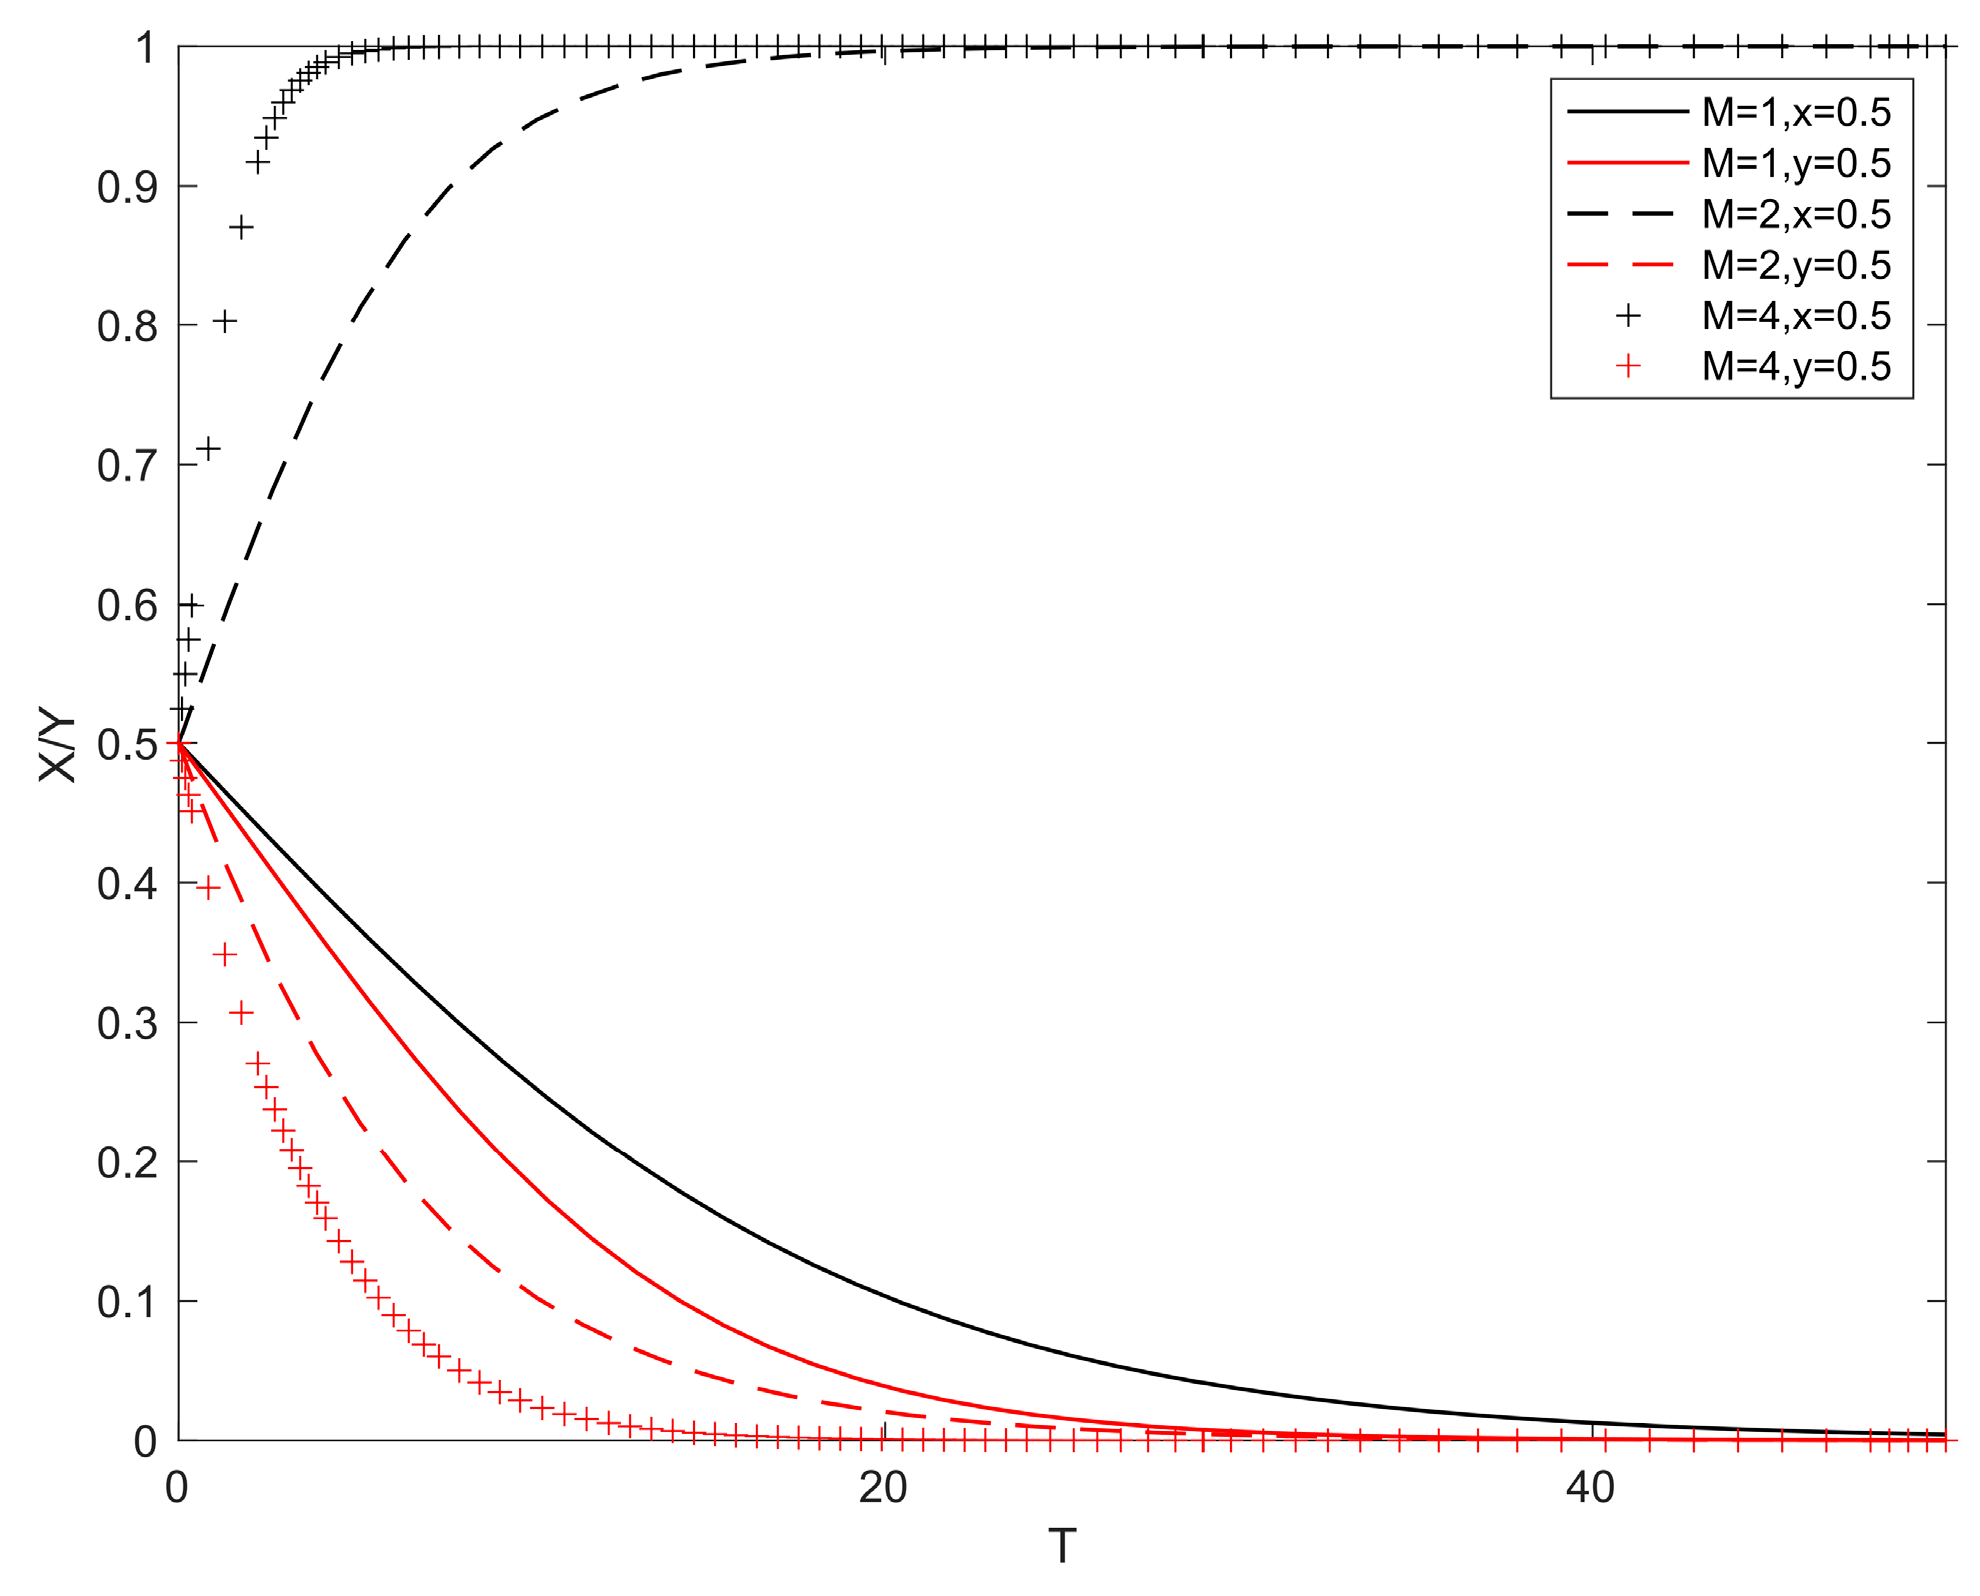
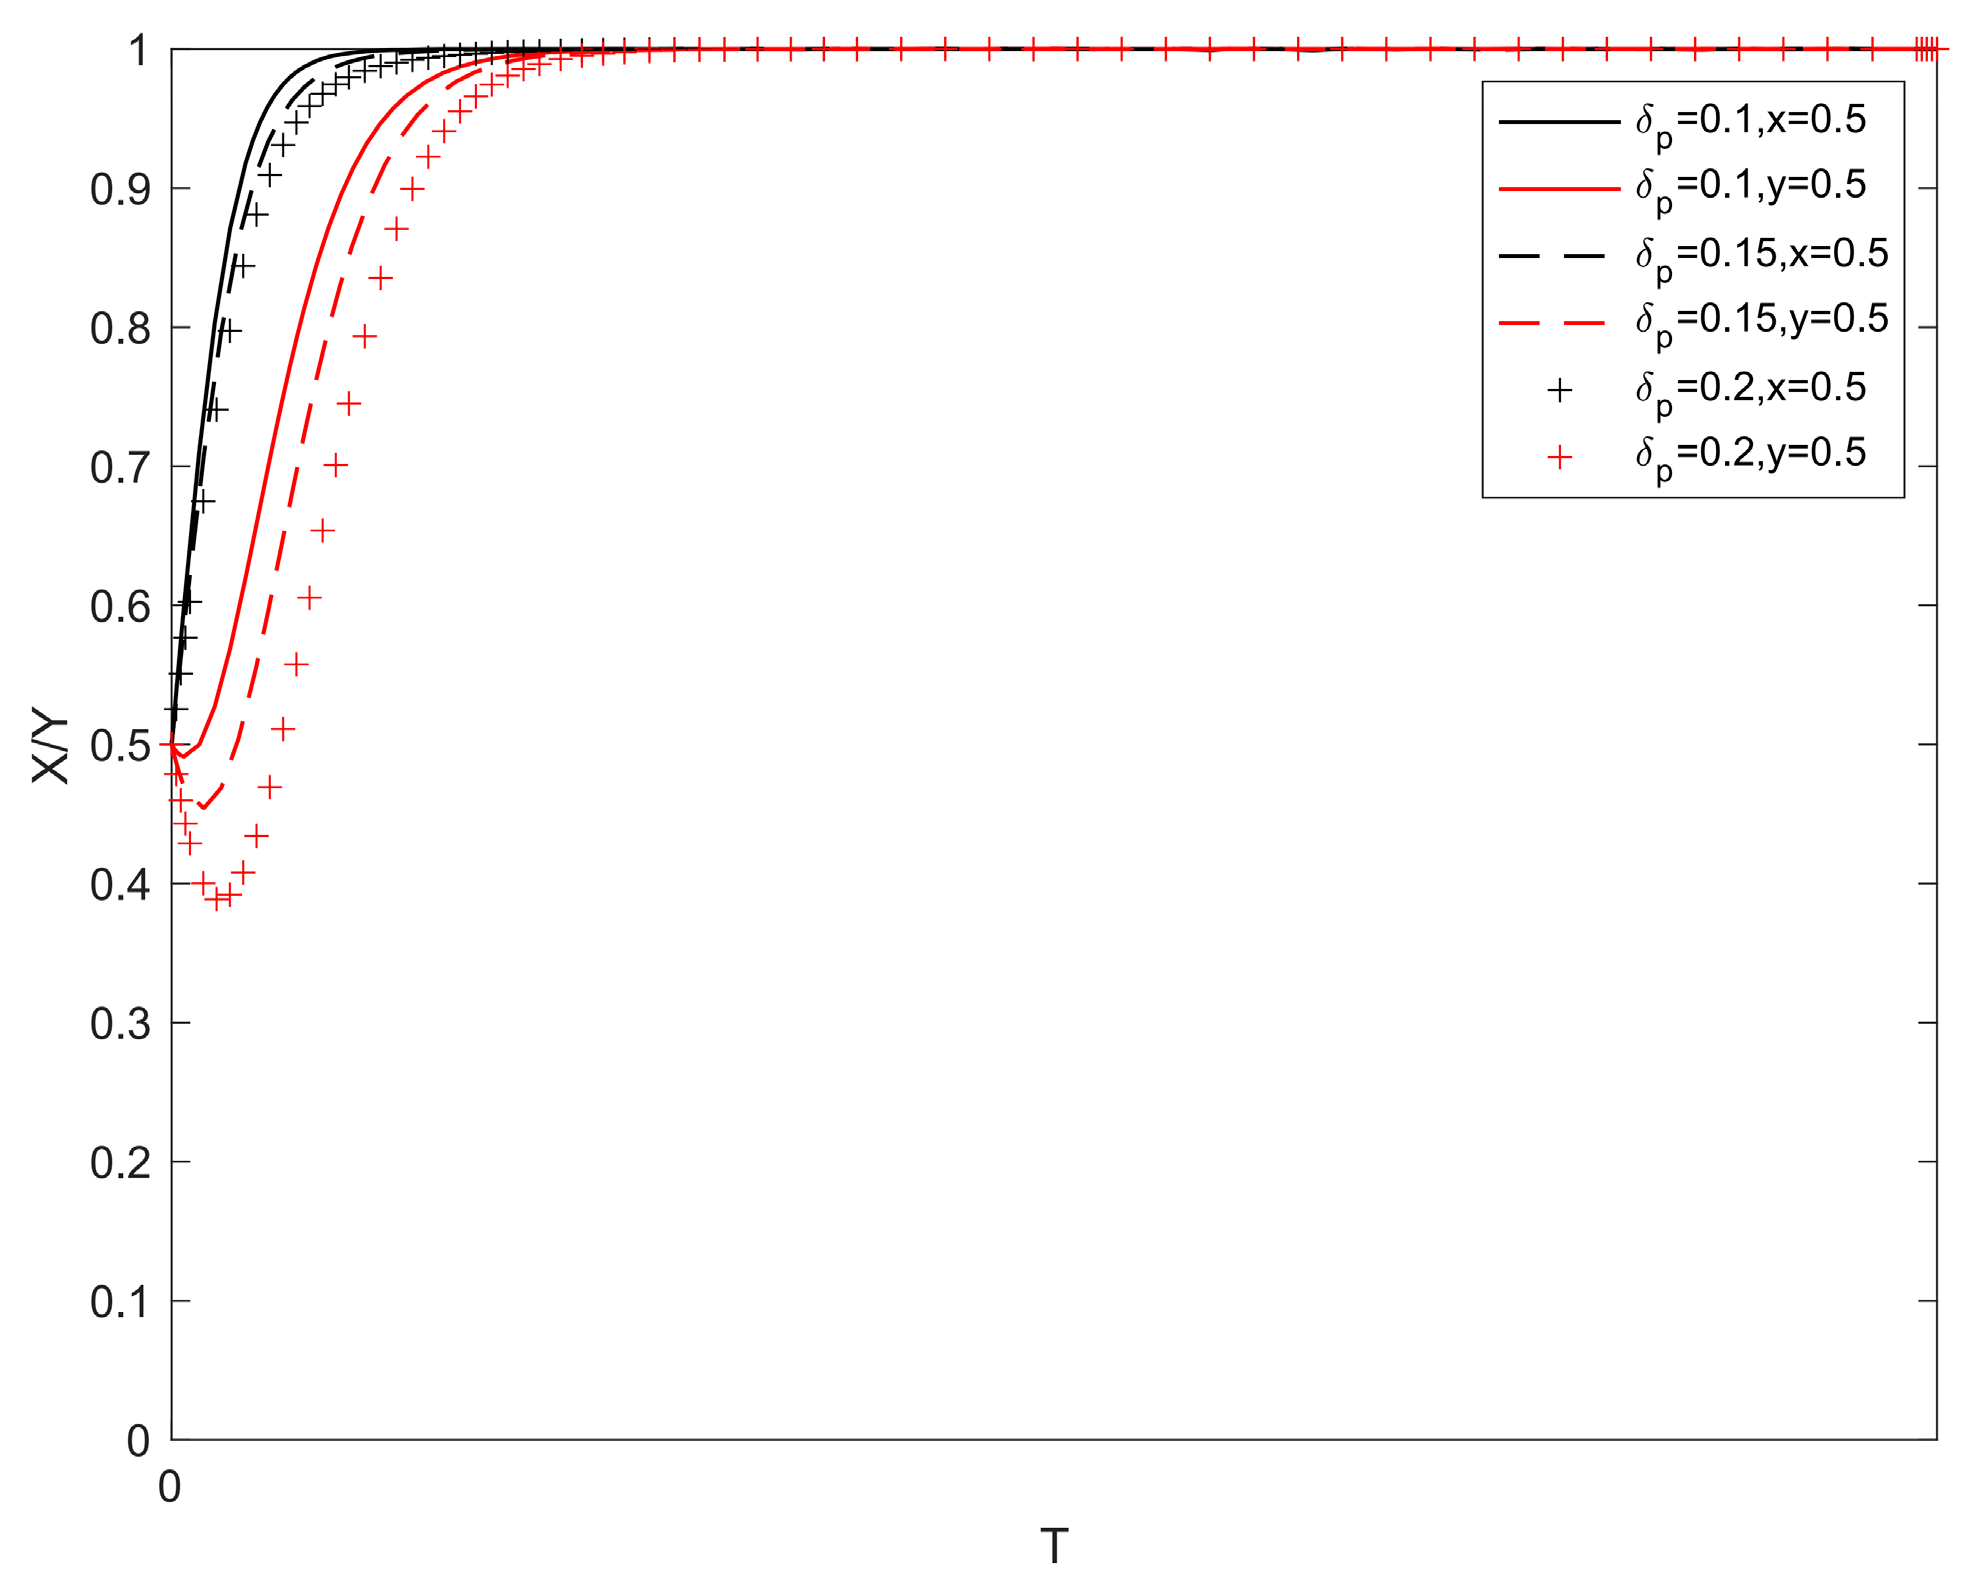
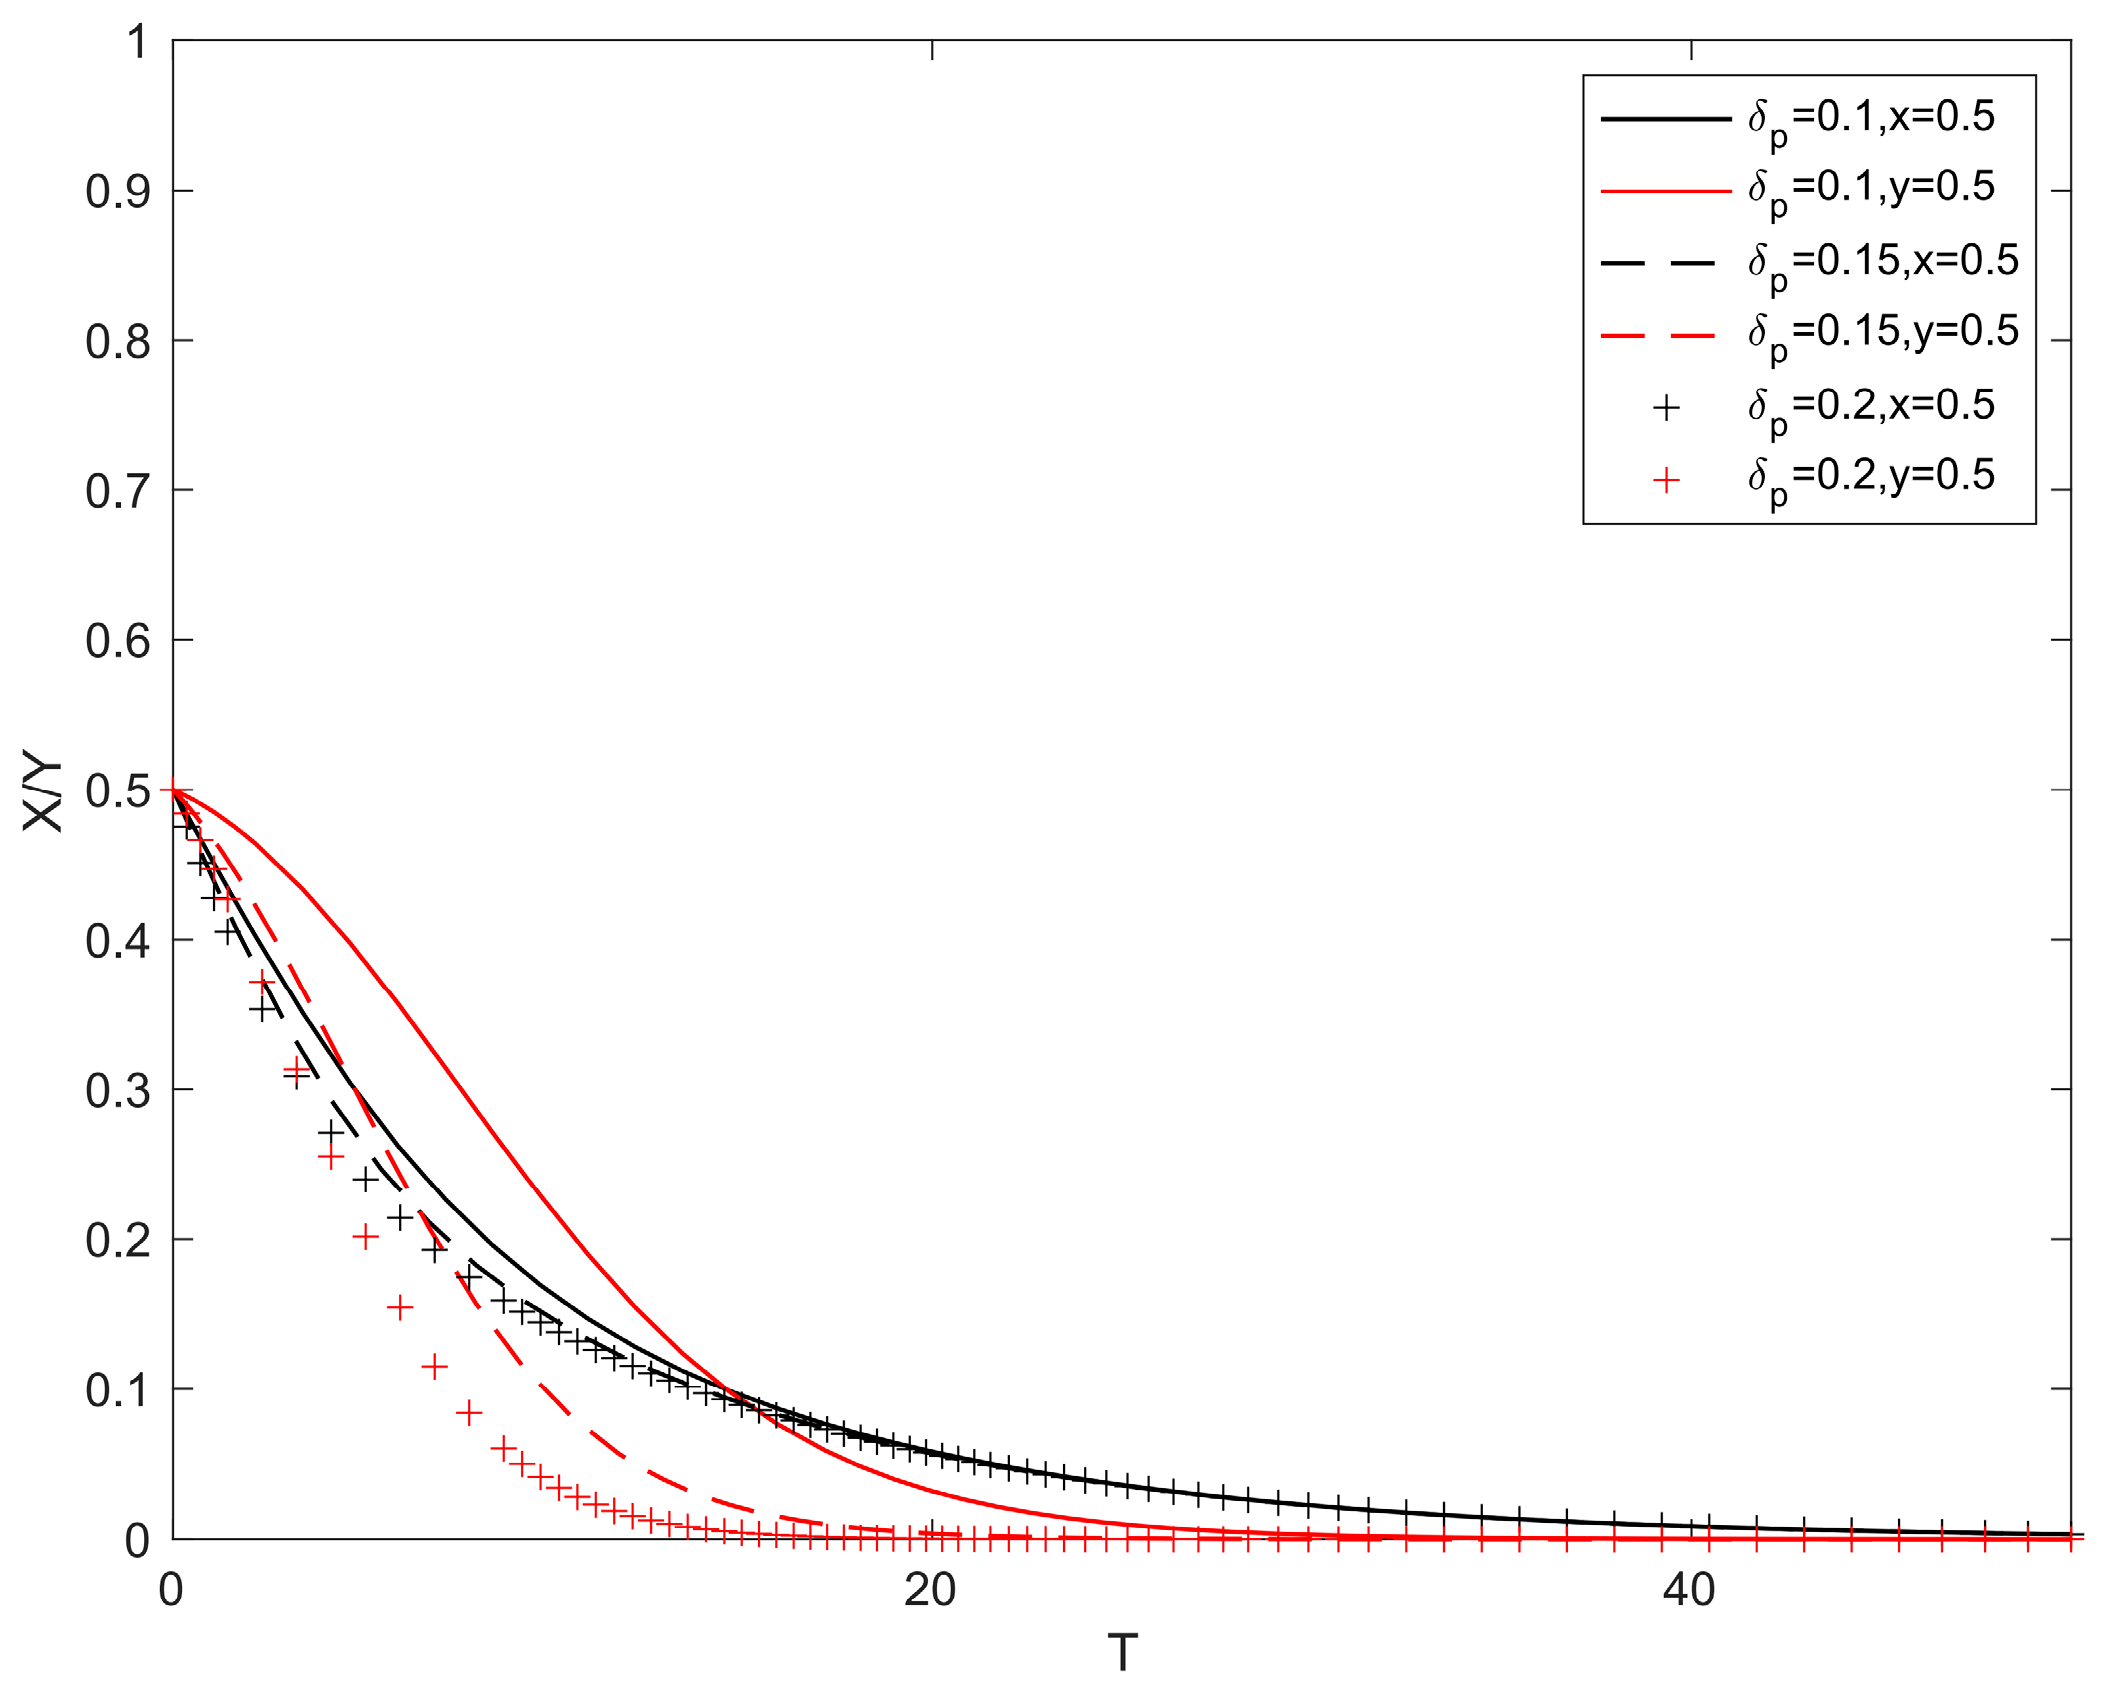
5.5. The Impact of Changes in Technological Advantage and Market Share

To study the impact of changes in technological advantage and market share when frontier enterprises open their patents in asymmetric competition on the system’s evolutionary outcomes, we kept the other parameters constant. We assigned values for s f of 0.1, 0.9, and 1.7, and the values for δ o of 0.05, 0.15, and 0.45. The simulation results are shown in Figure 9 and Figure 10.
When the unit benefit of technological advantage is low, despite growing losses in technological edge, frontier enterprises still tend to open their patents. Figure 9 and Figure 10 show how patent opening by frontier enterprises affects strategies. They consider the effects of technological advantage loss and market share changes on both types of enterprises at different unit benefit levels. As technological advantage loss grows, their patent opening benefits decrease. When the unit benefits of technological advantage are high, frontier enterprises shift from open to closed patents. Yet, when these benefits are minimal, a decrease in technological advantage merely delays the decision by frontier enterprises to open patents.
The decrease in an enterprise’s technological advantage can be understood as the degree of openness of the enterprise’s green innovation technology patents. If frontier enterprises gain little from keeping their patents closed, opening patents becomes a stable strategy. This holds true no matter how much they choose to disclose. Although greater patent openness leads to a larger reduction in market share, it stimulates the growth of green technology across the industry. Improved product quality then drives up market demand. This, in turn, increases the industry’s total market value and boosts company profits.

6. Conclusions and Discussion

Patent openness, as an emerging strategy, holds significant importance for industry development. It permits the sharing of technological achievements, accelerating technology dissemination and enhancing innovation within the sector. Against this backdrop, this study conducted an in-depth analysis of the internal mechanisms of corporate patent openness based on evolutionary game theory. This study constructed an asymmetric competition model and an evolutionary game model between frontier and laggard enterprises. It explored the impact of corporate patent openness on enterprise profits, with and without government subsidies. Additionally, this study objectively analyzed the external conditions affecting the relationship between patent openness policies and enterprise profits. Through theoretical modeling and numerical simulation analyses, the following conclusions can be drawn.
(1) For frontier enterprises, the pivot in investment proclivities of laggard enterprises substantially alleviates the market share erosion stemming from patent disclosure. While, in theory, the self-innovation of laggard enterprises is less likely to jeopardize the industry dominance of frontier enterprises compared to mere imitation, in actual management practice, frontier enterprises, driven by the imperative to preserve their market supremacy, may be averse to laggard enterprises gaining an excessive market share through self-innovation. Consequently, frontier enterprises may deploy a diverse array of strategies to counterbalance the innovative endeavors of laggard enterprises, encompassing but not limited to patent openness, technical collaboration, or market differentiation. For laggard enterprises, as the industry scale incrementally expands yet remains within a specific threshold, if the incremental returns on R&D investment outstrip the incremental returns on expansion investment, laggard enterprises will progressively transition from imitation to self-innovation. This paradigm shift not only bolsters the competitiveness of laggard enterprises but may also impel frontier enterprises to reassess their patent openness strategies in the face of potential market rivalry.
(2) When the marginal returns on expansion investment for laggard enterprises are minimal, and the losses incurred by frontier enterprises due to patent openness are substantial, firms will not embrace the strategy of opening green innovation patents unless they can reap incremental benefits that surpass the free-riding gains. For laggard enterprises, when the decision of frontier enterprises to shift from patent openness to non-openness inflicts significant losses on their R&D investments, they are more inclined to opt for expansion investment strategies.
(3) When the industry scale is nascent, laggard enterprises indeed tend to capitalize on the patent openness of frontier enterprises to invest in expansion, thereby rapidly augmenting their production capacity and capturing market share. As the industry scale swells, in order to distinguish themselves in the cutthroat market competition, laggard enterprises will progressively escalate their investment in self-research and development, aspiring to enhance product competitiveness and market share through technological innovation. In this process, frontier enterprises confront complex strategic choices. On the one hand, opening patents can garner social effects, foster industry development, and aid in maintaining their industry leadership; on the other hand, with the ascent of laggard enterprises, frontier enterprises may harbor concerns about market share dilution, and thus, when the industry scale reaches a certain magnitude, they will re-evaluate their patent openness strategy, inclining toward patent retention to safeguard technological advantages and earnings. However, in management practice, frontier enterprises are unlikely to be sanguine about laggard enterprises gaining excessive market share through self-innovation, as this poses a direct threat to the market position of frontier enterprises. In such scenarios, frontier enterprises should adopt a multiplicity of strategies to modulate the innovative activities of laggard enterprises, such as through technical collaboration, market differentiation, or patent cross-licensing, to preserve their competitive edge while forestalling excessive competition that could lead to market share fragmentation.
(4) When the R&D costs of laggard enterprises can more effectively amplify market share and technological advantages, the sustained expansion of aggregate demand markedly enhances the R&D returns of laggard enterprises. However, when the R&D costs of laggard enterprises are prohibitive, frontier enterprises often opt not to open their patents or prolong the stable period of their patent openness strategy, compelling laggard enterprises to pivot toward expansion investment. Concurrently, this enables frontier enterprises to free-ride, circumventing the loss of technological edge from patent openness while reaping the benefits of reduced overall industry production costs.
Insufficient and future research: This study analyzed patent openness among frontier and follower enterprises in an asymmetric competition environment. It also discussed how these policies affect enterprise profits. However, there are limitations to this study. For example, this study did not explore in depth the long-term effects of patent openness under various market conditions. Additionally, it did not sufficiently examine the impact of patent openness on the overall technological progress and competitive structure of the industry. Additionally, our model did not consider the “liquidity-driven demand,” “endogenous responses by industry leaders,” or “the role of the government” because they were not regarded as key points under our premise and hypotheses. However, this does not necessarily indicate that they are less important. In relevant future studies where the hypotheses will be further expanded, we intend to include these three elements during model construction, especially the way liquidity expansion influences enterprises’ investment decisions, technological innovation, and patent openness. To be more specific, how monetary expansionary policies impact frontier enterprises’ patent openness decisions and laggard enterprises’ investment decisions will be the major questions to be studied. Other short-term impacts are also to be studied in the future. Additionally, future researchers can look into how government policies might regulate the effectiveness of patent openness. Moreover, future studies could further investigate the decision-making differences of companies at different stages of the industry chain in response to patent openness.

Author Contributions

Conceptualization, C.L. and W.Z.; methodology, C.L., G.S., D.Y. and Z.S.; software, C.L.; validation, C.L., M.J., W.Z. and D.Y.; formal analysis, D.Y.; investigation, C.L., W.Z. and Z.S.; resources, M.J.; writing—original draft preparation, C.L.; writing—review and editing, C.L., G.S., D.Y. and Z.S.; supervision, M.J.; project administration, M.J.; funding acquisition, M.J. All authors have read and agreed to the published version of the manuscript.

Funding

This research was supported, in part, by the National Natural Science Foundation of China, grant no. 71831005 and no. 71502044.

Institutional Review Board Statement

Not applicable.

Informed Consent Statement

Not applicable.

Data Availability Statement

Data will be provided upon request.

Conflicts of Interest

The authors declare no conflicts of interest.

References

  1. Andrews, D.; Criscuolo, C.; Gal, P.N. Frontier Firms, Technology Diffusion and Public Policy: Micro Evidence from OECD Countries; OECD Publishing: Paris, France, 2015. [Google Scholar]
  2. Berlingieri, G.; Calligaris, S.; Criscuolo, C.; Verlhac, R. Last but not least: Laggard firms, technology diffusion, and its structural and policy determinants. In OECD Science, Technology and Industry Policy Papers; No. 86; OECD Publishing: Paris, France, 2020. [Google Scholar] [CrossRef]
  3. Bogers, M.L. The Open Innovation Paradox: Knowledge Sharing and Protection in R&D Collaborations. Eur. J. Innov. Manag. 2010, 14, 93–117. [Google Scholar]
  4. Ji, Y.; Yu, X.; Sun, M.; Zhang, B. Exploring the Evolution and Determinants of Open Innovation: A Perspective from Patent Citations. Sustainability 2022, 14, 1618. [Google Scholar] [CrossRef]
  5. He, S.; Zhang, R.; Zhao, J. Research on the impact of Tesla’s technology patent opening on China’s new energy vehicle industry. BCP Bus. Manag. 2022, 23, 307–314. [Google Scholar] [CrossRef]
  6. Wang, J.; Peng, X. A Study of Patent Open Source Strategies Based on Open Innovation: The Case of Tesla. Open J. Soc. Sci. 2020, 8, 386–394. [Google Scholar] [CrossRef]
  7. Ullah, K.; Abbas, S.; Tariq, M.; Mahmood, N.; Kaechele, H. The symmetric and asymmetric impacts of green energy, eco-innovation, and urbanization in explaining low-carbon economy for Pakistan. Environ. Sci. Pollut. Res. 2023, 30, 33375–33395. [Google Scholar] [CrossRef] [PubMed]
  8. Haese, J.; Peukert, C. Open at the Core: Moving from Proprietary Technology to Building a Product on Open Source Software. SSRN 2024. [Google Scholar] [CrossRef]
  9. Chinese Government Website. China to Promote Efficient Operation of Patent Open License System. The State Council of the People’s Republic of China. Available online: http://english.www.gov.cn/news/202407/15/content_WS6694e148c6d0868f4e8e92f6.html (accessed on 15 July 2024).
  10. Lerner, J.; Tirole, J. Some simple economics of open-source. J. Ind. Econ. 2002, 50, 197–234. [Google Scholar] [CrossRef]
  11. Lee, K.; Park, I.; Yoon, B. An approach for r&d partner selection in alliances between large companies, and small and medium enterprises (smes): Application of bayesian network and patent analysis. Sustainability 2016, 8, 117. [Google Scholar] [CrossRef]
  12. Arora, A.; Huang, C.; Athreye, S. The paradox of openness revisited: Collaborative innovation and patenting by UK innovators. Res. Policy 2016, 45, 1352–1361. [Google Scholar] [CrossRef]
  13. Kim, B.; Kim, E.; Miller, D.J.; Mahoney, J.T. The impact of the timing of patents on innovation performance. Res. Policy 2016, 45, 914–928. [Google Scholar] [CrossRef]
  14. Vicente, D.C.D.A. The Impact of Tesla’s Patent Opening. Master’s Thesis, Roma Tre University, Rome, Italy, 2023. [Google Scholar]
  15. Kwon, D.; Lee, H.Y.; Cho, J.H.; Sohn, S.Y. Effect of an open patent pool strategy on technology innovation in terms of creating shared value. Technol. Forecast. Soc. Change 2023, 187, 122251. [Google Scholar] [CrossRef]
  16. Thompson, P.; Zang, W. The relationship between foreign direct investment and domestic entrepreneurship: The impact and scale of investments in China. Growth Change 2023, 54, 694–735. [Google Scholar] [CrossRef]
  17. Cappelli, R.; Czarnitzki, D.; Kraft, K. Sources of spillovers for imitation and innovation. Res. Policy 2014, 43, 115–120. [Google Scholar] [CrossRef]
  18. Mancusi, M.L. International spillovers and absorptive capacity: A cross-country cross-sector analysis based on patents and citations. J. Int. Econ. 2008, 76, 155–165. [Google Scholar] [CrossRef]
  19. Chen, W.; Filieri, R. Institutional forces, leapfrogging effects, and innovation status: Evidence from the adoption of a continuously evolving technology in small organizations. Technol. Forecast. Soc. Change 2024, 206, 123529. [Google Scholar] [CrossRef]
  20. Li, D.; Alkemade, F.; Frenken, K.; Heimeriks, G. Catching up in clean energy technologies: A patent analysis. J. Technol. Transf. 2023, 48, 693–715. [Google Scholar] [CrossRef]
  21. Fershtman, C.; Markovich, S. Patents, imitation and licensing in an asymmetric dynamic R&D race. Int. J. Ind. Organ. 2010, 28, 113–126. [Google Scholar]
  22. Moilanen, M.; Østbye, S.; Woll, K. Non-R&D SMEs: External knowledge, absorptive capacity and product innovation. Small Bus. Econ. 2014, 43, 447–462. [Google Scholar]
  23. Los, B.; Verspagen, B. R&D spillovers and productivity: Evidence from US manufacturing microdata. Empir. Econ. 2010, 25, 127–148. [Google Scholar]
  24. Wang, X.; Li, F.; Li, Y.; Hou, D.; Wang, L.; Qin, X. Does inter-regional investment by publicly listed companies promote local technological catch-up? A study of the mediation effects of patents in China. Technol. Anal. Strateg. Manag. 2024, 36, 279–292. [Google Scholar] [CrossRef]
  25. Wang, L.; Wang, Y.; Lou, Y.; Jin, J. Impact of different patent cooperation network models on innovation performance of technology-based SMEs. Technol. Anal. Strateg. Manag. 2020, 32, 724–738. [Google Scholar] [CrossRef]
  26. Chang, S.; Kim, H.; Song, J.; Lee, K. Dynamics of Imitation versus Innovation in Technological Leadership Change: Latecomers’ Catch-up Strategies in Diverse Technological Regimes. Res. Policy 2024, 53, 105056. [Google Scholar] [CrossRef]
  27. Liu, Y.; Wu, W.; Kim, Y. How do latecomer firms achieve catch-up through technology management: A comparative analysis. Humanit. Soc. Sci. Commun. 2023, 10, 561. [Google Scholar] [CrossRef]
  28. Khunakornbodintr, S.; Lv, P.; Hain, D.S. Windows of opportunity for unrelated diversification: A patent data analysis of the field of neurotechnology. Int. J. Emerg. Mark. 2024. Early Access. [Google Scholar] [CrossRef]
  29. Wang, J.; Du, Y. From leveraging to learning: Latecomer trade-offs between technology purchase and imitation. Technol. Anal. Strateg. Manag. 2023, 36, 3786–3798. [Google Scholar] [CrossRef]
  30. Cayton, S.E. The “Green Patent Paradox” and Fair Use: The Intellectual Property Solution to Fight Climate Change. Seattle J. Technol. Environ. Innov. Law 2020, 11, 214. [Google Scholar]
  31. Vakili, K. Collaborative promotion of technology standards and the impact on innovation, industry structure, and organizational capabilities: Evidence from modern patent pools. Organ. Sci. 2016, 27, 1504–1524. [Google Scholar] [CrossRef]
  32. Musk, E. All Our Patent Are Belong to You. Available online: https://www.tesla.com/blog/all-our-patent-are-belong-you (accessed on 12 June 2014).
  33. Bowman, J. The Eco-Patent Commons: Caring Through Sharing. WIPO Magazine, 3 June 2009. Available online: https://www.wipo.int/wipo_magazine/en/2009/03/article_0004.html (accessed on 20 July 2024).
  34. Hu, B.; Hu, M.; Yang, Y. Open or closed? Technology sharing, supplier investment, and competition. Manuf. Serv. Oper. Manag. 2017, 19, 132–149. [Google Scholar] [CrossRef]
  35. BBC. How Elon Musk Aims to Revolutionise Battery Technology. Justin Rowlatt. Available online: https://www.bbc.co.uk/news/business-53067009 (accessed on 17 June 2020).
  36. Liu, S. Competition and Valuation: A Case Study of Tesla Motors. IOP Conf. Ser. Earth Environ. Sci. 2021, 692, 022103. [Google Scholar] [CrossRef]
  37. BBC. Tesla Cuts Prices in Major Markets as Sales Fall. Mariko Oi. Available online: https://www.bbc.co.uk/news/articles/c1d4g8jz57yo (accessed on 22 April 2024).
  38. Friedman, D. Evolutionary games in economics. Econom. J. Econom. Soc. 1991, 59, 637–666. [Google Scholar] [CrossRef]
  39. Fudenberg, D.; Tirole, J. Game Theory; MIT Press: Cambridge, MA, USA, 1991. [Google Scholar]
  40. Liu, L.; Chen, G.; Niu, X. Game analysis of the knowledge sharing mechanism for the supply chain collaborative innovation. J. Ind. Eng. Manag. 2015, 8, 152–169. [Google Scholar] [CrossRef]
  41. Chen, W.; Hu, Z.H. Using evolutionary game theory to study governments and manufacturers’ behavioral strategies under various carbon taxes and subsidies. J. Clean. Prod. 2018, 201, 123–141. [Google Scholar] [CrossRef]
  42. Peng, X.; Wang, F.; Wang, J.; Qian, C. Research on food safety control based on evolutionary game method from the perspective of the food supply chain. Sustainability 2022, 14, 8122. [Google Scholar] [CrossRef]
  43. Jamali, M.B.; Rasti-Barzoki, M. A game theoretic approach for green and non-green product pricing in chain-to-chain competitive sustainable and regular dual-channel supply chains. J. Clean. Prod. 2018, 170, 1029–1043. [Google Scholar] [CrossRef]
  44. Xue, R.; Xiong, L. Two-stage evolutionary game model on complex networks for emergency logistics based on blockchain platform. Expert Syst. Appl. 2024, 256, 124925. [Google Scholar] [CrossRef]
  45. O’Donnell, N.; Shannon, D.; Sheehan, B. The impact of monetary policy interventions on banking sector stocks: An empirical investigation of the COVID-19 crisis. Financ. Innov. 2024, 10, 44. [Google Scholar] [CrossRef]
  46. Christl, M.; De Poli, S.; Figari, F.; Hufkens, T.; Leventi, C.; Papini, A.; Tumino, A. Monetary compensation schemes during the COVID-19 pandemic: Implications for household incomes, liquidity constraints and consumption across the EU. J. Econ. Inequal. 2023, 22, 411–431. [Google Scholar] [CrossRef]
  47. Wei, Y.; Li, D.; Wang, J.; Chu, Y. The Expansion of Central Bank Collateral and Green Innovation of Enterprises. Front. Bus. Econ. Manag. 2024, 15, 411–415. [Google Scholar] [CrossRef]
  48. Lv, J. The Expansion of Monetary Policy Collateral Promotes Green Innovation of Heavily Polluting Enterprises. Highlights Bus. Econ. Manag. 2024, 44, 323–330. [Google Scholar] [CrossRef]
  49. Liu, T.; Chen, X.; Yang, S. Economic policy uncertainty and enterprise investment decision: Evidence from China. Pac.-Basin Financ. J. 2022, 75, 101859. [Google Scholar] [CrossRef]
  50. Gao, W.; Wang, D. Will Increasing Government Subsidies Promote Open Innovation? A Simulation Analysis of China’s Wind Power Industry. Sustainability 2021, 13, 13497. [Google Scholar] [CrossRef]
  51. Feriansyah, F.; Nursechafia, N. Empirical Study of Interest Rate Pass-Through Before and After Subprime Mortgage Crisis: An International Evidence. In Proceedings of the 1st International Conference on Contemporary Risk Studies, Jakarta, Indonesia, 31 March–1 April 2022. [Google Scholar]
  52. Huang, Y.; Huang, X.; Yu, R. The effectiveness of nonfinancial interventions and monetary incentives on COVID-19 vaccination: A meta-analysis. Health Psychol. 2023, 42, 411–424. [Google Scholar] [CrossRef]
  53. Cortés, G.S.; Gao, G.P.; Silva, F.B.; Song, Z. Unconventional monetary policy and disaster risk: Evidence from the subprime and COVID–19 crises. J. Int. Money Financ. 2022, 122, 102543. [Google Scholar] [CrossRef]
  54. Guasoni, P.; Wang, G. Consumption and Investment with Interest Rate Risk. J. Math. Anal. Appl. 2018, 476, 215–239. [Google Scholar] [CrossRef]
  55. Cunningham, C.; Ederer, F.; Song, M. Killer Acquisitions. J. Political Econ. 2021, 129, 649–702. [Google Scholar] [CrossRef]
  56. Niu, S.; Wang, M. Partial acquisition and patent licensing in an asymmetric duopoly. Manch. Sch. 2022, 90, 92–105. [Google Scholar] [CrossRef]
  57. Zhang, S.; Li, J.; Jiang, B.; Guo, T. Government Intervention, Structural Transformation, and Carbon Emissions: Evidence from China. Int. J. Environ. Res. Public Health 2023, 20, 1343. [Google Scholar] [CrossRef]
  58. Jiang, Z.; Shi, J. Government intervention and technological innovation in the wind power industry in China: The role of industrial environmental turbulence. Appl. Energy 2023, 344, 121265. [Google Scholar] [CrossRef]
  59. Zhan, W.; Jiang, M.; Wang, X. Optimal Capacity Decision-Making of Omnichannel Catering Merchants Considering the Service Environment Based on Queuing Theory. Systems 2022, 10, 144. [Google Scholar] [CrossRef]
  60. Huang, X.; Zhan, W.; Li, C.; Ma, T.; Hong, T. Collaborative Decision-Making of the Supply Chain System Considering Green Innovation Capability. Kybernetes 2024. Early Access. [Google Scholar] [CrossRef]
  61. Zhan, W.; Liu, J.; Yuan, X.; Huang, X.; Jiang, M. The optimal decision of service provider considering extra waiting area value-added services–pooled or dedicated? RAIRO-Oper. Res. 2024, 58, 4307–4340. [Google Scholar]
Figure 1. The effect of different M on the evolutionary game of firms’ patent openness and investment when t f = 2 .
Systems 13 00146 g001
Figure 2. The effect of different M on the evolutionary game of firms’ patent openness and investment when t f = 1 .
Systems 13 00146 g002
Figure 3. The impact of different evolutionary games on firms’ patent openness and investment when θ = 0.7 .
Systems 13 00146 g003
Figure 4. The impact of different evolutionary games on firms’ patent openness and investment when θ = 0.4 .
Systems 13 00146 g004
Figure 5. The impact of different g on corporate patent openness and investment in evolutionary game dynamics when M = 2 .
Systems 13 00146 g005
Figure 6. The impact of different g on corporate patent openness and investment in evolutionary game dynamics when M = 4 .
Systems 13 00146 g006
Figure 7. The impact of different I r on the evolutionary game of corporate patent openness and investment when δ r = 0.15 , s a = 0.2 .
Systems 13 00146 g007
Figure 8. The impact of different I r on the evolutionary game of corporate patent openness and investment when δ r = 0.3 and s a = 0.4 .
Systems 13 00146 g008
Figure 9. The impact of different s f ,   δ o on the evolutionary game of corporate patent openness and investment when R f = 1 .
Systems 13 00146 g009
Figure 10. The impact of different s f ,   δ o on the evolutionary game of corporate patent openness and investment when R f = 0.05 .
Systems 13 00146 g010
Table 1. Matrix of frontier enterprise patent policies and laggard enterprise returns.
Frontier Enterprises
Open   y Not   Open   1 y
Laggard EnterprisesInvestment in R&D
x
U a = r λ 1 θ + δ r + δ o 1 + s f + s a 1 C M I r U a = r λ 1 θ + δ r 1 + s a 1 C M I r
U f = r λ θ δ r δ o t f 1 C M + R f t f s f s a + f t f U f = r λ ( θ δ r ) t f 1 C M + R f t f s a
Investment in Production Expansion
1 x
U a = r λ 1 θ + δ p + δ o 1 + s f 1 C + g M I p U a = r λ 1 θ 1 C + g M I p
U f = r λ θ δ p δ o t f 1 C + g M + R f t f s f + f t f U f = r λ θ t f ( 1 C + g ) M + R f t f
Table 2. The eigenvalues of the Jacobian matrix at the equilibrium point of the system.
Equilibrium PointEigenvalue 1Eigenvalue 2
(0, 0) r λ 1 θ + δ r 1 + s a 1 C M r λ 1 θ 1 C + g M + I p I r r λ δ p δ o t f 1 C + g M R f s f + f t f
(0, 1) r λ 1 θ + δ r + δ o 1 + s f + s a 1 C M r λ 1 θ + δ o + δ p 1 + s f 1 C + g M + I p I r r λ δ p δ o t f 1 C + g M + R f s f f t f
(1, 0) [ r λ 1 θ + δ r 1 + s a 1 C M r λ 1 θ 1 C + g M + I p I r ] r λ δ o t f 1 C M R f s f + f t f
(1, 1) [ r λ 1 θ + δ r + δ o 1 + s f + s a 1 C M r λ 1 θ + δ o + δ p 1 + s f 1 C + g M + I p I r ] r λ δ o t f 1 C M + R f s f f t f
Disclaimer/Publisher’s Note: The statements, opinions and data contained in all publications are solely those of the individual author(s) and contributor(s) and not of MDPI and/or the editor(s). MDPI and/or the editor(s) disclaim responsibility for any injury to people or property resulting from any ideas, methods, instructions or products referred to in the content.

