Abstract
Globally, recycled building materials have attracted much attention, but the ambiguity of the use of recycled building materials makes it difficult for the building material remanufacturer (BMR) to compete with the building material manufacturer (BMM). Brand building is an important strategic tool for enterprises to increase product competitiveness. From the new perspective of the supply chain, this paper aims to examine the decision-making behavior of enterprises under two scenarios of consumer ambiguity neutrality and ambiguity tolerance and to analyze the impact of ambiguity tolerance on the pricing decisions of building materials supply chains in a brand-building scenario. This paper constructs a building material supply chain game model consisting of the BMM and BMR, according to the cognitive–affective personality system (CAPS) theory and through the Stackelberg game. The main findings are as follows. (1) Strengthening brand building can mitigate the negative impact of ambiguity tolerance on new product pricing. The selling price of recycled building materials is positively related to ambiguity tolerance. (2) When the BMM has higher brand value, there is a U-shaped trend between profit and ambiguity tolerance at a cost coefficient above the threshold value of 0.61. (3) When the BMR has higher brand value, profit is negatively related to ambiguity tolerance at operational inefficiencies and cost coefficients below the threshold value of 0.45. Otherwise, profits and ambiguity tolerance follow a U-shaped trend. This paper not only expands the research on brand building and ambiguity tolerance but also provides theoretical guidance for enterprises to make effective decisions in response to consumers’ ambiguity psychology.
1. Introduction
1.1. Global Context and Challenges
During the 27th UN Climate Change Conference, which was held at Sharm el-Sheikh from 6 to 18 November 2022, the UN Environment Programme highlighted that the construction industry contributes to more than 34% of worldwide energy usage and 37% of global CO2 emissions, both of which have unprecedented peaks [1]. With growing concern about environmental issues and global climate change, the shortcomings of traditional building materials, such as high carbon emissions and low recyclability, have received increasing attention from scholars [2]. Recycled building materials made from construction and demolition waste (CDW) can effectively bridge these gaps [3]. This is accomplished not only by saving energy through reduced greenhouse gas emissions and energy use but also by minimizing the installation capacity of renewable energy systems to effectively achieve carbon neutrality and energy transition [4]. In China, the Chongqing Municipality aims to recycle 85% of CDW into recycled building materials by 2035 [5]. Developed economies such as Germany have effectively managed the discharge of CDW through the use of advanced tools such as selective demolition, presorting facilities and green public procurement, resulting in recycling rates of 90% [6]. However, in recent years, owing to the unfavorable impact of multiple exogenous conditions, such as fierce competition, economic recession and the new coronavirus epidemic, the construction market has begun to experience a strongly competitive situation in which one project is being pursued by multiple companies [7]. The decline of the construction industry will inevitably lead to greater fluctuations in market demand, which in turn will increase the intensity of competition between the traditional building materials industry and the recycled building materials industry [8]. Brand building is crucial for manufacturing companies to increase their influence on the general consumer base and to grab the market quickly [9]. It is a dynamic process in which the enterprise endeavors in all directions to make its products gradually accumulate popularity and influence in the market. A series of positive actions have been proposed by building materials companies to enhance brand competitiveness and increase the market share of their products [10]. For example, some enterprises in China focus on building a green building material brand to help China achieve its “dual carbon” goals [11]. As the world’s leading supplier of building materials, Switzerland’s HOLCIM insists on brand innovation to provide a continuous impetus to decarbonize the whole life cycle of buildings [12]. These findings suggest that increasing the cost of brand building is important for promoting the green transformation of the building materials industry and realizing environmental sustainability.
1.2. Research Gaps and Problem Statement
However, existing research focuses only on the management innovation of enterprise brand building and lacks an in-depth analysis of the impact of consumer behavior on brand building management from the supply chain perspective. Consumers constitute the main body of market demand, and their behavior often has a nonnegligible effect on the brand-building decisions of enterprises. On the one hand, in the building materials supply chain composed of the building materials manufacturer (BMM) and the building materials remanufacturer (BMR), the uncertainty of the quality of the recycled building materials produced by the BMR and the hidden nature of the production process have led to ambiguity in consumers’ understanding of the recycled building materials. The cognitive–affective personality system (CAPS) theory suggests that the irritation caused by a lack of necessary information has a significant effect on self-regulation. Ambiguity tolerance is considered a self-regulation indicator of consumers’ ambiguous knowledge of recycled building materials [13]. Therefore, consumer ambiguity tolerance can affect the market demand for recycled building materials. On the other hand, to overcome the effect of consumer ambiguity tolerance on recycled building materials, the BMR will improve brand value through brand building to realize a change in consumer attitudes toward recycled building materials. In addition, the BMM and BMR are in a competitive relationship, so the BMM will also carry out brand building to expand the influence of its products. Consumer behavior can have a significant effect on pricing decisions and is an important topic of academic interest [14,15,16]. Therefore, it is necessary to explore the mechanism by which consumer ambiguity tolerance affects the pricing decisions of building material supply chain members in the context of brand building.
In summary, the scientific questions addressed in this paper include the following: (1) What is the impact of ambiguity tolerance in consumers on the pricing decisions of building materials and the profitability of building materials enterprises? (2) How does brand building moderate the relationship between ambiguity tolerance in consumers and building material supply chains? Therefore, in the context of brand competition between a BMM and a BMR, this paper considers a Stackelberg game model incorporating ambiguity tolerance in consumers, supply chain enterprises’ pricing decisions and brand-building decisions. The Stackelberg game is a dynamic noncooperative game according to the Nash equilibrium [17]. In the game, the leader first formulates the strategy and dominates decision-making, and the followers adjust their actions according to the leader’s strategy to realize the optimal goal. The leader will predict the reactions of the followers in advance, choose the optimal strategy accordingly, and finally, both sides reach a Nash equilibrium [18]. In this paper, the BMM becomes the leader of the game by relying on the market advantage of the new product and prioritizing its strategy. BMR becomes a follower because of the ambiguity of consumers’ knowledge about recycled building materials, and its strategy needs to be adjusted according to the leader’s decision. The two parties form a dynamic interaction mode of “decision-making first–response later”, which is consistent with the decision-making mechanism of Stackelberg’s game. Therefore, the Stackelberg game is applicable to the research problem of this paper. According to CAPS theory, when ambiguity tolerance at the consumer level is greater, the possibility of accepting recycled building materials is greater; conversely, the willingness of consumers to buy recycled building materials is lower [13]. This intuitively explains the meaning of consumer ambiguity tolerance. Therefore, CAPS theory is applicable to the research problem of this paper.
The innovations of this paper are as follows. (1) This paper first introduces CAPS theory into the construction material supply chain, revealing the impact mechanisms of consumer ambiguity tolerance on the pricing decisions and profits of the BMM and BMR, thereby expanding the literature on CAPS theory. (2) Existing studies have examined the influence of factors such as consumer green preference [19] and risk aversion [20] on supply chain enterprises, neglecting the important role of consumer ambiguity tolerance in recycled building materials. In this paper, ambiguity tolerance is introduced into the building materials supply chain for the first time, and a CDW resource recovery supply chain game model is constructed. It distinguishes itself from the research on ambiguity tolerance by traditional statistical methods. This paper quantitatively analyzes the influence mechanism of consumer ambiguity tolerance on supply chain enterprises by combining the Stackelberg game with the ambiguity tolerance measurement formula and provides a theoretical basis for enterprises to formulate strategies to regulate the influence of ambiguity tolerance.
1.3. Specific Objectives of the Study
This paper aims to explore how consumers’ ambiguity tolerance affects pricing decisions and profitability in the recycled materials supply chain while using branding as a moderating factor. First, this paper establishes a game model under two scenarios of ambiguity neutrality and ambiguity tolerance and solves the model by using inverse induction to obtain the equilibrium solution of enterprise decision variables (Section 4). Second, the model is analyzed to reveal how consumer ambiguity tolerance affects the pricing decisions and profits of enterprises in the building materials supply chain (Section 5). The results are then further analyzed and validated through numerical simulation and discussion (Section 6) and sensitivity analysis (Section 7). Finally, the study is summarized and limited (Section 8).
2. Literature Review
In this section, a literature review is conducted on brand building, ambiguity tolerance and supply chain enterprise management.
2.1. Studies on Brand Building
The literature on brand building focuses on brand portfolio management. For example, researchers investigating this topic explore how to name a new product according to branding decisions [21] and rationalize the distribution of work across multiple brands to achieve the greatest benefits [22]. In addition to the need to coordinate the allocation of product resources within various brands, developing a strategy to cooperate or compete with external brands has become an important challenge for enterprises [23]. Researchers have examined the impact of brand competition on brand licensing strategies [24] and investigated the competitive relationship between national and store brands from a quality management perspective [25]. With respect to the influential role of brand competition or cooperation, some interesting results are presented. Brand competition contributes to mitigating the competitive intensity of upstream and downstream firms [26]; joint promotion can harm the interests of weaker brands in asymmetric alliances [27]. In the context of an increasingly popular market for store brands, some of the literature has focused on the impact of store brand introduction on the supply chain when decisions such as pricing and advertising are integrated [28]. Furthermore, the strategic question of whether a retailer introduces another store brand is investigated given the premise that a store brand has existed [29]. There has been a wealth of research on brand building that provides a solid theoretical foundation for this paper; i.e., branding has a crucial role in the fiercely competitive manufacturing market. However, fewer studies have included brand building as a decision variable in remanufacturing supply chain models. Although Niu et al. [30] revealed the cannibalization effect of remanufacturing suppliers’ self-branding strategy on downstream firms’ incumbent brands, there is a lack of analysis of the interaction between the two brand-building processes. The closest topic of this paper is the study by [31], which explores the impact of brand competitiveness on the profits of two manufacturers in a scenario where the market contains both new and remanufactured products. Unlike this study, this paper takes the brand building of building materials as the research background, incorporates ambiguity tolerance in consumers into the model and explains the influence mechanism on pricing decisions and profits for both the BMM and the BMR.
2.2. Studies on Ambiguity Tolerance
Brand building is particularly important for BMR because of the inherent ambiguity of consumers’ perceptions of recycled building materials. The concept of ambiguity is defined as “The Nature of Expectation and Uncertainty” [32]. The ambiguity of the use of recycled building materials by consumers stems from two sources. On the one hand, the quality distribution of secondary building materials has a certain degree of uncertainty and fails to meet consumers’ expectations since remanufacturing technology has not yet matured [33]; on the other hand, the process of remanufacturing building materials is relatively complex, including classification, screening, crushing and many other procedures [34], which are not well known to consumers. The CAPS theory suggests that emotions arising from stimuli due to a lack of necessary information can have a significant effect on self-regulation. Ambiguity tolerance is regarded as an important alternative indicator of self-regulation, which can reflect, to a certain extent, the cognitive adaptability and emotion regulation ability of individuals when facing uncertain or ambiguous situations [13]. Theoretically, consumer ambiguity about recycled building materials affects the sales of recycled building materials, which in turn affects the long-term development of the construction waste recycling industry. In the real world, there is individual variability in the acceptance of ambiguity, which is customarily characterized as ambiguity tolerance by scholars. Ambiguity tolerance refers to an individual’s tendency to accept rather than reject ambiguous events [35]. This suggests that when ambiguity tolerance in consumers is greater, the likelihood of accepting recycled building materials is greater; conversely, when consumers’ ambiguity tolerance is lower, the consumers’ willingness to purchase recycled building materials is lower if remanufacturing companies disclose less information about the remanufacturing process and the quality of recycled building materials. The concept of ambiguity tolerance has been widely applied in various disciplines to explain individual behavior, e.g., psychology [36,37], behavioral sciences [38,39] and educational research [40,41], and includes a variety of research subjects, such as students [42] and employees [43]. However, there are fewer existing studies on consumers’ ambiguity tolerance, and they are mainly from two research streams. The first stream of research focuses on the direct effect of ambiguity tolerance on consumers’ behavior or perceptions. For example, Zhang and Liu [44] studied the effect of ambiguity tolerance on users’ use of bike-sharing services; Lu and Gursoy [45] argued that high ambiguity tolerance can trigger confusion in online tourism. The second stream of research addresses the indirect effects of ambiguity tolerance on consumers’ behavior or perceptions. For instance, some scholars argue that ambiguity tolerance moderates the relationship between consumers’ brand attitudes and the use of probability markers in advertising [46]. To date, no scholars have explored the impact of ambiguity tolerance in consumers on enterprises’ decisions and profits from a supply chain perspective.
2.3. Studies on Supply Chain Enterprise Management
As industries and enterprises are more closely linked, supply chain development and management are becoming increasingly important in the economic structure of countries. Many scholars have explored the factors influencing decision-making and profitability in supply chain enterprises [14,15,16,47,48,49,50,51,52]. At the enterprise level, the risk-averse behavior of green innovation-led firms reduces overall supply chain benefits in some cases [47]; mutual altruistic preferences maximize the profitability of the supply chain [48]; and power structures can influence the choice of the optimal guarantee finance model for supply chains [49]. At the governmental level, government subsidies may sometimes be detrimental to firms’ product development [50]; green certificate trading policy contributes to the level of emission reduction by enterprises [51]; and the government should formulate an appropriate carbon tax policy to benefit the profits of enterprises according to the external environment [52]. At the consumer level, consumer preference for online shopping in a given context favors higher profits for manufacturers and the whole supply chain, while retailers’ profits remain unchanged [14]; consumer preference for sustainable brands drives the enhancement of product traceability levels [15]; and consumers’ green preferences have a significant effect on the green level of products and the speed of market adjustment [16]. In contrast to these studies, this paper reveals for the first time the relationship between ambiguity tolerance in consumers toward recycled building materials and enterprises’ pricing decisions and profits in the context of building material supply chains. Solving this problem helps building materials remanufactures develop scientific decisions to mitigate the damage to the interests of consumers’ ambiguity and thus promote the development of a circular economy in the construction industry.
Table 1 summarizes and categorizes the relevant studies. The above literature summarizes the factors influencing the decision-making and profitability of supply chain enterprises from the perspectives of enterprises, governments, and consumers, which provides theoretical guidance for building materials enterprises to make relevant decisions. However, in summarizing consumer factors, existing studies have neglected how ambiguity tolerance in consumers affects pricing decisions. On this basis, this paper explores how ambiguity tolerance in consumers affects the pricing decisions of building material supply chain enterprises in the context of brand building.

Table 1.
Relevant elements of the literature review.
3. Methodology
The Stackelberg game is a dynamic noncooperative game [17]. It has become a common tool for a number of scholars who study supply chains [53,54], including those in the field of CDW recycling supply chains [47,55]. In this game, there are two types of players who interact with each other through decision making. The first type of player is the leader, who has the right to make decisions first; the second type of player is the follower, who makes decisions according to the leader’s decisions. Unlike static games, which require all players to make a one-time strategy, in the Stackelberg game, there is a sequential nature to the players’ decisions, and the players who make decisions later (followers) are able to access the information of the players who make decisions first (leaders) as a reference for their own decisions. Both leaders and followers are rational and selfish, aiming to maximize their own interests or utility. From the above description of the Stackelberg game, it is reasonable to assume that when there is a sequential order of decision-making between the stakeholders and one party’s decision depends on the other party in a dynamic system containing multiple stakeholders, the interaction of stakeholders within the system can be described via the Stackelberg game model [56]. In this paper, the BMM is the leader of the supply chain and relies on the inherent market advantage of the new product. However, consumers’ ambiguity about recycled building materials results in the BMR being at a disadvantage in the building material market and therefore being the follower. Obviously, the interactions between the objects studied in this paper are consistent with the basic concept of the Stackelberg game.
Additionally, the Stackelberg game decomposes the decision-making problem among players into different levels [57]. Each level is interconnected, and the optimal decision-making solution can be found at the corresponding level. The solution of the Stackelberg game is based on the backward induction method. First, because the leader takes the lead in decision making, the information is treated as known information for the follower. The followers make their own decisions according to the information about the leader’s decisions to maximize his own benefits or utility. At this point, the follower’s decision function is regarded as a reaction function. The leader uses the reaction function as the reference to obtain her own optimal decision. The optimal decision is then substituted into the reaction function to obtain the optimal decision of the follower. Finally, the profit of each player can be solved by substituting all the decision functions into the players’ profit function. The goal of this paper is to explore the impact of ambiguity tolerance in consumers on the pricing decisions and profits of building materials enterprises in the supply chain. The prerequisite is to solve the decision functions of the members via the backward induction method. Therefore, the Stackelberg game is applicable to the research problem of this paper.
3.1. Model Descriptions
This paper constructs a Stackelberg game model composed of the BMM, consumer and the BMR by referring to [58]. The game model is shown in Figure 1. Among them, the BMM, such as Vaagen Timbers, a US manufacturer of CLT plywood building materials [59], act as the gaming leader in the generation of building materials using solid wood and first decide on the selling price per unit of the new product and the level of effort to increase the value of the brand . Second, as the follower of the game, the BMR, such as Linyi Lantai Environmental Protection Technology Co. [60], recycle CDW and use it in the construction industry. The BMR is informed by the BMM’s decision to determine the unit selling price of recycled building materials and the level of effort to increase the brand’s value , with both parties aiming at profit maximization. In the early stage of brand building, the brand value of the BMM is , the brand value of the BMR is and the magnitude of the brand value of both parties is or . In the process of brand building, first, the BMM and BMR increase the brand value to and and incur costs of and , respectively. Second, due to the improved operational efficiency of enterprises, the unit operating costs of and should be reduced to a certain extent. The ambiguity tolerance of consumers with respect to recycled building materials affects their demand ; therefore, with reference to [61], this paper assumes that when consumers show ambiguity tolerance or ambiguity neutrality, they will purchase two building materials according to the principle of utility maximization.

Figure 1.
The building material recycling game model consisting of the BMM and BMR.
The parameters and descriptions are presented in Table 2.
Table 2.
Parameters and description.
3.2. Assumptions
Assumption 1: The BMM is the leader of the game, and the BMR is the follower of the game; they are in a competitive relationship and satisfy the Stackelberg game. This paper uses the backward induction method to solve the model and obtain the equilibrium solution of the enterprise decision-making variables. It analyses how ambiguity tolerance in consumers affects the pricing decision of building materials products and the profitability of building materials enterprises and how branding regulates the relationship between ambiguity tolerance in consumers and the supply chain of building materials.
Assumption 2: Brand value is enhanced in the process of brand building. The cost of increasing the value of an enterprise’s brand is related to the coefficient of brand building costs and the level of effort ; that is, [70].
Assumption 3: In the process of enhancing brand value, the enterprise reduces the unit operating cost to a certain extent because it improves operational efficiency and creates economies of scale, assuming that this cost is [65], where denotes the operating cost savings rate and the absolute value of is relatively small.
Assumption 4: Real market demand is related to consumer behavior. This paper, by referring to [71], incorporates consumer ambiguity tolerance as a parameter into the equivalent representation function of consumer utility in the deterministic case and solves to obtain consumer demand.
Assumption 5: As the leader of the game, the BMM plays a dominant role in decision making, and its decision information is considered public information. The follower BMR makes their own decisions according to the leader’s decision information to maximize their own interests or utility. Therefore, this paper assumes that the model design is based on a fully publicized parameter system and that the exchange of information between the BMM and the BMR is at a level of nondifferential equivalence [72].
Assumption 6: To effectively weaken the interference of production cost factors in model analysis, it is convenient to analyze how consumer ambiguity tolerance affects the profitability of enterprises and how branding regulates the relationship between ambiguity tolerance and the supply chain of building materials. This paper does not consider the production cost of the product [73].
4. Modeling and Solution Strategies
In this section, two models are designed for consumers’ behavioral performance in different contexts: a model for ambiguity-averse consumers and a model for ambiguity-neutral consumers. The BMM, as a leader, first sets the selling price per unit of new product and the level of effort to increase brand value . BMR, as a follower, then sets the selling price of recycled building materials and the level of effort to increase the value of the brand .
4.1. Ambiguity Neutrality (NA)
For the new product, the certainty equivalent of consumer utility is defined as shown in Equation (1):
For recycled building materials, the certainty equivalent of consumer utility is defined as shown in Equation (2):
Since , is a concave function of , and is a concave function of . Suppose that , which is solved as shown in Equations (3) and (4):
For the BMM, the profit function is defined as shown in Equation (5):
For the BMR, the profit function is defined as shown in Equation (6):
This section substitutes Equation (3) into Equation (5) and Equation (4) into Equation (6). At this stage, the Hessian matrix is shown in Equation (7):
The simplification gives . Since , when , i.e., , is negatively determined. Since the function exhibits joint concavity with respect to the variables and in its domain of definition, there is only one set of optimal solutions. At this stage, the Hessian matrix of with respect to and is shown in Equation (8):
The simplification gives . Since , when , i.e., , is negatively determined. Since the function exhibits joint concavity with respect to the variables and in its domain of definition, again, there is and is only one set of optimal solutions. Finding the common solution of the two solutions yields as the optimal solution.
To simplify the calculation results and facilitate model analysis, this paper sets . This can be solved via backward induction, as shown in Equations (9)–(14):
Substituting Equations (9)–(14) into Equations (5) and (6) yields Equations (15) and (16) as follows:
4.2. Ambiguity Tolerance (TA)
For the new product, the certainty equivalent of consumer utility is defined as shown in Equation (17):
For the recycled building material, the certainty equivalent of consumer utility is defined as shown in Equation (18):
Because , is a concave function of , and is a concave function of . Suppose that , which is solved as shown in Equations (19) and (20):
For the BMM, the profit function is defined as shown in Equation (21):
For the BMR, the profit function is defined as shown in Equation (22):
In this section, Equations (19) and (20) are substituted into Equations (21) and (22), respectively. According to empirical calculations, a unique set of optimal solutions occurs only when . The formulae and principles are the same as above.
Similarly, set . This is solved via backward induction, as shown in Equations (23)–(28):
Substituting Equations (23)–(28) into Equations (21) and (22) results in Equations (29) and (30):
5. Modeling Analysis
Proposition 1.
In the market environment of building materials, the dynamics of the selling price of building materials and cost coefficients are related as follows.
- (1)
- If , then ; if , then .
- (2)
- If , then .
Proposition 1 suggests that new products are priced higher in the ambiguity tolerance scenario under the low-cost coefficient condition. The opposite conclusion is reached when the cost coefficients are relatively high. Higher pricing of recycled building materials is in the ambiguity-neutral scenario.
Proposition 2.
For , and are related as follows.
- (1)
- If , then .
- (2)
- If , subject to , then ; if , then .
Proposition 2 suggests that the BMM is always more profitable when the cost coefficient is small in the ambiguity tolerance scenario. When presented with a large cost coefficient, the BMM can be more profitable only if the consumer’s tolerance for ambiguity is within a unique range of intervals. Once the ambiguity tolerance exceeds a critical value, the conclusions are reversed.
Proposition 3.
For , and are related as follows.
- (1)
- When , if , then ; if , under conditions , then ; and under conditions , then .
- (2)
- When , if , then .
Proposition 3 suggests that the BMR is always more profitable in times of ambiguous consumer aversion if the cost coefficients are low when the operating cost savings are below a certain threshold value. If the cost coefficient is high, there exists an interval in which the BMR is more profitable when the ambiguity tolerance of consumers is within a certain interval. Otherwise, the opposite conclusion was reached. The BMR is always more profitable when operating cost savings are greater than a critical mass and when consumers are ambiguously averse to them.
Proposition 4.
The positive and negative correlations between the selling price of building materials and ambiguity tolerance in consumers at different cost factors in the building materials market are as follows.
- (1)
- If , then is negatively correlated with ; if , then is positively correlated with .
- (2)
- If , then is positively correlated with .
Proposition 4 shows that the price of a new product is negatively related to ambiguity tolerance in consumers at low-cost coefficients. For high-cost coefficients, the conclusions are reversed. For recycled building materials, there is always a positive correlation between the price of recycled building materials and ambiguity tolerance in consumers.
Proposition 5.
The relationship between and for different cost coefficients is as follows.
- Proposition 5.1.
- (1)
- If , then is negatively correlated with .
- (2)
- If , conditional on , then is negatively correlated with . Conditional on , is positively correlated with .
- Proposition 5.2.
- (1)
- When , is negatively correlated with if ; when , is negatively correlated with if . Conditional on , then is positively correlated with .
- (2)
- When , if , conditional on , is negatively correlated with . Conditional on , is positively correlated with ; if , then is negatively correlated with . If , conditional on , then is negatively correlated with . Conditional on , then is positively correlated with .
- (3)
- When , conditional on , is negatively related to if ; conditional on , is positively correlated with . If , then is negatively correlated with . If , conditional on , is negatively correlated with ; conditional on , is positively correlated with .
- (4)
- When , conditional on , is negatively related to if ; conditional on , is positively correlated with . If , then is negatively related to .
Proposition 5.1 represents a scenario in which the brand value of the BMM is greater than the brand value of the BMR. When the cost coefficient is below a critical value, the profit of the BMM is always negatively correlated with ambiguity tolerance in consumers. When the cost coefficient is greater than the critical value, the profit of the BMM and ambiguity tolerance in consumers have a U-shaped trend.
Proposition 5.2 represents a scenario in which the brand value of the BMM is lower than the brand value of the BMR. When the rate of operating cost savings falls below a certain threshold, the same conclusion is obtained as in Proposition 5.1. When the operating cost savings rate is greater than another threshold, the conclusions are interchanged. When operating cost savings are within other ranges, BMM profits and ambiguity tolerance in consumers follow a U-shaped trend when the cost coefficients are below a certain critical value or above another critical value. When the cost coefficients lie within the range of the interval between these two thresholds, the ambiguity tolerance in consumers is not conducive to the profitability of the BMM.
Proposition 6.
The relationship between and for different cost coefficients is shown below.
- Proposition 6.1.
- (1)
- When , if , then is negatively correlated with . If , conditional on , then is negatively correlated with ; conditional on , then is positively correlated with .
- (2)
- When , if , is negatively correlated with .
- Proposition 6.2.
- (1)
- When , if , is negatively correlated with ; if , conditional on , is negatively correlated with ; conditional on , is positively correlated with .
- (2)
- When , if , conditional on , is negatively correlated with ; conditional on , is positively correlated with .
Proposition 6.1 represents a scenario in which the brand value of the BMM is greater than the brand value of the BMR. When the rate of operating cost savings falls below a certain threshold, with a low-cost coefficient, the profitability of the BMR decreases as ambiguity tolerance in consumers increases. There is a U-shaped trend in profits and ambiguity tolerance in consumers at high-cost coefficients. The profit of the BMR is negatively related to ambiguity tolerance in consumers when the operating cost savings rate is above a critical value.
Proposition 6.2 represents a scenario in which the brand value of the BMM is lower than the brand value of the BMR. The same conclusion is reached for the first case of Proposition 6.1 when the operating cost savings are below a certain threshold value. Profit and ambiguity tolerance in consumers follow a U-shaped trend when operating cost savings are above a critical value.
6. Numerical Simulation and Discussion
This section examines how ambiguity tolerance affects the price (, ) and profitability (, ) of building materials. In addition, this section validates the propositions presented in the model analysis section with the help of numerical simulations. This section assumes that and 1.8 correspond to various scenarios of savings rates, and it also sets = 1 [74], = 1 [68], = 0.8 [75] and = 2 [76]. To correspond to the case presented in the conclusion of the proposition, this section sets = 3.02 [31] and = 0.5 [30], which corresponds to Figure 3a. To correspond to the case of , this section sets = 3.61 [31] and = 3.97 [77], corresponding to Figure 3b,c. With unchanged, this section sets = 4.78 [77], corresponding to Figure 3d,e. To correspond to the case presented in the conclusion of the proposition, this section sets = 3.02 [31] and = 0.5 [30], which corresponds to Figure 4a,b. To correspond to the case of , this section sets = 3.61 [31] and = 3.97 [77], corresponding to Figure 4c,d. According to the results of the analysis of the Hessian matrix, the model has the possibility of an optimal solution only if the operational cost savings and the cost coefficients satisfy the specific condition .
6.1. The Impact of Ambiguity Tolerance on the Selling Price of New and Recycled Building Materials
Figure 2 depicts how ambiguity tolerance in consumers affects the selling price of new products and recycled building materials and verifies Proposition 4.
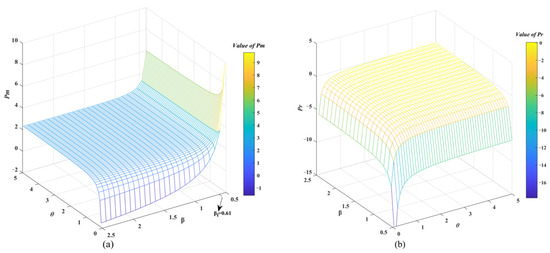
Figure 2.
The impact of ambiguity tolerance on the price of new and recycled building materials. (a) H = 1.1; (b) H = 1.1.
Figure 2 shows that the price of a new product with a low-cost coefficient of less than is negatively correlated with consumers’ ambiguity tolerance. When the high-cost coefficient is greater than , price is positively related to consumer ambiguity tolerance. In the case of recycled building materials, prices gradually increase as ambiguity tolerance among consumers increases. CAPS theory suggests that consumers’ individual perceptions in the face of ambiguous information generate tolerant behaviors for self-regulation [13]. Accordingly, consumer willingness to purchase recycled building materials increases as ambiguity tolerance increases. At this time, the BMR will adopt the strategy of raising prices to increase profits, whereas the BMM can only adopt the strategy of lowering prices to increase sales. However, when the BMM’s brand-building costs are high, the low-price strategy cannot maintain normal profitability, and the BMM will adopt the strategy of increasing prices to transfer costs to consumers.
The above findings are slightly different from Xu and Duan [78]. Xu and Duan’s findings are that disappointment aversion in consumers is harmful to enterprises under the full-coverage strategy. This is because Xu and Duan argued that disappointment aversion in consumers leads to lower expected utility for emotional consumers, forcing enterprises to set lower prices and reduce the optimal number of orders, which reduces enterprises’ profits. This paper explores the impact of ambiguity tolerance in consumers on the pricing of recycled building materials. The greater the ambiguity tolerance of consumers is, the more consumers tend to buy recycled building materials, which is conducive to BMR setting high selling prices and thus achieving profitability.
6.2. The Impact of Ambiguity Tolerance on the Profit of the BMM
Figure 3 depicts how consumers’ ambiguity tolerance affects the profitability of the BMM and verifies Proposition 5.

Figure 3.
The impact of ambiguity tolerance on the profitability of the BMM. (a) H = 1.1; (b) H = 1.1; (c) H = 1.8; (d) H = 1.1; (e) H = 1.8.
Figure 3a shows a scenario where the brand value of the BMM is greater than the brand value of the BMR. When the low-cost coefficient is less than , the profit of the BMM is negatively correlated with consumer ambiguity tolerance. However, when the high-cost coefficient is greater than , there is a U-shaped trend between profit and consumers’ ambiguity tolerance. At this point, a lower ambiguity tolerance with a low-cost coefficient is most profitable for the BMM. This is because when consumers are less tolerant of recycled building materials, the demand for new products increases, favoring the profitability of the BMM. In addition, the lower cost coefficient also helps enterprises spend less on branding.
Figure 3b–e show a scenario in which the brand value of the BMM is lower than the brand value of the BMR. Figure 3b shows that when the operating cost savings rate is below a certain threshold, profit is negatively correlated with consumers’ ambiguity tolerance, subject to the low-cost coefficient. When the high-cost coefficient is greater than , there is a U-shaped trend between profit and consumers’ ambiguity tolerance. Figure 3e shows that when the operating cost savings rate is greater than another threshold, the conclusions are interchanged with the same preconditions as in the previous case. Figure 3c shows that when the operating cost savings rate is in the middle range, profits and consumers’ ambiguity tolerance increase. Trends are in a U-shape when the low-cost coefficient is less than and the high-cost coefficient is greater than . When the cost coefficients are in the middle range of , profits are negatively correlated with consumers’ ambiguity tolerance. The cases in Figure 3c,d differ only in terms of the thresholds and are otherwise identical. This suggests that when the brand value of the BMM is low, enterprises making pricing decisions need to consider the operational efficiency of the enterprise. Low-cost factors and low tolerance remain profitable conditions for the BMM when operating cost savings are low. However, when the operating cost savings rate is high, as shown in Figure 3e, high-cost coefficients and low ambiguity tolerance are favorable conditions for profit maximization for the BMM. This is because, according to CAPS theory, the regulating self can systematically overcome stimulus control and have a significant effect on the environment [13]. Currently, the main determinant of profit maximization for the BMM is ambiguity tolerance, which favors the profitability of the BMM when consumers are less tolerant of recycled building materials.
The above findings are slightly different from Xu and Jackson [79]. Xu and Jackson argued that consumers’ ambiguity tolerance can positively influence their perceived risk, which can indirectly increase loyalty to consumers, thus reducing the costs associated with returns and achieving profitability. This is because the profitability of the enterprises studied in this paper is from the perspective of selling products, whereas the study by Xu and Jackson reaches profitability from the perspective of reducing the cost of returns.
6.3. The Impact of Ambiguity Tolerance on the Profitability of the BMR
Figure 4 depicts the impact of consumer ambiguity tolerance on the profitability of the BMR.
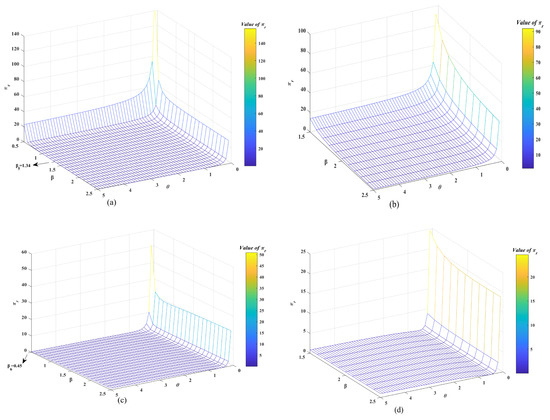
Figure 4.
The impact of ambiguity tolerance on the profitability of the BMR. (a) H = 1.1; (b) H = 1.8; (c) H = 1.1; (d) H = 1.8.
Figure 4a,b show a scenario in which the brand value of the BMM is greater than the brand value of the BMR. When the operating cost savings rate is below a critical value, profit is negatively related to consumers’ ambiguity tolerance. conditional on the low-cost coefficient. At this point, if the cost coefficient is high, greater than , the profit has a U-shaped trend with the consumer’s ambiguity tolerance. Profit is negatively correlated with consumers’ ambiguity tolerance, as consumers’ ambiguity tolerance increases under conditions where operating cost savings are above a critical value. This suggests that higher cost coefficients moderate the negative impact of ambiguity tolerance on the profitability of the BMR when operating cost savings are low. However, the cost coefficient does not have a moderating effect when the operating cost savings rate is high, and ambiguity tolerance is always negatively correlated with the profit of the BMR. CAPS theory suggests that even though consumers have the same perceptions in response to external stimuli, differences in goals or values may lead to different behaviors [80]. This suggests that although consumers show a high tolerance for ambiguity, they may still be inclined to purchase new products rather than recycled building materials, resulting in lower profits for the BMR. Figure 4c,d show a scenario in which the brand value of the BMM is lower than the brand value of the BMR. The same conclusion is reached when the operating cost savings are below the threshold. Profit and consumer ambiguity tolerance follows a U-shaped trend when operating cost savings are above a critical value. Figure 4c,d show that the profit of the BMR is maximized when both the cost coefficient and the ambiguity tolerance are low. This is because, at this point, lower brand building costs are the determining factor in maximizing profits for the BMR.
The above findings are slightly different from Liu et al. [81]. Liu et al. concluded that manufacturers’ profits are negatively related to consumer online acceptance. This is because Liu et al. established a two-channel supply chain consisting of a manufacturer and a retailer, which includes both online and traditional channels. When consumer web acceptance is high, consumer demand increases less despite higher prices in the online channel; therefore, manufacturers profit less. This paper constructs a single-channel supply chain model consisting of the BMM and BMR and considers the moderating role of branding in the impact of consumer ambiguity tolerance on the profitability of supply chain members.
6.4. Summary of the Main Results
Consumer ambiguity tolerance may have positive, negative and U-shaped effects on the profitability of the BMM and BMR under different scenarios. The moderating effect of brand building on the relationship of ambiguity tolerance between consumers and the building materials supply chain may fail. Therefore, this paper uses Table 3 to summarize the main findings of each results section.
Table 3.
Summary of the main results.
7. Sensitivity Analysis
To demonstrate the stability of the above model, the effects of and on the sales prices and profits of the BMM and the BMR are further investigated. In this section, reference is made to the related study [82], where the parameter values are set via numerical analysis and the sensitivity analysis is performed with the model in the case.
In accordance with He et al. [82], this section performs a sensitivity analysis of the enterprise’s sales price and profit by varying and . and are important parameters in the process of corporate brand building, which are realistic influences on the profitability achieved by the company, as well as parameters that are profoundly discussed in the proposition section; therefore, h and β are chosen for the sensitivity analysis in this section to verify the stability of the model and the results. For the sensitivity analysis of the parameter , replace [83], [84] with [85], [86] and specify parameters [87], [88] and [89] to analyze the sensitivity effects on the sales price and profit in the scenario when . For the sensitivity analysis of the parameter , replace [87], [88] with [87], [89] and specify parameters [85] to analyze the sensitivity effects on the sales price and profit in the scenario when .
7.1. Figure 5 Shows the Sensitivity Analysis of the Selling Prices of the BMM and the BMR to the Parameter h
Figure 5 shows that the change in has no effect on the relationship between the selling price of construction materials and the ambiguity tolerance . This is the same result as in Proposition 5.
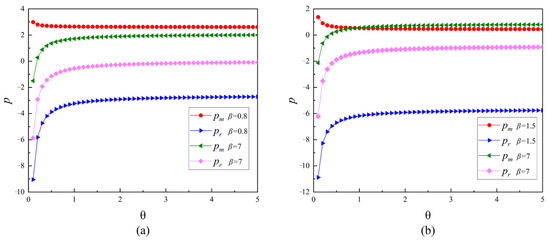
Figure 5.
Sensitivity analysis of the selling price of the BMM and the BMR to parameter h. (a) h = 0.3; (b) h = 0.9.
Figure 5.
Sensitivity analysis of the selling price of the BMM and the BMR to parameter h. (a) h = 0.3; (b) h = 0.9.
7.2. Figure 6 Shows the Sensitivity Analysis of the Profits of the BMM and the BMR to Parameter h
Figure 6 shows that the change in has no effect on the profit of the BMM or the BMR in relation to the ambiguity tolerance . This is the same result as in Propositions 6 and 7.
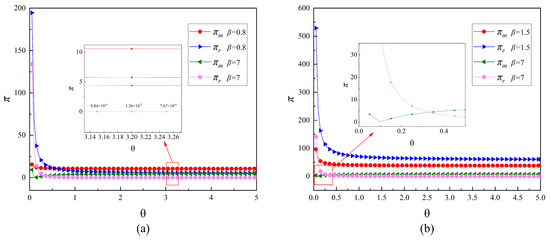
Figure 6.
Sensitivity analysis of the profits of the BMM and the BMR to parameter h. (a) h = 0.3; (b) h = 0.9.
Figure 6.
Sensitivity analysis of the profits of the BMM and the BMR to parameter h. (a) h = 0.3; (b) h = 0.9.
7.3. Figure 7 Shows the Sensitivity Analysis of the Selling Prices of the BMM and the BMR to the Parameter β
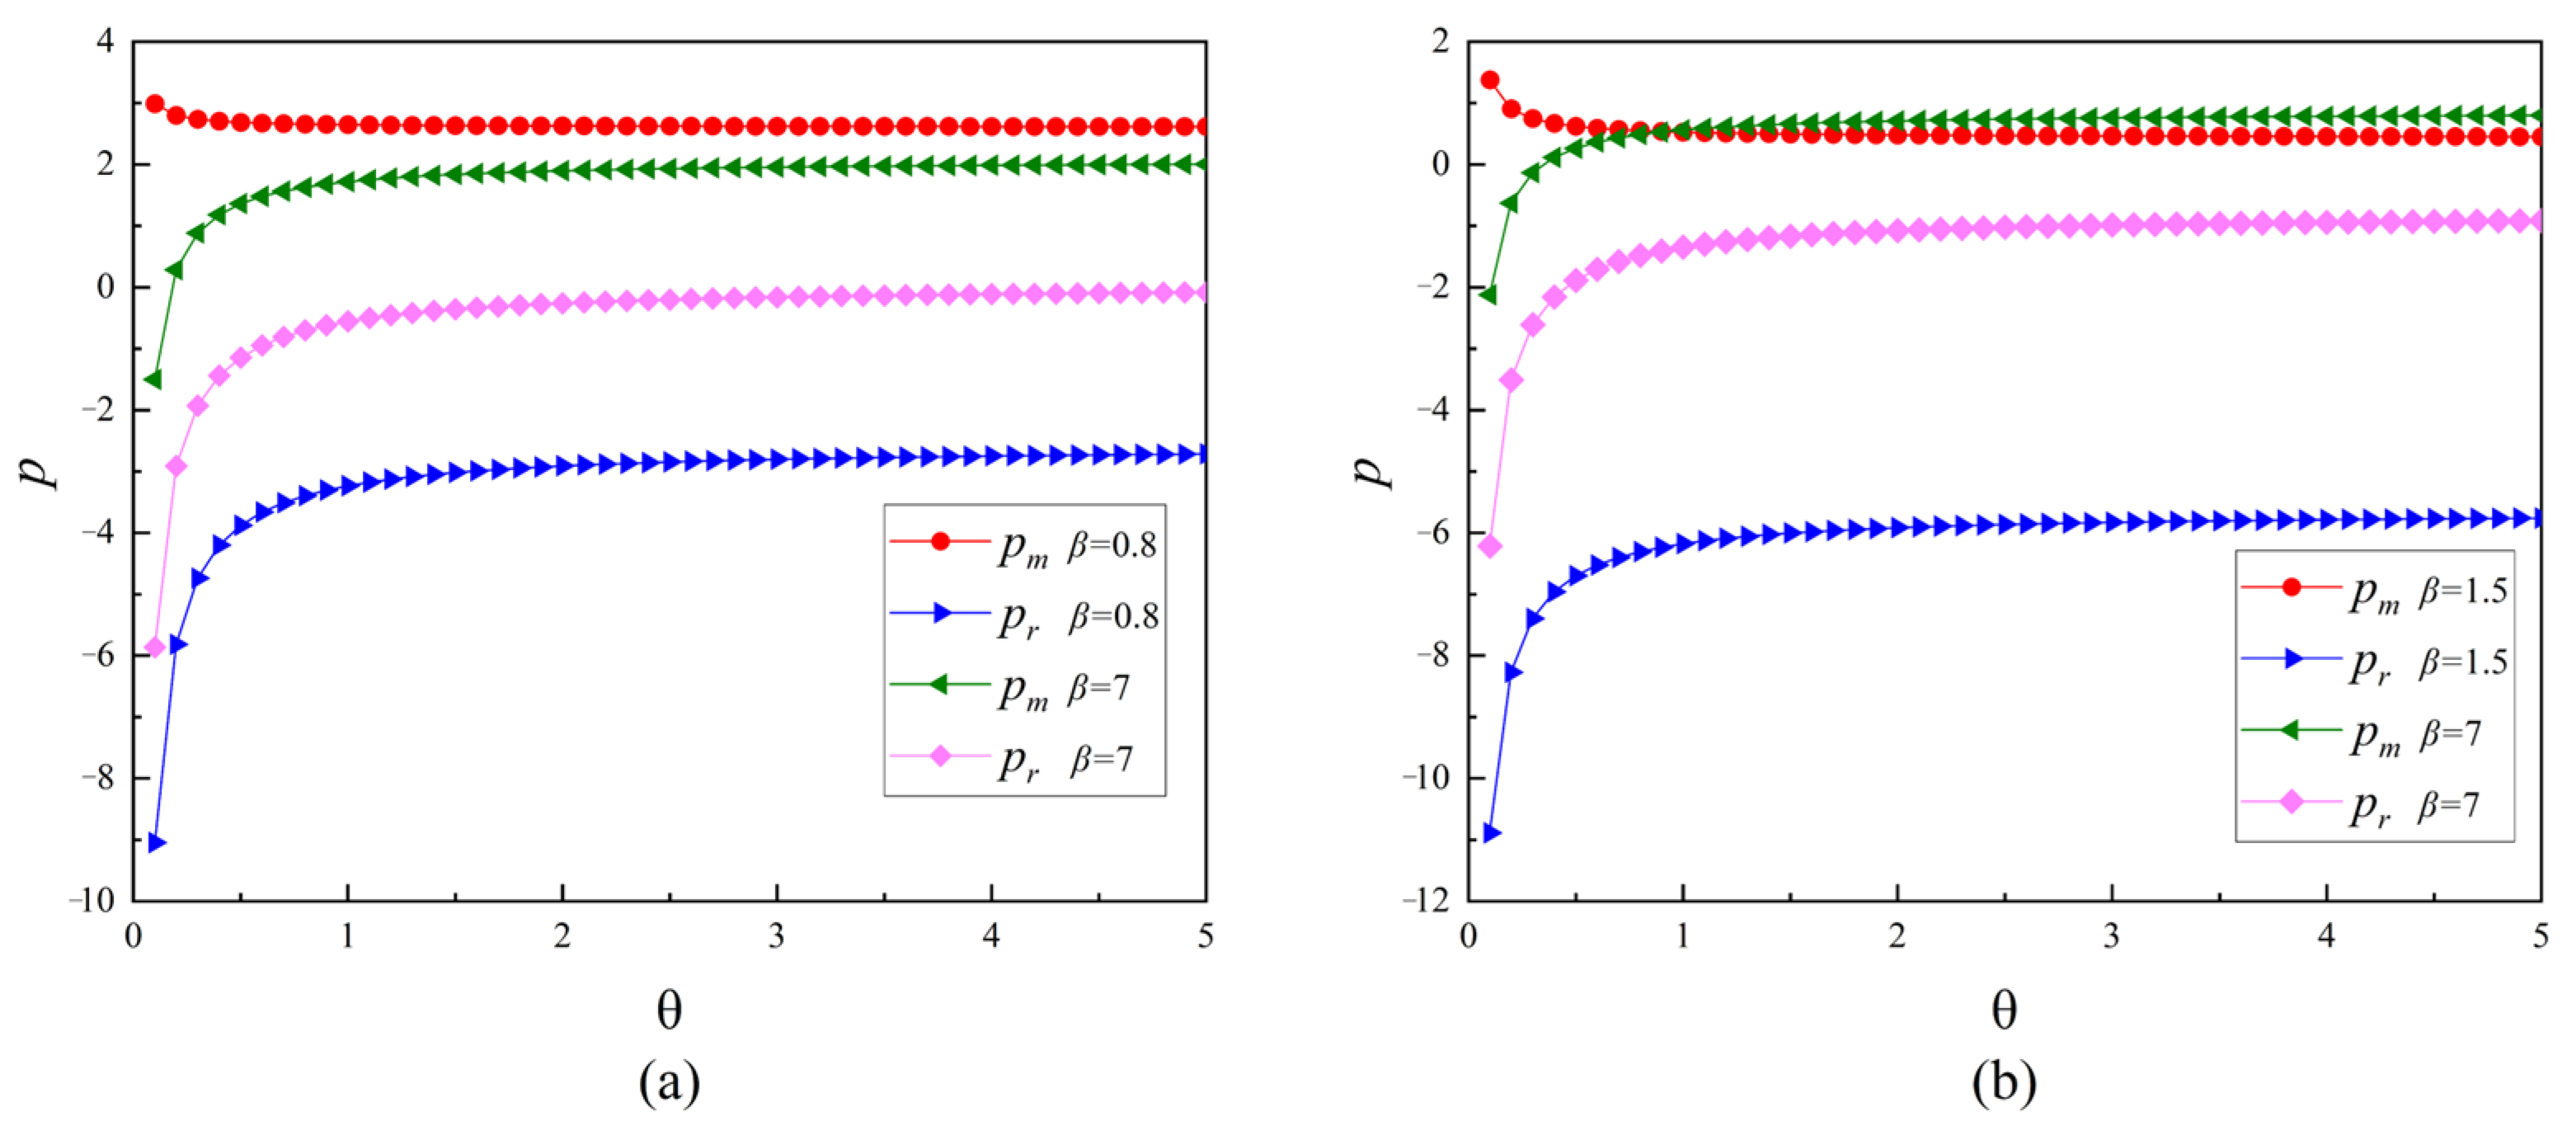
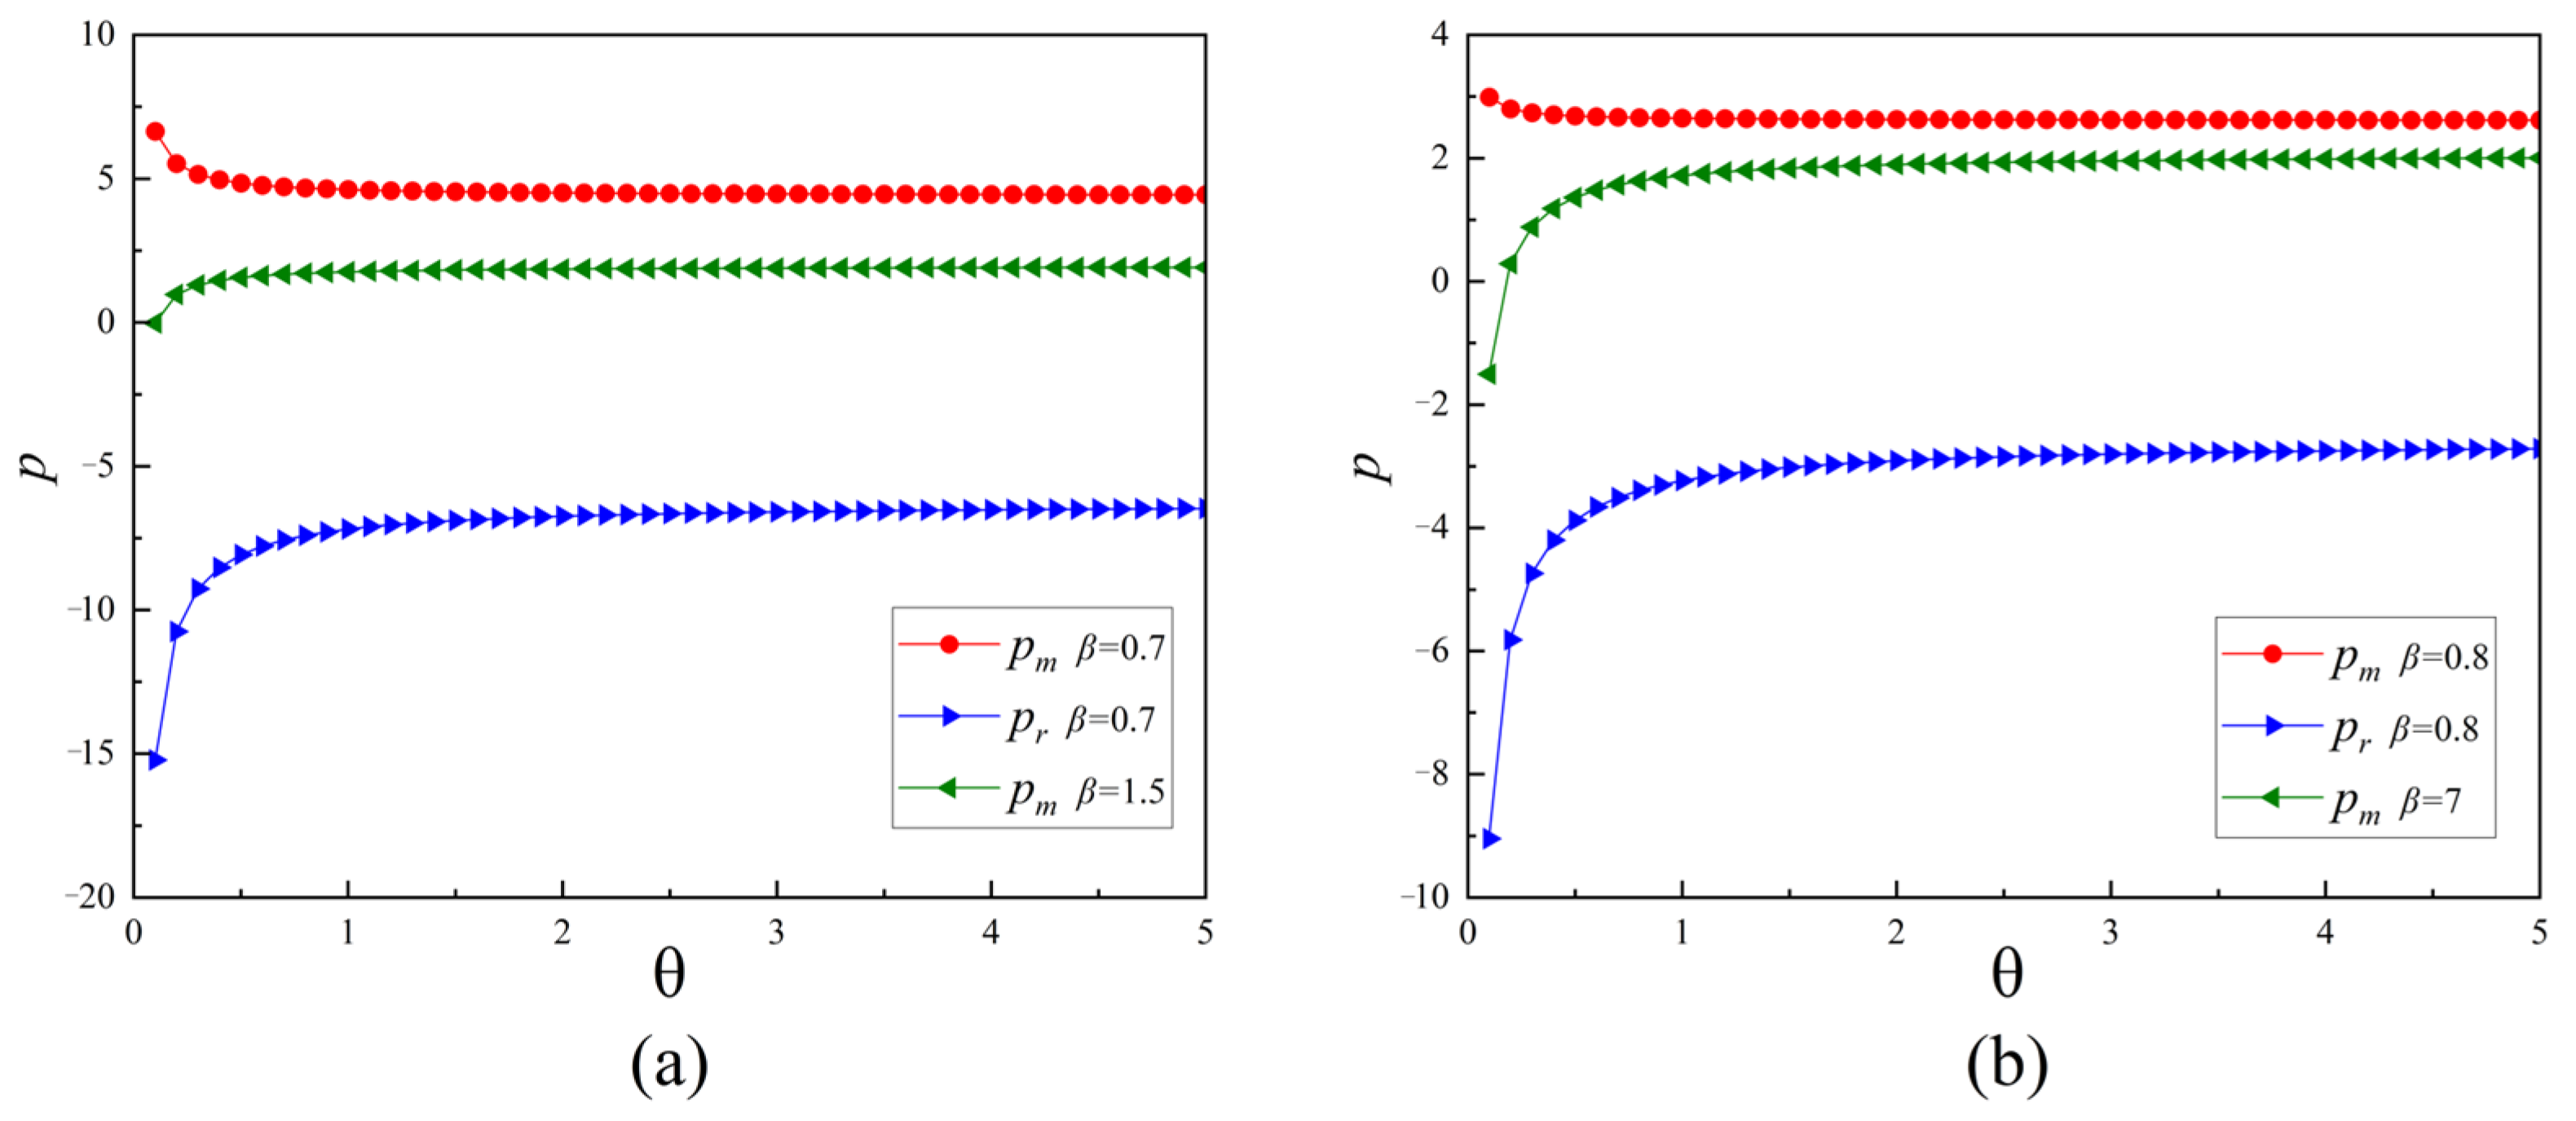
Figure 7 shows that the change in has no effect on the relationship between the selling price of construction materials and the ambiguity tolerance . This is the same result as in Proposition 5.
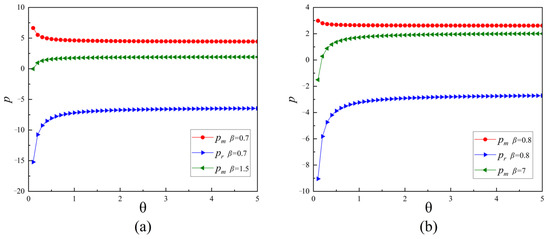
Figure 7.
Sensitivity analysis of the selling price of the BMM and the BMR to parameter β. (a) β = 0.7, β = 1.5; (b) β = 0.8, β = 7.
Figure 7.
Sensitivity analysis of the selling price of the BMM and the BMR to parameter β. (a) β = 0.7, β = 1.5; (b) β = 0.8, β = 7.
7.4. Figure 8 Shows the Sensitivity Analysis of the Profits of the BMM and the BMR to Parameter β
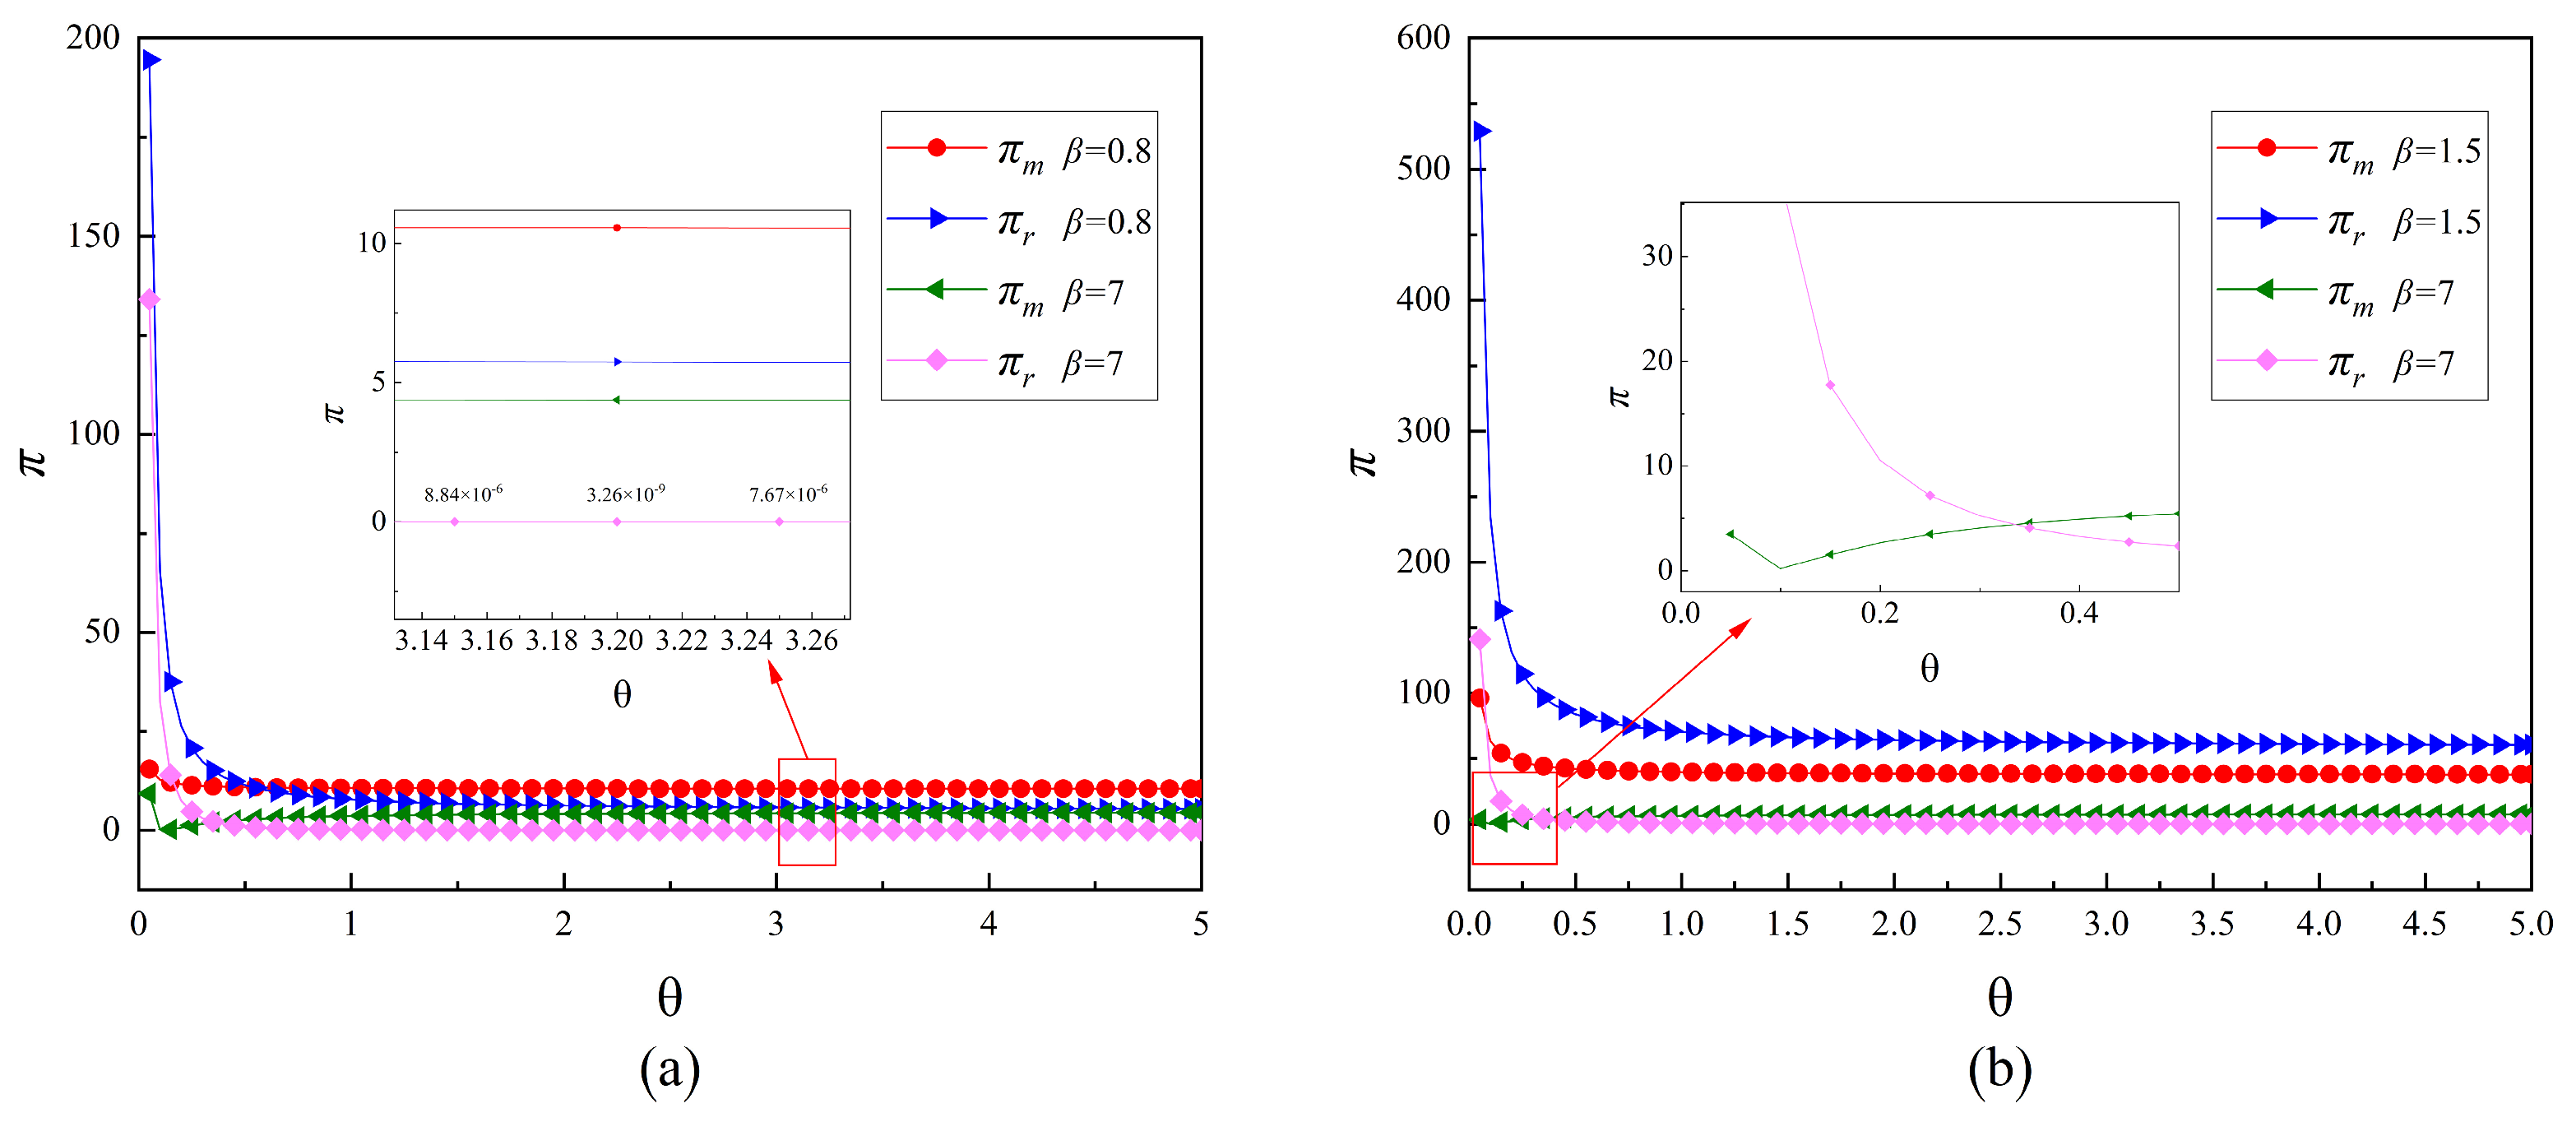
Figure 8 shows that the change in has no effect on the profit of the BMM or the BMR in relation to the ambiguity tolerance . This is the same result as in Propositions 6 and 7.
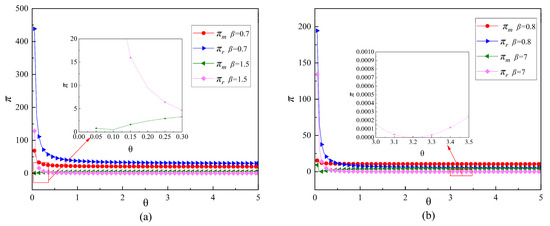
Figure 8.
Sensitivity analysis of the profits of the BMM and the BMR to parameter β. (a) β = 0.7, β = 1.5; (b) β = 0.8, β = 7.
Figure 8.
Sensitivity analysis of the profits of the BMM and the BMR to parameter β. (a) β = 0.7, β = 1.5; (b) β = 0.8, β = 7.
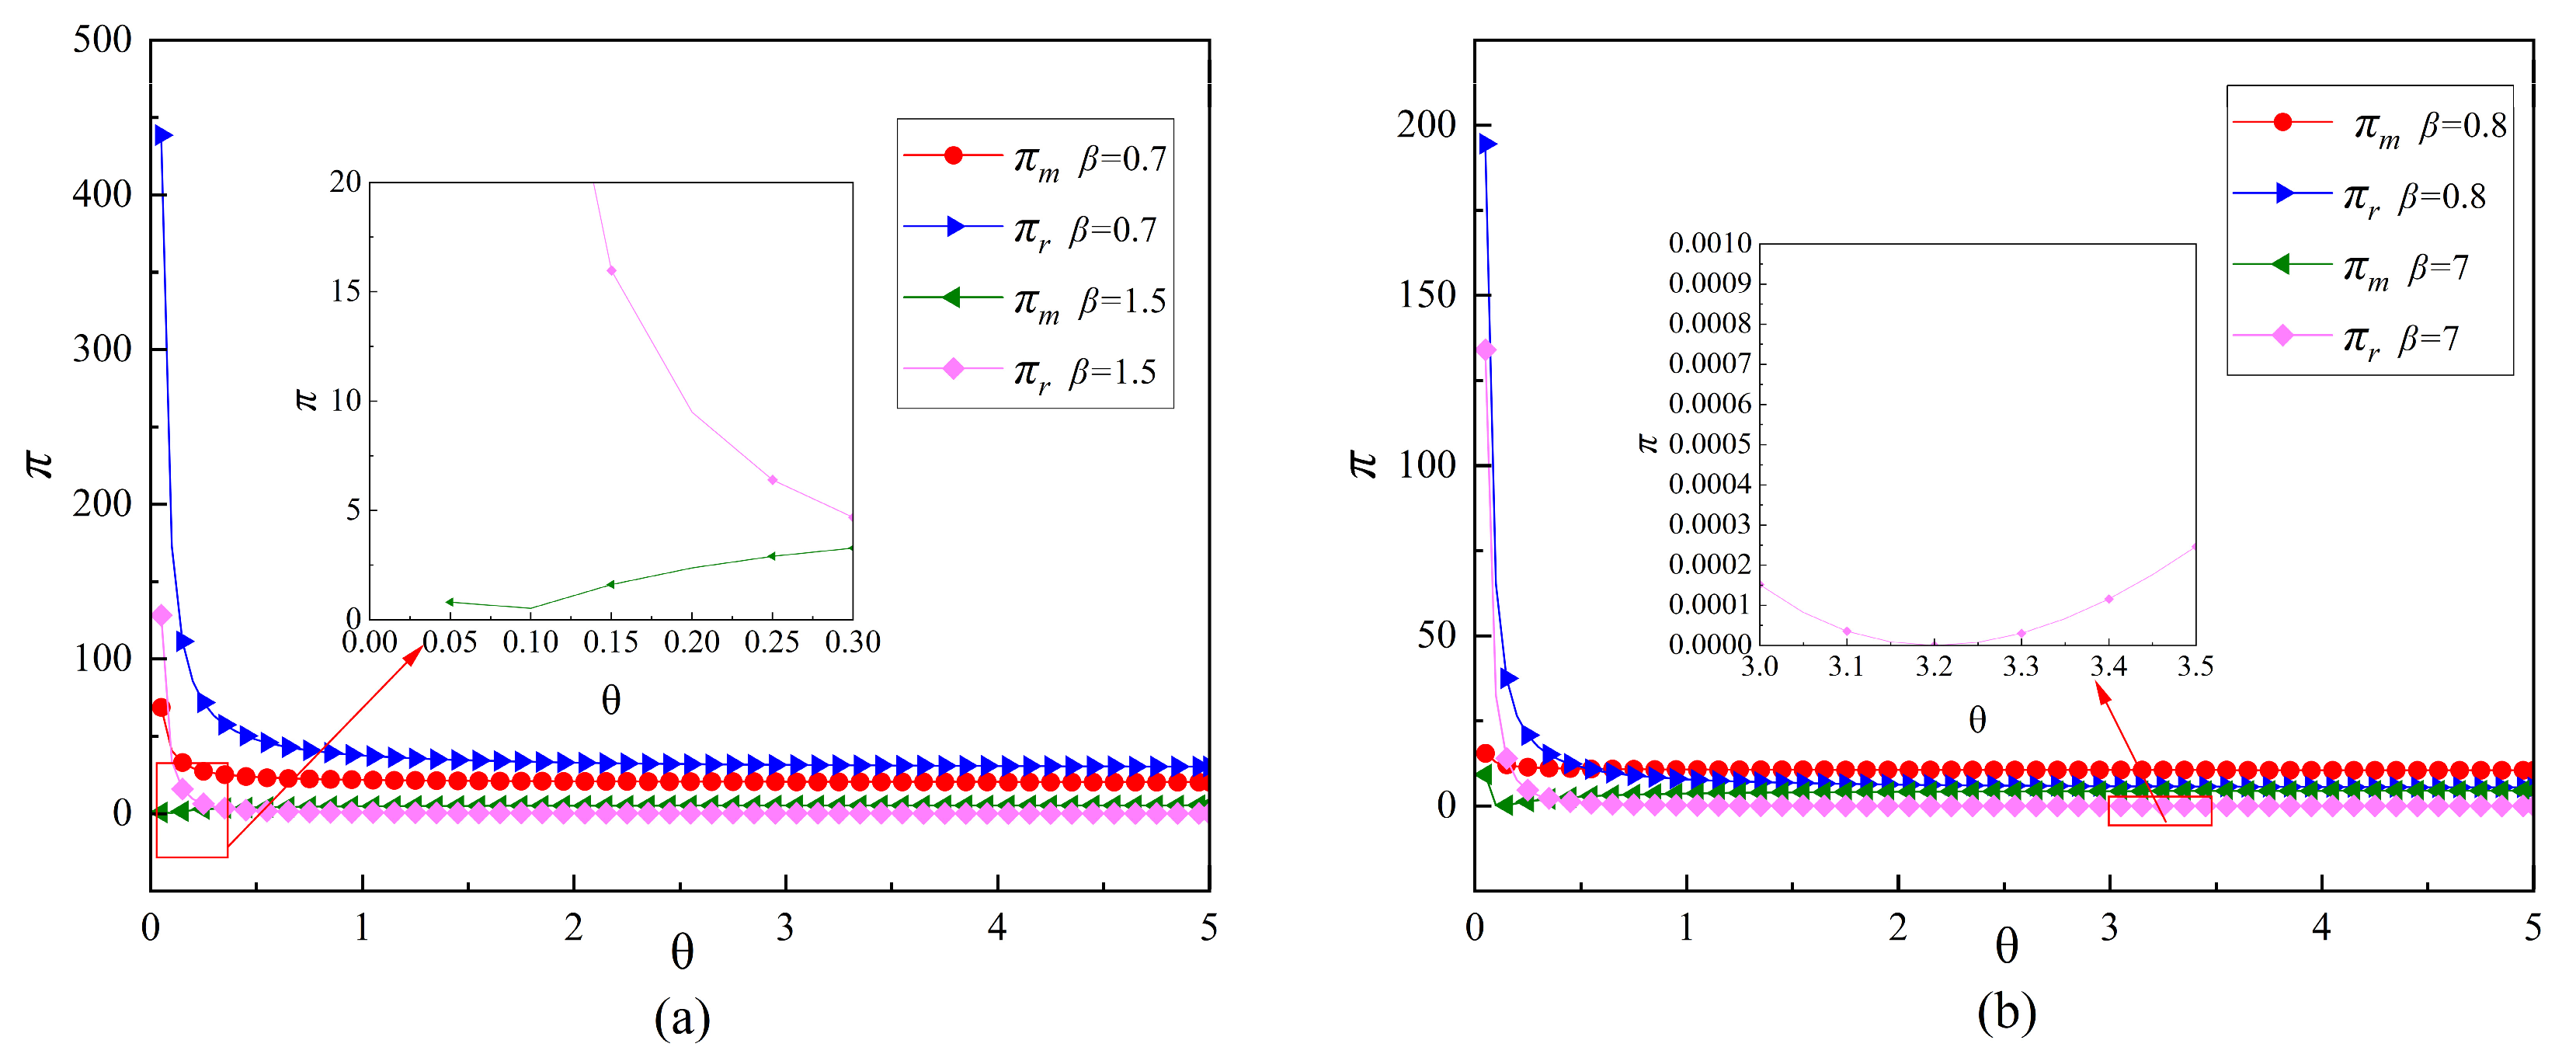
Figure 5 and Figure 7 show that the price of a new product with a low-cost coefficient is negatively correlated with ambiguity tolerance in consumers. For high-cost coefficients, price is positively related to ambiguity tolerance in consumers. In the case of recycled building materials, prices gradually increase as ambiguity tolerance among consumers increases. Figure 6 and Figure 8 show that when the brand value of the BMM is greater than the brand value of the BMR, in the case of the low-cost coefficient, the profit of the BMM is negatively correlated with consumer ambiguity tolerance. However, in the case of the high-cost coefficient, there is a U-shaped trend between profit and ambiguity tolerance in consumers. For the BMR, when the operating cost savings rate is below a critical value, profit is negatively related to ambiguity tolerance in consumers. At this point, if the cost coefficient is high, the profit has a U-shaped trend with ambiguity tolerance in consumers.
8. Conclusions and Implications
This study examines how ambiguity tolerance in consumers affects pricing decisions for building materials and how the profitability and branding of building materials enterprises moderates the relationship between ambiguity tolerance in consumers and building material supply chains. The main findings, contributions, limitations and directions for future research are as follows.
8.1. Conclusions
- (1)
- The relationship between the selling price of new and recycled building materials and ambiguity tolerance in consumers is influenced by factors such as cost coefficients, which show different trends. For new products, the price of a new product is negatively correlated with ambiguity tolerance in consumers when the brand-building cost coefficient is less than the threshold value of 0.61. The opposite conclusion was reached for brand building cost coefficients greater than the threshold value of 0.61. For recycled building materials, ambiguity tolerance in consumers can lead to higher sales prices.
- (2)
- When the brand value of the BMM is greater than that of the BMR, for the BMM, profit is always negatively correlated with ambiguity tolerance in consumers when the brand-building cost coefficient is less than the threshold value of 0.61. With the cost coefficient above the threshold value of 0.61, there is a U-shaped trend between profit and ambiguity tolerance in consumers. For the BMR, when the operating cost savings are lower than , the conclusion is different from that of the previous case only in terms of the threshold, and the relationship between profit and ambiguity tolerance is the same. Profit is always negatively related to ambiguity tolerance in consumers when the operating cost savings are greater than .
- (3)
- When the brand value of the BMM is lower than that of the BMR, for the BMM, when the operating cost savings rate is less than and the cost coefficient is higher than the threshold value of 0.61, the profit and ambiguity tolerance of consumers exhibit a U-shaped trend. When the operating cost savings rate is greater than , profit and ambiguity tolerance are achieved by consumers, following a U-shaped trend with a cost coefficient below the threshold value of 1.62. When the operating cost savings rate is greater than and less than , there is a U-shaped trend between profit and ambiguity tolerance in consumers at cost coefficients below the threshold value of 1.36 and above the threshold value of 1.62. When the operating cost savings rate is higher than and lower than , the conclusions obtained are different from the previous case only in terms of thresholds but are otherwise the same. For the BMR, when the operating cost savings rate is lower than , there is a U-shaped trend in profits and ambiguity tolerance in consumers when the cost coefficient is above the threshold value of 0.45. Profit and ambiguity tolerance in consumers followed a U-shaped trend when the operating cost savings rate was higher than .
8.2. Theoretical Contributions
- (1)
- Extant research on ambiguity tolerance in consumers focuses only on the effect on the behavior or perception of consumers [44,64,90]. From the new perspective of the supply chain, this paper discusses the impact of ambiguity tolerance on the profitability and pricing decisions of construction waste recycling supply chain enterprises, taking into account the uncertainty of consumers about recycled building materials in reality.
- (2)
- Research reveals the impact of consumers’ green preferences and online shopping preferences on the profitability of supply chain enterprises [14,16]. In terms of building material supply chains, this paper highlights the role of the ambiguity tolerance of consumers in enterprises’ pricing decisions and profits, thus extending the research on the factors related to consumers’ influence on supply chain enterprises’ decisions and profits.
- (3)
- Previous studies on ambiguity tolerance have used statistical methods [41,43,44]. This paper introduces the variable of ambiguity tolerance into a mathematical model for the first time, creatively combines the Stackelberg game method and provides a new method for the subsequent quantitative impact of ambiguity tolerance.
8.3. Implications for Practice
- (1)
- In terms of pricing decisions, consumer ambiguity tolerance is a favorable factor for the BMR to set high selling prices. When facing consumers with high ambiguity tolerance, the BMM should actively invest in brand building to increase brand competitiveness to transform ambiguity tolerance into a favorable factor for increasing selling prices.
- (2)
- For the BMM, when the brand value is higher than the brand value of the BMR, ambiguity tolerance in consumers and brand-building costs should be considered in terms of corporate profitability. Higher brand-building costs moderate the negative impact of consumer ambiguity tolerance on enterprises’ profitability. Therefore, the BMM should actively implement brand building to turn ambiguity tolerance into a favorable factor for enterprises’ profitability in the face of consumers with high levels of ambiguity tolerance. When the brand value is lower than the brand value of the BMR, the operational efficiency of the company is also taken into account with respect to the profitability of the company. When operational efficiency is relatively high, greater ambiguity tolerance can be translated into favorable factors for reducing brand-building costs and realizing corporate cost reductions and sales profitability. When operational efficiency is relatively modest, relatively high ambiguity tolerance is a favorable factor for the profitability of the BMM in the presence of low and high brand-building costs. At this point, the BMM should sell the new product to consumers with high ambiguity tolerance to maximize profits. In other cases, ambiguity tolerance is detrimental to corporate profitability.
- (3)
- For the BMR, the profitability of the business should be considered along with the efficiency of the business operations, the cost of brand building and ambiguity tolerance in consumers. On the one hand, BMR should sell recycled building materials to consumers with a high tolerance for ambiguity to reduce the high costs associated with brand building, when the brand value is lower than that of the BMM and when operational efficiency is relatively low. When operational efficiency is relatively high, a relatively low tolerance for ambiguity becomes a favorable factor for the profitability of the BMR. At this point, the BMR should sell recycled building materials to consumers with low ambiguity tolerance and realize a profit. On the other hand, when the brand value is greater than that of the BMM, the BMR should actively improve operational efficiency within the business and reduce brand-building costs while selling recycled building materials to consumers with a high tolerance for ambiguity to improve business profitability and maximize profits.
- (4)
- This paper analyses the impact of ambiguity tolerance in consumers on the profitability of enterprises and provides theoretical guidance for building materials enterprises to make effective decisions in response to consumers’ ambiguity psychology. Enterprises can use the findings of this paper to overcome negative consumer perceptions of recycled building materials and will have a positive impact. First, a change in consumers’ attitudes toward recycled building materials stimulates the growth of market demand, prompting enterprises to increase their investment in brand building and improve product quality and innovation. Second, with the efforts of enterprises in all aspects, the recycled building materials market is gradually growing, which will improve the circular economy industry chain. From upstream CDW recycling treatment to middle remanufacturing and then to downstream sales and application, each link closely cooperates with each other and drives the synergistic development of the upstream and downstream industries. The improvement of the industrial chain and the synergistic development of industries not only create economic benefits but also bring many employment opportunities. These favorable results have laid a solid foundation for the sustainable development of a circular economy in the field of building materials.
8.4. Limitations and Future Research
Although the research in this paper explores how ambiguity tolerance in consumers affects building material pricing decisions and how building material companies’ profitability and branding regulate the relationship between ambiguity tolerance in consumers and the building material supply chain, there are several limitations.
- (1)
- Although the conclusions of this paper are verified by numerical simulation and sensitivity analysis, they have not yet been verified by practical experience, and the conclusions of this paper can be further researched and verified in the future through case studies and questionnaire research.
- (2)
- In the actual building materials market, building materials companies such as the BMM and BMR may show ambiguity tolerance. Therefore, future research can consider the cases of the BMM and BMR with ambiguity tolerance to make the model more realistic.
- (3)
- This paper does not consider other factors, such as competition, government policy and consumer preferences for sustainable development. The reason is that the focus of this paper is on consumer ambiguity tolerance and simplifying the model for easy analysis. Future research can consider other factors affecting corporate pricing and profitability on the basis of this paper to make the model more comprehensive and realistic.
- (4)
- Although information symmetry has been mentioned in the literature [72], information asymmetry may also exist in reality. In future studies, researchers can analyze the impact of information asymmetry scenarios in depth according to the model proposed in this paper.
- (5)
- The focus of the model in this paper is to consider that the two building materials enterprises, the BMM and BMR, are in a competitive relationship, and both aim to maximize their respective profits. Other game scenarios, such as cooperation and Pareto optimal outcome scenarios, are not considered. Future research can further explore other game scenarios, such as cooperation and Pareto optimal outcome scenarios, and expand the research on consumer ambiguity tolerance.
Author Contributions
Methodology, validation, formal analysis, investigation, resources, data curation, writing—original draft, writing—review and editing, visualization, J.P.; conceptualization, methodology, writing—original draft, supervision, project administration, X.L.; writing—review and editing, Y.Z., H.Z., L.Z. and Y.W. All authors have read and agreed to the published version of the manuscript.
Funding
This work was supported by the National Natural Science Foundation of China (grant number 72204178), the Sichuan Science and Technology Program, the Natural Science Foundation of Sichuan, China (grant number 2023NSFSC1053), and the National College Students Innovation and Entrepreneurship Training Plan (grant number 202410626004).
Data Availability Statement
Data are contained within the article.
Conflicts of Interest
The authors declare no conflicts of interest.
References
- Li, X.; Li, J.; Shen, Q. Infection Mechanism of Greenwashing Behavior of Construction Material Enterprises under Multi-Agent Interaction. Dev. Built Environ. 2024, 17, 100321. [Google Scholar] [CrossRef]
- Chen, L.; Zhang, Y.; Chen, Z.; Dong, Y.; Jiang, Y.; Hua, J.; Liu, Y.; Osman, A.I.; Farghali, M.; Huang, L.; et al. Biomaterials Technology and Policies in the Building Sector: A Review. Environ. Chem. Lett. 2024, 22, 715–750. [Google Scholar] [CrossRef]
- Xu, L.; Wang, J.; Hu, X.; Ran, B.; Wu, T.; Zhou, X.; Xiong, Y. Physical Performance, Durability, and Carbon Emissions of Recycled Cement Concrete and Fully Recycled Concrete. Constr. Build. Mater. 2024, 447, 138128. [Google Scholar] [CrossRef]
- Kong, M.; Ji, C.; Hong, T.; Kang, H. Impact of the Use of Recycled Materials on the Energy Conservation and Energy Transition of Buildings Using Life Cycle Assessment: A Case Study in South Korea. Renew. Sustain. Energy Rev. 2022, 155, 111891. [Google Scholar] [CrossRef]
- Ma, M.; Tam, V.W.; Le, K.N.; Osei-Kyei, R. Analysing the Impacts of Key Factors on the Price of Recycled Concrete: A System Dynamics Model. J. Build. Eng. 2023, 80, 108123. [Google Scholar] [CrossRef]
- Han, D.; Kalantari, M.; Rajabifard, A. The Development of an Integrated BIM-Based Visual Demolition Waste Management Planning System for Sustainability-Oriented Decision-Making. J. Environ. Manag. 2024, 351, 119856. [Google Scholar] [CrossRef] [PubMed]
- Tamer, Z.; Yoon, Y.; Hastak, M. Protocol for Profitability Analysis Using Internal Entities in Organizational Structure of Construction Companies. J. Constr. Eng. Manag. 2012, 138, 1394–1402. [Google Scholar] [CrossRef]
- Niu, B.; Wang, L. How Does Green Manufacturing Promote the Recycling of Renewable Solid Waste and Carbon Reduction? Resour. Conserv. Recycl. 2024, 203, 107410. [Google Scholar] [CrossRef]
- Lim, J.N.; Schultmann, F.; Ofori, G. Tailoring Competitive Advantages Derived from Innovation to the Needs of Construction Firms. J. Constr. Eng. Manag. 2010, 136, 568–580. [Google Scholar] [CrossRef]
- Santos-Vijande, M.L.; del Río-Lanza, A.B.; Suárez-Álvarez, L.; Díaz-Martín, A.M. The Brand Management System and Service Firm Competitiveness. J. Bus. Res. 2013, 66, 148–157. [Google Scholar] [CrossRef]
- China National Building Material Group Co., Ltd. Available online: https://www.cnbm.com.cn/CNBM/0000000700010008/66951.html (accessed on 24 November 2024).
- HOLCIM. Available online: https://www.holcim.com/innovation/rd-at-holcim (accessed on 24 November 2024).
- Sun, J.; Ma, B.; Wei, S. Same Gratitude, Different Pro-Environmental Behaviors? Effect of the Dual-Path Influence Mechanism of Gratitude on Pro-Environmental Behavior. J. Clean. Prod. 2023, 415, 137779. [Google Scholar] [CrossRef]
- Wang, R.; Zhou, X.; Li, B. Pricing Strategy of Dual-Channel Supply Chain with a Risk-Averse Retailer Considering Consumers’ Channel Preferences. Ann. Oper. Res. 2021, 309, 305–324. [Google Scholar] [CrossRef]
- Bera, S.; Giri, B.C. Impact of Consumer Preferences in a Cournot Duopoly Market with Heterogeneous Smart Sustainable Supply Chains. Nonlinear Dyn. 2024, 112, 15567–15599. [Google Scholar] [CrossRef]
- Wang, Y.; Hou, G. A Duopoly Game with Heterogeneous Green Supply Chains in Optimal Price and Market Stability with Consumer Green Preference. J. Clean. Prod. 2020, 255, 120161. [Google Scholar] [CrossRef]
- Ji, Z.; Liu, X.; Tang, D. Game-Theoretic Applications for Decision-Making Behavior on the Energy Demand Side: A Systematic Review. Prot. Control Mod. Power Syst. 2024, 9, 1–20. [Google Scholar] [CrossRef]
- Lauffer, N.; Ghasemi, M.; Hashemi, A.; Savas, Y.; Topcu, U. No-Regret Learning in Dynamic Stackelberg Games. IEEE Trans. Autom. Control 2023, 69, 1418–1431. [Google Scholar] [CrossRef]
- Meng, Q.; Li, M.; Liu, W.; Li, Z.; Zhang, J. Pricing Policies of Dual-Channel Green Supply Chain: Considering Government Subsidies and Consumers’ Dual Preferences. Sustain. Prod. Consum. 2021, 26, 1021–1030. [Google Scholar] [CrossRef]
- Niu, B.; Xu, H.; Chen, L. Creating All-Win by Blockchain in a Remanufacturing Supply Chain with Consumer Risk-Aversion and Quality Untrust. Transp. Res. Part E Logist. Transp. Rev. 2022, 163, 102778. [Google Scholar] [CrossRef]
- Kovalenko, L.; Sorescu, A.; Houston, M.B. What Brand Do I Use for My New Product? The Impact of New Product Branding Decisions on Firm Value. J. Acad. Mark. Sci. 2021, 50, 338–365. [Google Scholar] [CrossRef]
- Mullins, R.; Swain, S.; Friend, S.B. How and Should Firms Motivate Salesperson Effort across a Multi-Brand Portfolio? J. Bus. Res. 2023, 158, 113677. [Google Scholar] [CrossRef]
- Rego, L.; Brady, M.; Leone, R.; Roberts, J.; Srivastava, C.; Srivastava, R. Brand Response to Environmental Turbulence: A Framework and Propositions for Resistance, Recovery and Reinvention. Int. J. Res. Mark. 2021, 39, 583–602. [Google Scholar] [CrossRef]
- Arifoğlu, C.; Tang, C.S. Luxury Brand Licensing: Competition and Reference Group Effects. Prod. Oper. Manag. 2023, 32, 3227–3245. [Google Scholar] [CrossRef]
- Chakraborty, T.; Chauhan, S.S.; Huang, X. Quality Competition between National and Store Brands. Int. J. Prod. Res. 2021, 60, 2703–2732. [Google Scholar] [CrossRef]
- Kittaka, Y.; Pan, C. The Bright Side of Outside Market Entry with Manufacturer Encroachment. Transp. Res. Part E Logist. Transp. Rev. 2023, 180, 103358. [Google Scholar] [CrossRef]
- Vaidyanathan, R.; Aggarwal, P. Asymmetric Brand Alliances: When Joint Promotions with Strong Brands Hurt. J. Bus. Res. 2022, 141, 213–228. [Google Scholar] [CrossRef]
- Karray, S.; Martín-Herrán, G. The Impact of a Store Brand Introduction in a Supply Chain with Competing Manufacturers: The Strategic Role of Pricing and Advertising Decision Timing. Int. J. Prod. Econ. 2022, 244, 108378. [Google Scholar] [CrossRef]
- Hsiao, L.; Xiong, H. Store Brand Introduction, Retail Competition and Manufacturers’ Coping Strategies. Transp. Res. Part E Logist. Transp. Rev. 2022, 165, 102861. [Google Scholar] [CrossRef]
- Niu, B.; Yu, X.; Zeng, F. Remanufacturer’s Downstream Encroachment and Incumbent Brand’s Order Shifting in Pareto Improvement of Economic and Environmental Sustainability. Comput. Ind. Eng. 2023, 182, 109417. [Google Scholar] [CrossRef]
- Jena, S.K.; Sarmah, S.P.; Sarin, S.C. Price Competition between High and Low Brand Products Considering Coordination Strategy. Comput. Ind. Eng. 2019, 130, 500–511. [Google Scholar] [CrossRef]
- Ellsberg, D. Risk, Ambiguity, and the Savage Axioms. Q. J. Econ. 1961, 75, 643–669. [Google Scholar] [CrossRef]
- Ma, W.; Hao, J.L. Enhancing a Circular Economy for Construction and Demolition Waste Management in China: A Stakeholder Engagement and Key Strategy Approach. J. Clean. Prod. 2024, 450, 141763. [Google Scholar] [CrossRef]
- Pacheco, J.; de Brito, J. Recycled Aggregates Produced from Construction and Demolition Waste for Structural Concrete: Constituents, Properties and Production. Materials 2021, 14, 5748. [Google Scholar] [CrossRef] [PubMed]
- Jorge, E.; Lopez-Valeiras, E.; Gonzalez-Sanchez, M.B. The Role of Attitudes and Tolerance of Ambiguity in Explaining Consumers’ Willingness to Pay for Organic Wine. J. Clean. Prod. 2020, 257, 120601. [Google Scholar] [CrossRef]
- Xu, H.; Tracey, T.J.G. The Role of Ambiguity Tolerance in Career Decision Making. J. Vocat. Behav. 2014, 85, 18–26. [Google Scholar] [CrossRef]
- Fujikawa, H.; Aoki, T.; Son, D.; Hayashi, M.; Eto, M. Association between Tolerance for Ambiguity Specific to the Clinical Context and Empathy in Medical Trainees: A Multicenter Cross-Sectional Study in Japan. Med. Teach. 2023, 46, 512–518. [Google Scholar] [CrossRef] [PubMed]
- Hitsuwari, J.; Nomura, M. Ambiguity Tolerance Can Improve through Poetry Appreciation and Creation. J. Creat. Behav. 2022, 57, 178–185. [Google Scholar] [CrossRef]
- Fujikawa, H.; Son, D.; Hayashi, M.; Kondo, K.; Eto, M. Translation, Adaptation, and Validation of the Tolerance of Ambiguity in Medical Students and Doctors (TAMSAD) Scale for Use in Japan. BMC Med. Educ. 2023, 23, 405. [Google Scholar] [CrossRef] [PubMed]
- Leite-Mendes, F.; Delgado, L.; Ferreira, A.; Severo, M. The Effect of the Attitude towards Risk/Ambiguity on Examination Grades: Cross-Sectional Study in a Portuguese Medical School. Adv. Health Sci. Educ. 2024, 29, 1309–1321. [Google Scholar] [CrossRef] [PubMed]
- Endres, M.L.; Milner, M.; Camp, R.R. A Fly in the Soup? The Role of Ambiguity in Student Assessment. Int. J. Manag. Educ. 2022, 20, 100679. [Google Scholar] [CrossRef]
- Xu, H.; Hou, Z.-J.; Tracey, T.J.G.; Zhang, X. Variations of Career Decision Ambiguity Tolerance between China and the United States and between High School and College. J. Vocat. Behav. 2016, 93, 120–128. [Google Scholar] [CrossRef]
- Sung, S.Y.; Antefelt, A.; Choi, J.N. Dual Effects of Job Complexity on Proactive and Responsive Creativity: Moderating Role of Employee Ambiguity Tolerance. Group Organ. Manag. 2015, 42, 388–418. [Google Scholar] [CrossRef]
- Zhang, W.; Liu, L. Exploring Non-Users’ Intention to Adopt Ride-Sharing Services: Taking into Account Increased Risks due to the COVID-19 Pandemic among Other Factors. Transp. Res. Part A Policy Pract. 2022, 158, 180–195. [Google Scholar] [CrossRef] [PubMed]
- Lu, A.C.C.; Gursoy, D. A Conceptual Model of Consumers’ Online Tourism Confusion. Int. J. Contemp. Hosp. Manag. 2015, 27, 1320–1342. [Google Scholar] [CrossRef]
- Bušljeta Banks, I.; De Pelsmacker, P. Involvement, Tolerance for Ambiguity, and Type of Service Moderate the Effectiveness of Probability Marker Usage in Service Advertising. J. Advert. 2014, 43, 196–209. [Google Scholar] [CrossRef]
- Zhang, H.; Li, X.; Ding, Z. Optimal Supply Chain Performance: Risk Aversion to Green Innovation. Manag. Decis. 2024, 62, 3996–4020. [Google Scholar] [CrossRef]
- Zhu, J.; Zhang, H.; Chen, W.; Li, X. Operational Decisions of Construction and Demolition Waste Recycling Supply Chain Members under Altruistic Preferences. Systems 2024, 12, 346. [Google Scholar] [CrossRef]
- Zhang, S.; Shu, J.; Wang, X.; Zhang, Z. A Supply Chain System Involving the Interaction of Guarantee Finance with Product Quality and After-Sales Service. IEEE Trans. Eng. Manag. 2023, 71, 3414–3429. [Google Scholar] [CrossRef]
- Long, J.; Wang, F. Complexity of a Two-Stage R&D Game within a Cluster Supply Chain Considering Vertical R&D Spillovers, Effective Information, and Government Subsidies. Math. Comput. Simul. 2024, 221, 606–621. [Google Scholar] [CrossRef]
- Ji, C.-Y.; Tan, Z.-K.; Chen, B.-J.; Zhou, D.-C.; Qian, W.-Y. The Impact of Environmental Policies on Renewable Energy Investment Decisions in the Power Supply Chain. Energy Policy 2024, 186, 113987. [Google Scholar] [CrossRef]
- Wang, S.; Yan, H.; Chen, P. A Comparative Study of Carbon Emission Reduction Modes in Supply Chain under Carbon Tax Mechanism. Environ. Dev. Sustain. 2023. [Google Scholar] [CrossRef]
- Wang, D.; Du, G.; Jiao, R.J.; Wu, R.; Yu, J.; Yang, D. A Stackelberg Game Theoretic Model for Optimizing Product Family Architecting with Supply Chain Consideration. Int. J. Prod. Econ. 2016, 172, 1–18. [Google Scholar] [CrossRef]
- Cao, B.-B.; You, T.-H.; Ou, C.X.; Zhu, H.; Liu, C. Optimizing Payment Schemes in a Decentralized Supply Chain: A Stackelberg Game with Quality Investment and Bank Credit. Comput. Ind. Eng. 2022, 168, 108077. [Google Scholar] [CrossRef]
- Han, Y.; Zheng, H.; Huang, Y.; Li, X. Considering Consumers’ Green Preferences and Government Subsidies in the Decision Making of the Construction and Demolition Waste Recycling Supply Chain: A Stackelberg Game Approach. Buildings 2022, 12, 832. [Google Scholar] [CrossRef]
- Li, Y.; Wang, B.; Yang, Z.; Li, J.; Chen, C. Hierarchical Stochastic Scheduling of Multi-Community Integrated Energy Systems in Uncertain Environments via Stackelberg Game. Appl. Energy 2022, 308, 118392. [Google Scholar] [CrossRef]
- Adil, M.; Mahmud, M.A.P.; Kouzani, A.Z.; Khoo, S. Energy Trading among Electric Vehicles Based on Stackelberg Approaches: A Review. Sustain. Cities Soc. 2021, 75, 103199. [Google Scholar] [CrossRef]
- De, A.; Ray, A.; Kundu, T.; Sheu, J.-B. Is It Wise to Compete or to Collaborate? Remanufacturing Business Models under Collective Extended Producer Responsibility Legislation. Transp. Res. Part E Logist. Transp. Rev. 2023, 179, 103294. [Google Scholar] [CrossRef]
- De Araujo, V.; Christoforo, A. The Global Cross-Laminated Timber (CLT) Industry: A Systematic Review and a Sectoral Survey of Its Main Developers. Sustainability 2023, 15, 7827. [Google Scholar] [CrossRef]
- China Economic Net. 2024. Available online: http://www.ce.cn/xwzx/gnsz/gdxw/202204/05/t20220405_37461133.shtml (accessed on 24 November 2024).
- Chen, H.-C.; Liu, S.-M. Optimal Investments of Port Authorities Facing Ambiguity on Uncertain Market Demands. Transp. Res. Part B Methodol. 2024, 179, 102856. [Google Scholar] [CrossRef]
- Ray, A.; De, A.; Mondal, S.; Wang, J. Selection of Best Buyback Strategy for Original Equipment Manufacturer and Independent Remanufacturer–Game Theoretic Approach. Int. J. Prod. Res. 2020, 59, 5495–5524. [Google Scholar] [CrossRef]
- Cai, Y.-J.; Choi, T.-M.; Zhang, T. Commercial Used Apparel Collection Operations in Retail Supply Chains. Eur. J. Oper. Res. 2021, 298, 169–181. [Google Scholar] [CrossRef]
- Choi, T.-M. Pricing and Branding for Remanufactured Fashion Products. J. Clean. Prod. 2017, 165, 1385–1394. [Google Scholar] [CrossRef]
- Jiang, B.; Li, Q.; Li, J. Brand value, equity concerns and contractual coordination in shipping supply chains. China Manag. Sci. 2020, 1, 101–112. (In Chinese) [Google Scholar] [CrossRef]
- Zhou, Q.; Meng, C.; Sheu, J.-B.; Yuen, K.F. Remanufacturing Mode and Strategic Decision: A Game-Theoretic Approach. Int. J. Prod. Econ. 2023, 260, 108841. [Google Scholar] [CrossRef]
- Abedsoltan, H.; Allah Taleizadeh, A.; Bhaba Sarker, R. Optimal Production of Remanufactured Products with Collaboration and Co-Branding of Luxury Brands. Comput. Ind. Eng. 2022, 172, 108533. [Google Scholar] [CrossRef]
- Zhang, H.; Chen, W.; Peng, J.; Wang, Y.; Zeng, L.; Gao, P.; Zhu, X.; Li, X. Pricing Decisions in Construction and Demolition Waste Recycling Supply Chains under Carbon Tax Scenarios. Systems 2024, 12, 35. [Google Scholar] [CrossRef]
- Wang, S.; Wang, J.; Yang, F.; Wang, Y.; Li, J. Consumer Familiarity, Ambiguity Tolerance, and Purchase Behavior toward Remanufactured Products: The Implications for Remanufacturers. Bus. Strategy Environ. 2018, 27, 1741–1750. [Google Scholar] [CrossRef]
- Ma, X.-Y.; Sun, D.-Q.; Liu, S.-X.; Li, Y.-T.; Ma, H.-Q.; Zhang, L.-M.; Li, X. Optimal Decisions in a Sea-Cargo Supply Chain with Two Competing Freight Forwarders Considering Altruistic Preference and Brand Investment. Systems 2023, 11, 399. [Google Scholar] [CrossRef]
- Xie, G.; Yue, W.; Wang, S.; Lai, K.K. Quality Investment and Price Decision in a Risk-Averse Supply Chain. Eur. J. Oper. Res. 2011, 214, 403–410. [Google Scholar] [CrossRef]
- Heydari, J.; Govindan, K.; Basiri, Z. Balancing Price and Green Quality in Presence of Consumer Environmental Awareness: A Green Supply Chain Coordination Approach. Int. J. Prod. Res. 2020, 59, 1957–1975. [Google Scholar] [CrossRef]
- Zhou, C.; He, J.; Li, Y.; Chen, W.; Zhang, Y.; Zhang, H.; Xu, S.; Li, X. Green Independent Innovation or Green Imitation Innovation? Supply Chain Decision-Making in the Operation Stage of Construction and Demolition Waste Recycling Public-Private Partnership Projects. Systems 2023, 11, 94. [Google Scholar] [CrossRef]
- Fang, C.; Fan, S.; Qiu, Y. The Choice of Remanufacturing Strategy for the OEM with Third-Party Remanufacturers’ Advantages. Comput. Ind. Eng. 2023, 176, 108973. [Google Scholar] [CrossRef]
- Yang, L.; Gao, M.; Feng, L. Competition versus Cooperation? Which Is Better in a Remanufacturing Supply Chain Considering Blockchain. Transp. Res. Part E Logist. Transp. Rev. 2022, 165, 102855. [Google Scholar] [CrossRef]
- Chen, B.; Xie, W.; Huang, F.; Li, X. Energy-Saving and Pricing Decisions in a Sustainable Supply Chain Considering Behavioral Concerns. PLoS ONE 2020, 15, e0236354. [Google Scholar] [CrossRef]
- de Vicente Bittar, A. Selling Remanufactured Products: Does Consumer Environmental Consciousness Matter? J. Clean. Prod. 2018, 181, 527–536. [Google Scholar] [CrossRef]
- Xu, J.; Duan, Y. Pricing, Ordering, and Quick Response for Online Sellers in the Presence of Consumer Disappointment Aversion. Transp. Res. Part E Logist. Transp. Rev. 2020, 137, 101925. [Google Scholar] [CrossRef]
- Xu, X.; Jackson, J.E. Investigating the Influential Factors of Return Channel Loyalty in Omni-Channel Retailing. Int. J. Prod. Econ. 2019, 216, 118–132. [Google Scholar] [CrossRef]
- Zayas, V.; Shoda, Y.; Ayduk, O.N. Personality in Context: An Interpersonal Systems Perspective. J. Personal. 2002, 70, 851–900. [Google Scholar] [CrossRef] [PubMed]
- Liu, Y.; Li, J.; Ren, W.; Forrest, J.Y.-L. Differentiated Products Pricing with Consumer Network Acceptance in a Dual-Channel Supply Chain. Electron. Commer. Res. Appl. 2020, 39, 100915. [Google Scholar] [CrossRef]
- He, L.; Wang, H.; Liu, F. Emission Abatement in Low-Carbon Supply Chains with Government Subsidy and Information Asymmetry. Int. J. Prod. Res. 2024, 62, 6598–6626. [Google Scholar] [CrossRef]
- HENAN ENERGY GROUP CO., LTD. 2025. Available online: https://www.hnecgc.com.cn/2024/04-07/19276.html (accessed on 24 January 2025).
- Guangming Online. 2025. Available online: https://economy.gmw.cn/2022-12/27/content_36261756.htm (accessed on 24 January 2025).
- People’s Daily Online. 2025. Available online: http://opinion.people.com.cn/n1/2017/0410/c1003-29198023.html (accessed on 24 January 2025).
- Zhang, Y.; Chen, W. Optimal Operational and Financing Portfolio Strategies for a Capital-Constrained Closed-Loop Supply Chain with Supplier-Remanufacturing. Comput. Ind. Eng. 2022, 168, 108133. [Google Scholar] [CrossRef]
- Ma, P.; Wang, H.; Shang, J. Supply Chain Channel Strategies with Quality and Marketing Effort-Dependent Demand. Int. J. Prod. Econ. 2013, 144, 572–581. [Google Scholar] [CrossRef]
- He, P.; He, Y.; Xu, H. Product Variety and Recovery Strategies for a Manufacturer in a Personalised and Sustainable Consumption Era. Int. J. Prod. Res. 2021, 60, 2086–2102. [Google Scholar] [CrossRef]
- Xiao, M.; Gu, Q.; He, X.-S. Selection of Sales Mode for E-Commerce Platform Considering Corporate Social Responsibility. Systems 2023, 11, 543. [Google Scholar] [CrossRef]
- Hazen, B.T.; Overstreet, R.E.; Jones-Farmer, L.A.; Field, H.S. The Role of Ambiguity Tolerance in Consumer Perception of Remanufactured Products. Int. J. Prod. Econ. 2012, 135, 781–790. [Google Scholar] [CrossRef]
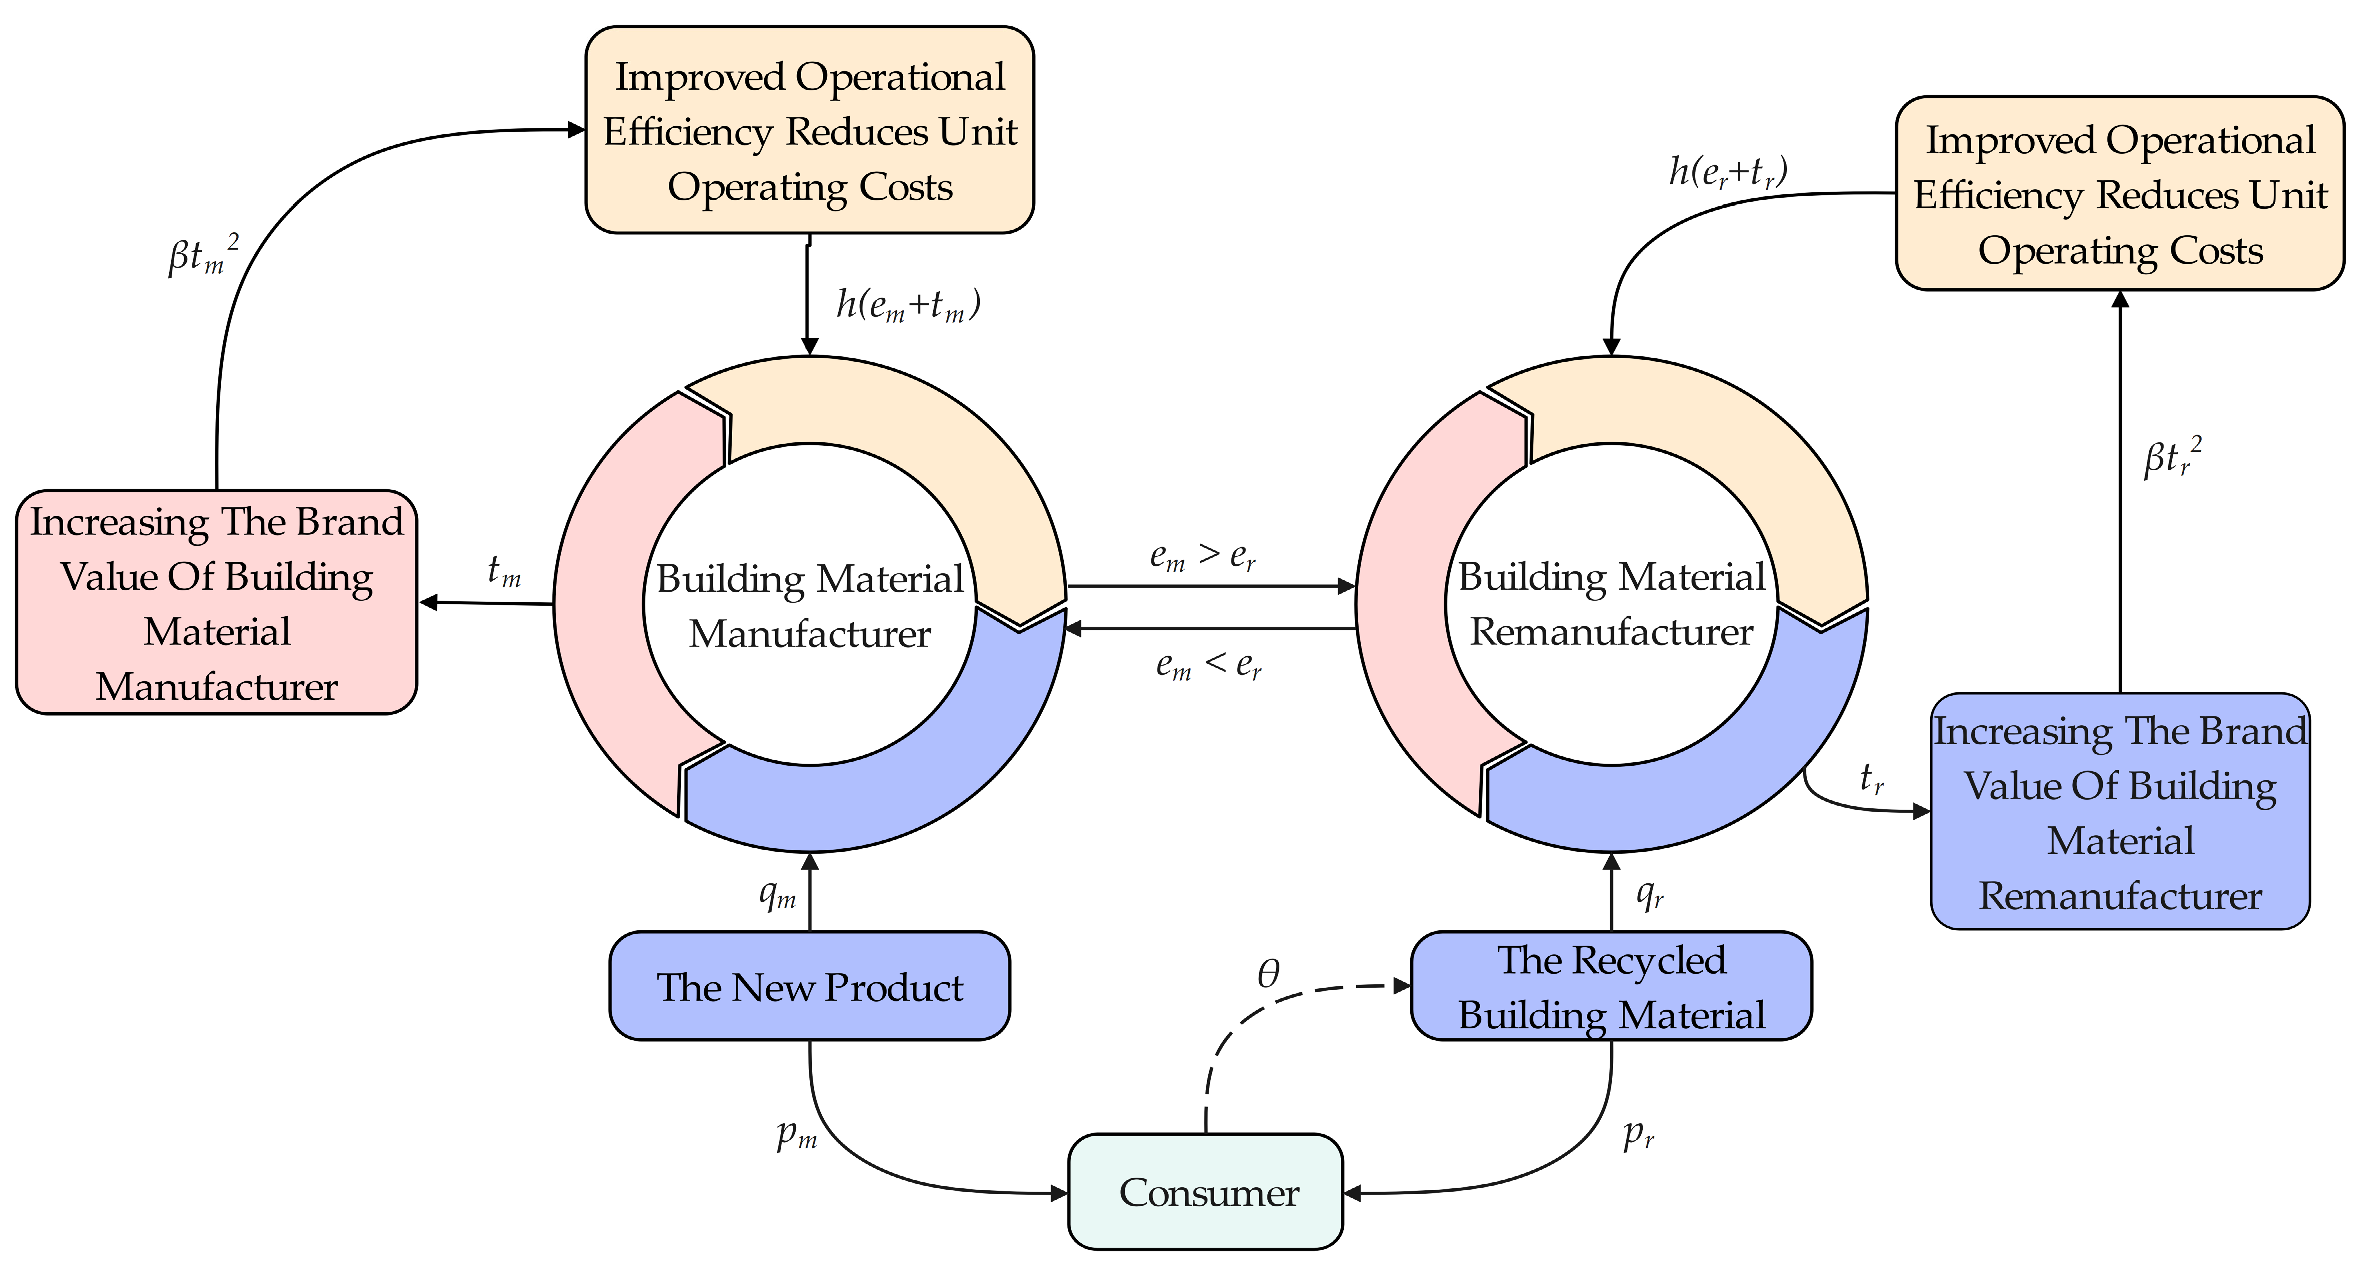
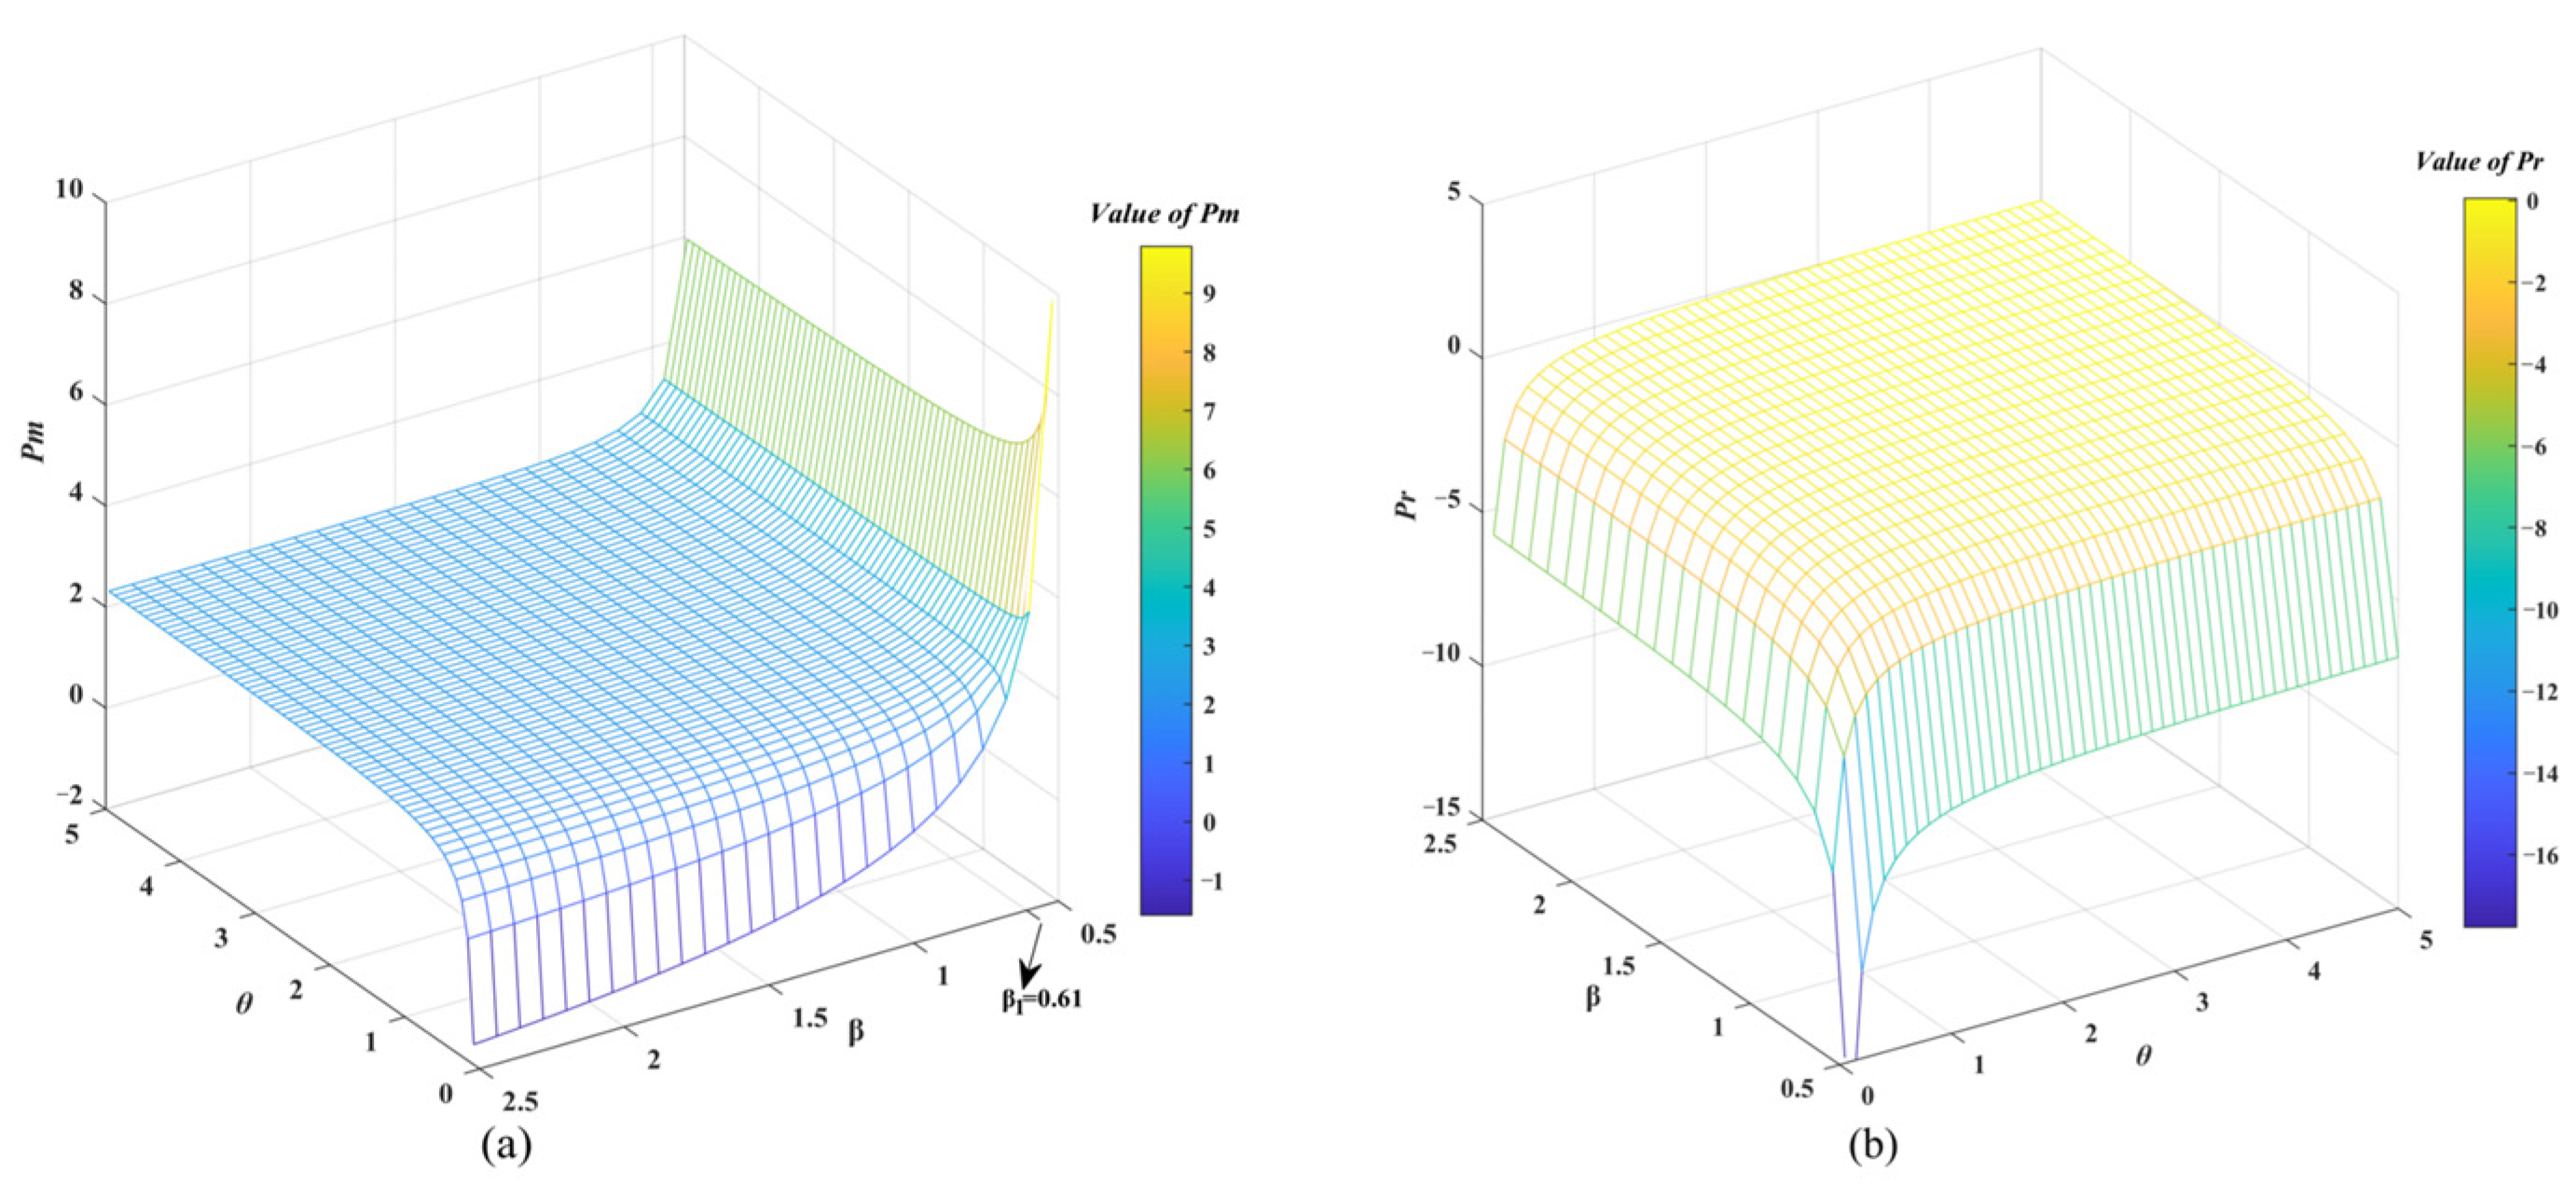
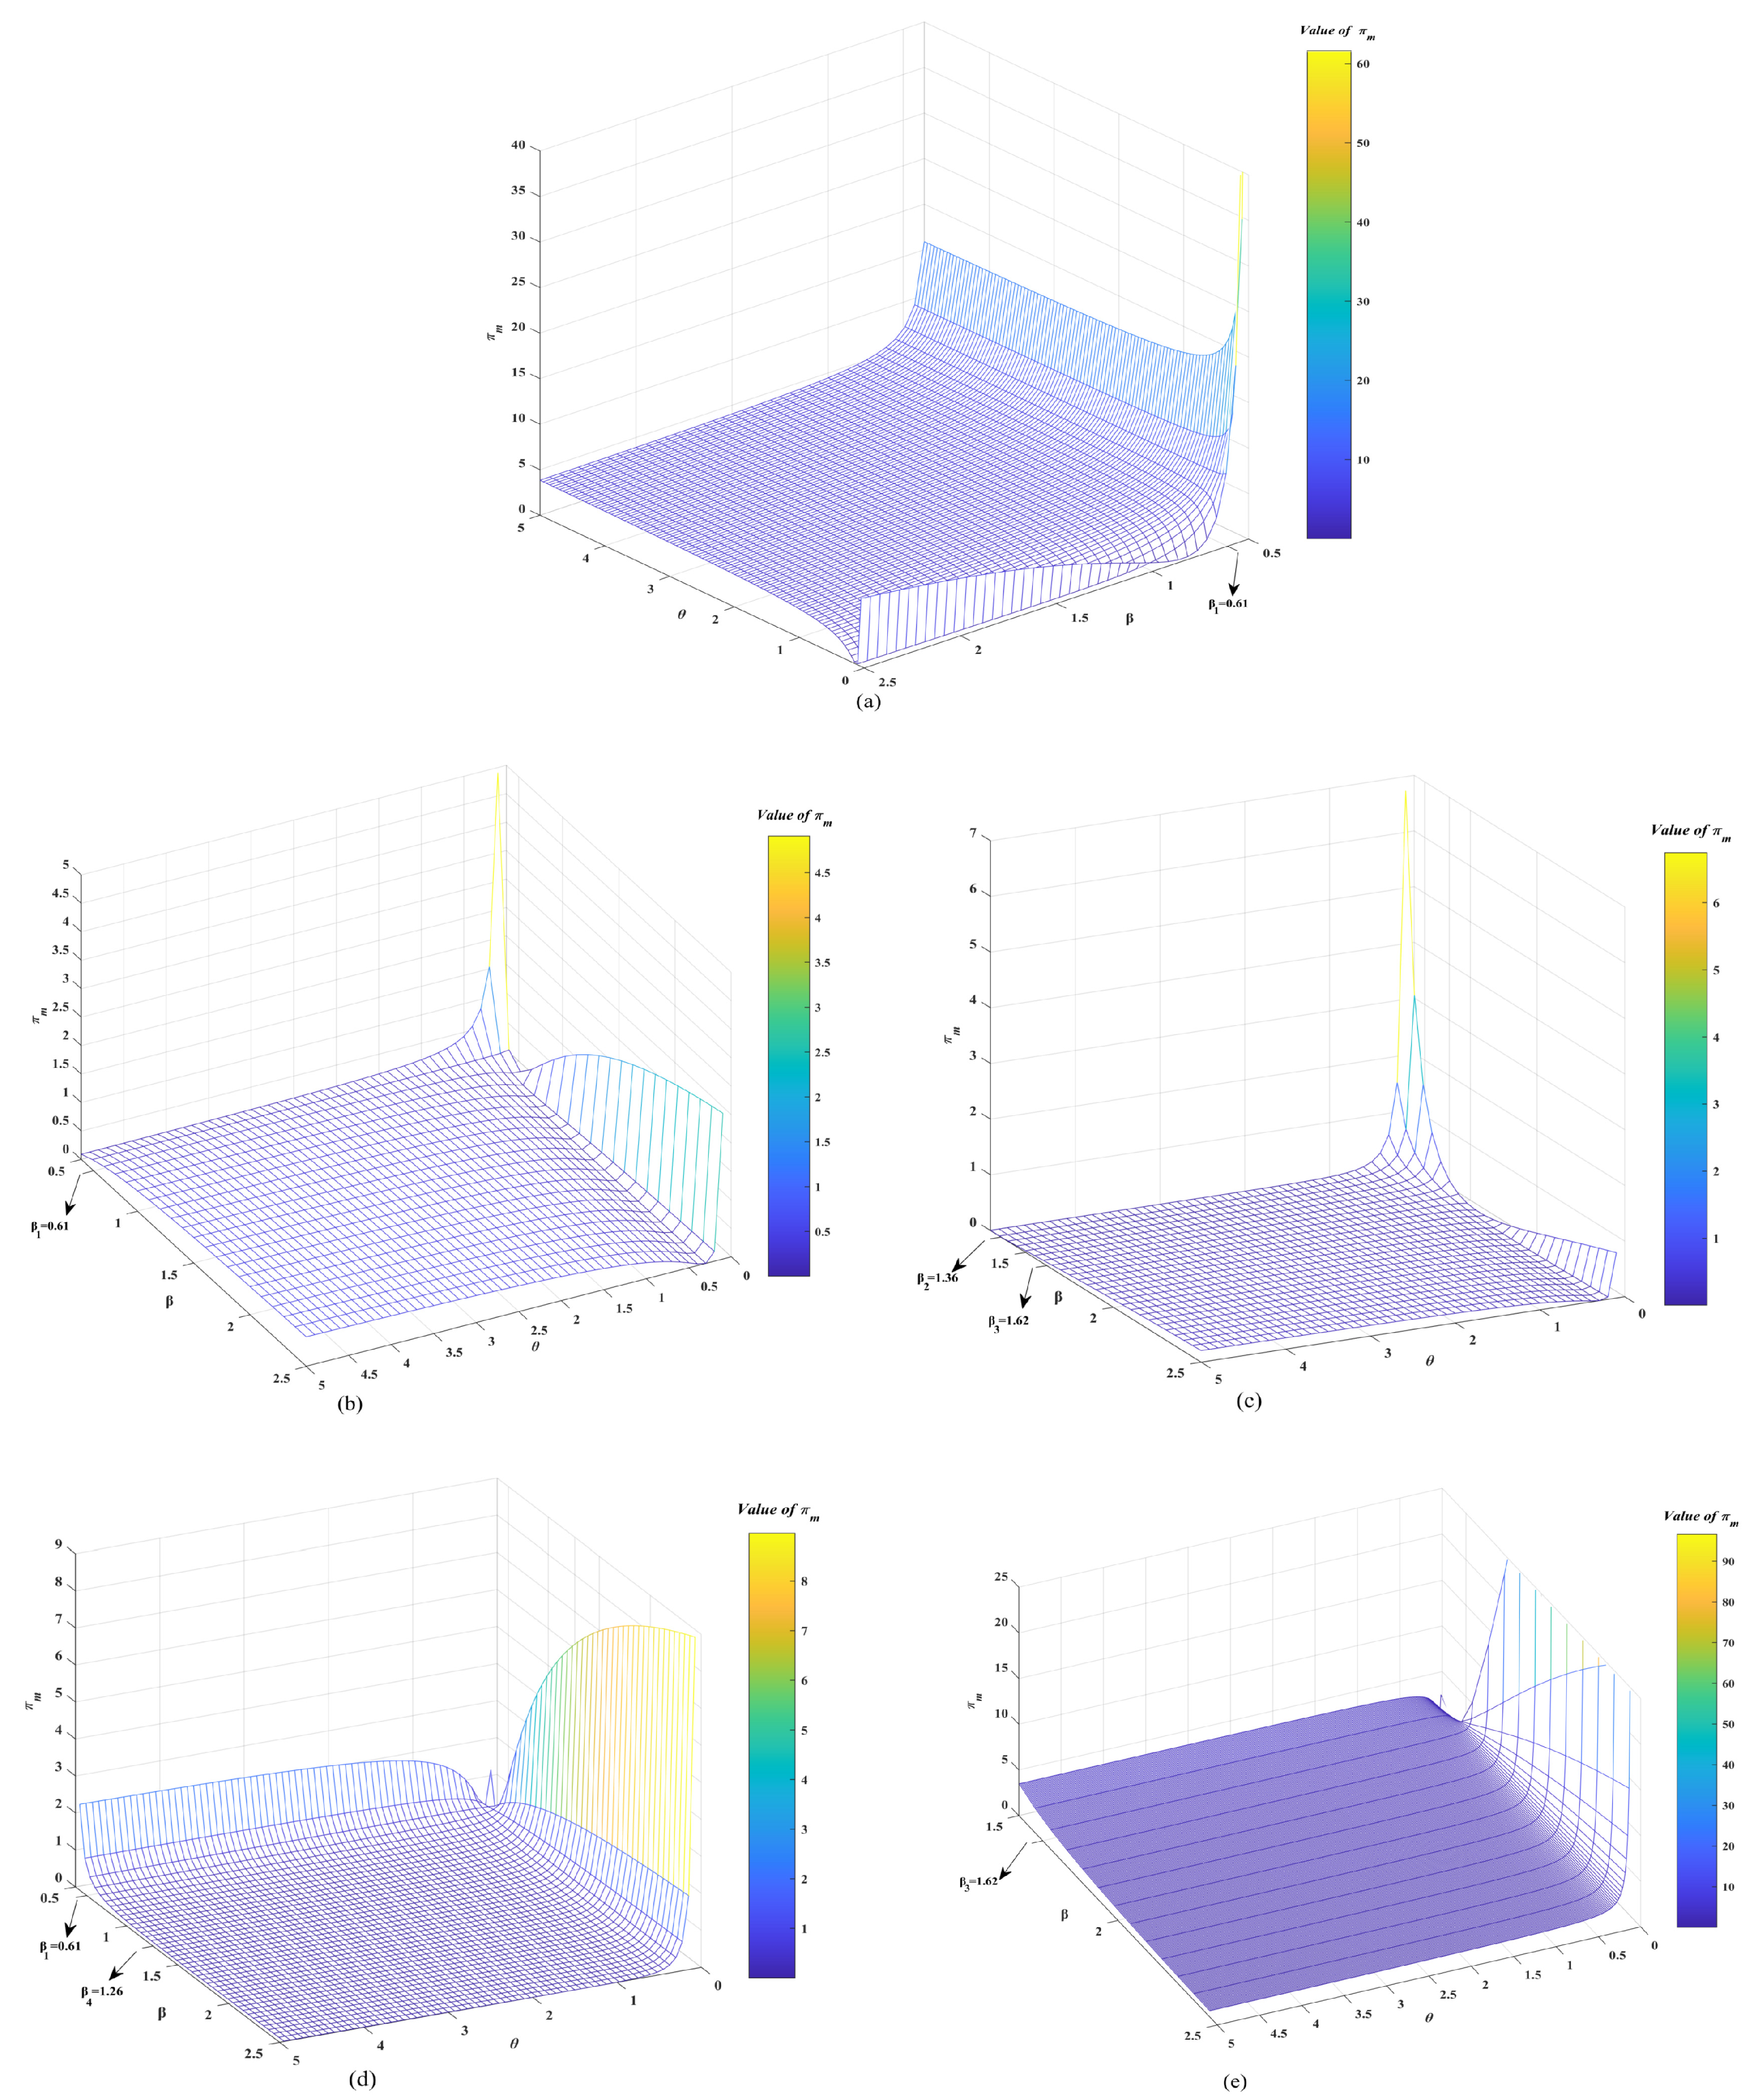
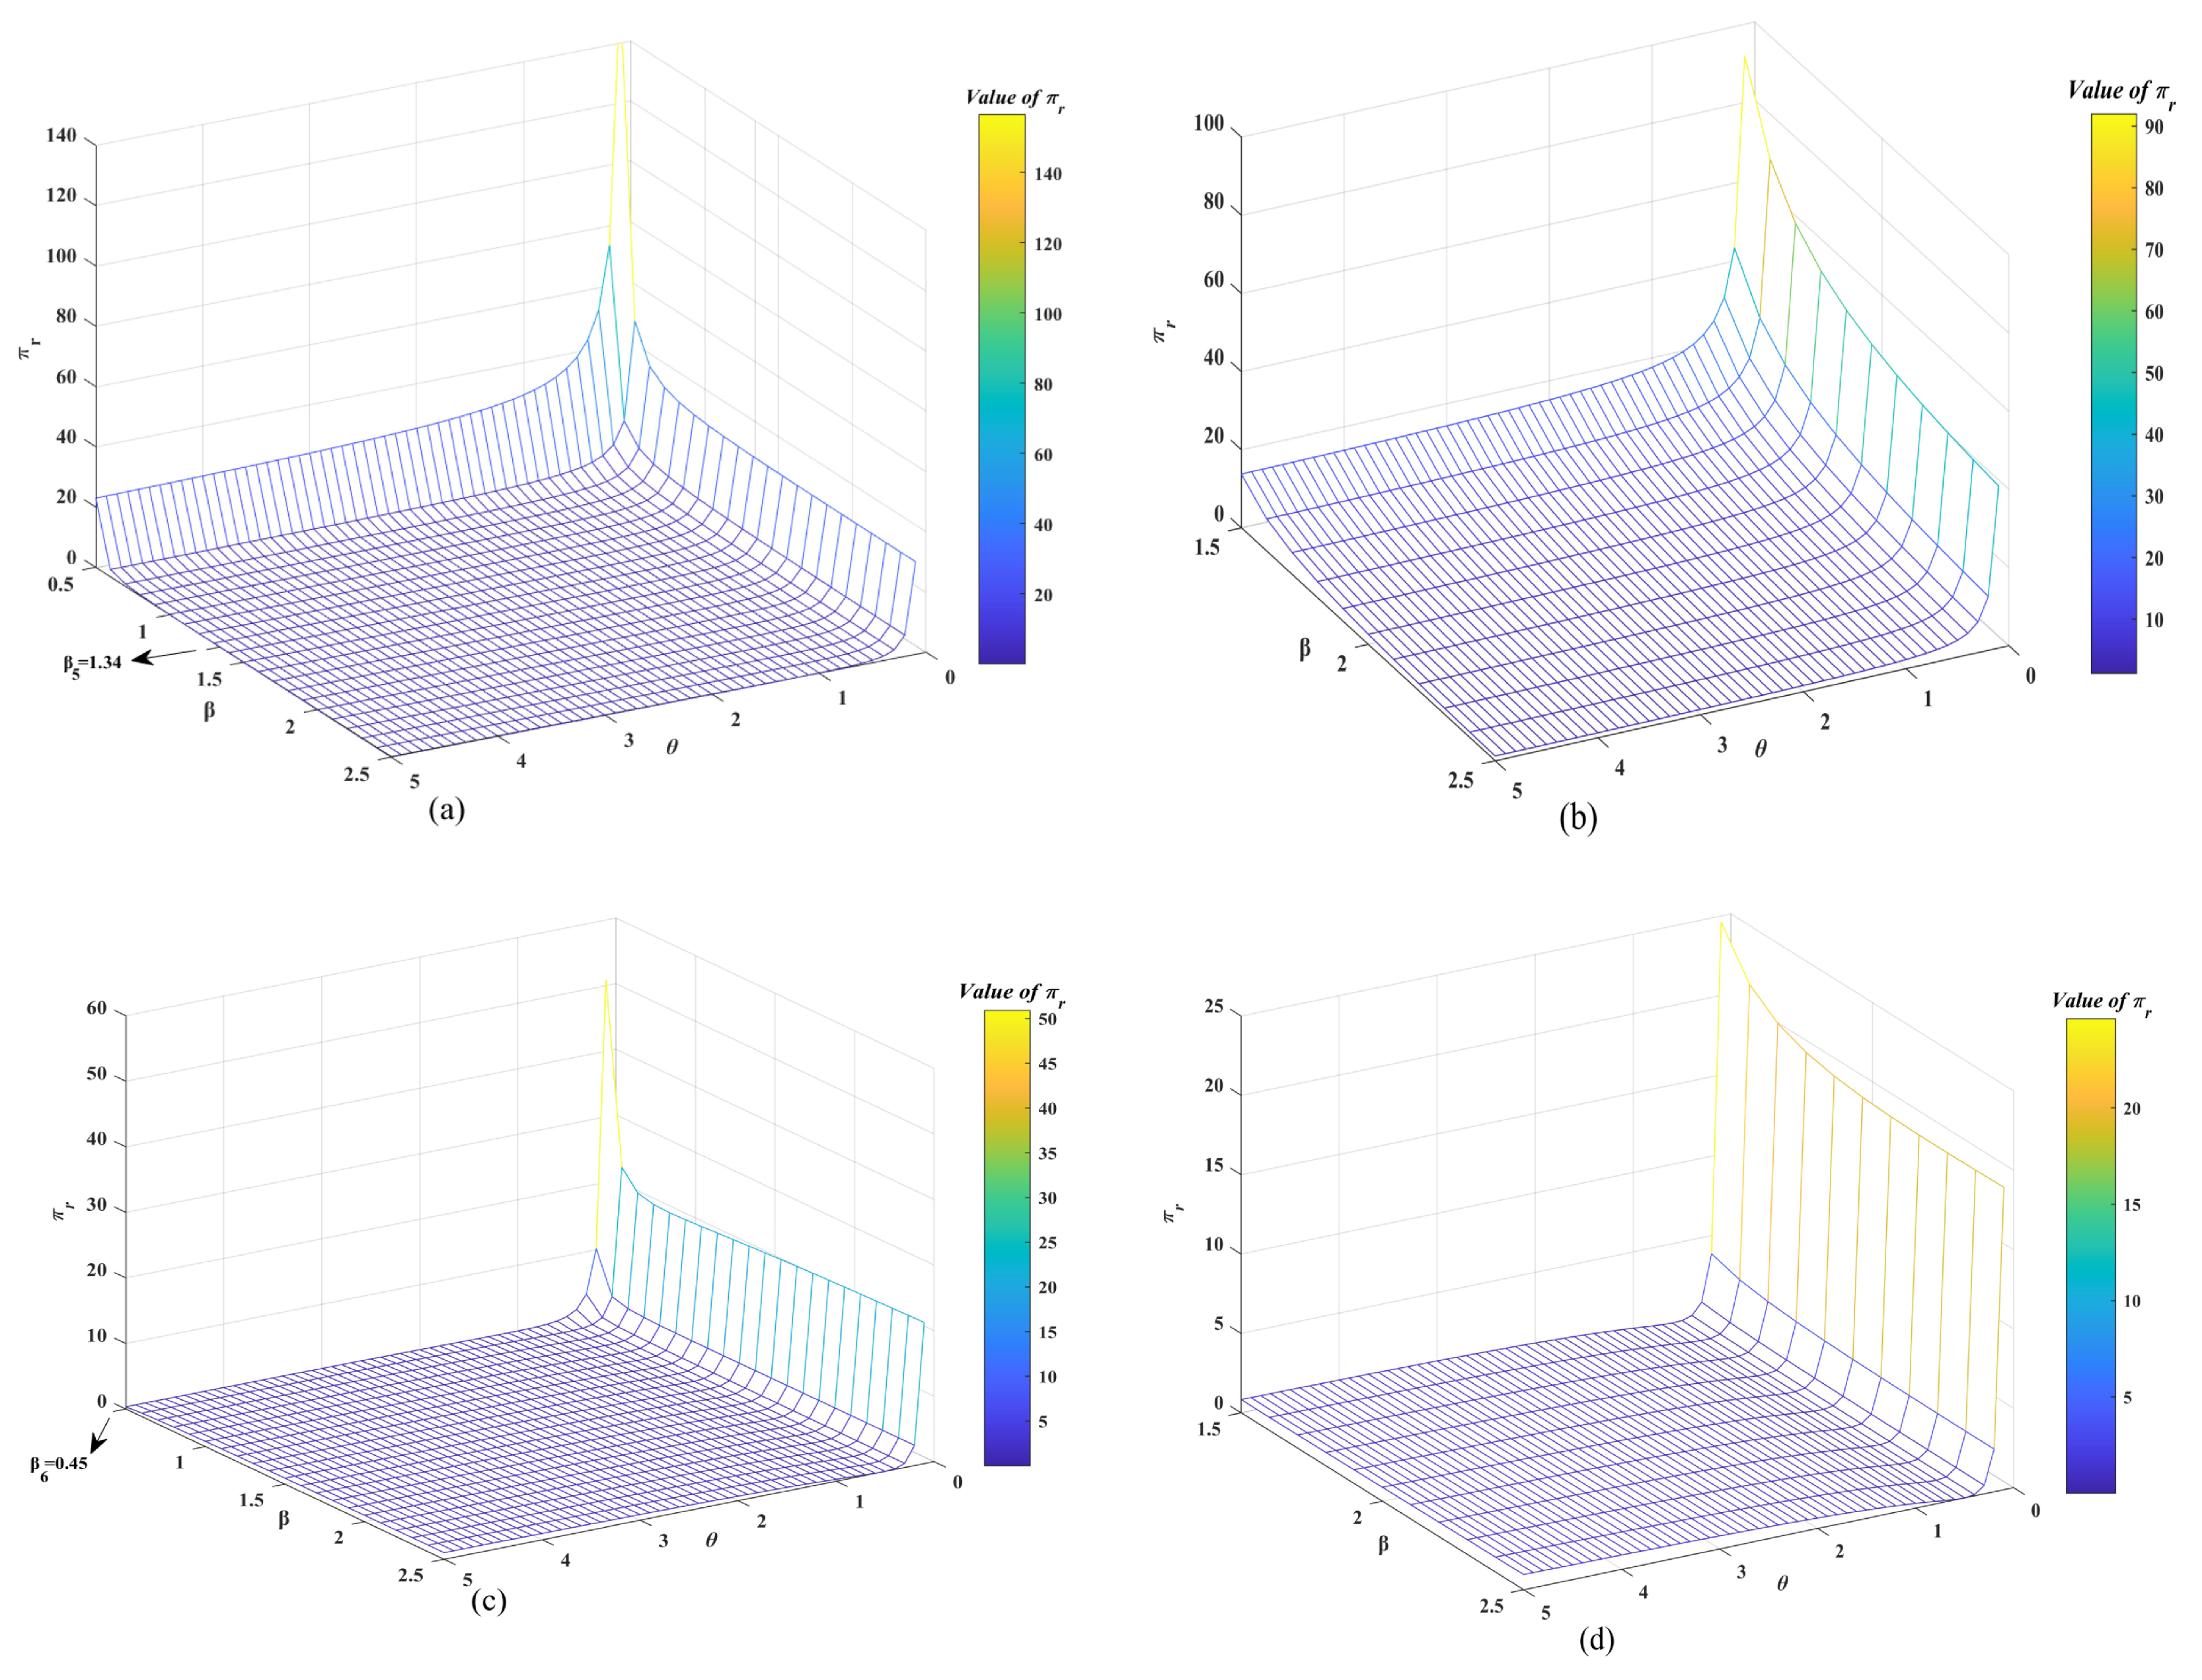
Disclaimer/Publisher’s Note: The statements, opinions and data contained in all publications are solely those of the individual author(s) and contributor(s) and not of MDPI and/or the editor(s). MDPI and/or the editor(s) disclaim responsibility for any injury to people or property resulting from any ideas, methods, instructions or products referred to in the content. |
© 2025 by the authors. Licensee MDPI, Basel, Switzerland. This article is an open access article distributed under the terms and conditions of the Creative Commons Attribution (CC BY) license (https://creativecommons.org/licenses/by/4.0/).