1. Introduction
As one of the world’s leading ports in terms of cargo throughput [
1], the container truck transportation network of the Ningbo-Zhoushan Port is not only the core support for the port’s daily efficient operations but also a critical link ensuring the smooth operation of the regional logistics system. With the development of information technology, particularly the application of the Global Positioning System (GPS), new data support and technical tools have been provided for analyzing the transportation characteristics of container trucks. With GPS technology, it is possible to track vehicle locations, speeds, and route selections in real time [
2]. Based on this, it is possible to systematically reveal the spatio-temporal characteristics of container truck operations, deepen understanding of the intrinsic relationship between container truck transportation behavior and port operations, and, compared to traditional methods, provide a more intuitive and comprehensive view of the dynamic changes in container truck transportation, thereby offering a more scientific basis for port management decisions [
3].
In addition, research and analysis of the spatio-temporal distribution characteristics of container truck transportation based on GPS data has immeasurable value for optimizing the port’s own operational management. It can not only optimize port operation scheduling and resource allocation and improve terminal operation efficiency, but also provide a scientific decision-making basis for government departments in areas such as transportation infrastructure planning [
4], smart port construction, and logistics policy formulation. Given this, conducting research on the spatio-temporal characteristics of container truck transportation, which combines theoretical innovation and practical guidance, can provide strong support for port operations management and government transportation planning and is of great significance for promoting the high-quality development of the Ningbo-Zhoushan Port and the entire regional logistics system.
As a critical link connecting maritime transport with inland logistics, the efficiency of port logistics systems directly impacts port competitiveness and regional economic development. In recent years, with the widespread adoption of positioning technology, vehicle trajectory analysis based on GPS data has provided a new research perspective for uncovering the spatio-temporal patterns of transportation activities. Domestic and international scholars have achieved significant results in studies on logistics vehicle behavior and the identification of urban freight travel characteristics, laying a methodological foundation for port container truck research. However, existing research on port container trucks—a specialized operational group—remains largely focused on scheduling optimization and route planning. Systematic empirical analyses of key issues such as their spatio-temporal distribution patterns, travel periodicity characteristics, and regional radiation structures during actual operations remain insufficient. Especially for the Ningbo-Zhoushan Port, an ultra-large composite port, the dynamic transportation characteristics of container truck flows under the backdrop of multi-port area coordination and cross-regional transportation remain unclear. Therefore, based on real trajectory data, it is essential to deeply explore the spatio-temporal characteristics of container truck transportation to provide new insights for port development.
This study follows the format of academic papers and conducts an in-depth analysis of the characteristics of container truck transportation at the Ningbo-Zhoushan Port. First, through a literature review, we summarize domestic and international research findings on the characteristics of logistics vehicle transportation and port logistics operations, identifying the progress and limitations of existing research to provide a theoretical foundation and research entry points for this study. Second, during the data processing phase, we perform preprocessing operations on the obtained container truck GPS trajectory data, including data cleaning, coordinate transformation, and origin-destination (OD) extraction, to ensure data quality and analysis reliability. Subsequently, the research methods employed are introduced, including the density-based DBSCAN algorithm and the Prophet time series forecasting model, to establish a scientific analytical framework. Based on the processed data and selected methods, the operational characteristics of container trucks at the Ningbo-Zhoushan Port are revealed across both temporal dimensions (such as daily peak travel times, monthly travel patterns, and vehicle departure and arrival time patterns) and spatial dimensions (such as the number of container trucks departing from the seven major regions of China, provincial-level, and municipal-level areas). Based on this, the study conclusions are summarized and analyzed, exploring the underlying driving mechanisms of these characteristics, with the aim of providing theoretical support and practical references for port logistics optimization and intelligent traffic management.
2. Literature Review
The growing importance of container trucks for efficient and sustainable freight transportation, coupled with heightened focus on port operational efficiency, has brought container truck transportation characteristics into widespread attention. Scholars in related fields have conducted valuable research. Previous studies on freight characteristics analysis primarily encompass three aspects: research on container truck traffic flow characteristics, investigations into the temporal fluctuations and periodic patterns of container truck traffic flow, and studies on the spatial distribution characteristics of container truck traffic flow and related network optimization. Specific analyses are as follows:
2.1. Analysis of Factors Influencing Container Truck Traffic Characteristics
Analysis of container truck traffic characteristics is crucial for optimizing port distribution systems and urban traffic management. It plays a vital role in accurately understanding the spatiotemporal distribution patterns, tidal characteristics, and node operational behaviors of container truck traffic, serving as the foundation for alleviating port-city conflicts and enhancing hub operational efficiency. In recent years, scholars have analyzed the influencing factors of container truck traffic from various perspectives. Zhu Z et al. and Jain V et al. employed machine learning and correlation classification models to predict conflicts in container truck traffic [
5,
6]. They, respectively, identified traffic density and speed, lane-changing frequency, and adjacent lane traffic volume as the most significant factors influencing conflicts [
5,
6]. Yang Y et al. adopted an environmental impact perspective, providing a novel dataset capturing large-scale individual truck movements during the COVID-19 pandemic [
7]. By leveraging mobile data and applying spatial statistical methods, the study quantified pandemic-induced changes in truck transportation demand structures, revealing complex interactions between factors that influenced and shaped behavioral shifts in inter-city truck transportation systems following the outbreak [
7,
8]. Cai J et al. and Gao Z et al. predicted freight demand across road networks under four truck access policies. Their approach combined origin-destination (OD) backcasting models with travel time, node flow, and road segment attributes [
9,
10]. Oka H et al. analyzed truck route data from the Tokyo Metropolitan Area Freight Survey to predict changes in freight traffic patterns under a specific policy scenario [
11]. These studies have established a multidimensional analytical framework for factors influencing container truck flows, laying a solid foundation for understanding the static structural characteristics of collection and distribution systems. However, critical issues such as the spatiotemporal evolution patterns of container truck flows, the temporal characteristics of node operations, and the coordination mechanisms of collective transport behavior remain under-explored. Therefore, shifting the analytical perspective from static structure to dynamic behavior is essential to deepen research on the spatiotemporal characteristics of port container truck flows. Precisely characterizing the spatiotemporal distribution patterns of container trucks and revealing their behavioral patterns will provide a scientific basis for optimizing port collection and distribution systems and alleviating port-city conflicts.
2.2. Research on the Temporal Fluctuation Characteristics and Periodic Patterns of Container Truck Traffic Flow
Research on the temporal fluctuation characteristics and periodic patterns of container truck flows holds critical significance for enhancing the efficiency of port distribution systems and regional traffic management. Consequently, some experts have conducted relevant studies. Wang Z et al. analyzed the relationship between truck flow and point speeds across sections of expressways [
12]. Using a K-means clustering combined with a regression method to segmentally predict travel times, they found exponential regression provided the best fit for the travel time-speed-density relationship [
12]. Kourounioti I et al. developed a time-of-day (TOD) model for import container pickup times using readily accessible data from Terminal Operating Systems (TOS) [
13]. This model calculates the probability of truck arrival times, thereby enhancing feeder transport efficiency [
13]. Guo J et al. constructed an integrated framework incorporating trajectory matching, carbon emission estimation, and spatial clustering analysis to systematically identify spatiotemporal evolution patterns of carbon dioxide (CO
2) emissions within port transportation networks, thereby characterizing temporal operational features of vehicle movements [
14]. Tao Y et al. analyzed the temporal characteristics of vehicle arrivals at port container terminals to address pollutant emissions caused by traffic congestion [
15]. Their study revealed the temporal fluctuations of container truck flows from multiple perspectives, providing crucial insights into the temporal patterns of port feeder systems [
15]. However, existing research remains limited by the absence of integrated analysis combining temporal characteristics with spatial distribution, making it difficult to comprehensively grasp the dynamic operational features of the feeder system. Therefore, to gain a deeper understanding of the operational patterns of port feeder systems, integrated research on the spatiotemporal characteristics of truck traffic flow is necessary to more fully reveal the dynamic behavioral patterns of port feeder systems.
2.3. Research on Spatial Distribution Characteristics of Container Truck Traffic and Related Network Optimization
Research on the spatial distribution characteristics and network optimization of container truck flows holds critical significance for enhancing the efficiency of port feeder systems and alleviating regional traffic pressure. It provides valuable decision support for port land-side road network planning and freight corridor management. Ma Y et al. and Tahlyan, respectively, employed the QuickBundles algorithm and BFS-LE algorithm to analyze vehicle trajectory data, identifying distinct route selection patterns to provide drivers with more scientifically effective travel routes [
16,
17]. Shi W et al., Kong X et al., and Toledo T et al. analyzed vehicle travel characteristics based on location-based services (LBS) travel preferences and the impact of highway tolls on route selection [
18,
19,
20]. Gao Z et al. and Huang Y et al. delved into the characteristics and evolutionary patterns of freight networks by examining the inter-city freight networks in the Yangtze River Delta and Zhejiang Province, respectively, providing theoretical support for optimizing regional freight networks [
21,
22]. Zhang L et al. and Yang Y et al. employed complex network methods to characterize freight transportation from multidimensional perspectives using freight truck trip data, supporting sustainable freight practices and alignment with environmental objectives [
23,
24]. Similarly, Liu Z B et al. analyzed structural features of inter-city freight connection networks using social network methods based on truck freight information from the “First Logistics” platform [
25]. Yitao Y et al. employed complex network analysis to examine large-scale freight truck travel data from Chinese cities, empirically reconstructing and characterizing urban freight truck mobility networks while revealing underlying spatial interaction patterns [
26]. While these studies clearly delineate the static structure of feeder systems and reveal the static characteristics of freight networks, port feeder systems are dynamic entities. They fail to fully capture the specific transport behavior patterns of container trucks operating within these freight network structures. Therefore, to investigate the actual operational efficiency of the Ningbo-Zhoushan Port collection and distribution system, analyzing only the spatial distribution of container trucks and network structure is far from sufficient. It is essential to further analyze the individual and collective behavioral characteristics of container trucks within the transportation network.
Although significant progress has been made in analyzing container truck traffic characteristics, covering aspects such as identifying influencing factors, temporal fluctuation patterns, and spatial distribution features, existing research has remained fragmented. Studies have tended to analyze temporal and spatial aspects of container truck traffic characteristics in isolation, lacking a research paradigm that integrates spatiotemporal dimensions [
27]. This limitation has hindered a deeper understanding of the internal operational mechanisms within port logistics systems and the exploration of potential improvement opportunities [
28]. Additionally, regarding model selection, this study employs the DBSCAN algorithm and Prophet model instead of the complex networks, trip partitioning algorithms, and ARMA models used in previous research. This aims to jointly construct an analytical framework capable of synergistically resolving spatio-temporal complexity. DBSCAN precisely delineates spatial hotspots and anomalous trajectories in container truck transportation through its ability to identify irregularly shaped clusters and noise. Meanwhile, the Prophet model clearly reveals daily and weekly fluctuation patterns in transportation activities by decomposing multi-periodic time series. Their synergistic application overcomes limitations of traditional methods in handling spatial heterogeneity and temporal nonlinearity. The core contribution lies in providing a robust and efficient analytical paradigm for deeply deconstructing the spatiotemporal dynamics of port logistics systems. Applying this framework to analyze the spatiotemporal characteristics of container truck transportation at the Ningbo-Zhoushan Port further clarifies the temporal and spatial patterns of container truck operations.
3. Data Sources and Processing
3.1. Data Sources
For research on port logistics transportation characteristics, the reliability and representativeness of data sources form the critical foundation for ensuring the scientific validity of research conclusions. In this study, data were sourced from a third-party information platform specializing in GPS tracking of port container truck movements. Data was selected from the one-month period spanning 27 October to 26 November 2024. This timeframe was chosen based on a thorough consideration of port operational patterns: it avoids the impact of major holidays on the logistics system while also circumventing strong seasonal interference. This provides an ideal observation period for capturing baseline operational characteristics under relatively stable conditions. This period better captures the daily patterns and characteristics of port container truck logistics. Furthermore, the study analyzed the movement data of over 5000 logistics vehicles, with nearly 290,000 total trips recorded during the research period based on origin-destination (OD) data extraction. These vehicles were extensively distributed across various transportation nodes and routes within the Ningbo-Zhoushan Port, enabling a multifaceted reflection of port container truck transportation activities from different angles and levels. Moreover, the selected information platform holds a significant share in the cargo collection and distribution system of Ningbo-Zhoushan Port, with its core business focused on the highway trunk freight sector. Therefore, the collected data possesses considerable representativeness in reflecting the characteristics of port container truck logistics transportation at Ningbo-Zhoushan Port.
3.2. Data Preprocessing
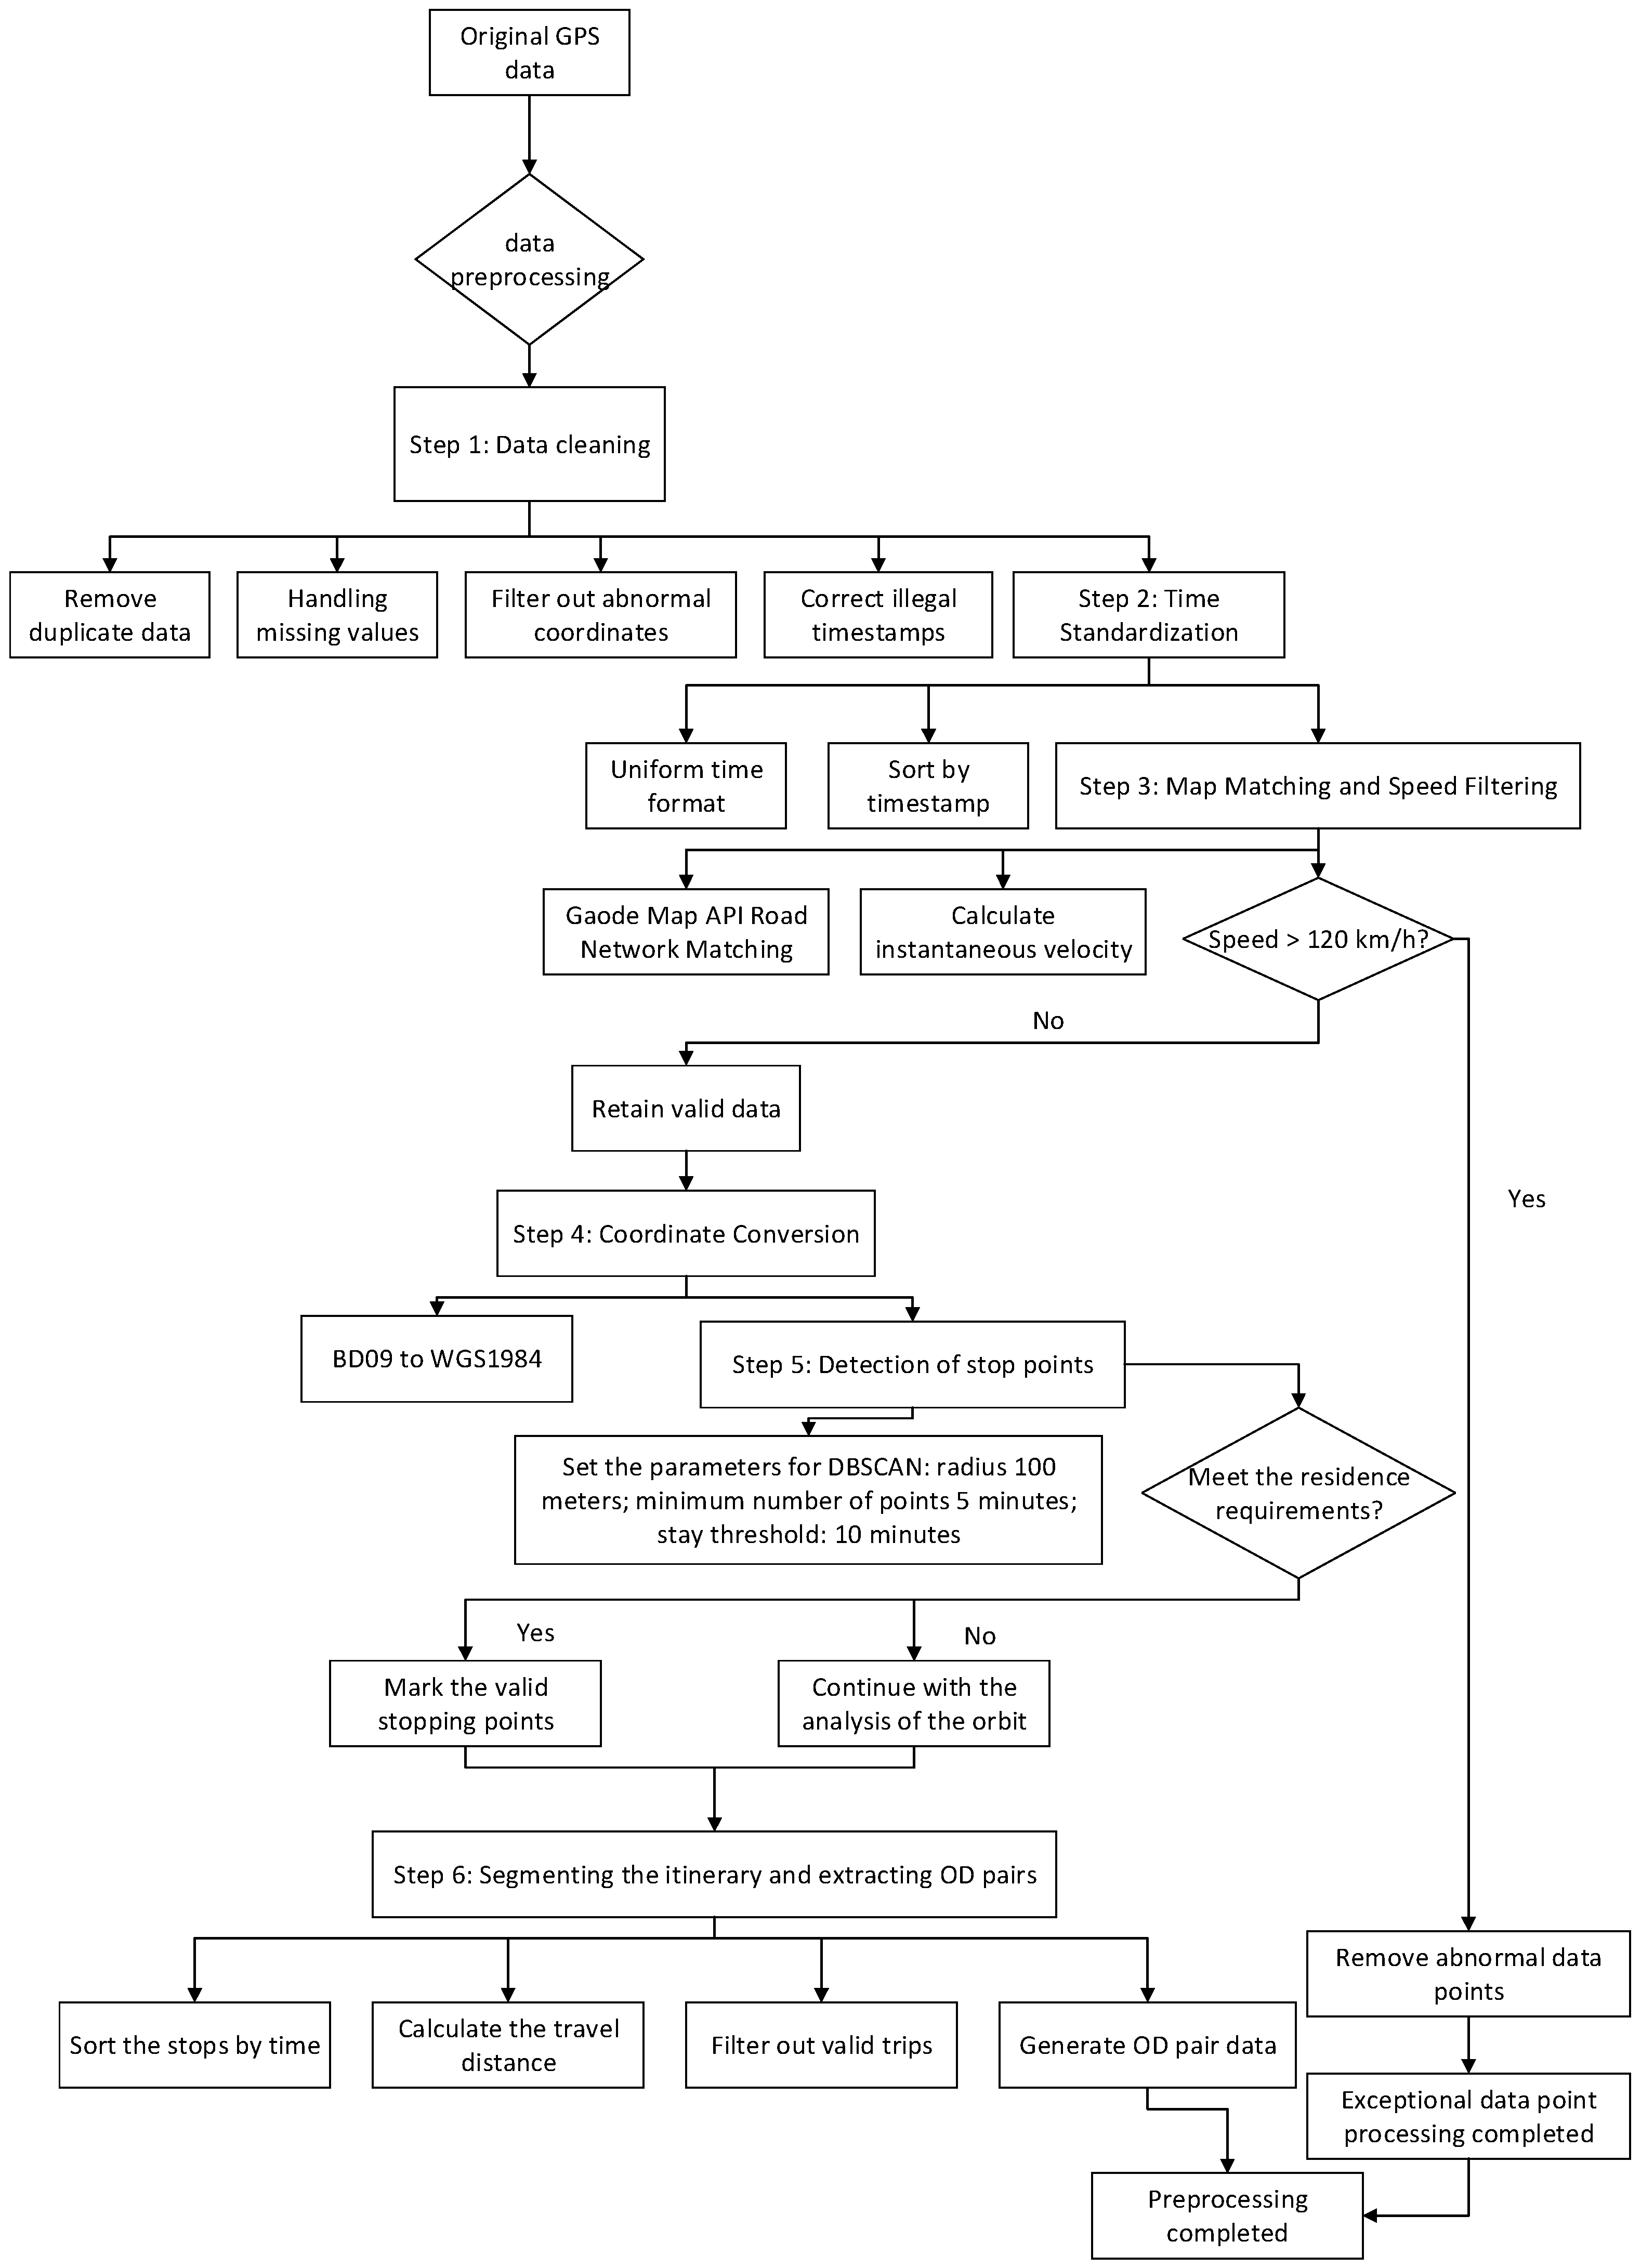
To ensure the accuracy and reliability of analysis results based on GPS trajectory data, rigorous preprocessing of raw data is essential. The raw GPS data used in this study was sourced from the Ningbo-Zhoushan Port third-party information platform, covering a one-month time span. The initial dataset comprised approximately 55 million records. Due to GPS device performance variations, urban canyon effects, and signal transmission interference, the raw data contained numerous unreasonable entries caused by “signal drift”, “recording gaps”, “timestamp discrepancies”, and “coordinate jumps” [
29]. If left unaddressed, these data quality issues would directly compromise the accuracy of subsequent analyses, including journey speed calculations, stop point identification, and origin-destination (OD) pair extraction. To address this, this study designed a systematic data preprocessing workflow, with the specific steps outlined below, the specific process is shown in
Figure 1.
Step 1: Data cleansing involves removing invalid or erroneous records, such as duplicates, missing values, anomalous coordinates, and invalid timestamps. Specific procedures include the following: eliminating duplicate records by removing identical entries based on key fields like vehicle ID and timestamp; handling missing values by checking and deleting records lacking critical information (e.g., timestamps, latitude/longitude coordinates); identifying and filtering outliers, which encompasses the following. Invalid coordinates: remove latitude/longitude data clearly outside the study area (e.g., mainland China) or physically impossible locations. Invalid timestamps: rRemove records with timestamps in the future or far earlier than the data collection period. For common GPS issues like signal drift or discontinuities, these can be identified and filtered by setting reasonable thresholds. Additionally, preliminary calculations of vehicle speed are performed, with a threshold set at 150 km/h.
Step 2: Time standardization involves unifying the format of time fields and converting them to a consistent time zone as required by the study. Additionally, the data is sorted in ascending order based on license plate numbers and timestamps to ensure the correct temporal sequence of the data.
Step 3: Using the Amap API, match the vehicle GPS data with the city road network, calculate the vehicle’s speed at each time point based on the GPS time and corresponding latitude and longitude, and compare it with the maximum speed limit specified in relevant regulations (not exceeding 120 km/h). If any V >= Vmax120 km/h, the record is deleted; otherwise, it is retained.
Step 4: Coordinate conversion. The original data used in this study are in the BD09 coordinate system. To facilitate spatial analysis and integration with geographic information systems, it must be uniformly converted to the standard WGS1984 coordinate system.
Step 5: Detect points. Set the DBSCAN clustering radius (100 m), the minimum number of points (the number of trajectory points within 5 min), and the time threshold (10 min). Analyze the trajectory data to determine if it meets the above conditions. Use the density-based DBSCAN algorithm to filter out valid [
30].
Step 6: Trip segmentation and origin-destination (OD) data extraction. Arrange the stay points in chronological order, calculate the distances between adjacent stay points, filter out valid trips, and record the start/end times, origin/destination coordinates, distances, and durations to generate OD pair data.
4. Research Methods
4.1. Trajectory Clustering Analysis—DBSCAN Algorithm
To identify high-frequency driving paths and hotspot areas for container trucks, a density-based spatial clustering algorithm (DBSCAN) was employed. Compared to other clustering algorithms, the DBSCAN density-based clustering algorithm offers several advantages: (1) It does not require pre-specifying the number of clusters, reducing human subjectivity and fully uncovering the inherent patterns within the data; (2) It can identify clusters of arbitrary shapes, not just spherical ones, making it more practical. Therefore, based on the above factors, the DBSCAN density clustering algorithm was selected as the research method for identifying spatial features of the Ningbo-Zhoushan Port [
26,
31]. It forms clusters by defining a neighborhood radius (
) and a minimum number of points (
). For any point
, if there are at least
points within its
neighborhood, the point is marked as a core point, and all points within its
neighborhood are assigned to the same cluster. This method effectively identifies high-frequency travel paths and hotspot areas for container trucks. The formula is expressed as follows:
where ‘
’ is the dataset containing all trajectory points, ‘
’ is the neighborhood radius, and ‘
’ is the minimum number of core points. The specific steps are shown in
Figure 2.
In applying the DBSCAN algorithm to process port container truck trajectory data, the settings of parameters and critically influence clustering effectiveness. Through multiple experiments and parameter scans, combined with contour coefficient and clustering stability assessments, this paper ultimately determines the optimal parameter combination for this dataset. Experimental results indicate that optimal clustering is achieved when the clustering radius is set to 100 m, and the minimum number of stay points is set to 5 min of trajectory points, with a data collection frequency of 4–5 times per minute. Under this parameter combination, the contour coefficient reaches 0.53, indicating both intra-cluster compactness and inter-cluster separation are at satisfactory levels. To balance clustering granularity and noise tolerance, internal evaluation metrics—the Calinski-Harabasz index and Davies-Bouldin index—were further employed to quantitatively assess clustering quality and validate the reliability of DBSCAN results. Combined with contour analysis, the compactness and separation of each cluster structure were validated to ensure that the identified paths and regions possess practical physical significance and statistical significance. Model validation results indicate that DBSCAN can stably identify representative travel paths and hotspot areas on this dataset, with clustering results meeting research expectations.
4.2. Time Series Model—Prophet Model
The Prophet model is a model built using the pySTAN module for structural assessment and function fitting [
32,
33]. Its advantages include fast fitting speed, automatic handling of partially missing values, good adaptability, easy adaptation to seasonal changes, and relatively accurate predictions. The prediction model has flexible parameter settings. When analyzing freight characteristics based on past truck GPS transportation trajectories, the Prophet model, through its unique time series decomposition method, can accurately capture transportation volume changes within a day and vehicle travel volume fluctuations at the beginning, middle, and end of a month. The basic form of this model is:
Among these, represents the time series value at time ; denotes the trend function, used to simulate non-periodic changes in the time series, including saturated growth models and piecewise linear models; signifies the seasonal component, reflecting periodic variations within the time series; indicates the holiday component, representing the anomalous impact of specific holidays or events on the time series; denotes the error term, accounting for any idiosyncratic changes not explained by the model, and is assumed to follow a normal distribution.
The trend component (
) describes the long-term upward or downward trend of the data over time. Prophet supports two growth patterns: linear growth and logistic growth. In the linear growth pattern, the trend can be expressed as:
Here is the growth rate, which is the change in the trend at a specific time point , reflecting any potential trend jumps. This method is particularly suitable for handling sudden changes in trends caused by market fluctuations or other external factors.
The seasonal component
is used to identify and model periodic fluctuations in the data, such as daily or weekly regular changes. Prophet uses the Fourier series to approximate these complex periodic patterns, with the specific expression as follows:
where
and
are Fourier coefficients,
is the period length (e.g., for weekly effects,
), and
is the Fourier order, which determines the model fitting complexity. In this way, Prophet can flexibly adapt to different periodicity requirements, accurately capturing transportation volume changes across different phases within a day or month.
, on the other hand, accounts for the impact of special dates on transportation volume, such as public holidays or company-specific event days. This effect can be modeled using an additional regression variable:
is a 0/1 vector indicating whether it is a holiday, and are parameters associated with each holiday. By introducing this component, the Prophet model can more accurately reflect the specific impact of holidays on transportation volume in actual operations.
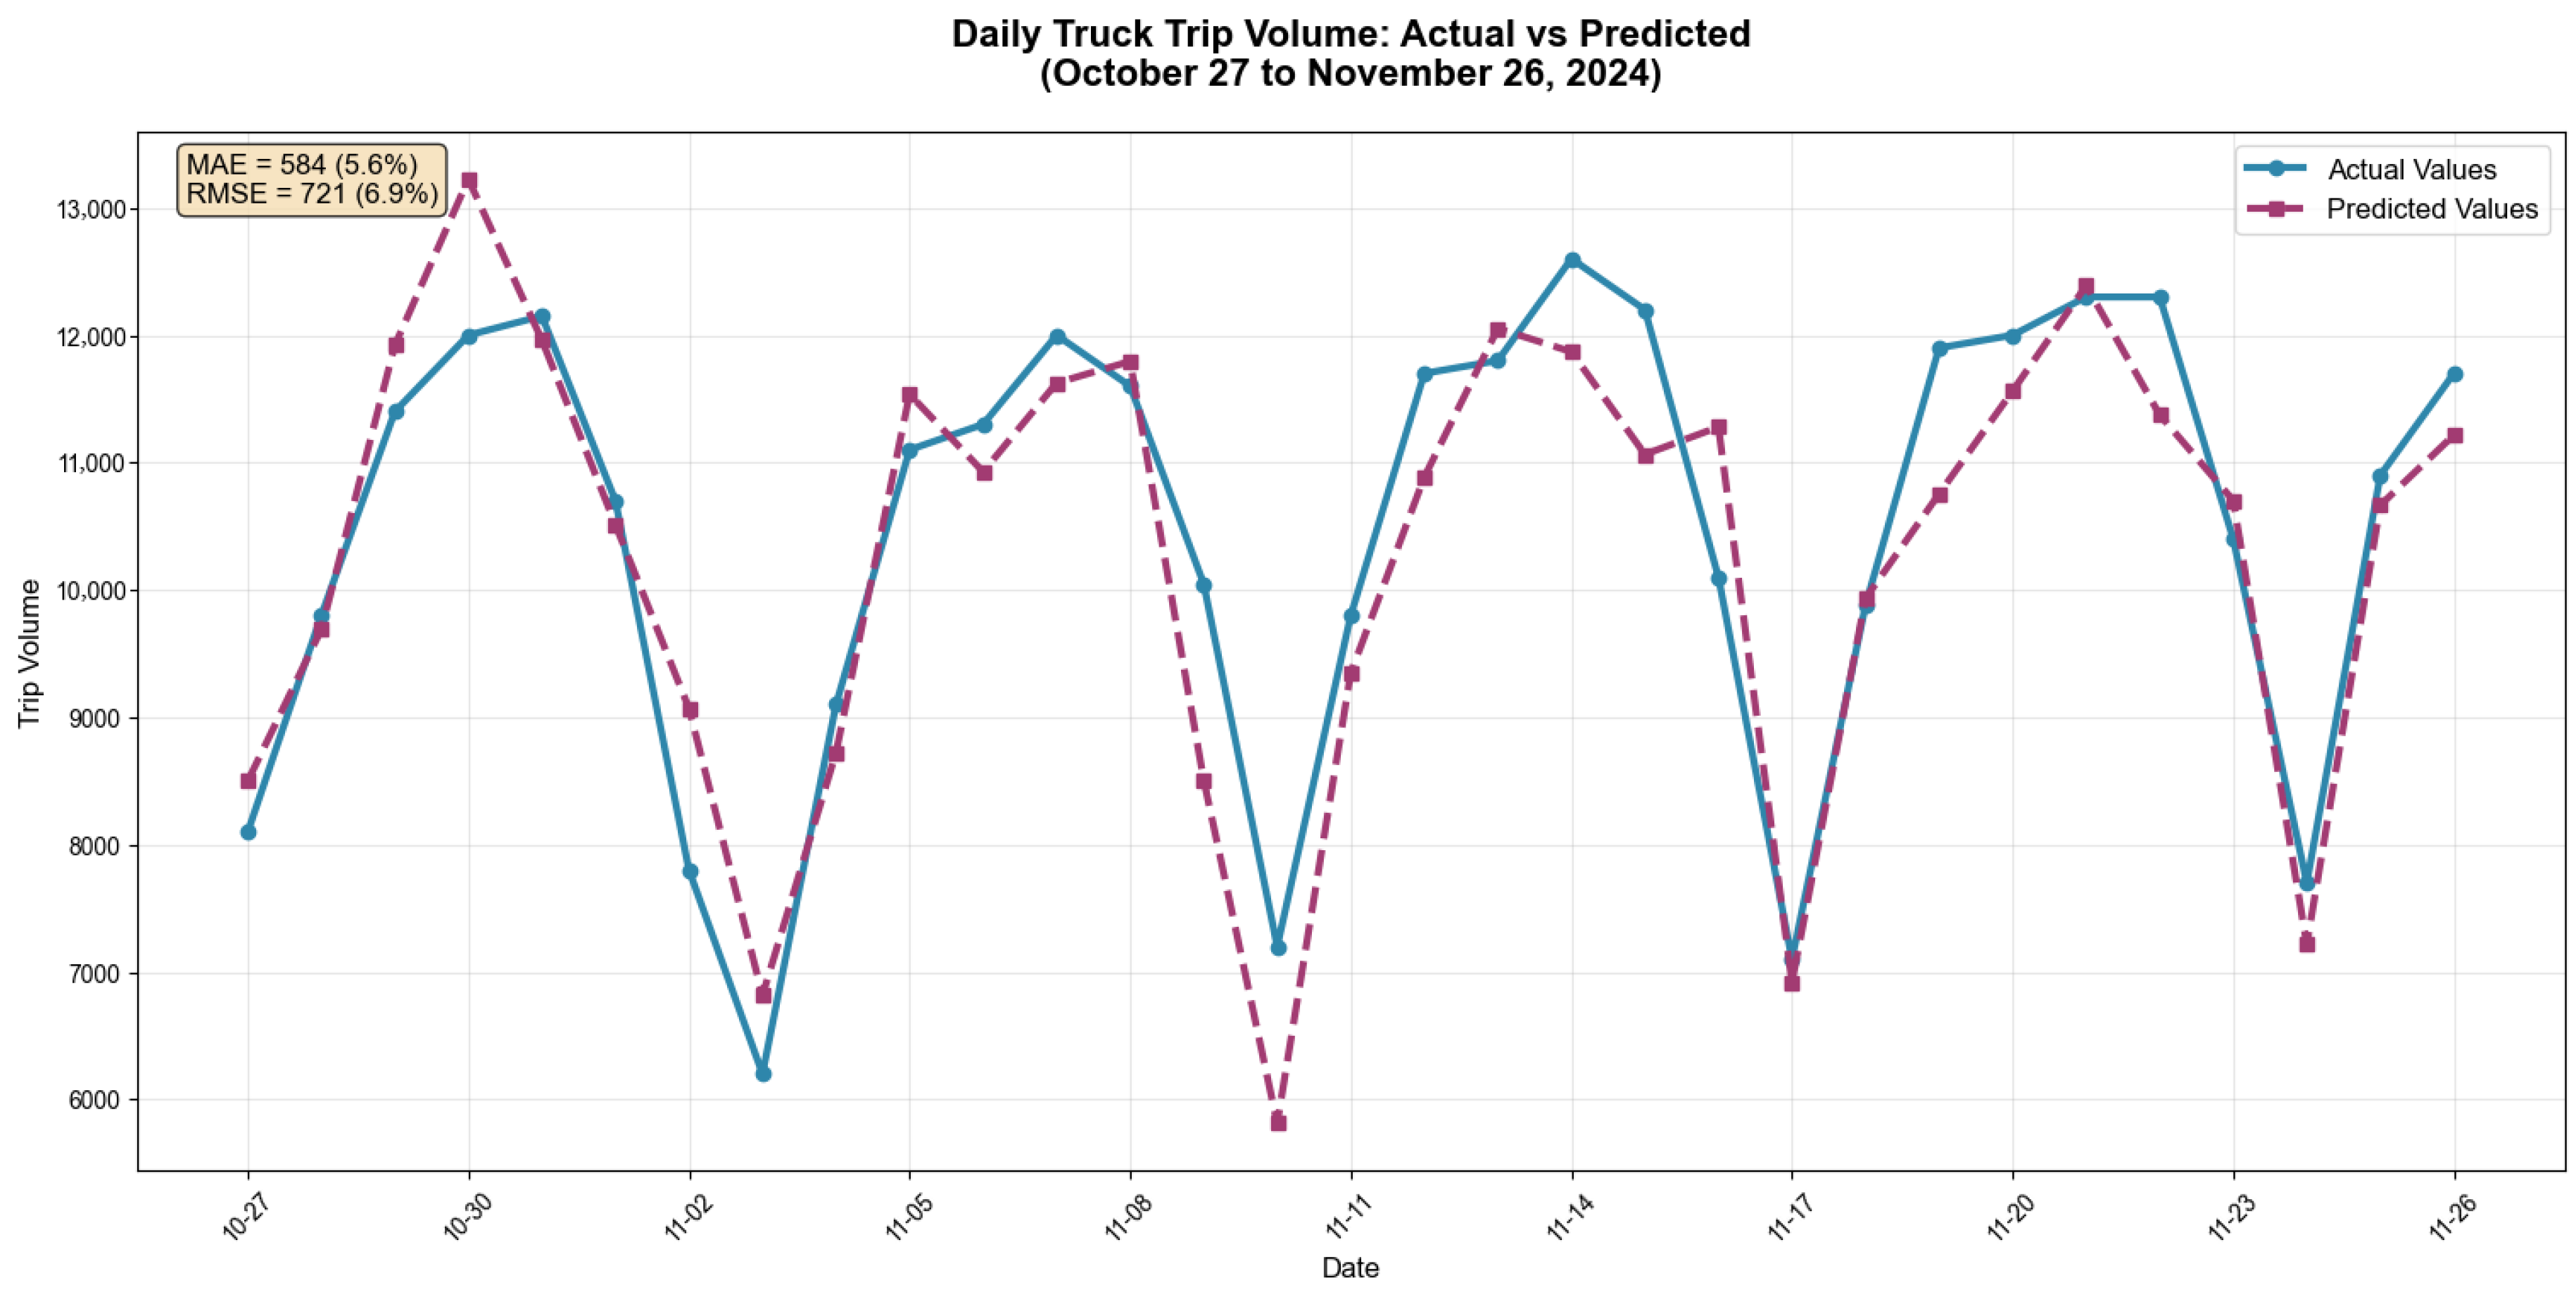
In this study, the prediction results of port container truck time characteristics based on the Prophet model underwent systematic validation, demonstrating high predictive accuracy. As shown in
Figure 3, the model achieved a Mean Absolute Error (MAE) of 584 and a Root Mean Square Error (RMSE) of 721. Using the daily truck trip volume of approximately 9000 as a baseline, the MAE accounted for 5.57% and the RMSE accounted for 6.88% of the mean. This indicates that the model’s predictions maintained high consistency with actual observations for the vast majority of time periods, with errors concentrated within a narrow range. Further residual analysis reveals no significant systematic bias or autocorrelation in the prediction errors, validating the model’s stability in time series decomposition. In summary, the Prophet model demonstrates reliable fitting capabilities, with error levels meeting practical requirements for port logistics data forecasting, though room for further optimization remains.
5. Characteristics of Container Truck Transportation from the Ningbo-Zhoushan Port
5.1. Spatial Distribution Characteristics of Container Truck Trips from the Ningbo-Zhoushan Port Area
This paper takes container trucks in the Ningbo-Zhoushan Port as the research object and focuses on analyzing the spatial distribution characteristics of their travel activities. The density-based DBSCAN clustering algorithm is used to extract origin-destination pairs (OD pairs) [
26,
34]. During the entire transportation process, the starting point or destination of container trucks typically has specific functional attributes, primarily including port terminals, cargo yards, warehouses, and factories, among other logistics nodes. To accurately identify the origin-destination (OD) relationships of container trucks [
35,
36], this study identified valid trips from the original GPS trajectory data based on the set stay time threshold and spatial buffer radius threshold [
37,
38], and extracted OD data at the prefecture-level city granularity. Spatial distribution analysis of origin and destination points was then conducted for each region. In the spatial distribution feature analysis, the ArcGIS 10.8 software is used to analyze the distribution of truck trips. From different spatial scales, the travel range of trucks is divided into three levels: municipal level, provincial level, and regional level. Among them, the regional level refers to the traditional geographical division of the country, which is divided into seven regions: East China, North China, South China, Central China, Southwest China, Northeast China, and Northwest China. The construction of a multi-level spatial structure facilitates a comprehensive understanding of the spatial organization patterns of container truck transportation activities and their intrinsic connections with regional economic development.
5.1.1. Spatial Characteristics Analysis of the Regional Tiers
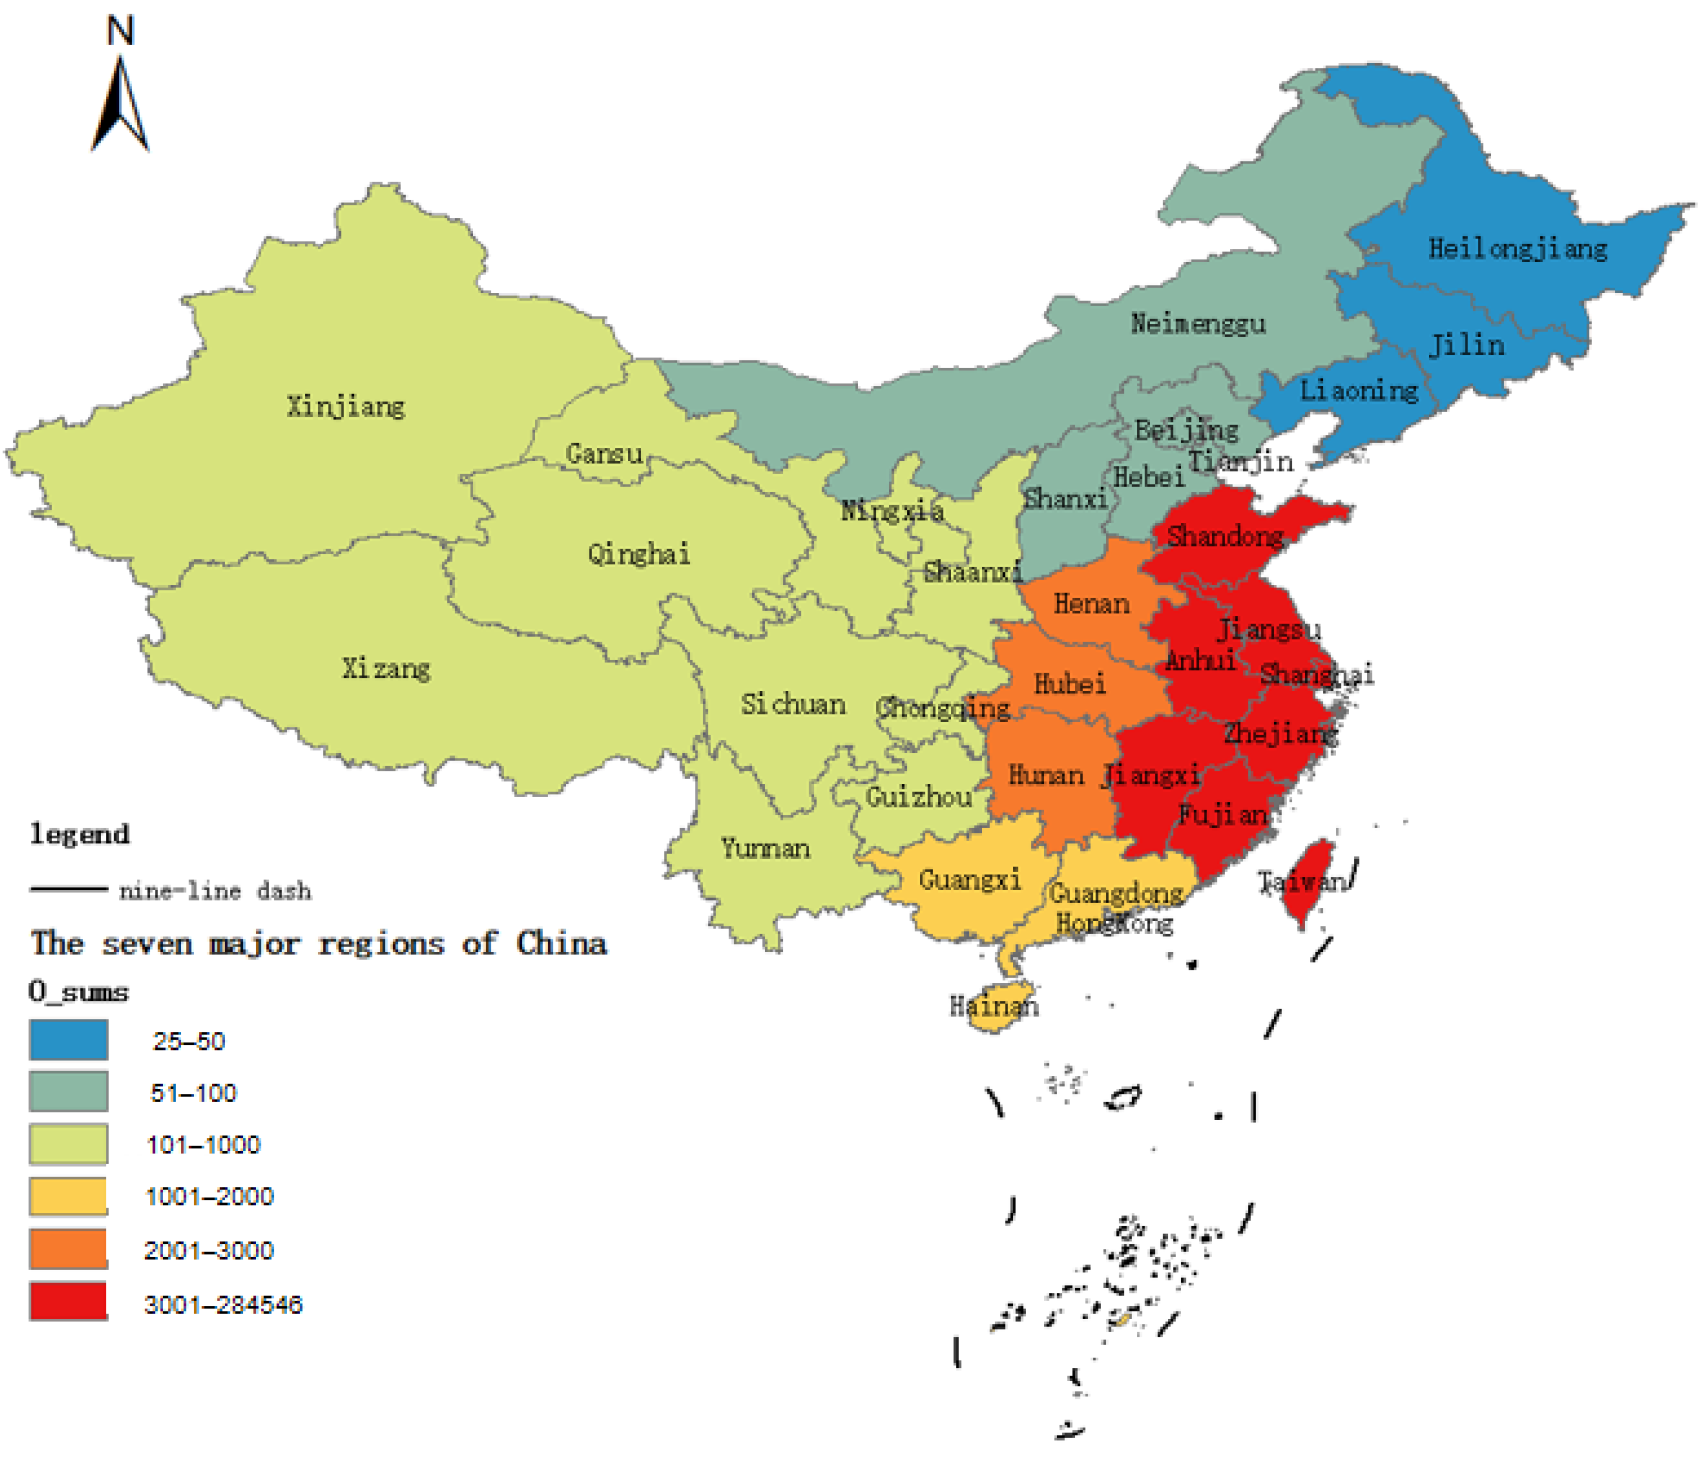
Analysis across seven major regional tiers reveals significant geographical variations in the number of trips made by freight container trucks at the Ningbo-Zhoushan Port, i.e.,
Figure 4, with similar numbers of origin and destination points within the same region. From a driving factors perspective, the differences in container truck transportation frequency across China’s seven major regions are fundamentally determined by their economic geography. As the direct hinterland, East China’s powerful drivers include its highly export-oriented industrial clusters and status as a global supply chain hub, forming high-intensity logistics connections. Within the study period, container truck trips reached nearly 300,000, reflecting its position as the core logistics radiation zone for the port. South China and Central China follow with frequencies between 1700 and 2200 trips, specific data is shown in
Table 1. Their lower port container truck transport volumes may stem from industrial complementarity and the linkage effects of the Yangtze River Economic Belt, as well as inefficiencies in multimodal transport connections. Meanwhile, North China, Southwest China, Northwest China, and Northeast China recorded fewer than 700 trips each. These regions exhibit weaker economic ties to ports and face natural barriers of long-distance land transportation costs due to their greater distance from ports. Additionally, goods from North China tend to choose Tianjin Port and Qingdao Port for shipment, while Northeast China prefers regional ports like Dalian Port and Yingkou Port over the more distant Ningbo-Zhoushan Port, indicating a clear phenomenon of port substitution.
5.1.2. Provincial-Level Spatial Characteristics Analysis
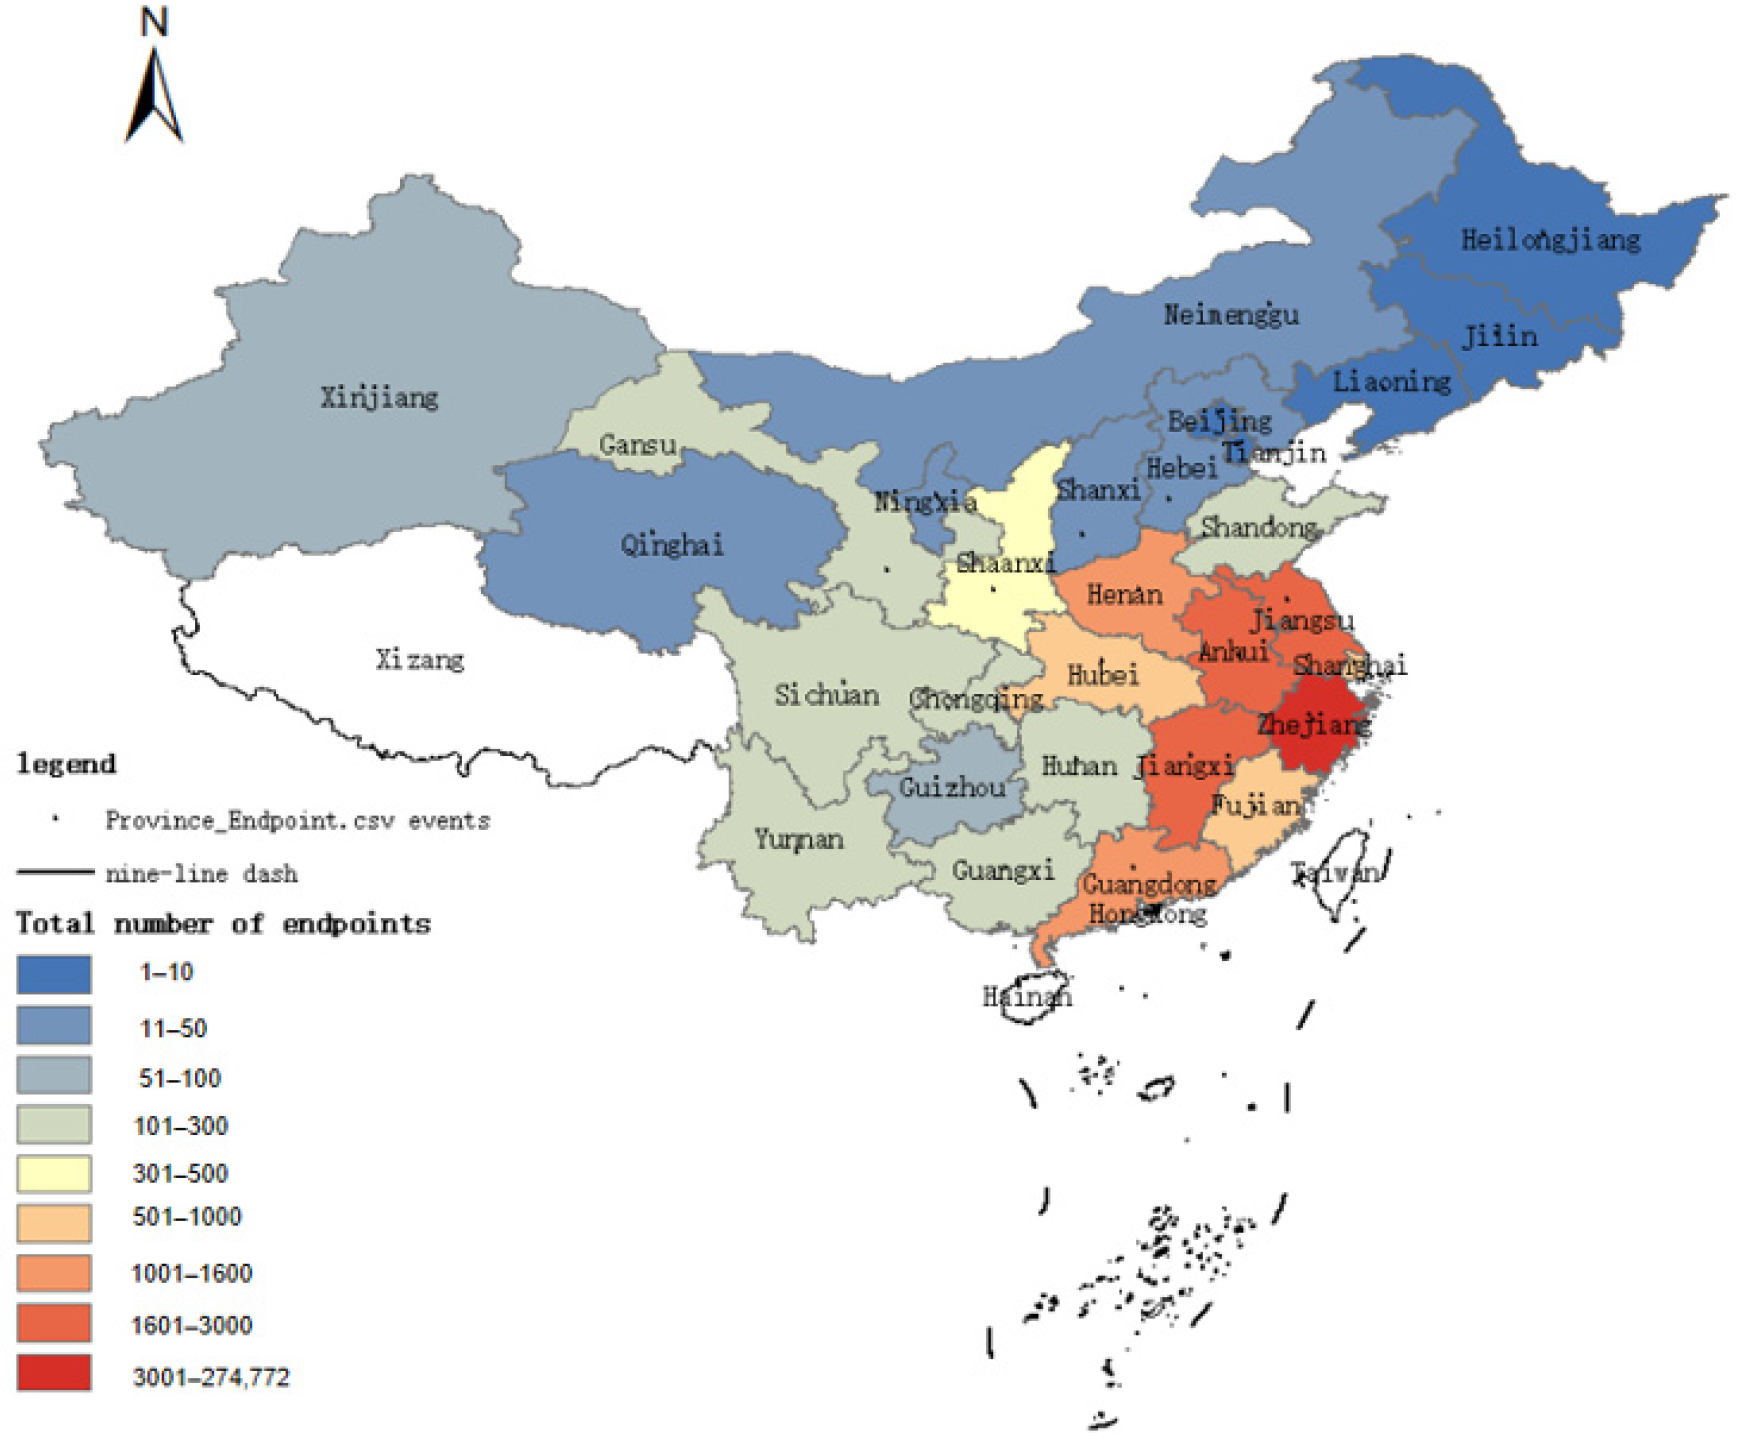
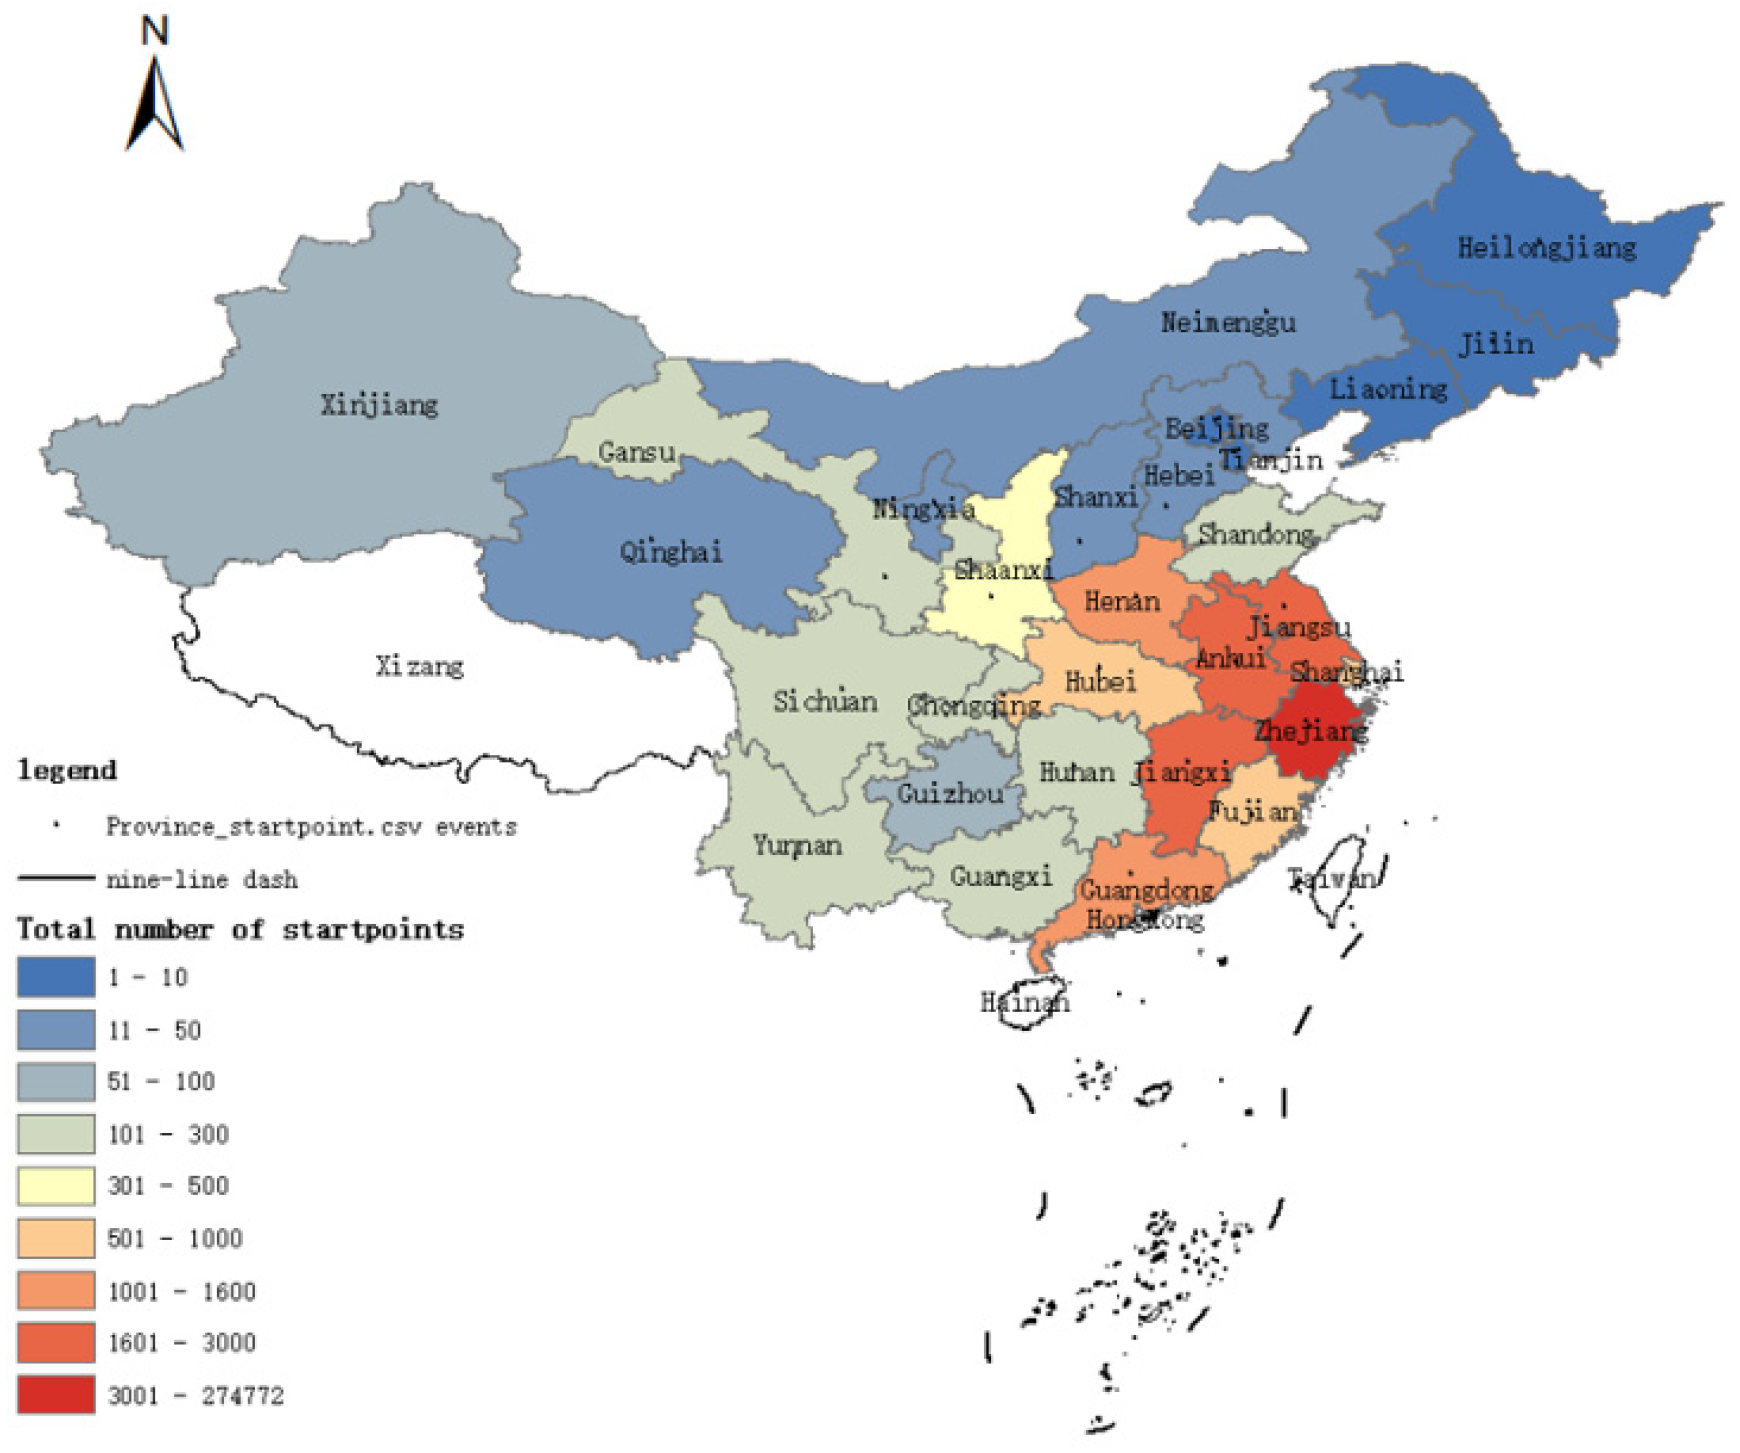
Analyze according to
Figure 5, analysis at the provincial level reveals that the travel frequency of freight container trucks serving Ningbo-Zhoushan Port exhibits significant spatial differentiation, though the number of origin and destination points within the same region shows relatively minor fluctuations. Based on the flow direction data of port container trucks, the transportation frequency between each province and Ningbo-Zhoushan Port can be categorized into three core tiers. The first tier comprises the high-frequency core hinterland, primarily encompassing cities within Zhejiang Province, Jiangxi Province, and Jiangsu and Anhui provinces in the Yangtze River Delta region. As shown in
Table 2, transport frequency within this study period reached 282,497 trips, accounting for 97.48% of the total volume. This is attributed to the absolute advantages in transportation costs and time offered by geographical proximity, coupled with a highly integrated industrial chain and supply chain collaboration within the region. Zhejiang’s private manufacturing sector, Jiangxi’s non-ferrous metals industry, Jiangsu’s electronics and high-end equipment manufacturing, and Anhui’s photovoltaic industry collectively form the core economic hinterland supporting Ningbo-Zhoushan Port’s cargo volume, generating substantial high-frequency, short-distance container truck transportation demand. The second tier comprises the medium-frequency main hinterland, encompassing provinces along the middle and lower reaches of the Yangtze River and central China, such as Hubei and Hunan. Container truck trips totaled 5768, significantly lower than the core region’s proportion, accounting for 1.99%. Provinces in this tier connect to the port via the Yangtze River’s golden waterway and a developed expressway network. Their transportation frequency is primarily constrained by the efficiency of the Yangtze River waterway transshipment and combined road-water transport. These regions serve as critical extensions of the port hub’s functional reach. Their foreign trade cargo is transported via container truck trunk lines to Ningbo-Zhoushan Port for export, exhibiting stable frequency but high cost sensitivity. The third tier comprises low-frequency potential hinterlands, primarily including parts of the middle and upper Yangtze River regions and northern inland provinces. Their transport volume is only 1536 trips, accounting for 0.53% of the total. Their low frequency stems from the high logistics costs and time losses associated with long-distance transportation, leading cargo sources to prefer closer seaports such as Tianjin, Qingdao, or Guangzhou. Their container truck connections with Ningbo-Zhoushan Port are mostly sporadic and non-dominant supplementary channels.
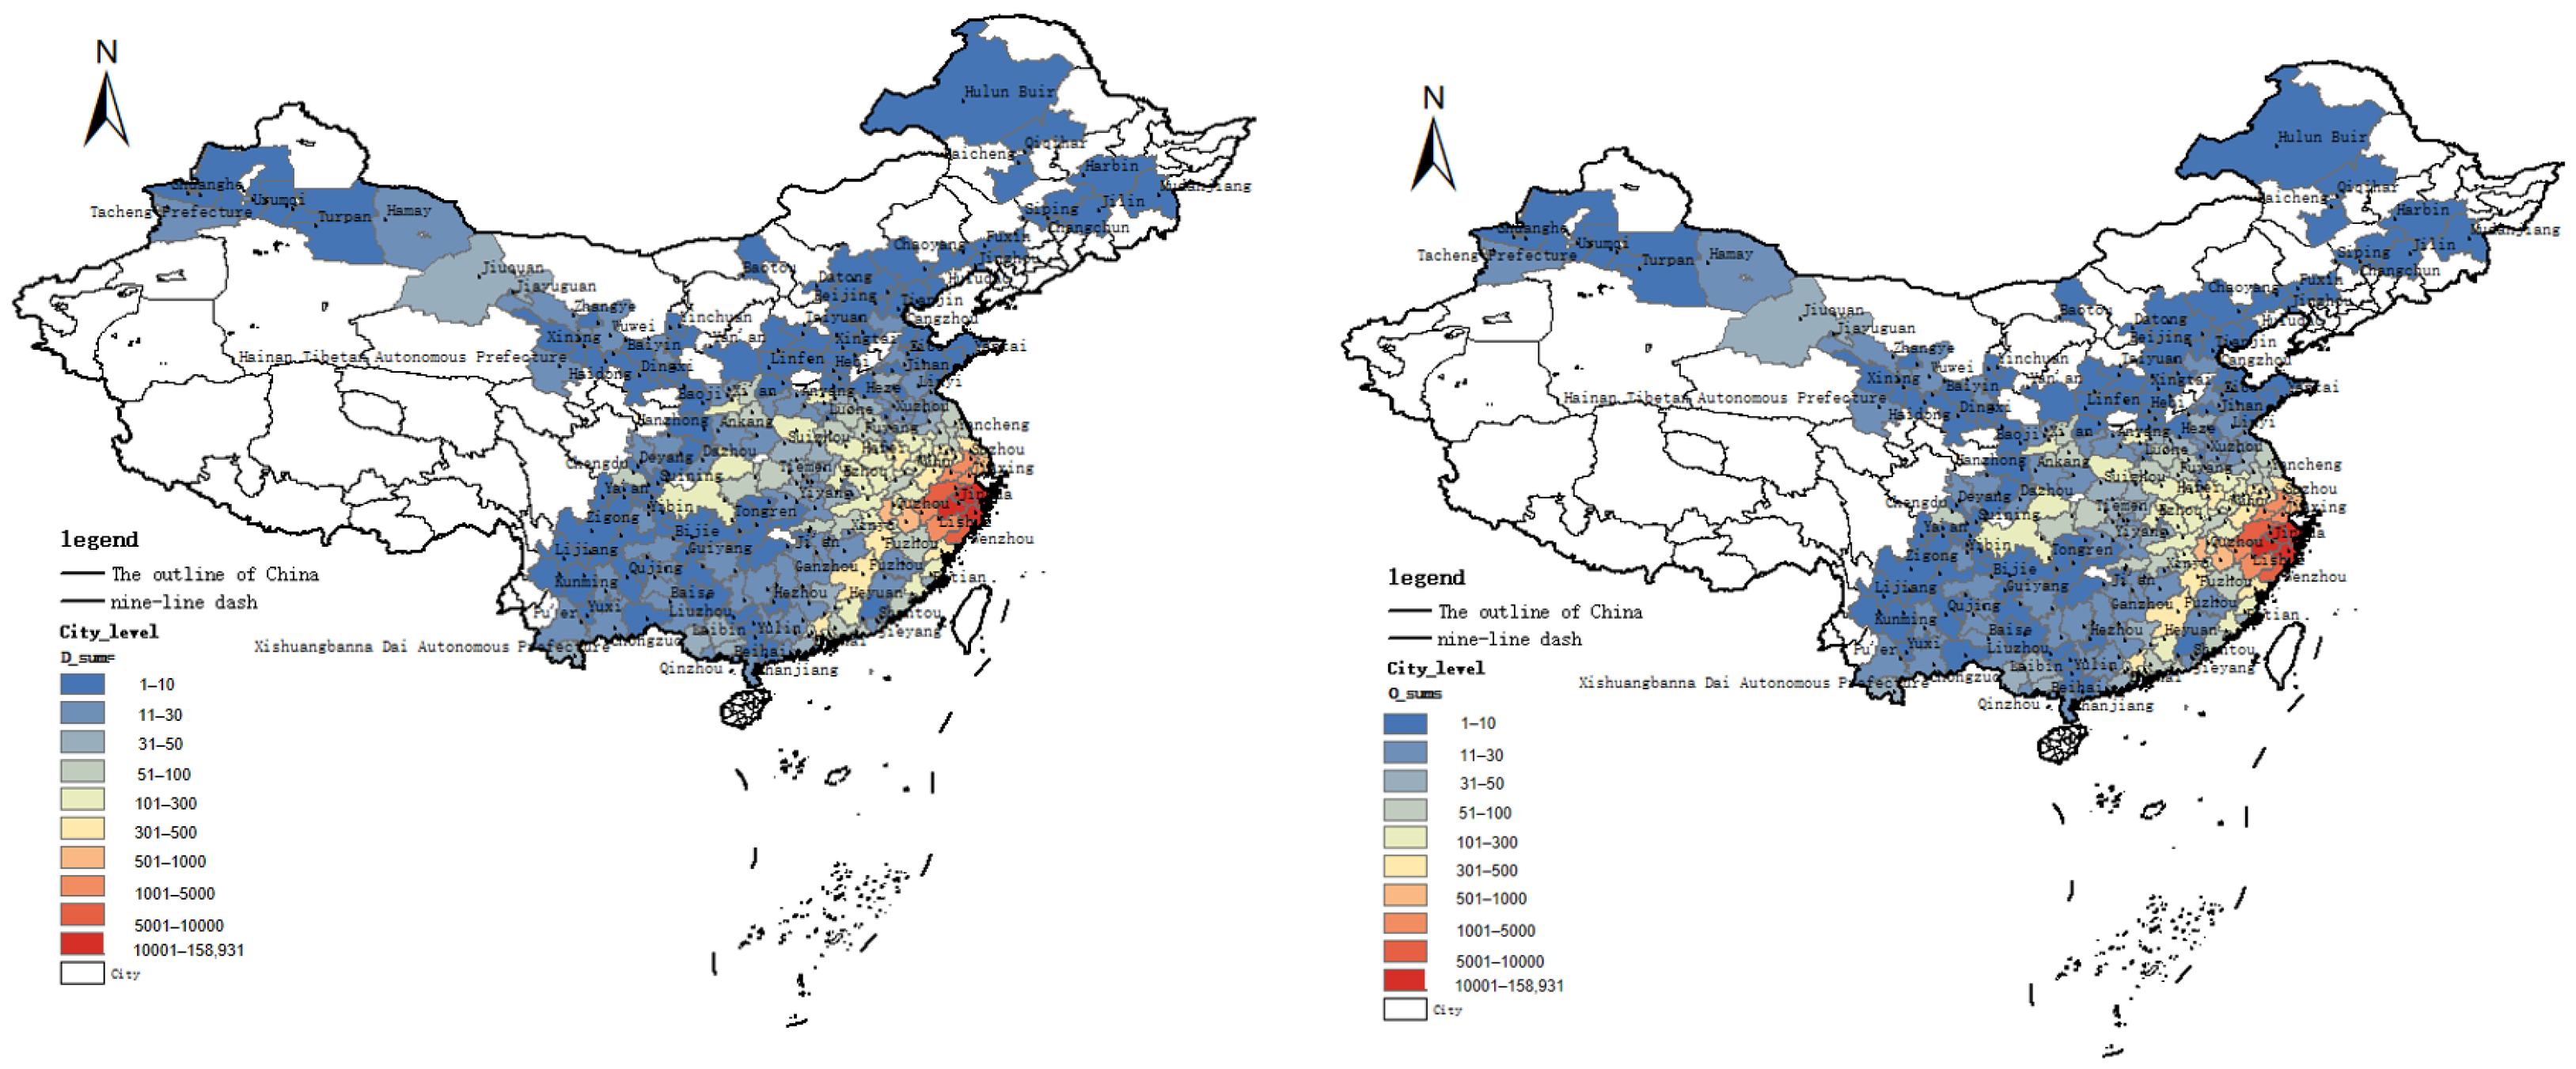
5.1.3. Municipal-Level Spatial Characteristics Analysis
Analysis based on
Figure 6 reveals the following spatial patterns in the municipal regions. Comparing the number of origin-destination pairs within the same region shows that Shuanghe City and Yantai City exhibit only outbound flows with no inbound flows, while other cities demonstrate relatively balanced inbound and outbound volumes. In terms of structural distribution, a distinct “core-periphery” network pattern emerges. Ningbo and its surrounding Zhejiang cities—Shaoxing, Jinhua, Hangzhou, Wenzhou, and Taizhou—form a tightly knit core cluster, accounting for 92.20% of total truck transport volume. This transportation pattern stems from highly interconnected industrial chains. Industries such as Ningbo’s port-adjacent manufacturing, Jinhua’s textile and hardware production, Hangzhou’s digital economy products, and Taizhou’s automotive components boast high industrial sales values and retail sales of consumer goods. Their proximity to the Ningbo-Zhoushan Port provides a natural price advantage. Other cities in the Yangtze River Delta region serve as secondary hubs, accounting for 4.90% of total transport volume. Beyond distance-related diminishing returns, these cities can also utilize inland waterways and road transport for goods movement. As the hinterland extends, peripheral nodes like cities in the Central Plains and remote regions exhibit lower connectivity intensity. Their container truck transport frequency accounts for only 2.90%, with transport activities showing sporadic and intermittent characteristics. This may stem from dual disadvantages: insufficient economic-trade traction and higher transport costs. Consequently, container truck transport frequency between these nodes and the Ningbo-Zhoushan Port remains at a low level within the entire structural network, specific economic-related factors are presented in the content of
Table 3.
5.2. Characteristics of Vehicle Travel Time Distribution
The analysis of the travel time characteristics of container trucks in the Ningbo-Zhoushan Port is of great significance for optimizing the travel schedule of container trucks and improving port operational efficiency. By conducting an in-depth exploration of the distribution patterns of container truck travel times, this study not only reveals the temporal and spatial evolution of traffic flow but also accurately identifies the travel patterns of container trucks. This, in turn, significantly enhances cargo turnover efficiency, reduces congestion and waiting times, and ultimately improves the overall efficiency of logistics transportation. This study analyzes the peak periods of container truck travel volume within different time segments of a day and examines the travel characteristics of container trucks during different phases within the study period, as detailed below:
5.2.1. Analysis of Daily Transportation Characteristics of Container Truck Travel Volume
- (1)
Analysis of Time-Series Distribution and Peak Patterns in Total Truck Traffic Flow
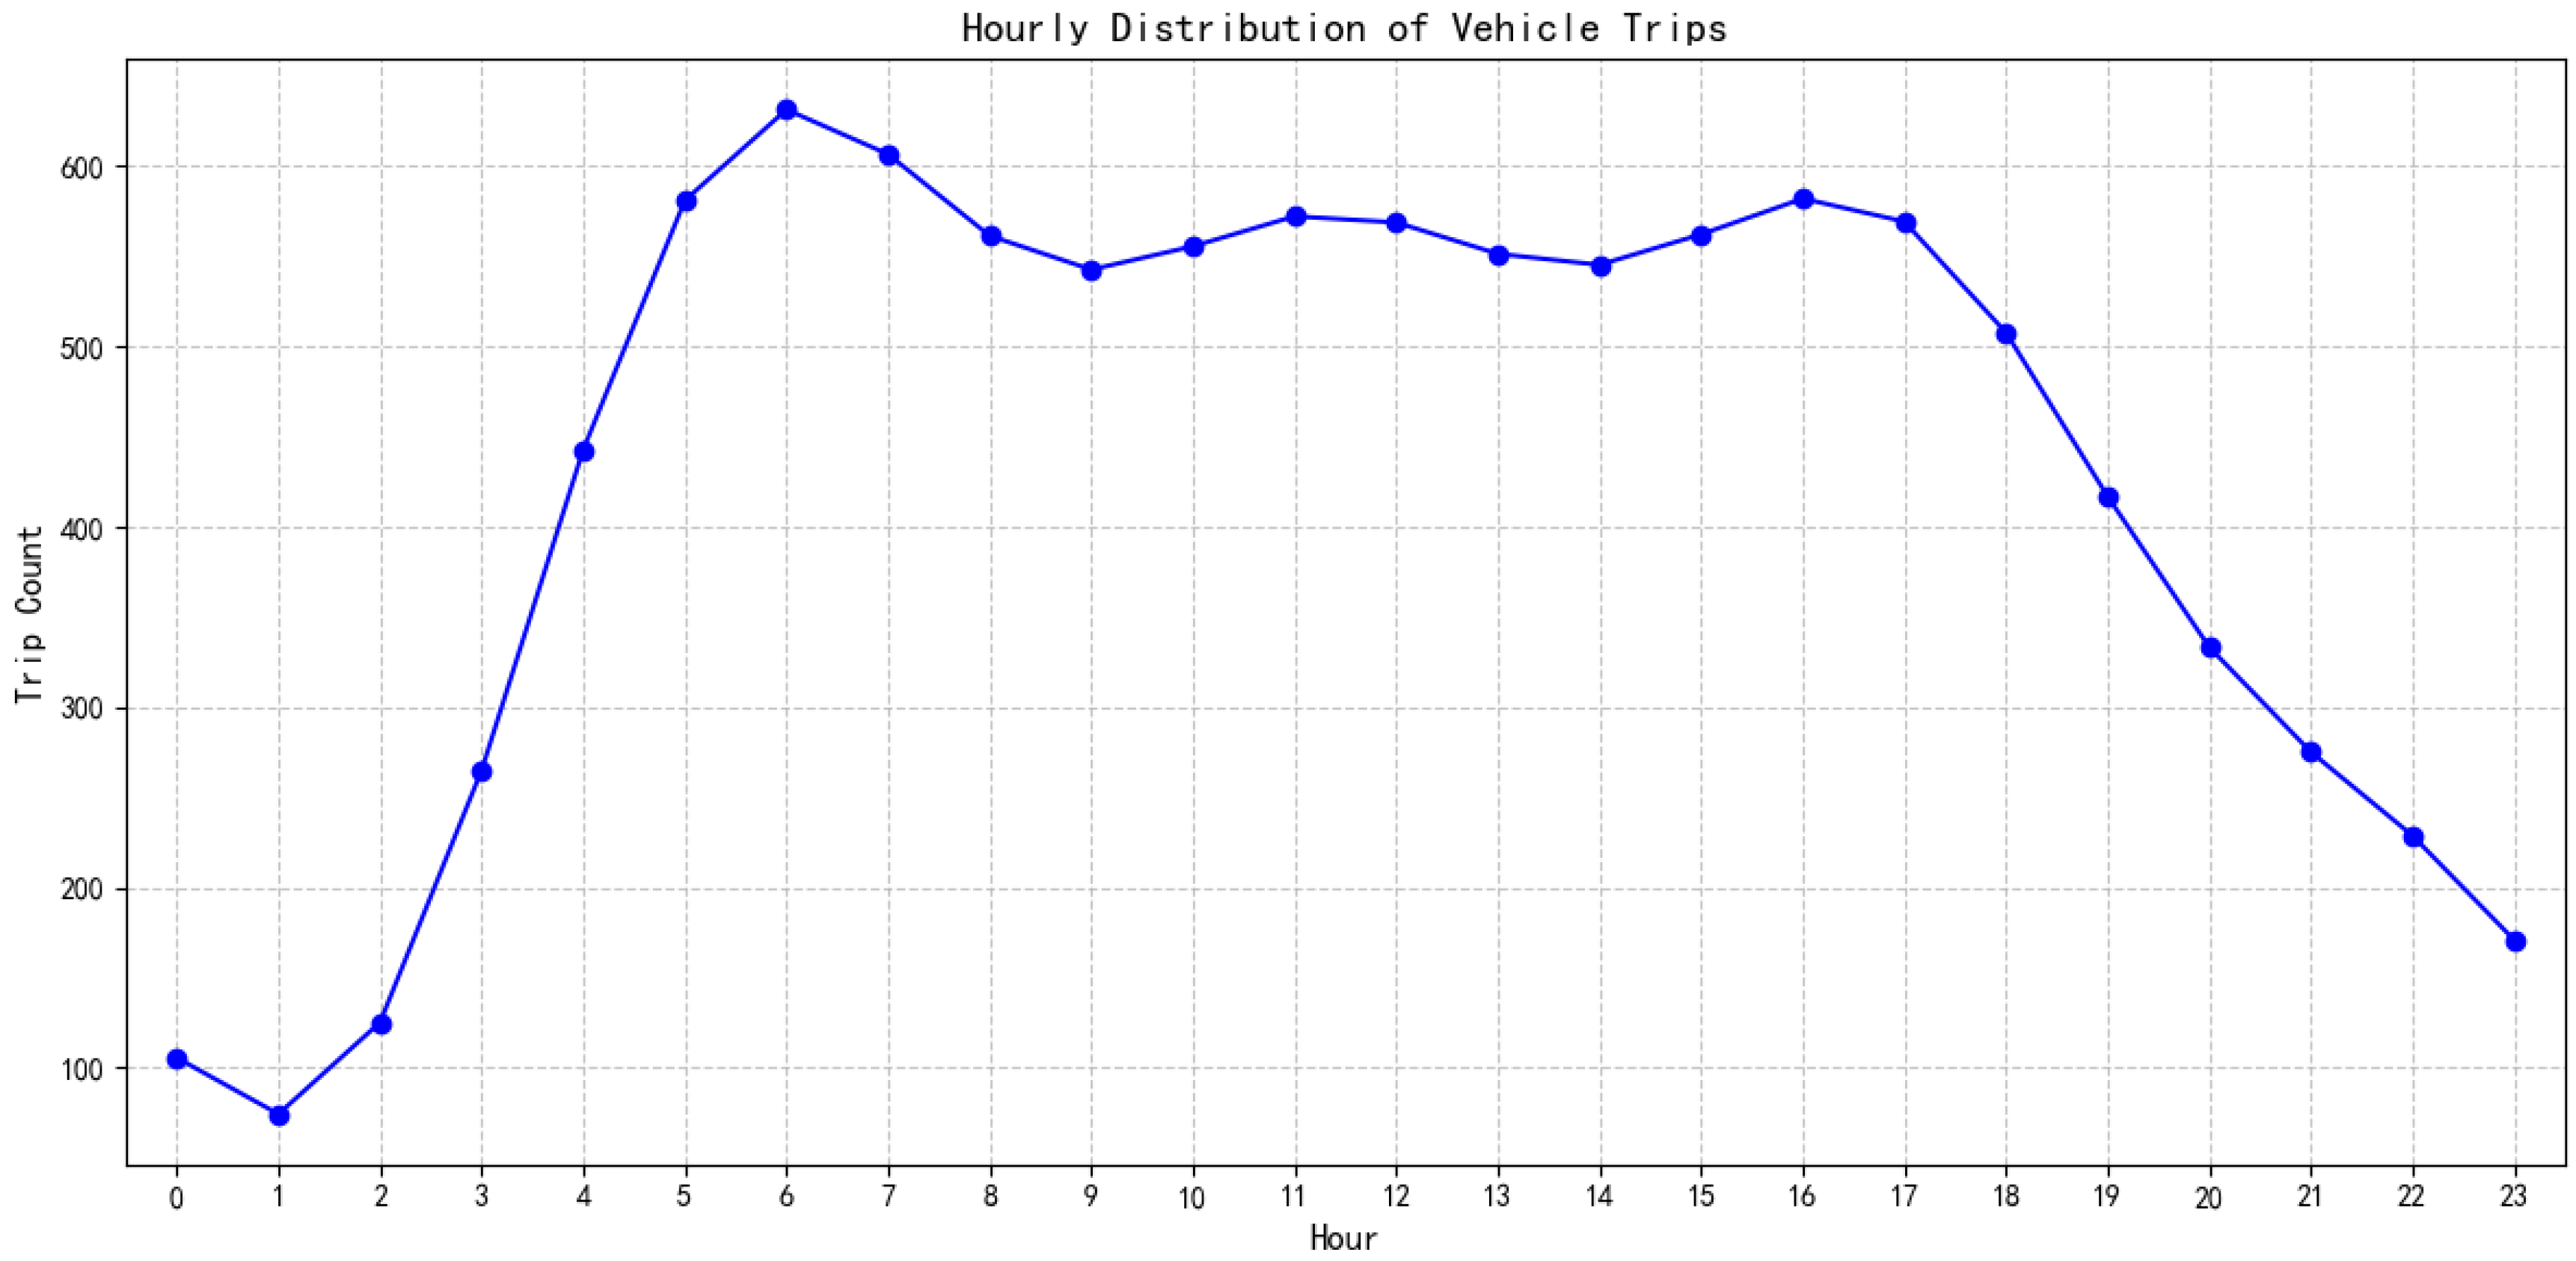
Analyze according to
Figure 7, the total daily truck traffic volume across China’s seven major regions exhibits distinct and regular temporal distribution patterns throughout the 24-h cycle. Daytime transportation activity follows three characteristic phases: From midnight to 3:00 AM, truck traffic remains relatively low. As dawn approaches, traffic volume rapidly increases, reaching approximately 450 vehicles by 4:00 AM and peaking for the first time around 6:00 AM at over 640 vehicles. This pattern indicates that ports experience their first major operational peak during the early morning hours. A surge occurs between 5:00 AM and 6:00 AM, marking the initiation of the morning rush hour. A brief traffic adjustment between 12:00 PM and 2:00 PM reflects an operational intermission. From the afternoon into the evening, a secondary peak plateau forms, with traffic volume stabilizing at over 90% of the morning peak level. Following 5:00 PM, the transportation activity enters a decline phase, with trip counts dropping to low levels by late night, reflecting the reduction in evening transport activities. This distinct diurnal pattern confirms the strong coupling between port operation scheduling mechanisms and the highway feeder transport system: constrained on one hand by port operational factors such as vessel arrival cycles and the operational efficiency of loading/unloading equipment, and on the other hand, limited by external environmental factors including urban road access policies and logistics companies’ scheduling systems.
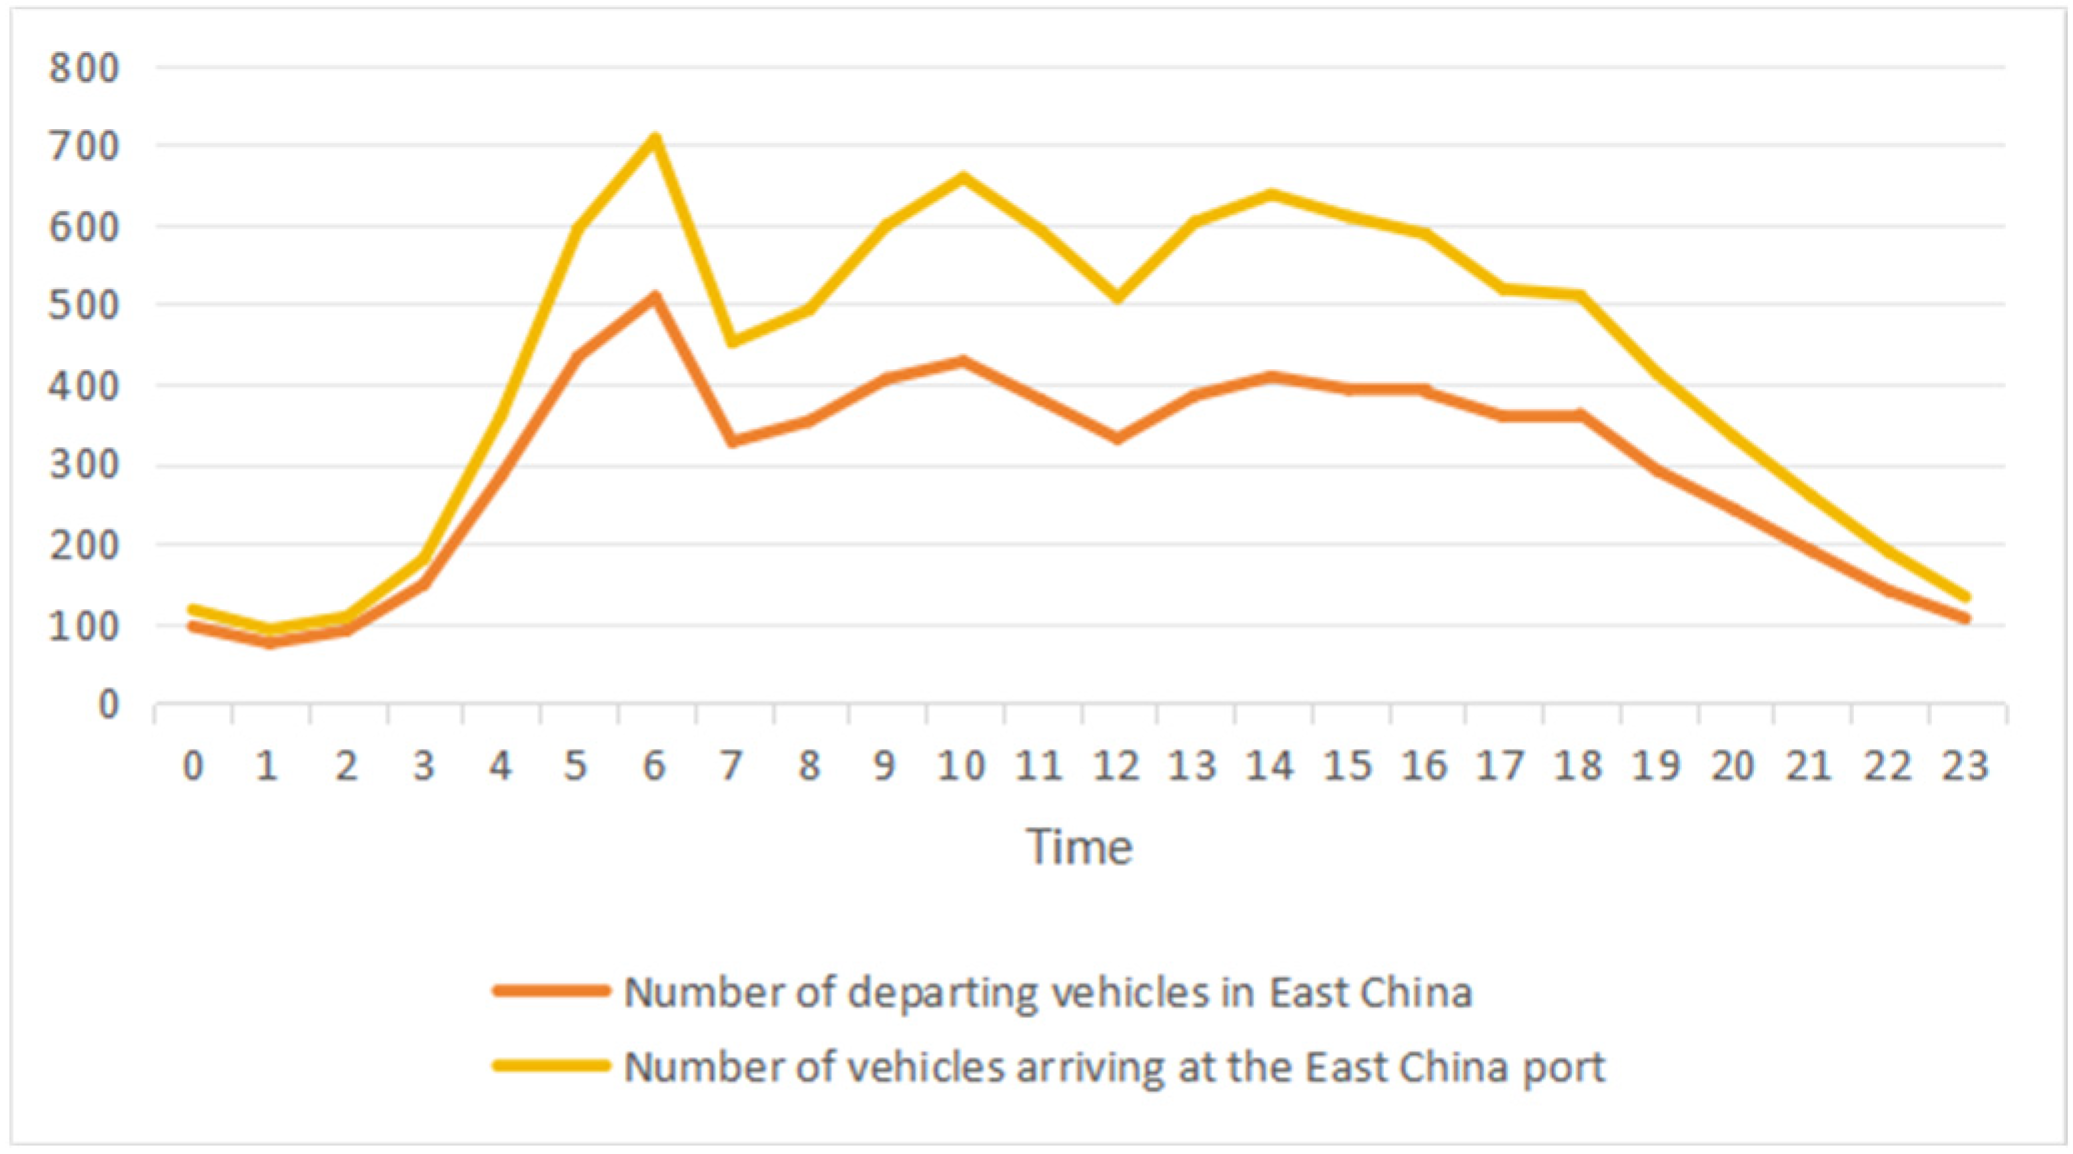
Looking at specific regions, East China, as the nation’s core logistics hub, has a total truck traffic volume far exceeding other regions. Both departure and arrival peaks occur around 6:00 AM, with a distinct secondary peak forming between 10:00 AM and 11:00 AM. This indicates exceptionally active logistics operations in East China, where not only does outbound cargo transportation concentrate in the early morning to meet nationwide demand, but substantial cargo flows also continue throughout the morning hours. This further underscores its pivotal role as a logistics distribution center. The North China, South China, and Central China regions exhibit lower operational volumes with relatively stable patterns. This reflects their role as logistics transfer nodes, providing steady and continuous transit functions within the supply chain. Traffic increases occur during specific periods based on cargo transfer demands. The traffic patterns in the Southwest, Northeast, and Northwest regions exhibit similar daily trends, with significant peaks during morning and evening rush hours (roughly between 8 and 10 AM and 5 and 7 PM), indicating concentrated increases in port traffic during these periods. Concurrently, the fluctuation patterns of departing and arriving vehicles are largely synchronized, reflecting the coordinated nature of port operations.
- (2)
Recognition and Classification of Truck Flow Time Series Patterns in Hinterland Provinces
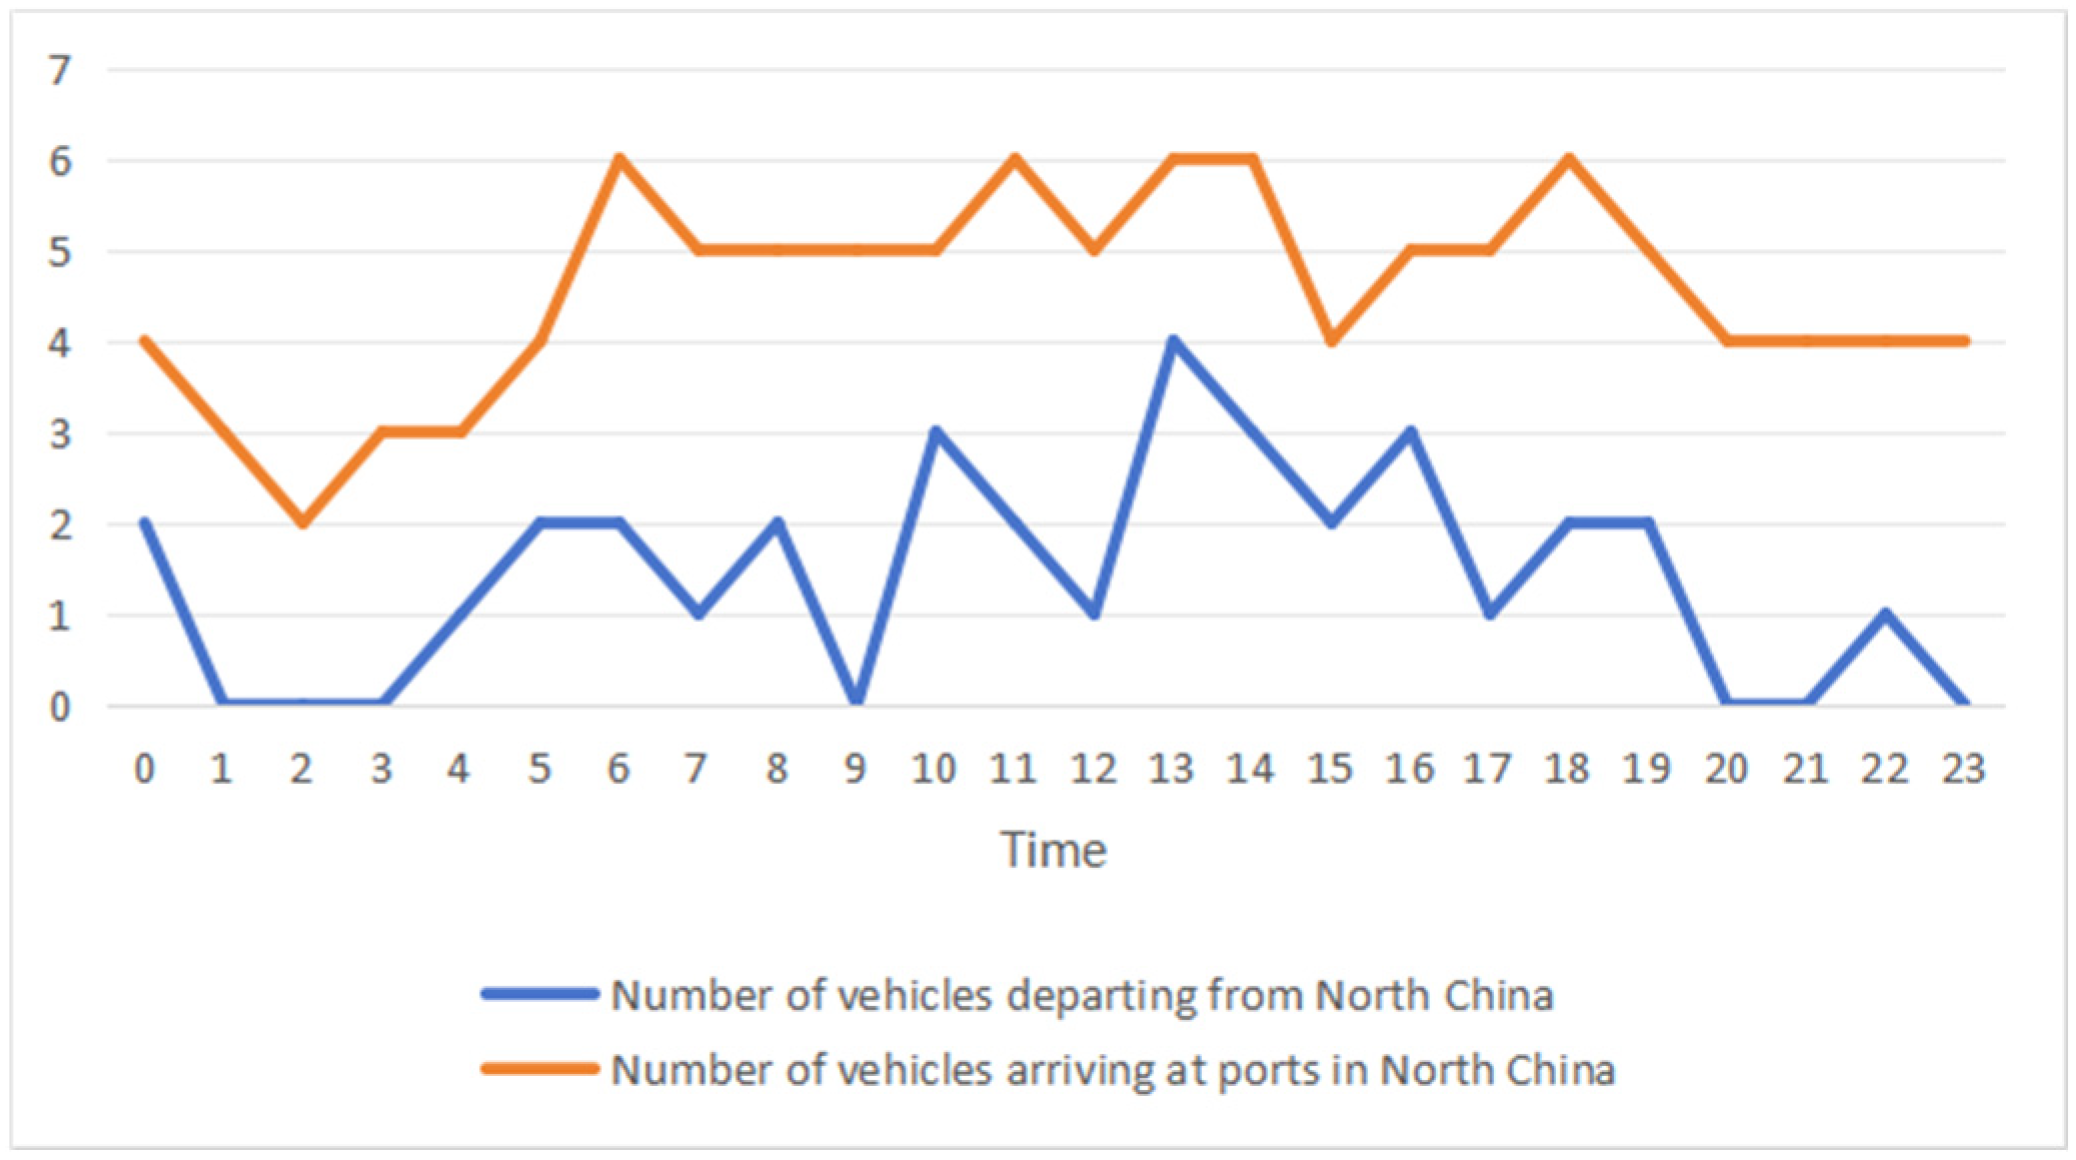
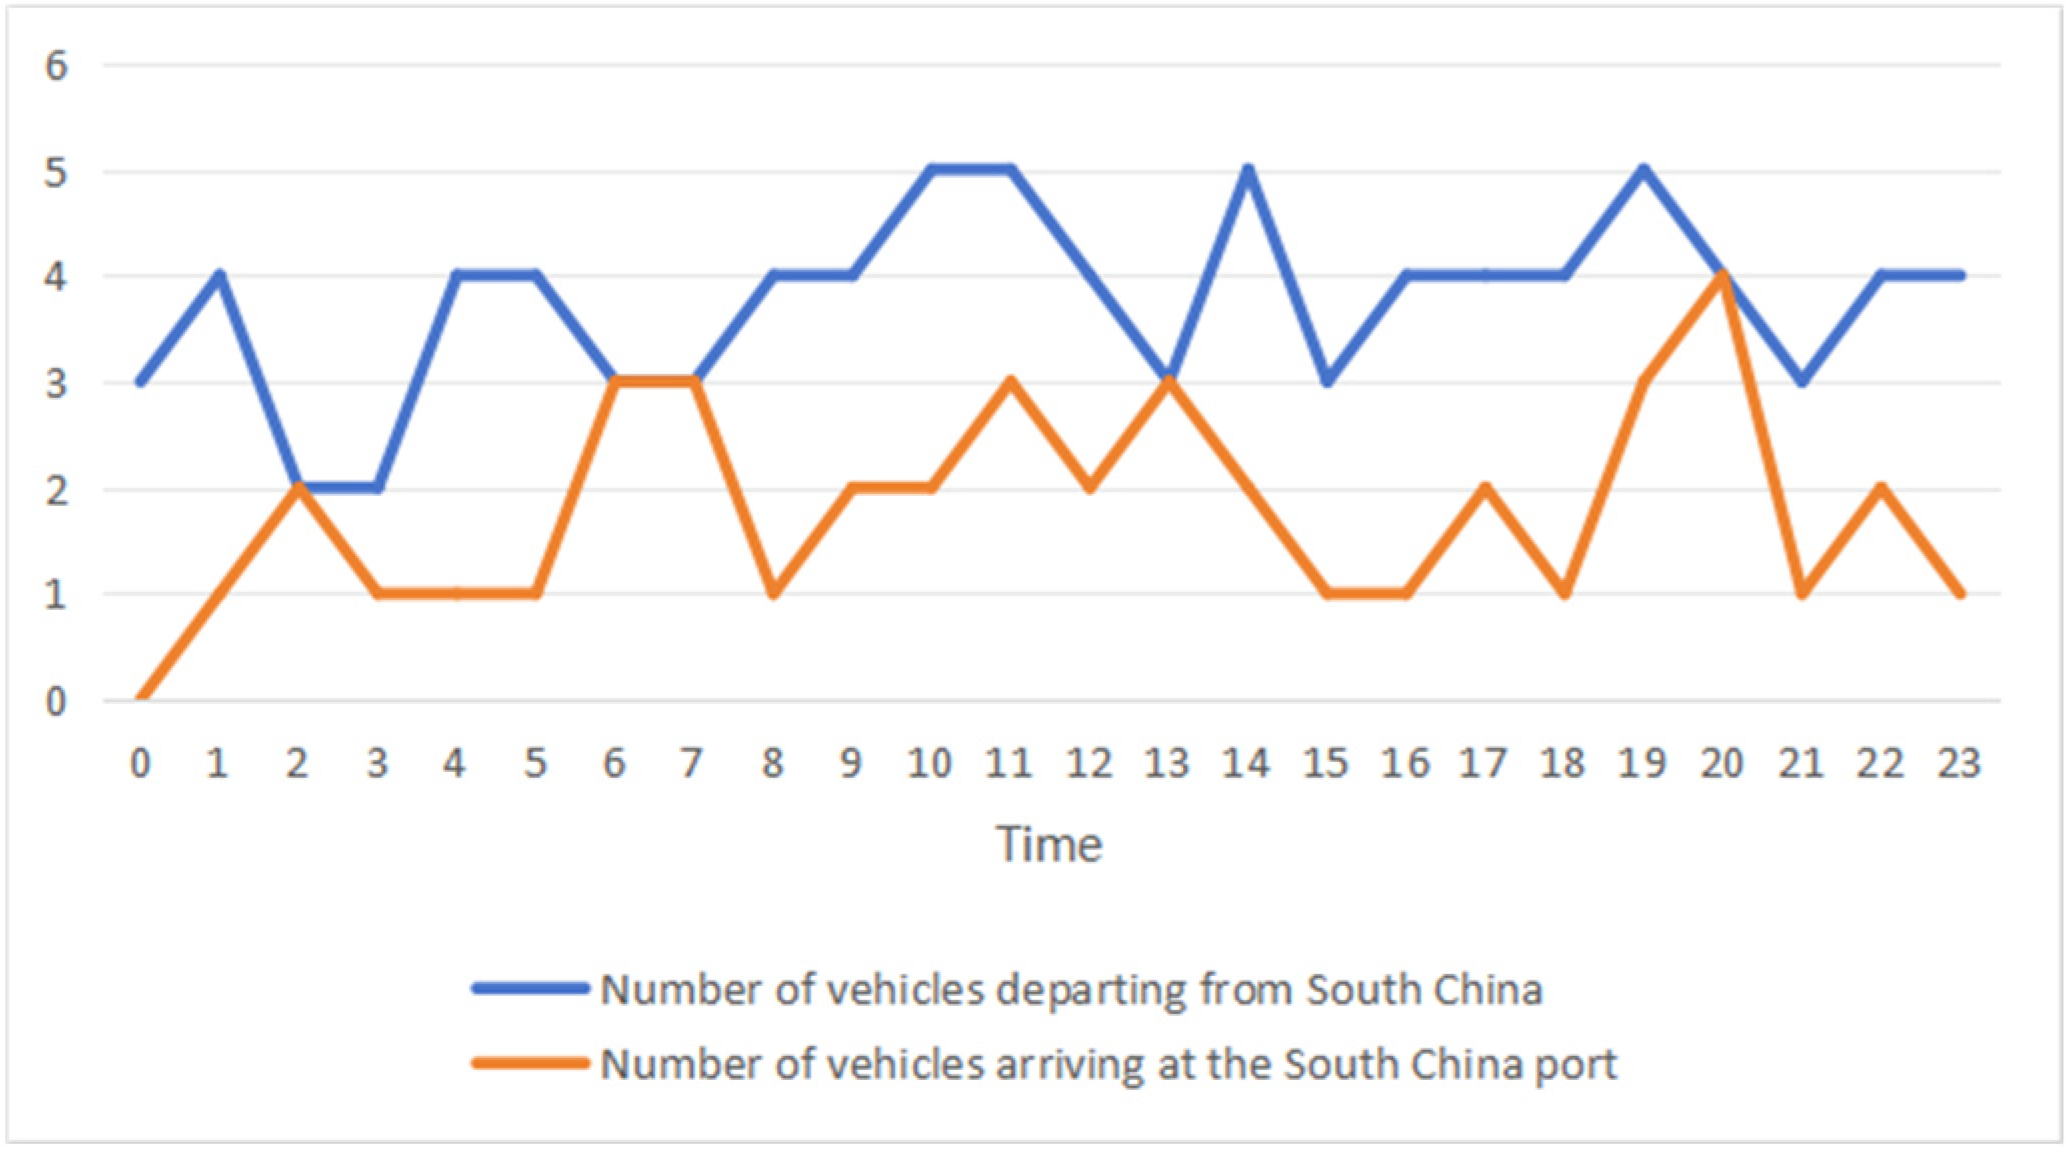
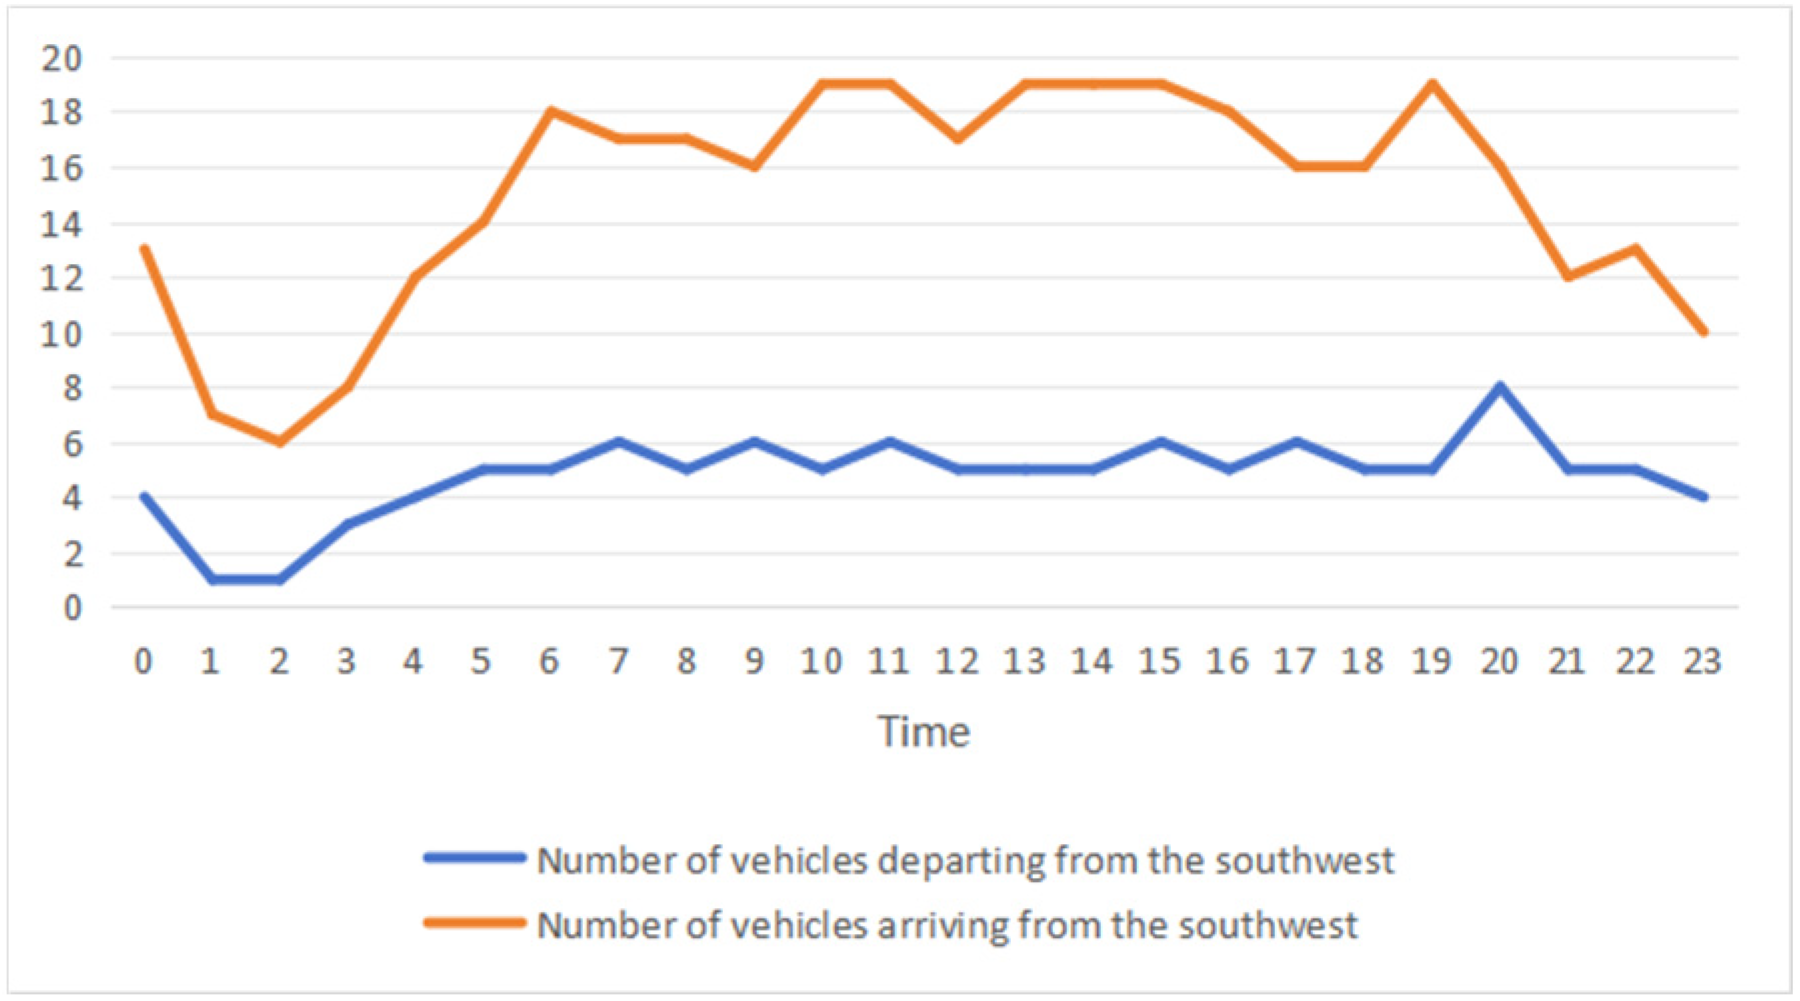
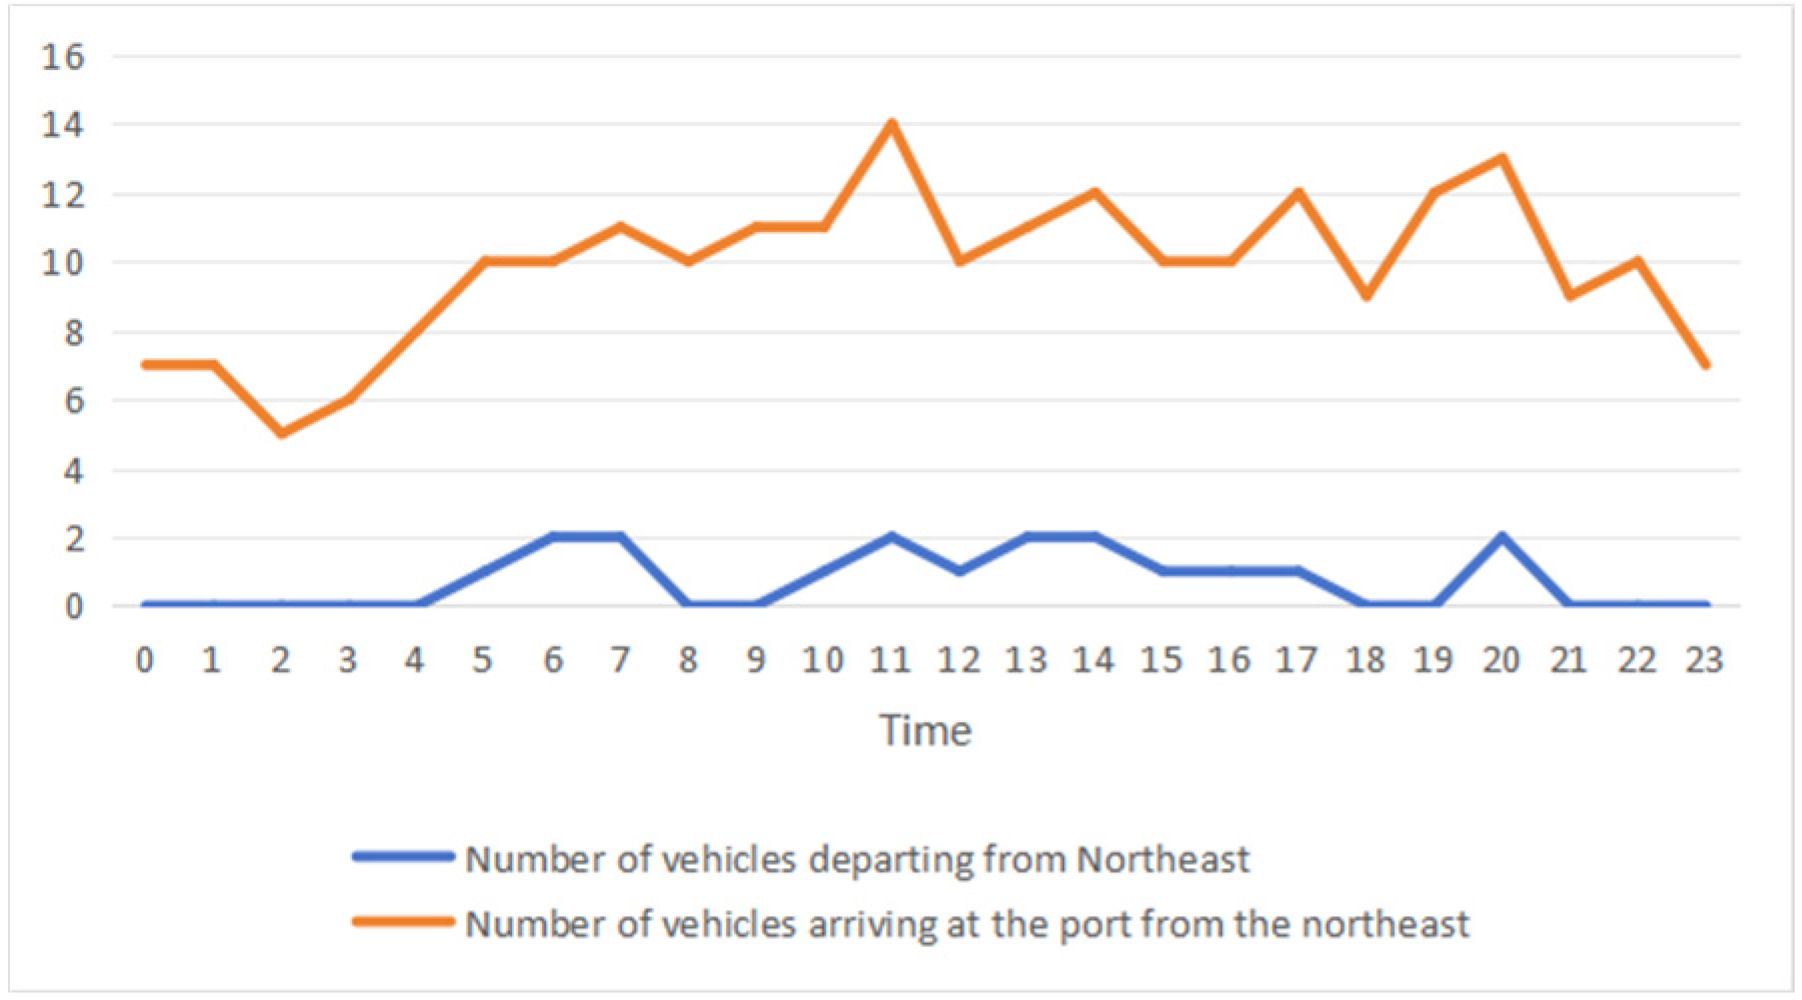
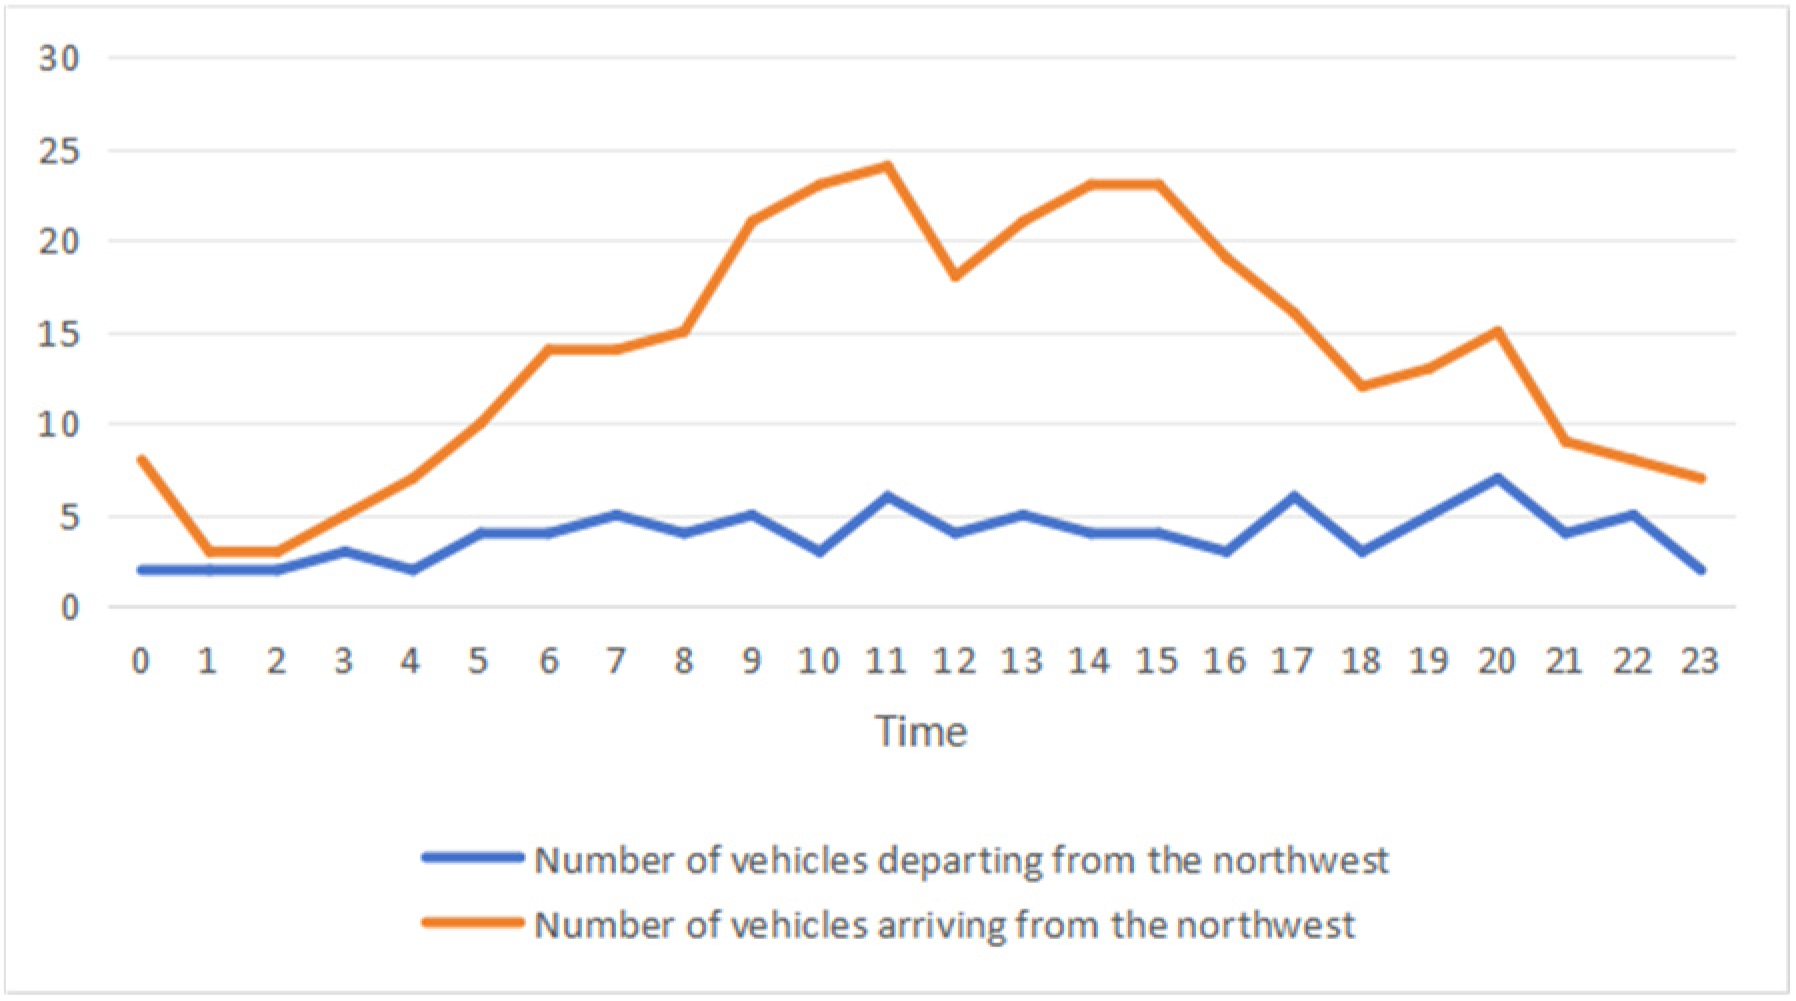
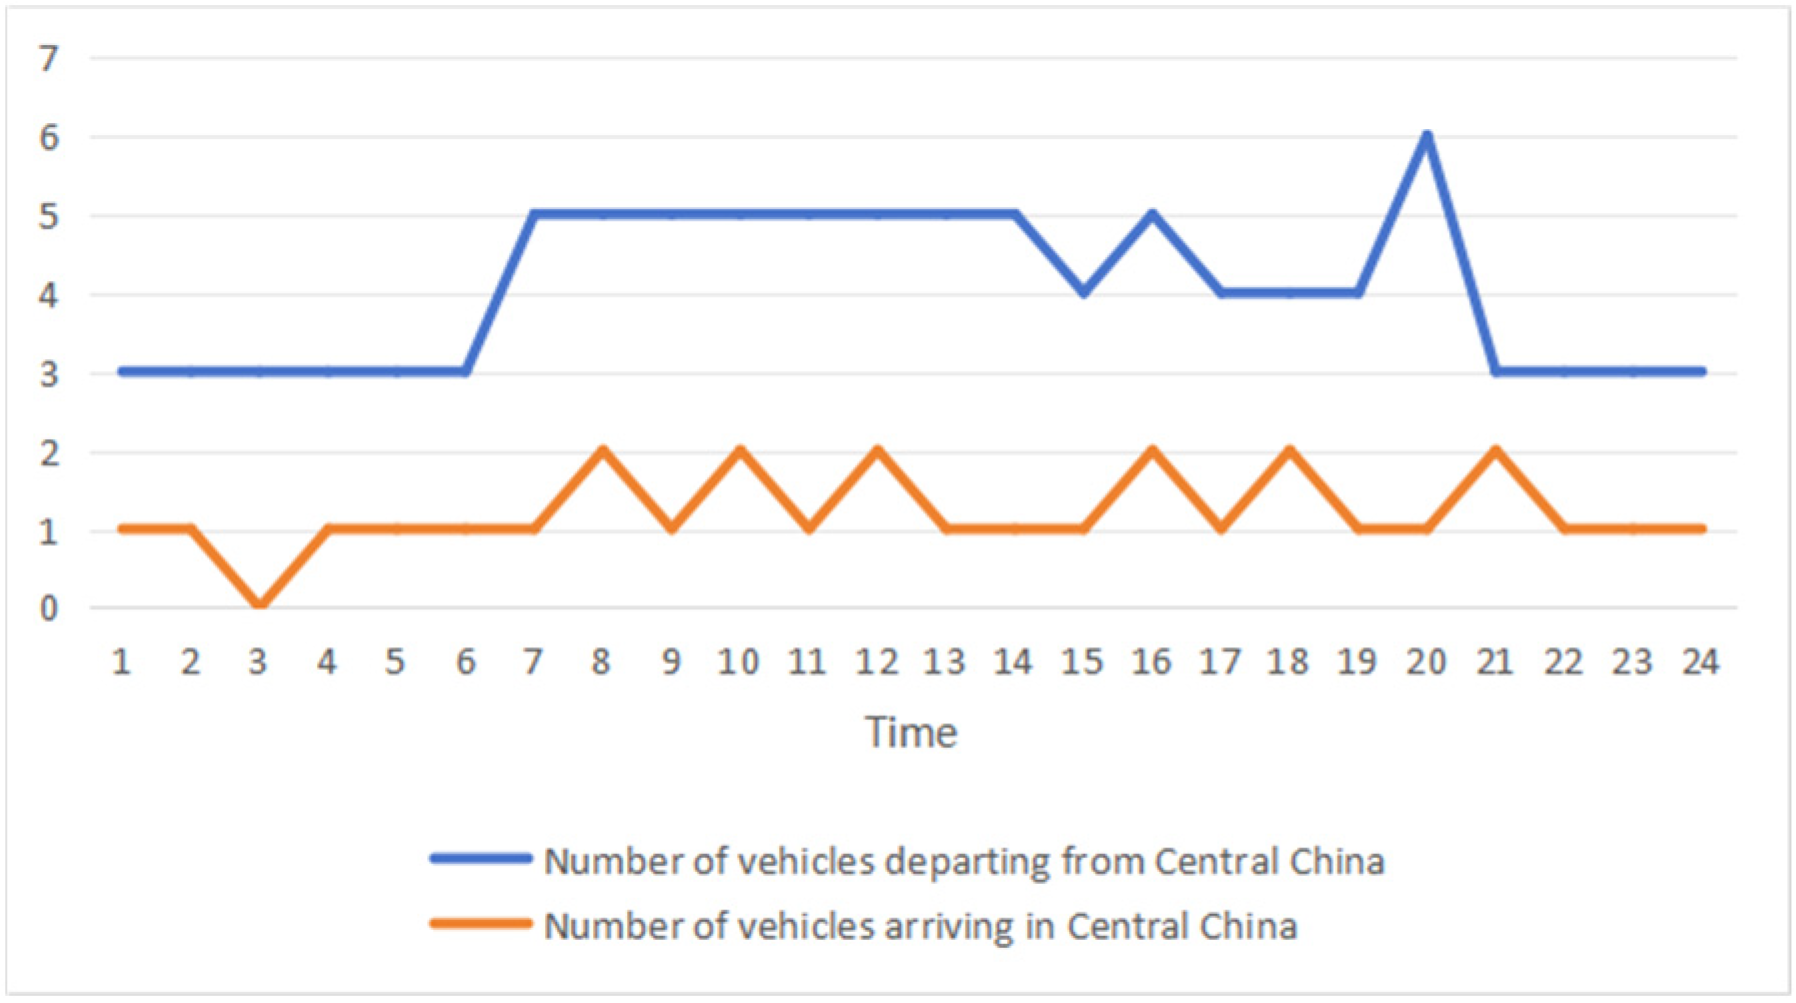
Accurate recognition and classification of truck flow time series patterns are crucial for understanding regional logistics characteristics, optimizing resource allocation, and enhancing transportation efficiency. By studying the time series patterns of truck flows across seven major regions, this analysis reveals the inherent patterns of logistics activities in different areas. Based on the data, the truck flow time series patterns in these seven regions can be categorized into the following types, as shown in
Figure 8,
Figure 9,
Figure 10,
Figure 11,
Figure 12,
Figure 13 and
Figure 14.
Multi-Peak Pattern: East China Region. Departure peak occurs between 6:00 and 10:00, with a secondary peak at 14:00–16:00; arrival peak similarly concentrates between 6:00 and 10:00, featuring a secondary peak at 13:00–15:00. Departure and arrival flows exhibit high synchronization, with significant daily traffic fluctuations. East China ranks among China’s most economically dynamic regions, characterized by dense populations and advanced industrial and commercial development. The dual peaks in departures and arrivals reflect concentrated commuting and logistics activities: the morning peak corresponds to commuting and the initiation of freight transport, while the midday peak is likely associated with commercial activities and deliveries.
Low-Traffic Steady Pattern: North China, South China, Central China. Both departure and arrival vehicle counts are low, with relatively even distribution throughout the day and no significant peaks. In North China, departure and arrival values mostly range between 0 and 6; South China’s departures range from 2 to 5, with arrivals between 0 and 4; Central China’s departures range from 3 to 6, with arrivals between 0 and 2. Traffic fluctuations are minimal, and departure-to-arrival ratios are nearly equal. While economically developed, these regions’ lower traffic volumes may reflect limitations in specific transportation modes. Additionally, intra-regional travel may be dominated by short-distance or dispersed trips, avoiding concentrated peaks. Relatively balanced economic structures or traffic network diversion effects may also contribute to stable flow patterns.
Arrival Peak Patterns: Southwest, Northwest, and Northeast Regions. Arrival vehicle counts significantly exceed departures, with distinct peak arrival periods occurring during specific hours, while departures remain relatively steady. Southwest peaks from 10:00–15:00 with departure values ranging from 1 to 8; Northwest peaks from 9:00–11:00 with departure values from 2 to 7; Northeast peaks from 10:00–12:00 and 19:00–21:00. These regions exhibit relatively high inbound traffic volumes with smaller fluctuations in outbound flows. As inland hubs, the Southwest and Northwest regions likely serve logistics distribution or resource inflow functions. The Northeast region, characterized by heavy industry and agriculture, may face population outflow and economic transition pressures, resulting in fewer outbound vehicles. This could stem from resource inflow or transportation hub functions, as well as regional economic vitality or transportation network characteristics.
5.2.2. Monthly Transportation Characteristics Analysis of Container Truck Travel Volume
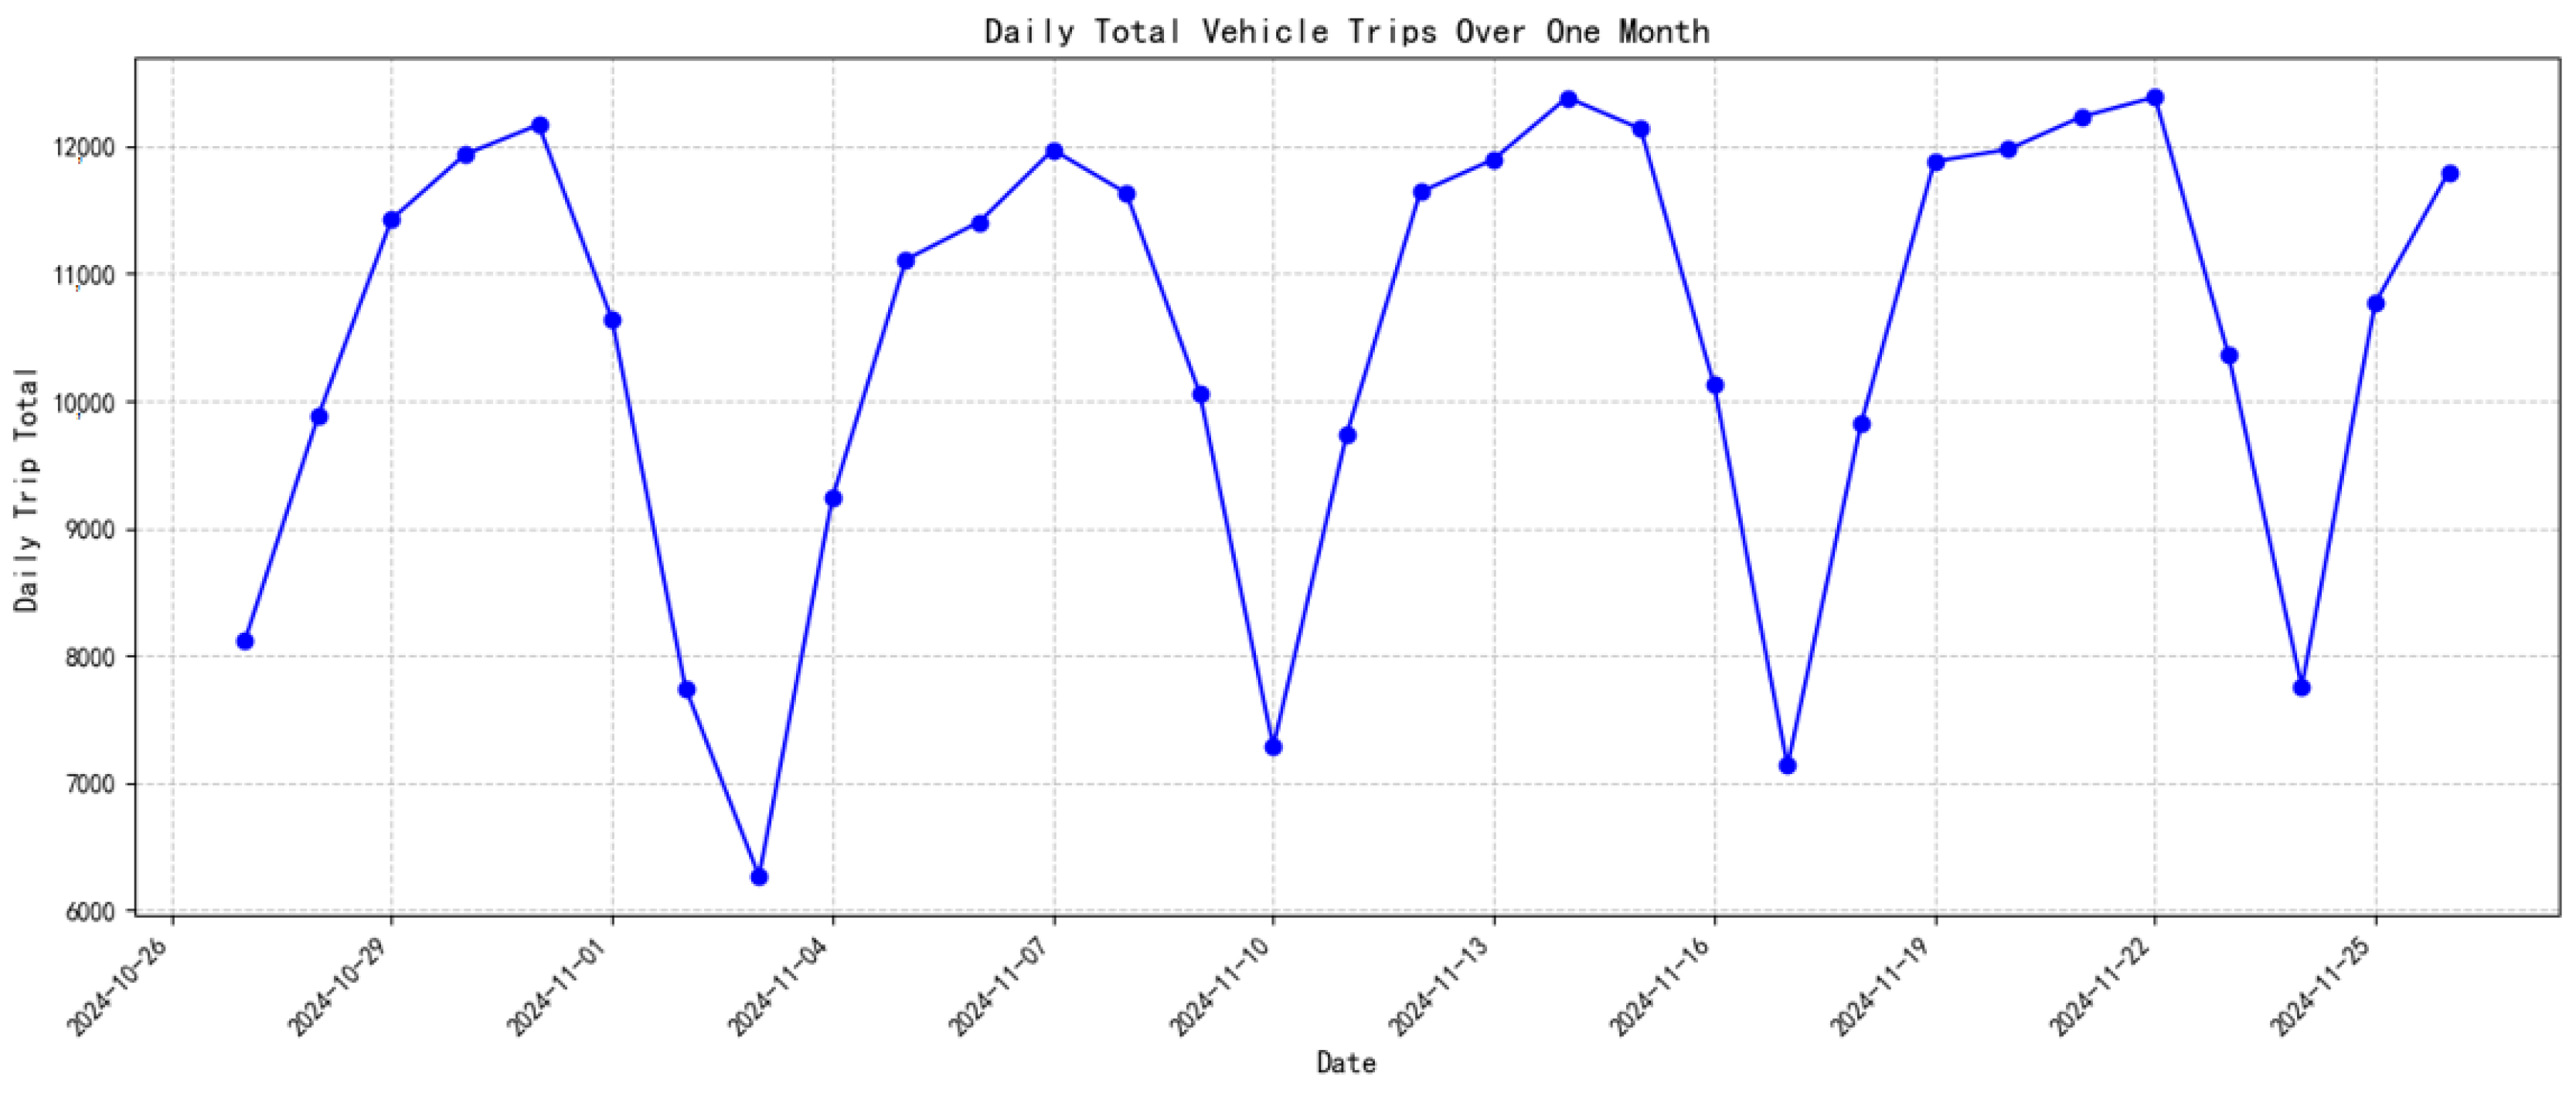
According to
Figure 15, From 27 October to 26 November 2024, container truck trips at Ningbo Zhoushan Port exhibited an overall “multi-peak fluctuation” pattern with localized variations. Specifically, daily trips ranged between 4000 and 12,000, with pronounced weekday-weekend differentiation within weekly cycles. On weekdays, trip volumes exhibited a “stepwise increase”: climbing steadily from Monday to Wednesday, followed by a slight decline starting Thursday. After peaking on Friday, volumes rapidly declined. Weekends exhibit a “rapid decline” pattern, with Saturday volumes averaging 25% lower than Friday’s, and Sunday volumes further dropping to the trough, forming a distinct non-working day decay pattern. This spatio-temporal differentiation aligns closely with the periodic patterns of cargo arrivals and departures at the port, validating the strong rhythmic characteristics of port logistics activities. The aforementioned truck operation patterns demonstrate the rhythmic temporal responses within the port transportation system, exhibiting strong regularity and predictability.
6. Conclusions
This study focuses on the transportation characteristics of container trucks at the Ningbo-Zhoushan Port. It is based on GPS trajectory data from over 5000 container trucks obtained from a third-party platform during the period from 27 October to 26 November 2024. After preprocessing steps including coordinate transformation, removal of speed outliers, and time standardization, the DBSCAN density clustering algorithm and the Prophet time series model were employed for analysis. The main findings regarding the spatio-temporal characteristics of container trucks at the Ningbo-Zhoushan Port are as follows:
- (1)
From a spatial characteristics perspective: Regarding the spatial distribution of container truck travel volume, there is relatively little fluctuation in the origin and destination vehicle travel volume at the seven major regional levels. In terms of vehicle travel characteristics at the provincial level, the Yangtze River Delta region has the highest number of container truck trips, with Zhejiang Province, as a port location, having the highest travel frequency, forming a core radiation zone; Jiangsu, Anhui, and other neighboring provinces follow next, forming a secondary connection zone; the central-western and northeastern regions show a significant decrease in travel frequency, forming an outer weak connection zone. At the city level, the spatial characteristics exhibit the following patterns: Ningbo and its surrounding cities have extremely high travel frequencies, making them a high-frequency area for freight container truck activities at the Ningbo-Zhoushan Port; as the hinterland extends, travel frequencies gradually decrease.
- (2)
From a temporal perspective: In terms of daily travel patterns, the number of departing container trucks reaches a low point around 1:00 AM, followed by a surge in the 5:00–6:00 AM time slot, marking the onset of the morning rush hour. The majority of vehicles depart between 7:00 AM and 5:00 PM, which constitutes the peak working hours, while the period after 5:00 PM enters a decline phase in transportation activity. Analysis of monthly travel patterns reveals a unique multi-peak fluctuation pattern. During weekdays, the daily number of truck departures shows an overall upward trend, while truck travel volume drops sharply on weekends, exhibiting a distinct weekday-weekend differentiation within a single weekly cycle.
- (3)
The time domain distribution of departure and arrival frequencies shows an obvious imbalance. In the early morning hours, both departure and arrival frequencies of container trucks are extremely low. In the early morning and morning hours, departure frequencies rise sharply, followed by a gradual increase in arrival frequencies. Both reach a relative peak in the morning, and then gradually decline in the evening, with a drop of more than 75%.
7. Policy Implications
Based on the analysis of the temporal and spatial operational characteristics of container trucks, the following recommendations are proposed: From a regional perspective, given the high frequency of trips in the East China region, efforts should be strengthened to enhance the construction of port logistics infrastructure in this area. By appropriately leveraging policy incentives, efforts should be made to attract logistics companies to cluster and develop, thereby achieving economies of scale. For regions with lower trip frequencies, such as Southwest, Northeast, and Northwest China, it is necessary to optimize the existing logistics network structure and strengthen cross-regional logistics collaboration. In terms of time, in response to the three-stage transportation characteristics during the day and the multi-peak fluctuations within a month, it is recommended to implement a dynamic adjustment strategy for port operation times. By applying big data technology, it is possible to accurately predict logistics demand and reasonably allocate transportation resources. This aims to reduce overall logistics operating costs through a time-sequence coordination mechanism.
The results of the above feature analysis provide insights into improving port operational efficiency and service quality, and offer empirical support for government transportation infrastructure planning and policy formulation. However, this study has certain limitations. First, the data collection period is relatively short, which may not fully reflect the impact of seasonal fluctuations or special events on container truck transportation. Future research could extend the data collection period and combine long-term historical data to further validate the stability of spatio-temporal characteristics. Second, this study primarily focuses on transportation characteristic analysis, with limited exploration of influencing factors. Subsequent research could introduce more variables, construct a comprehensive analytical framework, and delve deeper into the interactive mechanisms between container truck transportation characteristics and external environmental factors.
Author Contributions
Conceptualization, Z.L. and C.L.; methodology, K.Y. and Q.Y.; software, C.L. and K.Y.; validation, Z.L., C.L., and K.Y.; formal analysis, C.L. and K.Y.; investigation, C.L. and K.Y.; resources, Z.L.; data curation, C.L. and K.Y.; writing—original draft preparation, Z.L., C.L., and K.Y.; writing—review and editing, K.Y. and Q.Y.; visualization, C.L.; supervision, Z.L. and K.Y.; project administration, Z.L. All authors have read and agreed to the published version of the manuscript.
Funding
This research was funded by the Philosophy and Social Sciences Planning Project of Zhejiang Province (No. 25SSHZ027YB).
Data Availability Statement
Data for the study conducted here will be available upon request.
Conflicts of Interest
The authors declare no conflict of interest.
References
- Gong, X.W.; Li, J.L.; Wang, W.; Wang, L.J.; Zhang, J.P.; Xie, Y.H. Methods and Pathways for Deep Integration of Shipbuilding and Ocean Engineering Programs at Local Universities with Industry. J. High. Educ. 2025, 11, 31–34. [Google Scholar] [CrossRef]
- Wang, L.L.; Gui, J.S.; Deng, X.H.; Zeng, F.; Kuang, Z.F. Routing algorithm based on vehicle position analysis for internet of vehicles. IEEE Internet Things J. 2020, 7, 11701–11712. [Google Scholar] [CrossRef]
- Zhao, R.; Song, Y.; Zhao, Z.; Fu, Q.; Zhao, R. Bi-Objective Combinatorial Optimization Model for Emission Reduction Projects at Container Terminals Considering Investment Amount and Reduction Efficiency. Transp. Res. Rec. 2025, 2679, 1447–1465. [Google Scholar] [CrossRef]
- Hao, J.; Zhang, L.; Liu, L. Coupling relationship of freight transportation activities and transport infrastructure: Case study of Yunnan, China. J. Urban Plan. Dev. 2020, 146, 05020019. [Google Scholar] [CrossRef]
- Zhu, Z.; Meng, Y.; Cheng, R. Container Truck High-Risk Events Prediction and Its Influencing Factors Analyses Based on Trajectory Data. Systems 2025, 13, 326. [Google Scholar] [CrossRef]
- Jain, V.; Dhamaniya, A. Investigating spatiotemporal traffic dynamics toward conflict risk levels using trajectory data in heterogeneous traffic conditions. Traffic Inj. Prev. 2025; Online ahead of print. [Google Scholar] [CrossRef]
- Yang, Y.; Jia, B.; Yang, Z.; Yan, X.-Y.; Zheng, S.-T.; Liu, J.; Song, D.; Ji, H.; Gao, Z. Revealing the impacts of COVID-19 pandemic on intercity truck transport: New insights from big data analytics. Transp. Res. Part C Emerg. Technol. 2024, 169, 104861. [Google Scholar] [CrossRef]
- Yang, Y.; Liu, E.; Chen, Y.; Meng, X.; Wang, T.; Wang, H.; Zhi, D.; Song, D.; Wang, H. Assessing the resilience of urban truck transport networks under the COVID-19 pandemic: A case study of China. Transp. Res. Part E Logist. Transp. Rev. 2025, 197, 104087. [Google Scholar] [CrossRef]
- Cai, J. Research on Truck Traffic Demand Prediction Models and Evaluation Methods for the Effectiveness of Traffic Management Policies. Ph.D. Thesis, Beijing University of Technology, Beijing, China, 2019. [Google Scholar]
- Liu, F.; Gao, Z.; Janssens, D.; Jia, B.; Wets, G.; Yang, Y. Identifying business activity-travel patterns based on GPS data. Transp. Res. Part C Emerg. Technol. 2021, 128, 103136. [Google Scholar] [CrossRef]
- Oka, H.; Hagino, Y.; Kenmochi, T.; Tani, R.; Nishi, R.; Endo, K.; Fukuda, D. Predicting travel pattern changes of freight trucks in the Tokyo Metropolitan area based on the latest large-scale urban freight survey and route choice modeling. Transp. Res. Part E Logist. Transp. Rev. 2019, 129, 305–324. [Google Scholar] [CrossRef]
- Wang, Z.; Goodchild, A.; McCormack, E. A methodology for forecasting freeway travel time reliability using GPS data. Transp. Res. Procedia 2017, 25, 842–852. [Google Scholar] [CrossRef]
- Kourounioti, I.; Polydoropoulou, A. Application of aggregate container terminal data for the development of time-of-day models predicting truck arrivals. Eur. J. Transp. Infrastruct. Res. 2018, 18, 3220. [Google Scholar] [CrossRef]
- Guo, J.; Guo, H.; Chen, Z.-S.; Fan, Z.; Shang, W.-L. Spatiotemporal analysis of CO2 emissions from heavy-duty trucks in belt and road port transportation using GPS trajectory data. Resour. Conserv. Recycl. 2025, 223, 108540. [Google Scholar] [CrossRef]
- Tao, Y.; Zhang, S.; Lin, C.; Lai, X. A bi-objective optimization for integrated truck operation and storage allocation considering traffic congestion in container terminals. Ocean Coast. Manag. 2023, 232, 106417. [Google Scholar] [CrossRef]
- Ma, Y.; Schmöcker, J.-D.; Sun, W.; Nakao, S. Unravelling route choices of large trucks using trajectory clustering and conditional Logit models. Int. J. Transp. Sci. Technol. 2025, 17, 238–250. [Google Scholar] [CrossRef]
- Tahlyan, D.; Pinjari, A.R. Performance evaluation of choice set generation algorithms for analyzing truck route choice: Insights from spatial aggregation for the breadth first search link elimination (BFS-LE) algorithm. Transp. A Transp. Sci. 2020, 16, 1030–1061. [Google Scholar] [CrossRef]
- Shi, W. Spatio-Temporal Characteristics of Vehicle Travel Based on LBS. Master’s Thesis, Wuhan University of Technology, Wuhan, China, 2015. [Google Scholar]
- Kong, X.; Eisele, W.L.; Zhang, Y.; Cline, D.B.H. Evaluating the impact of real-time mobility and travel time reliability information on truck drivers’ routing decisions. Transp. Res. Rec. 2018, 2672, 164–172. [Google Scholar] [CrossRef]
- Toledo, T.; Atasoy, B.; Jing, P.; Ding-Mastera, J.; Santos, J.O.; Ben-Akiva, M. Intercity truck route choices incorporating toll road alternatives using enhanced GPS data. Transp. A Transp. Sci. 2020, 16, 654–675. [Google Scholar] [CrossRef]
- Gao, Z.; Wei, S. Analysis of the Characteristics of the Yangtze River Delta Highway Freight Network Based on Order Big Data. Reg. Res. Dev. 2022, 41, 20–25. [Google Scholar]
- Huang, Y.; Ren, T.M.; Huang, S.M.; Liu, R.D.; Mao, L.S.; Sheng, S.L. Evolution and Driving Mechanisms of Inter-city Freight Spatio-temporal Networks in Zhejiang Province under the “Internet+” Context. Econ. Geogr. 2020, 40, 126–136. [Google Scholar]
- Zhang, L.; Hao, J.; Ji, X.; Liu, L. Research on the complex characteristics of freight transportation from a multiscale perspective using freight vehicle trip data. Sustainability 2019, 11, 1897. [Google Scholar] [CrossRef]
- Yang, Y.; Jia, B.; Yan, X.-Y.; Zhi, D.; Song, D.; Chen, Y.; de Bok, M.; Tavasszy, L.A.; Gao, Z. Uncovering and modeling the hierarchical organization of urban heavy truck flows. Transp. Res. Part E Logist. Transp. Rev. 2023, 179, 103318. [Google Scholar] [CrossRef]
- Liu, Z.B.; Dai, T.Q.; Liao, C.; Hu, K.; Liang, J.S. Spatial Network Characteristics of Intercity Freight Transportation in China: A Study Based on Data from the “First Logistics” Website. Econ. Geogr. 2017, 37, 28–35. [Google Scholar]
- Yang, Y.; Jia, B.; Yan, X.-Y.; Li, J.; Yang, Z.; Gao, Z. Identifying intercity freight trip ends of heavy trucks from GPS data. Transp. Res. Part E Logist. Transp. Rev. 2022, 157, 102590. [Google Scholar] [CrossRef]
- Hu, W.; Dong, J.; Hwang, B.-G.; Ren, R.; Chen, Z. A scientometrics review on city logistics literature: Research trends, advanced theory and practice. Sustainability 2019, 11, 2724. [Google Scholar] [CrossRef]
- Luo, T.; Zheng, X.; Xu, G.; Fu, K.; Ren, W. An improved DBSCAN algorithm to detect stops in individual trajectories. ISPRS Int. J. Geo-Inf. 2017, 6, 63. [Google Scholar] [CrossRef]
- Mu, W.G.; Yang, W.H. Analysis of logistics vehicle travel characteristics based on GPS data. Compr. Physiol. 2020, 42, 83–89+113. [Google Scholar]
- Demissie, M.G.; Kattan, L. Estimation of truck origin-destination flows using GPS data. Transp. Res. Part E Logist. Transp. Rev. 2022, 159, 102621. [Google Scholar] [CrossRef]
- Gong, L.; Yamamoto, T.; Morikawa, T. Identification of activity stop locations in GPS trajectories by DBSCAN-TE method combined with support vector machines. Transp. Res. Procedia 2018, 32, 146–154. [Google Scholar] [CrossRef]
- Deng, D. DBSCAN clustering algorithm based on density. In Proceedings of the 2020 7th International Forum on Electrical Engineering and Automation (IFEEA), Hefei, China, 25–27 September 2020; pp. 949–953. [Google Scholar]
- Liao, S.; Yang, C.; Li, D. Improving precise point positioning performance based on Prophet model. PLoS ONE 2021, 16, e0245561. [Google Scholar] [CrossRef]
- Zhang, B.B.; Chen, Y.; Cao, L.J. Re-estimation of China’s digital economy scale and dynamic prediction based on machine learning. J. Lanzhou Univ. Financ. Econ. 2024, 40, 20–37. [Google Scholar]
- Ma, X.; Wang, Y.; McCormack, E.; Wang, Y. Understanding freight trip-chaining behavior using a spatial data-mining approach with GPS data. Transp. Res. Record. 2016, 2596, 44–54. [Google Scholar] [CrossRef]
- Deng, S.F.; Zhu, J.X.; Zhong, C.B. Analysis of the Evolution of Spatial Correlation Patterns in Freight Logistics in Jiangsu Province under the Background of Industrial Transformation and Upgrading. Reg. Res. Dev. 2019, 38, 35–40. [Google Scholar]
- Tahlyan, D.; Pinjari, A.R.; Luong, T.; Ozkul, S. Truck Route Choice Modeling Using Large Streams of GPS Data; Rutgers University: New Brunswick, NJ, USA; Center for Advanced Infrastructure and Transportation: Piscataway, NJ, USA, 2017. [Google Scholar]
- Shimazoe, K.; Takahashi, H.; Shi, B.; Orita, T.; Furumiya, T.; Ooi, J.; Kumazawa, Y. Dynamic time over threshold method. IEEE Trans. Nucl. Sci. 2013, 59, 3213–3217. [Google Scholar] [CrossRef]
| Disclaimer/Publisher’s Note: The statements, opinions and data contained in all publications are solely those of the individual author(s) and contributor(s) and not of MDPI and/or the editor(s). MDPI and/or the editor(s) disclaim responsibility for any injury to people or property resulting from any ideas, methods, instructions or products referred to in the content. |
© 2025 by the authors. Licensee MDPI, Basel, Switzerland. This article is an open access article distributed under the terms and conditions of the Creative Commons Attribution (CC BY) license (https://creativecommons.org/licenses/by/4.0/).
