Article

Exploring the Evolutionary Traits of Post-Disaster Reconstruction Under the Background of Sustainable Development

1
School of Economics and Management, Jiangxi University of Science and Technology, Ganzhou 341000, China
2
School of Economics and Management, Harbin Institute of Technology (Weihai), Weihai 264200, China
3
Graduate School of Global Environmental Studies, Sophia University, Tokyo 162-8601, Japan
*
Author to whom correspondence should be addressed.
These authors contributed equally to this work.
Systems 2025, 13(12), 1063; https://doi.org/10.3390/systems13121063
Submission received: 9 October 2025 / Revised: 18 November 2025 / Accepted: 21 November 2025 / Published: 24 November 2025
(This article belongs to the Section Complex Systems and Cybernetics)

Abstract

Sustainable development serves as a key gripper and critical juncture for disaster-stricken regions to achieve the goal of “building back better”, and post-disaster reconstruction (PDR) involves complex system engineering. To explore the evolutionary traits of PDR under the background of sustainable development, this paper analyzes the internal subsystems and the corresponding state variables of PDR based on complex system thinking, and establishes a nonlinear dynamic model to describe how PDR evolves by using synergetics and the Logistic equation. Through dissecting the model, this paper determines all the evolutionary equilibrium points of PDR as well as the conditions allowing these points to stabilize, identifies the evolutionary pathways of PDR, and verifies the proposed model and the results deduced from the model by simulations. Results show that the ideal steady state of PDR needs to balance multi-dimensional sustainability. This study also finds that the evolutionary pathways of PDR, along with the corresponding stage-specific measures, are mainly determined by the initial conditions of PDR, the resource inputs of each subsystem, and the interactions between subsystems.

1. Introduction

Natural or human-induced disasters—such as earthquakes, landslides, fires, toxic spills, tornadoes, and terrorist attacks—can strike human society with little or no warning and cause considerable environmental damage, immeasurable social losses, and substantial economic shocks, which seriously hinder disaster-stricken areas from developing sustainably [1,2,3]. In recent years, disasters have occurred with increasing frequency and intensity, creating a continuously growing need associated with the sustainable development of post-disaster reconstruction (PDR) [4]. After disasters, disaster-stricken regions would carry out disaster response and PDR in sequence. However, public attention and investment in disaster-stricken regions gradually diminish from the disaster response to PDR, yielding the result that PDR is often treated as the least surveyed and understood phase of disaster management [5]. Historic disasters have repeatedly corroborated the importance of PDR; for example, five years after the 2010 Haiti earthquake, about 65000 disaster victims were still homeless [6]. PDR is a complex system of systems, and its internal multifaceted complexity tends to overshadow the dynamic evolutionary laws of PDR [7]. As a result, it is difficult for relevant stakeholders to effectively manage PDR [8], let alone achieve sustainable recovery and reconstruction. Therefore, it is worth further surveying the evolutionary traits of PDR, which constitutes an important precondition to promote PDR with high quality under the context of sustainable development.
The existing literature prefers to qualitatively explore how PDR develops, relying on its inclusions from a local perspective [9,10]. For example, Ngulube et al. [11] surveyed what factors influenced participatory post-disaster housing reconstruction processes using qualitative methods such as observations and focus groups. Few studies apply quantitative methods to globally investigate how PDR evolves by taking all of its subsystems into consideration, let alone directly at sustainable PDR. Driven by the actual need to manage PDR as comprehensively as possible and the above research gap, this paper tries to establish matched holistic models to discuss the evolution of PDR in a more precise way when sustainable development is desired. Conceptual models are frequently proposed to grasp PDR, but they are unable to delineate the complex composition and dynamic properties of PDR due to their reductionism and mechanisms [12,13]. Complex systems thinking, which offers extensive quantitative analysis ranging from local to global levels, has been demonstrated as useful for describing PDR [14,15]. The existing studies based on complex systems thinking quantitatively dissect the complexity of PDR through designing holistic models [16,17,18]; however, these studies cannot show how PDR leverages its subsystems and inter-subsystem interactions to evolve. Fortunately, synergetics is born to research how all the subsystems within a complex system interact to give rise to macroscopic ordered behaviors [19]. PDR mainly includes an environmental system, a social system, and an economic system, which is widely adopted [5,20,21]. Given the environmental–social–economic nature of PDR, this paper establishes nonlinear dynamic models using synergetics and the Logistic equation to quantitatively probe the evolutionary traits of PDR in a bottom-up way.
The contributions of this study are presented as follows: (1) This study devises a three-dimensional nonlinear dynamic model to analyze the evolutionary stability and evolutionary pathways of PDR when sustainable development is emphasized, which overcomes current research inadequacies represented by conceptual and non-synergistic models along with local and qualitative-leaning analysis, provides a novel research paradigm in the area of PDR as a complex environmental–social–economic system, and enriches the applications of synergetics. (2) Numerical simulations on how PDR stabilizes at each equilibrium point, and how PDR evolves to the ideal equilibrium point through stepwise and leapfrogging pathways, are conducted to verify the proposed model and its theoretical results, which can provide scientific guidance to promote sustainable PDR by stages. The proposed methodology, as well as the consequent results, incorporates prior research to present a theoretically sound framework for PDR to realize the goal of “building back better” in the context of sustainable development.
The remainder of this study is organized as follows. Section 2 presents a review of relevant studies; Section 3 proposes and analyzes the nonlinear evolutionary model for PDR under the background of sustainable development; Section 4 performs a series of numerical simulations; and Section 5 concludes this paper.

2. The Literature Review

2.1. PDR Models

PDR presents many complex system characteristics, including dynamics, nonlinearity, emergence, and irreversibility, just to name a few [4]. To better understand PDR as a whole, related studies prefer to design varied conceptual frameworks, such as a decision-making framework for prioritizing PDR projects [22], a multi-dimensional framework to evaluate disaster recovery pathways [23], a framework for assessing the indirect economic impacts of PDR [24], a probabilistic recovery framework for modeling electric power networks [6], and a digital twin-based post-disaster risk management framework [25]. Such conceptual frameworks can provide guidance for PDR; however, most of these frameworks are limited by their reductionism and mechanisms and find it difficult to explain the complex behaviors and traits of PDR [26]. Therefore, many studies turn to constructing models for PDR based on complex systems thinking and have yielded several foundational results, such as agent-based or complex-network-based models of post-disaster recovery [14,17,27], fractional-order models of post-earthquake recovery [16], and low-carbon reconstruction models based on dissipative structure theory [28].
As can be seen in the above research, complex system theories, methods, and tools are very suitable for modeling PDR; however, these studies do not reveal how PDR relies on the competition and cooperation among its subsystems to evolve in an orderly manner. Synergetics, a key theory investigating complex systems, is unique in terms of uncovering how global evolution emerges through local competition and collaboration [19]. Nonlinear dynamics provides a solid mathematical foundation to understand the ideas of synergetics [29,30]. For this reason, this paper attempts to establish a nonlinear dynamic model for PDR based on synergetics, which enables the exploration of the dynamic evolutionary laws of PDR.

2.2. PDR Composition

PDR is a multi-coupled field that pre-disaster legacy elements and post-disaster emerging elements cohere closely [31]. Affected by the overlapping effects between system elements, PDR in developing countries and regions often takes years or even decades to reshape stable states [17,24]. Therefore, what PDR includes and how PDR develops depending on its inclusions warrants thorough investigation and is explored by some researchers. As to what PDR includes, no consensus has been reached, but the prevailing view holds that PDR mainly involves three typical elements, namely a social system, an environmental system, and an economic system [5,20,21]. The non-mainstream divisions of PDR are diverse. For example, Xiao et al. [32] divided PDR into a socioeconomic development subsystem and an ecological environment subsystem and examined the coupling coordination degree between these two subsystems; Xue et al. [14] modeled post-disaster recovery as a multilayer network, which is composed of a human layer, a social infrastructure layer, and a physical infrastructure. No matter how PDR is divided, all of its subsystems contribute to its development. However, existing research focuses on the local reconstruction of disaster-stricken regions, such as the reconstruction of electric power networks [6], shelters [33], and infrastructures [3]. It is necessary to globally study PDR through taking all the subsystems into account. With respect to how PDR develops depending on its inclusions, existing studies tend to carry out investigations in a qualitative way. For example, Ngulube et al. [34] investigated citizen participation in post-earthquake recovery using qualitative data and found that interpersonal interactions had been a great challenge for citizen participation during the recovery process; Okunola [35] explored how community stakeholders linked by varied interactions shaped disaster recovery by qualitative methods such as semi-structured interviews. Although these qualitative explorations are meaningful, they offer extremely limited utility when more accurate and objective PDR is needed. PDR is a complex system with nonlinear interactions linking its subsystems; hence, more attention needs to be paid to discussing how PDR evolves with nonlinear interactions inside itself in a quantitative way.
In the context of sustainable development, the environmental system, social system, and economic system are still the leading subsystems of PDR, and they jointly determine the evolutionary processes and the final states of PDR with nonlinear interactions between them [36,37]. Based on the prevailing view of PDR composition, this paper attempts to quantitatively survey how PDR relies on its environmental system, social system, and economic system to evolve in a bottom-up way when nonlinear interactions exist between the three subsystems.

2.3. Conceptualizing Sustainable PDR

The concept of sustainable development, which is often treated as synonymous with the concept of sustainability in the academic field [38,39,40], can be dated back to the late 18th century, when Thomas Malthus published his essay to elucidate that the world would encounter unbalanced relations between the exponential growth of population and the arithmetic growth of available food [41]. In 1987, the World Commission on Environment and Development presented the first formal and most politically significant definition of sustainable development: “sustainable development is development that meets the needs of the present without compromising the ability of future generations to meet their own needs” [42]. This statement is criticized as an ambiguous and inaccurate definition, and many subsequent studies attempt to deepen the understanding of sustainable development by proposing sustainability principles, frameworks, indicators, metrics, tools, methodologies, and so on [43]. For example, the World Conservation Union proposed a composite of 88 indicators for 180 countries to measure sustainable development [44], and Ben-Eli [45] put forward five core principles to comprehend sustainability. After more than two centuries of evolution, sustainable development has been assigned diverse definitions and understandings, with different emphases on what is to be sustained, what is to be developed, how to balance present and future, etc. [46,47].
Although there is no unified definition associated with sustainable development to date [40], it is widely accepted that the concept of sustainable development should be grasped in terms of the three pillars of environmental, social, and economic aspects [48,49], including in the field of PDR [1,4]. Based on this broadly recognized viewpoint, this paper tries to explore the sustainability of PDR in light of environmental sustainability, social sustainability, and economic sustainability, which are viewed herein as the state variables of the environmental system, the social system, and the economic system of PDR, respectively.

2.4. The Position of This Paper

This paper tries to investigate evolutionary traits of PDR under the background of sustainable development. This study differs from previous research in two ways. On one hand, existing studies prefer to characterize PDR by constructing conceptual models based on mechanisms and reductionism, and such models are of limited utility in accounting for the complex evolution of PDR. Moreover, existing research has also put forward some complex systems models of PDR, although these models cannot reveal how the subsystems of PDR interact. Therefore, this paper attempts to fill this research gap by using synergetics to establish a nonlinear dynamic model for PDR when sustainable development is emphasized. On the other hand, this paper explores PDR composition in a global and quantitative way, which is different from the literature marked by local or qualitative exploration of PDR composition. In conclusion, through surveying the evolutionary stability and pathways of PDR under the background of sustainable development, we can provide more guidance for disaster-stricken regions to realize the goal of “building back better”. Table 1 compares the PDR models and PDR composition used in previous studies and those employed in this research. In Table 1, “✓” denotes that the relevant papers carry out the corresponding research.

3. Evolutionary Model of PDR

3.1. Model Assumptions

PDR is a dynamic super system in nature. In line with previous studies, PDR is divided into an environmental system, a social system, and an economic system in this study. This research makes three assumptions to lay the foundation for the following model construction and model analysis:
Assumption 1. The environmental system, the social system, and the economic system of PDR develop as a function of time marked as t. Under the influences of all the factors, these three subsystems change continuously and together depict the evolutionary processes of PDR in the context of sustainable development.
Assumption 2. If the environmental system develops solely, its evolution follows the growth law represented by the Logistic equation. The same is true for the social system and the economic system.
Assumption 3. During the PDR process, there exist complex nonlinear interactions between the environmental system, the social system, and the economic system. Such interactions can pose positive or negative impacts on the corresponding systems.
PDR is a time-varying complex system. From a complex systems perspective, how a complex system develops is determined by its subsystems and the nonlinear interactions between them when external conditions remain constant [50,51]. Such interactions may be beneficial or harmful to system growth. For example, competition and mutualism are two kinds of such nonlinear interactions; competition can inhibit the growth of interacting systems, while mutualism benefits the growth of interacting systems [52]. As a result, assumption 1 and assumption 3 are reasonable. Based on the biological principles of limited resources and intraspecific competition, a system cannot realize unrestrained growth and could experience S-shaped growth, which can be modeled by the Logistic equation [53]. Therefore, assumption 2 is also rational.

3.2. Model Construction

As mentioned above, PDR is an environmental–social–economic system. In accordance with nonlinear dynamics, the evolutionary laws of a system can be dynamically described by system features or attributes, which are defined as state variables [54]. In the context of sustainable development, the state variables of environmental systems, social systems, and economic systems are refined as environmental sustainability, social sustainability, and economic sustainability, respectively [2]. Environmental sustainability in PDR underscores minimizing the ecological footprint during recovery processes and enhancing the resilience of reconstructed areas against future environmental hazards [4]. Social sustainability in PDR centers on whether reconstruction efforts equitably consider the different needs of all stakeholders regarding social inclusion and enhance knowledge on disaster-risk reduction [55]. Economic sustainability in PDR emphasizes that reconstruction efforts should promote local economies, support local businesses, and create new employment opportunities in a cost-effective way [56].
An S-shaped function can be applied to depict how sustainability develops [1], and it is quantified as the Logistic equation in this paper. If all the subsystems of PDR develop in isolation, how PDR changes over time is denoted as follows:
d x 1 d t = α 1 x 1 β 11 x 1 2 d x 2 d t = α 2 x 2 β 22 x 2 2 d x 3 d t = α 3 x 3 β 33 x 3 2
where x1, x2, and x3 are state variables that stand for environmental sustainability, social sustainability, and economic sustainability, respectively; α1 represents the changing rate of environmental sustainability when the environmental system with constant inputs develops independently in PDR—the greater the value of α1 is, the more inputs the environmental system has, and the same is true for α2 and α3. Let βij (i = j = 1, 2, 3) indicate the auto-inhibited effects of xi. βij (i = j) generally satisfies βij > 0 because limited resources can be gradually consumed during PDR processes, and auto-inhibited effects emerge and hinder xi from growing when resource consumption increases to a certain degree. In fact, there exist nonlinear relations between the environmental system, the social system, and the economic system of PDR, so that Equation (1) cannot represent the actual evolution of PDR. As a result, the evolutionary model of PDR is adjusted as follows:
d x 1 d t = α 1 x 1 β 11 x 1 2 β 12 x 1 x 2 β 13 x 1 x 3 d x 2 d t = α 2 x 2 β 21 x 2 x 1 β 22 x 2 2 β 23 x 2 x 3 d x 3 d t = α 3 x 3 β 31 x 3 x 1 β 32 x 3 x 2 β 33 x 3 2
where product xixj (ij; i = 1, 2, 3; j = 1, 2, 3) represents the nonlinear relationships between xi and xj; βij (ij) shows the influences that the nonlinear relationships between xi and xj exert on the growth of xi. If βij > 0, the nonlinear relationships between xi and xj restrain the growth of xi; if βij < 0, the nonlinear relationships between xi and xj promote the growth of xi; if βij = 0, the nonlinear relationships between xi and xj do not affect the growth of xi.

3.3. Model Analysis

3.3.1. Evolutionary Stability Analysis

To survey the dynamics of PDR and to ensure that PDR can evolve to expected states, analyzing the evolutionary stability of PDR is required. Let d x i d t = 0 i = 1 , 2 , 3 in Equation (2), then eight equilibrium points can be obtained. These equilibrium points are denoted as E1(0, 0, 0), E2 α 1 β 11 , 0 , 0 , E3 0 , α 2 β 22 , 0 , E4 0 , 0 , α 3 β 33 , E5 α 1 β 22 α 2 β 12 β 11 β 22 β 12 β 21 , α 2 β 11 α 1 β 21 β 11 β 22 β 12 β 21 , 0 , E6 α 1 β 33 α 3 β 13 β 11 β 33 β 13 β 31 , 0 , α 3 β 11 α 1 β 31 β 11 β 33 β 13 β 31 , E7 0 , α 2 β 33 α 3 β 23 β 22 β 33 β 23 β 32 , α 3 β 22 α 2 β 32 β 22 β 33 β 23 β 32 , and E8 P 1 P , P 2 P , P 3 P , where P = β 11 β 12 β 13 β 21 β 22 β 23 β 31 β 32 β 33 , P 1 = α 1 β 12 β 13 α 2 β 22 β 23 α 3 β 32 β 33 , P 2 = β 11 α 1 β 13 β 21 α 2 β 23 β 31 α 3 β 33 , and P 3 = β 11 β 12 α 1 β 21 β 22 α 2 β 31 β 32 α 3 .
PDR could stabilize at the above equilibrium points. The equilibrium point E1 denotes that environmental sustainability, social sustainability, and economic sustainability all equal zero when the environmental system, social system, and economic system develop in unison, meaning that PDR fails in terms of sustainable development. E2 represents that environmental sustainability, social sustainability, and economic sustainability, respectively, become α 1 β 11 , 0, and 0 in the end, indicating that PDR merely contains its environmental system; the same is true for E3 and E4. E5 shows that environmental sustainability, social sustainability, and economic sustainability ultimately become α 1 β 22 α 2 β 12 β 11 β 22 β 12 β 21 , α 2 β 11 α 1 β 21 β 11 β 22 β 12 β 21 , and 0, respectively, signifying that PDR restores its environmental system and social system; the same is true for E6 and E7. E8 suggests that environmental sustainability, social sustainability, and economic sustainability separately reach non-zero values, implying that PDR restores all the subsystems at the same time. It should be pointed out that this study only considers the case that equilibrium points possess non-negative values. Generally, PDR represented by equilibrium points E1, E2/E3/E4, E5/E6/E7, and E8 gradually improves.
To perform the local stability of PDR, it is necessary to further analyze the stability of Equation (2) at each equilibrium point by calculating the corresponding Jacobian matrix. The Jacobian matrix of Equation (2) at Ei (i = 1, 2, …, 8) is outlined below:
J E i = V 1 V 2 V 3 V 4 V 5 V 6 V 7 V 8 V 9
where V 1 = α 1 2 β 11 x 1 β 12 x 2 β 13 x 3 , V 2 = β 12 x 1 , V 3 = β 13 x 1 , V 4 = β 21 x 2 , V 5 = α 2 β 21 x 1 2 β 22 x 2 β 23 x 3 , V 6 = β 23 x 2 , V 7 = β 31 x 3 , V 8 = β 32 x 3 , and V 9 = α 3 β 31 x 1 β 32 x 2 2 β 33 x 3 . The characteristic equation of the above Jacobian matrix J(Ei) is as follows:
λ 3 + δ 1 λ 2 + δ 2 λ + δ 3 = 0
where δ 1 = V 1 + V 5 + V 9 , δ 2 = V 1 V 5 + V 1 V 9 + V 5 V 9 V 2 V 4 V 3 V 7 V 6 V 8 , and δ 3 = V 1 V 6 V 8 + V 2 V 4 V 9 + V 3 V 5 V 7 V 1 V 5 V 9 V 2 V 6 V 7 V 3 V 4 V 8 .
If all the eigenvalues of the characteristic equation at an equilibrium point are negative or have negative real parts, then the equilibrium point is stable. According to the Routh–Hurwitz criterion [57], the necessary and sufficient conditions that all the eigenvalues of a characteristic equation are negative or have negative real parts are that all the Routh–Hurwitz determinants (RHi, i = 1, 2, 3) are positive, where R H 1 = δ 1 , R H 2 = δ 1 1 δ 3 δ 2 , and R H 3 = δ 1 1 0 δ 3 δ 2 δ 1 0 0 δ 3 . This paper discusses the stability of Ei (i = 1, 2, …, 8) based on the Routh–Hurwitz criterion.

3.3.2. Evolutionary Pathway Analysis

PDR can evolve to high-level states in both stepwise and leapfrogging ways, which means that PDR can develop through stepwise pathways and leapfrogging pathways. PDR needs to balance its three subsystems and maintain the corresponding sustainability at non-zero levels in order that it can realize its ideal stable states. Therefore, the equilibrium point labeled as E8 is the only ideal state that PDR seeks to stabilize, and Ei (i = 1, 2, …, 7) can be the initial stable equilibrium points or intermediate stable equilibrium points before PDR reaches E8.
The stepwise evolutionary pathways of PDR mean the pathways that PDR restores its environmental system, social system, and economic system to the ideal state, step by step. If PDR without intervention would stabilize at E1, it can recover to the state represented by E8 via six sequential evolutionary pathways, namely E1E2E5E8, E1E2E6E8, E1E3E5E8, E1E3E7E8, E1E4E7E8, and E1E4E6E8. The realization of these six stepwise pathways requires taking a minimum of three phase-specific measures at the right time. To be specific, the first-phase interventions must be implemented before PDR plateaus at E1, otherwise PDR would maintain stability at E1 forever; the second-phase measures can be deployed at an arbitrary time before, during, or after PDR stabilizes at E2/E3/E4; and the third-phase actions can be taken at any point before, during, or after stabilization at E5/E6/E7. The measures at all stages mainly concern the resource inputs of the environmental system, social system, and economic system, and the interactions between these subsystems, which are known as parameters αi and βij (i = 1, 2, 3; j = 1, 2, 3; ij). Through depending on the above six stepwise pathways, disaster-stricken areas are able to identify and overcome the barriers to sustainable development in each subsystem one by one. For example, the evolutionary pathway E1E2E5E8 denotes that PDR first reshapes its environmental system by varied measures such as ecological remediation and infrastructure construction, then recovers its social system by housing improvements, resource allocation optimization, etc., and finally adopts diverse economic approaches to reconstruct its economic system. Following the pathway, PDR can realize sustainable development.
If PDR without interference stabilizes at E2, E2E6E8 and E2E5E8 are two available evolutionary pathways for PDR to reach E8 step by step; if E3 is the initial stable equilibrium point of PDR, E3E5E8 and E3E7E8 are able to gradually guide PDR to evolve towards E8; if PDR remains steady at E4 with its initial conditions, it can recover to E8 by two stepwise evolutionary pathways, which are, respectively, denoted as E4E7E8 and E4E6E8; the achievement of the above six pathways needs to take at least two phased actions, and these two staged actions can be implemented at any time before, during, or after PDR stabilizes at the corresponding equilibrium point. If disaster- stricken areas are initially equipped with available resources to stabilize at E5, E6, or E7, its reconstruction can directly evolve towards E8 by E5E8, E6E8, or E7E8, respectively; the successful fulfillment of these three evolutionary pathways needs to take at least one staged measure at any time before, during, or after PDR stabilizes at E5/E6/E7. The stepwise evolutionary pathways of PDR are summarized in Table 2.
The leapfrogging evolutionary pathways signify the pathways by which PDR skips intermediate states and reaches its expected states in a non-consecutive manner, and they emphasize that PDR restores two or more subsystems simultaneously. If PDR stabilizes at E1 with its initial conditions, it can evolve towards E8 by seven leapfrogging pathways, namely E1E2E8, E1E3E8, E1E4E8, E1E8, E1E5E8, E1E6E8, and E1E7E8. The former three pathways restore one subsystem of PDR with priority, and then recover the remaining two subsystems; conversely, the latter three pathways give priority to developing two subsystems of PDR, with the recovery of the remaining one subsystem to follow; realizing these six pathways needs to take at least two phased measures, of which the first-phase measures must be carried out before the stabilization at E1, and the second-phase measures can be implemented at any time before, during, or after the stabilization at Ei (i = 2, 3, …, 7). For example, the evolutionary pathway E1E5E8 represents a pathway in which PDR first recovers its environmental system and social system concurrently via countermeasures of environmental protection, societal governance, and so on, followed by the development of the economic system using effective economic measures. The pathway E1E8 concurrently develops all the subsystems of PDR by taking one necessary action before PDR stabilizes at E1. If PDR is qualified with proper initial conditions to stabilize at E2, E3, or E4, its direct evolution to E8 just needs one stage-skipping development, which is supported by at least one staged measure executed without time constraints. For instance, disaster-stricken regions with adequate environmental substrates can directly transit to E8 with powerful economic and social backings. The leapfrogging evolutionary pathways of PDR are summarized in Table 2.

4. Numerical Simulations

This section conducts a series of numerical simulations to verify the above theoretical results and to visually show the evolutionary traits of PDR under the background of sustainable development.

4.1. Simulations on Evolutionary Stability

To validate the evolutionary stability of PDR represented by Equation (2), this section first sets values for parameters αi and βij (i = 1, 2, 3; j = 1, 2, 3) in Equation (2), and the specific parameter settings are shown in Table 3. According to Table 3, when α1 = α2 = α3 = 1, β11 = β22 = β33 =1, β12 = β21 = −0.04, β13 = β31 = −0.03, and β23 = β32 = −0.02, the equilibrium points of Equation (2) and the stabilizing conditions of these equilibrium points are summarized as follows: (1) The effective equilibrium points of Equation (2) are Ei (i = 1, 2, …, 8). (2) RHi > 0 (i = 1, 2, 3) does not always hold for Ei (i = 1, 2, …, 7); therefore, these equilibrium points are unstable, and PDR cannot stabilize at these equilibrium points. (3) RHi > 0 (i = 1, 2, 3) always holds for E8 whatever the initial values of xi (i = 1, 2, 3); thus, E8 is stable, which means that PDR finally stabilizes at E8 with environmental sustainability, social sustainability, and economic sustainability equaling 1.074, 1.064, and 1.054, respectively, as shown in Figure 1.
When α1 = −0.1, α2 = −0.3, α3 = −0.2, β11 = β22 = β33 =1, β12 = −0.03, β13 = −0.04, β21 = 0.4, β23 = −0.02, β31= 0.3, and β32 = 0.02, E1 is the unique effective equilibrium point of Equation (2); moreover, PDR stabilizes at E1 because RHi > 0 (i = 1, 2, 3) always holds for E1. When α1 = 0.5, α2 = 0.1, α3 = 0.1, β11 = β22 = β33 =1, β12 = −0.03, β13 = −0.04, β21 = 0.4, β23 = 0.02, β31= 0.4, and β32 = 0.02, Ei (i = 1, 2, 3, 4, 7) are the effective equilibrium points of Equation (2), RHi > 0 (i = 1, 2, 3) holds exclusively for E2, and PDR eventually converges to E2 (0.5, 0, 0). Similarly, if parameter settings make an equilibrium point effective and enable all the Routh–Hurwitz determinants at this point to be positive, PDR would ultimately become stable at the equilibrium point, as shown in Table 3. For simplicity, this section omits simulating the evolutionary stability of PDR at Ei (i = 1, 2, …, 7).

4.2. Simulations on Evolutionary Pathways

This section conducts simulations to verify the evolutionary pathways proposed in Section 3.3.2 and to vividly present how PDR evolves from non-ideal states to ideal stable states through the proposed pathways. The iteration duration t is set as 50 or 100, depending on specific evolutionary pathways.

4.2.1. Simulations on Stepwise Evolutionary Pathways

This section focuses on simulating the stepwise evolutionary pathways of PDR. Since the stepwise pathways from Ei (i = 2, …, 7) to E8 are covered in the stepwise pathways from E1 to E8, this section just simulates the evolutionary pathways starting from E1 and omits the simulations on the stepwise pathways from Ei (i = 2, …, 7) to E8. The detailed simulation results are displayed in the following figures.
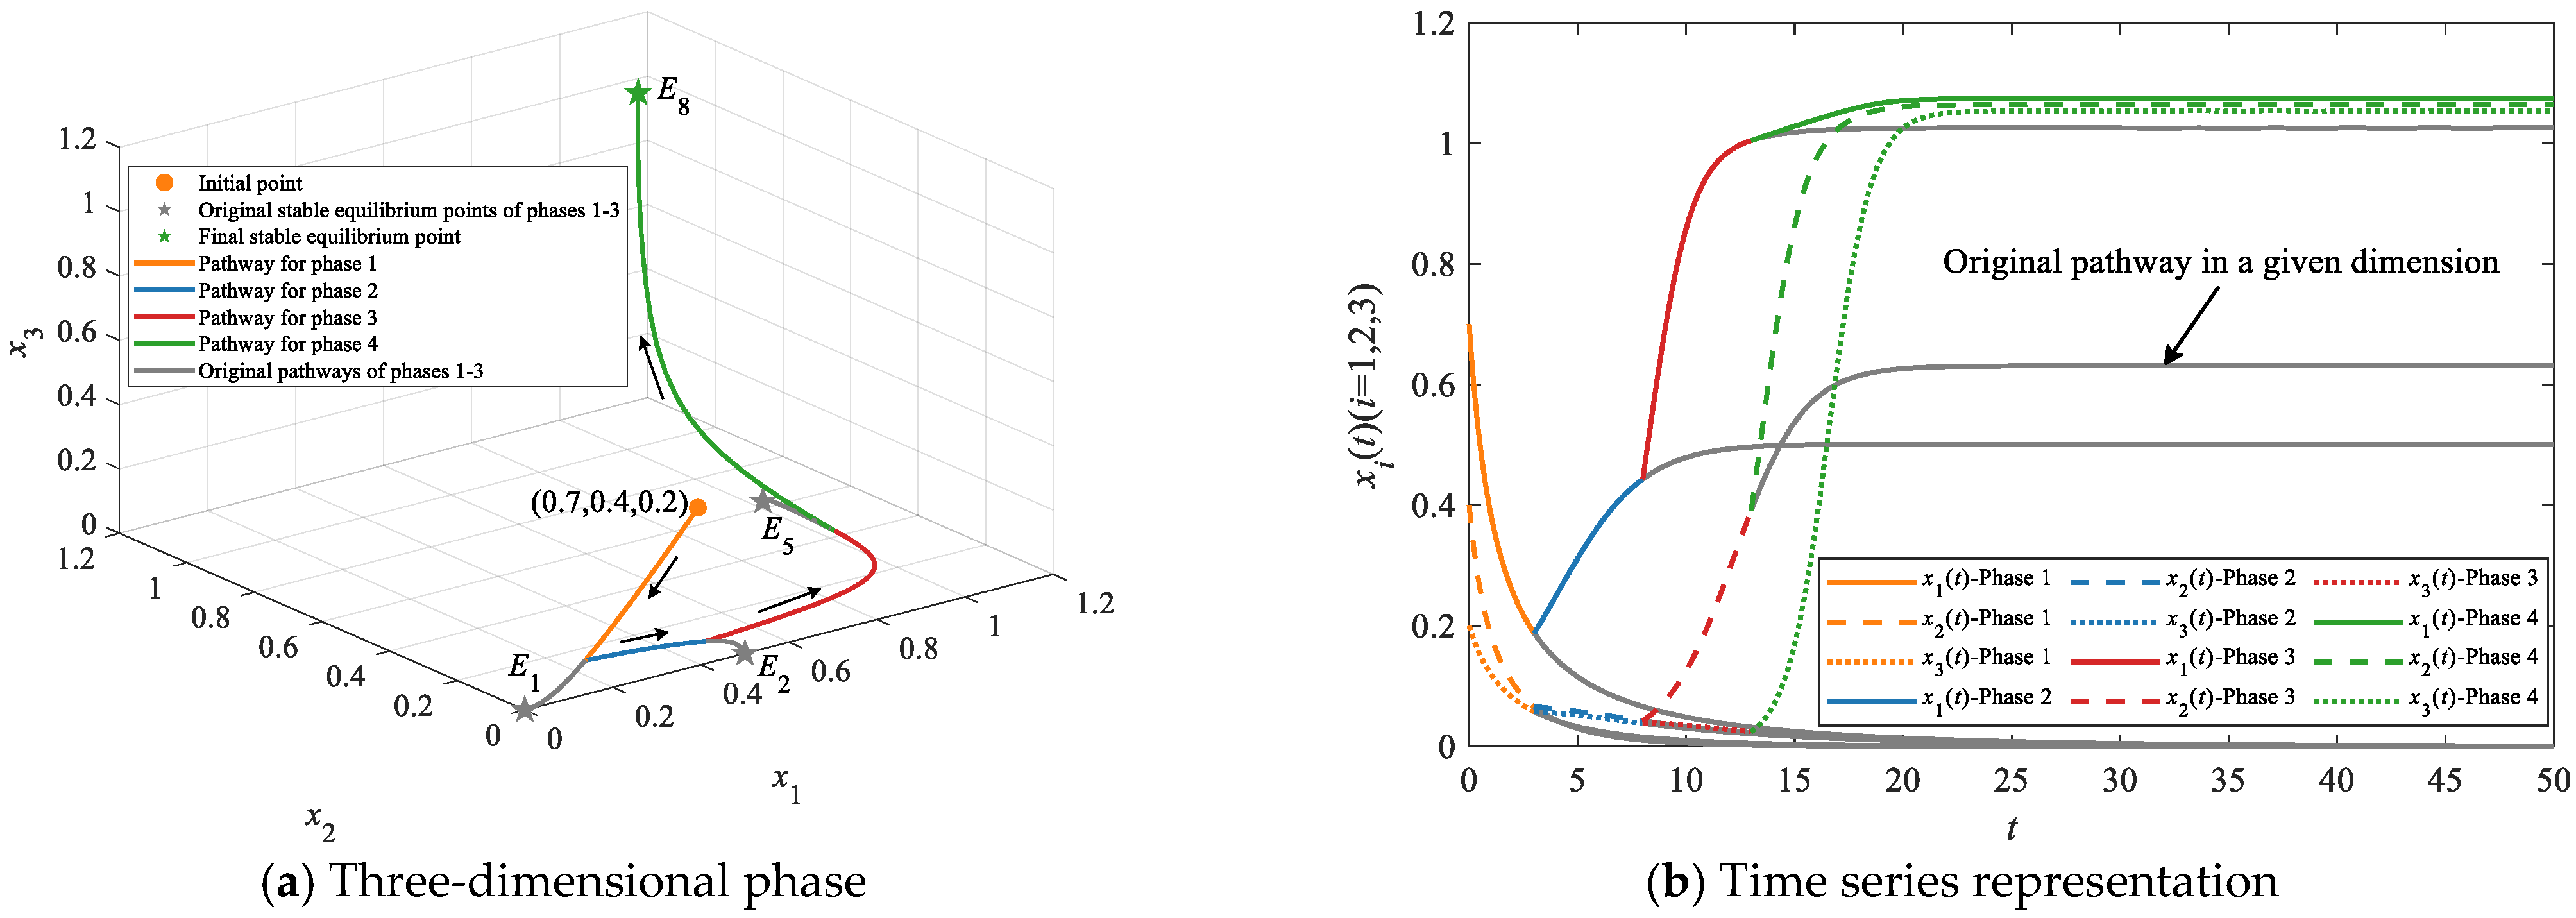
If the initial parameter values of PDR precisely match those listed in Table 3 and make E1 stable, and if the initial point of PDR is (0.7, 0.4, 0.2), PDR along the stepwise evolutionary pathway E1E2E5E8 could adhere to the procedures below: (1) When t = 3, PDR needs to increase the inputs of each subsystem, reinforce the inhibitory effects of social–economic interactions on the growth of social sustainability and the inhibitory effects of the environmental–economic couplings on the growth of economic sustainability; more precisely, parameters αi (i = 1, 2, 3), β23, and β31 need to be increased to α1 = 0.5, α2 = 0.1, α3 = 0.1, β23 = 0.02, and β31 = 0.4, respectively. By implementing these measures, PDR can gradually deviate from the original stable equilibrium point of phase 1 (i.e., E1) and evolve towards E2, as shown in Figure 2. (2) When t = 8, it is necessary to continuously increase the inputs of each subsystem, enhance the promoting effects of social–environmental and social–economic interactions on the growth of social sustainability, and weaken the inhibitory effects of environmental–economic interactions on the growth of economic sustainability; to be more exact, parameters αi (i = 1, 2, 3) should be separately increased to α1 = 1, α2 = 0.6, and α3 = 0.2, and parameters β21, β23, and β31 should be decreased to β21 = −0.03, β23 = −0.02, and β31 = 0.3, respectively. By these measures, PDR can progressively stray from the original stable equilibrium point of phase 2 (i.e., E2) and evolve towards E5, as shown in Figure 2. (3) When t = 13, PDR could keep adding the inputs of the social system and the economic system, adjust the promoting effects of environmental–social and environmental–economic interactions on the growth of environmental sustainability, strengthen the promoting effects of social–environmental interactions on the growth of social sustainability and the promoting effects of economic–environmental and economic–social interactions on the sustainable growth of the economic system; specifically, parameters αi (i = 2, 3) should be individually increased to α2 = 1 and α3 = 1, parameters β12 and β13 should be separately adjusted to β12 = −0.04 and β13 = −0.03, and parameters β21, β31, and β32 should be decreased to β21 = −0.04, β31 = −0.03, and β32 = −0.02, respectively. After taking these steps, PDR can slowly move away from the original stable equilibrium point of phase 3 (i.e., E5) and converge steadily to the stable equilibrium point of phase 4 (i.e., E8), as shown in Figure 2.
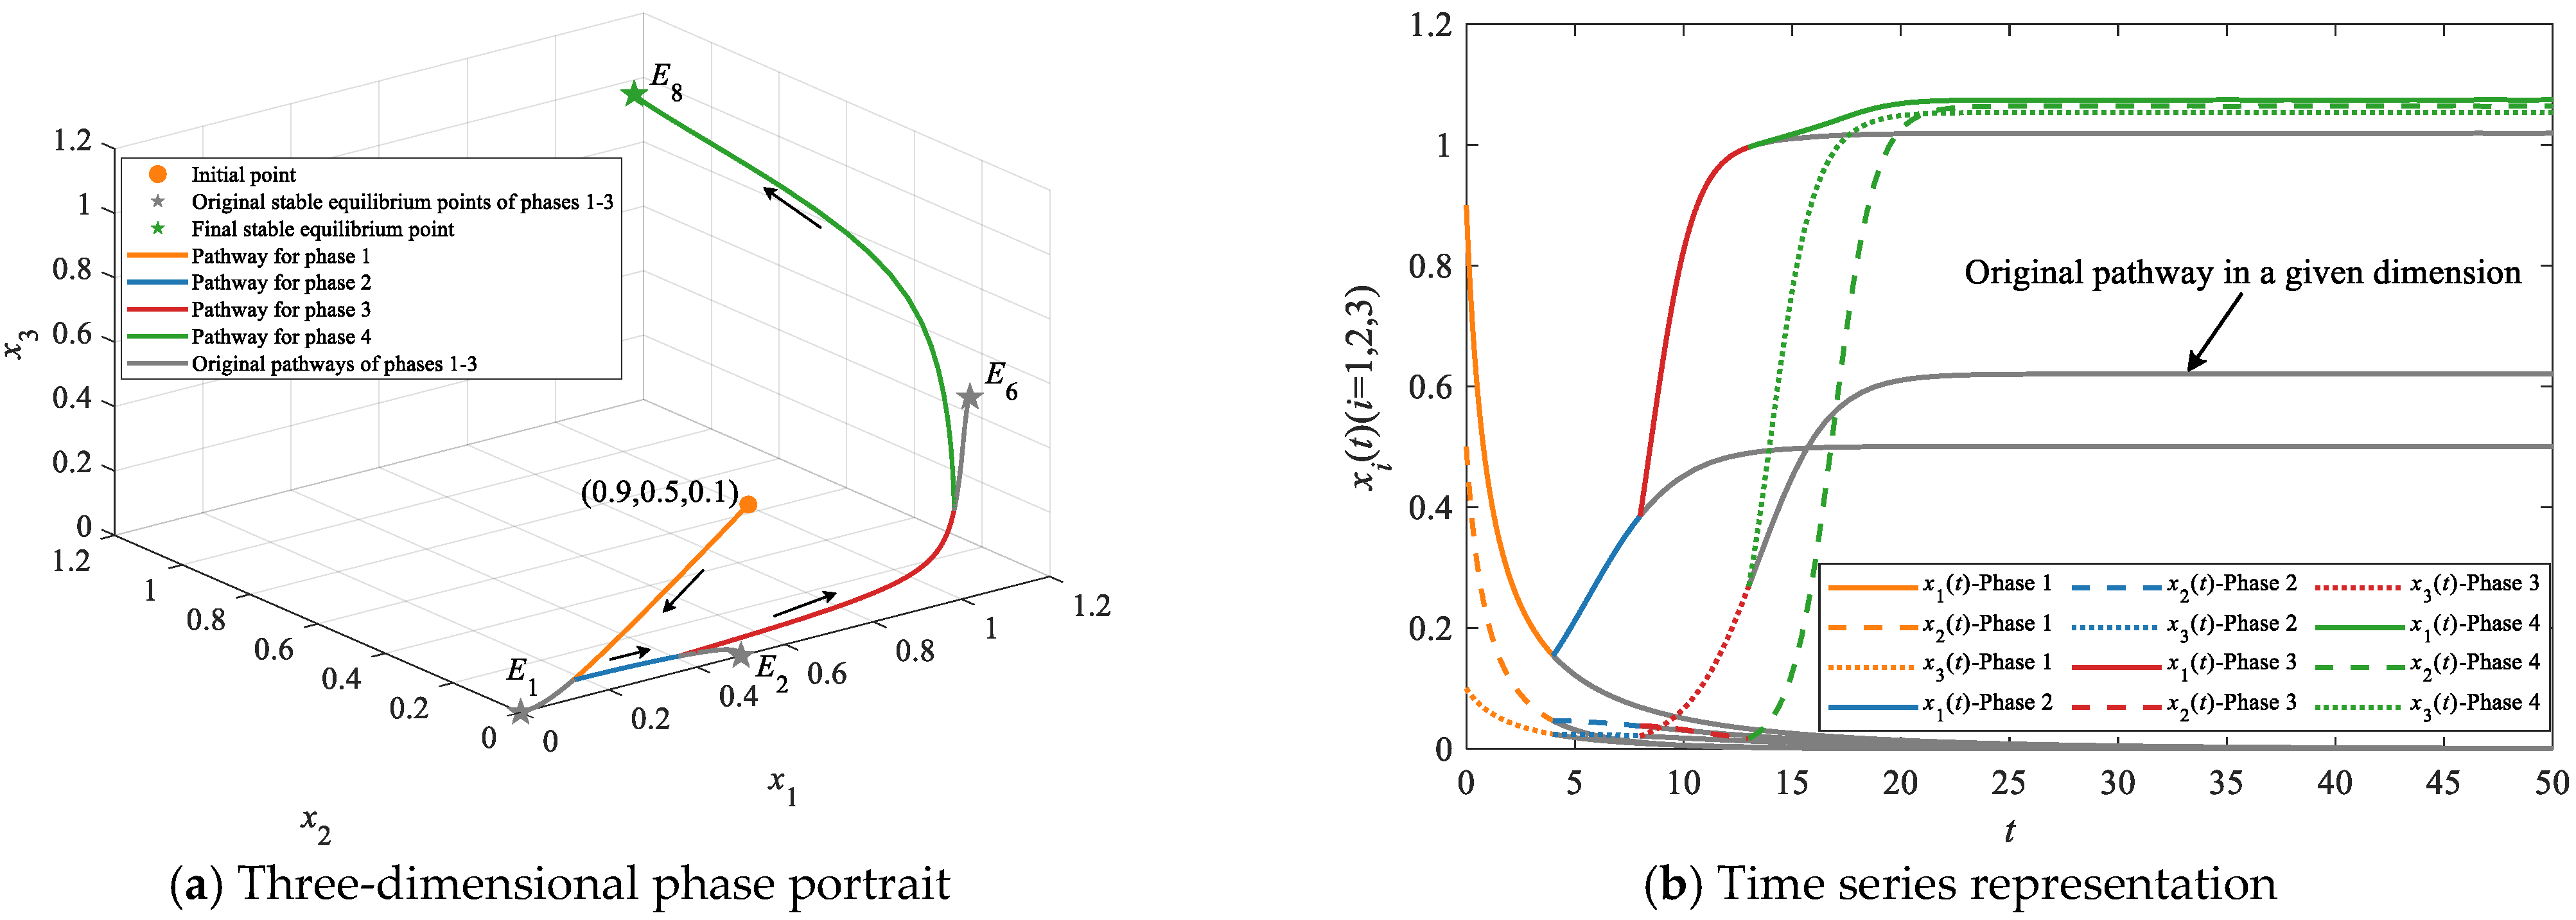
If the initial parameter values of PDR equal those listed in Table 3 and make E1 stable, and if the initial point of PDR is (0.9, 0.5, 0.1), directing PDR to develop along the pathway E1E2E6E8 can follow the procedures below: (1) Applying the measures proposed in the first procedure of the evolutionary pathway E1E2E5E8 at t = 4 enables PDR to evolve from E1 to E2. (2) When t = 8, PDR can continuously increase the inputs of each subsystem, and reinforce the promoting effects of economic–environmental and economic–social interactions on the growth of economic sustainability; to be specific, αi (i = 1, 2, 3) should be separately increased to α1 = 1, α2 = 0.2, and α3 = 0.6, while β31 and β32 should be decreased to β31 = −0.02 and β32 = −0.03, respectively; by taking these actions, PDR can gradually move away from the original stable equilibrium point of phase 2 (i.e., E2) and evolve towards E6. (3) When t = 13, PDR can increase the inputs of the social system and the economic system, and adjust the promoting effects of inter-subsystem interactions on the sustainable growth of each subsystem; in other words, αi (i = 2, 3) should be increased to α2 = 1 and α3 = 1, respectively, and βij (ij; i = 1, 2, 3; j = 1, 2, 3) should be individually adjusted to β12 = −0.04, β13 = −0.03, β21 = −0.04, β23 = −0.02, β31= −0.03, and β32 = −0.02. After executing the measures, PDR can slowly drift from the original stable equilibrium point of phase 3 (i.e., E6) and converge to the stable equilibrium point of phase 4 (i.e., E8). How PDR develops along the pathway E1E2E6E8 is shown in Figure 3.
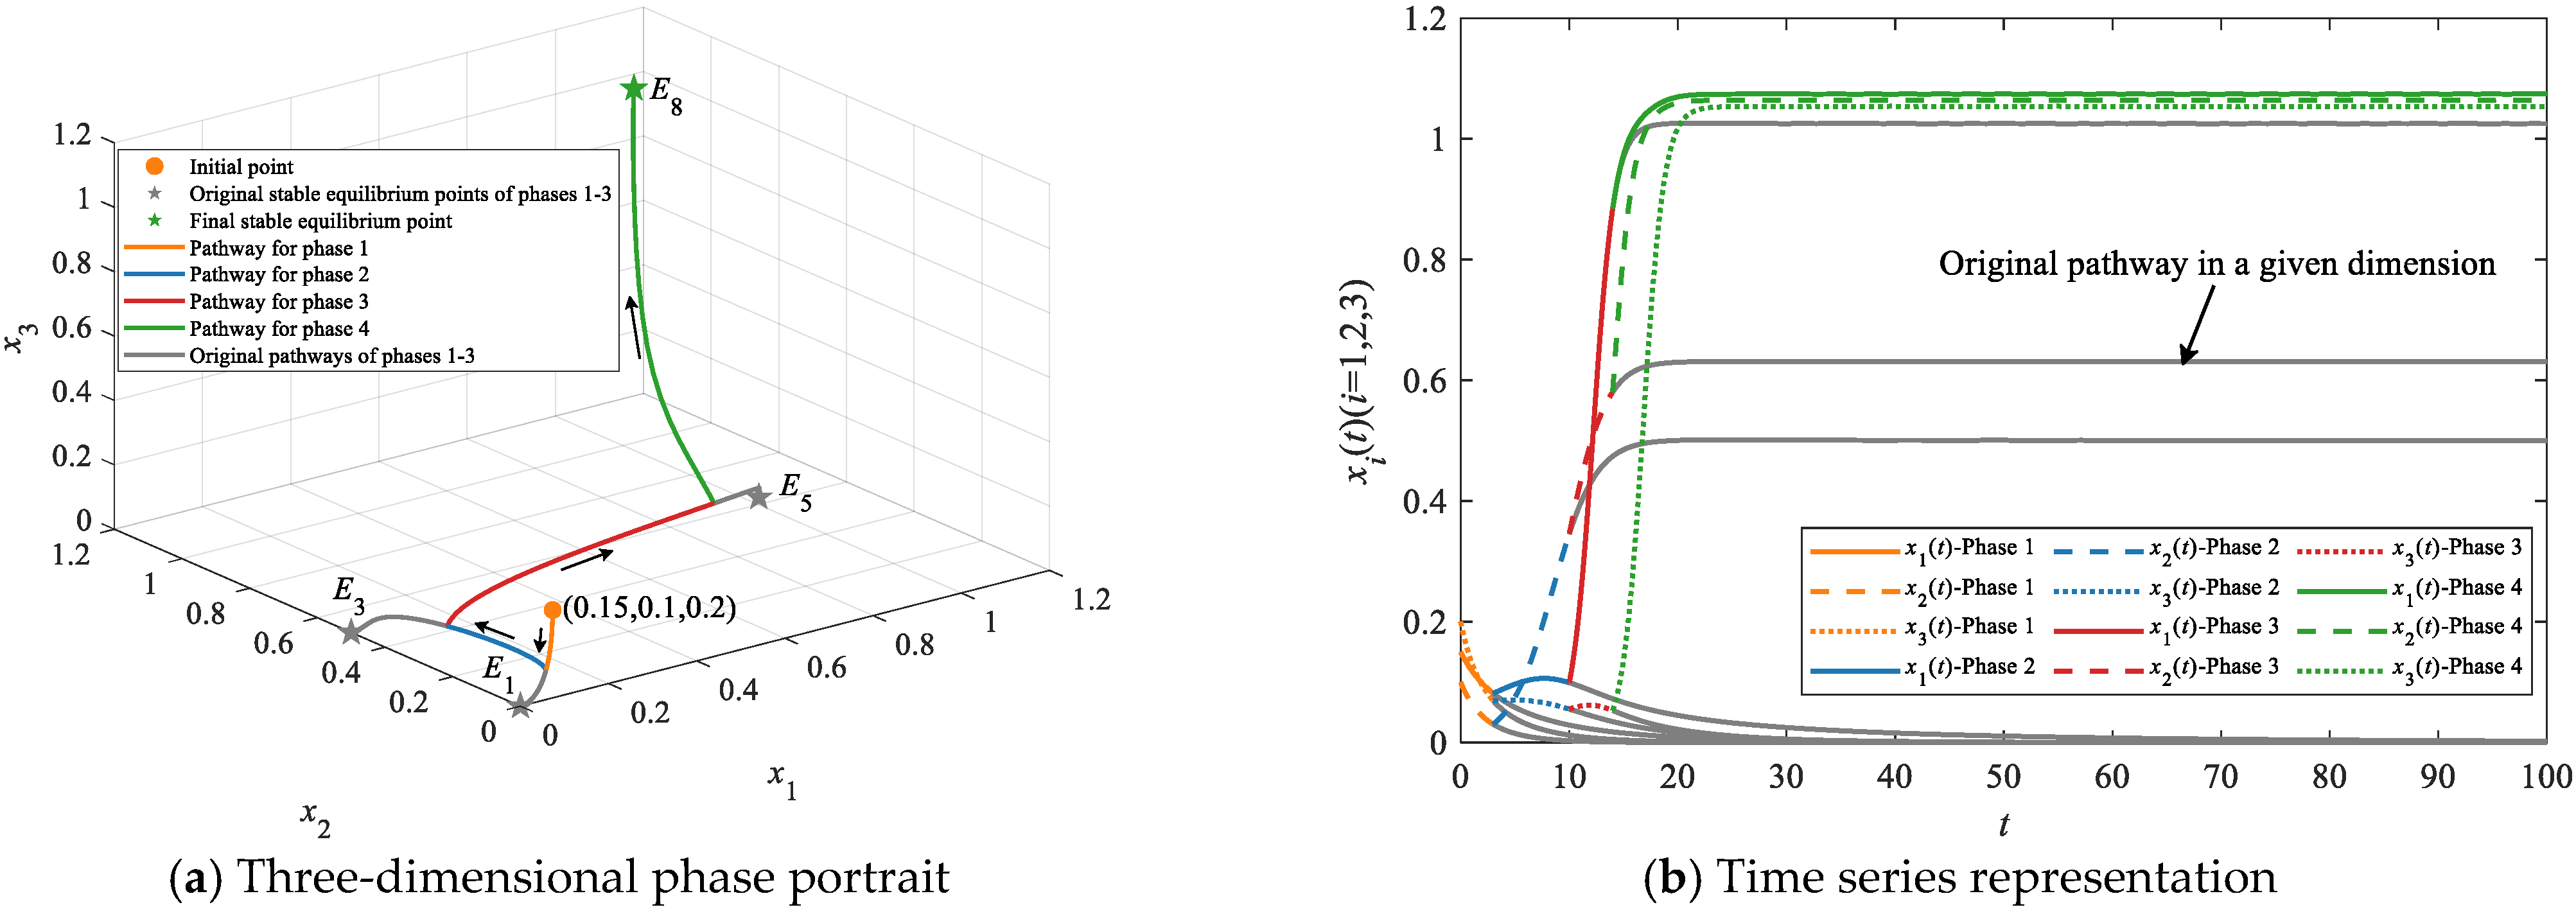
If the initial parameter values of PDR precisely match those listed in Table 3 and make E1 stable, and if the initial point of PDR is (0.15, 0.1, 0.2), guiding PDR to evolve along E1E3E5E8 can follow the procedures below: (1) When t = 3, PDR could increase the inputs of each subsystem, strengthen the inhibitory effects of environmental–social and environmental–economic interactions on the sustainable growth of the environmental system, enhance the promoting effects of social–environmental interactions on the sustainable growth of the social system and the inhibitory effects of economic–social interactions on the sustainable growth of the economic system, and attenuate the inhibitory effects of economic–environmental interactions on the sustainable growth of the economic system; to be more exact, αi (i = 1, 2, 3), β12, β13, and β32 should be separately increased to α1 = 0.2, α2 = 0.5, α3 = 0.1, β12 = 0.45, β13 = 0.03, and β32 = 0.4, and β21 and β31 should be decreased to β21 = −0.03 and β31 = 0.03, respectively. By taking these measures, PDR can gradually stray from the original stable equilibrium point of phase 1 (i.e., E1) and evolve towards E3, as shown in Figure 4. (2) When t = 10, PDR could continuously increase the inputs of each subsystem, reinforce the promoting effects of environmental–social and environmental–economic interactions on the growth of environmental sustainability, increase the inhibitory effects of economic–environmental interactions on the sustainable growth of the economic system, and weaken the inhibitory effects of economic–social interactions on the sustainable growth of the economic system; in other words, αi (i = 1, 2, 3) and β31 should be individually increased to α1 = 1, α2 = 0.6, α3 = 0.2, and β31 = 0.3, and β12, β13, and β32 should be decreased to β12 = −0.03, β13 = −0.04, and β32 = 0.02, respectively. After applying these measures, PDR can slowly move away from the original stable equilibrium point of phase 2 (i.e., E3) and evolve towards E5, as shown in Figure 4. (3) Implementing the interventions applied in the last procedure of the evolutionary pathway E1E2E5E8 at t = 14 enables PDR to gradually switch from E5 to E8, as shown in Figure 4.
If the initial parameter values of PDR equal those listed in Table 3 and make E1 stable, and if the initial point of PDR is (0.6, 0.8, 0.3), how PDR evolves along E1E3E7E8 can be tackled by the procedures below: (1) When t = 3, adopting the measures executed in the first procedure of the evolutionary pathway E1E3E5E8 enables PDR to evolve from E1 to E3, as shown in Figure 5. (2) When t = 8, it is necessary to enrich the inputs of the social system and the economic system and weaken the inhibitory effects of the economic–social interactions on the sustainable growth of the economic system. In addition, enhancing the promoting effects of environmental–economic interactions on the sustainable growth of the environmental system and reinforcing the inhibitory effects of the same interactions on the sustainable growth of the economic system are also essential. In other words, αi (i = 2, 3) and β31 should be separately increased to α2 = 1, α3 = 0.6, and β31 = 0.3, while β13 and β32 should be decreased to β13 = −0.02 and β32 = 0.02, respectively. By taking these measures, PDR can gradually diverge from the original stable equilibrium point of phase 2 (i.e., E3) and evolve towards E7, as shown in Figure 5. (3) When t = 13, PDR can increase the inputs of the environmental system and the economic system, enhance the promoting effects of environmental–economic interactions on the growth of environmental sustainability and economic sustainability, reinforce the promoting effects of environmental–social interactions on the sustainable growth of the corresponding subsystems, and strengthen the promoting effects of economic–social couplings on the sustainable growth of the economic system; specifically, αi (i = 1, 3) should be individually increased to α1 = 1 and α3 = 1, while β12, β13, β21, β31, and β32 should be decreased to β12 = −0.04, β13 = −0.03, β21 = −0.04, β31 = −0.03, and β32 = −0.02, respectively. Through the above interventions, PDR can gradually stray from the original stable equilibrium point of phase 3 (i.e., E7) and evolve to the stable equilibrium point of phase 4 (i.e., E8), as shown in Figure 5.
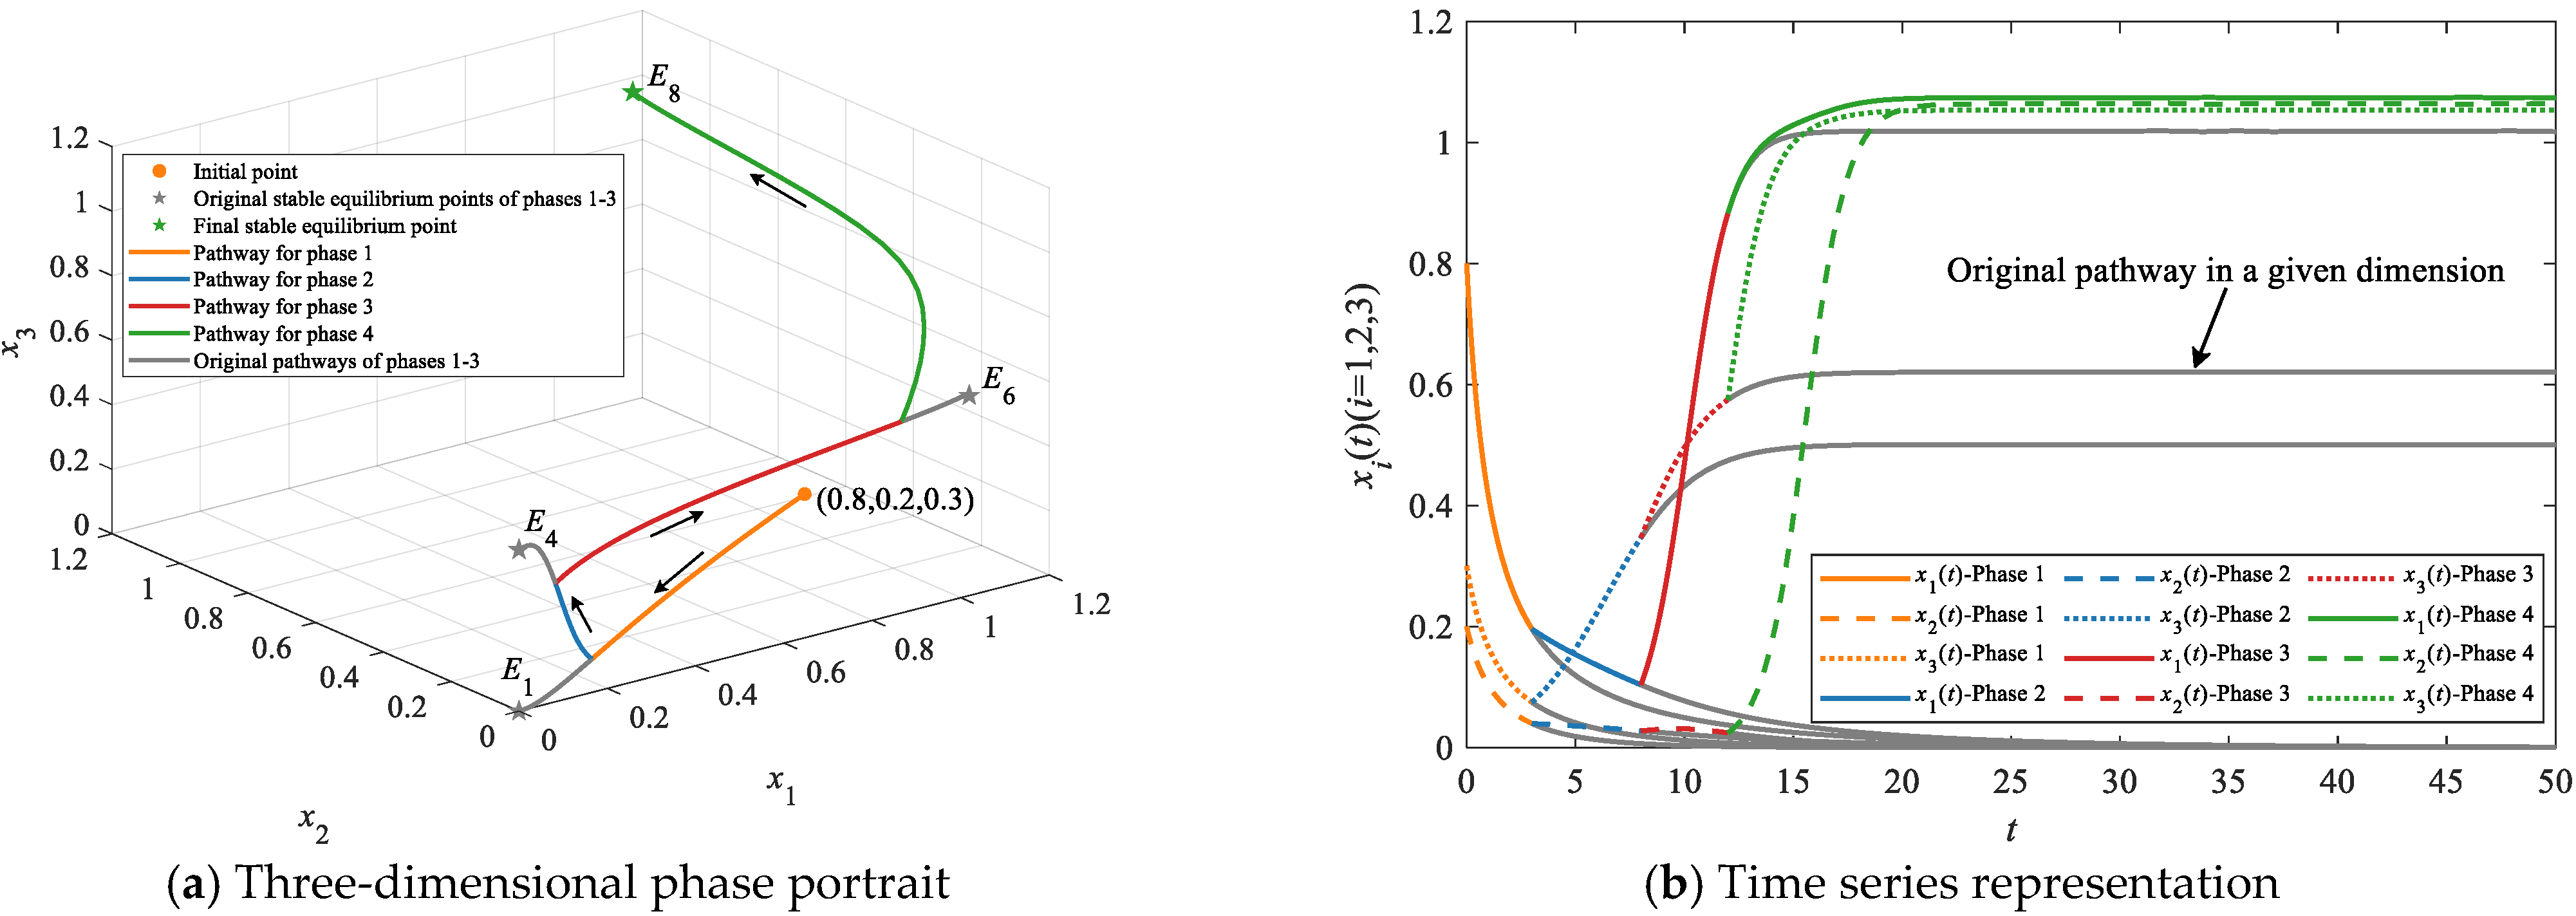
If the initial parameter values of PDR equal those listed in Table 3 and make E1 stable, and if the initial point of PDR is (0.8, 0.2, 0.3), PDR following E1E4E6E8 can be divided into the procedures below: (1) When t = 3, PDR can increase the inputs of each subsystem, reinforce the inhibitory effects of environmental–social and environmental–economic interactions on the sustainable growth of the environmental system, enhance the inhibitory effects of social–economic couplings on the growth of social sustainability, and strengthen the promoting effects of economic–environmental and economic–social interactions on the sustainable growth of the economic system, which can be quantified as increasing αi (i = 1, 2, 3), β12, β13, and β23 to the respective values of α1 = 0.1, α2 = 0.1, α3 = 0.5, β12 = 0.03, β13 = 0.4, and β23 = 0.04 and decreasing β31 and β32 to β31 = −0.04 and β32 = −0.02, respectively. Relying on the above actions, PDR can slowly move away from the original stable equilibrium point of phase 1 (i.e., E1) and evolve towards E4, as shown in Figure 6. (2) When t = 8, increasing the inputs of each subsystem, enhancing the promoting effects of environmental–social and environmental–economic interactions on the sustainable growth of the environmental system, impairing the inhibitory effects of social–economic interactions on the sustainable growth of the social system, and adjusting the promoting effects of economic–environmental and economic–social couplings on the growth of economic sustainability are available measures; these can be precisely reflected as increasing αi (i = 1, 2, 3) and β31 to the respective values of α1 = 1, α2 = 0.2, α3 = 0.6, and β31 = −0.02 and decreasing β12, β13, β23, and β32 to β12 = −0.03, β13 = −0.04, β23 = 0.02, and β32 = −0.03, respectively. By implementing these measures, PDR can gradually deviate from the original stable equilibrium point of phase 2 (i.e., E4) and evolve towards E6, as shown in Figure 6. (3) In order to shift from E6 to E8, PDR can take the measures occurring in the last procedure of the evolutionary pathway E1E2E6E8 at t = 12, as shown in Figure 6.
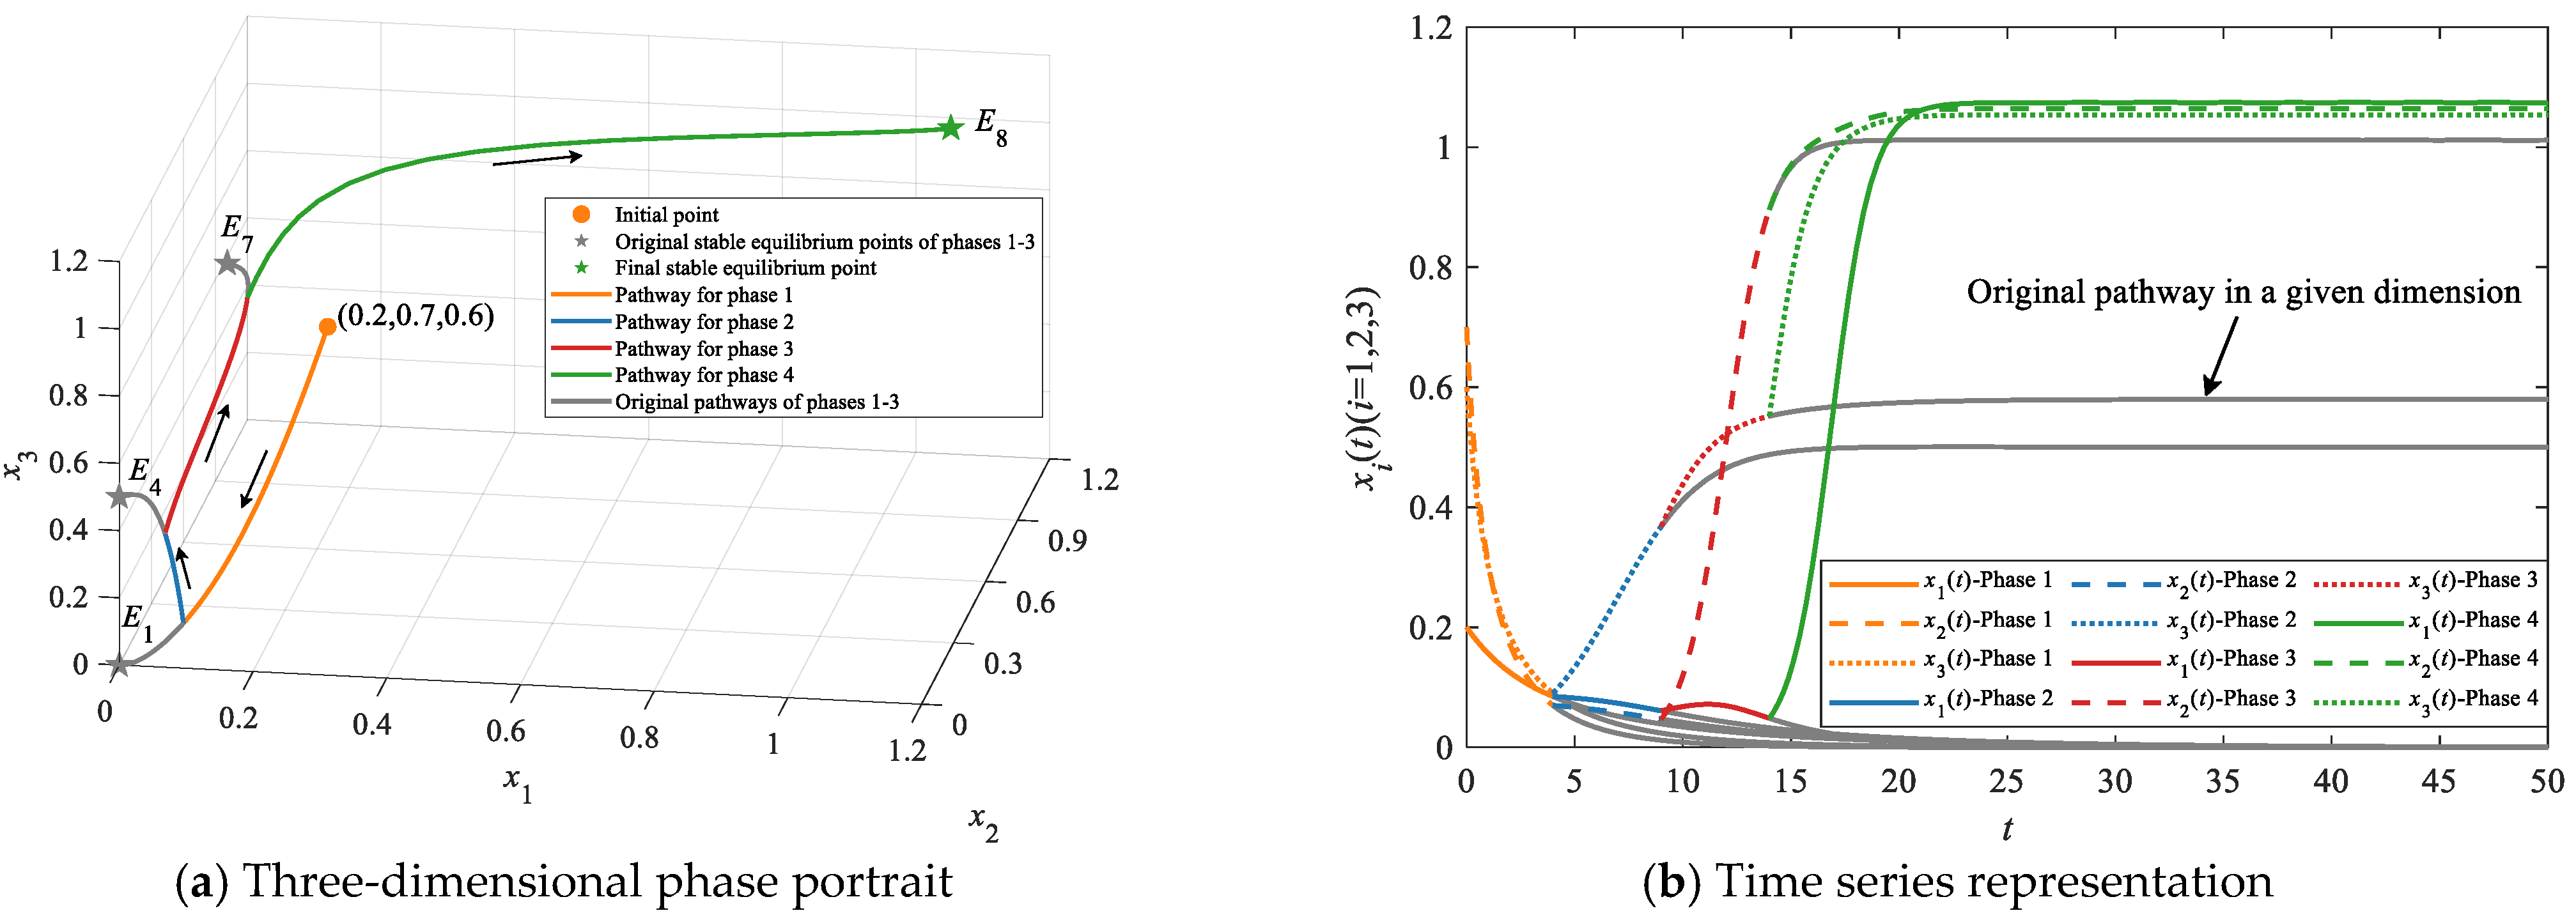
If the initial parameter values of PDR equal those listed in Table 3 and make E1 stable, and if the initial point of PDR is (0.2, 0.7, 0.6), steering PDR to develop along E1E4E7E8 can adhere to the procedures below: (1) PDR can take the measures implemented in the first procedure of the evolutionary pathway E1E4E6E8 at t = 4 to realize the evolution from E1 to E4, as shown in Figure 7. (2) When t = 9, increasing the inputs of each subsystem and adjusting the effects of inter-subsystem interactions on the sustainable growth of each subsystem are feasible measures which can be elaborated as increasing αi (i = 1, 2, 3) to the respective values of α1 = 0.2, α2 = 1, and α3 = 0.6 and adjusting βij (ij; i = 1, 2, 3; j = 1, 2, 3) as β12 = 0.45, β13 = −0.02, β21 = −0.03, β23 = −0.02, β31 = 0.3, and β32 = 0.02, respectively. After implementing the measures, PDR is able to gradually stray from the original stable equilibrium point of phase 2 (i.e., E4) and evolve towards E7, as shown in Figure 7. (3) When t = 14, implementing the measures applied in the last procedure of the evolutionary pathway E1E3E7E8 makes the shift from the original stable equilibrium point of phase 3 (i.e., E7) to the stable equilibrium point of phase 4 (i.e., E8) possible, as shown in Figure 7.
The above simulations show how PDR evolves along the stepwise pathways that take E1 and E8 as the initial and final stable equilibrium points, respectively. Different stepwise pathways are coupled with distinct specific actions, and when to take the phased measures of a stepwise pathway could vary within a certain time window, in line with the actual situations of disaster-stricken areas.

4.2.2. Simulations on Leapfrogging Evolutionary Pathways

PDR also preserves the ability to leapfrog to E8 with Ei (i = 1, 2, 3, 4) as the initial stable equilibrium points. Thus, this section simulates the leapfrogging pathways of PDR.
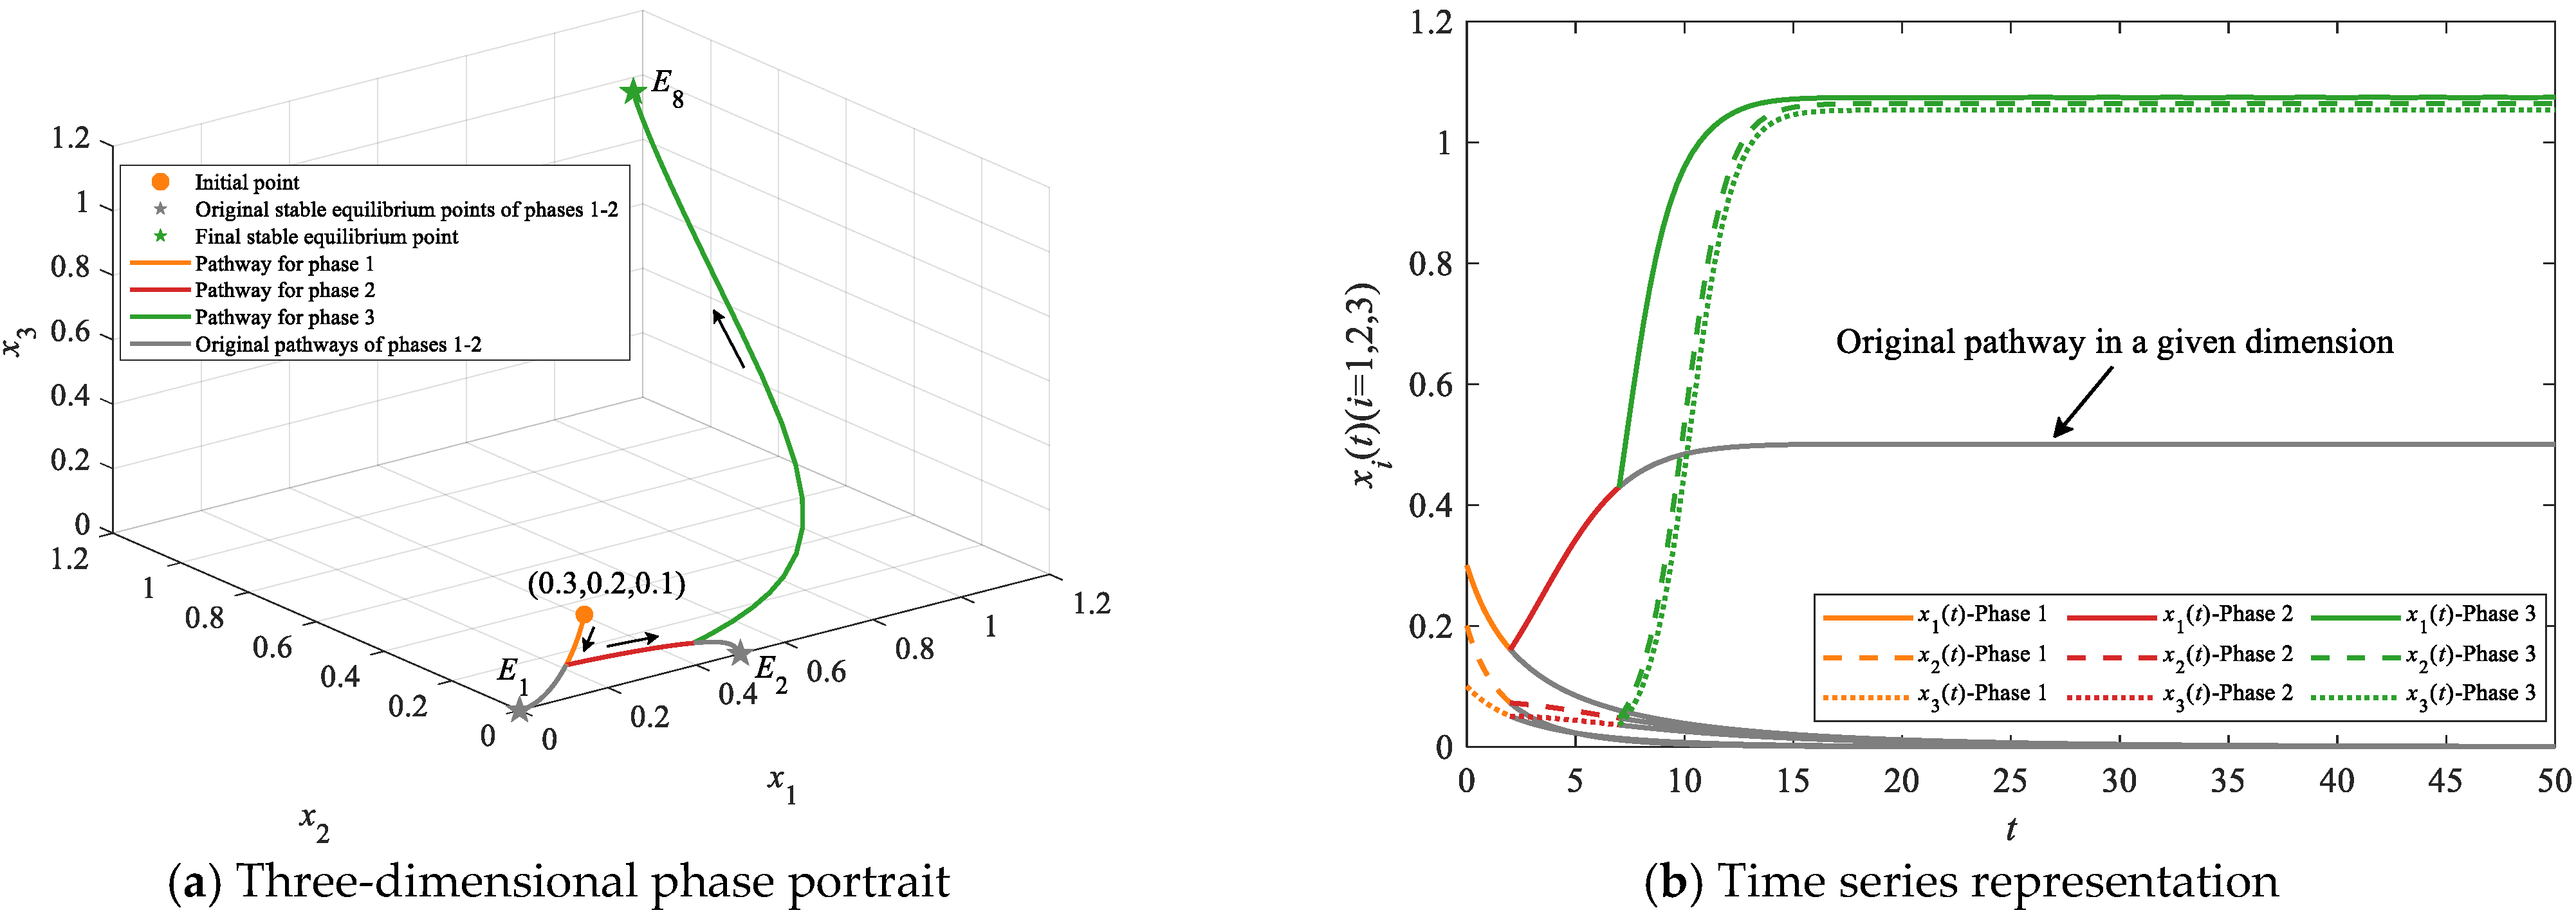
If the initial parameter values of PDR equal those listed in Table 3 and make E1 stable, and if the initial point of PDR is (0.3, 0.2, 0.1), PDR along the leapfrogging evolutionary pathway E1E2E8 can be divided into the procedures below: (1) Taking the measures adopted in the first procedure of the pathway E1E2E5E8 at t = 2 enables PDR to evolve from E1 to E2, as Figure 8 shows. (2) When t = 7, PDR can increase the inputs of each subsystem, enhance the promoting effects of environmental–social interactions on the growth of environmental sustainability and social sustainability, weaken the promoting effects of environmental–economic couplings on the sustainable growth of the environmental system, and reinforce the promoting effects of economic–environmental and economic–social interactions on the sustainable growth of the economic system; these actions can be refined as increasing αi (i = 1, 2, 3) and β13 to the respective values of α1 = 1, α2 = 1, α3 = 1, and β13 = −0.03, while decreasing β12, β21, β31, and β32 to β12 = −0.04, β21 = −0.04, β31 = −0.03, and β32 = −0.02, respectively. After taking these actions, PDR can gradually shift from the original stable equilibrium point of phase 2 (i.e., E2) to the stable equilibrium point of phase 3 (i.e., E8), as shown in Figure 8.
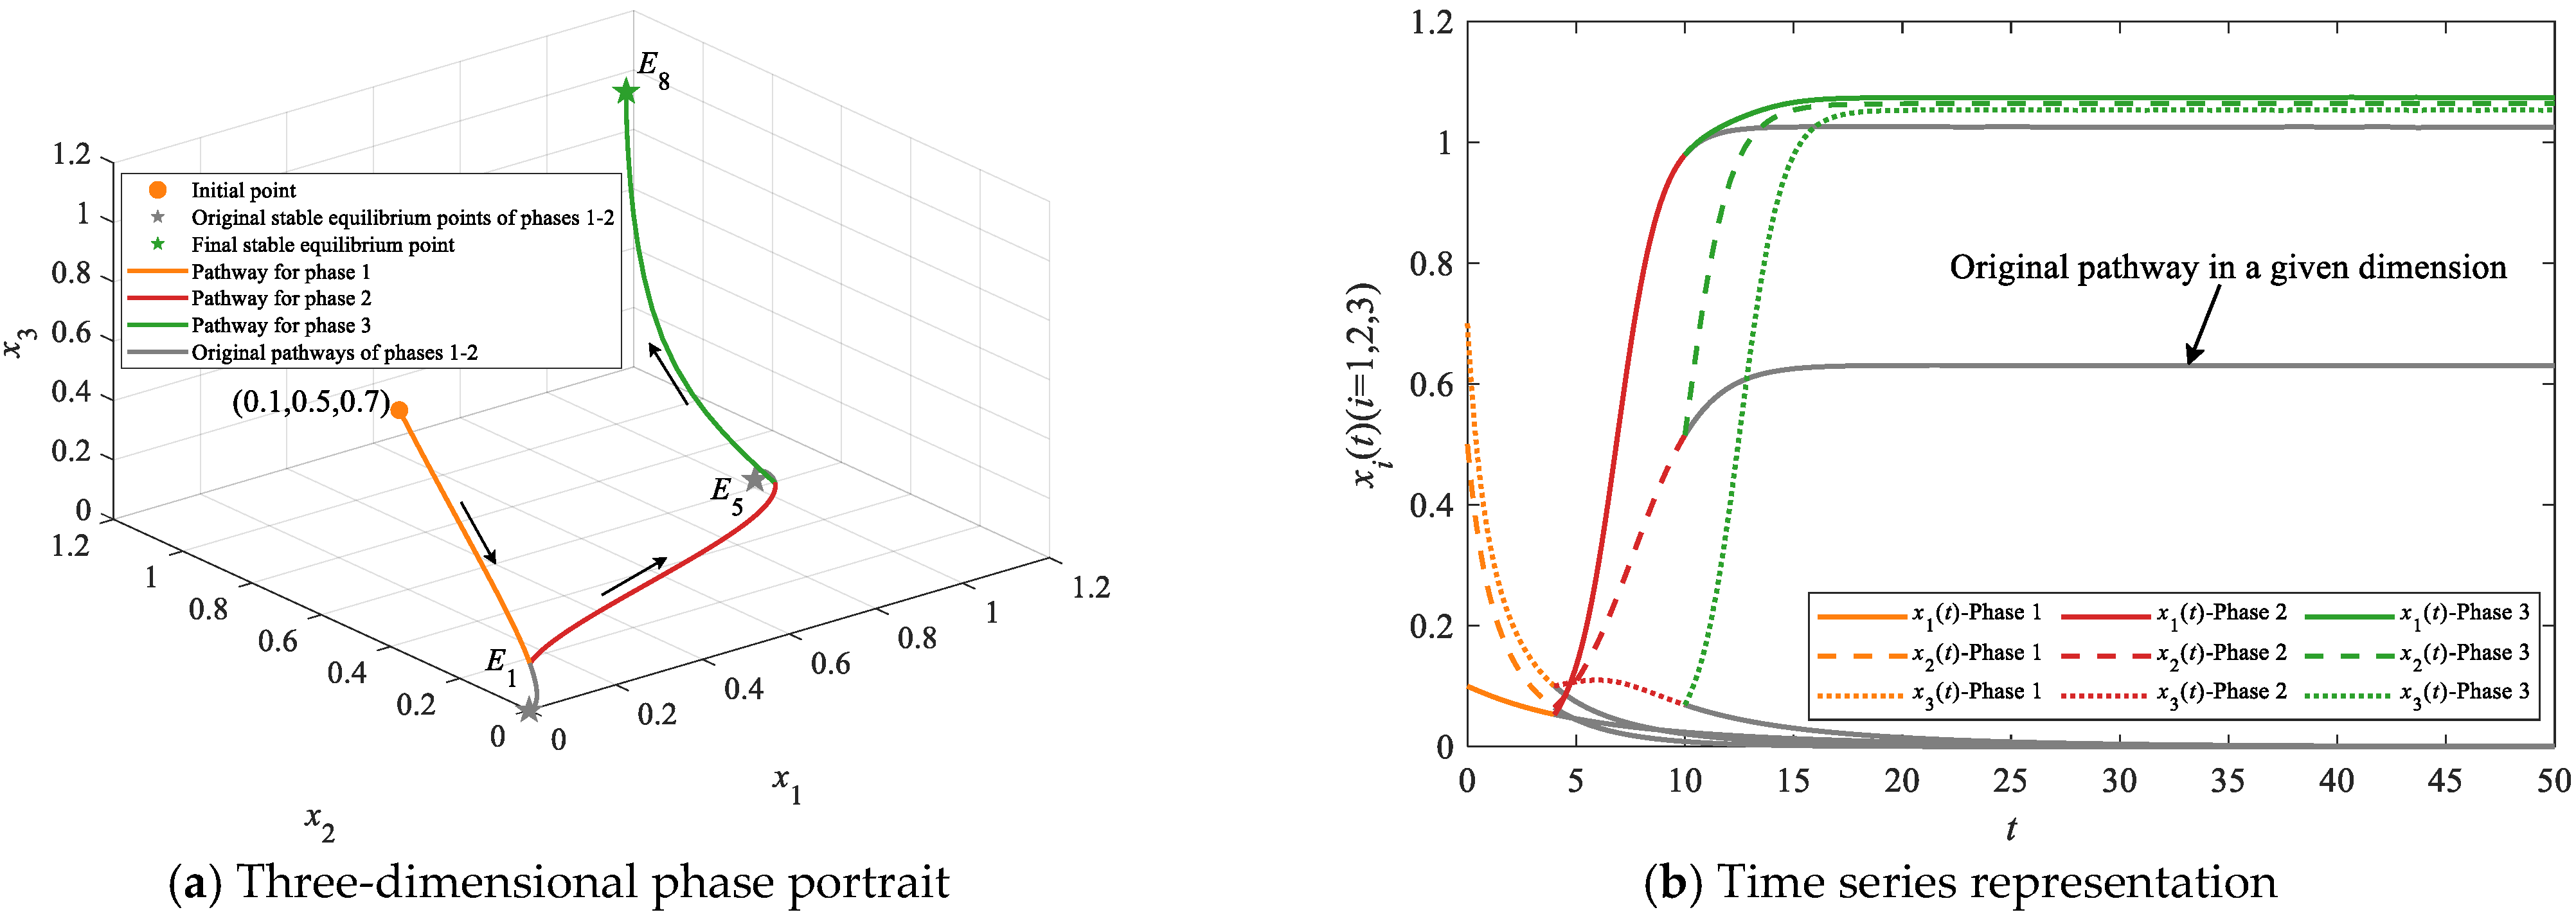
If the initial parameter values of PDR equal those listed in Table 3 and make E1 stable, and if the initial point of PDR is (0.1, 0.5, 0.7), PDR along the pathway E1E5E8 can be split into the procedures below: (1) When t = 4, enriching the inputs of each subsystem and strengthening the promoting effects of social–environmental interactions on the growth of social sustainability are available options that can be quantified as increasing αi (i = 1, 2, 3) to the respective values of α1 = 1, α2 = 0.6, and α3 = 0.2 and decreasing β21 to β21 = −0.03. After using these measures, PDR can slowly move away from the original stable equilibrium point of phase 1 (i.e., E1) and evolve to E5, as Figure 9 shows. (2) Carrying out the interventions implemented in the last procedure of the pathway E1E2E5E8 at t = 10 enables PDR to shift from the original stable equilibrium point of phase 2 (i.e., E5) to E8, as shown in Figure 9.
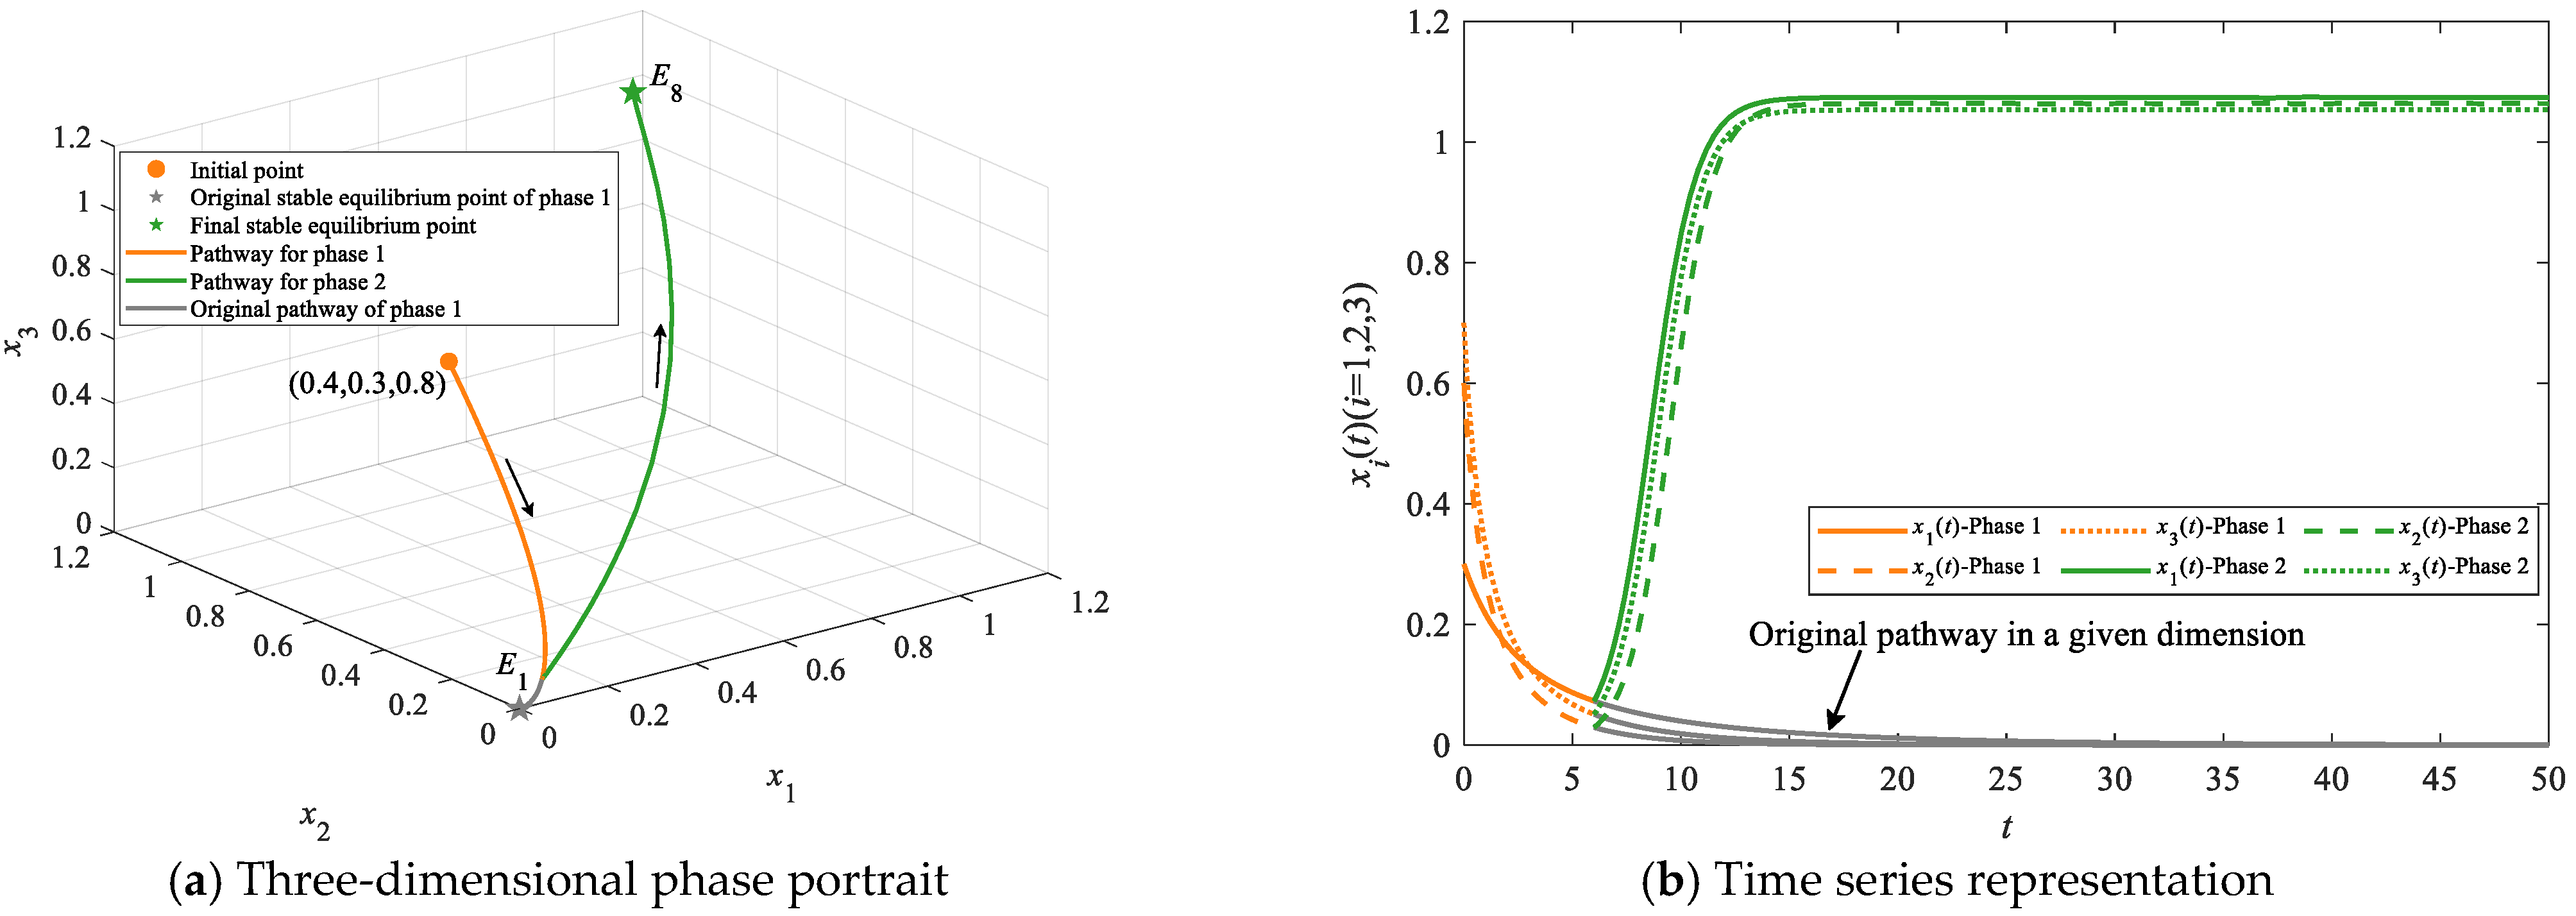
If the initial parameter values of PDR equal those listed in Table 3 and make E1 stable, PDR can also directly leapfrog to E8 without intermediate stable points. If the initial point of PDR is (0.4, 0.3, 0.8), PDR along the leapfrogging evolutionary pathway, denoted as E1E8, can be realized through increasing the inputs of each subsystem, reinforcing the promoting effects of environmental–economic and economic–social interactions on the sustainable growth of the economic system, enhancing the promoting effects of environmental–social couplings on the growth of environmental sustainability and social sustainability, and impairing the promoting effects of environmental–economic interactions on the sustainable growth of the environmental system at t = 6. Specifically, these measures can be quantified as increasing αi (i = 1, 2, 3) and β13 to the respective values of α1 = 1, α2 = 1, α3 = 1, and β13 = −0.03 and decreasing β12, β21, β31, and β32 to β12 = −0.04, β21 = −0.04, β31= −0.03, and β32 = −0.02, respectively. After taking these actions, PDR can slowly deviate from the original stable equilibrium point of phase 1 (i.e., E1) and converge to the stable equilibrium point of phase 2 (i.e., E8), as shown in Figure 10.
The leapfrogging evolutionary pathways denoted as E1E2E8, E1E5E8 and E1E8 are able to stand for all kinds of leapfrogging evolutionary pathways starting from E1; thus, numerical simulations on the remaining leapfrogging pathways starting from E1 are neglected in this section. In the following context, this section performs simulations on the leapfrogging evolutionary pathways starting from E2, E3, and E4.
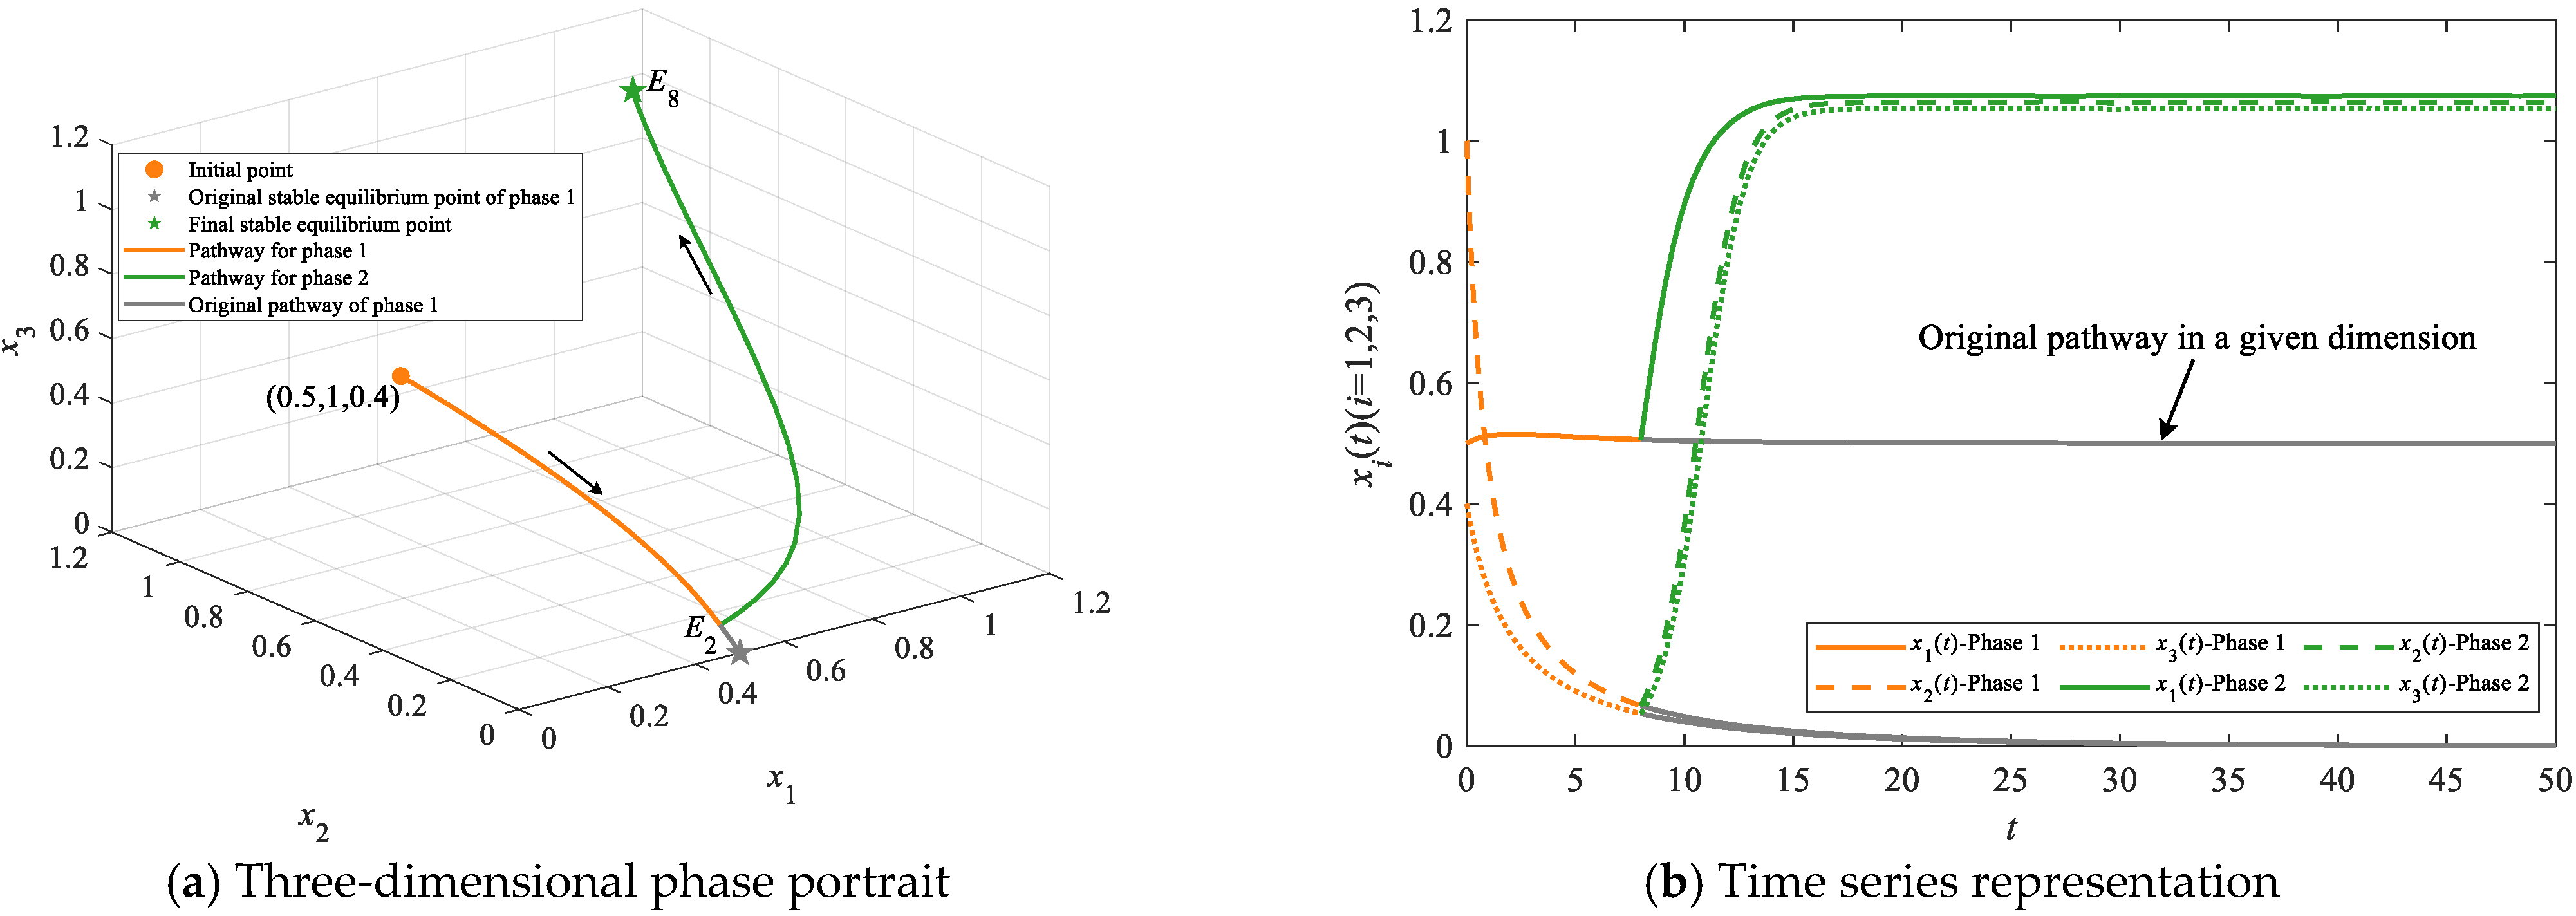
If the initial parameter values of PDR equal those listed in Table 3 and make E2 stable, and if the initial point of PDR is (0.5, 1, 0.4), PDR along the leapfrogging evolutionary pathway E2E8 can be realized by increasing αi (i = 1, 2, 3) and β13 to the respective values of α1 = 1, α2 = 1, α3 = 1, and β13 = −0.03 at t = 8; at the same time, β12, β21, β23, β31, and β32 need to be decreased to β12 = −0.04, β21 = −0.04, β23 = −0.02, β31= −0.03, and β32 = −0.02, respectively. By taking these actions, it is possible for PDR to stray from the original stable equilibrium point of phase 1 (i.e., E2) and evolve towards the stable equilibrium point of phase 2 (i.e., E8), as shown in Figure 11.
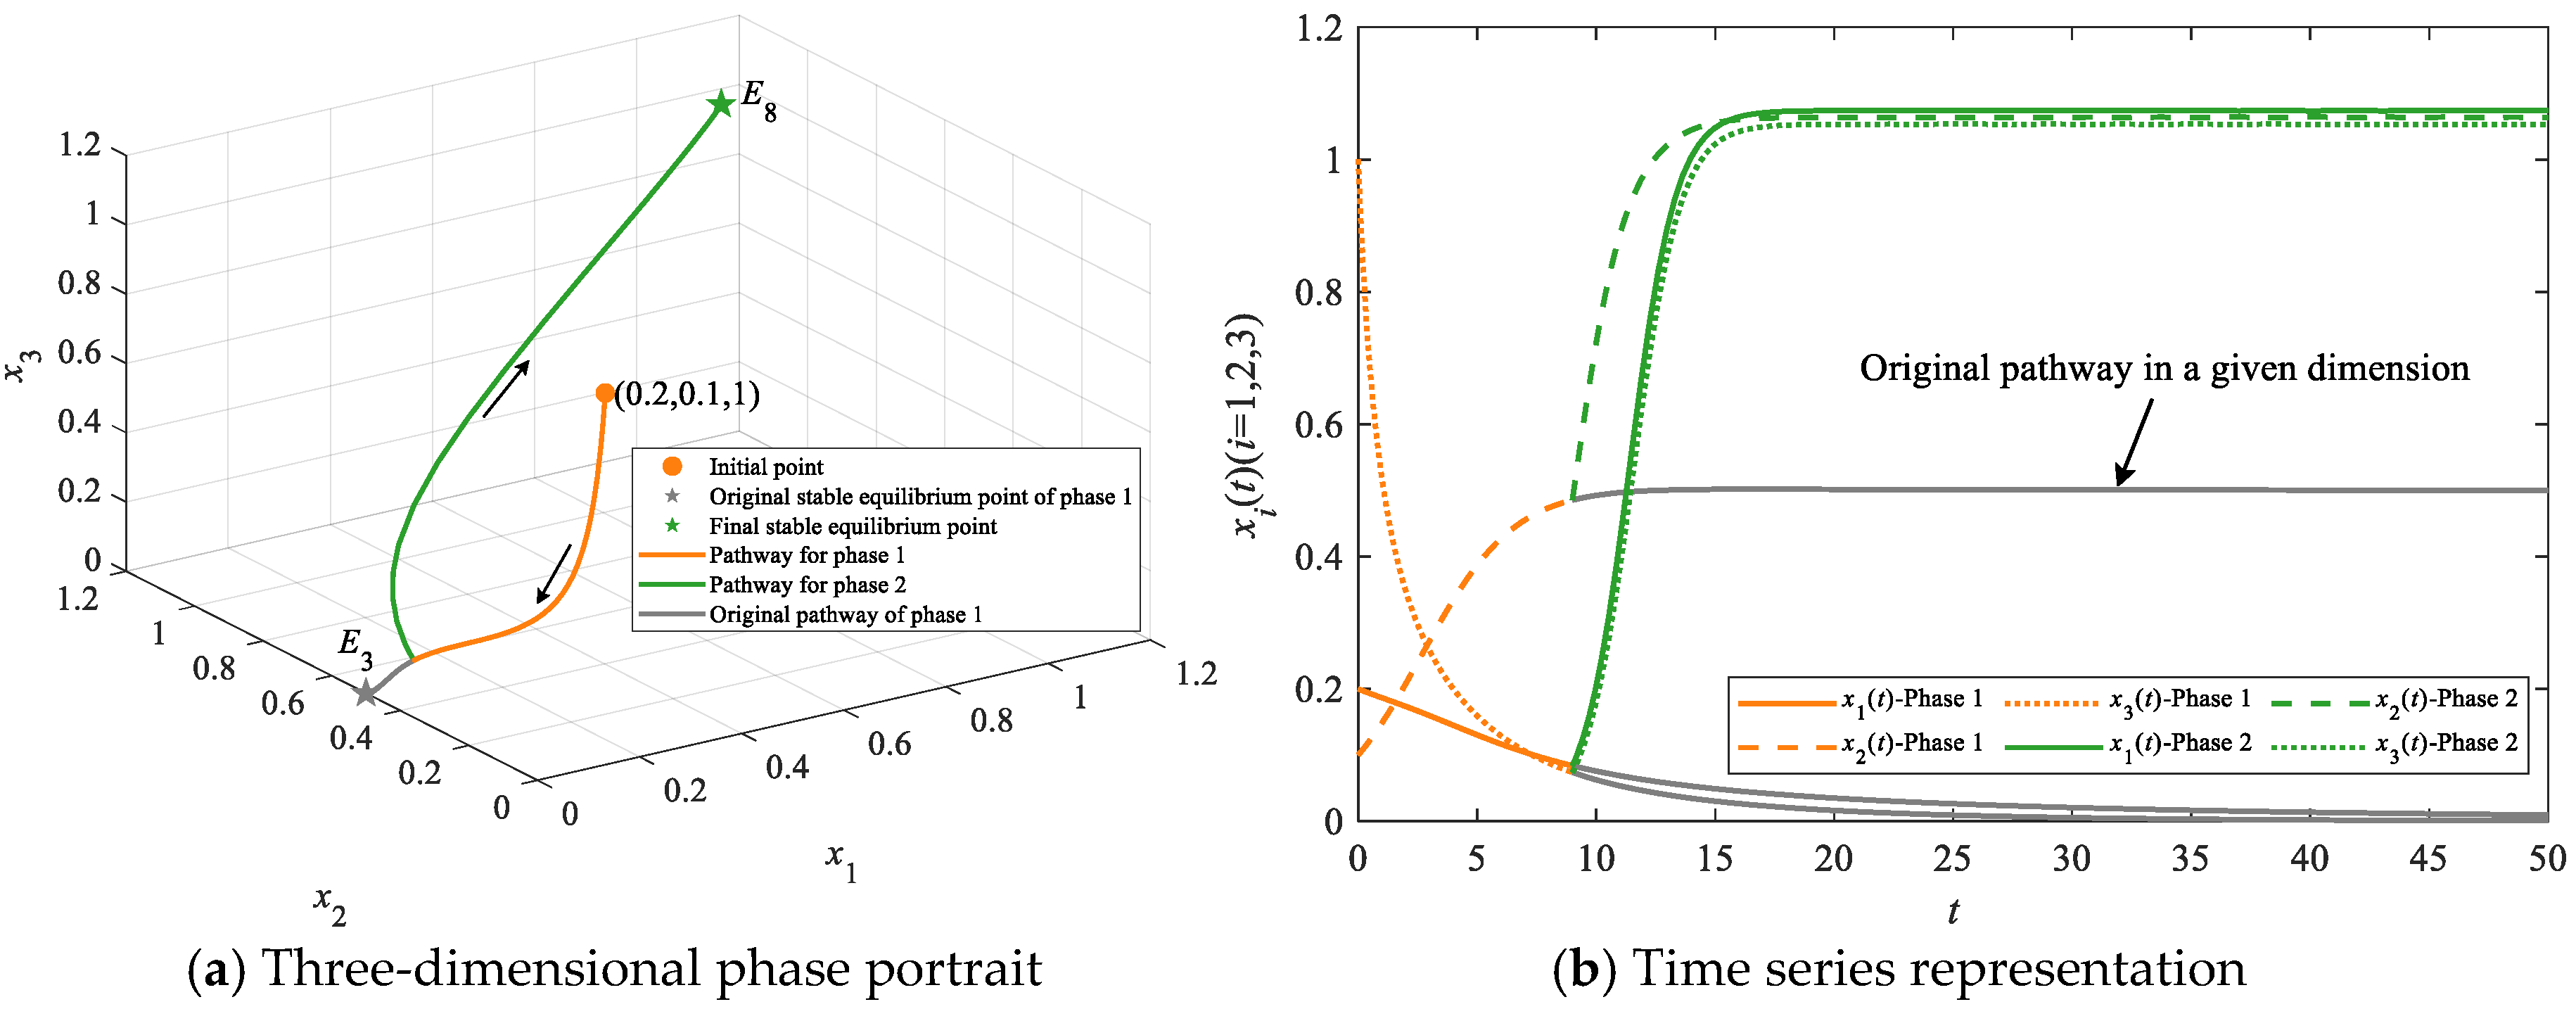
If the initial parameter values of PDR equal those listed in Table 3 and make E3 stable, and if the initial point of PDR is (0.2, 0.1, 1), how PDR leapfrogs along the evolutionary pathway E3E8 can be realized by increasing αi (i = 1, 2, 3) to 1 and decreasing β12, β13, β21, β31, and β32 to the respective values of β12 = −0.04, β13 = −0.03, β21 = −0.04, β31= −0.03, and β32 = −0.02 at t = 9. After taking these measures, PDR can shift from the original stable equilibrium point of phase 1 (i.e., E3) to the stable equilibrium point of phase 2 (i.e., E8), as Figure 12 shows.
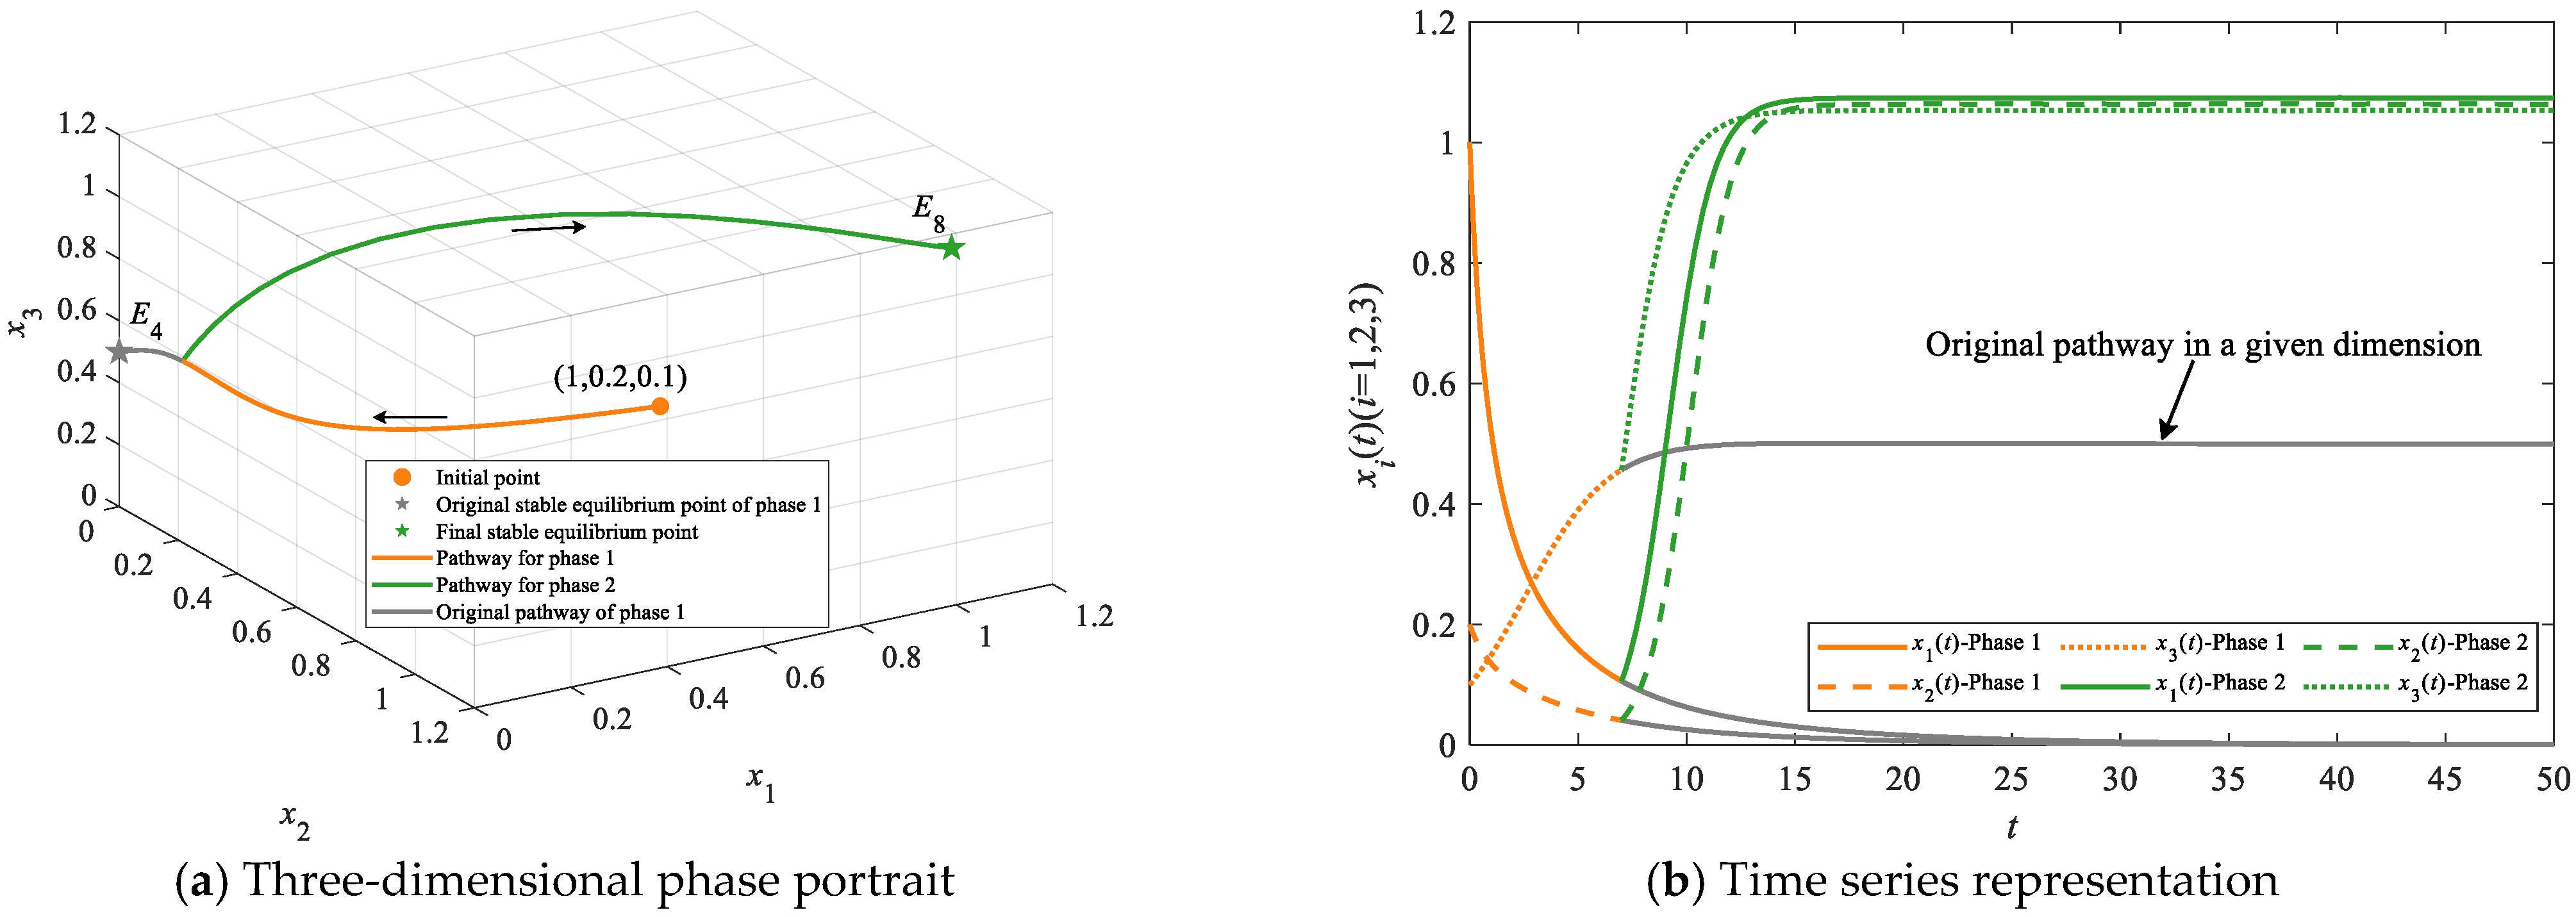
If the initial parameter values of PDR equal those listed in Table 3 and make E4 stable, and if the initial point of PDR is (1, 0.2, 0.1), PDR leapfrogging along the pathway E4E8 can be achieved by increasing αi (i = 1, 2, 3) and β31 to the respective values of α1 = 1, α2 = 1, α3 = 1, and β31 = −0.03 at t = 7; at the same time, decreasing β12, β13, β21, and β23 to the respective values of β12 = −0.04, β13 = −0.03, β21 = −0.04, and β23 = −0.02 is also necessary. After implementing the above interventions, PDR can slowly deviate from the original stable equilibrium point of phase 1 (i.e., E4) and finally converge to the stable equilibrium point of phase 2 (i.e., E8), as Figure 13 shows.

5. Conclusions

PDR is one of the key phases of disaster management and serves as a pivotal opening for sustainable development in disaster-stricken areas. Revolving around the evolutionary traits of PDR under the background of sustainable development, this paper divides PDR into an environmental system, a social system, and an economic system with respective state variables named as environmental sustainability, social sustainability, and economic sustainability; proposes three assumptions justified by ecological theory and complex systems theory; establishes an evolutionary dynamic model for PDR based on synergetics; and reveals the evolutionary stability and evolutionary pathways of PDR based on model analysis. The proposed model and its theoretical results are verified through numerical simulations, which in turn validate the reasonability of the proposed assumptions to a certain extent.
This study yields the following findings: (1) PDR under the background of sustainable development is able to stabilize at eight equilibrium points, of which E1 has zero-value sustainability at all the three dimensions; E2, E3, and E4 all exactly possess zero-value sustainability at two dimensions; E5, E6, and E7 all exactly show zero-value sustainability at one dimension; and E8 exhibits non-zero sustainability at each dimension. The PDR states represented by E1, E2/E3/E4, E5/E6/E7, and E8 gradually improve, and E8 is the unique ideal stable state for PDR. The Routh–Hurwitz criterion determines the necessary and sufficient conditions for PDR to stabilize at each equilibrium point. (2) How PDR evolves to E8 can follow stepwise pathways and leapfrogging pathways. The stepwise evolutionary pathways, which develop the unrecovered subsystems of PDR one by one, can take Ei (i = 1, …, 7) as the initial stable equilibrium points and include the pathways denoted as E1E2E5/E6E8, E1E3E5/E7E8, E1E4E6/E7E8, E2E5/E6E8, E3E5/E7E8, E4E6/E7E8, and E5/E6/E7E8, respectively. The leapfrogging evolutionary pathways, which develop two or more unrestored subsystems of PDR at the same time, can take Ei (i = 1, 2, 3, 4) as the initial stable equilibrium points and cover the pathways denoted as E1E8, E2/E3/E4E8 and E1E2/E3/E4/E5/E6/E7E8, respectively. Different evolutionary pathways are supported by different interventions that pertain to the inputs of the three subsystems of PDR and the effects of inter-systems’ interactions on the sustainable growth of the corresponding systems. For a single evolutionary pathway of PDR, when to take the specific measures of a certain stage is dynamically adjustable within a specified time window based on the practical conditions of disaster-stricken areas.
To facilitate PDR to realize the goal of “building back better” in the context of sustainable development, it is necessary to clarify the initial resource endowment related to the environmental system, the social system, and the economic system of PDR, and to identify the interactions between these three subsystems in the first place. According to the actual situations and external surroundings of disaster-stricken areas, it is then essential to identify the initial evolutionary stable state enabled by the incipient conditions of disaster-stricken regions, determine the categories of evolutionary pathways, choose a specific evolutionary pathway for PDR, formulate concrete measures for each phase of the selected evolutionary pathway, and delineate clear timeframes for phase-specific measures. For example, if the initial conditions would make PDR stabilize at E1, the related subjects should first assess whether to pursue a stepwise pathway (e.g., E1E2E5E8) or a leapfrogging pathway (e.g., E1E2E8); if a stepwise pathway denoted as E1E2E5E8 is selected for PDR to follow, the relevant stakeholders should then determine the specific actions represented by the changes of αi and βij (i = 1, 2, 3; j = 1, 2, 3) during the shifts of E1E2, E2E5 and E5E8, respectively, and confirm the earliest and latest time to take the corresponding measures at each phase. It should be noted that the internal and external conditions of disaster-stricken regions could change. Hence, the related subjects should better prepare alternative reconstruction pathways for emergency use. Last but not least, concerned parties need to design phase-tailored supervisory mechanisms (e.g., public supervision mechanisms), safeguard mechanisms (e.g., organizational and living support systems), and contingency actions and measures for PDR in practice, thereby guaranteeing that PDR surely evolves to its ideal stable states by following predetermined pathways or timely adjusted pathways.
This study mainly has the following drawbacks. (1) This study models inter-subsystem interactions as xixj (ij; i = 1, 2, 3; j = 1, 2, 3), but there remain other quantitative forms for inter-subsystem interactions, such as x i 2 x j 3 and x i 3 x j . In other words, the proposed model does not account for more complex forms of interactions that would provide a more accurate reflection of reality, and the quantification of inter-subsystem interactions in this study is not all-encompassing. Moreover, PDR may be bistable, tristable, cyclic, or even chaotic, which is not further studied in this paper. (2) The proposed assumptions may prevent the model from fully aligning with reality, and this study is not backed by factual data and actual case examples. (3) PDR might vary with the type of disaster, which is neglected in this paper. Therefore, future studies will develop more generalizable nonlinear dynamic models that would include a wider spectrum of interaction forms between the subsystems of PDR, and compulsory verification of these models with factual data and specific examples drawn from real-world crisis situations in various parts of the world will be performed in terms of mathematical–empirical studies or case empirical studies. In addition, PDR related to a certain type of disaster and the cases that PDR is bistable, tristable, cyclic, or even chaotic will be comprehensively discussed in our future research.

Author Contributions

Conceptualization, Z.S. and J.Z.; Methodology, Z.S.; Software, J.B.; Validation, J.B.; Formal Analysis, J.B.; Investigation, Z.S. and J.Z.; Resources, Z.S. and J.Z.; Data Curation, Z.S. and J.Z.; Writing—original draft, Z.S. and J.Z.; Writing—review and editing, Z.S. and J.Z.; Visualization, J.B.; Supervision, J.Z. and J.B.; Project Administration, J.B. All authors have read and agreed to the published version of the manuscript.

Funding

This study was funded by the Humanities and Social Sciences Research Project of Jiangxi Higher Educations Institutions (Grant No. GL24202), the Shandong Social Science Planning Project (Grant No. 23DRWJ02), the Youth Program of the Natural Science Foundation of Shandong Province (Grant No. ZR2022QG030) and Shandong Provincial Young Science and Technology Talent Support Program (Grant No. SDAST2025QTB017).

Data Availability Statement

The original contributions presented in this study are included in the article. Further inquiries can be directed to the corresponding author.

Conflicts of Interest

The authors declare no conflicts of interest.

References

  1. Hosseini, S.M.A.; Farahzadi, L.; Pons, O. Assessing the sustainability index of different post-disaster temporary housing unit configuration types. J. Build. Eng. 2021, 42, 102806. [Google Scholar] [CrossRef]
  2. Pomponi, F.; Moghayedi, A.; Alshawawreh, L.; D’Amico, B.; Windapo, A. Sustainability of post-disaster and post-conflict sheltering in Africa: What matters? Sustain. Prod. Consum. 2019, 20, 140–150. [Google Scholar] [CrossRef]
  3. Opabola, E.A.; Galasso, C.; Rossetto, T.; Meilianda, E.; Idris, Y.; Nurdin, S. Investing in disaster preparedness and effective recovery of school physical infrastructure. Int. J. Disaster Risk Reduct. 2023, 90, 103623. [Google Scholar] [CrossRef]
  4. Mushtaha, A.W.; Alaloul, W.S. Sustainability factors influencing post-disaster reconstruction projects: Critical review and bibliometric analysis. Sustain. Futures 2025, 10, 100930. [Google Scholar] [CrossRef]
  5. Hendriks, E.; Opdyke, A. The influence of technical assistance and funding on perceptions of post-disaster housing safety after the 2015 Gorkha earthquakes in Nepal. Int. J. Disaster Risk Reduct. 2022, 73, 102906. [Google Scholar] [CrossRef]
  6. Opabola, E.A.; Galasso, C. A probabilistic framework for post-disaster recovery modeling of buildings and electric power networks in developing countries. Reliab. Eng. Syst. Saf. 2024, 242, 109679. [Google Scholar] [CrossRef]
  7. Matsushita, T.; Ghezelloo, Y.; Maly, E.; Kondo, T.; Meyer, M.; Newman, G. Placemaking mediating dilemmas by addressing the gaps in post-disaster recovery process: Long-term citizen-driven place-nurturing in New Orleans after hurricane Katrina. Int. J. Disaster Risk Reduct. 2024, 106, 104457. [Google Scholar] [CrossRef]
  8. Asgary, A.; Naeemi, P.; Ganguli, N.; Tofighi, M.; Attarian, K.; Fioretto, T. Road to resettlement: Understanding post-disaster relocation and resettlement challenges and complexities through a serious Game. Int. J. Disaster Risk Sci. 2024, 15, 521–535. [Google Scholar] [CrossRef]
  9. Hadlos, A.; Opdyke, A.; Hadigheh, S.A.; Gato, C. Pathways of multi-hazard post-disaster housing reconstruction among Ivatan Indigenous households. J. Build. Eng. 2024, 91, 109636. [Google Scholar] [CrossRef]
  10. Kobayashi, A.; Kobayashi, T.; Maeda, M.; Hidaka, T.; Mizuki, R. Factors ensuring healthy work environments for municipal office workers in the disaster area after the Fukushima Daiichi nuclear power plant accident: A qualitative analysis. Int. J. Disaster Risk Reduct. 2025, 116, 105125. [Google Scholar] [CrossRef]
  11. Ngulube, N.K.; Tatano, H.; Samaddar, S. Factors impacting participatory post-disaster relocation and housing reconstruction: The case of Tsholotsho District, Zimbabwe. Int. J. Disaster Risk Sci. 2024, 15, 58–72. [Google Scholar] [CrossRef]
  12. Sospeter, N.G.; Rwelamila, P.D.; Gimbi, J.J. A conceptual framework for managing post-disaster reconstruction projects in emerging economies: The case of Angola. Built Environ. Proj. Asset Manag. 2022, 12, 205–222. [Google Scholar] [CrossRef]
  13. Deng, H.; Li, H.; Xu, L.; Khudhair, A.; Song, H.; Gao, Y. Real-time bridge disaster management: Enabling technology and application framework. Autom. Constr. 2025, 174, 106150. [Google Scholar] [CrossRef]
  14. Xue, J.; Park, S.; Mondal, W.U.; Reia, S.M.; Yao, T.; Ukkusuri, S.V. An agent-based model of post-disaster recovery in multilayer socio-physical networks. Sustain. Cities Soc. 2024, 115, 105863. [Google Scholar] [CrossRef]
  15. Sharif, S.V.; Moshfegh, P.H.; Kashani, H. Simulation modeling of operation and coordination of agencies involved in post-disaster response and recovery. Reliab. Eng. Syst. Saf. 2023, 235, 109219. [Google Scholar] [CrossRef]
  16. Daşbaşı, T.; Daşbaşı, B. Fractional-order model of the post-disaster period: Study on the earthquakes in Türkiye. Math. Model. Numer. Simul. Appl. 2025, 5, 117–142. [Google Scholar] [CrossRef]
  17. Ghaffarian, S.; Roy, D.; Filatova, T.; Kerle, N. Agent-based modelling of post-disaster recovery with remote sensing data. Int. J. Disaster Risk Reduct. 2021, 60, 102285. [Google Scholar] [CrossRef]
  18. Wei, M.; Xu, J. Assessing road network resilience in disaster areas from a complex network perspective: A real-life case study from China. Int. J. Disaster Risk Reduct. 2024, 100, 104167. [Google Scholar] [CrossRef]
  19. Haken, H. Synergetics. Phys. Bull. 1977, 28, 412. [Google Scholar] [CrossRef]
  20. Sina, D.; Chang-Richards, A.Y.; Wilkinson, S.; Potangaroa, R. What does the future hold for relocated communities post-disaster? Factors affecting livelihood resilience. Int. J. Disaster Risk Reduct. 2019, 34, 173–183. [Google Scholar] [CrossRef]
  21. Liu, K.; Chang-Richards, A.; Costello, S.B.; L’Hermitte, C.; Li, N. What factors influence building material supply for post-disaster reconstruction and recovery? A systematic review applying systems thinking. Int. J. Disaster Risk Reduct. 2024, 114, 104981. [Google Scholar] [CrossRef]
  22. Mushtaha, A.W.; Alaloul, W.S.; Baarimah, A.O.; Musarat, M.A.; Alzubi, K.M.; Khan, A.M. A decision-making framework for prioritizing reconstruction projects in post-disaster recovery. Results Eng. 2025, 25, 103693. [Google Scholar] [CrossRef]
  23. Okunola, O.H.; Werners, S.E. A multi-dimensional framework for assessing disaster recovery pathways: Lessons and experiences from Germany and Nigeria. Int. J. Disaster Risk Reduct. 2024, 112, 104777. [Google Scholar] [CrossRef]
  24. Wang, C.; Wu, J.; Guo, E.; Wang, Y. The TransIRIO model: Capturing the economic ripple effect of different economic behaviours in post-disaster emergency-recovery-reconstruction. Int. J. Disaster Risk Reduct. 2024, 110, 104634. [Google Scholar] [CrossRef]
  25. Lagap, U.; Ghaffarian, S. Digital post-disaster risk management twinning: A review and improved conceptual framework. Int. J. Disaster Risk Reduct. 2024, 110, 104629. [Google Scholar] [CrossRef]
  26. Davidson, C.H.; Johnson, C.; Lizarralde, G.; Dikmen, N.; Sliwinski, A. Truths and myths about community participation in post-disaster housing projects. Habitat Int. 2007, 31, 100–115. [Google Scholar] [CrossRef]
  27. Zhao, Z.; Li, Z.; Wang, T.; Lin, Z.; Fang, D. Post-disaster recovery planning for infrastructure systems based on residents’ needs: A hypernetwork approach. Int. J. Disaster Risk Reduct. 2025, 118, 105258. [Google Scholar] [CrossRef]
  28. Lu, Y.; Xu, J. Low-carbon reconstruction: A meta-synthesis approach for the sustainable development of a post-disaster community. Syst. Res. Behav. Sci. 2016, 33, 173–187. [Google Scholar] [CrossRef]
  29. Lazarević, M.P. Elements of mathematical phenomenology of self-organization nonlinear dynamical systems: Synergetics and fractional calculus approach. Int. J. Non-Linear Mech. 2015, 73, 31–42. [Google Scholar] [CrossRef]
  30. Kabir, K.A.; Tanimoto, J. The role of pairwise nonlinear evolutionary dynamics in the rock–paper–scissors game with noise. Appl. Math. Comput. 2021, 394, 125767. [Google Scholar] [CrossRef]
  31. Chen, X.; Kwan, M.P.; Li, Q.; Chen, J. A model for evacuation risk assessment with consideration of pre-and post-disaster factors. Comput. Environ. Urban Syst. 2012, 36, 207–217. [Google Scholar] [CrossRef]
  32. Xiao, Y.; Tian, K.; Yuan, M.; Ouyang, Y.; Huang, H. Examining the complex relationships between socioeconomic development and the improvement of ecological environment in post-disaster reconstruction: The case of Wenchuan earthquake disaster area in Western China. J. Clean. Prod. 2022, 337, 130581. [Google Scholar] [CrossRef]
  33. Moghri, A.; Khalili, A. Investigating the influential post-disaster factors in determining the optimal location of shelters: A case study, Sarpol-e Zahab, Kermanshah province, Iran. Front. Archit. Res. 2022, 11, 846–864. [Google Scholar] [CrossRef]
  34. Ngulube, N.K.; Tatano, H.; Samaddar, S. Community insights: Citizen participation in Kamaishi Unosumai decade-long recovery from the Great East Japan Earthquake. Int. J. Disaster Risk Sci. 2023, 14, 886–897. [Google Scholar] [CrossRef]
  35. Okunola, O.H. Stakeholder engagement in disaster recovery: Insights into roles and power dynamics from the Ahr Valley, Germany. Int. J. Disaster Risk Reduct. 2024, 114, 104960. [Google Scholar] [CrossRef]
  36. Khan, M.T.I.; Anwar, S.; Sarkodie, S.A.; Yaseen, M.R.; Nadeem, A.M.; Ali, Q. Comprehensive disaster resilience index: Pathway towards risk-informed sustainable development. J. Clean. Prod. 2022, 366, 132937. [Google Scholar] [CrossRef]
  37. Yuan, M.; Xiao, Y.; Yang, Y.; Liu, C. Coupling coordination analysis of the economy-ecology-society complex systems in China’s Wenchuan earthquake disaster area. Ecol. Indic. 2023, 156, 111145. [Google Scholar] [CrossRef]
  38. Sartori, S.; Latrônico, F.; Campos, L. Sustainability and sustainable development: A taxonomy in the field of literature. Ambiente Soc. 2014, 17, 01–22. [Google Scholar] [CrossRef]
  39. Olawumi, T.O.; Chan, D.W. A scientometric review of global research on sustainability and sustainable development. J. Clean. Prod. 2018, 183, 231–250. [Google Scholar] [CrossRef]
  40. Ruggerio, C.A. Sustainability and sustainable development: A review of principles and definitions. Sci. Total Environ. 2021, 786, 147481. [Google Scholar] [CrossRef]
  41. Dresner, S. The Principles of Sustainability, 2nd ed; Routledge: London, UK, 2012; pp. 1–224. ISBN 978-1-84407-496-9. [Google Scholar]
  42. Keeble, B.R. The Brundtland report: ‘Our common future’. Med. War 1988, 4, 17–25. [Google Scholar] [CrossRef]
  43. Tuazon, D.; Corder, G.D.; McLellan, B.C. Sustainable development: A review of theoretical contributions. Int. J. Sustain. Future Hum. Secur. 2013, 1, 40–48. [Google Scholar] [CrossRef]
  44. Parris, T.M.; Kates, R.W. Characterizing and measuring sustainable development. Annu. Rev. Environ. Resour. 2003, 28, 559–586. [Google Scholar] [CrossRef]
  45. Ben-Eli, M.U. Sustainability: Definition and five core principles, a systems perspective. Sustain. Sci. 2018, 13, 1337–1343. [Google Scholar] [CrossRef]
  46. Paul, B.D. A history of the concept of sustainable development: Literature review. Ann. Univ. Oradea Econ. Sci. Ser. 2008, 17, 576–580. [Google Scholar]
  47. Mishra, M.; Desul, S.; Santos, C.A.G.; Mishra, S.K.; Kamal, A.H.M.; Goswami, S.; Kalumba, A.M.; Biswal, R.; da Silva, R.M.; dos Santos, C.A.C.; et al. A bibliometric analysis of sustainable development goals (SDGs): A review of progress, challenges, and opportunities. Environ. Dev. Sustain. 2024, 26, 11101–11143. [Google Scholar] [CrossRef] [PubMed]
  48. Giovannoni, E.; Fabietti, G. What is sustainability? A review of the concept and its applications. In Integrated Reporting: Concepts and Cases That Redefine Corporate Accountability; Busco, C., Frigo, M., Riccaboni, A., Quattrone, P., Eds.; Springer: Cham, Switzerland, 2013; pp. 21–40. ISBN 978-3-319-02167-6. [Google Scholar]
  49. Johri, A.; Joshi, P.; Kumar, S.; Joshi, G. Metaverse for sustainable development in a bibliometric analysis and systematic literature review. J. Clean. Prod. 2024, 435, 140610. [Google Scholar] [CrossRef]
  50. Zhao, J.; Gu, Y.; Xie, X.; Yu, D. Actor-critic-disturbance reinforcement learning algorithm-based fast finite-time stability of multiagent systems. Inf. Sci. 2025, 699, 121802. [Google Scholar] [CrossRef]
  51. Chen, G.; Xia, J.; Park, J.H.; Shen, H.; Zhuang, G. Robust sampled-data control for switched complex dynamical networks with actuators saturation. IEEE Trans. Cybern. 2021, 52, 10909–10923. [Google Scholar] [CrossRef]
  52. Barnett, W.P.; Carroll, G.R. Competition and mutualism among early telephone companies. Adm. Sci. Q. 1987, 32, 400–421. [Google Scholar] [CrossRef]
  53. Bertsimas, D.; King, A. Logistic regression: From art to science. Stat. Sci. 2017, 32, 367–384. [Google Scholar] [CrossRef]
  54. Jie, J.; Yang, Y.; Zhang, P. The construction method of chaotic system model based on state variables and uncertain variables and its application in image encryption. Appl. Math. Model. 2025, 144, 116097. [Google Scholar] [CrossRef]
  55. Anilkumar, S.; Banerji, H. An inquiry into success factors for post-disaster housing reconstruction projects: A case of Kerala, South India. Int. J. Disaster Risk Sci. 2021, 12, 24–39. [Google Scholar] [CrossRef]
  56. McCaughey, J.W.; Daly, P.; Mundir, I.; Mahdi, S.; Patt, A. Socio-economic consequences of post-disaster reconstruction in hazard-exposed areas. Nat. Sustain. 2018, 1, 38–43. [Google Scholar] [CrossRef]
  57. DeJesus, E.X.; Kaufman, C. Routh-Hurwitz criterion in the examination of eigenvalues of a system of nonlinear ordinary differential equations. Phys. Rev. A 1987, 35, 5288. [Google Scholar] [CrossRef]
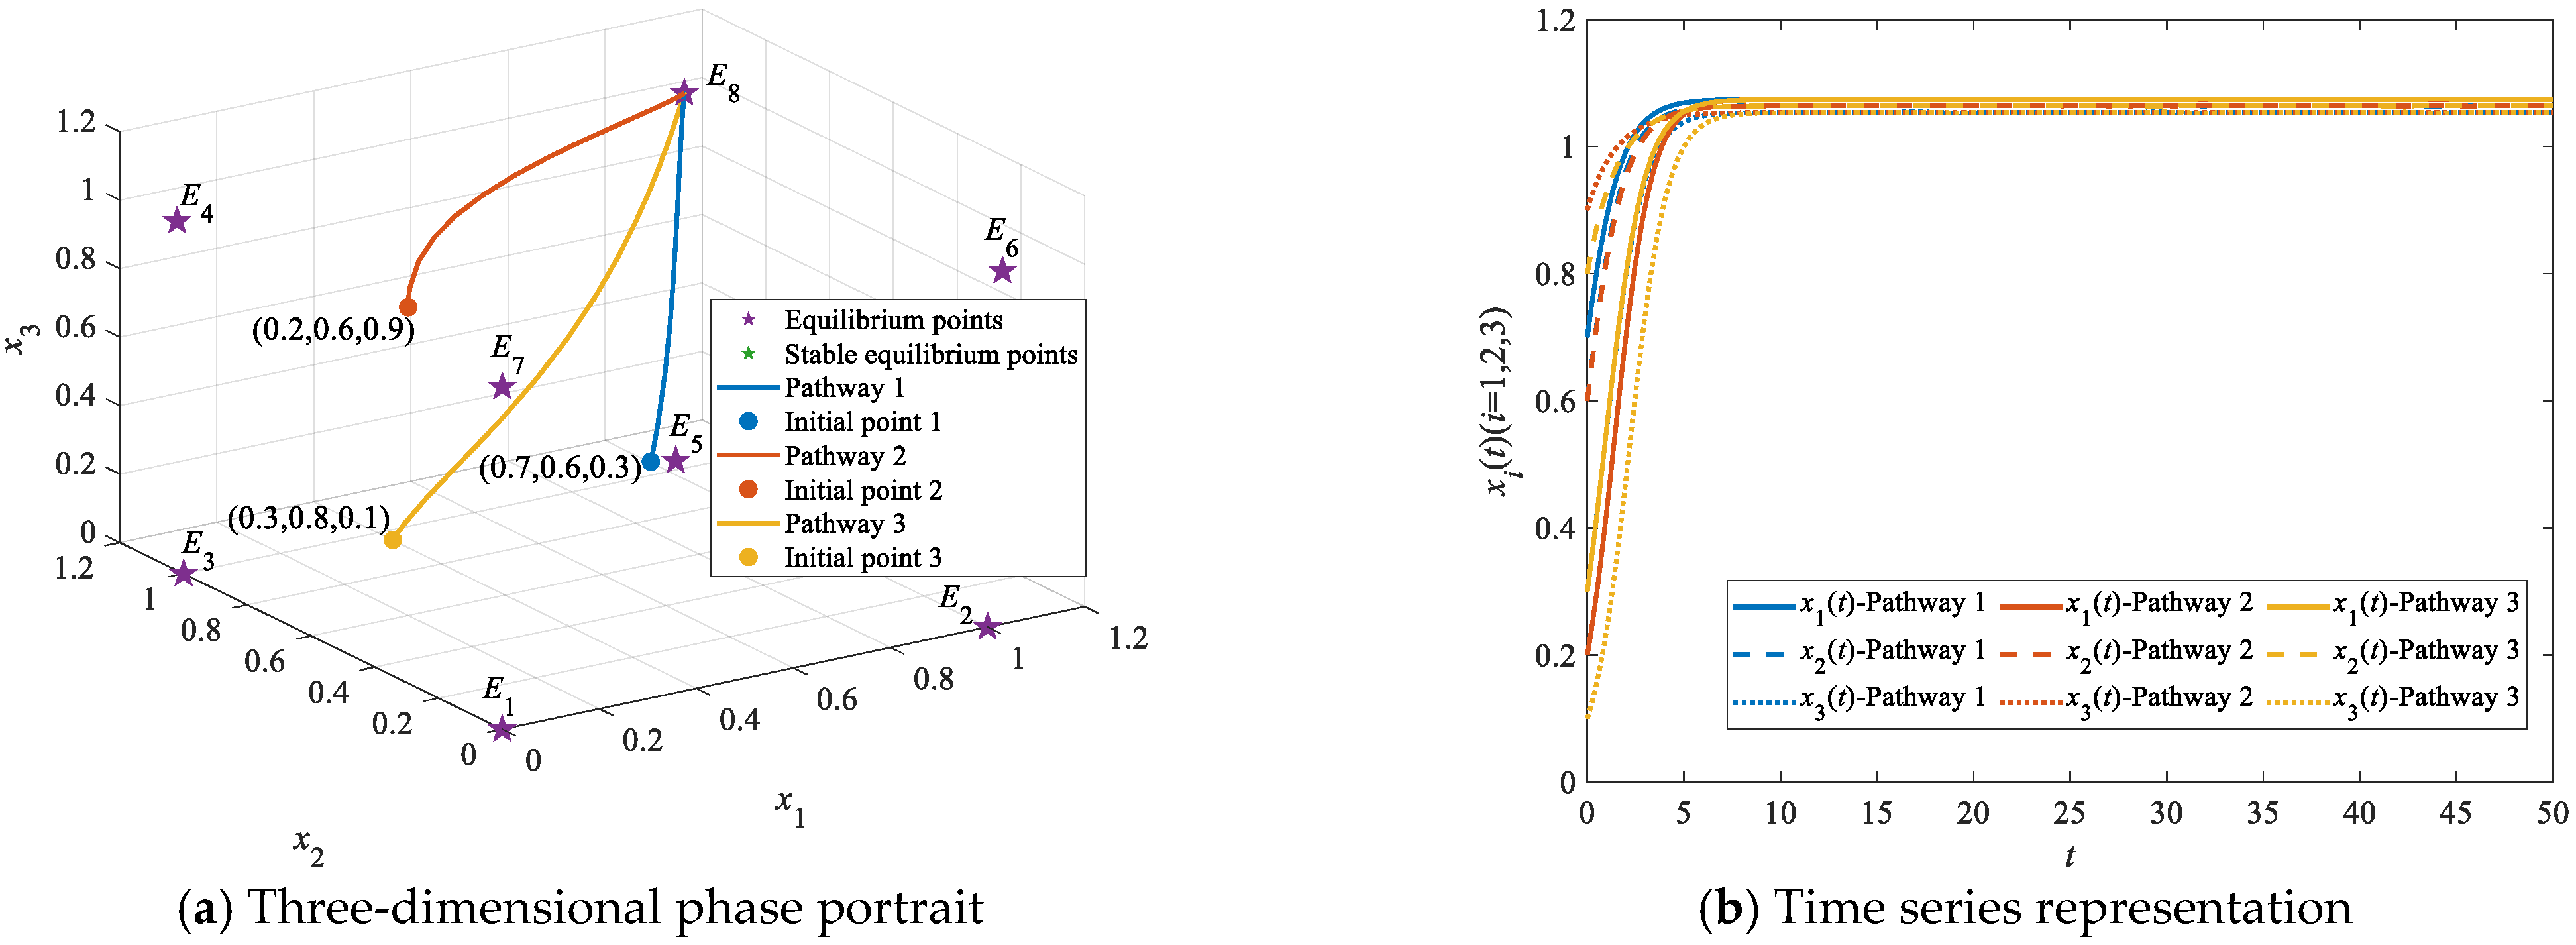
Figure 1. The evolutionary stability of PDR at E8.
Systems 13 01063 g001
Figure 2. The stepwise evolutionary pathway E1E2E5E8.
Systems 13 01063 g002
Figure 3. The stepwise evolutionary pathway E1E2E6E8.
Systems 13 01063 g003
Figure 4. The stepwise evolutionary pathway E1E3E5E8.
Systems 13 01063 g004
Figure 5. The stepwise evolutionary pathway E1E3E7E8.
Systems 13 01063 g005
Figure 6. The stepwise evolutionary pathway E1E4E6E8.
Systems 13 01063 g006
Figure 7. The stepwise evolutionary pathway E1E4E7E8.
Systems 13 01063 g007
Figure 8. The leapfrogging evolutionary pathway E1E2E8.
Systems 13 01063 g008
Figure 9. The leapfrogging evolutionary pathway E1E5E8.
Systems 13 01063 g009
Figure 10. The leapfrogging evolutionary pathway E1E8.
Systems 13 01063 g010
Figure 11. The leapfrogging evolutionary pathway E2E8.
Systems 13 01063 g011
Figure 12. The leapfrogging evolutionary pathway E3E8.
Systems 13 01063 g012
Figure 13. The leapfrogging evolutionary pathway E4E8.
Systems 13 01063 g013
Table 1. Comparison between previous papers and this paper.
PapersPDR ModelsPDR Composition
Conceptual ModelsComplex Systems ModelsLocal or Qualitative ExplorationGlobal and Quantitative Exploration
Non-Synergetics-BasedSynergetics-Based
[6,12,13,22,23,24,25]
[14,16,17,18,27,28]
[3,6,33,34,35]
This paper
Table 2. The evolutionary pathways of PDR.
Evolutionary Pathway TypesInitial Stable PointIntermediate Stable Point Ideal Stable PointPathwaysIntervention Stages Required
Stepwise evolutionary pathwaysE1E2, E5/E6;
E3, E5/E7;
E4, E6/E7;
E8E1E2E5E8, E1E2E6E8, E1E3E5E8, E1E3E7E8, E1E4E6E8 and E1E4E7E8At least three
E2E5/E6E8E2E5E8 and E2E6E8At least two
E3E5/E7E8E3E5E8 and E3E7E8
E4E6/E7E8E4E7E8 and E4E6E8
E5/E6/E7NoneE8E5E8, E6E8 and E7E8At least one
Leapfrogging evolutionary pathwaysE1E2/E3/E4/E5/E6/E7E8E1E2E8, E1E3E8, E1E4E8, E1E5E8, E1E6E8 and E1E7E8At least two
E1NoneE8E1E8At least one
E2/E3/E4NoneE8E2E8, E3E8 and E4E8
Table 3. Parameter settings.
Parameters (10−1)Effective Equilibrium Points
α1α2α3β11β12β13β21β22β23β31β32β33StableUnstable
−1−3−210−0.3−0.4410−0.230.210E1None
51110−0.3−0.44100.240.210E2E1, E3, E4, E7
251104.50.3−0.310−0.20.3410E3E1, E2, E4, E6
115100.344100.4−0.4−0.210E4E1, E2, E3, E5
106210−0.3−0.4−0.310−0.230.210E5E1, E2, E3, E4, E7
102610−0.3−0.44100.2−0.2−0.310E6E1, E2, E3, E4, E7
2106104.5−0.2−0.310−0.230.210E7E1, E2, E3, E4, E6
10101010−0.4−0.3−0.410−0.2−0.3−0.210E8Ei(i = 1, 2, …, 7)
Disclaimer/Publisher’s Note: The statements, opinions and data contained in all publications are solely those of the individual author(s) and contributor(s) and not of MDPI and/or the editor(s). MDPI and/or the editor(s) disclaim responsibility for any injury to people or property resulting from any ideas, methods, instructions or products referred to in the content.