Article

System-Level Evaluation of Autonomous Vehicle Lane Deployment Strategies Under Mixed Traffic Flow

School of Transportation, Southeast University, Jiulonghu Campus, Nanjing 211189, China
*
Author to whom correspondence should be addressed.
Systems 2025, 13(11), 958; https://doi.org/10.3390/systems13110958
Submission received: 16 September 2025 / Revised: 15 October 2025 / Accepted: 27 October 2025 / Published: 28 October 2025

Abstract

Connected and Autonomous Vehicles (CAVs) are expected to reshape future transportation systems. During the long transition period, in which CAVs and human-driven vehicles (HVs) coexist, deploying CAV-dedicated lanes offers a promising approach to enhancing overall efficiency, but raises concerns about distributional fairness. This study develops a system-level evaluation framework that integrates bi-level network capacity optimization with practical planning constraints to determine optimal lane-deployment strategies. The bi-level model aims to maximize network reserve capacity at the upper level, while it captures mixed-traffic flow distribution under the lower-level user equilibrium (UE) principle. Both levels are constrained by CAV market penetration (MPR), social equity, and budget bound considerations. To ensure computational tractability, nonlinear relationships are linearized through Piecewise Linear Approximation (PLA), converting the original Mixed-Integer Nonlinear Programming (MINLP) model into a Mixed-Integer Linear Programming (MILP) formulation solvable by standard optimization solvers. Numerical experiments on the Sioux Falls network demonstrate that increasing MPR and dedicated lane deployment can substantially improve network capacity by up to 36% compared with the baseline, with diminishing marginal benefits as deployment scale excesses. Incorporating equity constraints further reduce the HV–CAV cost gap, promoting fairer outcomes without significant efficiency loss. These findings offer quantitative evidence on the efficiency–equity trade-offs in CAV-dedicated lanes planning and provide practical implications for policymakers in developing sustainable strategies.

1. Introduction

The advent of Connected and Autonomous Vehicles (CAVs) is expected to reshape the structure and operation of future transportation systems. Compared with human-driven vehicles (HVs), CAVs can operate cooperatively in platoons with shorter headways through advanced sensors and communication technologies [1]. Autonomous driving mitigates human-related errors and delays, thereby improving road capacity [2], enhancing traffic efficiency [3], and reducing fuel consumption [4]. However, studies suggest that the penetration rate of Level 4 CAVs is unlikely to reach 100% before 2045 [5], implying a prolonged transitional period in which HVs and CAVs will coexist. Since most of the aforementioned benefits depend on a high CAV market penetration rate (MPR), realizing the full potential of CAVs in mixed-traffic environments remains a significant challenge [6]. To address this issue, it is essential to evaluate system-level performance under mixed-traffic conditions and develop effective strategies to optimize system capacity during this transition.

1.1. Literature Review

The presence of CAVs substantially alters traffic-flow characteristics in a mixed environment comprising HVs. Research on this impact can be broadly divided into micro-level and macro-level studies. At the micro-level, researchers have focused on car-following behavior [7,8], trajectory optimization [9], and intersection control [10]. For example, Mohajerpoor and Ramezani [11] developed analytical models to estimate saturation flow and delay under mixed-traffic conditions, demonstrating that road capacity is strongly influenced by MPR, platoon size, headway, and car-following patterns [12,13]. At the macro-level, network capacity is widely recognized as a key indicator of system performance, reflecting the maximum traffic volume or origin–destination (OD) throughput that a network can accommodate [14,15]. Recent studies have extended this concept to mixed HV–CAV networks [16], revealing that the overall efficiency generally improves as the MPR increases.
These studies have indicated that the stable platooning of CAVs becomes less feasible when CAVs and HVs share the roadway, making it difficult for the potential gains of automation to be fully realized [17]. Because of this limitation, allocating dedicated lanes to CAVs has been frequently proposed as a promising approach to reduce the interactions between CAVs and HVs [18]. Such lanes can be implemented by reallocating existing road space or constructing new infrastructure, thereby creating exclusive operational domains that mitigate the inefficiencies of mixed flow and help realize the benefits of automation.
The design and impacts of CAV-dedicated lanes across various facility types and modeling scales have been examined in a growing body of literature. Simulation studies primarily evaluate the operational and safety effects of dedicated lanes under different analytical parameters [19,20,21,22]. For example, Rahman and Abdel-Aty [21] evaluated the safety performance of CAV platoons by using VISSIM microscopic simulation and found that CAV-dedicated lanes outperform regular lanes in improving longitudinal safety. Xiao, Wang [22] reported that the CAV-dedicated lanes may worsen congestion at MPR but significantly enhance traffic efficiency once CAV adoption reaches moderate levels.
Although simulation experiments can capture detailed vehicle operation and queuing characteristics, it remains difficult to optimize deployment strategies from a macro-policy perspective, which is precisely what planners require for practical management. Therefore, more recent works have extended to system-level optimization, employing bi-level or equilibrium-based frameworks to determine optimal lane locations [23,24,25]. For example, Chen, He [25] proposed a bi-level programming framework to minimize the overall travel cost through the CAV-dedicated lane deployment, while Madadi, Van Nes [26] constructed a similar bi-level structure in which the upper level designs optimize lane allocations and the lower level models user–route choices. These formulations have demonstrated the effectiveness of system-level optimization to enhance network efficiency through dedicated lane planning and show that the effectiveness of deployment is closely tied to the MPR.
Nevertheless, most existing frameworks remain primarily efficiency-oriented, typically pursuing single objectives, such as maximizing network capacity or minimizing total travel time, while overlooking broader practical considerations that are critical for real-world implementation. Consequently, their applicability to policy and large-scale planning contexts is limited. In fact, several articles have pointed out that dedicating lanes exclusively to CAVs may increase travel costs for HV users by limiting their route choices, thereby raising concerns of social inequity [27,28]. In addition, economic feasibility must also be considered, as large-scale deployment of dedicated lanes is often constrained by limited budgets and investment priorities.
Therefore, future planning and deployment strategies should systematically integrate efficiency, economic feasibility, and social fairness within a unified, system-level modeling framework. Such an approach can better support sustainable and socially acceptable CAV-lane-deployment decisions. To bridge this methodological gap, we develop a comprehensive bi-level optimization framework and investigate the design of CAV-dedicated lane strategies from a macro-level planning perspective. Specifically, the study aims to address the following research questions:
(1) How can the influence of MPR on network performance be systematically evaluated under mixed-traffic conditions?
(2) How can an optimal CAV lane-deployment strategy be determined to achieve a balanced trade-off among capacity enhancement, social fairness, and economic feasibility?
(3) What is the system-wide and user-level implications of CAV-lane deployment for the travel cost?

1.2. Objectives and Contributions

Building on the above research gap, this study aims to establish a system-level modeling framework that optimizes the deployment of CAV-dedicated lanes under mixed HV–CAV conditions. The proposed approach emphasizes not only efficiency improvement but also the consideration of economic feasibility and social fairness. The main contributions are summarized as follows:
(1) Integrated bi-level optimization framework: A novel bi-level model is developed to capture the coupling between lane-allocation decisions and traffic-assignment behavior. The upper level aims to maximize the network reserve capacity (i.e., total OD demand), while the lower level predicts travelers’ path choices by considering user equilibrium (UE) traffic-assignment problems under the lane-deployment configuration. Additional constraints are incorporated into the framework to ensure that dedicated lanes are established in a feasible and policy-consistent way. Compared with previous efficiency-oriented formulations, the proposed framework explicitly considers MPR (to reflect adoption levels), social equity (measured by the travel cost gap between HVs and CAVs), and budget limitation, enabling a more realistic and policy-relevant system-level optimization.
(2) Advanced reformulation and solution techniques: To overcome the computational complexity of the bi-level Mixed-Integer Nonlinear Programming (MINLP) formulation, we adopt the Piecewise Linear Approximation (PLA) approach. This reformulation converts nonlinear functions into a Mixed-Integer Linear Programming (MILP) structure, which can be solved efficiently using standard optimization solvers.
(3) Numerical validation and policy insights: Numerical experiments on Sioux Falls network are conducted to verify the correctness and convergence of the proposed algorithm. The results confirm the framework’s ability to evaluate system performance under varying MPRs, budget levels, and equity thresholds. In addition, the experiments yield valuable policy insights, identifying critical thresholds for over-deployment and highlighting the trade-offs between efficiency improvement, equity assurance, and economic feasibility—thereby providing quantitative guidance for sustainable CAV lane planning and staged deployment strategies.
The structure of the proposed bi-level programming is shown in Figure 1.

2. Model Formulation

2.1. Network Description

This study investigates an emerging traffic system in which travelers use either HVs or CAVs to satisfy travel demand across origin–destination (OD) pair (r, s). We strive to design a strategy of CAV-dedicated lane deployment that enhances network performance with mixed HV and CAV flows. Once the strategy is determined, a subset of roads is designated as control roads to be converted with CAV-dedicated lanes, while the remaining roads are retained as regular roads.
For clarity in model formulation, an extended network is constructed, where each original road is represented by a pair of parallel links: a CAV-dedicated candidate link and a regular link. Let A 0 and A ˜ denote the set of regular links and CAV-dedicated candidate links, respectively. The set A contains all links in the extended network and set Φ contains parallel-link pairs. After model solving, three road links exist: regular links, CAV-dedicated links, and virtual links. A binary variable y a is introduced to indicate if link a A 0 is deployed with a CAV-dedicated deployment. Note that if y a = 1 , the parallel link a ˜ is set as a CAV-dedicated link. Mathematically, the extended network is expressed as follows:
A = A 0 A ˜ , a A , a 0 A 0 , a ˜ A ˜
Φ a 0 = a 0 , a ˜ , , a 0 A 0 , a ˜ A ˜
y a 0 , 1 , a A 0
Take the network in Figure 2 as an example. As road 1 and road 2 are to be developed as control roads, there are A = 1 , 2 , 3 , 4 , 5 , 6 , 7 , 8 , A 0 = 1 , 2 , 5 , 6 , A ˜ = 3 , 4 , 7 , 8 , and Φ = 1 , 3 , 2 , 4 , 5 , 7 , 6 , 8 , where Φ 1 = 1 , 3 means regular link 1 and CAV-dedicated link 3 are parallel links.
The key notations used in this paper are summarized in Appendix A.

2.2. Assumptions

Before formulation of the optimization model, this section will present necessary assumptions as follows.
Assumption 1.
All CAVs considered in this study are assumed to possess Level-4 automation, as defined by SAE International [29]. At this level, CAVs are capable of fully automated driving with minimal human intervention and have perfect, real-time knowledge of traffic conditions, enabling them to maintain shorter headways through cooperative control. Meanwhile, human drivers are assumed to exhibit residual skepticism toward CAV technologies, as automation remains relatively new and unfamiliar [30]. Consequently, HV drivers tend to maintain larger gaps to hedge against perceived uncertainty when following CAVs. Under these assumptions, the headway relationships among the four vehicle-pair scenarios can be determined, as described in Section 2.3.
Assumption 2.
For modeling tractability and network continuity, each multi-lane link is restricted to at most one CAV-dedicated lane and link-level heterogeneity (e.g., lane changing/merging, or intersection bottlenecks) is not explicitly modeled at this stage. This assumption has been widely used in previous studies [17,31], simplifying lane-allocation decisions, ensuring model solvability, and remaining effective in system-level analysis.
Assumption 3.
On links with a dedicated CAV-lane deployed, HVs are prohibited from using the dedicated lane, while CAVs are permitted to use either the dedicated or regular lanes [32]. This strict-separation baseline facilitates system-level optimization. Flexible sharing rules (e.g., time-of-day or demand-responsive allocation) are beyond the current scope.
Assumption 4.
Traffic characteristics are assumed to be time-invariant, representing average daily conditions. This simplification facilitates tractable optimization of lane-deployment decisions, although time-of-day variations (e.g., peak-hour congestion or nighttime low demand) could potentially affect traffic dynamics and thus the optimal deployment outcomes.
Remark 1.
The above assumptions are adopted to ensure the tractability of the bi-level optimization model and the continuity of network representation. These simplifications inevitably introduce certain limitations. Specifically, Assumption 1 idealizes vehicle behavior by assuming perfect perception and full cooperation among CAVs; Assumptions 2 and 3 abstract away link-level heterogeneity and microscopic dynamics such as lane changing or merging; and Assumption 4 assumes temporally stationary traffic conditions, neglecting diurnal variations that may affect short-term deployment outcomes. As a result, the framework focuses on network-level efficiency and policy evaluation rather than fine-grained temporal or behavioral processes.

2.3. Travel Time Function of Mixed-Flow Environment

According to the classical Bureau of Public Roads (BPR) formula [33], the travel time t a v a H V for only-HV traffic can be written as a strictly increasing function of flow v a H V :
t a v a H V = t a 0 1 + α v a H V / C a 0 β , a A
where α and β are default parameters. t a 0 represents the free-flow travel time and C a 0 represents the basic capacity of link a when pure HVs flow exists, respectively.
In the mixed-traffic environment, it is assumed that once the traffic flow reaches a steady state, vehicles form a periodic platooning pattern consisting of k 1 HVs between two CAV platoons of size k 2 [12]. As illustrated in Figure 3, this configuration gives rise to four vehicle pairings, each characterized by a corresponding headway distance. According to the different driving characteristics, the relationships among the four headway types can be expressed as γ H 0 γ 1 H 0 < H 0 γ 2 H 0 . This ordering reflects the underlying car-following behavior: the intra-platoon CAV–CAV spacing ( γ H 0 ) is the smallest due to cooperative control; the head of a CAV platoon ( γ 1 H 0 ) maintains at least the headway of a non-leader CAV; the nominal HV–HV headway ( H 0 ) represents the typical spacing under human driving; and HV following a CAV ( γ 2 H 0 ) requires a larger following distance that reflects the perceived uncertainty in mixed-traffic interactions. Consequently, the following conditions are expected: 0 < γ γ 1 < 1 and γ 2 1 .
To analyze the traffic flow characteristics, it is essential to obtain the average headway of the mixed flow considering the placement of CAVs and HVs. Following the analytical approach developed by Chen, Ahn [34], the link capacity with mixed HV and CAV traffic flow is not constant. Therefore, the average headway required for vehicles in the mixed-traffic environment to travel safely and consecutively reduces from H 0 to H ¯ , which can be expressed as follows:
H ¯ = k 2 1 γ H 0 + γ 1 H 0 + k 1 1 H 0 + γ 2 H 0 / k 1 + k 2
Consequently, the capacity C a with mixed HV and CAV flow is defined as follows:
C a = C a 0 H 0 / H ¯ , a A
When a link is constructed with the deployment of CAV-dedicated lane, HV and CAV flows are segregated, as shown in Figure 4.
The capacity of a CAV-dedicated link a A ˜ can be obtained by the equations:
H ¯ = k 2 1 γ H 0 + γ 1 H 0 / k 2
C a = C a 0 H 0 / H ¯ , a A ˜
To express the link capacity formula as a unified equation, the CAV proportion ρ a and the average gain ε of critical spacing per CAV are introduced [34]. Then, Equations (5)–(8) can be combined as follows:
C a = C a 0 / 1 ε ρ a , a A
ρ a = v a C A V / m M v a m , a A
ε = 1 γ γ 1 γ / k 2 ,   if   ρ a = 1 1 γ γ 1 γ + γ 2 1 / k 2 ,   if   0   ρ a < 1 , a A
It should be noted that 0 < ρ a < 1 means link a accommodates mixed-traffic flow of both CAVs and HVs. Combining Equations (9)–(11), the link travel time is formulated as follows:
t a = t a 0 1 y a 1 + α v H V + 1 ε v C A V C a 0 β + t a 0 y a 1 + α N u m a v H V + 1 ε v C A V N u m a 1 C a 0 β , a A 0 t a ˜ = t a 0 y a 1 + α N u m a v H V + 1 ε v C A V C a 0 β , a ˜ A ˜

2.4. Travel Costs for HV and CAV Users

The generalized travel cost consists of travel time and fuel consumption. To combine the two factors, the monetary parameter V O T m is introduced to convert travel time into equivalent monetary value. Since CAV is more helpful to travel time-saving than HV users, the value of V O T C A V is commonly set lower than V O T H V [35]. The travel cost c a m for mode m on a regular link can be described as follows:
c a m = V O T m t a v a + χ m L a , a A , m M
where χ m represents the monetary cost of vehicle fuel per kilometer, and L a denotes the length of link a . For each travel path k, the generalized cost c m , k r s equals the total travel cost of links passed:
c k r s , m = a A m M c a m δ a , k r s , m , r R , s S , k K r s
δ a , k r s , m { 0 , 1 } , a A , r R , s S , k K r s
where δ a , k r s , m = 1 when path k passes through link a , δ a , k r s = 0 otherwise.

3. Bi-Level Programming with Deployment Constraints

3.1. Mixed-Flow Reserve Capacity Model

This section presents the bi-level optimization model for maximizing network reserve capacity in the mixed-flow traffic environment. The following objective function is employed to maximize the total sum of O–D demand [36]:
max q ¯ 0 Q q ¯ = r R s S q ¯ r s
Subject to
0 v a q ¯ C a , a A
where q ¯ r s is the maximum potential travel demand that can be allocated in an O–D pair (r, s), q ¯ is the vector of q ¯ r s , and v a denotes link flow at the equilibrium state obtained by solving the lower-level problem, which can be formulated as follows:
min Z = a A m M 0 v a m c a m ω d ω
Subject to
k K r s m M f k r s , m = q m r s , r R , s S , m M
q m r s 0 , r R , s S , m M
f k r s , m 0 , k K r s , r R , s S , m M
v a m = r R s S k K r s f k r s , m δ k r s , m , a A , m M
v a = m M v a m , a A
Constraint (19) ensures traffic flow relationships. Constraints (20) and (21) specify that decision variables q m r s and f k r s , m are non-negative. Constraints (22) and (23) calculate the traffic flow on link a .

3.2. Practical Constraints for CAV-Dedicated Lane Deployment

3.2.1. CAV Market Penetration Ratio

The value of MPR is a key indicator reflecting the planning stage of a region or city. Therefore, the required deployment scale of CAV-dedicated lanes critically depends on the MPR. It is noted that the MPR is an OD-level exogenous parameter representing the CAV proportion of travel demand between each OD pair, while the link-level variable ρ a is the endogenous variable. The following proportionate relation between CAVs and HVs is set as a constraint:
r R , s S q C A V r s = ρ r R , s S q ¯ r s = ρ r R , s S q H V r s + r R , s S q C A V r s , r R , s S
where the predetermined bound of MPR is set as ρ 0 , 1 , to ensure the condition of the mixed HV and CAV environment.

3.2.2. Social Equity

The term “social equity” (also called “fairness”) refers to the distribution of effects (benefits or costs) and whether it is considered fair and appropriate [37]. Regarding the deployment of CAV-dedicated lanes, such construction can enhance network performance by improving CAV traffic capacity. Nevertheless, it may restrict HV operations and increase their travel cost, resulting in raising social equality concerns. To account for this trade-off between system efficiency and user fairness, an equity indicator should be explicitly integrated into the planning framework, enabling a quantitative and interpretable control of the efficiency–equity balance within the optimization framework.
Equity are generally distinguished into two main categories: Horizontal equity, which emphasizes equal treatment among comparable users, and Vertical equity, which focuses on redistributing benefits toward disadvantaged groups [38]. This study adopts the Horizontal perspective, aiming to narrow the travel cost gap between groups that differ in vehicle technology (HV vs. CAV). In practical terms, the proposed equity constraint provides planners with a policy-relevant lever for assessing the trade-off between network efficiency and user fairness in CAV-lane-deployment decisions, by influencing the feasible domain of the optimal deployment strategy.
Consequently, equity is formulated as an OD-specific cost-ratio constraint, which limits the relative travel cost of HVs to that of CAVs in each OD pair:
u r s , H V < λ u r s , C A V , r R , s S
where u r s , H V and u r s , C A V represent the travel cost of HV and CAV users between OD pair (r, s), respectively. The parameter λ represents the maximum allowable inequity level: a larger value of λ implies a weaker equity constraint and thus a higher permissible cost disparity between HVs and CAVs. Since HV costs are inherently no lower than those of CAVs, λ > 1 must be set to ensure model feasibility.
The robustness of the proposed equity indicator is theoretically supported by previous findings showing that equity-based network design formulations of a similar structure are generally robust to moderate parameter perturbations. For instance, Behbahani, Nazari [38] demonstrated that equity-based performance metrics—defined by generalized travel cost or accessibility measures—varied by less than 3% under comparable conditions.
It is worth noting that, while equity is measured between HV and CAV travelers at the system level, other fairness dimensions—such as income heterogeneity or OD-specific accessibility differences, are not included in the current framework [39]. These aspects could be incorporated in future work to provide a more comprehensive evaluation of social acceptability.

3.2.3. Budget Bound

Since deploying CAV-dedicated lanes represents a capital-intensive infrastructure investment, it is essential to account for budgetary constraints to capture real-world implementation limitations. Let D ¯ denote the predetermined maximum allowable budget for the total construction cost.
0 < a A y a L a d D ¯
where y a = 1 indicates link a is deployed with a CAV-dedicated lane, and y a = 0 otherwise. d is the unit construction cost of a CAV-dedicated lane.

3.3. Bi-Level Optimization Model for CAV-Dedicated Lane-Deployment Strategy

Synthesizing the preceding analysis, a bi-level optimization model incorporating practical constraints is formulated. The model outputs the deployment strategy of each road link as a decision variable.
(I) Upper-level objective problem
max q ¯ Ω q ¯ Q q ¯ = r R s S q ¯ r s
subject to Equation (17).
(II) Practical CAV-dedicated lane-deployment conditions. Under the given MPR, social equity, and construction budget bound, the feasible region Ω q , v for travel demand and traffic-flow variables should satisfy the constraints of Equations (24)–(26).
(III) Lower-level model
q q ¯ , v q ¯ = arg min q , v Ω q , v a A m M 0 v a m V O T m t a ω d ω + a A m M v a m χ m L a
subject to Equations (19)–(22).
With the maximum OD demand q ¯ solved by model (I) and feasible region Ω q , v obtained from condition (II), the link flow pattern v q ¯ = v a q ¯ , a A , and demand pattern q q ¯ = q m r s q ¯ , r R , s S , m M T are ultimately solved by the lower-level model (III).

4. Solution Technique

The bi-level structure and inherent nonlinearity of the proposed model present substantial challenges for obtaining an effective solution. To overcome these difficulties, this section introduces a set of solution techniques designed to address the nonlinearity issue.

4.1. Linearization of the UE Principle

The path choice of HV and CAV users is assumed to follow the user equilibrium (UE) principle [40]. Under the UE condition, the travel times of all utilized paths within each OD pair are equal to and no greater than those of any unused paths. Accordingly, the path flow of HVs and CAVs must satisfy the following constraints once the traffic system reaches equilibrium state:
f k r s , m c k r s , m u r s , m = 0 , r R , s S , k K r s , m M
c k r s , m u r s , m 0 , r R , s S , k K r s , m M
where u r s , m denotes the minimum travel cost of mode m between OD pair (r, s).
The nonlinearity of the UE condition arises from the multiplicative terms in constraint (29), which significantly increase computational complexity. Therefore, we introduce binary variables to reformulate the condition into an equivalent set of linear constraints [41]:
0 c k r s , m u r s , m U 1 ψ k r s , m , r R , s S , k K r s , m M
0 f k r s , m U ψ k r s , m , r R , s S , k K r s , m M
ψ k r s , m 0 , 1 , r R , s S , k K r s , m M
where U is a sufficiently large number. The auxiliary binary variable ψ k r s , m = 1 implies path k K r s of mode m takes positive flow, and is 0 otherwise.

4.2. Linearization of Link Travel Time

As the travel time function adopts the classical BPR formula with the form of power, the nonlinear link travel time is related to variables v a H V , v a C A V , and a binary variable y a . Therefore, the linearization of Equation (12) consists of three steps.
Step 1: Change the multivariate polynomial into a univariate polynomial. By introducing new auxiliary continuous variables w a = v a H V + 1 ε v a C A V and l a = w a / C a 0 β , Equation (12) can be rewritten as follows:
t a = t a 0 1 y a 1 + α l a + t a 0 y a 1 + α l a 1 / N u m a β , a A 0 t a ˜ = t a 0 y a 1 + α l a 1 / N u m a β , a ˜ A ˜
Following the relation of link flow v a and capacity C a in Equation (35), the lower and upper bounds of w a can be calculated, with w _ a = 0 and w ¯ a = C a 0 , respectively.
m M v a m C a = C a 0 / 1 ε v a C A V / m M v a m , a A
Step 2: Linearize the power function. The PLA approach is one of the most widely used techniques for solving the nonlinear problem [42]. As shown in Figure 5, the bound interval w _ a , w ¯ a is subdivided into smaller intervals by introducing points W a p , where p P = 1 , 2 , , N , N + 1 and 0 = W a 1 < W a 2 < < W a p < W a p + 1 < W a N < W a N + 1 = C a 0 . Then, the univariate polynomial curve can be replaced with a piecewise linear curve.
The variable φ a p is introduced to denote the weight coefficient of breakpoint W a p . Thus, for any point w a in the interval W a p , W a p + 1 , it can be represented as φ a p W a p + φ a p + 1 W a p + 1 . With each interval W a p , W a p + 1 assumed to be the same size, the above linearized constraints can be expressed as follows:
l ^ a = p = 1 N + 1 φ a p l a W a ( p ) , a A
w a = p = 1 N + 1 φ a p W a p , a A
W ( a p ) = w _ a + w ¯ a w _ a p 1 / N , a A , p P
p = 1 N + 1 φ a p = 1 , a A
φ a p 0 , a A
where Equation (36) denotes the PLA of the function l a over the interval [ w _ a , w ¯ a ] . The variable w a is rewritten as Equation (37), which follows the constraints in Equations (38)–(40). Referring to the technique of Special Order Set Type 2 (SOS2) [43], at most, two adjacent φ a p are positive. To enforce the condition of SOS2, the coefficient φ a p needs to follow the constraints:
p = 1 N ξ a p = 1 , a A
φ a 1 ξ a 1 , a A
φ a p ξ a p 1 + ξ a p , a A , p P \ 1 , N + 1
φ a N + 1 ξ a N , a A
where Equations (42)–(44) indicate ξ a p = 1 when W a p w a W a p + 1 , and ξ a p = 0 otherwise.
Step 3: Linearize the product of continuous and binary variables. Although we have obtained the linear function l ^ a to estimate l a , t a is still nonlinear due to the product of l a and y a . Thus, a new variable ω a = l a y a constrained by Equation (45) is introduced, and Equation (34) can be rewritten as Equation (46):
ω a U y a , ω a l ^ a , ω a l ^ a U 1 y a , a A 0
t a = t a 0 1 + α l a + α ω a 1 / N u m a β 1 , a A 0 t a ˜ = t a 0 y a + α ω a 1 / N u m a β , a ˜ A ˜
At this point, the proposed model is converted into a MILP. The objective function is Equation (16), constrained by Equations (19)–(26), (31)–(33), (36)–(46), and can be easily solved by standard solvers such as CPLEX.

5. Numerical Experiments

To verify the effectiveness of the proposed bi-level model for CAV-dedicated lane deployment, a series of numerical experiments was conducted on the Sioux Falls network. This section first introduces the experimental setup and parameter configuration, then presents the optimal deployment strategies under different conditions. Finally, sensitivity analyses examine the effects of MPR, budget constraints, and equity considerations on network performance.

5.1. Experimental Setup and Parameters

The Sioux Falls network consists of 24 nodes, 76 links (3 lanes per link), and 528 OD pairs. The original network is expanded into a new network that includes regular links and CAV-dedicated candidate links. Basic parameters are set as follows:
(1) Parameters of BPR function are typically set as α = 0.15 , β = 4 . (2) Parameters of mixed-traffic flow are set as k 2 = 4 , γ = 0.6 , γ 1 = 0.9 , γ 2 = 1.4 . (3) Unit fuel cost is χ H V = $ 0.056 / km , and χ C A V = $ 0.050 / km as autonomous driving technology makes CAV travel more fuel-efficient [28]. (4) A total of 40% VOT saving is assumed for CAV users [35]. Let V O T H V = $ 11.20 / hr , and V O T C A V = $ 6.72 / hr . (5) Unit deployment cost of CAV-dedicated lane is d = $ 1.2 × 10 5 / km . All computations were executed in Python 3.7 using the CPLEX 12.6 solver on a personal computer with an Intel(R) Core (TM) i7 CPU @ 3.40 GHz and 12 GB RAM.

5.2. Optimal Deployment Strategy

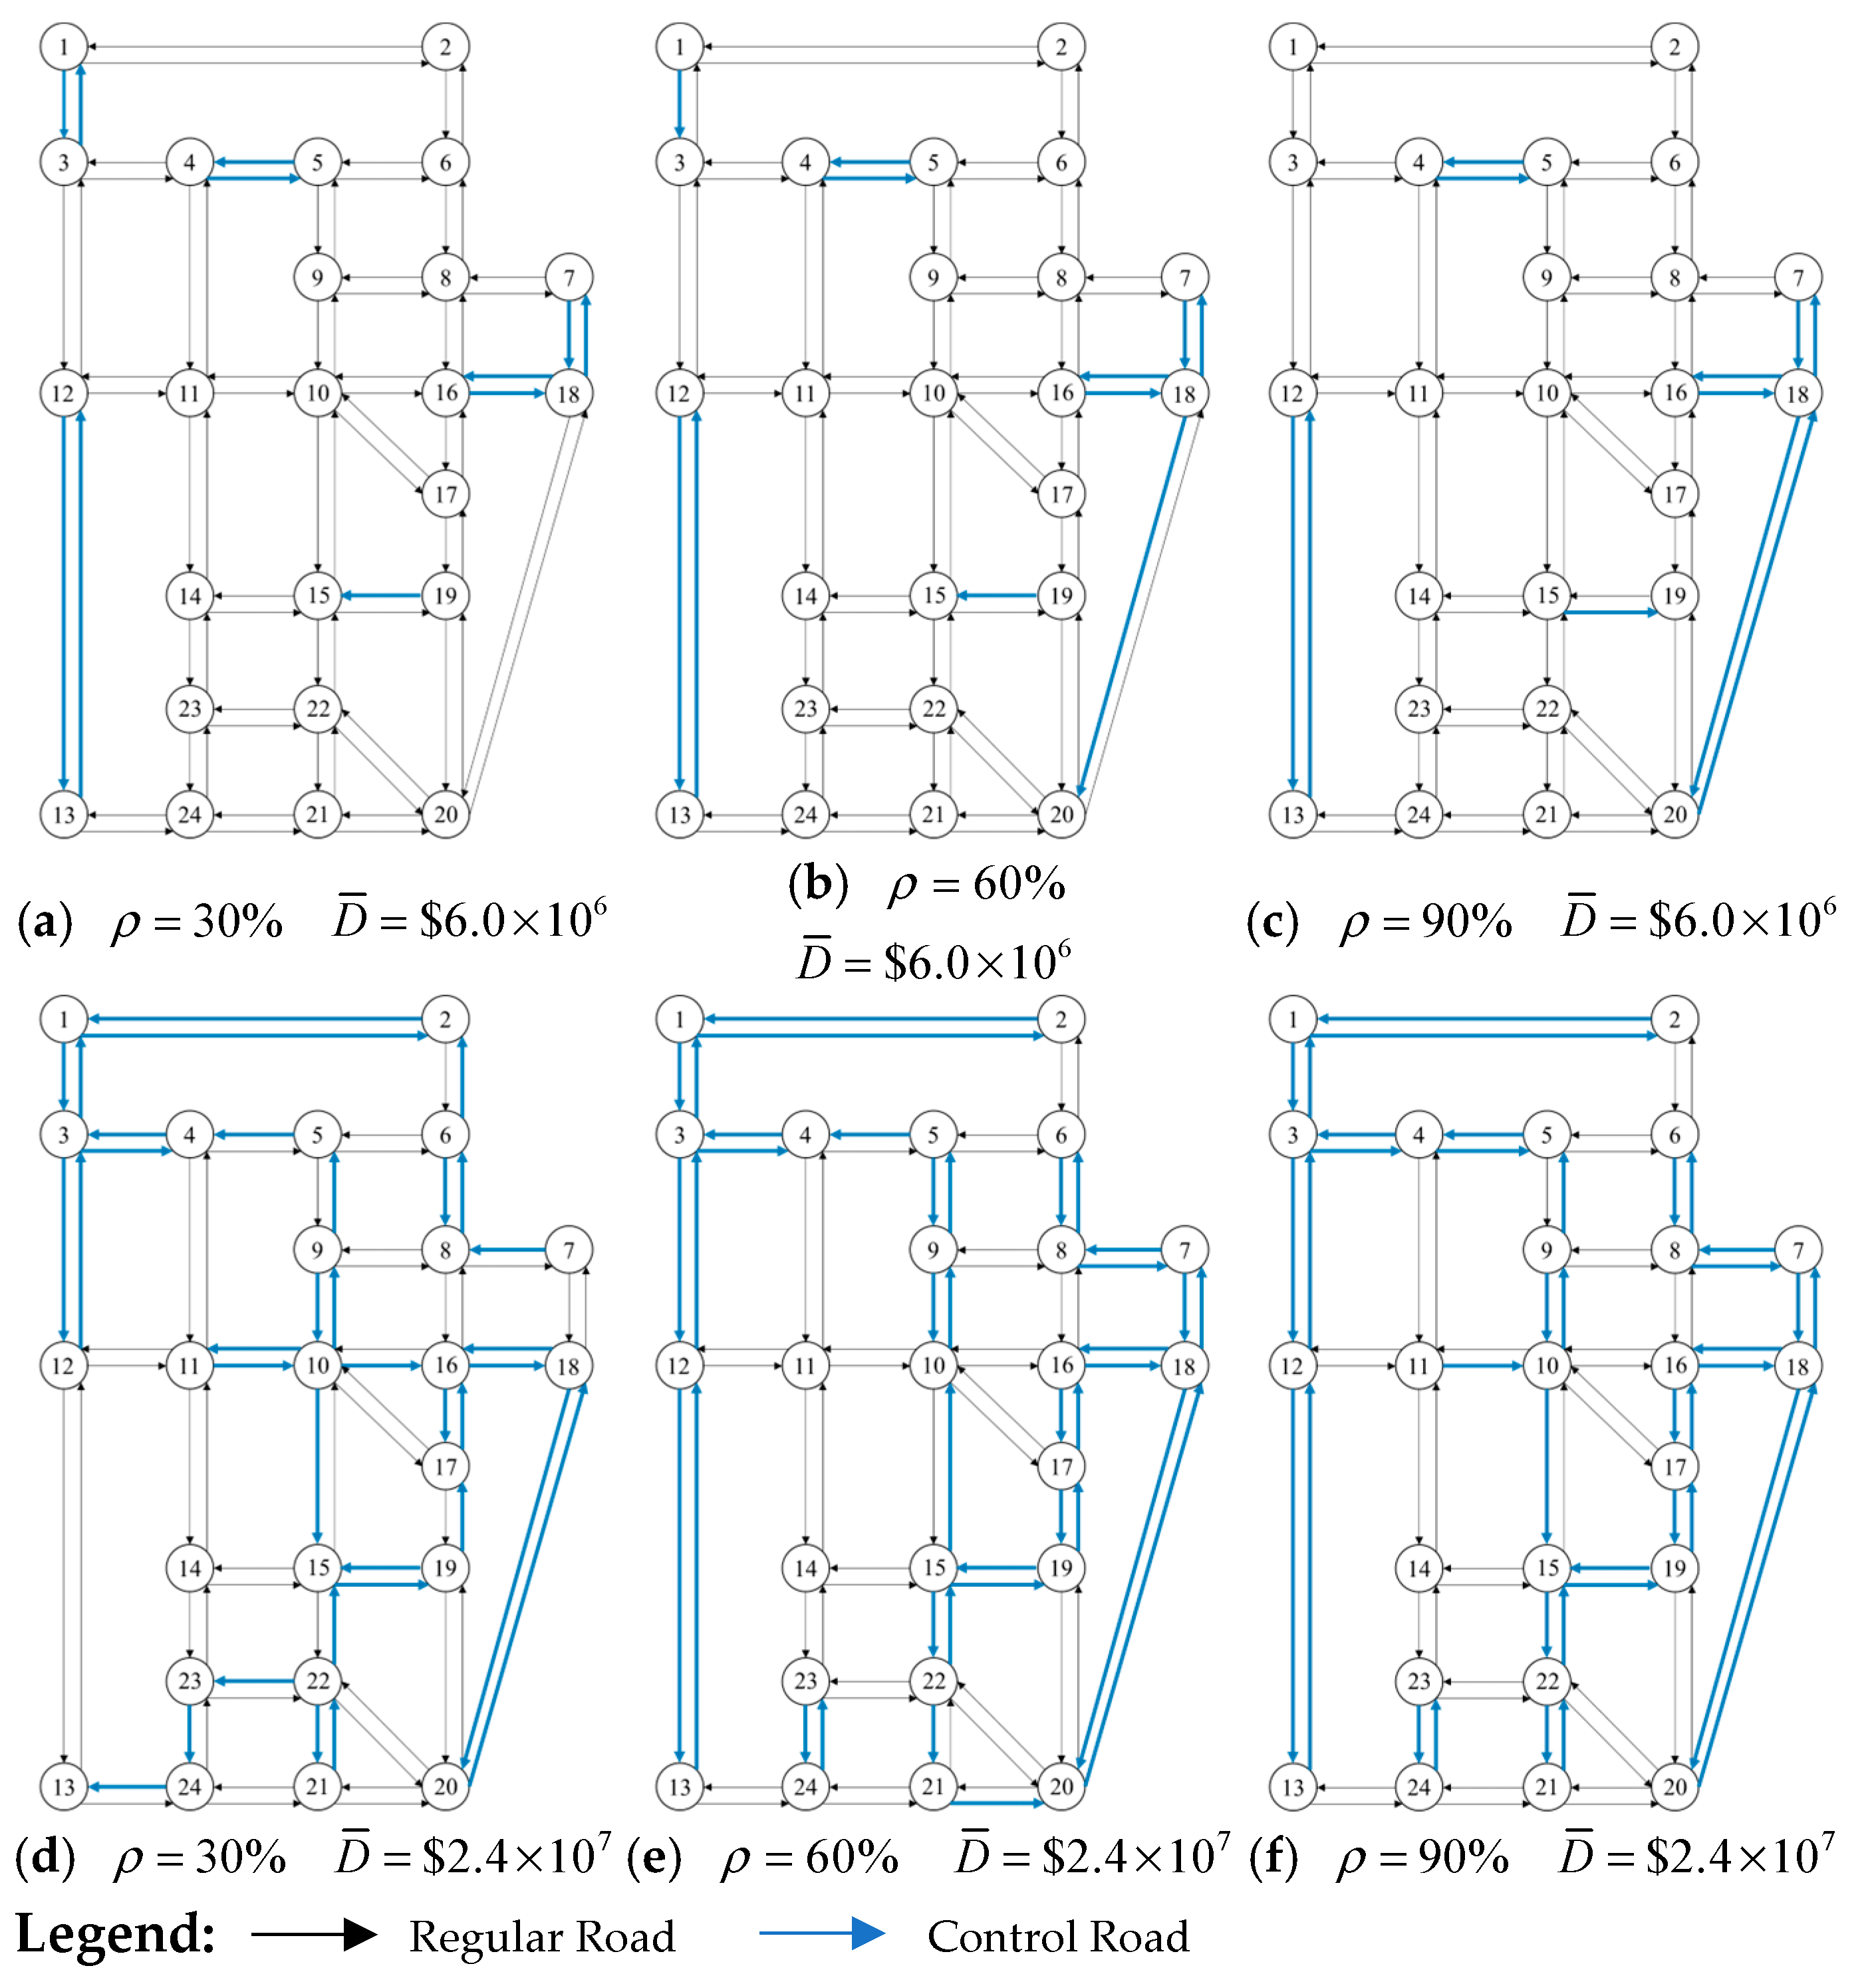
To evaluate the effectiveness of the proposed design framework, six cases are examined. Across three MPR levels—low, medium, and high (also referred to as planning period), the optimal CAV-dedicated lane strategies under different budget constraints are illustrated in Figure 6. It is worth mentioning that the constraint λ = 1.6 is set to present an accepted equity threshold in this research. A detailed analysis of each case is presented in the rest of this section.
Under a certain budget constraint, the spatial distribution of CAV-dedicated lane deployment exhibits distinct patterns across varying MPR levels. At low MPR level, deployment is concentrated on short-to-medium distance links, aiming to generate immediate and area-specific benefits from limited CAV travel. As the MPR increases, the optimal strategy gradually shifts toward long-distance corridors, which facilitates efficient long-distance trips, and enhances system capacity. For example, short CAV-dedicated links such as (1, 3) and (3, 1), illustrated in Figure 6a, are progressively replaced by longer-distance links such as (18, 20) and (20, 18) in Figure 6b,c.
Table 1 further summarizes the network performance and travel costs of the base scenario (without CAV-dedicated lanes and MPR = 0%) and the above six cases Figure 6a–f. In the base case, the network capacity is at its lowest (778, 787 veh/h). By establishing dedicated CAV lanes and increasing MPR, the reserve capacity improves substantially, reaching up to approximately 36% higher than the baseline. This demonstrates that both infrastructure deployment and technology adoption jointly contribute to enhancing the traffic-carrying capability.
The comparison of travel cost reveals several notable patterns. Relative to the base case, the introduction of CAV-dedicated lanes consistently lowers the system-wide travel cost, declining from 1.102 $/trip to as low as 0.798 $/trip in case (c), representing a reduction of nearly 28%. CAV users benefit significantly from dedicated lanes. Their average travel costs decline markedly, reaching the minimum of 0.679 $/trip in case (b), which is about 38% lower than the base case. This demonstrates that dedicated lanes effectively exploit the operational advantages of CAVs, such as smoother car-following and reduced delays. In contrast, HV users experience cost increases in all deployment scenarios. Their average travel costs exceed the base value (1.102 $/trip), peaking at 1.412 $/trip in case (c). This pattern reflects the capacity loss imposed on HVs when lanes are allocated exclusively to CAVs, thereby raising concerns of social inequity, which are further discussed in Section 5.3.2.
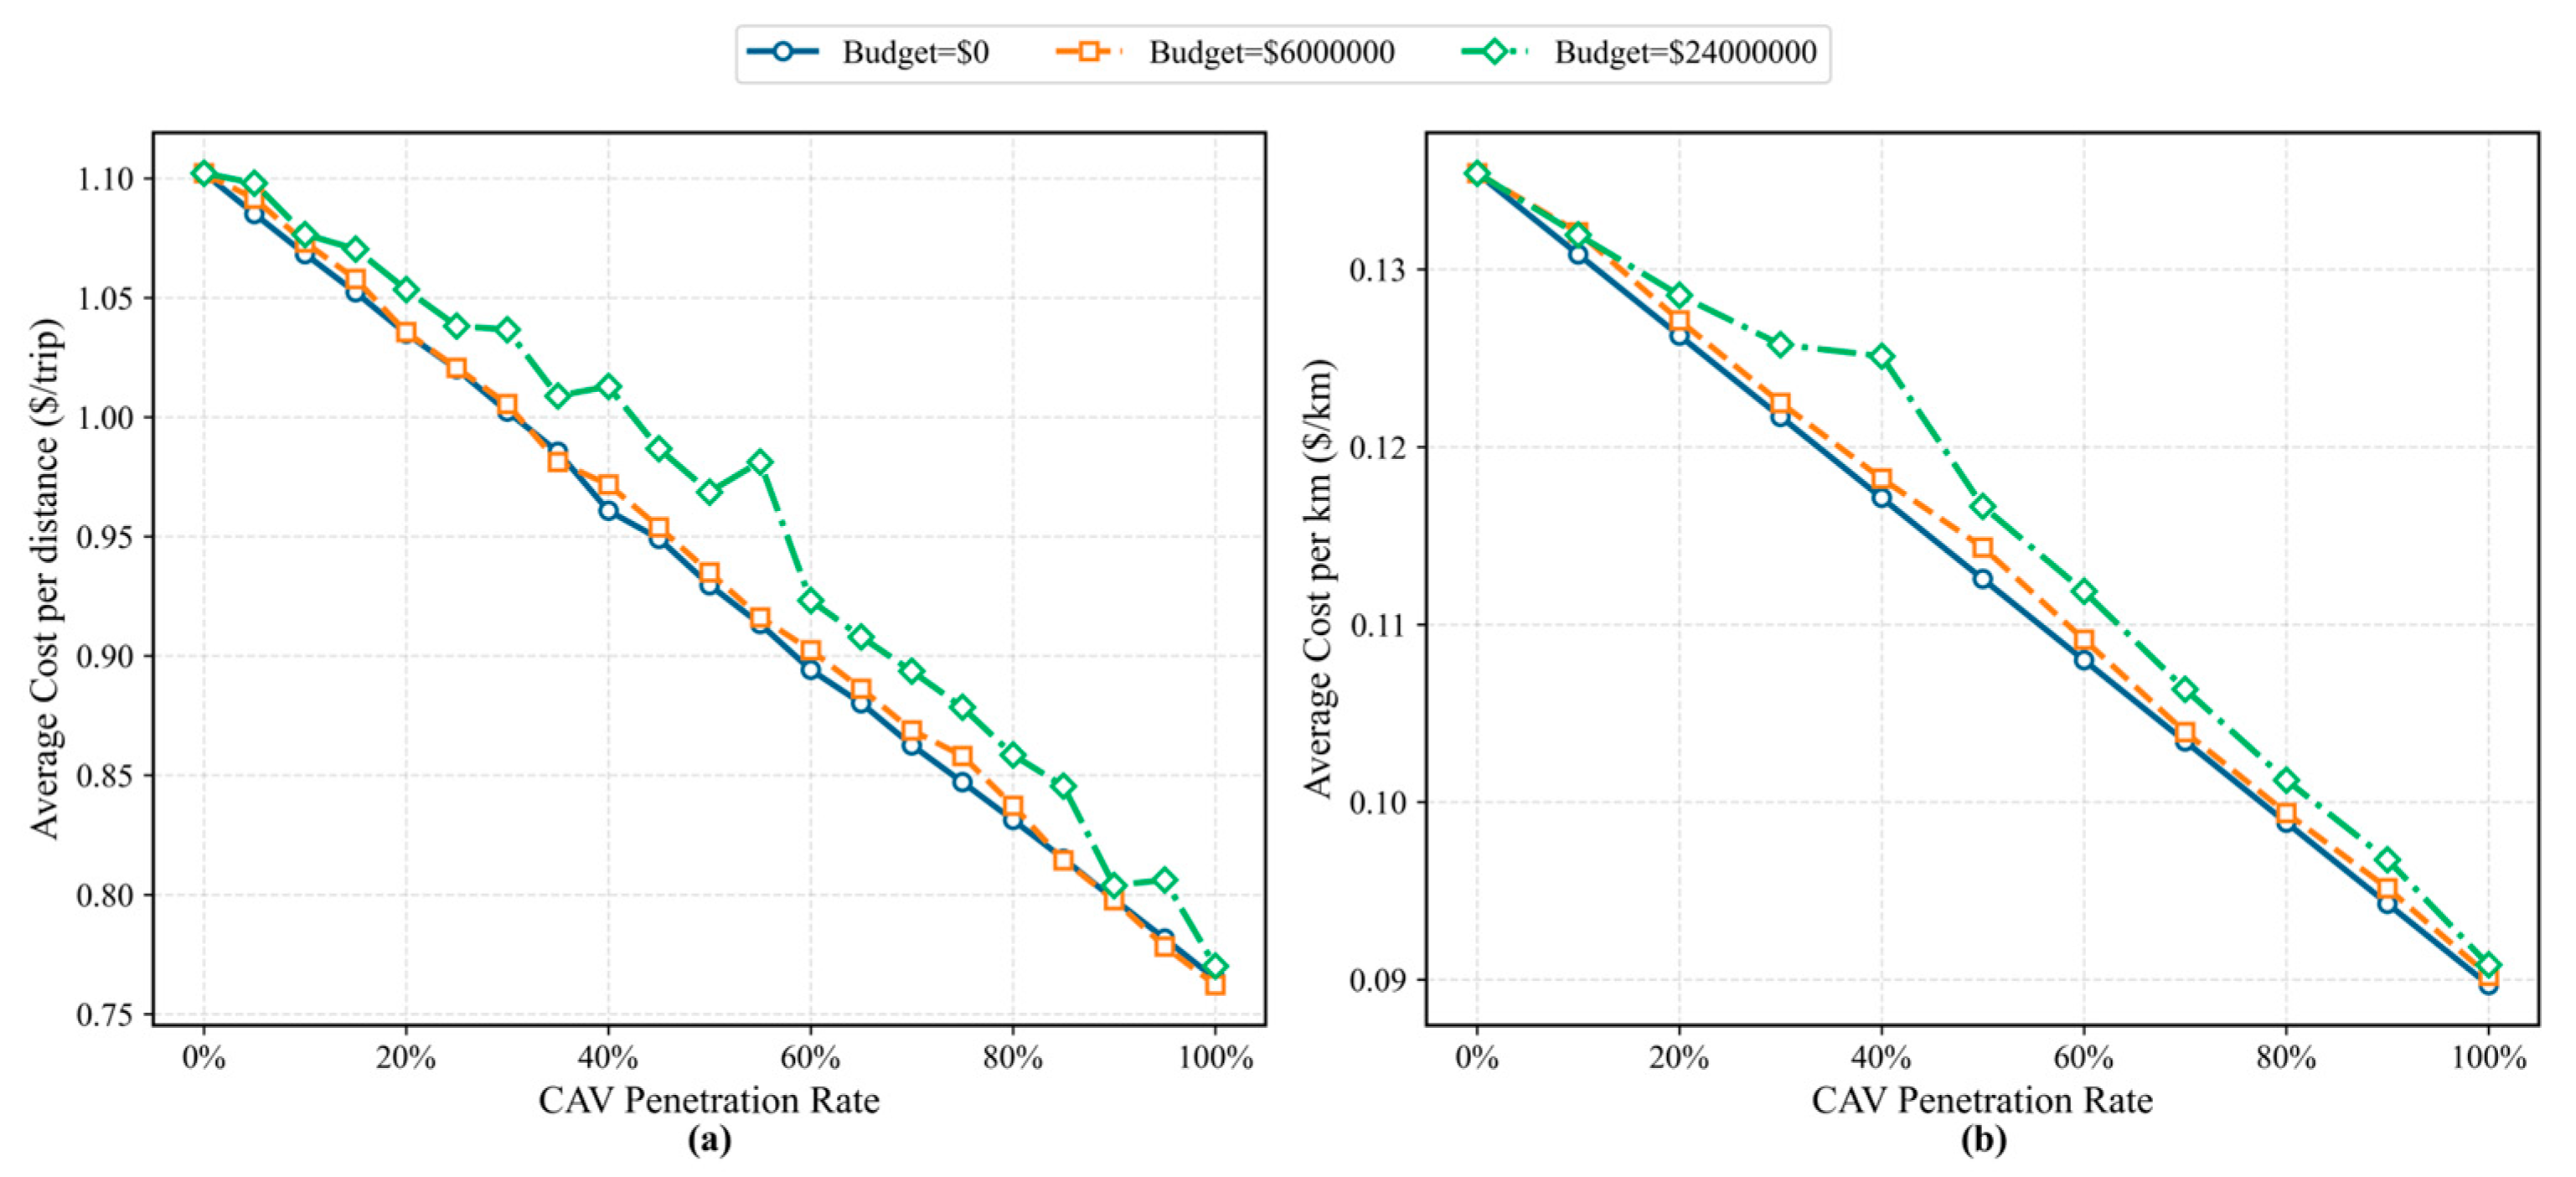
Figure 7 illustrates how travel costs vary with CAV penetration and lane-deployment budgets. As the MPR increases, both the average trip cost (in Figure 7a) and the distance-normalized cost (in Figure 7b) decline consistently, confirming the efficiency gains brought by automation and cooperative driving. When larger budgets are introduced, the curves exhibit slightly higher values at certain penetration levels. This shift does not imply reduced efficiency; rather, it reflects the secondary effect of increased network utilization—as dedicated lanes enhance overall capacity, the system accommodates more trip throughput, leading to a mild redistribution of flow and localized congestion. From a system-wide perspective, the influence of dedicated lane remains decisively positive.

5.3. Sensitivity Analysis

To evaluate the robustness of the proposed model and assess the impacts of applied constraints, a sensitivity analysis is conducted, through which policy implications for CAV-dedicated lanes planning during different planning periods can also be derived.

5.3.1. Impact of Budget Constraint

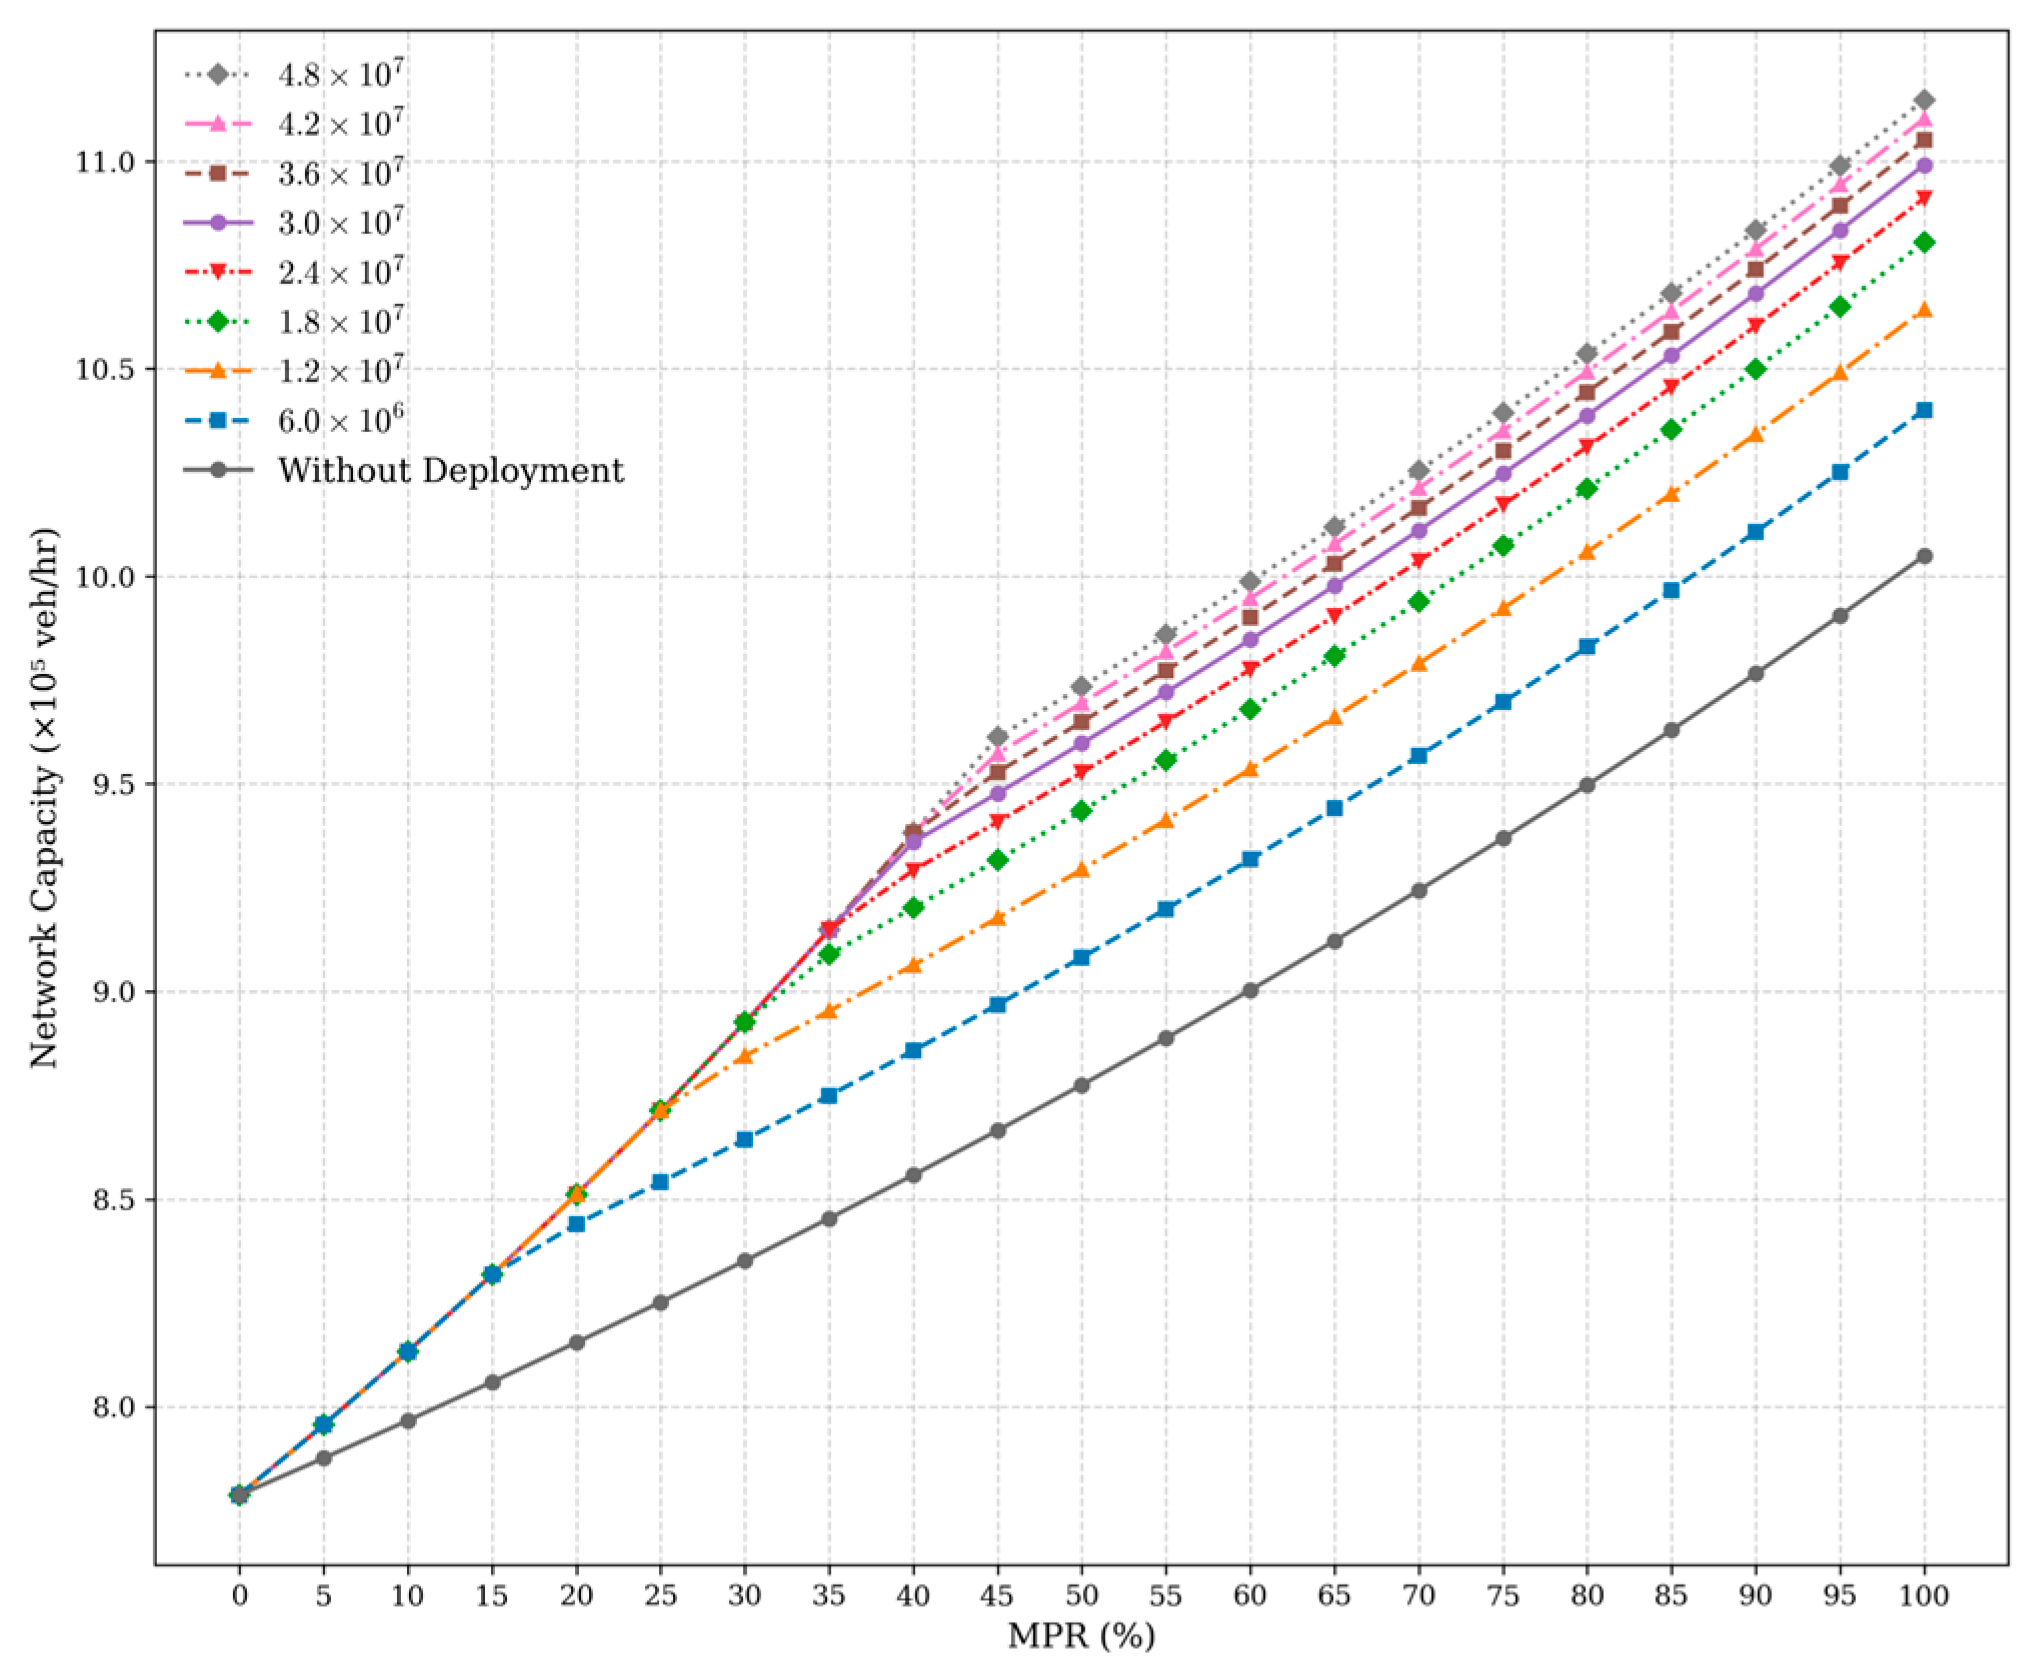
Figure 8 shows the overall trend of network reserve capacity under different economic bounds and MPR levels. Network capacity rises sharply with increasing budgets at low MPRs, then gradually plateaus, indicating diminishing aggregate efficiency gains as investment scales up. Higher MPRs shift this inflection point rightward, suggesting that greater automation levels can sustain effective capacity growth over larger investment ranges.
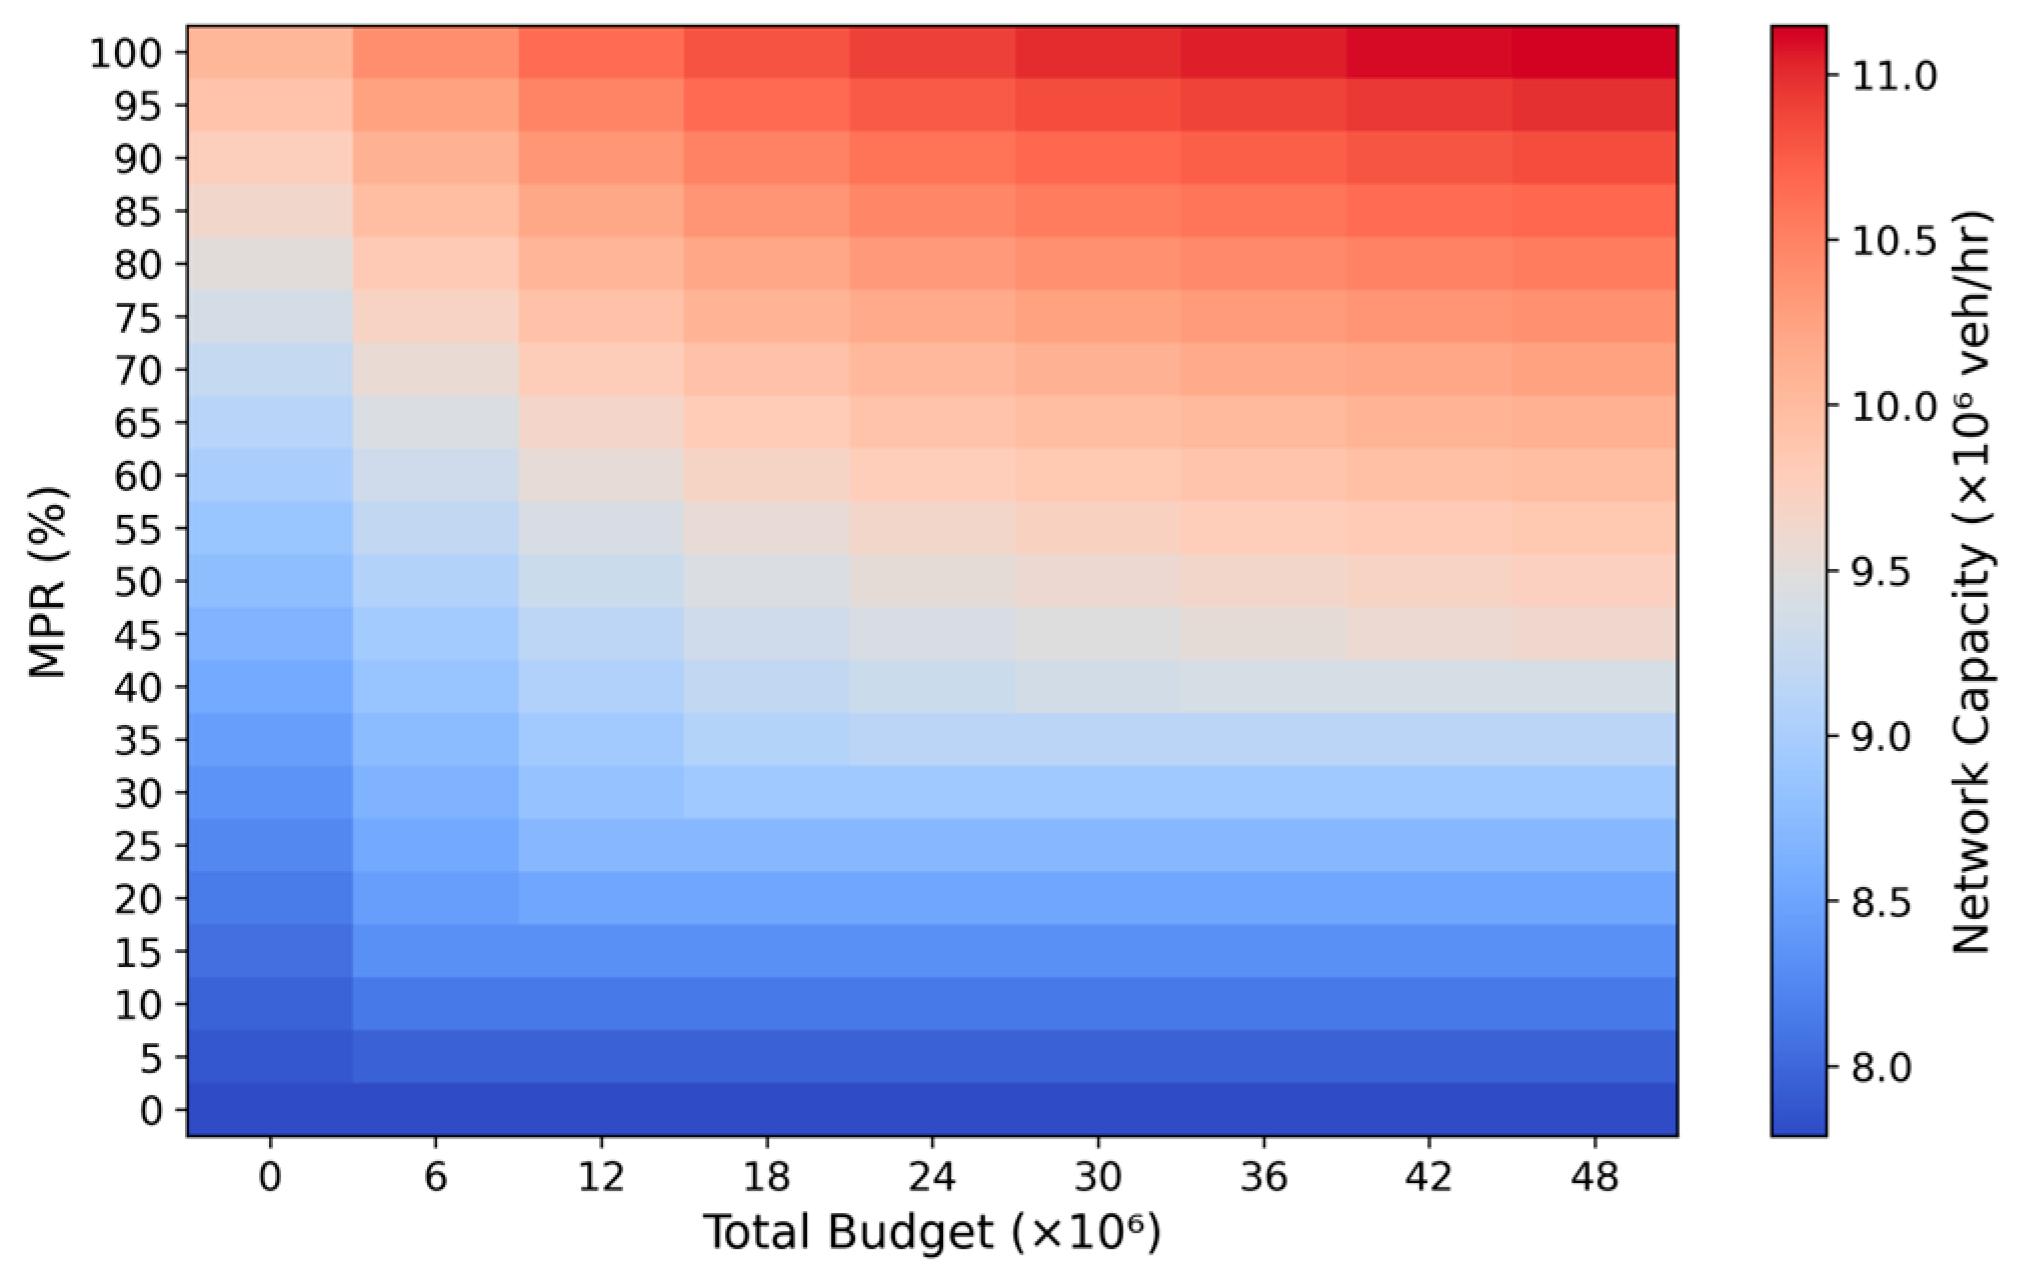
Moreover, the heatmap in Figure 9 provides a system-wide perspective, revealing three distinct regimes. At low MPRs (<20%), network capacity remains uniformly low regardless of budget, indicating negligible marginal returns without sufficient CAV adoption. In the intermediate range (20–50%), capacity becomes increasingly responsive to budget allocation, highlighting the synergistic reinforcement between CAV adoption and dedicated-lane investment. At high MPRs (>50%), capacity rises almost linearly with budget, suggesting that high adoption and adequate infrastructure are jointly required to unlock the network’s full potential.
To further quantify the diminishing-returns effect observed in Figure 8 and Figure 9, a marginal-benefit experiment was conducted. The experiment evaluates a series of deployment scenarios under various budget levels B k (from $ 6.0 × 10 6 to $ 4.8 × 10 7 ). For each budget level, the optimization model yields a corresponding network reserve capacity R C k . The marginal capacity gain Δ R C k is computed as follows:
Δ R C k = R C k R C k 1 , k = 1 , 2 , K
Figure 10 plots the marginal reserve-capacity gain Δ R C k for representative MPRs. The curves confirm that marginal benefits decline as budget increases, but the rate of decay depends on penetration. Under low MPRs (≤20%), marginal gains quickly approach zero, implying limited value from aggressive deployment when automation is scarce. When high MPR level (≥50%) is achieved, marginal gains persist over a wider budget range and decay more slowly, indicating that dedicated lanes become cost-effective only after CAV adoption exceeds a sufficient scale. Taken together, Figure 8, Figure 9 and Figure 10 define the “diminishing-returns region” and provide quantitative guidance for cost-effective lane-deployment strategies.
From a planning perspective, the results indicate that the deployment of CAV-dedicated lanes should be strategically synchronized with the prevailing MPR level to maximize overall efficiency. Investment resources should be prioritized in regimes where marginal returns are highest, thereby avoiding overinvestment that delivers limited capacity gains. Achieving coordinated growth in both CAV adoption and dedicated lane deployment is essential for harnessing their synergistic effects and realizing the greatest network-wide benefits.

5.3.2. Impact of Equity Constraints

To analysis the effectiveness of equity constraints in addressing social equity when planning CAV-dedicated lanes, the inequity level I L m is calculated by Equation (48):
I L m = r R s S u r s , H V / r R s S u r s , C A V , m = 5 % , 10 % , 95 %
We compare the value of I L m between the equity-constraint case ( λ = 1.2 ) and the “without equity constraint” case, defining the relative inequity level Δ I L m as follows:
Δ I L m = I L e q u i t y m I L n o e q u i t y m , m = 5 % , 10 % , 95 %
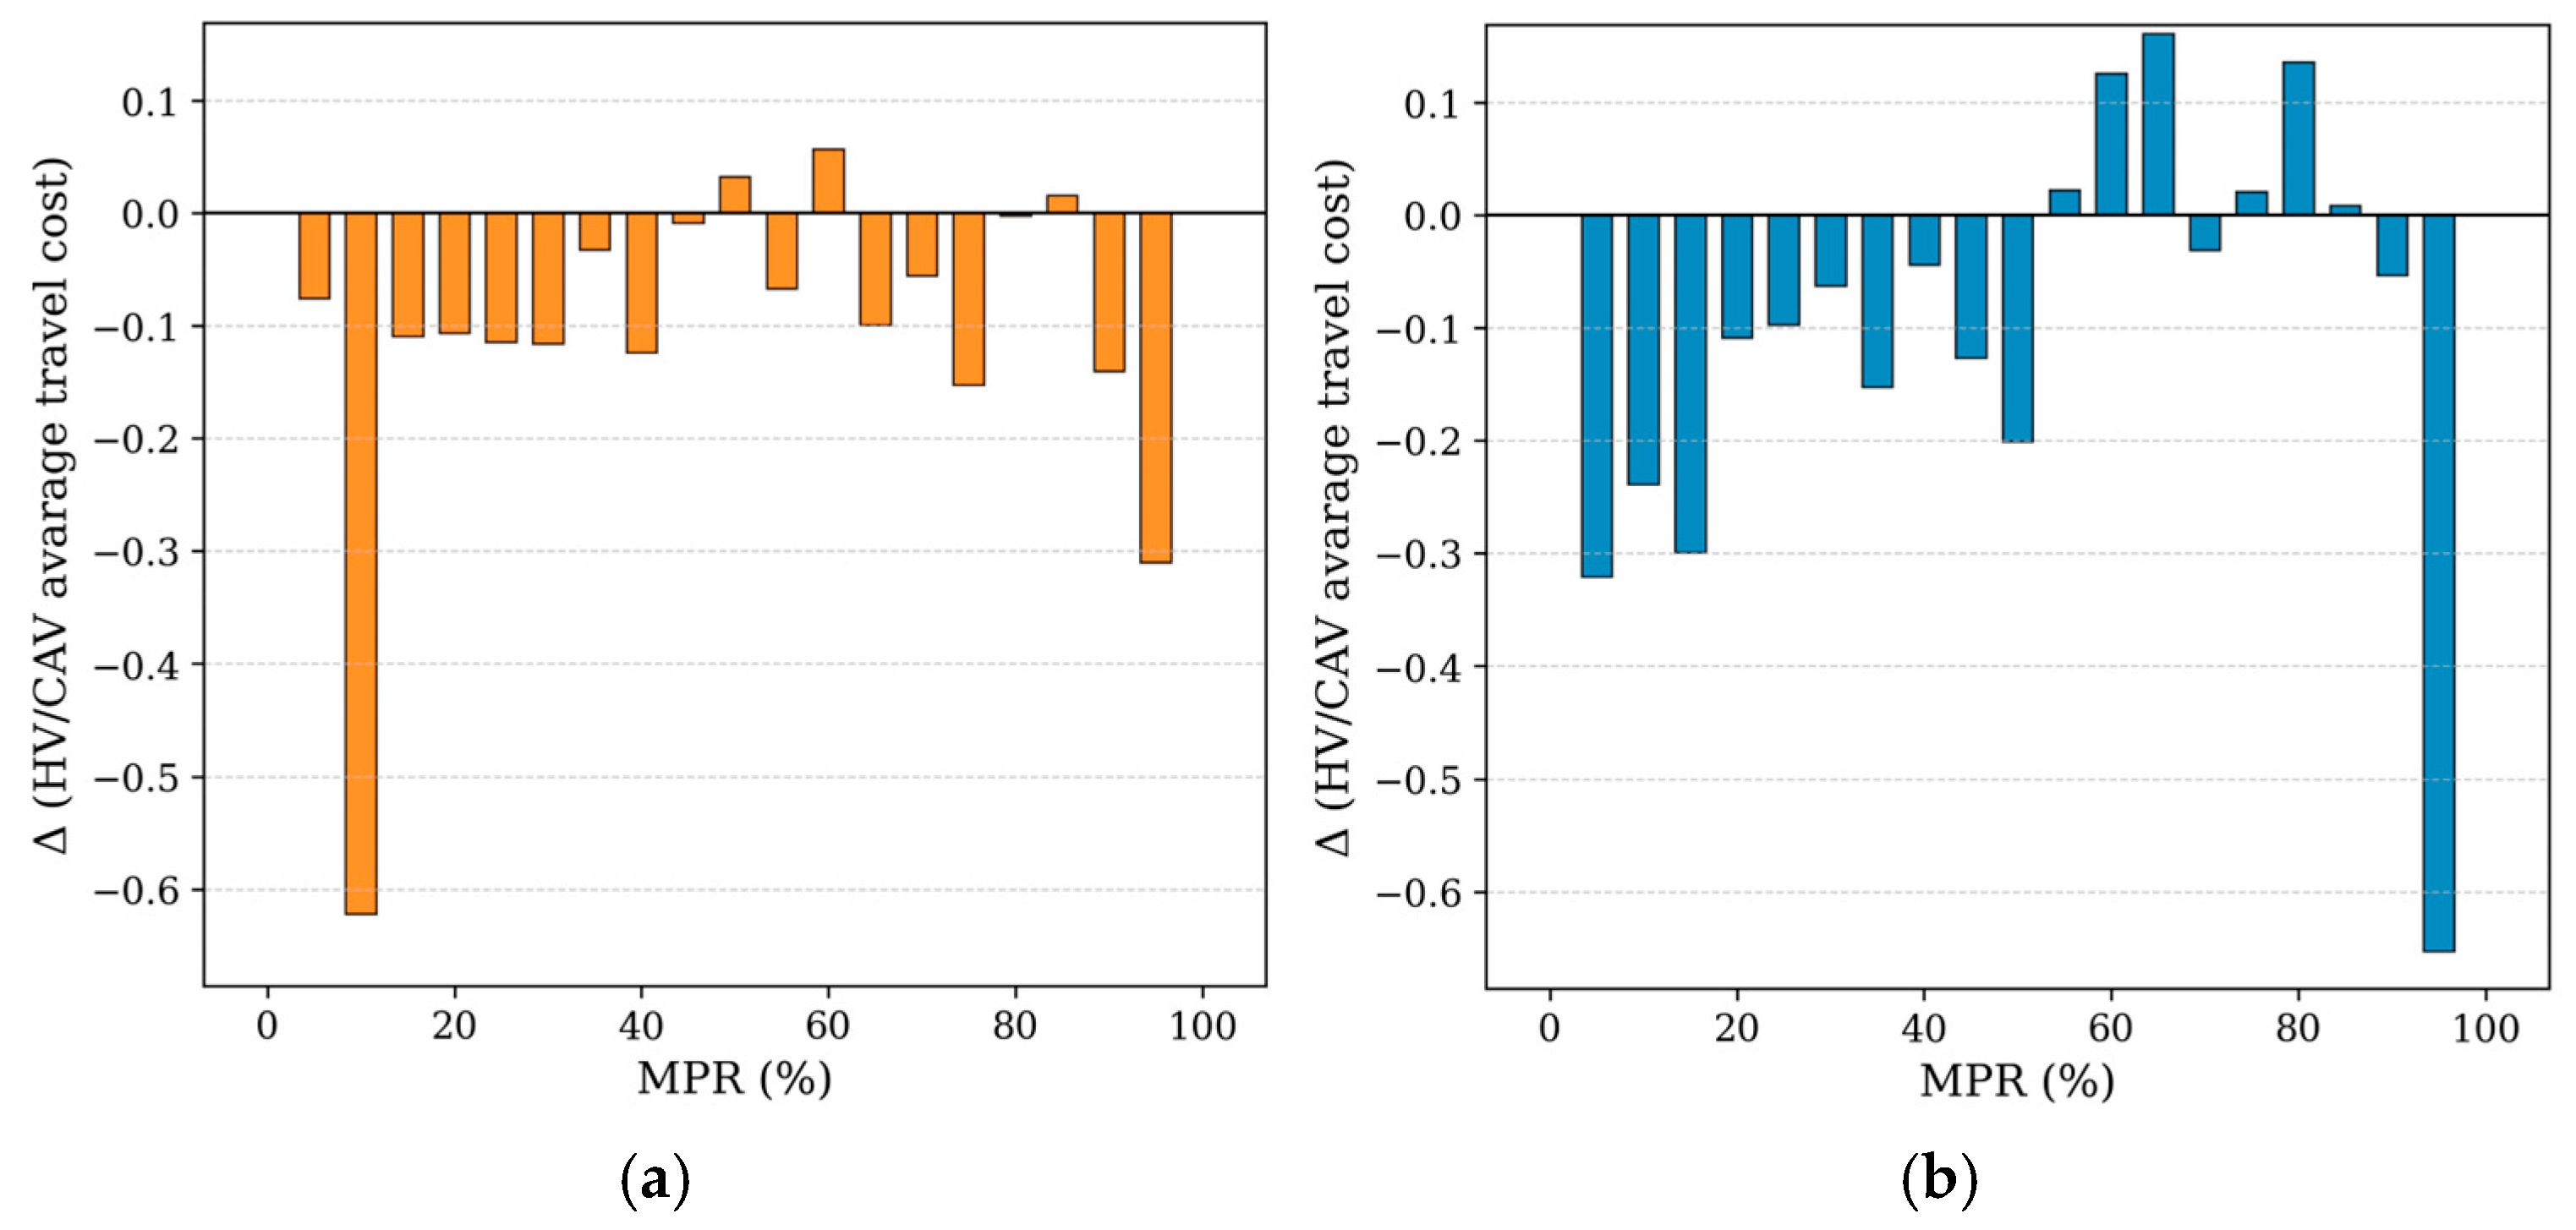
As illustrated in Figure 11, implementing equity constraints consistently reduces the ratio of HV to CAV travel costs across most MPR levels, with the largest reduction exceeding 0.6, demonstrating a substantial mitigation of social inequity.
However, small residual disparities (≈0.1) remain at certain MPR levels, suggesting that although equity constraints markedly enhance fairness, they cannot fully eliminate cost differences under all conditions. This unexpected outcome can be attributed to several factors. First, as shown in Equation (25), equity constraints are applied to each OD pair. At intermediate MPR levels, the efficiency gap between CAVs and HVs is most pronounced. To satisfy the requirements for all OD pairs, the model may compromise efficiency on some OD pairs, leading to a slight reduction in total average HV’s travel cost. Second, under limited budgets, enforcing equity constraints may allocate resources across less efficient corridors, slightly increasing travel costs for certain user groups. Nevertheless, despite these issues, the imposition of equity constraints ensures a more balanced treatment across OD pairs. From a system-wide perspective, the disadvantages experienced by HV users incurred by the introduction of CAVs and dedicated lanes are also substantially alleviated.
These findings highlight the inherent trade-off between efficiency and fairness in CAV-dedicated lane deployment. From a planning perspective, incorporating moderate equity constraints is essential for balancing these competing objectives. Such constraints can help secure social acceptance and mitigate potential inequities, while coordinated budget allocation and infrastructure deployment strategies remain critical for maximizing overall system efficiency. Together, these insights provide a policy basis for developing socially sustainable deployment strategies for CAV-dedicated lanes.

6. Conclusions

This study proposes a bi-level optimization framework to evaluate network performance in mixed HV–CAV traffic and determine optimal deployment strategies for CAV-dedicated lanes under MPR, budget, and equity constraints. The framework integrates reserve-capacity maximization at the upper level with UE traffic assignment at the lower level and is linearized by using the PLA technique. Numerical experiments on the Sioux Falls network demonstrate that the proposed approach can enhance overall network capacity by up to 36% relative to the baseline, while revealing the trade-offs among efficiency, equity, and budget allocation.
Key findings are threefold. First, at low MPR (<30%), limited but well-targeted deployment already improves effective capacity and lowers average cost, indicating a favorable policy window with high marginal returns per unit budget. Second, at intermediate MPR (30–50%), the system operates in a sensitivity regime: small adjustments in lane allocation and budget jointly trigger pronounced changes in capacity and cost, reflecting the emergent network connectivity benefits for CAV flows. Third, at high MPR (>50%), returns become approximately linear with budget bounds—the network can accommodate additional flow; yet, part of the expected efficiency gain is offset as higher throughput increases congestion exposure.
Regarding distributional outcomes, imposing an explicit equity constraint consistently reduces the HV–CAV average-cost ratio across most MPR levels, substantially alleviating disparities. Residual differences persist at certain MPR ranges because satisfying pairwise OD equity may require reallocating resources toward less efficient corridors, producing mild local trade-offs. Even so, the constraint ensures a more balanced treatment across OD pairs and protects HV users from disproportionate burdens.
From a planning perspective, the deployment of CAV-dedicated lanes should be strategically synchronized with the prevailing MPR level to maximize efficiency. Investment resources are best prioritized where marginal returns are highest, thereby avoiding overinvestment that yields limited capacity improvements. Coordinated growth in both CAV adoption and dedicated lane deployment is essential for exploiting synergistic effects and realizing the greatest network-wide benefits. Across all regimes, embedding equity constraints is advisable to guard against distributional harms without materially compromising efficiency.
Despite its encouraging results, this study has several limitations that suggest directions for future enhancement:
(i) The current framework simplifies vehicle interactions and flow dynamics to maintain tractability, which may overlook heterogeneous driving behavior, microscopic processes such as lane changing or merging, and temporal variations across different periods of the day. Extending the model to incorporate these operational details would improve its behavioral realism and predictive reliability.
(ii) Equity in this study is evaluated only at the system level between HV and CAV users. Other fairness dimensions, such as income heterogeneity, OD-specific accessibility, or spatial equity, remain to be explored. Introducing income-weighted indicators or group-specific fairness constraints could offer a more comprehensive assessment of social acceptability.
(iii) Future research may also integrate stochastic demand, signal-control effects, and dynamically evolving capacity to better capture real-world variability, thereby supporting more robust and practically implementable CAV-lane-deployment strategies.

Author Contributions

Conceptualization: W.L. and W.W.; methodology, W.L. and K.J.; validation: W.L. and K.J.; formal analysis, W.W. and K.J.; investigation, K.J.; resources, W.L. and W.W.; data curation, K.J.; writing—original draft preparation, W.L.; writing—review and editing, W.W.; visualization, K.J.; supervision, W.W.; project administration, W.L.; funding acquisition, W.W. All authors have read and agreed to the published version of the manuscript.

Funding

This research was funded by the Jiangsu Postgraduate Research Innovation Program (KYCX24_0457), Jiangsu Funding Program for Excellent Postdoctoral Talent under Grant Number 2025ZB754, and the National Natural Science Foundation of China (52432010).

Data Availability Statement

The original contributions presented in this study are included in the article. Further inquiries can be directed to the corresponding author.

Conflicts of Interest

The authors declare no conflicts of interest. The funders had no role in the design of the study; in the collection, analyses, or interpretation of data; in the writing of the manuscript; or in the decision to publish the results.

Abbreviations

The following abbreviations are used in this manuscript:
HVHuman-driven Vehicle
CAVConnected Autonomous Vehicle
ODOrigin–Destination
VOTValue of Time
UEUser Equilibrium
MPRCAV Market Penetration Rate
MINLPMixed-Integer Nonlinear Programming
MILPMixed-Integer Linear Programming
PLAPiecewise Linear Approximation

Appendix A

The notations used in the following sections are defined below.
Table A1. Notations.
Sets:
A 0 Set of regular links, a 0 A 0
A ˜ Set of CAV-dedicated candidate links, a ˜ A ˜
A Set of all links, A = A 0 A ˜ , a A
NSet of road nodes, n N
RSet of origin zones, r R
SSet of destination zones, s S
MSet of travel modes, M = [human-driven vehicle (HV), connected autonomous vehicle (CAV)],
K r s Set of paths between OD pair (r, s), k K r s
Parameters:
a ˜ The parallel link of regular link a 0
C a 0 Lane capacity of link a with pure HV flow (veh/h)
C a Lane capacity of link a in a mixed HVs and CAVs environment (veh/h)
L a Length of link a (km)
N u m a Number of lanes on link a
t a 0 Free-flow travel time of link a (km/h)
χ m Fuel cost of vehicle per unit kilometer ($/km)
V O T m Value of travel time for mode m users ($/h)
d Unit construction cost of CAV-dedicated lane in per kilometer ($/km)
D ¯ Maximum budget for total CAV-dedicated lane construction cost
λ Equity degree of impacts on HV users under the deployment of CAV-dedicated lanes
ρ Market share of CAV in the network
H 0 Spacing between an HV and another HV
γ Spacing coefficient between a CAV and another CAV in the platoon
γ 1 Spacing coefficient for a CAV platoon following an HV
γ 2 Spacing coefficient for an HV following a CAV platoon
k 1 Number of HVs between two CAV platoons
k 2 CAV platoon size (the number of CAVs per platoon)
U A sufficiently large number
Variables:
h a A continuous variable h a indicating the toll of driving on CAV-dedicated link for HVs per unit kilometer ($/km)
H ¯ Average vehicle headway
y a A binary decision variable y a indicating link a is deployed with CAV-dedicated lane, and 0 otherwise, a A 0
ψ k r s , m An auxiliary binary variable ψ k r s , m = 1 indicating path k K r s takes flow, and 0 otherwise
δ a , k r s A binary decision variable δ a , k r s = 1 indicating path k K r s uses link a , and 0 otherwise
ρ a CAV proportion in the traffic flow of link a
q m r s Travel demand of mode m between OD pair (r, s)
q r s Total travel demand between OD pair (r, s), q r s = m M q m r s
c k r s , m Travel cost on path k of mode m between OD pair (r, s)
u r s , m The shortest travel cost of mode m between OD pair (r, s)
f k r s , m Flow of mode m on path k between OD pair (r, s)
v a Total flow on link a
v a m Flow of mode m on link a
t a ( v a ) Travel time on link a

References

  1. Arman, M.A.; Tampère, C.M. Lane-level trajectory reconstruction based on data-fusion. Transp. Res. Part C Emerg. Technol. 2022, 145, 103906. [Google Scholar] [CrossRef]
  2. Wang, J.; Peeta, S.; He, X. Multiclass traffic assignment model for mixed traffic flow of human-driven vehicles and connected and autonomous vehicles. Transp. Res. Part B Methodol. 2019, 126, 139–168. [Google Scholar] [CrossRef]
  3. Fan, B.; Su, Z.; Chen, Y.; Wu, Y.; Xu, C.; Quek, T.Q.S. Ubiquitous control over heterogeneous vehicles: A digital twin empowered edge AI approach. IEEE Wirel. Commun. 2022, 30, 166–173. [Google Scholar] [CrossRef]
  4. Chen, B.; Chen, Y.; Wu, Y.; Xiu, Y.; Fu, X.; Zhang, K. The Effects of Autonomous Vehicles on Traffic Efficiency and Energy Consumption. Systems 2023, 11, 347. [Google Scholar] [CrossRef]
  5. Wang, S.; Li, Z.; Levin, M.W. Optimal policy for integrating Autonomous Vehicles into the auto market. Transp. Res. Part C Emerg. Technol. 2022, 143, 103821. [Google Scholar] [CrossRef]
  6. Wang, J.; Lu, L.; Peeta, S.; He, Z. Optimal toll design problems under mixed traffic flow of human-driven vehicles and connected and autonomous vehicles. Transp. Res. Part C Emerg. Technol. 2021, 125, 102952. [Google Scholar] [CrossRef]
  7. Jia, Y.; Qu, D.; Song, H.; Wang, T.; Zhao, Z. Car-following characteristics and model of connected autonomous vehicles based on safe potential field. Phys. A Stat. Mech. Its Appl. 2022, 586, 126502. [Google Scholar] [CrossRef]
  8. Levin, M.W.; Boyles, S.D. A multiclass cell transmission model for shared human and autonomous vehicle roads. Transp. Res. Part C Emerg. Technol. 2016, 62, 103–116. [Google Scholar] [CrossRef]
  9. Xiong, B.-K.; Jiang, R.; Li, X. Managing merging from a CAV lane to a human-driven vehicle lane considering the uncertainty of human driving. Transp. Res. Part C Emerg. Technol. 2022, 142, 103775. [Google Scholar] [CrossRef]
  10. Wang, J.; Cai, Z.; Chen, Y.; Yang, P.; Chen, B. An advanced control strategy for connected autonomous vehicles based on Micro simulation models at multiple intersections. Phys. A Stat. Mech. Its Appl. 2023, 623, 128836. [Google Scholar] [CrossRef]
  11. Mohajerpoor, R.; Ramezani, M. Mixed flow of autonomous and human-driven vehicles: Analytical headway modeling and optimal lane management. Transp. Res. Part C Emerg. Technol. 2019, 109, 194–210. [Google Scholar] [CrossRef]
  12. Jiang, Y.; Sun, S.; Zhu, F.; Wu, Y.; Yao, Z. A mixed capacity analysis and lane management model considering platoon size and intensity of CAVs. Phys. A Stat. Mech. Its Appl. 2023, 615, 128557. [Google Scholar] [CrossRef]
  13. Rosca, M.A.; Oprea, F.C.; Dragu, V.; Dinu, O.M.; Costea, I.; Burciu, S. Evaluating the Impact of Automated Vehicle Penetration on Intersection Traffic Flow: A Microsimulation-Based Approach. Systems 2025, 13, 751. [Google Scholar] [CrossRef]
  14. Liu, Z.; Wang, Z.; Cheng, Q.; Yin, R.; Wang, M. Estimation of urban network capacity with second-best constraints for multimodal transport systems. Transp. Res. Part B Methodol. 2021, 152, 276–294. [Google Scholar] [CrossRef]
  15. Xu, X.; Chen, A.; Jansuwan, S.; Yang, C.; Ryu, S. Transportation network redundancy: Complementary measures and computational methods. Transp. Res. Part B Methodol. 2018, 114, 68–85. [Google Scholar] [CrossRef]
  16. Zhou, W.; Weng, J.; Li, T.; Fan, B.; Bian, Y. Modeling the road network capacity in a mixed HV and CAV environment. Phys. A Stat. Mech. Its Appl. 2024, 636, 129526. [Google Scholar] [CrossRef]
  17. Rad, S.R.; Farah, H.; Taale, H.; van Arem, B.; Hoogendoorn, S.P. Design and operation of dedicated lanes for connected and automated vehicles on motorways: A conceptual framework and research agenda. Transp. Res. Part C Emerg. Technol. 2020, 117, 102664. [Google Scholar]
  18. Lee, S.; Oh, C.; Hong, S. Exploring lane change safety issues for manually driven vehicles in vehicle platooning environments. IET Intell. Transp. Syst. 2018, 12, 1142–1147. [Google Scholar] [CrossRef]
  19. Van Arem, B.; Van Driel, C.J.; Visser, R. The impact of cooperative adaptive cruise control on traffic-flow characteristics. IEEE Trans. Intell. Transp. Syst. 2006, 7, 429–436. [Google Scholar] [CrossRef]
  20. Laan, Z.V.; Sadabadi, K.F. Operational performance of a congested corridor with lanes dedicated to autonomous vehicle traffic. Int. J. Transp. Sci. Technol. 2017, 6, 42–52. [Google Scholar] [CrossRef]
  21. Rahman, M.S.; Abdel-Aty, M. Longitudinal safety evaluation of connected vehicles’ platooning on expressways. Accid. Anal. Prev. 2018, 117, 381–391. [Google Scholar] [CrossRef]
  22. Xiao, L.; Wang, M.; van Arem, B. Traffic Flow Impacts of Converting an HOV Lane Into a Dedicated CACC Lane on a Freeway Corridor. IEEE Intell. Transp. Syst. Mag. 2020, 12, 60–73. [Google Scholar] [CrossRef]
  23. Wang, T.; Li, Y.; Jia, B.; Long, J. An autonomous vehicle exclusive lane design problem under the mixed autonomy traffic environment: Model formulation and large-scale algorithm design. Transp. Res. Part E Logist. Transp. Rev. 2024, 188, 103534. [Google Scholar] [CrossRef]
  24. Seilabi, S.E.; Pourgholamali, M.; Miralinaghi, M.; Homem de Almeida Correia, G.; He, X.; Labi, S. Optimizing dedicated lanes and tolling schemes for connected and autonomous vehicles to address bottleneck congestion considering morning commuter departure choices. J. Intell. Transp. Syst. 2024, 1–18. [Google Scholar] [CrossRef]
  25. Chen, Z.; He, F.; Zhang, L.; Yin, Y. Optimal deployment of autonomous vehicle lanes with endogenous market penetration. Transp. Res. Part C Emerg. Technol. 2016, 72, 143–156. [Google Scholar] [CrossRef]
  26. Madadi, B.; Van Nes, R.; Snelder, M.; Van Arem, B. Optimizing Road Networks for Automated Vehicles with Dedicated Links, Dedicated Lanes, and Mixed-Traffic Subnetworks. J. Adv. Transp. 2021, 2021, 8853583. [Google Scholar] [CrossRef]
  27. Chen, Z.; He, F.; Yin, Y.; Du, Y. Optimal design of autonomous vehicle zones in transportation networks. Transp. Res. Part B Methodol. 2017, 99, 44–61. [Google Scholar] [CrossRef]
  28. Zhu, D.; Xie, T.; Liu, Y.; Zou, B.; Rujeerapaiboon, N. Optimal deployment of an equitable CAV platoonable corridor on road networks with mixed traffic flow. Transp. Res. Part C Emerg. Technol. 2023, 157, 104399. [Google Scholar] [CrossRef]
  29. SAE International. Taxonomy and Definitions for Terms Related to Driving Automation Systems for On-Road Motor Vehicles; SAE International: Warrendale, PA, USA, 2016. [Google Scholar]
  30. Walker, F.; Forster, Y.; Hergeth, S.; Kraus, J.; Payre, W.; Wintersberger, P.; Martens, M. Trust in automated vehicles: Constructs, psychological processes, and assessment. Front. Psychol. 2023, 14, 1279271. [Google Scholar] [CrossRef] [PubMed]
  31. Ngoduy, D.; Nguyen, C.H.; Lee, S.; Zheng, Z.; Lo, H.K. A dynamic system optimal dedicated lane design for connected and autonomous vehicles in a heterogeneous urban transport network. Transp. Res. Part E Logist. Transp. Rev. 2024, 186, 103562. [Google Scholar] [CrossRef]
  32. He, S.; Ding, F.; Lu, C.; Qi, Y. Impact of connected and autonomous vehicle dedicated lane on the freeway traffic efficiency. Eur. Transp. Res. Rev. 2022, 14, 1–14. [Google Scholar] [CrossRef]
  33. Bureau of Public Roads. Traffic Assignment Manual for Application with a Large, High Speed Computer; US Department of Commerce; US Bureau of Public Roads; Office of Planning; Urban Planning Division: Washington, DC, USA, 1964.
  34. Chen, D.; Ahn, S.; Chitturi, M.; Noyce, D.A. Towards vehicle automation: Roadway capacity formulation for traffic mixed with regular and automated vehicles. Transp. Res. Part B Methodol. 2017, 100, 196–221. [Google Scholar] [CrossRef]
  35. Liu, Z.; Chen, Z.; He, Y.; Song, Z. Network user equilibrium problems with infrastructure-enabled autonomy. Transp. Res. Part B Methodol. 2021, 154, 207–241. [Google Scholar] [CrossRef]
  36. Yang, H.; Bell, M.G.; Meng, Q. Modeling the capacity and level of service of urban transportation networks. Transp. Res. Part B Methodol. 2000, 34, 255–275. [Google Scholar] [CrossRef]
  37. Litman, T. Evaluating Transportation Equity; Victoria Transport Policy Institute: Victoria, BC, Canada, 2017. [Google Scholar]
  38. Behbahani, H.; Nazari, S.; Kang, M.J.; Litman, T. A conceptual framework to formulate transportation network design problem considering social equity criteria. Transp. Res. Part A Policy Pract. 2019, 125, 171–183. [Google Scholar] [CrossRef]
  39. Feng, T.; Zhang, J. Multicriteria evaluation on accessibility—Based transportation equity in road network design problem. J. Adv. Transp. 2014, 48, 526–541. [Google Scholar] [CrossRef]
  40. Patriksson, M. The Traffic Assignment Problem: Models and Methods; Courier Dover Publications: Garden City, NY, USA, 2015. [Google Scholar]
  41. Noruzoliaee, M.; Zou, B.; Liu, Y. Roads in transition: Integrated modeling of a manufacturer-traveler-infrastructure system in a mixed autonomous/human driving environment. Transp. Res. Part C Emerg. Technol. 2018, 90, 307–333. [Google Scholar] [CrossRef]
  42. Xu, M.; Wu, T.; Tan, Z. Electric vehicle fleet size for carsharing services considering on-demand charging strategy and battery degradation. Transp. Res. Part C Emerg. Technol. 2021, 127, 103146. [Google Scholar] [CrossRef]
  43. Guéret, C.; Prins, C.; Sevaux, M. Applications of Optimisation with Xpress-MP; Dash Optimization Ltd.: Blisworth, UK, 2002. [Google Scholar]
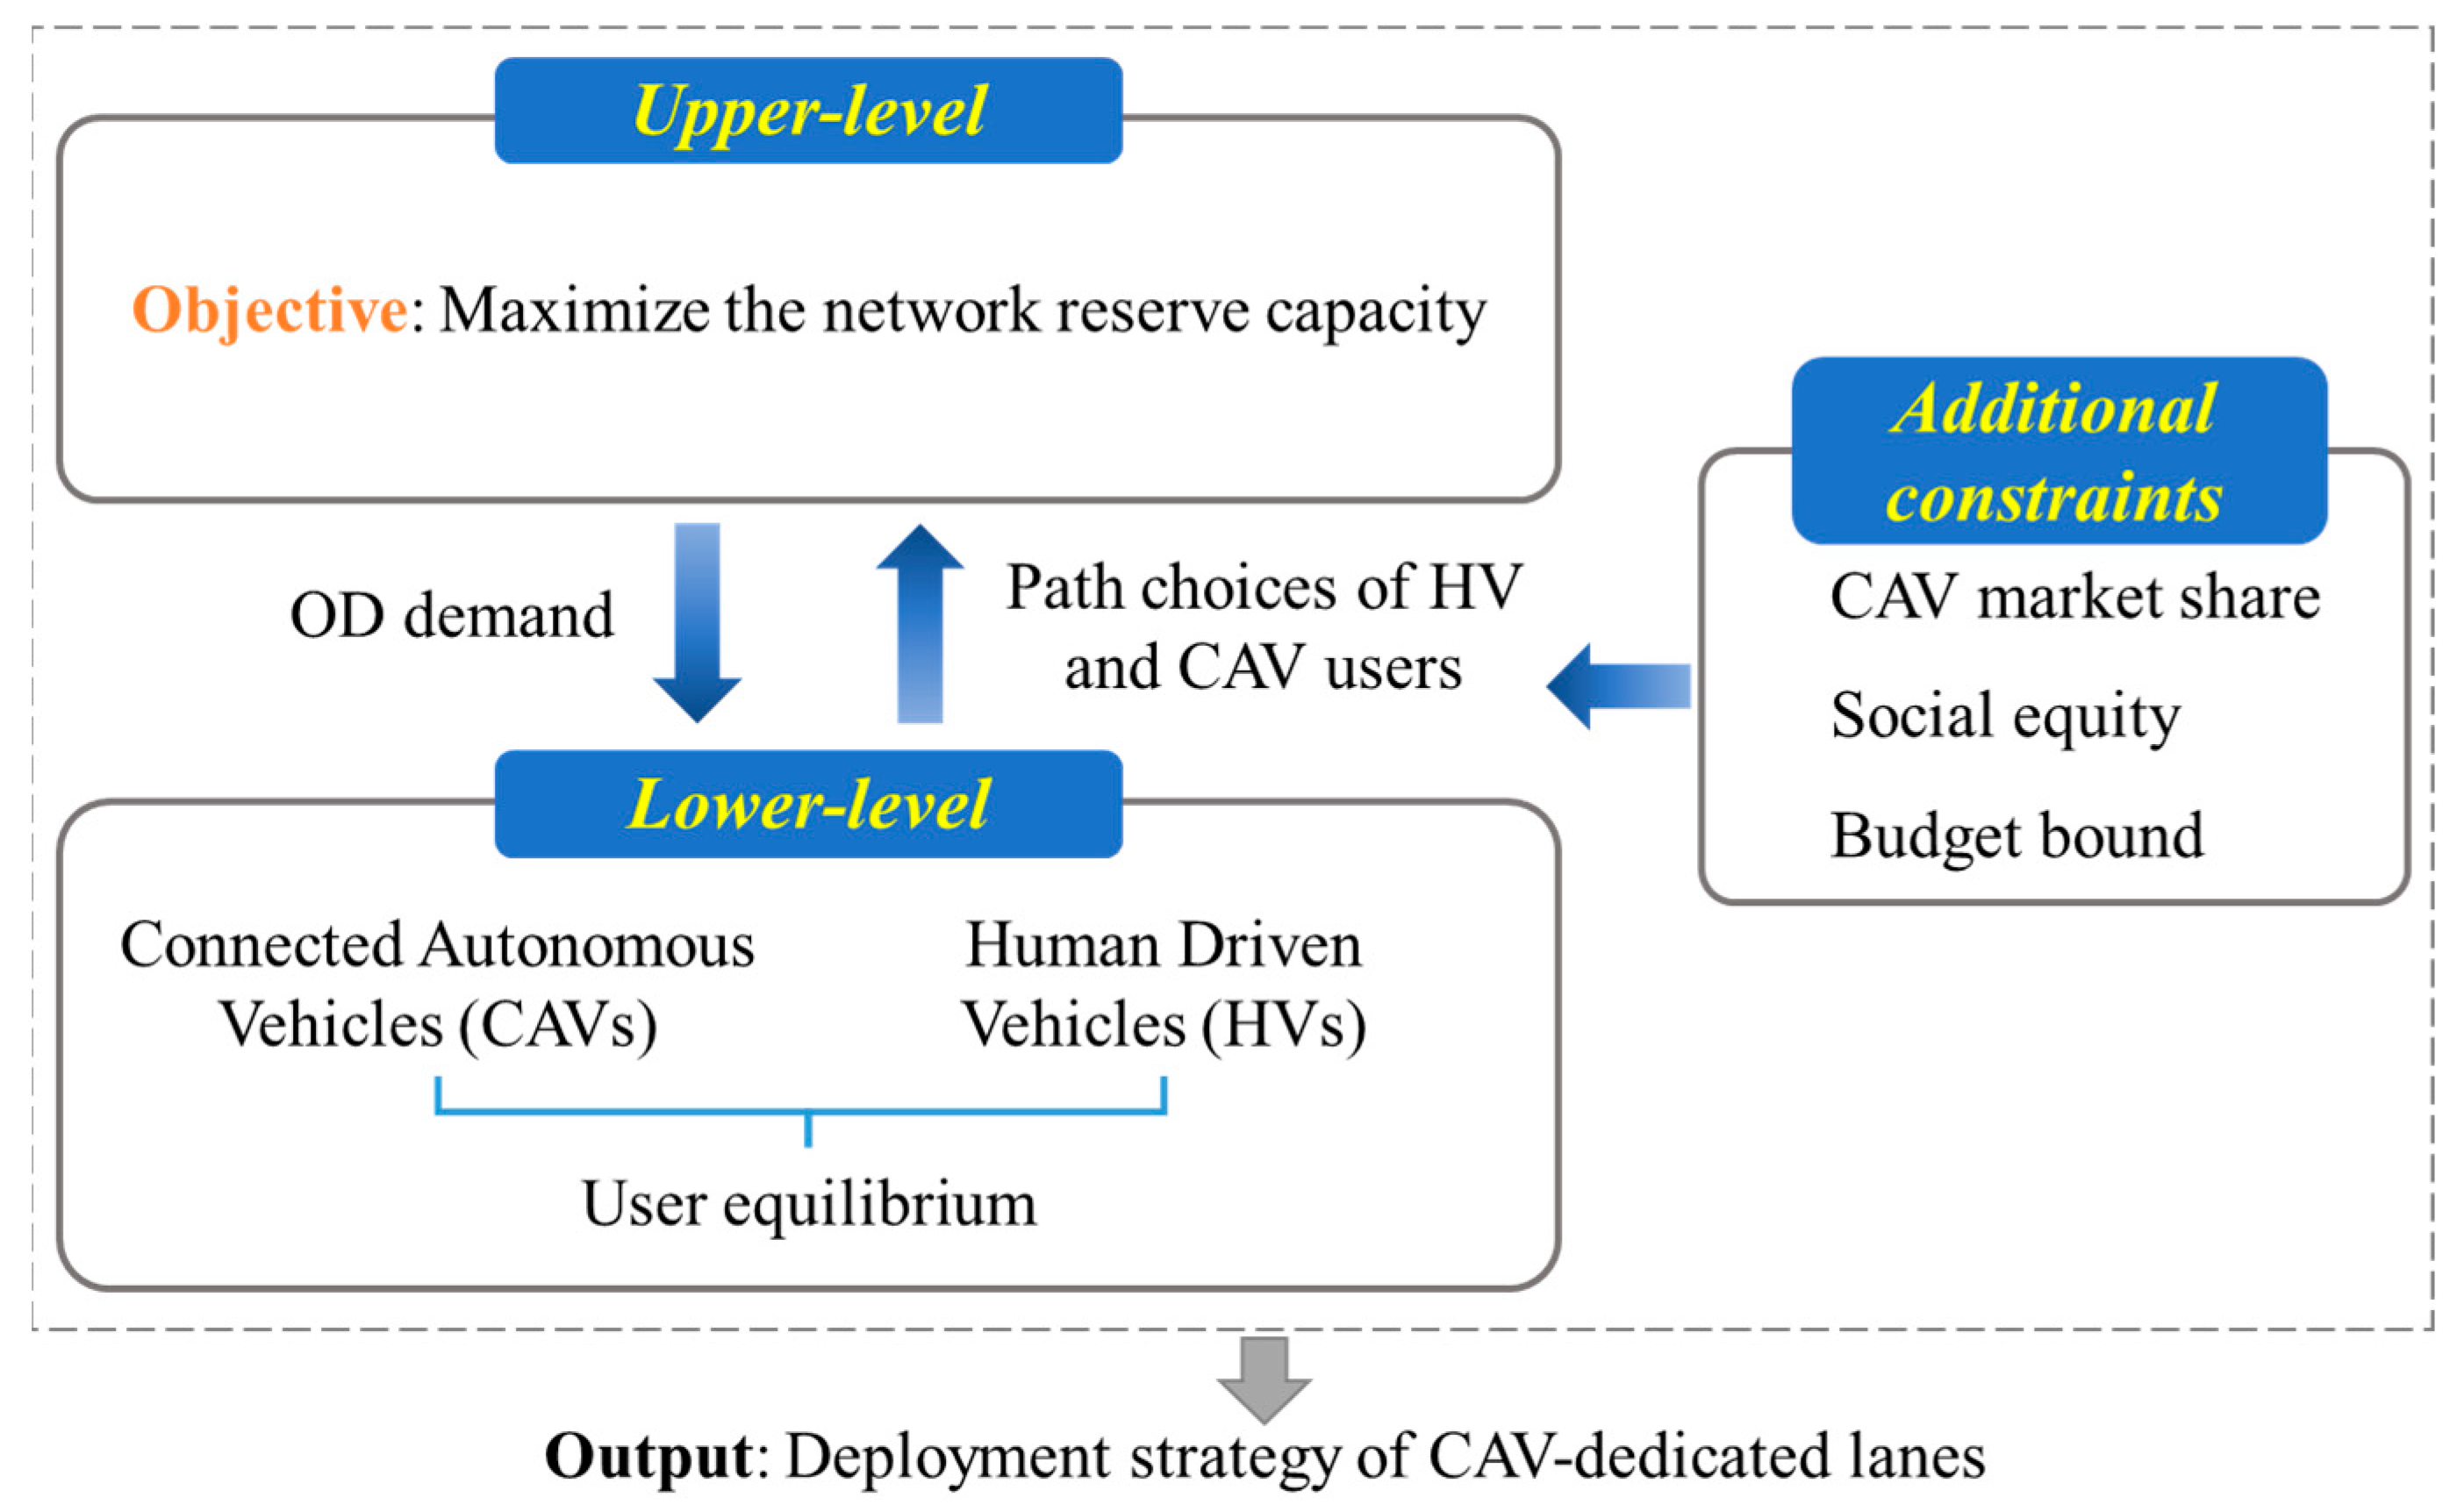
Figure 1. Bi-level programming framework for the CAV-dedicated deployment strategy.
Systems 13 00958 g001
Figure 2. Example of the extended network.
Systems 13 00958 g002
Figure 3. An illustration of the mixed CAVs and HVs traffic environment.
Systems 13 00958 g003
Figure 4. HV and CAV flows are segregated with CAV-dedicated lanes.
Systems 13 00958 g004
Figure 5. Illustration of the PLA approach.
Systems 13 00958 g005
Figure 6. Deployment plans under different cases ( λ = 1.6 ).
Systems 13 00958 g006
Figure 7. Average travel costs under different budget settings. (a) Average travel cost per trip. (b) Average travel cost per distance.
Systems 13 00958 g007
Figure 8. Network capacity with various economic bounds D ¯ .
Systems 13 00958 g008
Figure 9. Network capacity heatmap.
Systems 13 00958 g009
Figure 10. Marginal reserve-capacity gain with budget.
Systems 13 00958 g010
Figure 11. Impact of equity constraint. (a) D ¯ = $ 1.4 × 10 7 , without equity constraint vs. with equity constraint λ = 1.2 . (b) D ¯ = $ 2.4 × 10 7 , without equity constraint vs. with equity constraint λ = 1.2 .
Systems 13 00958 g011
Table 1. Network performance with and without CAV-dedicated lanes.
CaseNetwork Capacity (veh/h)Total Travel Cost ($)Average Travel Cost ($/Trip)HV’s Average Travel Cost ($/Trip)CAV’s Average Travel Cost ($/Trip)
Base778,787858,343.31.102\1.102
(a)864,367869,124.41.0051.1070.768
(b)931,818840,903.00.9021.2370.679
(c)1,010,687806,244.30.7981.4120.729
(d)892,543925,244.31.0371.1180.847
(e)977,518902,505.70.9231.1420.778
(f)1,060,254852,288.50.8041.2940.749
Note: All values are model-based simulation outputs on the Sioux Falls network. Because travel time functions are approximated via piecewise linearization and solved with finite optimality gaps, the reported numbers may exhibit small approximation differences relative to the underlying nonlinear model. These differences are bounded by the pre-specified tolerance ε used in the piecewise linearization and solver settings (see proof in Xu, Wu [42]).
Disclaimer/Publisher’s Note: The statements, opinions and data contained in all publications are solely those of the individual author(s) and contributor(s) and not of MDPI and/or the editor(s). MDPI and/or the editor(s) disclaim responsibility for any injury to people or property resulting from any ideas, methods, instructions or products referred to in the content.