1. Introduction
The supply chain is often affected by various shock events, some of which are natural events such as epidemics and earthquakes, while others are man-made events including wars, geopolitical conflicts, and economic sanctions [
1]. For instance, in the 1980s, the United States outcompeted Japan’s semiconductor industry through the “301 investigation” and market quotas, effectively curbing the development of Japan’s semiconductor sector. In recent years, to curb the development of China’s integrated circuit (IC) industry, the United States has repeatedly added many Chinese enterprises to the “Entity List” [
2], on the grounds of national security, to impose technological blockades, restrict normal trade activities such as exports and investments, and impose additional tariffs. The Russia–Ukraine war [
3] led to the suspension of neon gas production in Ukraine and restricted the export of rare metals such as palladium and nickel from Russia, causing significant impacts on the material sources of the IC supply chain. As an industry with a high degree of global supply chain layout [
4], the IC industry is increasingly affected by such shocks. Therefore, more and more scholars are paying attention to the research on the resilience of the IC supply chain.
The industrial chain refers to the value creation chain relationship formed by all the links from raw materials to the final consumers of products or services. It focuses on the upstream and downstream of products and the division of labor and cooperation within the industry and is a complete industrial value creation network [
5]. The supply chain is a network that emphasizes the collaborative relationship among the representative entities. It refers to the coordinated network of all agents (suppliers, manufacturers, wholesalers, retailers, etc.) in the entire process from raw material procurement, production, and manufacturing to the delivery of products or services to the final consumers [
6]. The term “industrial chain supply chain” has been frequently referenced in government work reports [
7,
8]. It refers to an integrated structure that combines the industrial chain and supply chain, with value creation at its core. This system encompasses all entities and activities involved in value generation—from raw material supply to end-product consumption—within the industrial ecosystem [
9,
10]. It constitutes a complex network [
11] organized around industrial value chain and agent-based division of labor and collaboration. The resilience of industrial chain–supply chain is its ability to maintain core functions despite severe external shocks, rapidly adapting, recovering, and reorganizing to ensure continuity and stability.
As the “world factory”, China has the most powerful manufacturing industry in the world. In 2024, China’s IC export volume reached 159.55 billion US dollars, ranking first in the world. The stability of China’s IC industry not only plays a crucial role in ensuring the security of the global IC supply chain but also influences the development of the artificial intelligence industry. However, China’s IC industry is facing the following challenges, including emergencies [
12], geopolitical conflicts [
13], and extreme natural disasters [
14]. Given China’s pivotal role in the global IC industry, understanding the key mechanisms underlying its industrial resilience is crucial for enhancing the risk resistance of worldwide IC supply chain. Accordingly, this study selects China’s IC industrial chain–supply chain as the research focus, with the objective of strengthening its overall resilience and adaptive capacity. The core of this research lies in identifying and analyzing the critical factors that influence the robustness of the industry. The investigation is structured around the following three research questions:
- RQ1:
How to model the complex system of the IC industrial chain–supply chain? The industrial chain–supply chain system is characterized by multiple agents and complex relationships. Research on its resilience and risk transmission depends on a reasonable and complete modeling of this system.
- RQ2:
How to identify the key industries and key enterprises in the IC industrial chain–supply chain? The identification of key points is conducive to the implementation of specific resilience enhancement measures and is of great significance for the research on the resilience of the system.
- RQ3:
How to measure the resilience level of IC industrial chain–supply chain, and what are the key influencing factors? The definition of resilience is the first step in analyzing the resilience level of the system, and due to the complex nature of the IC industrial chain–supply chain, there are numerous potential factors that need to be identified to determine the key influencing factors.
Based on the above problems, the research of this paper is mainly divided into two parts: the construction of the industrial chain–supply chain model and the simulation study of the model.
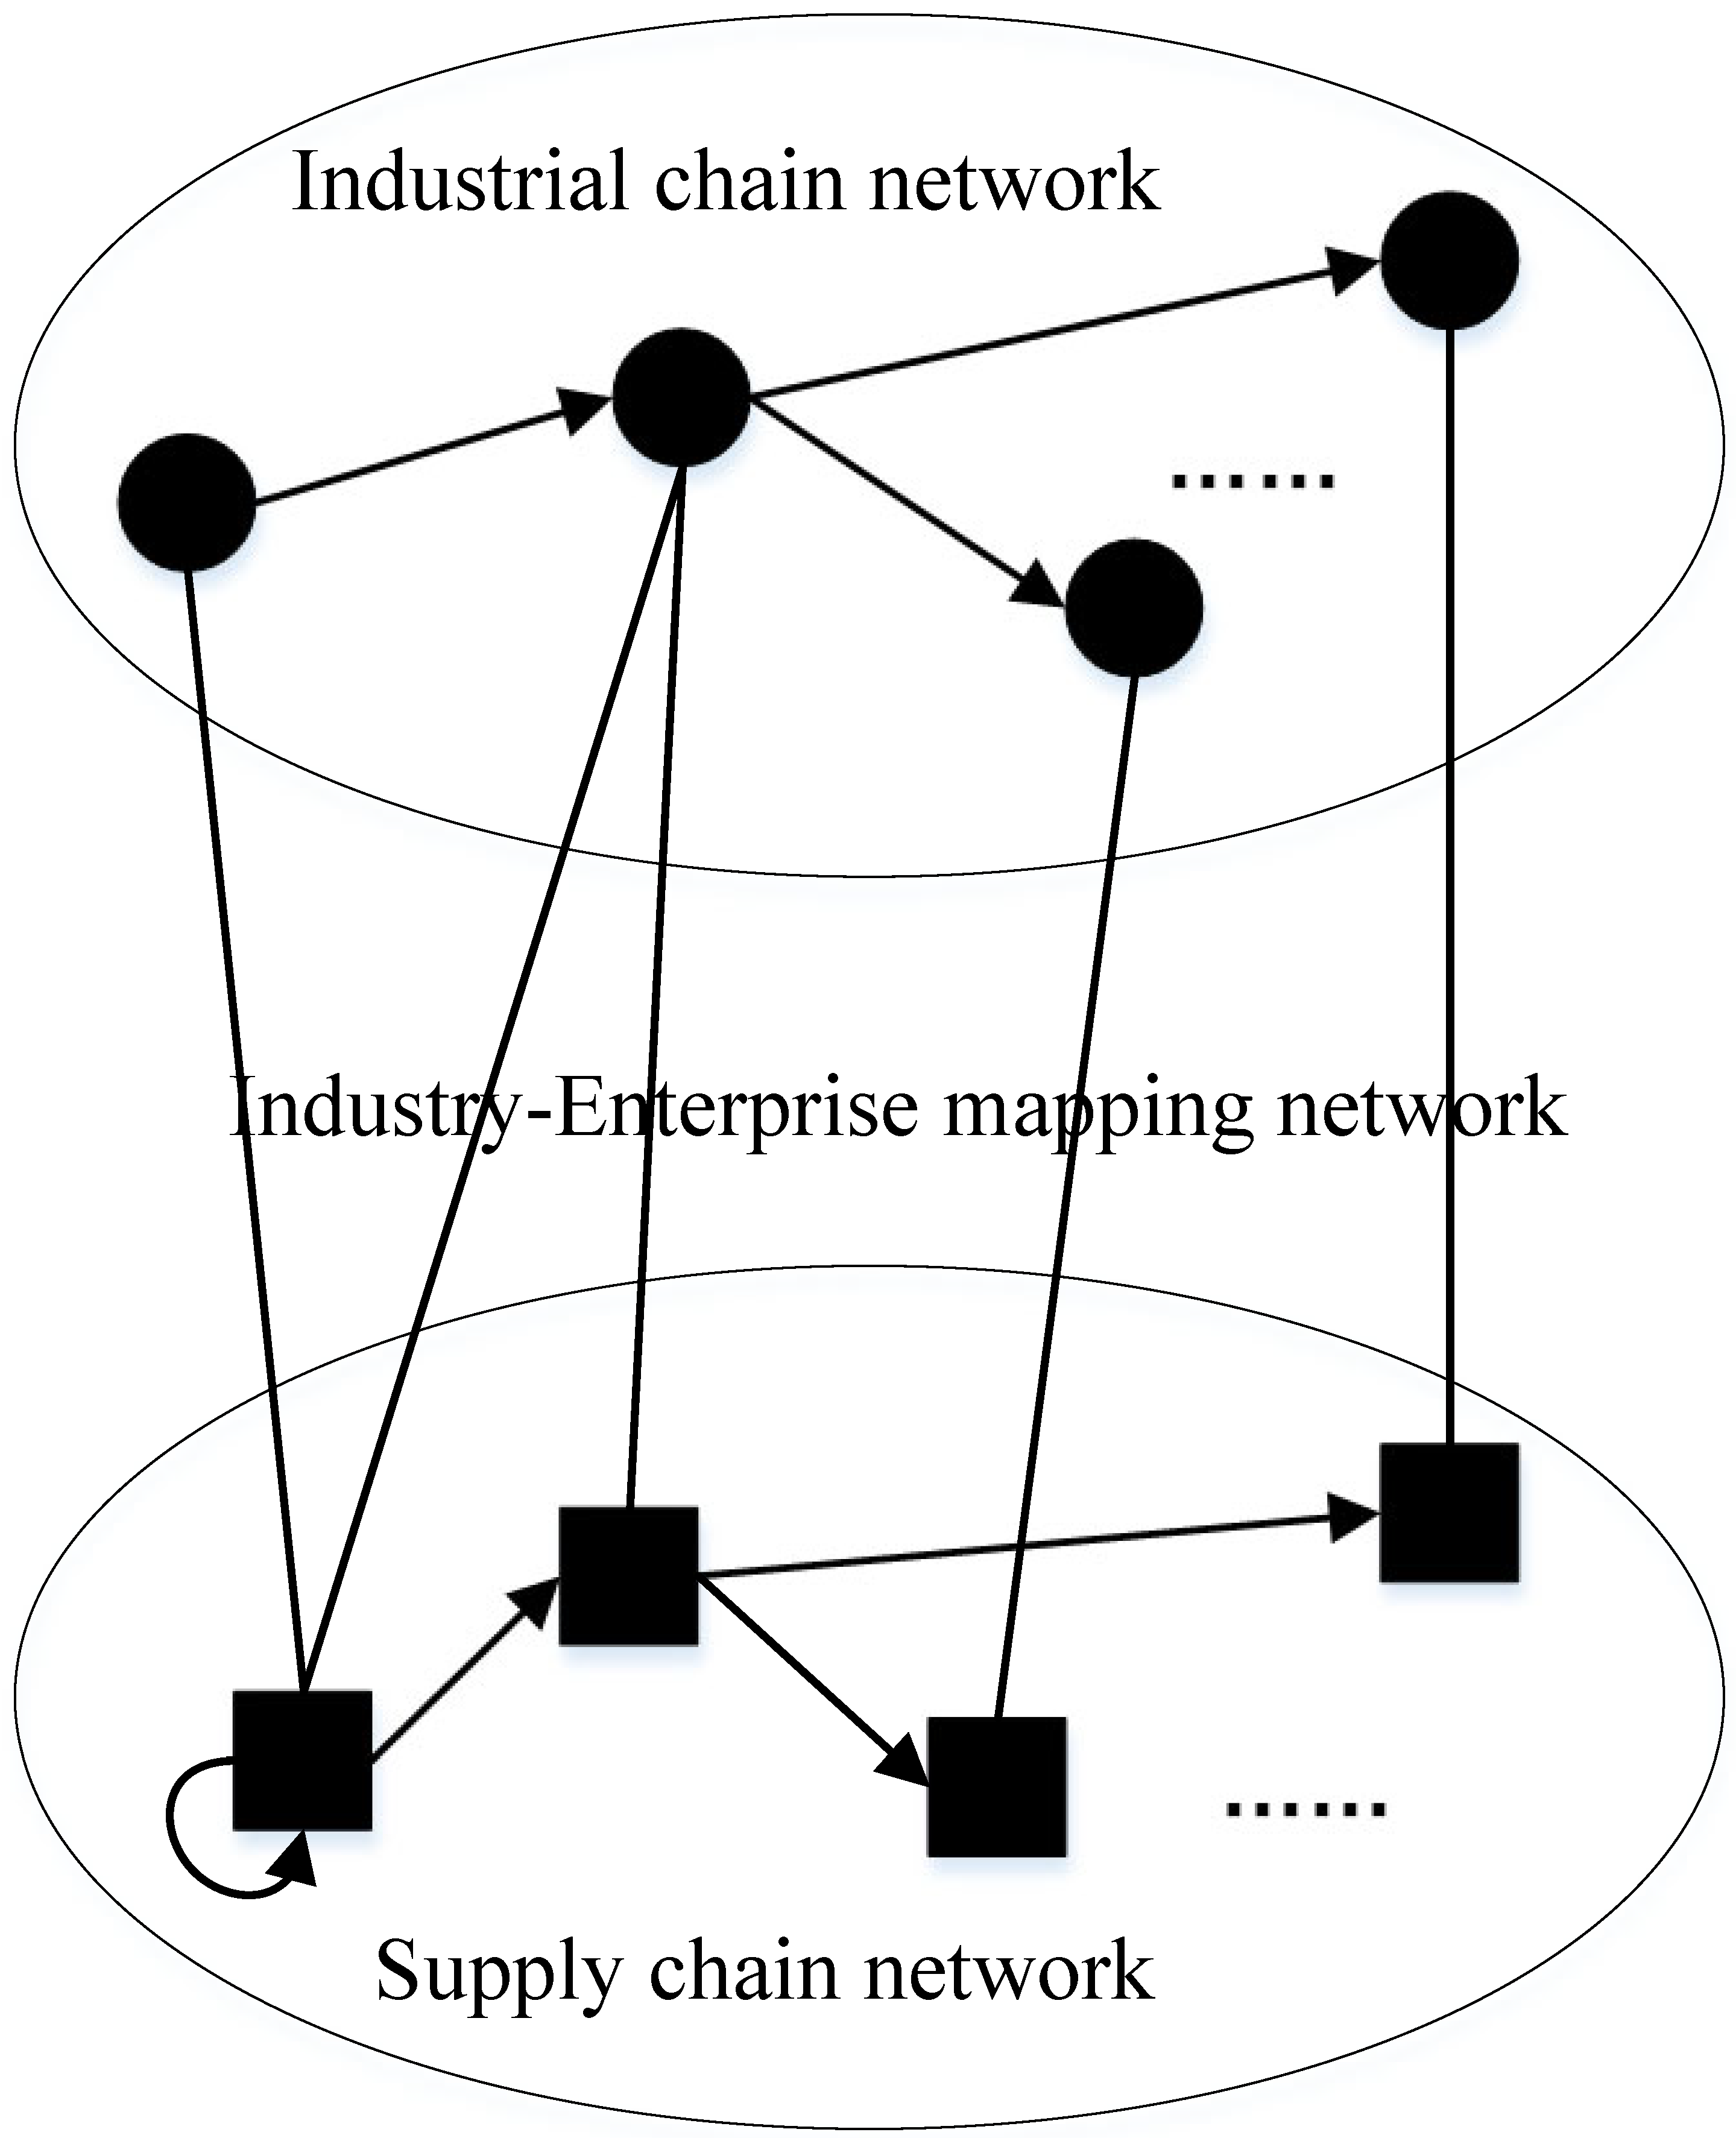
This study addresses the challenge of quantifying and enhancing resilience in China’s IC industrial chain–supply chain. To systematically evaluate how disruptive risks propagate and how the system can recover, a three-layer network model was constructed reflecting the real-world structure of China’s IC sector. The model integrates the industrial chain network, a synthetic but realistic supply chain network based on enterprise attributes, and a mapping between enterprises and their respective industries, following the approach of He et al. [
15].
Using this model, simulation experiments were designed to replicate actual disruption scenarios and risk propagation dynamics. The simulations capture enterprise-level decision-making in response to shocks, allowing us to trace cascading effects across the system. To assess system resilience, four key performance indicators were defined and evaluated across over 3630 simulation runs. The results reveal that higher-risk segments are concentrated in the IC raw materials industry. These findings help pinpoint vulnerable nodes where targeted resilience policies would be most effective.
Furthermore, through an orthogonal experimental design involving 34,200 simulations, an analysis of variance (ANOVA) was employed to identify which of eight potential factors most significantly influence system resilience. The analysis shows that enterprise-level characteristics—such as purchasing strategy, size preference, communication capability, and redundancy capacity—play decisive roles in system performance. These insights provide a factual basis for policymakers and enterprises seeking to prioritize investments and strategies that strengthen the IC industrial chain.
Based on the above work, the marginal contributions of this study mainly include the following two points:
- (1)
In terms of theoretical contributions, this study conducted a variance analysis experiment using a mixed orthogonal table to examine the influencing factors. It identified the key factors that have a significant impact on the resilience of the IC industrial chain–supply chain system from multiple potential factors. This provides a reference for the research on other influencing factors of the supply chain system.
- (2)
In terms of practical contributions, this study takes China’s IC industrial chain–supply chain as an example and divides the industries and enterprises within the IC industrial chain–supply chain into different risk levels. This provides a scientific basis for the targeted implementation of resilience level improvement strategies.
The remaining part of this paper is arranged as follows.
Section 2 combs the existing research on the IC industrial chain, supply chain, and industrial chain–supply chain and expounds the research content of this paper by summarizing the gaps in the existing research.
Section 3 introduces the IC industrial chain–supply chain network constructed in this paper and the main simulation model used for shock event simulation.
Section 4 carries out the experimental design and shows the relevant experimental results. Finally,
Section 5 summarizes and prospects the research of this paper.
2. Literature Review
The existing research on industry resilience mostly studies the industrial chain and the supply chain separately. There are few studies that regard the industrial chain–supply chain as a whole system.
2.1. Research on Resilience of Industrial Chain
With the increase in risk events in recent years, research on the resilience of the industrial chain has also been increasing year by year. Research on the resilience of industrial chains can be classified into static perspective and dynamic perspective studies based on different research perspectives.
Most of the existing research is static analysis of the industrial chain. To study the formation and measurement of global industrial chain resilience and explore the influencing factors of resilience, Ma et al. [
16] constructed a global supply chain production model and analyzed the data of Eora MRIO from 1990 to 2021. Xue and Zhu [
17] analyzed the panel data of 30 provinces in China from 2011 to 2022 to study the impact mechanism of intelligent technology on the resilience of the industrial chain. Sun et al. [
18] have established a micro-evaluation index system for industrial chain resilience, analyzed the data of China’s A-share manufacturing listed companies from 2015 to 2022, and explored the impact mechanism of digital transformation on industrial chain resilience. There are few studies on the dynamic perspective. In order to study the influence mechanism of digital collaboration of manufacturing enterprises under the industrial Internet platform, Yi et al. [
19] constructed a stochastic evolutionary game model including core manufacturing enterprises, suppliers, and local governments, analyzed the stability conditions of game agents with the help of stochastic differential equations, and explored different incentive mechanisms of enterprise strategies.
The research on the resilience of the IC industrial chain started relatively late, and the related research has gradually increased after 2020. In terms of the static perspective, Yu et al. [
20] started from the upstream perspective of the IC industrial chain and constructed a targeted weighted supply network for semiconductor materials from 2013 to 2022. From a static perspective, they analyzed the resilience level of the material supply network, which helped identify the key materials and core countries in the IC industrial chain. Liu et al. [
21] collected the statistics of cooperation and investment among enterprises related to China’s semiconductor industry from 2002 to 2020. Through the analysis of key parts of the value chain, they studied the impact and contribution of these key industries to the development of China’s IC industry. Wu et al. [
22] constructed the vulnerability evaluation system of IC the industrial chain from three dimensions of exposure, sensitivity, and adaptability and used the entropy weight Topsis method to evaluate. Wu et al. [
23] constructed a directed weighted network of China’s electronic components industrial chain based on the input–output ratio table, focusing on the contribution degree of node network connectivity and node external dependence, identifying the key nodes in the industrial chain, and realizing the assessment of network resilience. In terms of the dynamic perspective, Zhu [
24] constructed a system dynamics simulation model around the formation factors of resilience, simulated the impact events and relevant policies, and revealed the formation mechanism of resilience of the digital industry innovation ecosystem. Some scholars nominally study the industrial chain resilience but still take the cooperative relationship network between enterprises as the research object. Wang et al. [
25] used the complex network theory to analyze the performance level of the IC industrial chain in Shaanxi Province, and they used the cooperation relationship of the IC enterprises in Shaanxi Province when constructing the industrial chain model.
In this field, existing studies mostly focus on the overall structure and operation patterns of the industrial chain at the macro level. Most of them concentrate on exploring the interconnection patterns among industries, regional distribution characteristics, and the impact of policy intervention on the resilience of the industrial chain. However, to a large extent, they have overlooked the supply chain information interaction and collaborative mechanisms embedded within each link of the industrial chain. The research often takes macro perspectives such as industrial clusters and industrial ecosystems as entry points, rarely delving into the specific operational details at the supply chain level and failing to integrate the macro structure of the industrial chain with the micro dynamics of the supply chain from a systemic overall perspective. As a result, there is a certain degree of one-sidedness in understanding the formation mechanism of the industrial chain’s resilience, making it difficult to comprehensively reveal the resilience evolution patterns of the industrial chain under complex disturbances, and these researches do not yet offer a comprehensive framework that simultaneously addresses both macro-level planning and micro-level operations to enhance the overall resilience of the industrial chain.
2.2. Research on Resilience of Supply Chain
The related research of supply chain resilience can also be divided into the static perspective and dynamic perspective.
In the study of the static perspective, Soni et al. [
26] constructed a model that comprehensively considered the influencing factors and interrelations of supply chain resilience based on the graph theory and analyzed it through the interpretative structural modeling method. Ahmadian et al. [
27] proposed a quantitative assessment method for supply chain network resilience, which contributed to the assessment and comparison of supply chain network resilience. Tafakkori et al. [
28] explored the optimal decisions of supply chain entities by constructing a bi-objective stochastic robust optimization model with the objective of resilience performance and cost-effectiveness. In the study of the dynamic perspective, simulation methods have been widely used. It has the advantage of being able to handle complex problem settings where the system’s behavior changes over time [
29]. Agent-based modeling (ABM), as a bottom-up simulation modeling method, can model the heterogeneous attributes and behaviors of the agents within the system. It is an important tool for studying complex systems. Li and Chan [
30] proposed an ABM model to model the make-to-order and make-to-stock supply chains with dynamic structures. The member companies in the supply chain were modeled as agents in the simulation model, and each agent established an association with products. The agents could dynamically select the production products and structure patterns based on the order information. Ivanov [
31] constructed a four-layer supply chain simulation model to study the relationship between supply chain resilience and sustainability. To determine which sustainability factors show a positive correlation with resilience performance and which ones show a negative correlation, a simulation experiment was designed using the mobile phone supply chain as a case study. To quantitatively reflect the performance of the supply chain, the author focused on service level and delivery time parameters (customer satisfaction). Lohmer et al. [
32] studied the impact of blockchain technology, as a representative of emerging digital technologies, on supply chain resilience, constructed a four-layer supply chain network, and built simulation models with the agents of each layer as the main body. The study takes the cost of network interruption, recovery time, and the number of subjects affected by the interruption as the quantitative indicators of resilience and studies the impact of blockchain technology by comparing the supply chain resilience performance of the model integrating blockchain technology and the benchmark model. Rozhkov et al. [
33] studied the impact of the spread of the epidemic on the supply chain and explored the effects of different structural designs (two-tier and three-tier ordering networks) and recovery strategies on epidemic disruption events. Unlike the traditional simulation-based supply chain risk research that models the impact of disruptions as a parameter in the supply chain model, the authors, respectively, constructed ABM models for the supply chain and the epidemic and connected the two models by using the proportional relationship between the number of uninfected people in the epidemic model and the producer capacity in the supply chain model.
Similar to the industry chain research, the related research of the IC supply chain also started late, and most of the research focuses on the static perspective. Chen and Wen [
34] used the ability of the supply chain to resist shocks and recover as the evaluation criterion of supply chain resilience, constructed a directed weighted network based on the complex network theory, took the real data of the global IC supply chain as an example, identified the key nodes in the supply chain network, and proposed two measures to improve the resilience of a knowledge-intensive supply chain. Kumar et al. [
35] studied product flows in a semiconductor supply chain during a pandemic outbreak using a multi-objective mixed-integer nonlinear programming approach. From the perspective of complex network modeling, Jiang and Li [
36] constructed a multi-layer network model by using the supply and demand data of China’s IC etching raw material parts so as to evaluate the supply chain resilience and find potential alternative paths. A few scholars use the dynamic perspective research method. Zhang et al. [
37] constructed a system dynamics model based on the actual operation of the supply network to analyze the impact effects and ultimately obtained the best risk response measures through game theory and optimization methods. Chen et al. [
38] studied the impact of alternative sites on supply chain resilience and used discrete event simulation technology to evaluate the operation conditions of different types of backup sites with different reserve levels under different disruption scenarios.
Studies on supply chain resilience have primarily examined the micro-level operations of individual firms. However, they have paid limited consideration to the macro-environment and the system-wide mechanisms of information flow and interaction. The research rarely examines the resilience of the supply chain within the overall framework of the industry chain, ignoring the systematic influence of macro factors such as industrial structure layout, cross-industry resource allocation, and policy environment changes on the resilience of the supply chain. Moreover, it does not fully incorporate the micro-dynamics of the supply chain with the macro-context of the industrial chain into a cohesive systemic view, limiting the understanding of supply chain resilience to the optimization of local links and making it difficult to comprehensively grasp the formation logic of supply chain resilience in the large-scale industry chain system. It also lacks a robust theoretical foundation for constructing a resilient industrial chain-supply chain system that effectively balances micro-level efficiency with macro-level coordination.
2.3. Research on Industrial Chain–Supply Chain
In recent years, several scholars have paid more attention to the research of industrial chain–supply chain as a whole system on the basis of the research of the industrial chain and supply chain [
39].
At present, the research on the integration of the industrial chain–supply chain is mostly to build a static evaluation index system. Zheng et al. [
40] constructed the safety evaluation index system of China’s fluorite resources industrial chain–supply chain from three dimensions of resource acquisition, resource circulation, and resource transformation. Wu et al. [
41] selected 21 influencing factors from four perspectives of absorbability, adaptability, resilience, and self-learning ability to construct an evaluation index system for improving the resilience of the coal-to-liquids industrial chain. In the field of IC, Sun et al. [
42] constructed the index system of the safety level of the industrial chain and supply chain from three dimensions of dependence degree, controllable resilience, and independent ability to evaluate the safety level of China’s IC field.
Few scholars have paid attention to the industrial chain–supply chain network from the dynamic perspective. Wang [
43] divided the whole system into three levels of node, chain, and network and constructed the resilience measurement index system of the semiconductor industrial chain–supply chain from three dimensions of resistance ability, adaptive ability, and resilience ability, respectively. On this basis, the system causal loop diagram and the system stock flow diagram were drawn, and the simulation analysis was carried out by using the method of system dynamics.
Current research on industrial chain–supply chain resilience has begun to bridge the traditional divide between industrial chain and supply chain studies. However, significant limitations remain. Most studies adopt a static perspective, relying on methods such as constructing evaluation indicator systems, conducting data analysis, or performing case comparisons to assess resilience at a specific point in time. While useful, these approaches are difficult to capture the dynamic evolution of system resilience under external disturbances. Although a limited number of studies have introduced simulation-based dynamic analysis methods, they often do not sufficiently explore the complex interactions among various agents within the industrial chain-supply chain system. They neither fully reveal the dynamic interaction mechanism of information transmission, resource flow, and risk transmission among the agents nor take into account the risk perception and decision-making ability of each entity when facing risk events, resulting in research conclusions that are difficult to comprehensively reflect the dynamic resilience characteristics of the real system.
2.4. Summary of Existing Studies
According to the above review and summary of research in the field of IC industrial chain–supply chain, it is not difficult to find that, although the existing related research has formed a certain research foundation in this field, the overall research is still in the initial stage, and there are the following opportunities for further research:
- (1)
The existing research ignores the complex system characteristics of the IC industrial chain–supply chain.
The IC industrial chain–supply chain is a complex system that includes industrial value creation information, enterprise collaboration, information and industry–enterprise coupling information. Existing studies pay more attention to the relationship between the influencing factors of risk and resilience, ignoring the most basic agent information of a complex system. This study enhances the realism of IC supply chain resilience modeling by integrating crucial adaptation strategies—like multi-sourcing and network reconstruction—into a simulation framework. By doing so, it extends existing research and offers a more robust tool for analyzing the dynamics of this complex system under disruption.
- (2)
The existing research does not take the advantage of the IC network structure.
The network structure is helpful to promote the efficient collaboration among the agents in the IC industrial chain–supply chain [
10]. The existing research mostly focuses on the construction of the index system and the system dynamics relationship between the influencing factors of resilience, ignoring the help of the IC industrial chain and supply chain network structure for research. The network structure can vividly describe the characteristics of industrial chain and supply chain and has the potential to model the complex system of the industrial chain–supply chain. Therefore, this study achieved the quantitative modeling of the IC system by constructing a three-layer network. It provides a model foundation for the research on the resilience of the system.
- (3)
The existing research ignores the feedback and decision of IC enterprises under risk.
Enterprises are the most fundamental entities in the supply chain. They possess the ability to perceive risks and can choose the most appropriate decision-making methods when facing various unexpected situations. In the research of the IC industrial chain–supply chain, the significance of enterprise initiative cannot be overlooked. Existing studies mostly analyze the influencing factors of resilience from an overall data perspective, lacking attention to the enterprise as the agent. Therefore, in this study, the ABM simulation method was employed, which fully took into account the decisions and interactions of the entities within the system, providing a dynamic research perspective for the identification of risk nodes and the determination of key influencing factors in the research of the resilience of IC system.
4. Experimental Design and Analysis
This study conducted two phases of simulation experiments. Firstly, in the defined benchmark scenario, the risk nodes in the IC industrial chain and supply chain were analyzed. Then, based on the orthogonal table, the experimental design was carried out and the key resilience influencing factors were identified. This chapter will detail the parameter data of the simulation experiments as well as the experimental results and analyses.
4.1. Simulation Initial Setup and Data
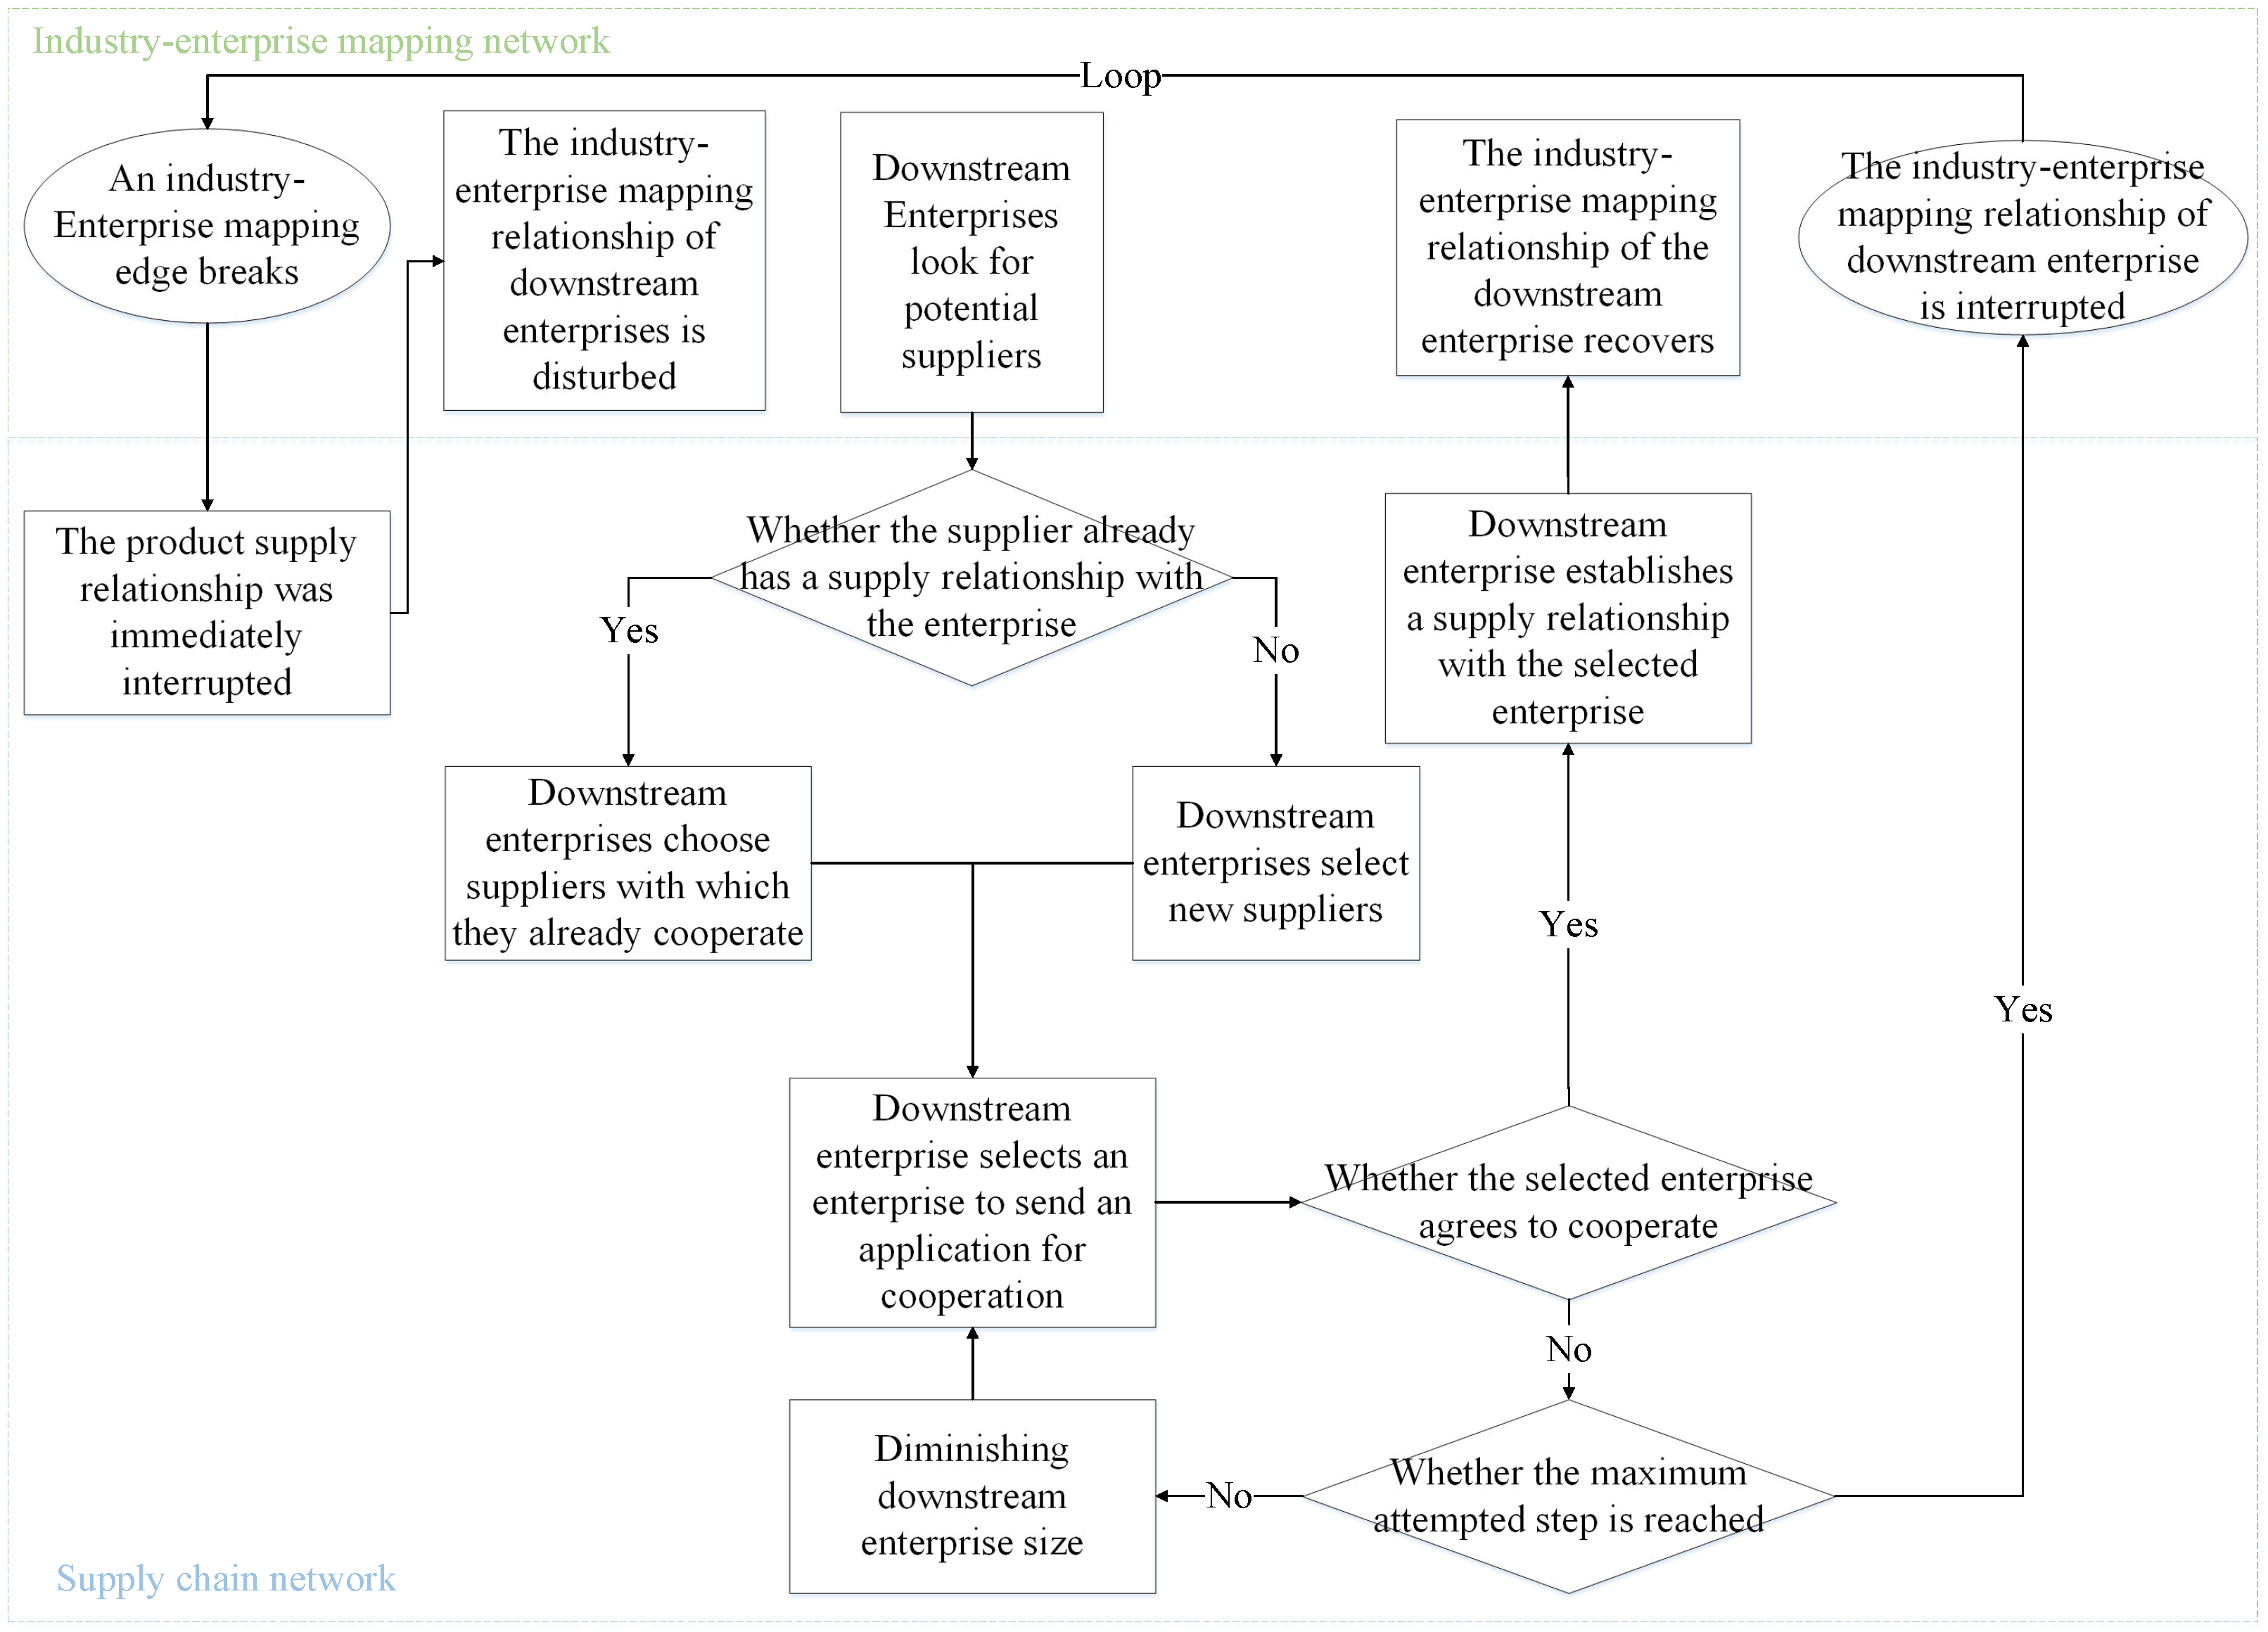
The simulation model is implemented based on python 3.8, the network structure is implemented by NetworkX library, and the ABM is implemented by mesa library. The initial risk event is set to interrupt 363 edges in the industry–firm mapping network one by one and immediately interrupt the supply of the corresponding firm to the downstream. In order to reduce the influence of randomness on the analysis of the experimental results, the experiment was repeated 10 times for each risk event.
Table 3 shows the parameter values used for the simulation experiment, where the underlined ones are the parameters for the benchmark scenario. The selection of parameters was based on the parameter settings in the research conducted by He et al. [
15], Ma et al. [
45], Yang et al. [
46].
All other data used in the experiment comes from the real data of China’s IC industrial chain–supply chain obtained by network crawling and literature research, and some missing data is approximately processed by regression and interpolation methods.
4.2. Risk Nodes of IC Industrial Chain–Supply Chain in the Benchmark Scenario
The parameter values indicated by the underscores in
Table 3 are used in the benchmark model. Through the experiment of disconnecting 363 industry–enterprise network links one by one and repeating 10 times, this study obtained 3630 groups of experimental data and carried out a detailed analysis of the risk nodes in the industrial chain and supply chain.
4.2.1. Risk Node of Industrial Chain Network
Through statistical analysis of the number of transmission of risk events in each industry in the industrial chain, as is shown in
Table 4, this study constructed an industry risk level table through the interquartile distribution of transmission times.
This study statistically analyzed the transmission of risk events among products at different time steps in all experimental data. Based on the analysis of risks at industrial nodes, it further examined the transmission paths of risks in each industrial chain. The statistical results are shown in
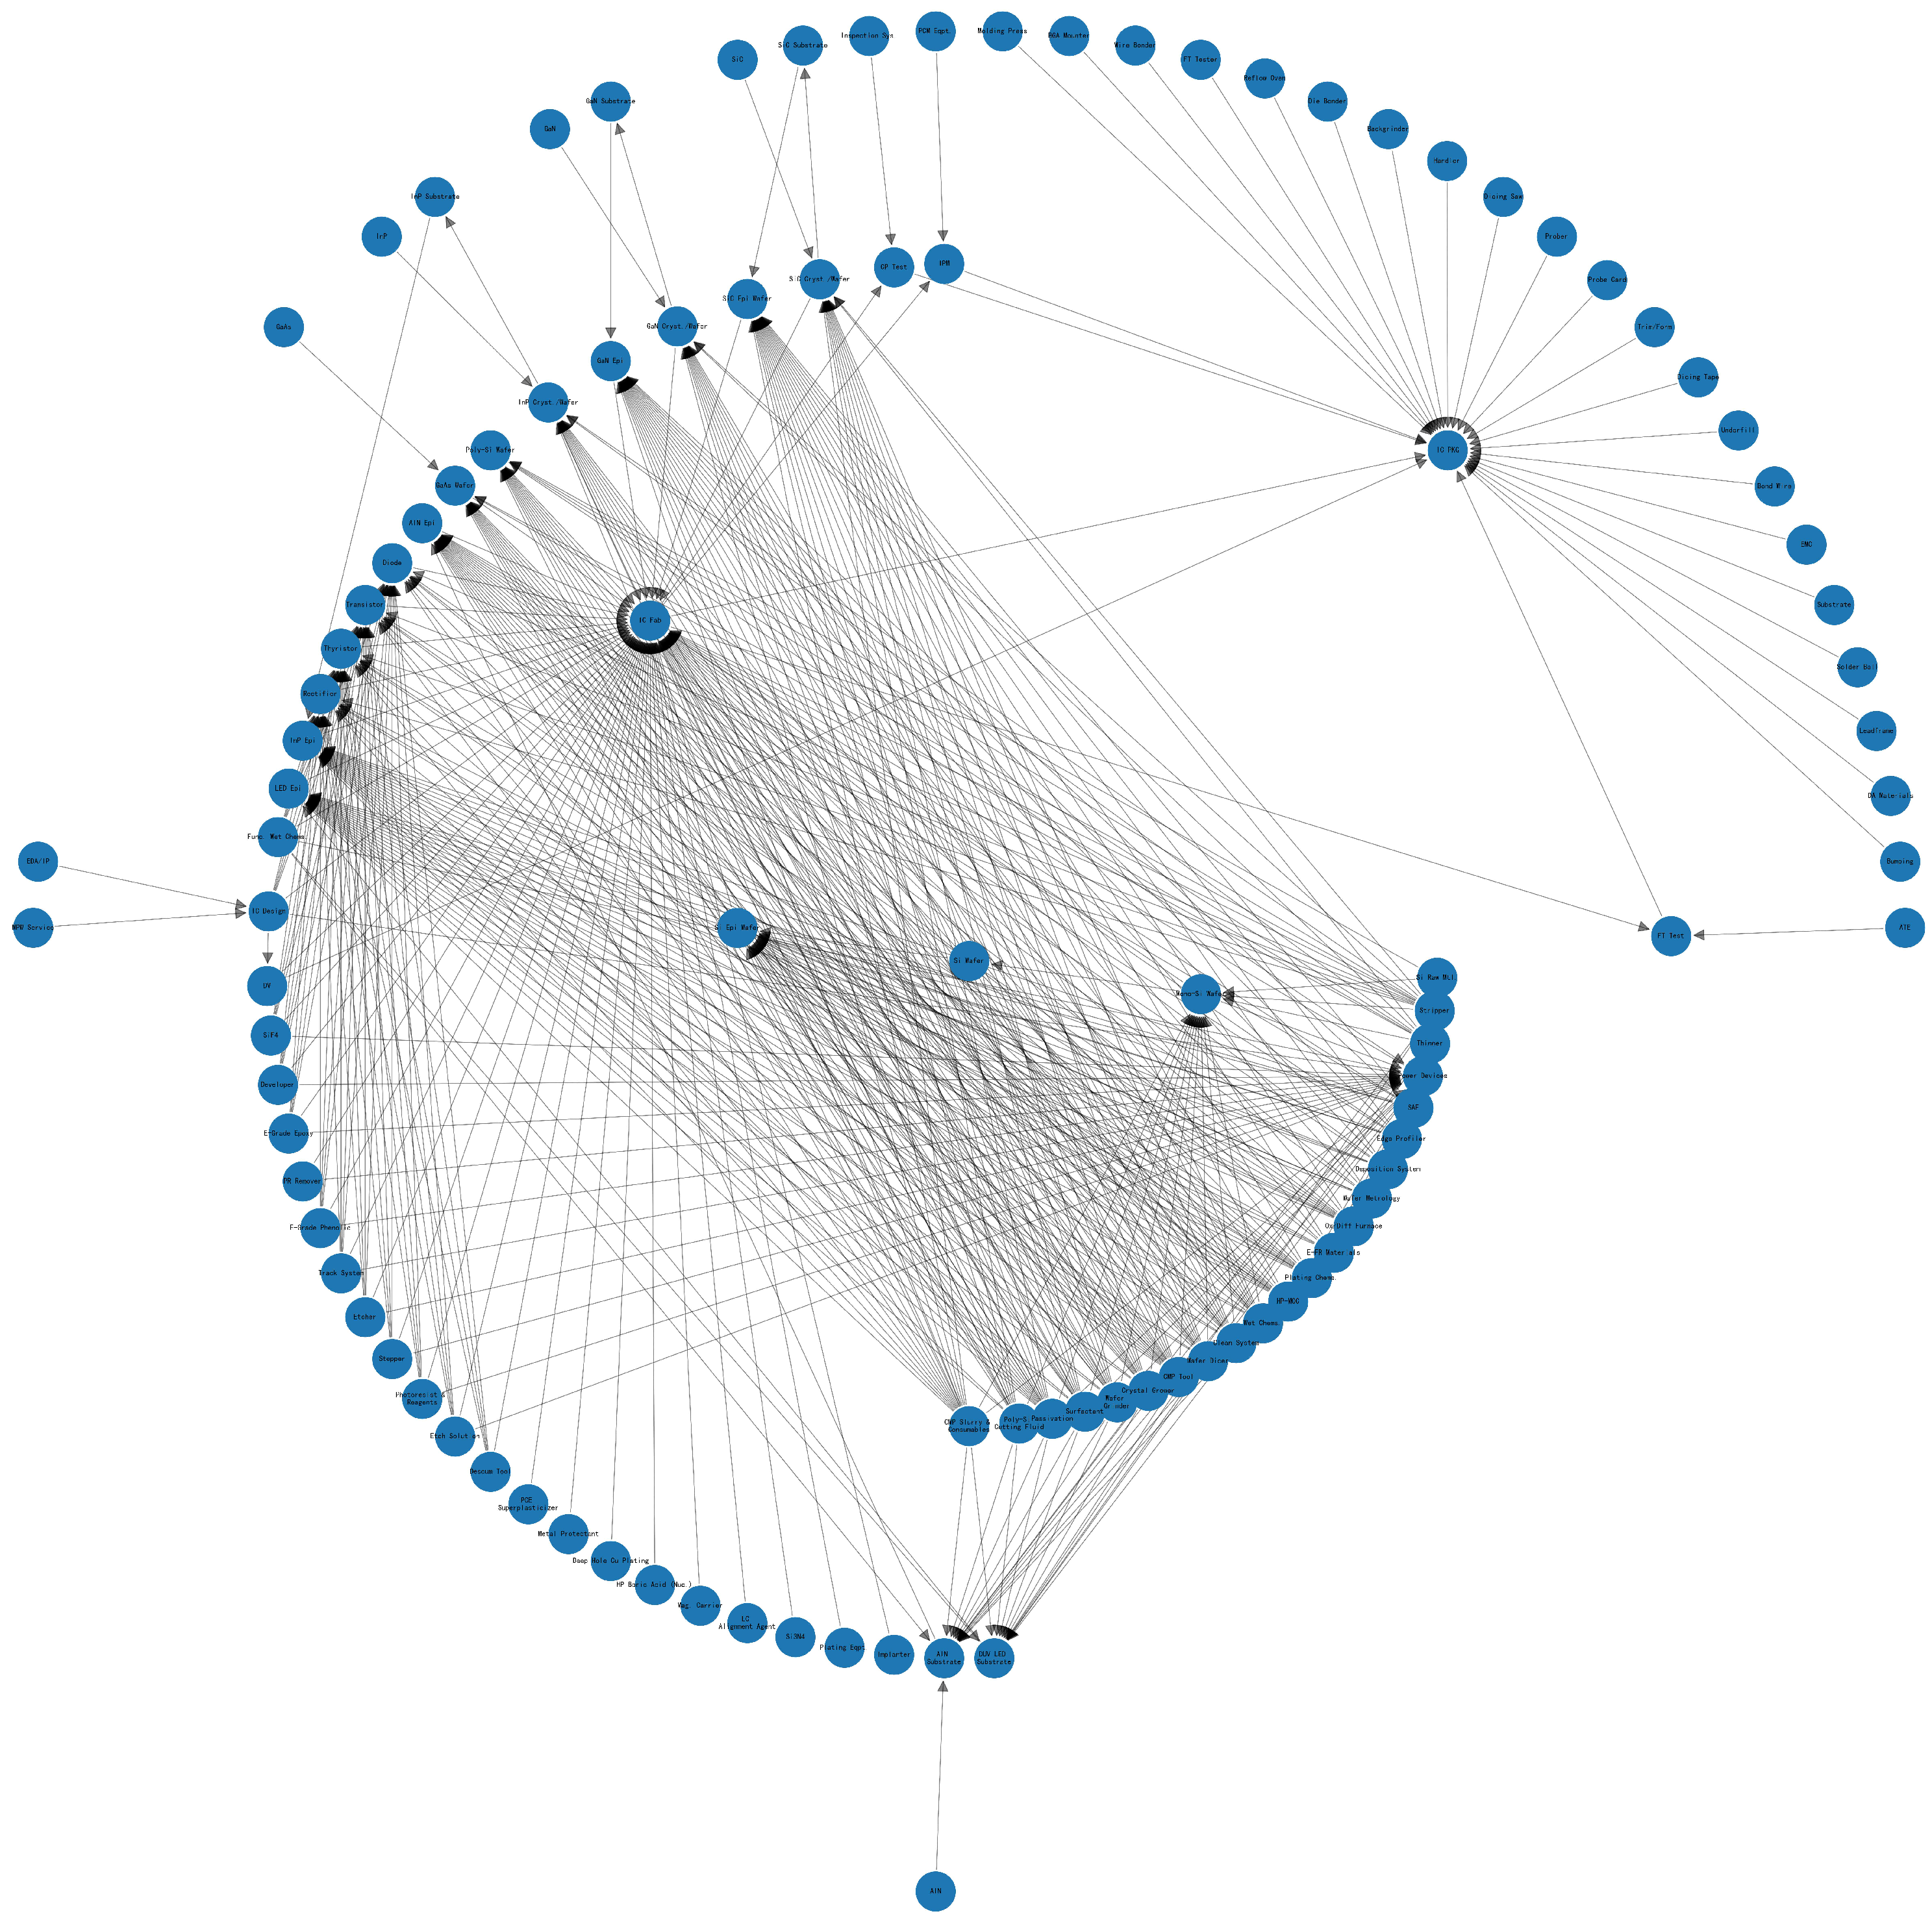
Figure 5, where the depth of the edge color represents the frequency of risk event transmission between industries; the darker the color, the more frequent the risk event transmission. Only risk propagation times greater than 100 are shown. The risk event path with the highest transmission frequency is from “95 Integrated Circuit Manufacturing” to “99 Wafer Testing”, with a total of 4025 transmissions. The downstream industrial chain risks can be traced back to “53 Gallium Nitride Epitaxial Wafer”, “51 Silicon Carbide Epitaxial Wafer”, “50 Silicon Epitaxial Wafer”, and “54 Indium Phosphide Epitaxial Wafer”, with transmission frequencies of 263, 251, 250, and 240 times, respectively. To reduce the industrial chain risks of China’s IC, particular attention should be paid to the “99 Wafer Testing” industry and its upstream industries.
As with the above analysis, high-risk industries also include “90 Power Semiconductor Devices”, with risks mainly stemming from “45 Polysilicon Wafer”, “49 Gallium Nitride Crystal and Single Crystal Wafer”, “46 Indium Phosphide Single Crystal and Wafer”, and “47 Silicon Carbide Single Crystal and Wafer”. In this study, industries with relatively high risks also include “52 Aluminum Nitride Epitaxial Wafer” and “55 LED Epitaxial Wafer”, with 1069 and 1053 risk events occurring, respectively.
4.2.2. Risk Node of Supply Chain Network
Similar to the identification analysis of risk nodes in the industrial chain, this study also counts the number of risk transmission of enterprises that experience risk events and classifies the risk enterprises into four levels according to the quartile of the number. The specific classification is shown in
Table 5.
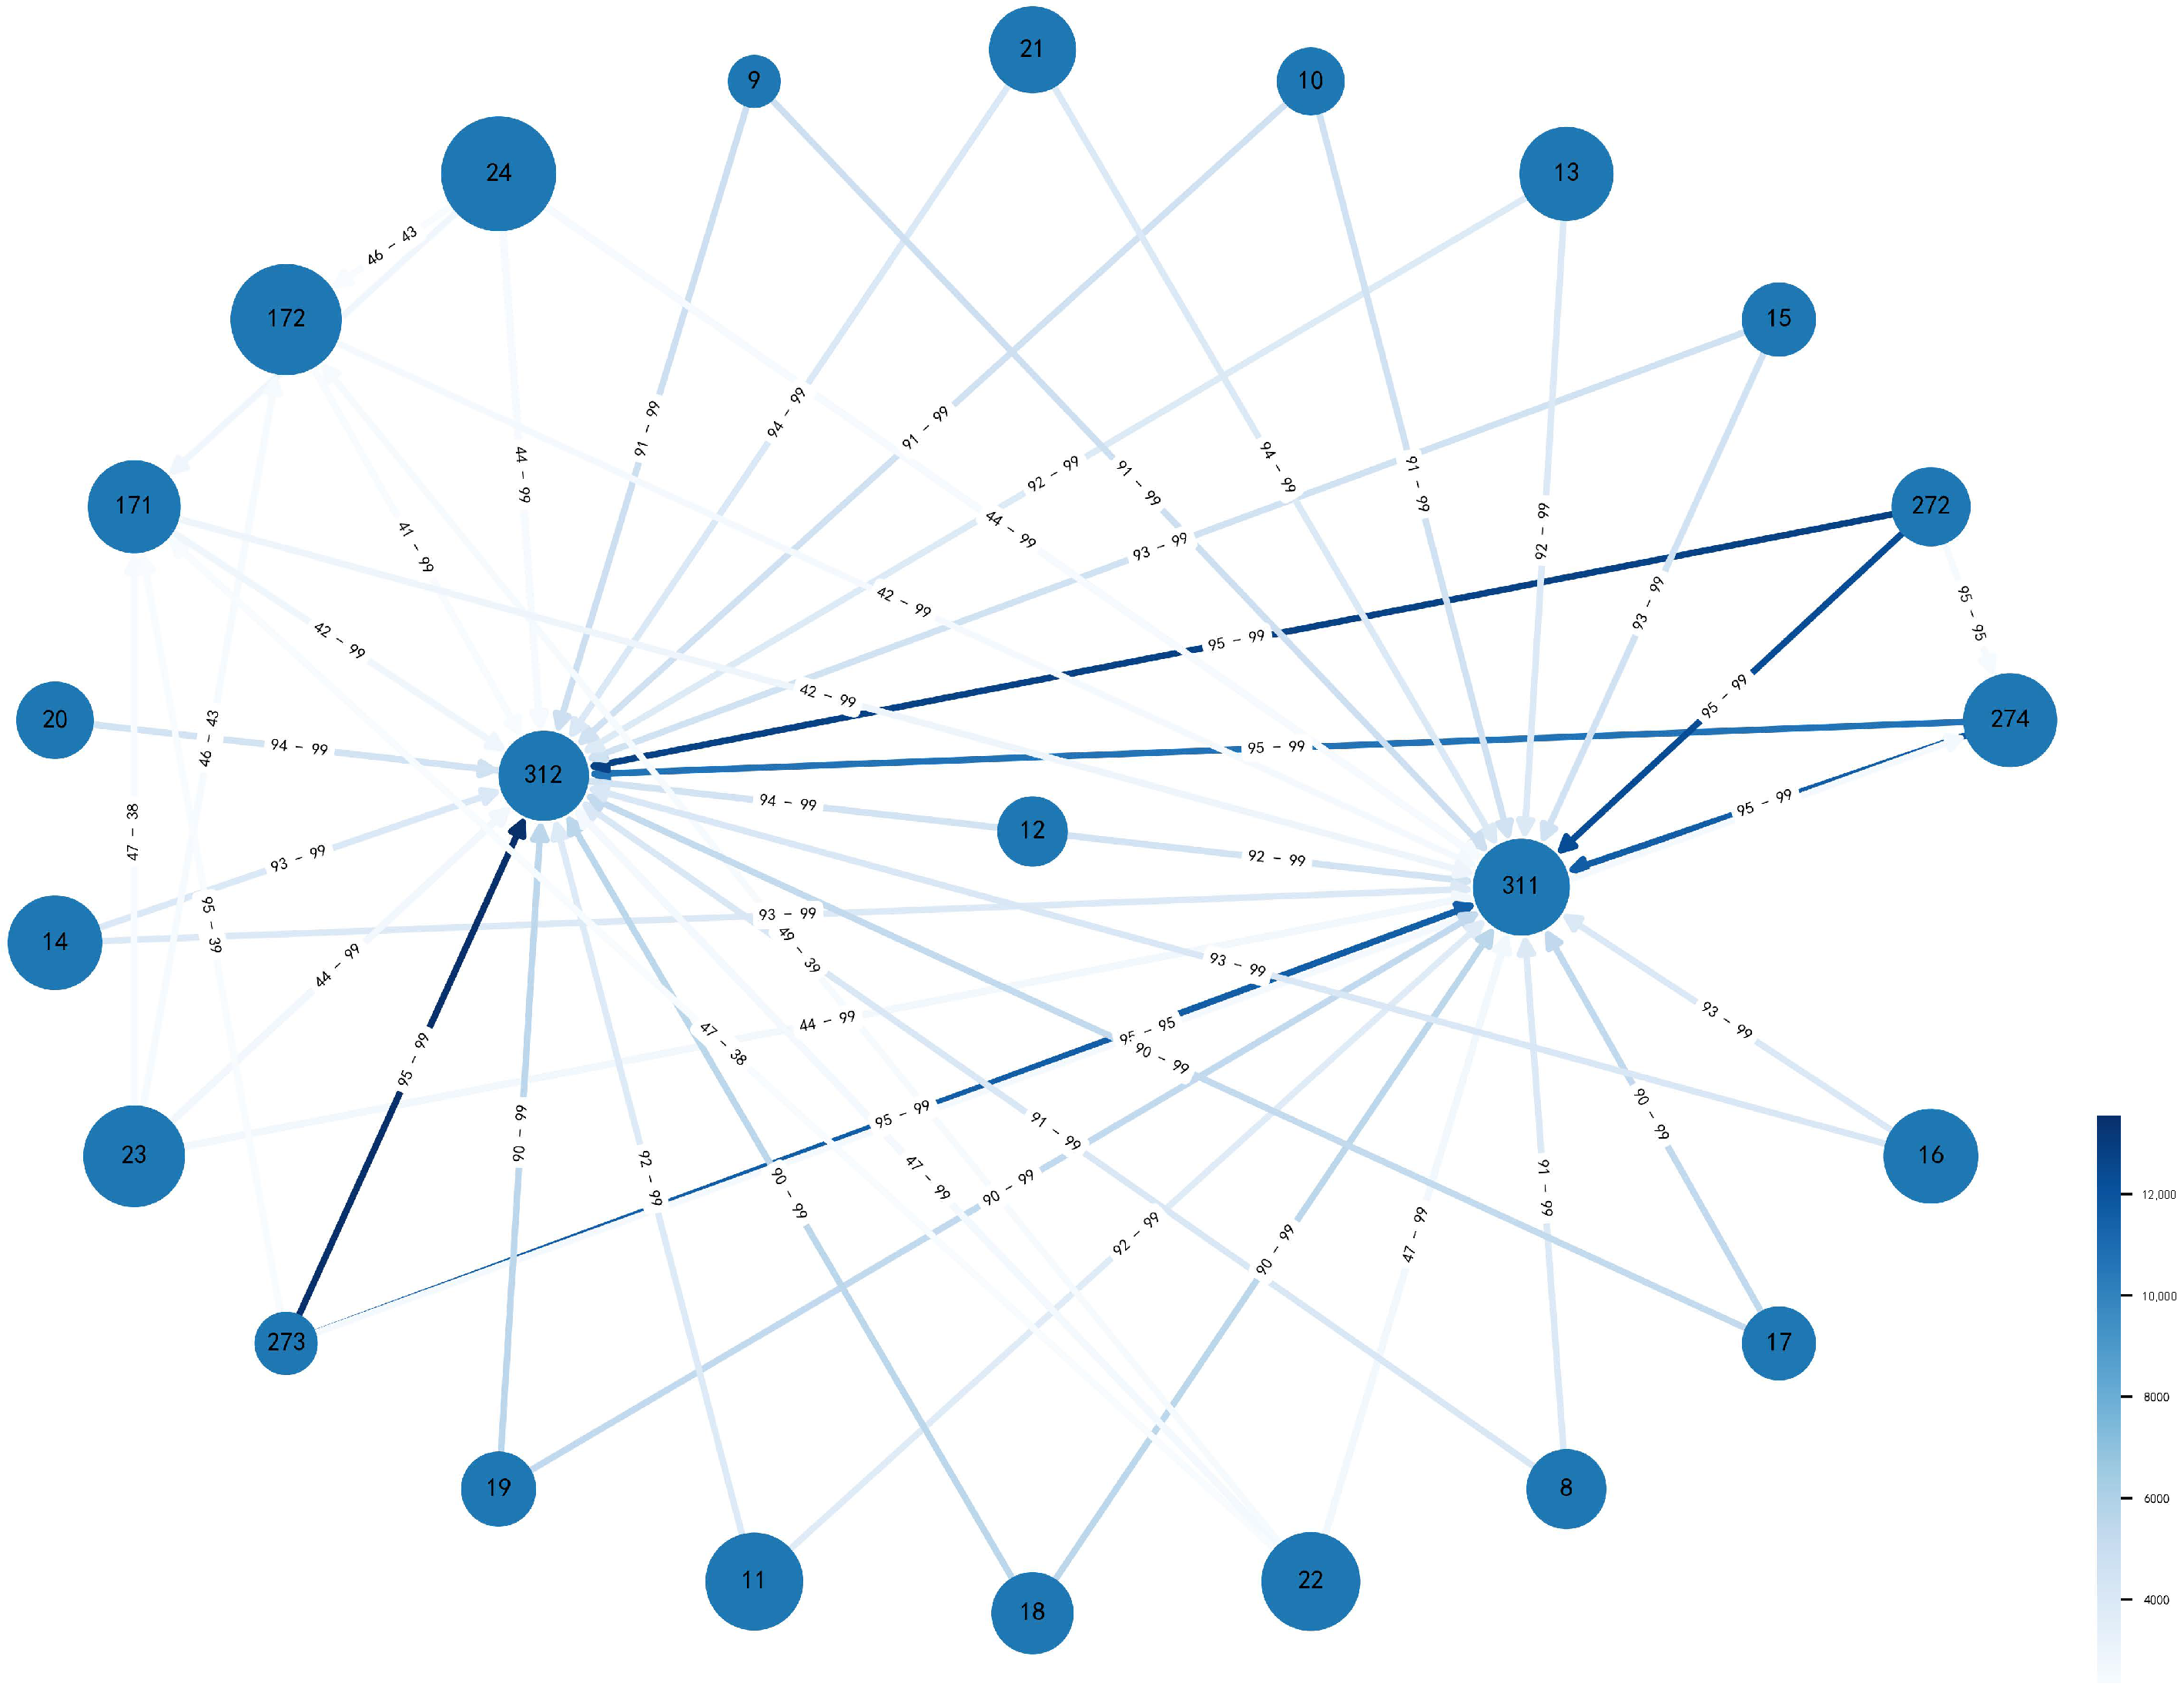
This study also tallied the risk event transmission among enterprises. As shown in
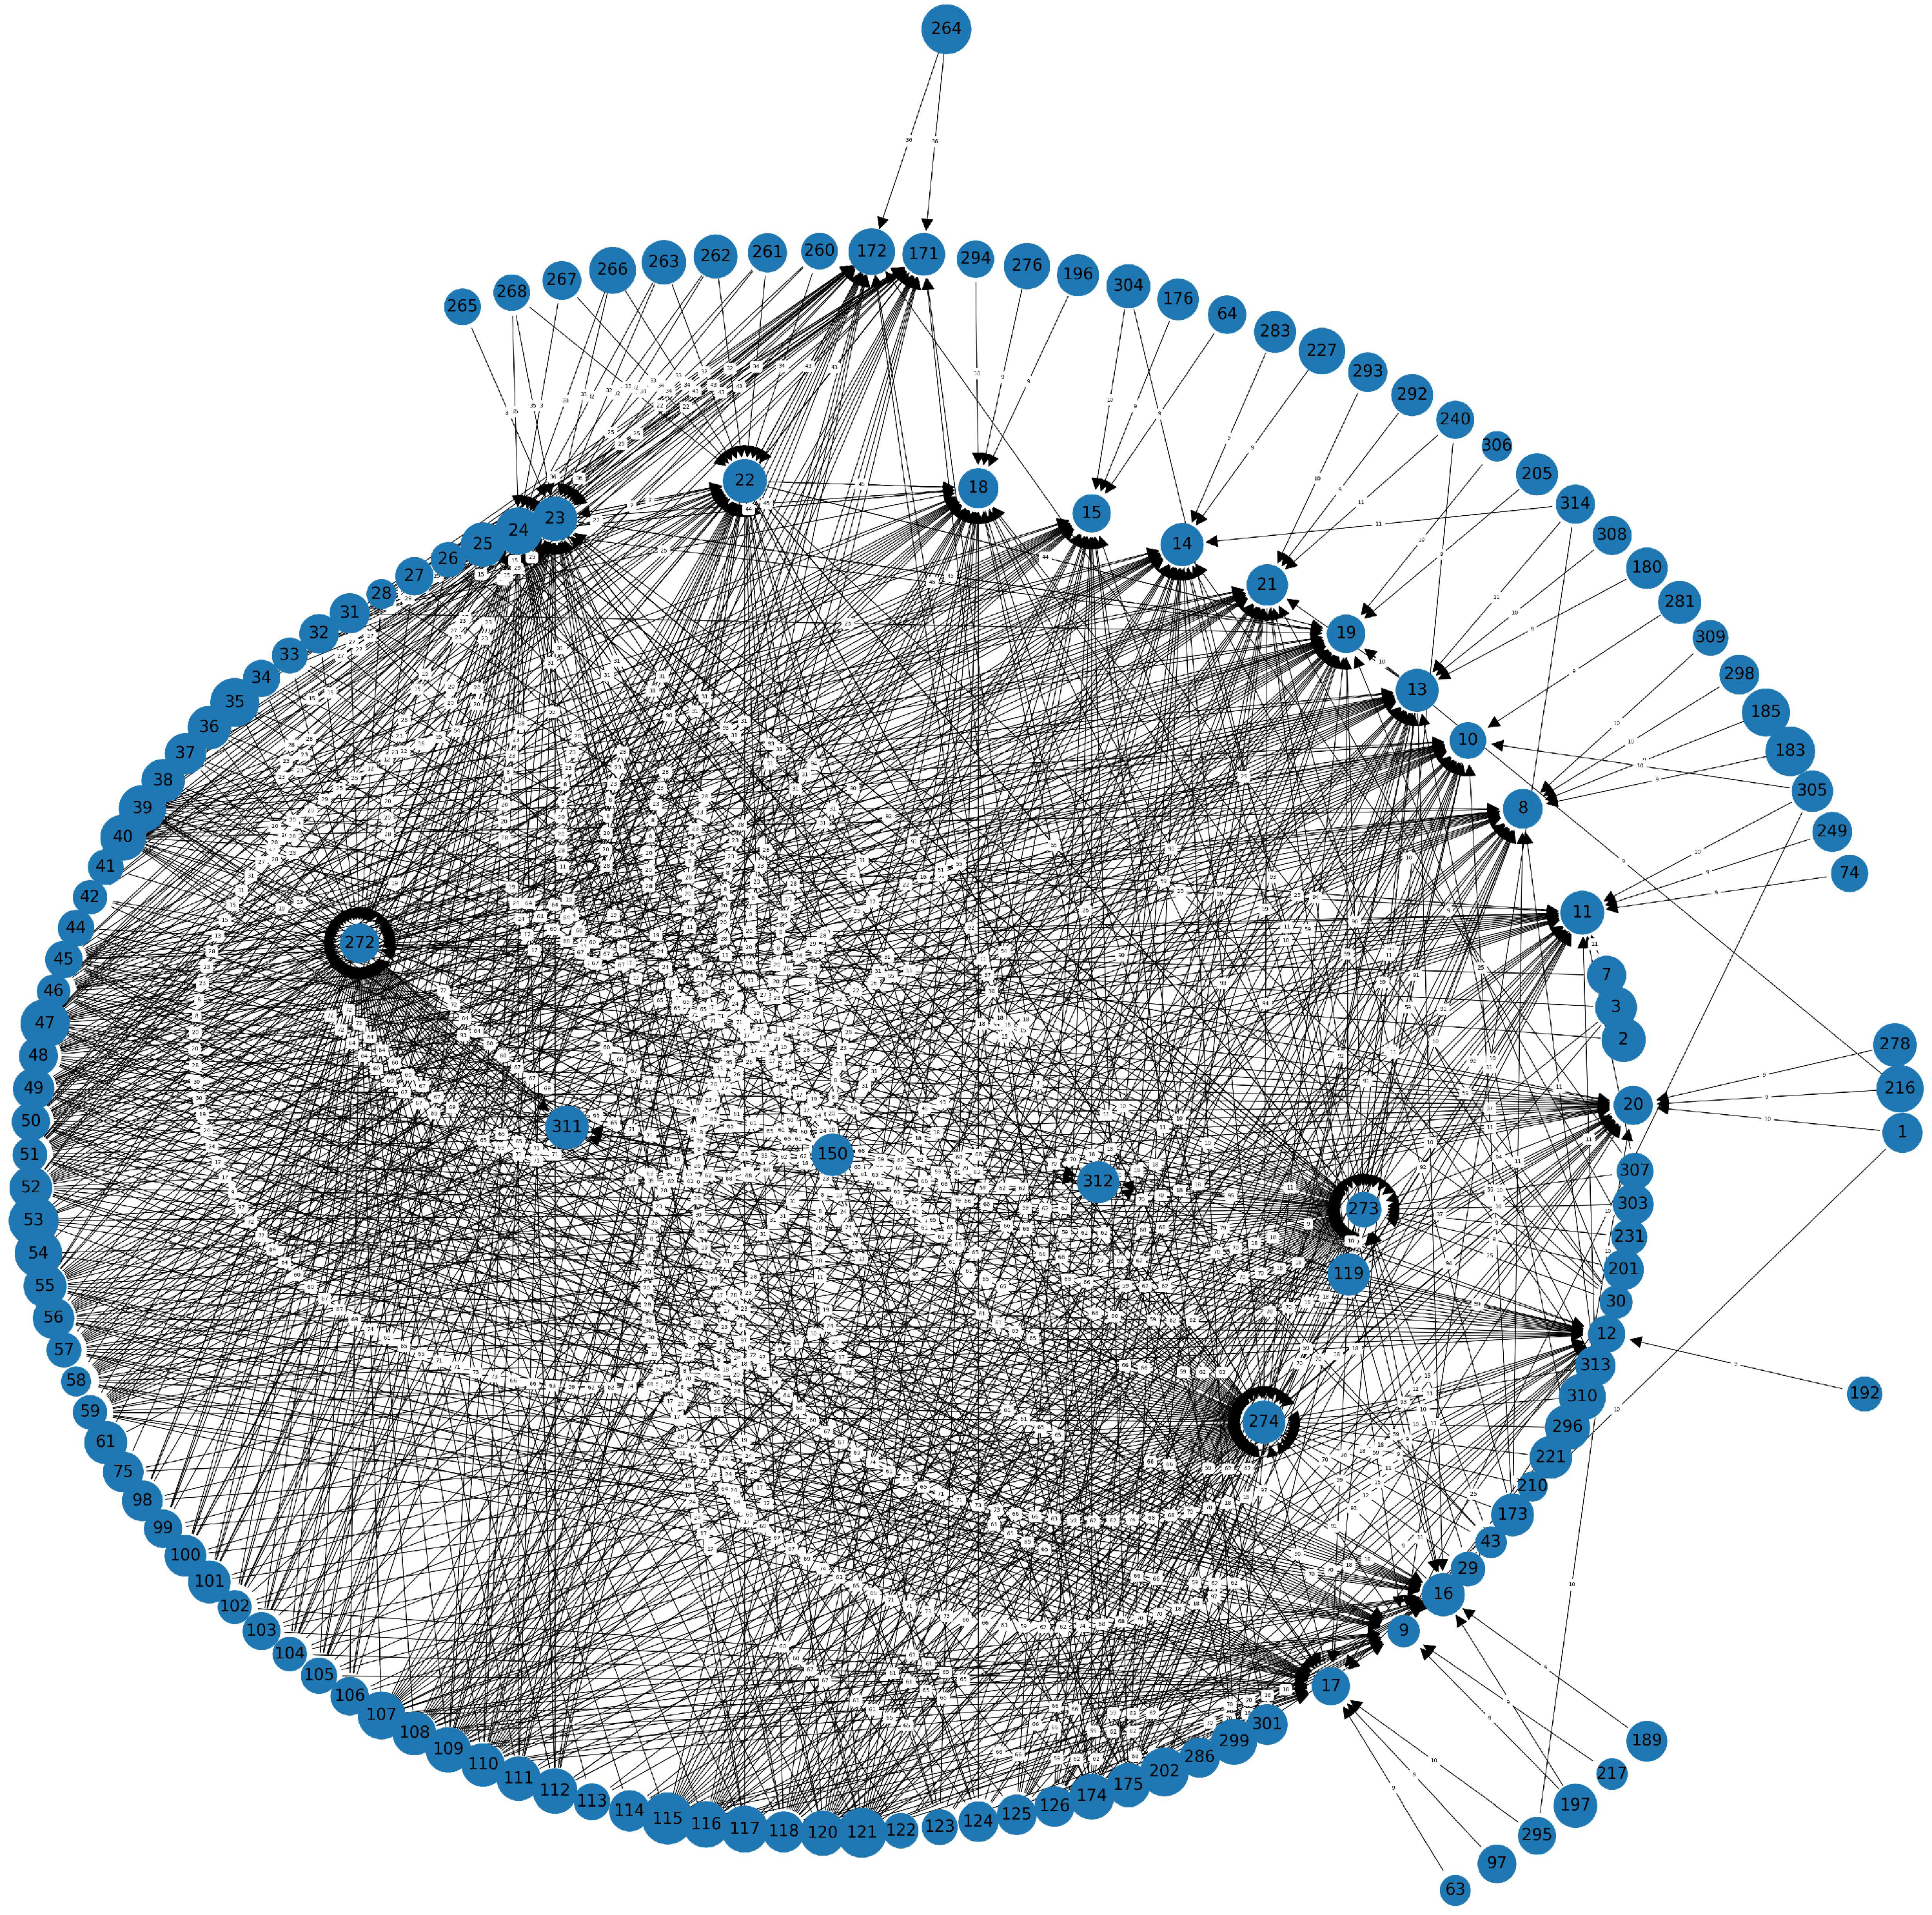
Figure 6, only the risk transmission paths with more than 130 occurrences are displayed in the figure. The path with the most risk transmission occurrences is from enterprise 273 to enterprise 312, corresponding to the industries “95 Integrated Circuit Manufacturing” to “99 Wafer Testing”, with a total of 753 occurrences. The second is from enterprise 272 to enterprise 312, corresponding to the industries “95 Integrated Circuit Manufacturing” to “99 Wafer Testing”, with a total of 710 occurrences. It can be seen that the high-risk enterprises in the “99 Wafer Testing” link of the simulated IC supply chain in this study mainly include enterprises 272, 273, 274, 311, and 312. Moreover, this link is basically consistent with the “99 Wafer Testing” risk chain in the industrial chain risk analysis.
Apart from the “99 Wafer Testing” risk chain, other chains with relatively high risks also include the chain from enterprise 18 to enterprise 312, corresponding to the industries from “90 Power Semiconductor Devices” to “99 Wafer Testing”, with a transmission frequency of 308 times. This chain corresponds to the transmission path of the industrial risk analysis in the industrial chain regarding the “90 Power Semiconductor Devices” industry risk.
4.3. Influence Factors of IC Industrial Chain–Supply Chain Resilience
Through the analysis of the benchmark scenario, 363 risk events are ranked, and the top 95 events were selected. Observing the types of the eight parameters in this study, it is found that three of them are Boolean value types, so the L36 mixed level orthogonal table is selected for experimental design in this paper. Through the L36 mixed orthogonal table design, this study completed the significance test of all influencing factors with only 36 experiments, significantly saving computing resources.
For each experiment, this study tested the above 95 risk events and repeated the simulation for each risk event 10 times, thus obtaining 34,200 sets of experimental data. Based on these experimental data, this study conducted a variance analysis of the four system performance evaluation indicators proposed in
Section 3.2.4. The significance analysis results of all influencing factors are shown in
Table 6.
Based on
Table 6, this study identified the significance of eight influencing factors for the four system performance indicators and drew the main effect chart for the influencing factors with significant impact to show the impact of the influencing factors on the system indicators.
First, the purchasing strategy and size preference have a significant impact on only one of the four indicators.
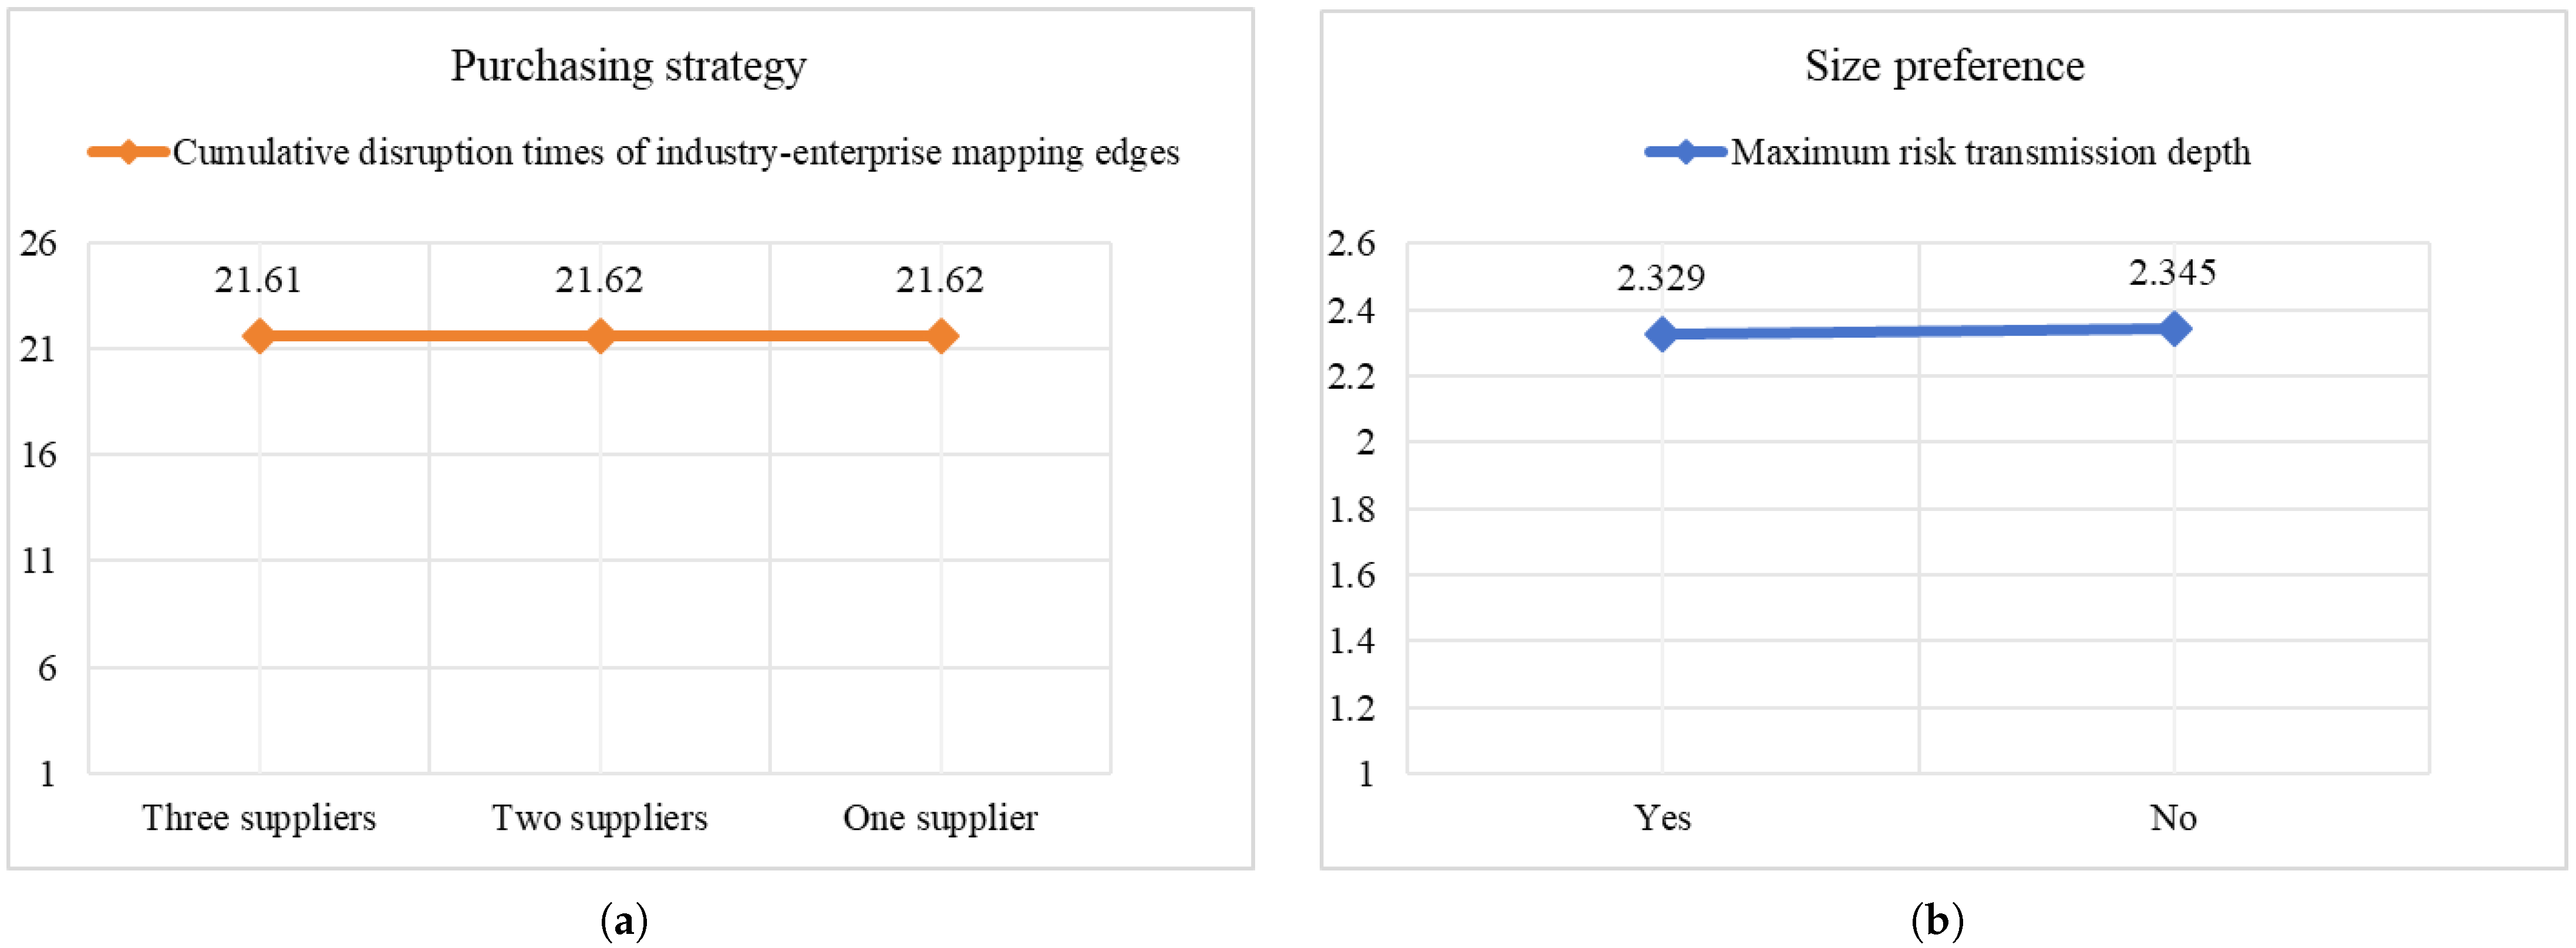
Figure 7 shows the detailed effects of the two factors, respectively. As can be seen from
Figure 7a, an increase in the number of suppliers will cause cumulative disruption times of industry–enterprise mapping edges to slightly decrease. Multiple suppliers allow the enterprise to maintain its supply level in the event of a risk to one of the suppliers. From
Figure 7b, it can be seen that the maximum risk transmission depth expands when there is no scale preference because the cooperation among enterprises will be more dispersed in the absence of scale preference, so it is easier to transmit risks.
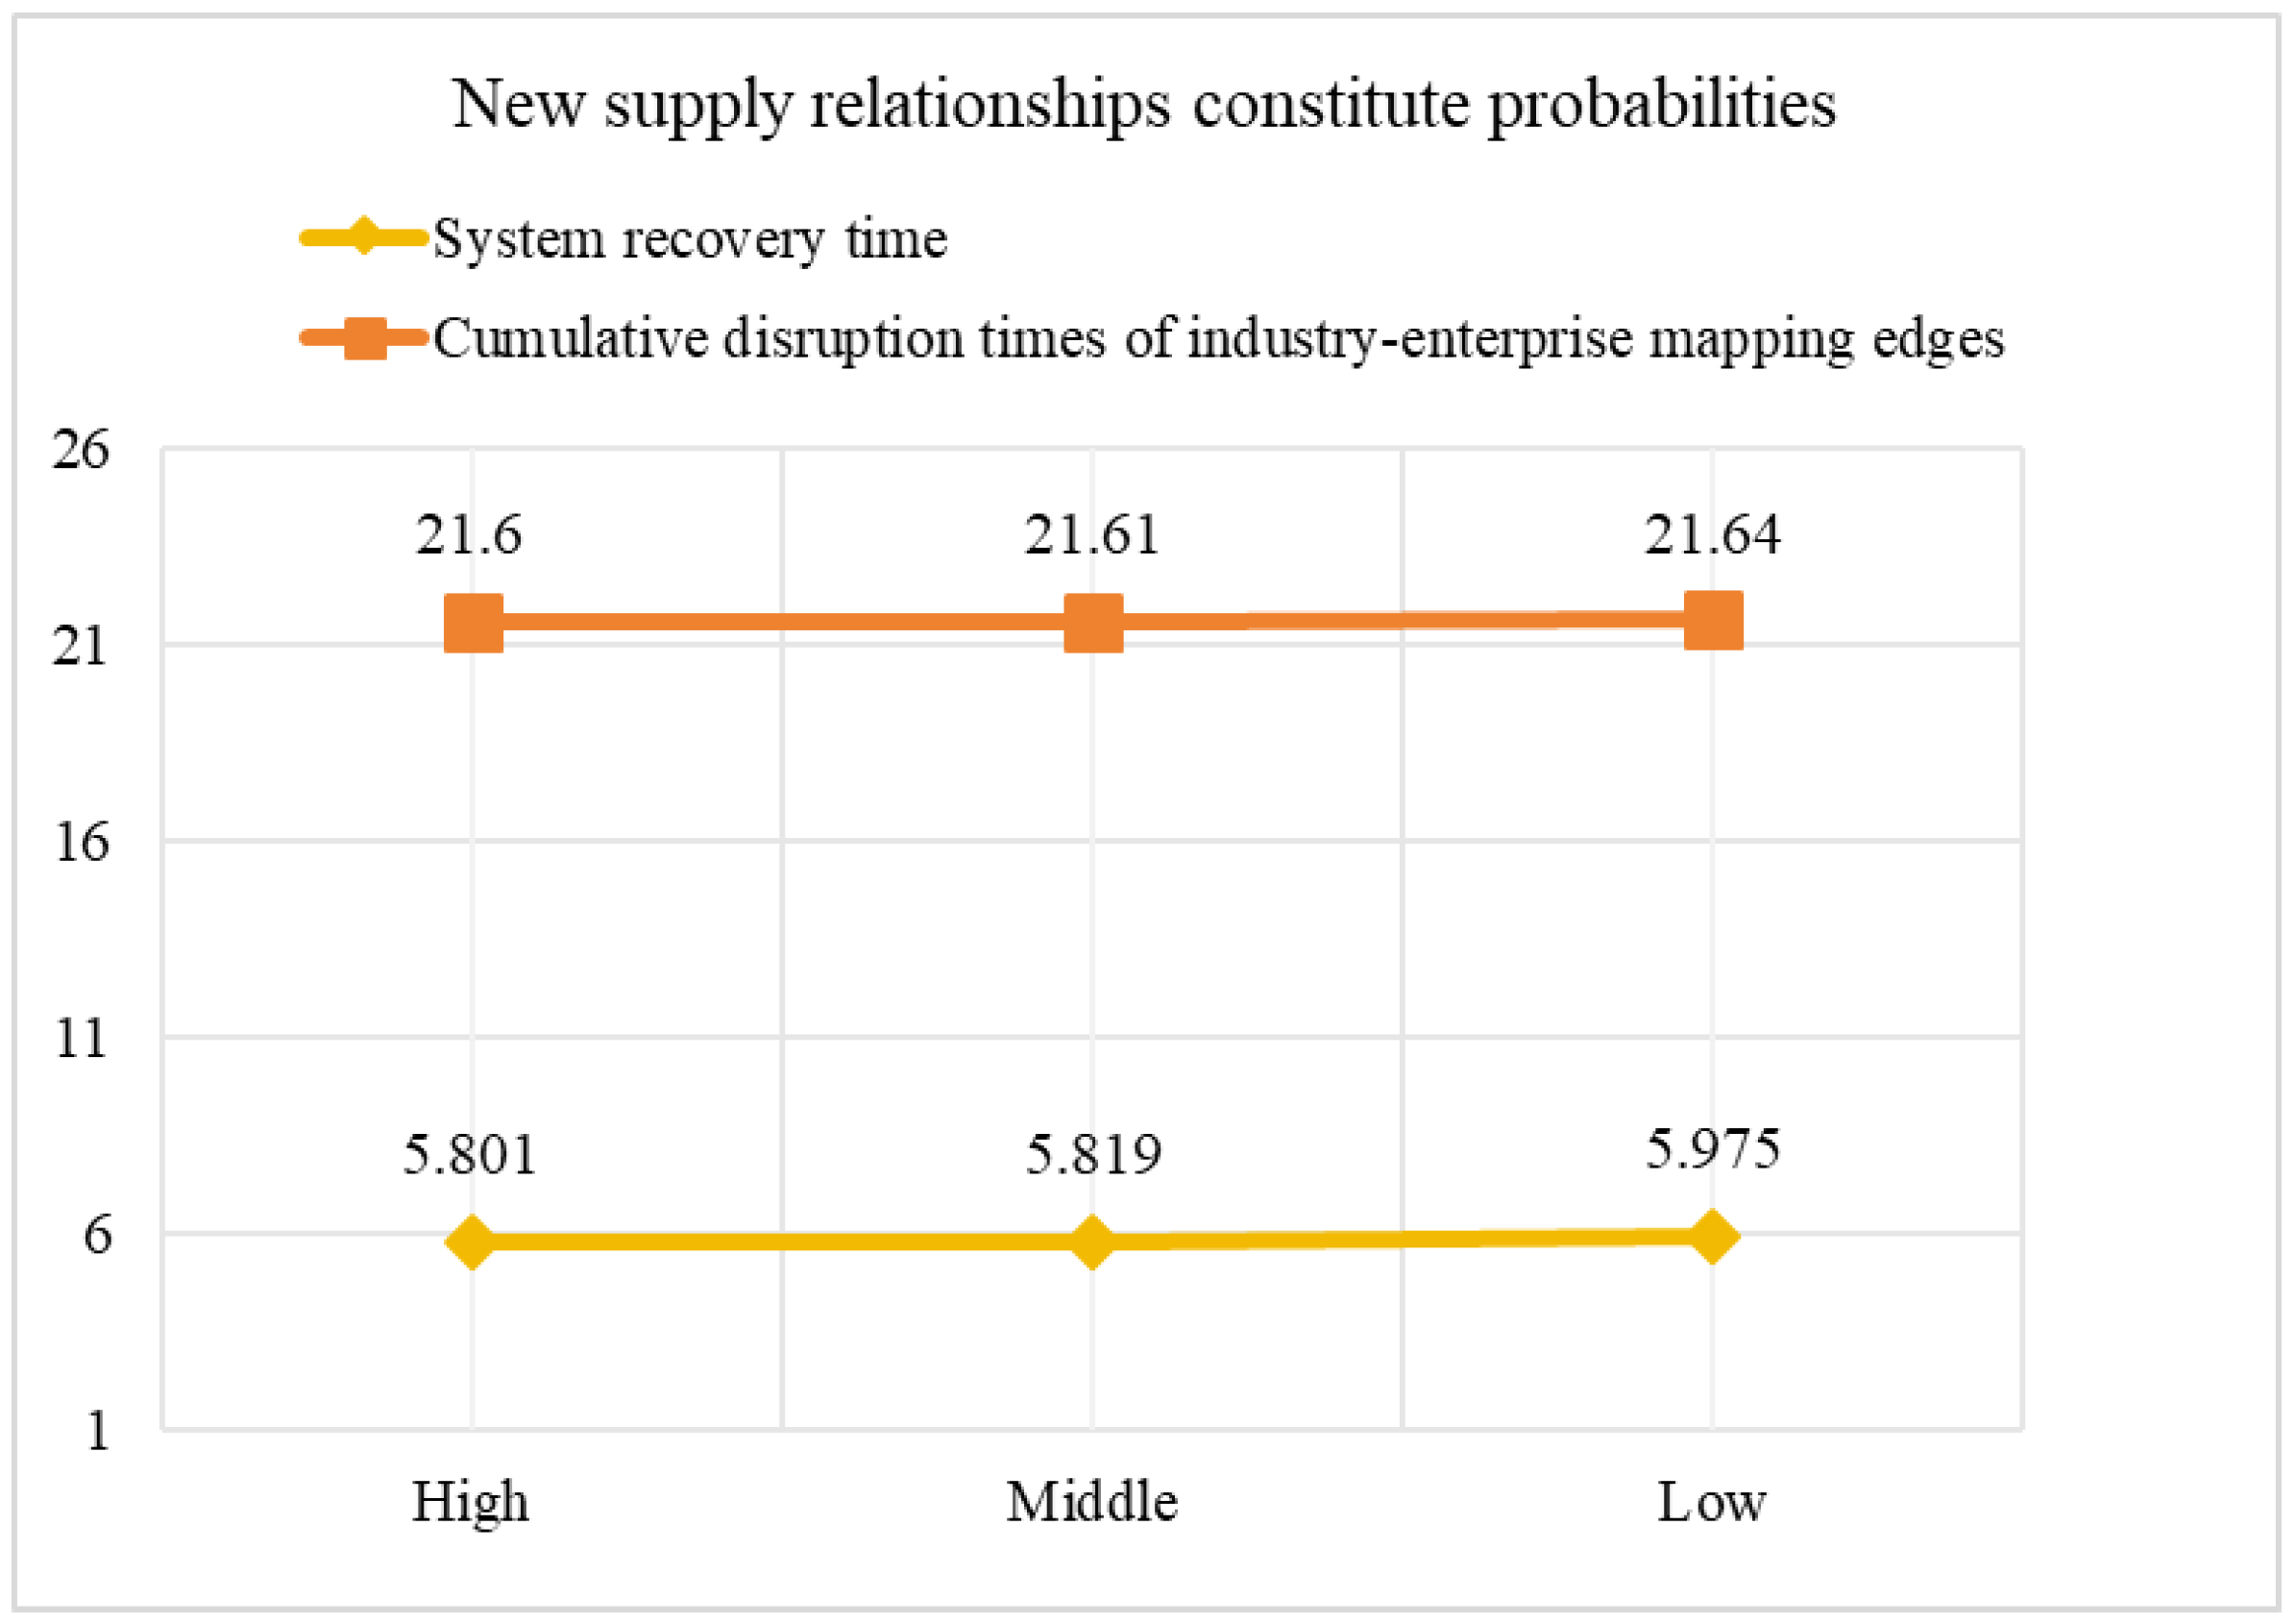
Next is the probability of forming new supply relationships. As is shown in
Figure 8, this factor only significantly impacts the system recovery time and the cumulative disruption times of the industry–enterprise mapping edges. As the value of the probability of forming new supply relationships increases, both indicators show a downward trend. The easier-to-achieve new cooperation will enable the system to return to normal more quickly. At the same time, this will also shorten the cumulative duration for companies in a risky state within the system.
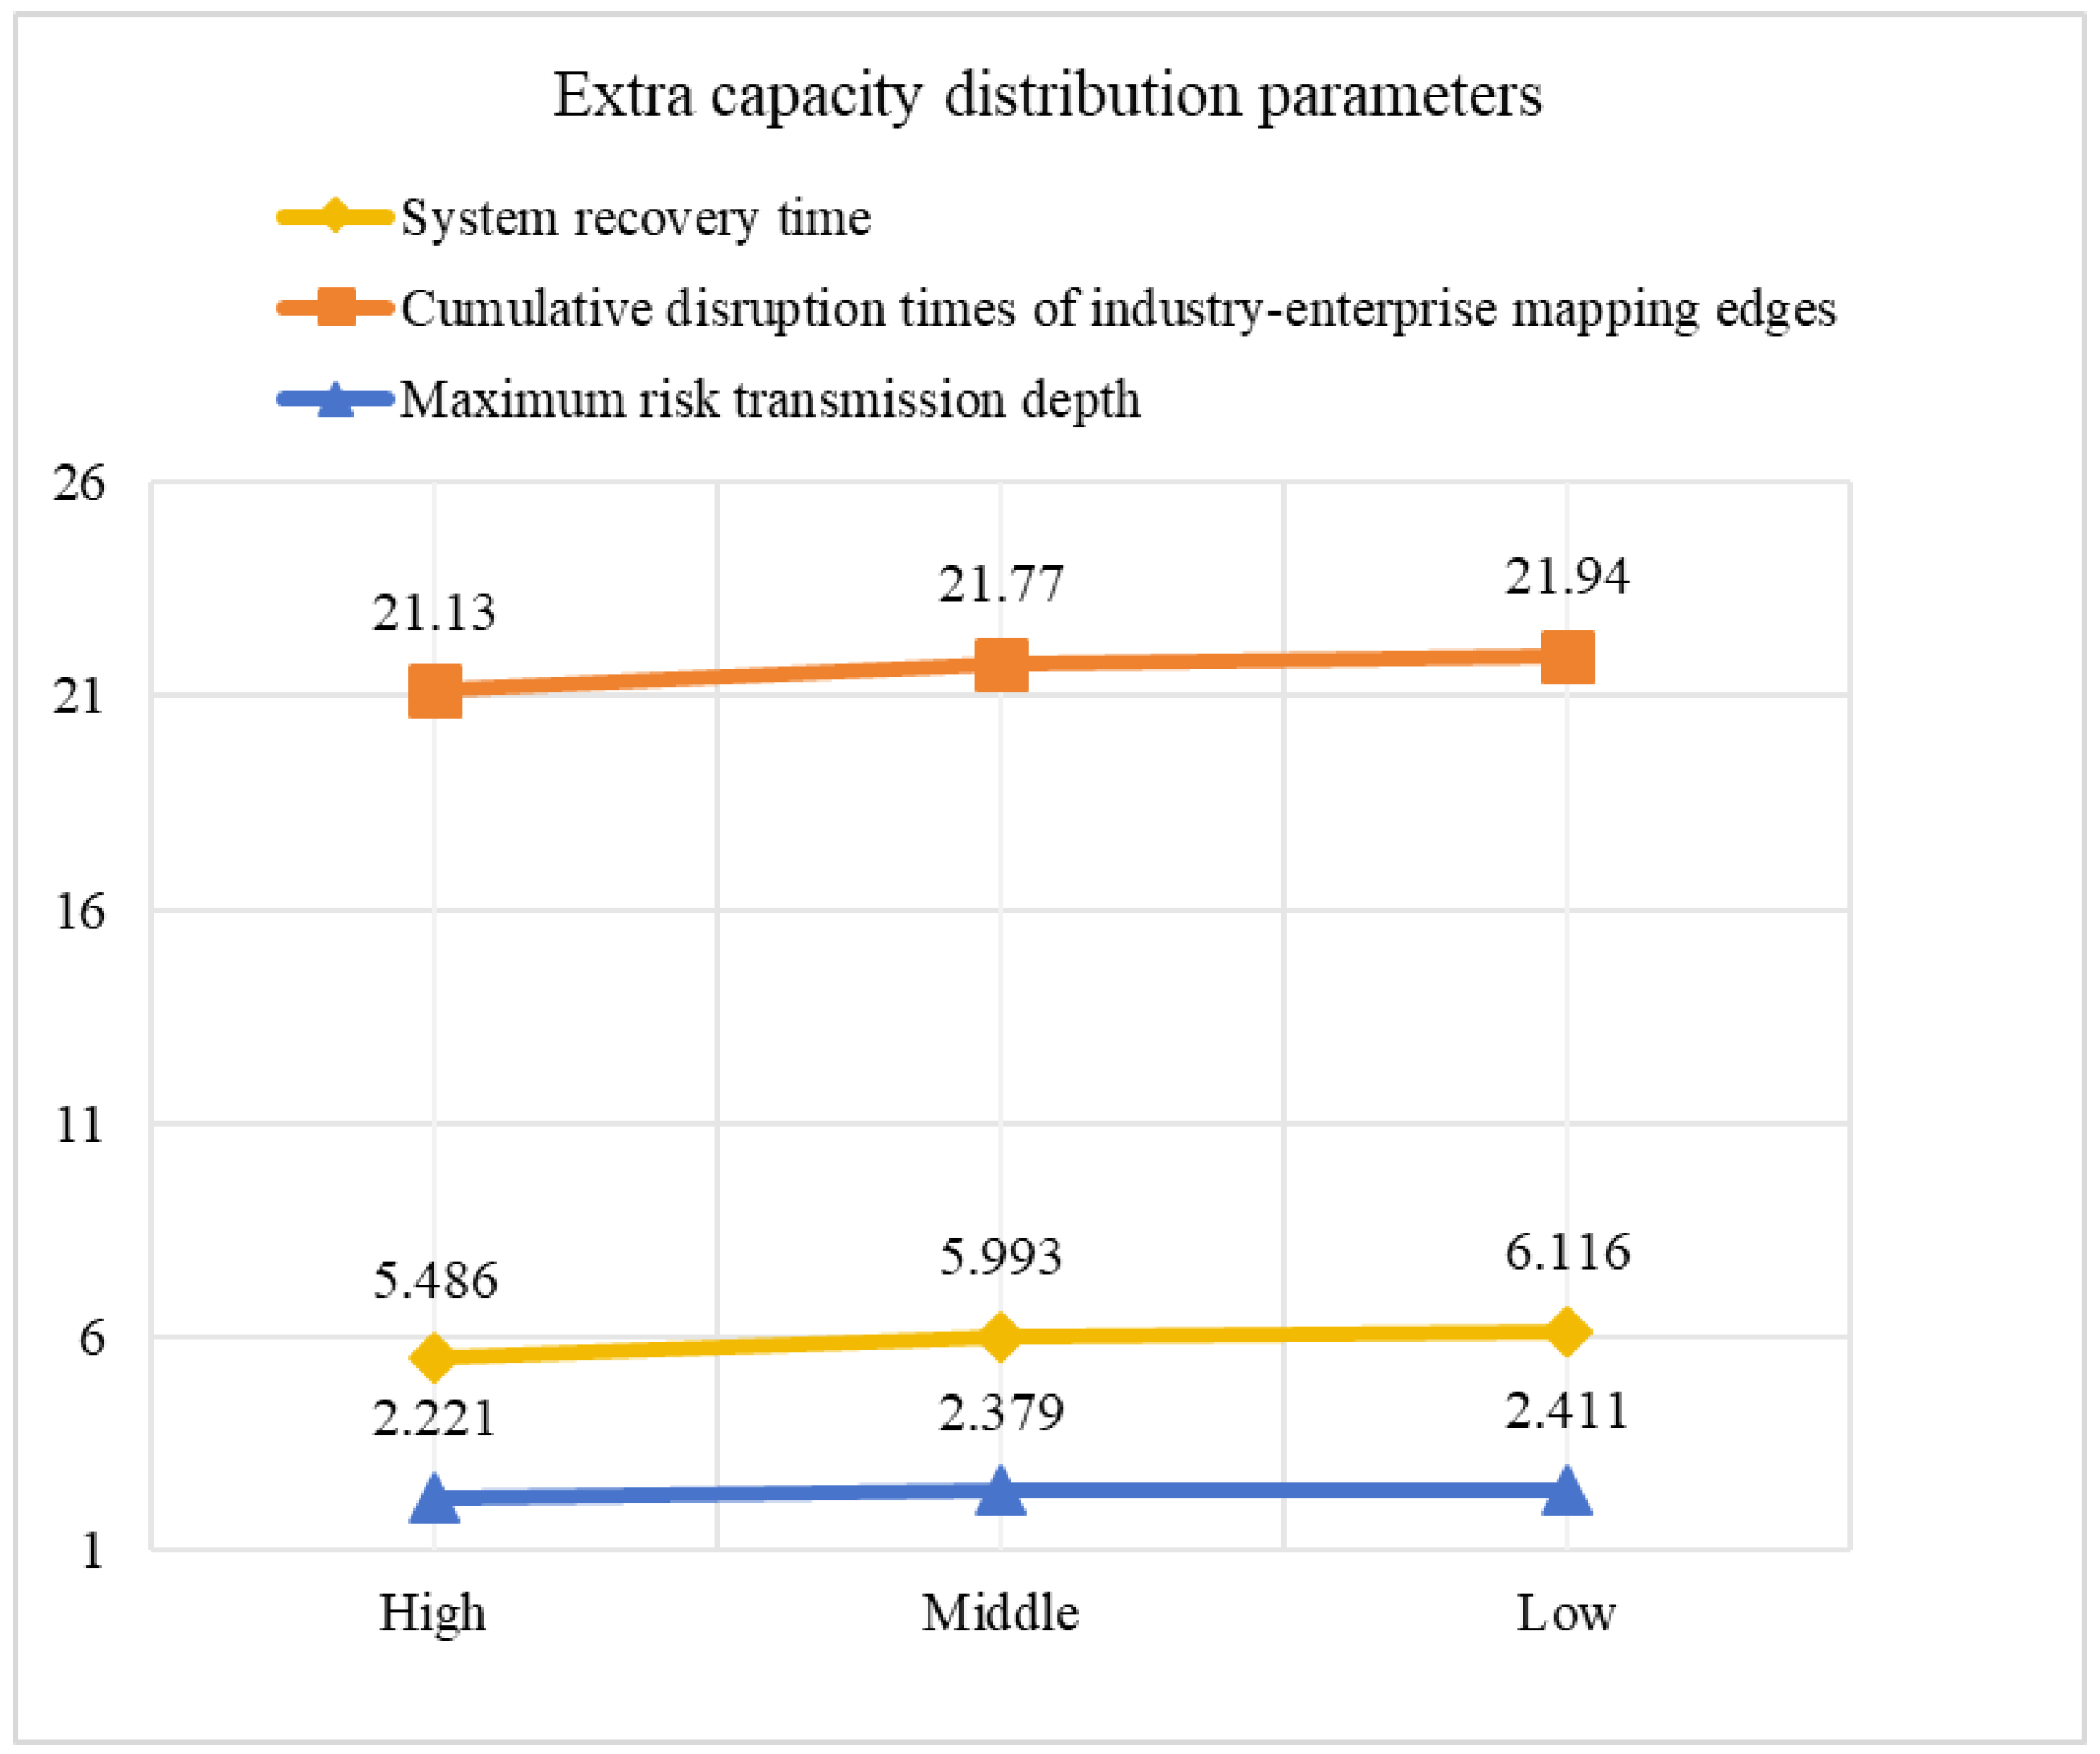
Then comes the distribution parameter of extra production capacity, which significantly influences three indicators: the system recovery time, the cumulative disruption times of industry–enterprise mapping edges, and the maximum risk transmission depth. As shown in
Figure 9, as the additional production capacity distribution parameters increase, all three indicators show a certain degree of decline. A larger distributed parameter indicates that the enterprise will have more surplus capacity. This will enable these enterprises to receive more supply applications and thus generate more new partnerships. Thus, the risk enterprises can restore their supply more quickly, and the system can return to normal more rapidly from the risk situation.
Finally, the preference for existing connections and the extra capacity distribution type are found to exert a significant influence on all four system metrics. As shown in
Figure 10a, the four system indicators in the case of connection preference are significantly higher than those in the case without connection preference. The preference for cooperation leads to the formation of clusters in the supply network. As mentioned earlier, this preference makes enterprises vulnerable to risks due to their excessive reliance. Therefore, this will lead to an increase in the depth and duration of the spread of risks.
Figure 10b illustrates the impact of two types of extra capacity distribution on the four indicators. The values of all four system metrics under uniform distribution are lower than those under normal distribution. By eliminating the low-redundancy weak points inherent in normal distribution, the uniform distribution of extra capacity prevents the concentration of risks in localized areas and avoids cascading failures, thereby achieving superior overall resilience at the system level.
Among the eight factors, the two influencing factors of the maximum number of attempts and the maximum try time step have no significant impact on the four indicators. This might be because the risk transmission chain usually recovers before the enterprise’s attempts run out as it successfully finds a replacement, or it is terminated due to the complete lack of feasible paths within the network. In this case, a larger number of attempts and try steps does not have any effect on the resilience performance of the system.
4.4. Summary of Experimental Results
Based on the analysis of the above experimental results, the following conclusions can be drawn in this study.
- (1)
The existence of connection preferences is a double-edged sword.
While preference for existing connections can reduce transaction costs and build trust, it also creates dense clusters within the supply network. This concentration makes the system more vulnerable to widespread, deep-level disruptions when a key node within a cluster fails, as evidenced by its negative impact on all resilience metrics. This finding aligns with the concept of supply chain complexity and risk propagation, where interconnectedness can amplify disruptions [
1]. Zhang et al. [
47]’s research also confirmed that the inherent resilience level of hub-and-spoke networks is generally quite low.
- (2)
Extra capacity is crucial to the resilience performance of the industrial chain–supply chain system.
The type and parameters of extra capacity distribution are paramount. A uniform distribution of extra capacity across enterprises proved superior to a normal distribution. It prevents the formation of low-redundancy weak links that can become failure hotspots, thereby enhancing overall system resilience by ensuring a more balanced and robust capacity buffer. Chopra and Sodhi [
48]’s research indicates that a supply chain without redundant capacity may be more cost-effective, but it is also more vulnerable. This underscores a fundamental principle in resilience engineering: the strategic deployment of slack resources to absorb disruptions.
- (3)
Trade-offs between resilience and efficiency in procurement strategies.
The selective impact of purchasing strategy and size preference highlights a classic trade-off between lean operations and robust design. While multi-sourcing and a lack of size preference can increase operational efficiency and reduce certain risks, they may also lead to a more connected and complex network that facilitates the spread of disruptions. Decision-makers must balance these competing objectives. This trade-off is a central theme in the supply chain resilience literature, where strategies like dual or multi-sourcing are widely recommended to mitigate supply-side risks but require careful management to avoid increasing network complexity [
49].
- (4)
The speed of reconnectivity is critical for the resilient performance of the system.
The significance of the new supply relationship constitute probability emphasizes that the speed at which broken connections can be re-established is a critical determinant of how quickly the system can recover and how much cumulative damage it incurs. This ability to swiftly reconfigure the supply network is a key attribute of a resilient system, often referred to as agility or adaptive capacity [
50]. Research on supply chain resilience emphasizes that recovery speed is a crucial component of overall resilience, directly impacting financial and operational performance after a shock [
51,
52].
4.5. Implications for Economics and Management
Based on the risk simulation and resilience analysis of the IC industrial chain–supply chain, this study identifies the following core implications for economic policy and managerial practice:
- (1)
Promoting the construction of balanced industrial redundant capacity is crucial for the resilience of the industry.
The experiments show that higher redundant capacity and a more balanced distribution of redundant capacity are beneficial to system resilience. This requires policy-makers and business managers to go beyond traditional “lean” thinking and strategically plan and build capacity-backup systems for critical materials at the national and industrial levels.
- (2)
Enterprises should avoid over-reliance on existing connections and establish diversified cooperation networks.
The experimental results show that the preference for existing connections can significantly deepen the depth and scope of risk propagation. This warns that enterprises need to take the initiative to break path dependence and avoid the formation of closed cooperation cliques. Managers should formulate regular supplier evaluation and rotation mechanisms, actively establish contacts with emerging enterprises of different sizes and different regions, and build a more open and diversified supply network to enhance the structural resilience to external shocks.
- (3)
Supplier diversification is a key strategy for avoiding disruption risks.
The significant impact of purchasing strategies on the cumulative number of disruptions reveals the huge risks of over-concentrated procurement. In the selection of suppliers, a comprehensive evaluation system should be established. Beyond scale and geography, managers must assess suppliers’ financial and operational health, along with their sub-tier chains’ transparency and resilience. This is key to systematically reducing supply base risk.
- (4)
Building digital collaboration capabilities is beneficial for the resilience performance of the system.
The simulation results show that the probability of new supply relationship formation has a significant impact on the recovery speed, highlighting the extreme importance of supply chain visibility and collaborative efficiency. Business managers need to increase investment in infrastructure such as industrial internet platforms and supply chain digital twins and enhance real-time visibility throughout the entire chain. This ensures that when an interruption occurs, enterprises can quickly identify alternative solutions and efficiently establish connections with potential partners.
5. Conclusions
Geopolitical conflicts and frequent natural disasters have brought increasing instability to the IC industry, which has a highly globalized supply chain layout. Against the backdrop of intensifying Sino-US competition, this study selected China’s IC industrial chain–supply chain system as the research object. By using simulation methods, it identified the key nodes in China’s IC industrial chain and supply chain from a dynamic perspective and analyzed the factors that have the greatest impact on the resilience of the entire system.
This study was designed to assess and enhance the resilience of China’s IC industrial chain and supply chain. To achieve this, a three-layer network model was developed, integrating the industrial chain structure, enterprise-level supply relationships, and a mapping between industries and enterprises. This model synthesizes authentic data obtained through web crawling and structured information processing, offering a realistic representation of the IC system. In the second phase, the model was employed to simulate the propagation of risk events across the network and to evaluate how enterprises respond to disruptions. By analyzing the outcomes of these simulations, the study identifies key factors that significantly influence the system’s ability to withstand and recover from risk events, thereby providing actionable insights for building a more resilient IC industry chain–supply chain.
Taking the disruption of each edge of the industry–enterprise mapping network as the initial risk event, a large number of simulation experiments are carried out, which not only promotes the research of IC industrial chain–supply chain resilience but also provides decision-making theoretical basis for IC industry decision-makers and enterprise managers. There are still some limitations in this study. Firstly, due to the scarcity of real-world enterprise supply relationship data, the supply chain network was constructed using rule-based synthetic generation rather than empirical data, potentially limiting the model’s alignment with actual industrial structures. Secondly, the agent decision-making model adopted simplified behavioral and attribute assumptions, omitting nuanced factors such as financial constraints, dynamic adaptation, and real-time market interactions, which may reduce the realism of agent responses under disruptions. Thirdly, the research focused exclusively on China’s IC industry, neglecting the global interconnectedness of semiconductor supply chains, thereby limiting insights into cross-border risk propagation and international policy implications. Finally, the model is not calibrated and validated against historical disturbance events. The model is validated only by common-sense conclusions, which may affect the robustness of the recovery performance of the simulations.
To address these limitations and advance the field, future studies should pursue several promising directions. One critical step is integrating real-world supply chain data—such as transactional records and partnership networks—to enhance model accuracy. Additionally, ABM should be refined to incorporate more sophisticated attributes, including dynamic learning, financial viability, and multi-level decision-making mechanisms, allowing for more realistic simulations of enterprise behaviors. Expanding the geographical scope to include global IC supply networks would help evaluate the impact of international geopolitical events and multi-regional policy interactions on resilience. Finally, empirical validation through case studies of historical disruptions is also essential for verifying and refining model parameters.
