Article

Coordinated Development of Urban Transportation Structure Optimization and Energy Conservation, and Emission Reduction Under the Low-Carbon Background in Lanzhou, China

1
School of Traffic and Transportation, Lanzhou Jiaotong University, Lanzhou 730070, China
2
School of Rail Transportation, Gansu Vocational and Technical College of Communications, Lanzhou 730207, China
*
Author to whom correspondence should be addressed.
Systems 2025, 13(1), 34; https://doi.org/10.3390/systems13010034
Submission received: 25 November 2024 / Revised: 21 December 2024 / Accepted: 3 January 2025 / Published: 6 January 2025

Abstract

:
Under the context of low-carbon travel, promoting the green and environmentally friendly upgrade of urban transportation and optimizing urban transportation structures are of great significance in reducing carbon emissions. Exploring the pathways and methods to achieve green and low-carbon goals in urban transportation is a key research objective. Accordingly, this study constructs a multi-objective optimization model to optimize the transportation structure of Lanzhou City and quantitatively verifies the optimization effects through carbon emission calculations and coordination evaluations. The results indicate that (1) optimizing urban transportation structures can reduce energy consumption and emission levels but cannot achieve the “carbon peaking” goal; (2) developing urban rail transit has a significant positive impact on energy saving and emission reduction; (3) the development of green transportation is closely integrated with and mutually influenced by slow-moving transportation, showing both synergy and constraints; and (4) under the comprehensive restriction scenario, despite higher energy consumption and emission values, better coordination is achieved, making it the most suitable optimization plan aligned with the green transportation development concept.

1. Introduction

In an era of rapid economic and social growth, addressing how to effectively mitigate the impacts of the greenhouse effect, energy crises, and environmental pollution has become crucial for achieving sustainable, high-quality development. This is a pressing concern worldwide. China has responded by setting ambitious targets to reach peak carbon emissions by 2030 and to achieve net zero carbon emissions by 2060. Research indicates that urban areas contribute approximately 75% of global carbon emissions—a figure expected to increase with ongoing urbanization. Urban transportation, a major consumer of energy and a significant source of emissions, connects various subsystems within cities. Thus, it plays a pivotal role in influencing both carbon emissions and urban development [1].
There is a strong correlation among energy consumption, carbon emissions, and pollution from urban transportation. To fundamentally reduce these impacts, it is essential to synchronize all three aspects through scientifically sound and reasonable transportation policies. This approach will promote the sustainable development of urban transport systems. Particularly under the “dual-carbon” strategy, which prioritizes green and low-carbon initiatives, focusing on achieving carbon peak targets holds significant practical importance. It is imperative to undertake research aimed at the synergistic optimization of these targets, facilitating effective strategies for energy conservation and emission reduction in urban transport.
Scholars from around the world have developed numerous modeling approaches to evaluate the energy consumption and emissions of transport systems, with a focus on assessment, prediction, and strategic planning. These models are crucial for analyzing environmental impacts and guiding policy and technology decisions in transportation. Bottom-up models are based on engineering and technological foundations, enabling detailed parameterization of different transport modes, processes, and living conditions. These models incorporate technological measures and policy inputs to facilitate multi-scenario predictions and analyses, essential for comprehensive environmental impact studies. The Long-range Energy Alternatives Planning System (LEAP) is employed to predict future energy demands, carbon emissions, and other environmental impacts [2]. LEAP is instrumental in assessing the feasibility and effectiveness of various energy policies and technological options, thereby aiding in strategic energy planning and sustainability assessments [3]. The Asia-Pacific Integrated Model (AIM) serves as a global integrated assessment tool focusing on climate change, energy, and environmental sustainability in the Asia-Pacific region. It is designed to analyze the effects of climate, energy, and other environmental policies, providing vital data for regional and global policy-making [4]. Finally, the Mines Energy for Environment and Economic Efficiency (MEDEE) model aims to analyze the environmental and economic impacts of various technological and policy choices within the energy system [5]. It offers insights that help decision-makers formulate more effective energy policies and optimize energy use, contributing to better environmental and economic outcomes [6,7].
Optimizing the transport structure for low-carbon travel involves integrating various analytical methods to analyze and plan for sustainable urban mobility [8,9]. Hierarchical analysis simplifies complex decision-making by structuring transportation options and their impacts on carbon emissions into different levels, allowing for systematic evaluation and prioritization [10]. System dynamics further enhances understanding by simulating the interactions between urban growth, transportation demand, and environmental impacts, revealing long-term trends and the potential effects of different policy measures [11,12]. Topological object element theory complements these approaches by modeling the structural relationships within the transportation system to identify key points that can influence travel behavior and emissions effectively [13,14]. Meanwhile, planning models utilize tools ranging from mathematical optimization to scenario planning, crucial for forecasting the outcomes of various transport policies and balancing multiple objectives such as emission reduction, economic growth, and cost efficiency [15,16]. These methods provide a comprehensive framework for urban planners and policy-makers to manage the rising travel demands of expanding urban areas and denser populations, without exacerbating environmental degradation. This integrated strategy aims to combine technological upgrades, infrastructural improvements, and policy incentives to promote green transport and achieve sustainable development [17].
The challenges identified in existing studies on urban transportation and carbon emissions highlight significant gaps that need addressing to enhance the accuracy and applicability of the research findings. The first issue pertains to the broad categorization used in macro-level studies. These studies often apply a single emission factor across diverse transportation scenarios, which oversimplifies the complexities of real-world transportation patterns. As a result, the precision of assessments suffers because such approaches do not account for the variability in vehicle types, fuel efficiencies, and traffic conditions found across different areas and times.
Secondly, micro-level studies frequently focus narrowly on specific road sections or intersections, typically under unique or controlled conditions. While these studies provide valuable insights into localized traffic dynamics and pollution contributions, their findings are often not scalable or directly applicable to broader contexts. This limitation restricts their usefulness in guiding larger-scale policy or infrastructural changes aimed at reducing energy consumption and emissions on a societal level.
Thirdly, many studies do not differentiate between core urban areas and suburban zones. This omission overlooks the distinct transportation needs and patterns that can vary dramatically between densely populated city centers and less congested suburban areas. The lack of detailed internal analyses within cities means that opportunities for targeted interventions in different urban zones are missed, potentially leading to less effective transportation planning and emission control measures.
Addressing these issues requires a more nuanced approach to transportation research that incorporates finer categorizations and differentiates more clearly between urban zones. Furthermore, expanding the scope of micro studies to reflect more typical or varied conditions could enhance the relevance of their conclusions, supporting broader energy-saving and emission-reduction goals.
This study aims to provide potential methods and feasible approaches for achieving a low-carbon and green transition in urban transportation. Lanzhou, a valley-type city in Gansu Province, China, is characterized by a dense population, high demand for transportation, and significant local carbon emissions during peak hours. With economic development, the number of private vehicles has been rising rapidly, while the share of public transportation remains high but faces severe congestion overall. The intensity of urban transportation carbon emissions continues to increase, necessitating urgent optimization and improvement in the transportation structure.
Based on the foregoing, this study develops a multi-objective decision-making model for optimizing the urban transport structure of Lanzhou, with a specific focus on minimizing carbon emissions.
In the process of selecting the model for carbon emission measurement, we consider that models based on the top-down approach lack consideration of factors related to different transportation modes and energy types, making them less suitable for scenario design and parameterization. Therefore, this study adopts a bottom-up model, which enables the parameterized configuration of various transportation modes and supports multi-scenario predictive analysis. The LEAP model—a tool extensively applied in energy and emissions analysis across various geographical scales and sectors, including industry [18,19], transportation [20,21], and electric power [22,23]—can be used to forecast energy demand, carbon emissions, and other environmental impacts, facilitating the evaluation of the feasibility and effectiveness of different energy policies and technological solutions. Thus, this study intends to utilize the LEAP model to calculate carbon emission levels.
The proposed model aims to assess carbon emissions, energy use, and pollution over the forthcoming decades. It incorporates entropy weight theory and the Technique for Order Preference by Similarity to Ideal Solution (TOPSIS) to evaluate the synergy of green transportation initiatives across different urban scenarios [24]. This assessment includes comparisons before and after optimization interventions and across the four main districts of the city under a baseline scenario [25].
By integrating these methodologies, this study not only quantifies the impacts of structural optimizations on urban transport but also provides actionable insights and viable strategies for advancing the low-carbon green transformation of urban mobility systems. This approach enhances both theoretical and practical understandings of sustainable urban transport development.

2. Study Area and Methodology
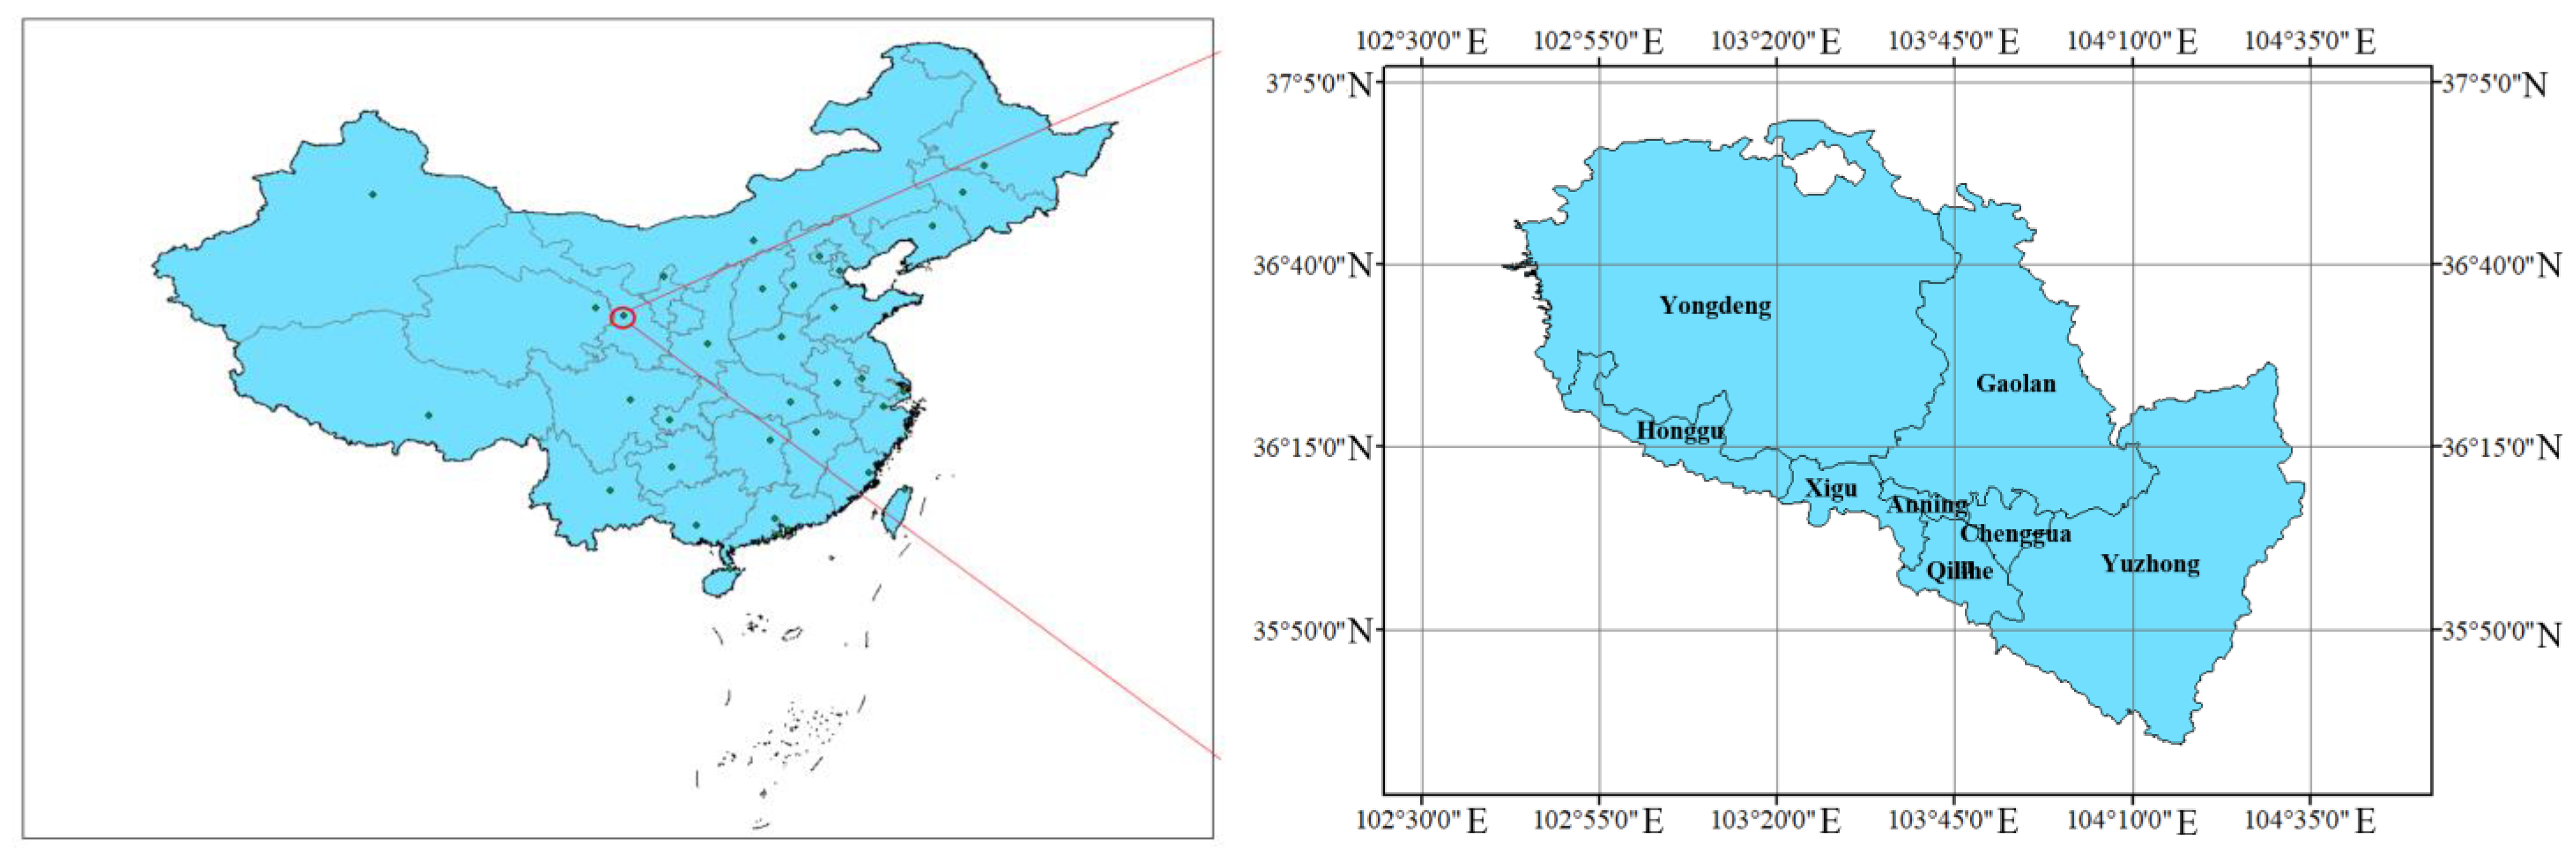
2.1. Study Area

Lanzhou, situated along the banks of the Yellow River in a semi-arid region with a temperate continental climate, serves as a pivotal economic and cultural hub in Gansu Province, China. Figure 1 illustrates the geographic location of Lanzhou. Historically recognized as an industrial stronghold, the city has undergone substantial transformation over recent decades, evolving into a multifaceted urban environment. This development trajectory mirrors that of many growing cities which concurrently face challenges such as air pollution and traffic congestion.
In an effort to address these environmental and infrastructural issues, the Lanzhou municipal government has launched several urban regeneration initiatives. Key projects include the establishment of green belts along the riverbanks and the enhancement of public transportation networks, notably the expansion of the metro system. These initiatives are strategically aimed at fostering low-carbon and green commuting practices among residents, thereby reducing the ecological footprint of urban transport.
These measures not only aim to improve the quality of urban life but also contribute to the broader goals of sustainable urban development. By integrating environmental conservation with urban planning, Lanzhou is striving to mitigate the adverse effects of urbanization and promote a healthier, more sustainable future for its inhabitants.

2.2. Computational Principles of the Prediction Model

LEAP’s integration of methodologies such as the input–output method, system dynamics, and gray system theory enhances its capability to provide comprehensive and adaptable energy and environmental analyses. This integration allows it to accommodate varying degrees of data availability and quality, making it a versatile tool in both well-documented and data-sparse environments. Its scenario-based analysis is particularly valuable for exploring the long-term effects of policy decisions and technological changes, making it a critical tool for policy-makers aiming to achieve sustainable and environmentally friendly energy solutions [14].
Computational principles of the model [2].
E D k = i j A L i j k × E I i j k
In the above equation, ED is the total energy demand, AL is the activity level, and EI is the energy intensity; i, j, and k represent different industries, facilities, and energy types, respectively.
Carbon emissions from fossil fuels are calculated using the following formula [2].
C = i C i = i F C i × F i = i F C i × A L C i × c i × R i × 44 12
In the above equation, C (kgCO2) denotes the carbon emission from fossil energy consumption; i denotes different types of fossil fuels (including petrol, diesel, LPG, and natural gas); FC (kg) denotes the consumption; F (kgCO2/kg) denotes the carbon emission coefficient; and ALC (kJ/kg) denotes the average low-order calorific value. c (T/TJ) denotes the carbon content; R denotes the carbon oxidation rate.
Carbon emissions are calculated using the internal statistical procedures of the LEAP model, which identifies the main drivers and quantifies their impact on emission changes. Therefore, the results from a LEAP-based assessment are likely to gain wider international recognition compared to other bottom-up models.
The following is the method of calculating energy consumption [2].
E C = P i , j , k × V K T i × F E i , j
In the above formula, EC is the energy consumption; Pi,j,k is the retention of transportation mode i using energy type j under emission standard k; VKTi is the average annual mileage traveled by transportation mode i; and FEi,j is the energy consumption per hundred kilometers of transportation mode i using energy type j.
The following is methods of calculating carbon emissions [2].
C E = E C j × E F j
In the above formula, CE is the carbon emission from urban transport; ECj is the consumption of energy in category j; and EFj is the CO2 emission factor of energy in category j.
The following is the calculation method of pollutant emissions (including CO, NOx, SO2, PM2.5, etc.) [2].
E L = i j A L i , j × E I i , j × E F i , j × N i , j
In the above equations, EL is the emission of air pollutants; EFi,j and Ni,j are the air pollutant emission factor and pollution reduction factor per unit of energy i consumed by transport mode j, respectively.

2.3. Construction of the Structural Optimization Model

Based on the theory of green transport development, a multi-objective decision-making model for optimizing urban transport structures has been constructed, incorporating objectives related to carbon emissions and energy consumption. This model categorizes travel modes into buses, private cars, taxis, and railways. It considers carbon emissions, external costs, energy consumption, road occupancy, transport subsidies, and travel costs as objectives. Additionally, the model sets traffic demand, road network capacity, and maximum travel time as constraints.
The following is the traffic structure optimization objective system.
(1)
Carbon Emissions. This objective quantifies the carbon emissions from urban transportation [16].
C m i n = i = 1 4 P 0 r i L i ε i
In this equation, C represents the carbon emissions from urban transportation, measured in tons; P0 is the total passenger volume, measured in passenger trips; ri is the proportion of the ith mode of transport, measured in percentage; Li is the annual average travel distance of the ith mode of transport, measured in kilometers; and εi is the carbon dioxide emission factor for the ith mode of transport, measured in grams per person per kilometer.
(2)
Energy Consumption. This objective addresses the energy demands of urban transportation [16].
E m i n = i = 1 4 P 0 r i L i e i
In the above equations, E denotes energy consumption, and e is the energy consumption factor in megajoules per person-kilometer.
(3)
External Costs. This economic cost objective includes costs due to road congestion, noise, air pollution, and traffic accidents [12].
W m i n = W 1 + W 2 + W 3 + W 4 = i = 1 4 P 0 r i N i v i t i k i p + σ + N i L i ρ i + q i
In the above equations, W1, W2, W3, and W4 represent the costs caused by road congestion, noise, air pollution, and traffic accidents, respectively. N is the average occupancy rate of various travel modes, v is the average speed during congestion in kilometers per hour, t is the average delay time in hours, k is the average fuel consumption in liters per kilometer, p is the fuel price in CNY per liter, σ is the average cost of noise pollution in CNY per vehicle, and q is the external cost of traffic accidents per vehicle in CNY per vehicle.
(4)
Roadway Occupancy Area, reflects the efficiency of the city’s roadway network in traffic trip objectives [12].
S m i n = i = 1 4 P 0 r i s i
In the above equations, S is the road occupied area in square meters, and si is the per capita road area in square meters.
(5)
Transportation Financial Assistance. This economic objective pertains to financial support for transportation [17].
O m i n = P 0 r 1 o 1 + P 0 r 4 o 4
In the above equations, O is the total transportation subsidy, in CNY; o is the public transportation operating subsidy, in CNY per passenger trip.
(6)
Travel Costs, includes both economic and time costs [12].
F m i n = F 1 + F 2 = i = 1 4 r i u i + i = 1 4 r i h i ω
In the above equations, F is the cost of travel in CNY per trip, u is the average economic cost in CNY per trip, h is the average time cost in hours, and ω is the per capita hourly wage in CNY per hour.
Transportation Structure Optimization Constraints.
(1)
Transportation Demand Constraints [16].
i = 1 4 P 0 r i L i + j = 1 2 P j L j R γ
In the above equations, r is the resident population in tens of thousands, γ is the average residential travel rate in percent, and j represents other travel modes.
(2)
Road Network Capacity Constraints [16].
i = 1 4 r i L s i S 0
In the above equations, S0 denotes the per capita road area in square meters.

2.4. Coordination Evaluation Model

The conventional entropy weight-approximation ideal solution ranking method (Technique for Order Preference by Similarity to Ideal Solution, TOPSIS) evaluation model primarily considers the relative distance between the evaluated programs and both the positive and negative ideal solutions. However, it overlooks the interdependencies among the programs and the individual program’s evolving trends. In contrast, gray correlation theory primarily measures the similarity of data series curves, making it adept at analyzing trends and developmental progressions. By integrating these two methods, we can leverage their respective strengths while accounting for the relative positions and dynamic trends of the programs. This integration begins by calculating the weights for each criterion, followed by determining the gray correlation and entropy-weighted TOPSIS Euclidean distance. These metrics serve as intermediate variables. Subsequently, a new parameter, termed gray relative proximity, is derived through the application of a preference coefficient to the evaluation results. This refined approach ensures a more comprehensive assessment of each program’s strengths, weaknesses, and trends.
Construction of the evaluation models.
Step 1: Construct the initial decision matrix X and normalize it to matrix Y [25].
X = x 11 x 12 x 1 j x 21 x 22 x 2 j   x i 1 x i 2 x i j m × n
Y = y i j
y i j = x i j ( k = 1 n x k j )
In the above equations, xij denotes the value of the jth indicator for the ith object of study. i = 1, 2, …, m; j = 1, 2, …, n.
Step 2: Determine the entropy value of the indicator [25].
First, construct the judgment matrix B = (bij).
Benefit-based indicators (bigger is better):
b i j = x i j x m i n x m a x x m i n  
Cost-based indicators (smaller is better):
b i j = x m a x x i j x m a x x m i n  
Then, determine the entropy of the indicator:
H f = 1 ln n i = 1 n f i j ln f i j
In the above equations, f i j = 1 + b i j i = 1 n ( 1 + b i j ) denotes the weight of the value of the ith research object indicator under the jth indicator.
Step 3: Determine the entropy weight matrix A and weighted normalization matrix Z for each indicator [25].
A = a 1 0 0 0 a 2 0 0 0 a j n × n
In the above equations, a j = 1 + H j n j = 1 n H j at this point satisfies j = 1 n a j = 1 .
Z = z i j = Y × A
Step 4: Calculate the positive and negative ideal solutions [25].
Positive ideal solution:
Z + = z 1 + , z 2 + , , z n +
Negative ideal solution:
Z = z 1 , z 2 , , z n
z j + = Benefit based   indicators , max i z i j Cost based   indicators , min i z i j
z j = Benefit based   indicators , min i z i j Cost based   indicators , max i z i j  
Step 5: Calculate the Euclidean distance between each current solution and the optimal and worst solutions [25].
D i + = j = 1 n z i j z j + 2
D i = j = 1 n z i j z j 2
Step 6: Perform a gray correlation analysis [8].
g i j + = min i min j | z j + z i j | + ε max i   max j | z j + z i j | z j + z i j + ε max i   max j | z j + z i j |
g i j = min i min j | z j z i j | + ε max i   max j | z j z i j | z j z i j + ε max i   max j | z j z i j |
In the above equations, g i j + denotes the gray correlation coefficient between the ith research object and the positive ideal solution with respect to the jth indicator; g i j denotes the gray correlation coefficient between the ith research object and the negative ideal solution about the jth indicator; and i = 1,2,…,m; j = 1,2,…,n; ε ∈ (0,1) is the discrimination coefficient, which is taken as 0.5.
The gray correlation is
G i + = 1 n i = 1 n g i j +
G i = 1 n i = 1 n g i j
Step 7: Calculate the relative proximity [8].
The obtained D i + , D i , G i + , and G i are dimensionless.
d i + = D i + m a x D i +
d i = D i m a x D i
j i + = G i + m a x G i +
j i = G i m a x G i
Combine the processed Euclidean distance and gray correlation:
S i + = α d i + β j i +
S i = α d i + + β j i
In the above equations, α and β are preference degrees, which can be determined by the decision-maker, and are all taken as 0.5 here; S i + and S i denote the degree of proximity and distance between the research target program and the optimal program, respectively [8].
In summary, the Gray Relative Proximity will be obtained for proximity.
R i + = S i + S i + + S i , i = 1,2 , , m
Step 8: Evaluate and analyze each research object according to the gray relative proximity; the scheme with the larger value is better, i.e., better coordination. According to the distribution of the values of the relevant studies, determine the coordination grade classification as listed in Table 1.

3. Data and Optimization Results

3.1. Predictive Modeling

The LEAP (Long-range Energy Alternatives Planning) model is a powerful tool designed to analyze and project energy consumption, carbon emissions, and pollutant emissions in urban transportation systems, which has a modular structural design [26].
Data Input serves as the foundation for all other modules, providing the necessary data for each of them. The Demand Module and Supply Module are interdependent. The Demand Module generates data on future energy needs, which the Supply Module uses to adjust energy supply planning. The Energy Conversion Module depends on the energy supply data and conversion technologies, while it also responds to energy demand changes from the Demand Module. The Emissions Module relies on data from the Energy Conversion and Consumption processes to calculate emissions. The Economic Module and Policy Module are closely linked. Policies set in the Policy Module affect energy prices, cost structures, and investment decisions, and the Economic Module evaluates their financial implications. The Optimization Module typically draws on data from the preceding modules, helping to determine the best energy development path. Optimization results can feed back into other modules to guide decision-making. The Resource Module provides the final analysis, presenting the results of interactions between all the modules and supporting decision-making through visualization and comparison of different scenarios [26].
The core content and goal of this study is the calculation of carbon emissions generated by urban transportation, so the individual parameter setting process of some modules can be omitted here, and they can be run in the default state.
The Demand Module models the dynamic energy demands of different sectors (e.g., industrial, transport, and buildings), typically based on historical data and assumptions regarding economic and societal development. It is a prerequisite for carbon emission prediction. This component of the LEAP-Lanzhou model focuses exclusively on urban transportation. The model categorizes urban transportation into three hierarchical levels but excludes certain vehicle types that are less prevalent in urban settings.
Resource Module. This module considers only the primary and secondary energy sources that are directly relevant to urban transportation. The primary energy sources included are gasoline and natural gas, and the secondary source is electricity [26]. These selections reflect the most common energy carriers used in urban transportation systems.
Based on the aforementioned carbon emission calculation methods, the LEAP model is constructed to analyze the energy consumption, carbon emissions, and pollutant emissions of urban transportation in the target city. According to the research requirements and the actual traffic conditions in Lanzhou, some simplifications are made: the Demand Module considers only urban transportation, divided into three levels, while excluding diesel vehicles that are less commonly used in urban areas, as well as motorcycles and electric bicycles. The Resource Module considers only primary energy sources such as gasoline and natural gas, and secondary energy such as electricity. Considering China’s “dual carbon” goals, 2020 is set as the base year and 2060 as the target year. The pollutants considered are limited to SO2, NOx, and particulate matter.
The architecture of the LEAP-Lanzhou model, constructed based on the aforementioned principles, is shown in Figure 2.

3.2. Structural Optimization Model

Assumptions and Their Implications.
  • Separate System. The assumption that the urban transportation system in Lanzhou functions as a separate entity isolates the analysis from external influences such as transit vehicles from other regions or demographic changes. This allows for a more controlled study of the urban transportation system itself but may overlook interactions with neighboring systems or broader demographic trends that could impact demand and efficiency.
  • Modes and Energy Sources. By limiting the model to four primary modes of transportation (buses, taxi, metro, and private cars) and four energy sources (gasoline, diesel, natural gas, and electricity), the model simplifies the complexities of urban transport energy consumption and supply. This makes modeling more manageable but may limit the scope of potential innovations or changes in newer transportation technologies or alternative fuels.
  • Constraints. Focusing on five specific constraints (travel demand, energy consumption, transport supply, accessibility, and environmental pollution) helps to streamline the objectives and makes the model practically applicable to real-world scenarios. However, this approach might neglect other potential factors such as economic impacts, social equity, or urban planning changes.
The following is a multi-objective planning model for the optimization of green transport structures in Lanzhou.
C m i n = = i = 1 4 P 0 r i L i ε i   E m i n = i = 1 4 P 0 r i L i e i   W m i n = i = 1 4 P 0 r i N i v i t i k i p + σ + N i L i ρ i + q i S m i n = i = 1 4 P 0 r i s i F m i n = F 1 + F 2 = i = 1 4 r i u i + i = 1 4 r i h i ω   O m i n = P 0 r 1 o 1 + P 0 r 4 o 4  
s . t . i = 1 4 P 0 r i L i + j = 1 2 P j L j R γ i = 1 4 P 0 r i L s i + j = 1 2 P j r j P 0 + j = 1 2 P j S 0
Based on the actual situation of the study area—Lanzhou and the collected statistical data—the various parameters involved in the model were determined, as shown in Table 2:
Data source: 2021 Lanzhou Statistical Yearbook, 2020 Lanzhou Passenger Transportation Report, 2020 Departmental Accounts of the State-owned Assets Supervision and Administration Commission of the Lanzhou Municipal People’s Government Explanation, 2021 Gansu Provincial Statistical Yearbook.

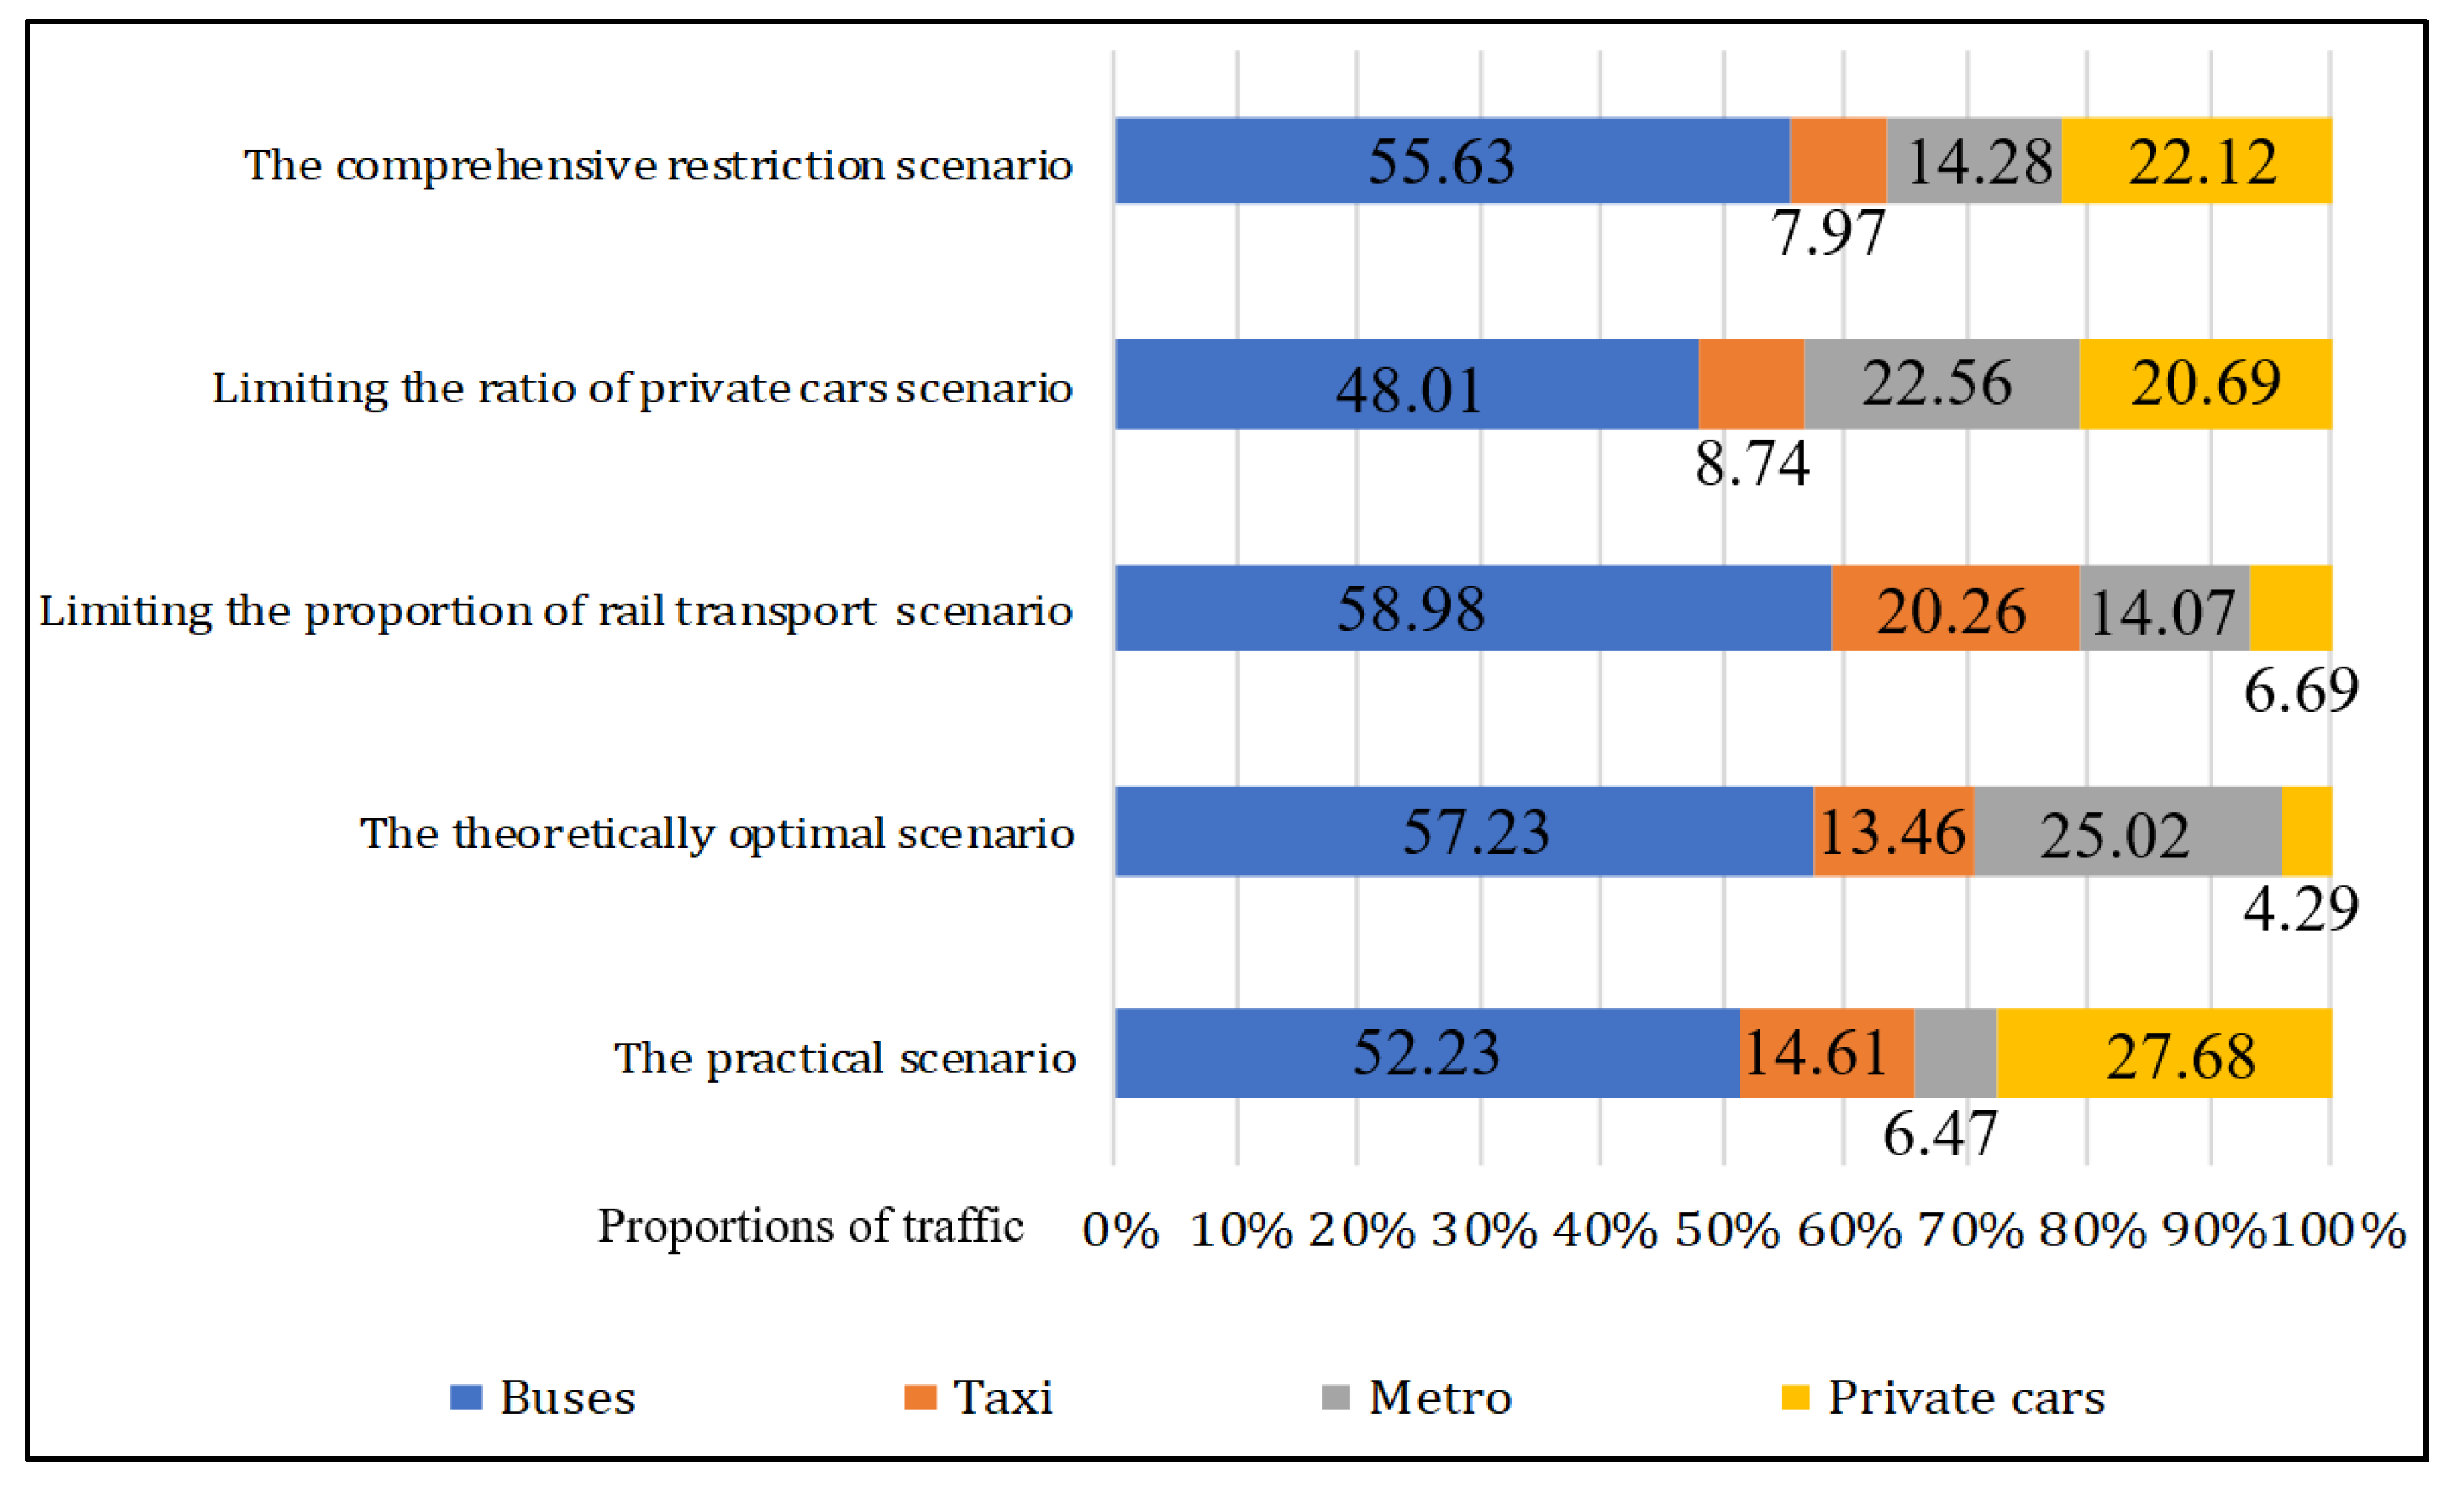
3.3. Optimization Results

Considering the various approaches, policies, and measures implemented over many years to develop a green and low-carbon urban transportation system are showing positive results, it is noted that the “dual-carbon” strategic goal has been in effect for over two years. The energy intensity and emissions of the current urban transportation system are beginning to stabilize and even show slight declines. This presents a contradiction to the common baseline scenario described as having “no energy-saving or emission-reduction measures, stagnant technology levels, and unchanged activity levels, energy intensity, and emission intensity”. Therefore, the current urban transportation system is selected as the sole scenario for analysis [27]. This scenario assumes that economic development goals are met without new changes in energy-saving and emission-reduction measures, slight reductions in energy intensity, a modest increase in electric vehicle use, and no major shifts in other energy structures. The pollutants considered in this scenario are only CO, NOx, SO2, and PM2.5. Specific scenario parameters are detailed in Table 3.
In the base year, the share of hybrid vehicles among buses and private cars was relatively small. Given the complexity of accounting for the specific technical specifications and energy consumption levels of each vehicle, they were broadly categorized into two main types: gasoline-powered and fully electric. Micro-vans, which are commonly used within urban settings, and sedans exhibit minor differences in energy consumption and are therefore classified together under private cars. The total number of registered motorcycles is approximately 10,000, considerably fewer than the 1.14 million motorized vehicles, leading to the exclusion of motorcycles from this analysis for simplicity. The ownership data for buses, taxis, and private cars were sourced from national statistics, with the average annual mileage for private cars derived from “Cloud Insurance Technology” survey results, estimated at 14,600 km. Vehicle capacity calculations for different modes of transport were based on current realities: buses at 40 passengers per vehicle, subways at 1400 passengers per train, taxis at 2.5 passengers per vehicle, and private cars at 1.5 passengers per vehicle. Fuel and power consumption rates were established as follows: diesel buses consume 34 L per 100 km; electric buses use 75 kWh per 100 km; and the Lanzhou subway, which operates on electric traction, consumes an average of 250 kWh per 100 km. Based on the cited parameters, the energy consumption for private cars is 8.5 L and 14 kWh per 100 km for gasoline and electric vehicles, respectively, whereas taxis consume 7 L and 13.2 kWh per 100 km. Additionally, the natural gas consumption for taxis is estimated at 10 cubic meters per 100 km. The method for calculating energy intensity is detailed in [19].
E D i , k = F C i , k O i 100
In the equations described above, EDi,k represents the energy intensity of the kth energy technology; FCi,k indicates the energy consumption per 100 kilometers for the kth energy technology; and Oi refers to the average passenger capacity of the ith end-use vehicle.
References for this study are drawn from a variety of authoritative sources including the Lanzhou Statistical Yearbook, the Gansu Province Statistical Yearbook, the New Energy Vehicle Industry Development Plan (2021–2035), the Action Plan for Promoting Electrification of Public Sector Vehicles, the Lanzhou Passenger Transportation Report, the Lanzhou New Township Development Plan (2021–2035), the official website of Lanzhou Railway Traffic Ltd., the “Cloud Risk Technology”, and the official website of the Lanzhou Municipal Transportation Commission.
In this study, we utilized the multi-objective optimization toolbox in MATLAB to employ the non-dominated sorting genetic algorithm for solving the problem of optimal traffic structure proportion. Considering Lanzhou’s specific context as of the end of the base year 2020, the city had 1,144,900 motor vehicles, predominantly private cars. Given the significant role of the small car production and sales industry in the local economy, completely neglecting this sector in pursuit of green and low-carbon urban transport could undermine both residents’ travel needs and socio-economic development. Therefore, drawing from the actual traffic composition of Lanzhou as of 2020, the theoretically optimal ratios, and data from other regions and studies, we constrained the proportion of private cars to no less than 20%, and the scenario limiting the ratio of private cars is obtained.
As of 2023, only two rail lines are operational in Lanzhou, covering a total length of 34.96 km with 27 stations. Since the rail transit system was recently inaugurated in 2020 and accounted for less than 7% of the traffic structure, optimizing urban traffic composition required careful consideration of these facts. By referencing transit data from other cities with similar demographics, travel times, and rail transit scales, we capped the rail transit structure proportion at a maximum of 15%. Optimization based on this additional constraint yields a scenario termed limiting the proportion of rail transport structure.
Based on the aforementioned scenario with additional constraints, we define a new optimization configuration by simultaneously limiting the lower bound of the private car proportion and the upper bound of the subway proportion, which is referred to as the “comprehensive restriction scheme”.
Substituting the parameters of the four scenarios into the optimization model presented in Equations (39) and (40), and adding additional constraints based on the scenario definitions, the optimization model is solved to obtain the optimized transportation structure proportions for the four scenarios. As shown in Figure 3, these proportions represent the transportation structure of the practical scenario and the four optimized scenarios.
Proportions of various energy sources utilized across different transportation modes and the associated energy intensities, in accordance with the baseline scenario.

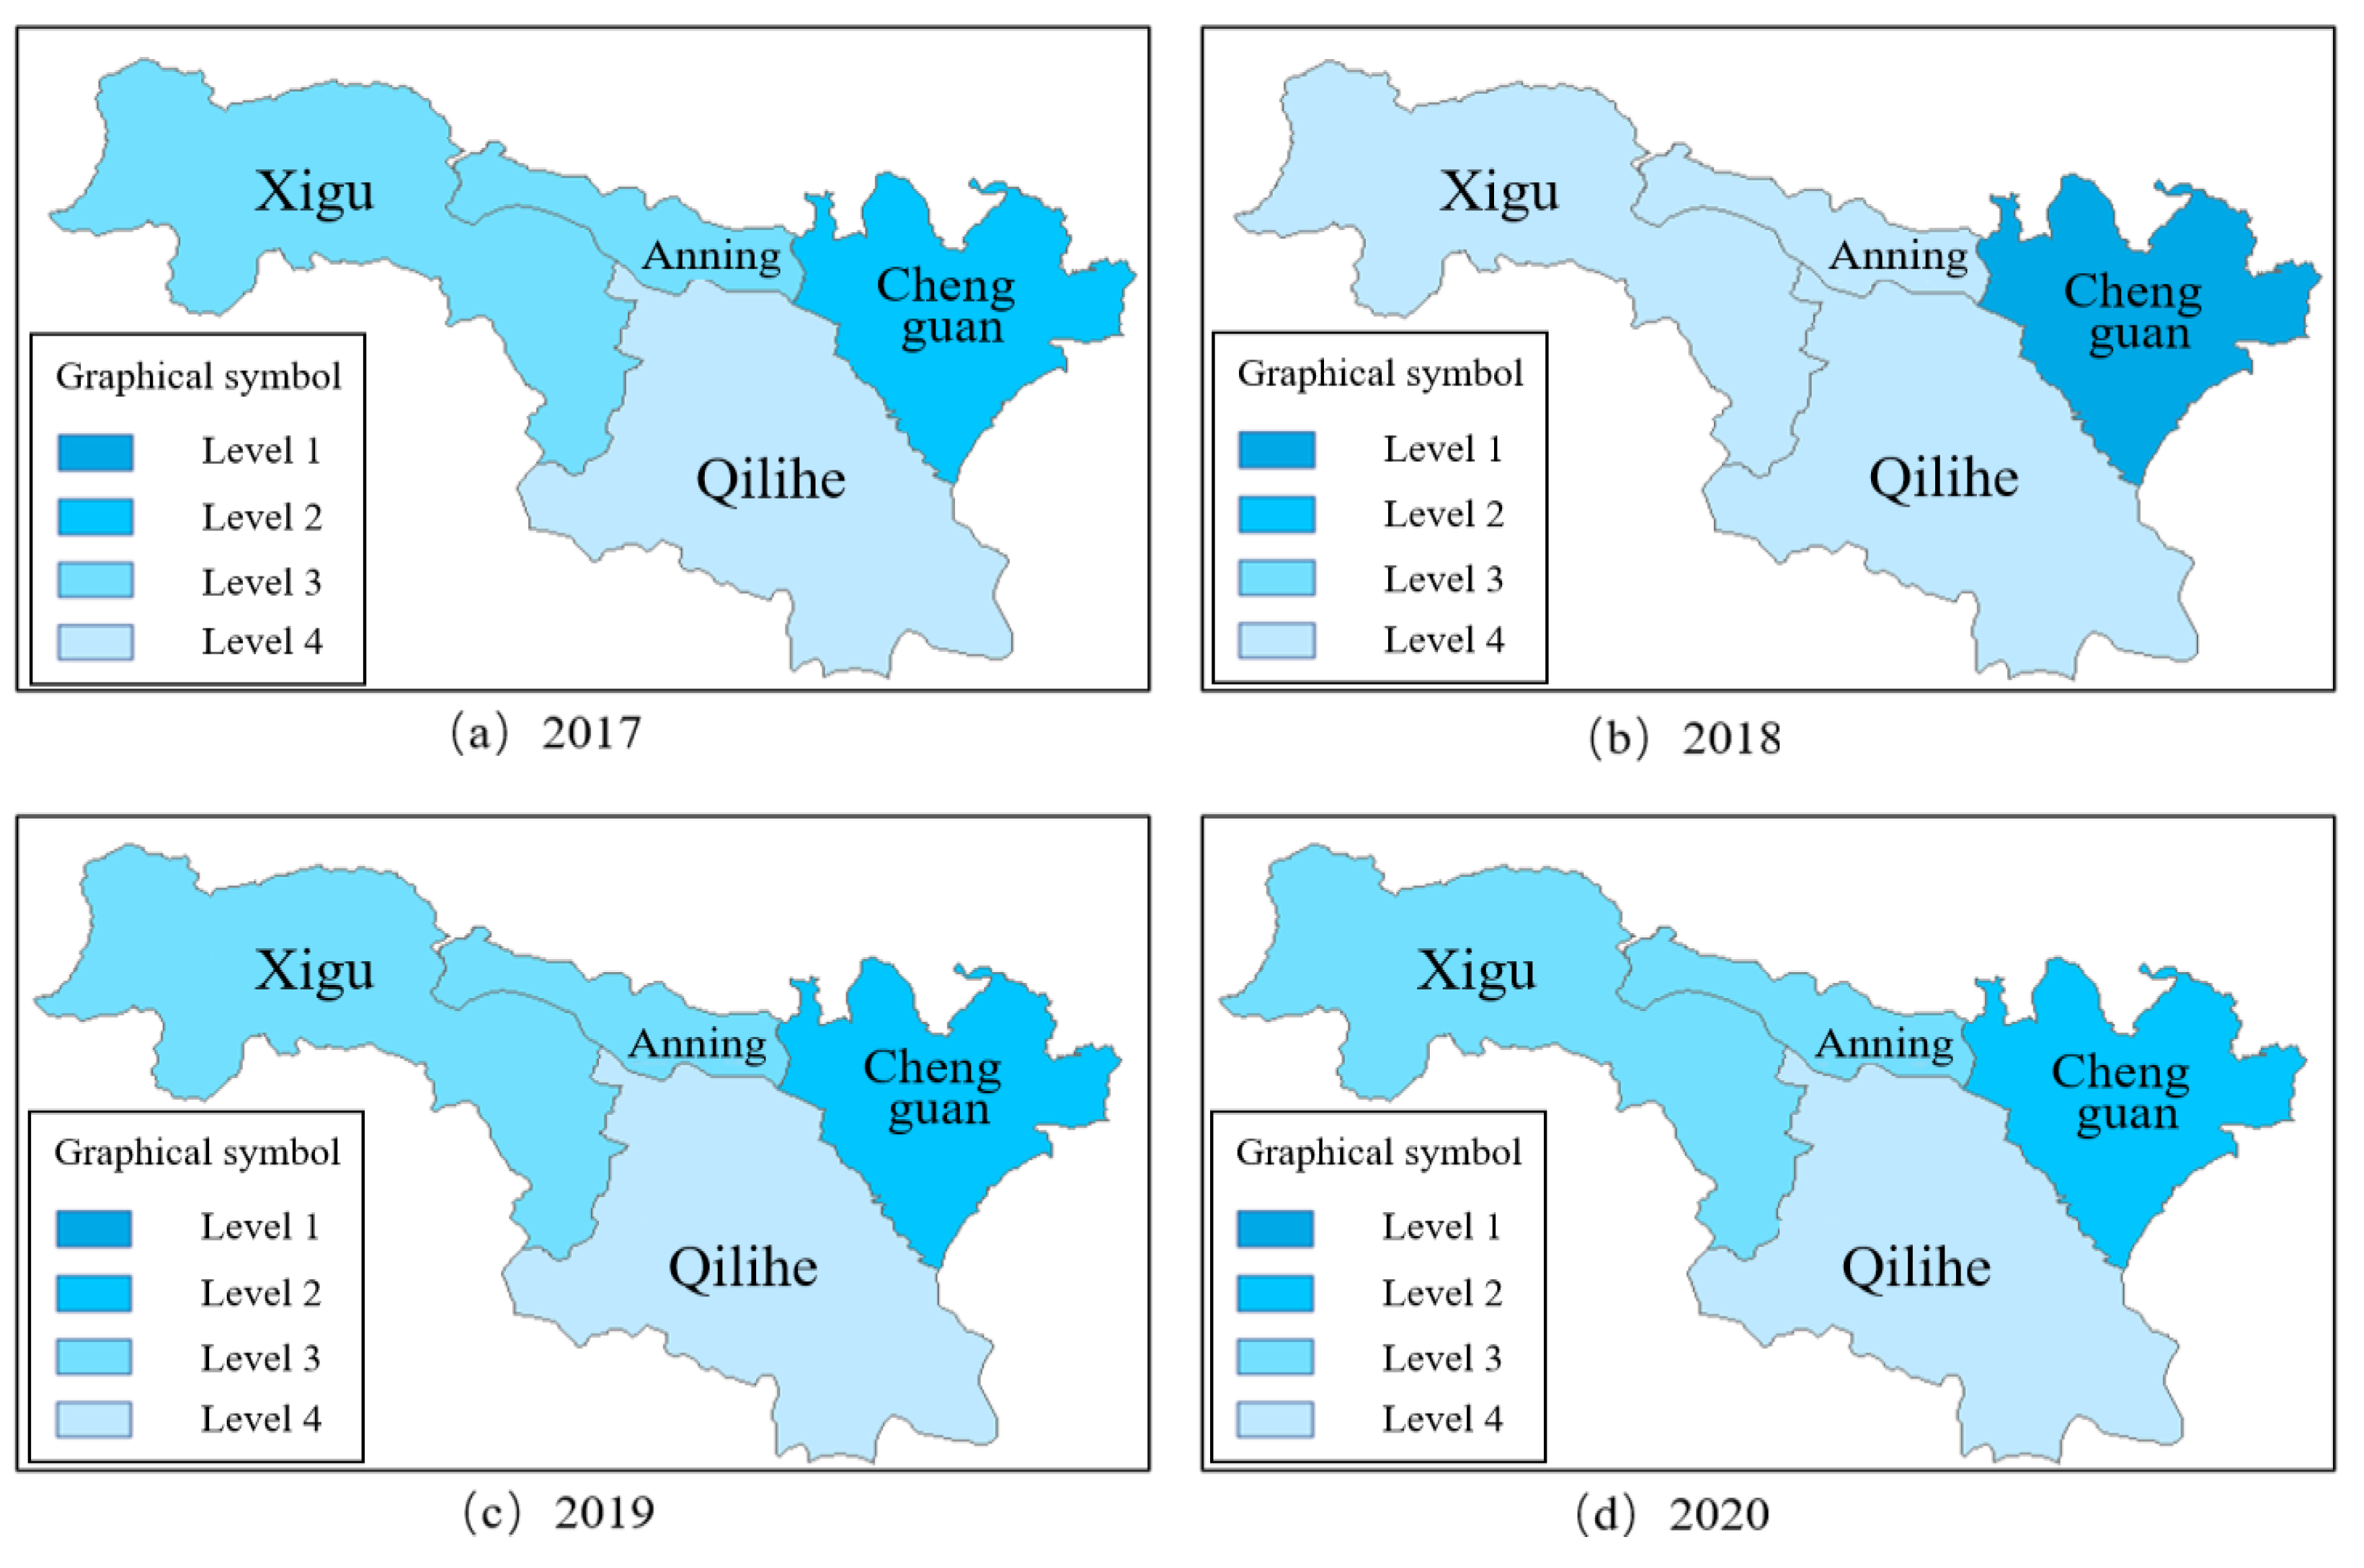
3.4. Evaluation of Harmonization

The entropy weight TOPSIS evaluation model primarily focuses on the relative distances between the evaluated programs and the positive and negative ideal solutions, yet it overlooks the interactions among different programs and their own evolving trends. In contrast, gray relational theory predominantly assesses the similarity of data series curves, making it adept at analyzing trends in changes and development. Therefore, integrating these two methods can harness their individual strengths while concurrently considering both the relative positions and the evolving trends of the programs. This integration is achieved by initially calculating the weights for each index, followed by determining the gray relational grade and the entropy-weighted TOPSIS Euclidean distance. These metrics serve as intermediary quantities from which a new parameter, termed the gray relational proximity, is derived through the allocation of preference coefficients as a factor in the evaluation results. This approach enables a more comprehensive analysis of each program’s merits, demerits, and trends.
The selection of evaluation indicators should, on one hand, ensure that the chosen metrics can accurately reflect the efficiency of system operations and the essential characteristics of the subject being evaluated. On the other hand, it is crucial that these indicators are comparable and continuous in nature. The evaluation of green transportation coordination in this context should encompass three tiers of indicators that capture the intrinsic qualities of green transportation within the urban construction process. This includes the development of the transportation sector, the impact of urban transportation on the ecological environment, and transportation safety. Based on the principles of operability, independence, and comparability, and considering the characteristics of residents’ travel and urban transportation in depth, this evaluation also takes into account the effects of intra-urban transportation on the ecological environment and transportation safety. Furthermore, it incorporates insights from other evaluation models developed in related domestic and international studies. This study focuses on five scenarios related to the baseline year of urban transportation carbon emissions in Lanzhou.
The citywide evaluation indicators and their weights for Lanzhou are listed in Table 4.
The evaluation focuses on the green traffic initiatives implemented in the base year across five scenarios developed from optimizing Lanzhou’s urban traffic structure. The selection of evaluation indices begins at two levels: urban traffic and travel demand, and the demand for green, low-carbon development. These indices are chosen based on the principles of operability, independence, and comparability. They consider the unique travel behaviors of residents and the specific characteristics of urban traffic extensively. Additionally, the evaluation system is designed by deeply analyzing the impacts on both the ecological environment and traffic safety, while also incorporating insights from other relevant evaluation models used in domestic and international studies.
This study utilizes SPSS 22.0 software to facilitate the analysis of indicator data, applying entropy weight theory to efficiently and accurately determine the weight of each indicator. These weights and indicator parameters are integrated into the evaluation model to calculate the gray relative proximity for each scenario within the base year. This metric effectively measures the closeness of various scenarios or programs to the ideal optimal program, with higher values indicating superior scenarios. The evaluation model, classified under green transportation coordination, uses the terms “superiority” and “inferiority” to reflect the level of coordination or discord within the system. Essentially, scenarios with greater gray relative proximity exhibit better coordination.
Furthermore, by incorporating data on energy consumption, carbon emissions, and pollution emissions from urban transportation for each scenario, the corresponding gray proximity is determined, as shown in Table 5. This data elucidate the level of green transportation coordination for each scenario, with higher values indicating more effective coordination and, consequently, a more favorable scenario.
It is evident that the baseline scenario exhibits the lowest gray relative proximity, indicating the poorest level of green transportation coordination compared to other scenarios. These alternative scenarios have been optimized through structural adjustments and generally show better performance. Notably, the comprehensive restriction scenario ranks second in green transportation coordination. This ranking primarily relies on the Euclidean distance between each scenario and both the positive and negative ideal solutions. The comprehensive restriction scenario is closer to the ideal solution in terms of Euclidean distance, and when combined with gray correlation coefficients, it displays a greater gray relative proximity. This suggests that the comprehensive restriction scenario achieves a higher level of coordination.
The analysis incorporates data from Lanzhou, which spans urban areas, townships, and suburban regions. In optimizing the urban transportation structure, a greater emphasis should be placed on urban areas to alleviate traffic congestion and reduce environmental impacts in densely populated zones. The same coordination evaluation method and indices are thus applied to assess green transportation coordination in the four urban districts of Lanzhou—Chengguan, Qilihe, Anning, and Xigu—under the baseline scenario. The findings from this evaluation are presented in Figure 4 and Figure 5.
Figure 4 illustrates the varying dynamics of green transportation coordination across the districts of Lanzhou, with Chengguan District consistently outperforming the others. Chengguan, located centrally, exhibits the highest coordination level, underpinned by superior performance across all evaluated indicators. In contrast, Qilihe District shows lower coordination levels, with its ranking remaining relatively stable but below average compared to the other districts. Xigu District, although better than Qilihe, experiences less fluctuation in its rankings, suggesting a slightly more stable but moderate coordination performance. Anning District, similar in performance to Xigu, sees more significant ranking fluctuations.
The three districts with lower coordination—Qilihe, Xigu, and Anning—also have a lower demand for travel compared to Chengguan. This discrepancy highlights a critical need for targeted adjustments in the green transportation development plans for these districts to enhance their efficiency and effectiveness in promoting sustainable urban mobility.
Figure 5 illustrates the levels of green transportation coordination across the four districts. Although the coordination levels of the districts are ranked, districts with small differences in coordination are still categorized within the same level. From Figure 5, we can conclude Qilihe and Anning Districts are adjacent to Chengguan District, and a significant amount of travel demand is reflected in inter-district travel among the three areas, especially during morning and evening commutes. If slow traffic is obstructed or the allowed traffic volume is less than the actual demand, it will greatly increase the time residents spend waiting on roads and at stations, leading to a higher occupancy rate of traffic resources. Although the total number of taxis and ride-hailing vehicles is relatively reasonable, there are instances during peak hours and inclement weather when it becomes difficult to find a vehicle. With the opening of Metro Line 1 in June 2019, residents now have a new travel option between Chengguan, Qilihe, and Anning Districts, which has slightly alleviated the aforementioned issues, but there is still room for optimization.
Anning District faces prominent issues such as a dense urban road network with poor circulation, uneven distribution of crossing facilities, inadequate layout of slow traffic facilities, and excessive congestion during public transport peak periods. Additionally, there are 17 colleges and universities in the district, apart from primary and secondary schools, which has led to a surge in travel demand during peak hours in certain areas due to the concentration of educational resources and high density of student populations. The opening of the Bus Rapid Transit (BRT) system has had a positive effect on addressing these issues, but the results are limited. With the continuous expansion of higher education institutions, the travel demand in certain areas has been increasing year by year, exacerbating the imbalance between travel demand and existing traffic resources, thereby reducing the coordination of green transportation.
Xigu District is relatively far from the other districts, especially from the densely populated urban areas. Several large enterprises within the region have addressed a certain proportion of residents’ employment issues. As a result, the proportion of traffic travel within the district is high, with walking, cycling, and public transport becoming the main modes of travel. Although Xigu District has a lower degree of road network completeness and per capita road area, it can still achieve good coordination of green transportation by promoting travel modes primarily based on slow traffic.

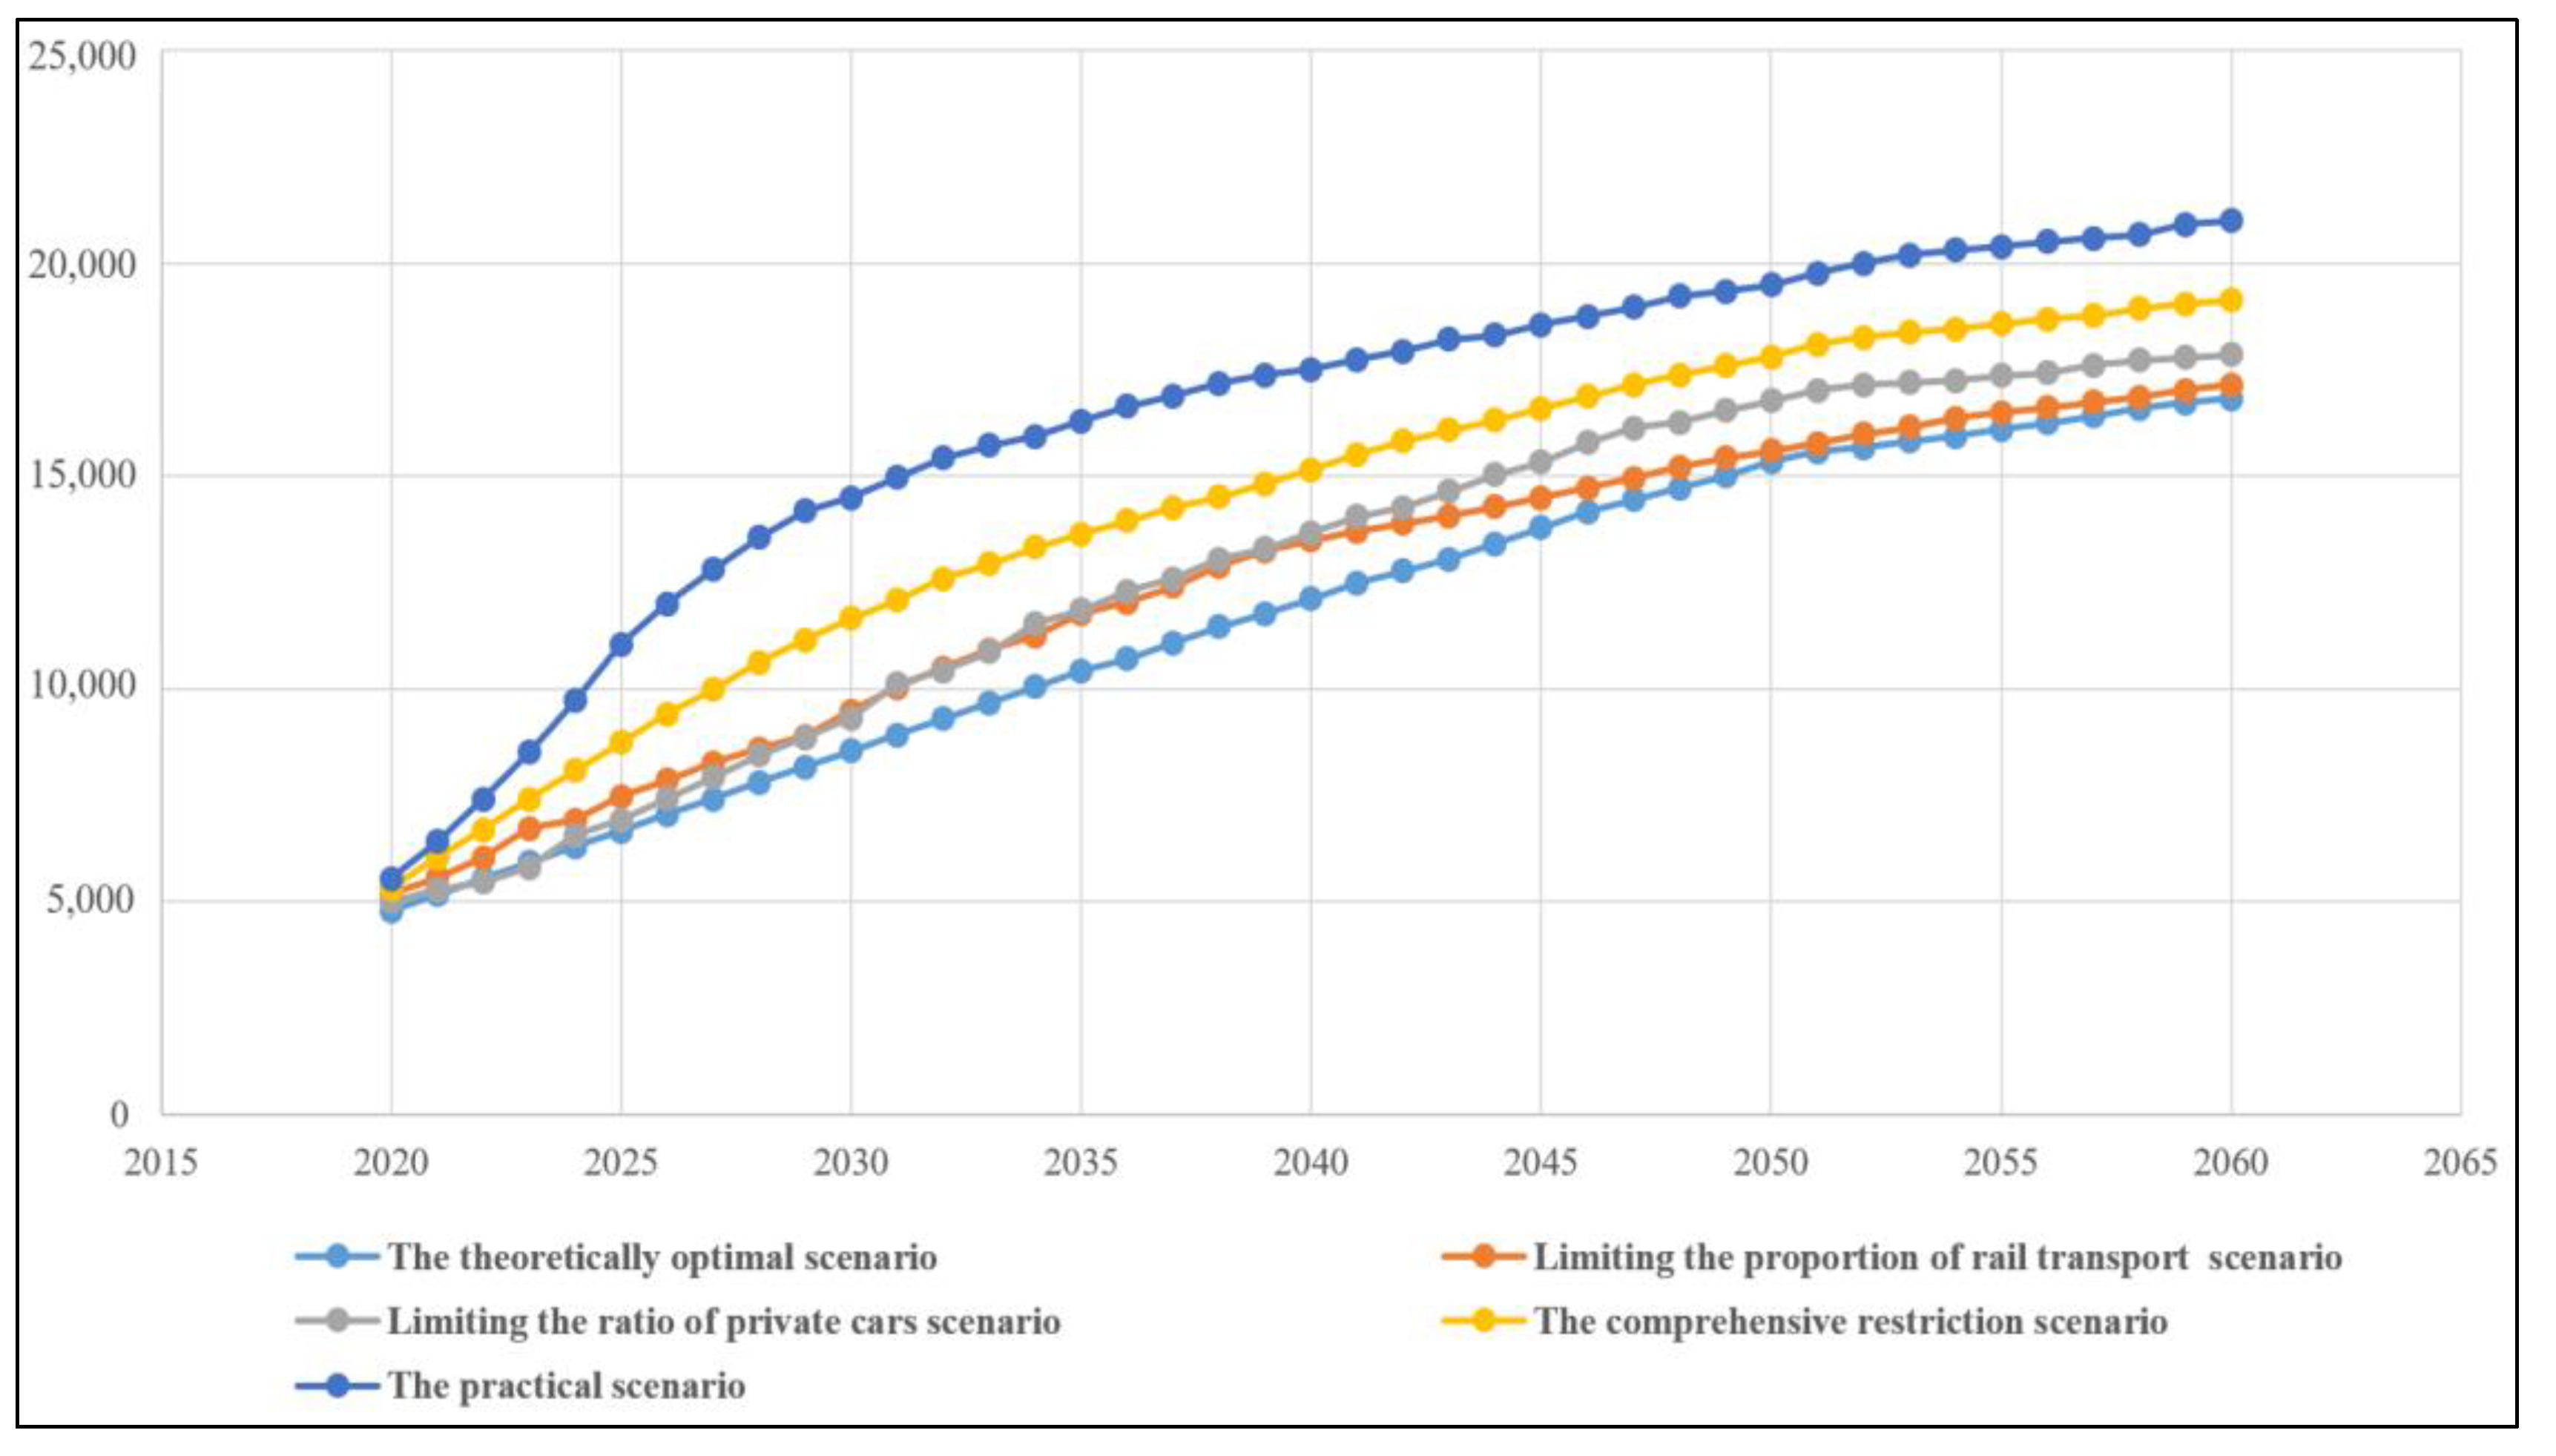
4. Analysis of Carbon Emission Projection Results

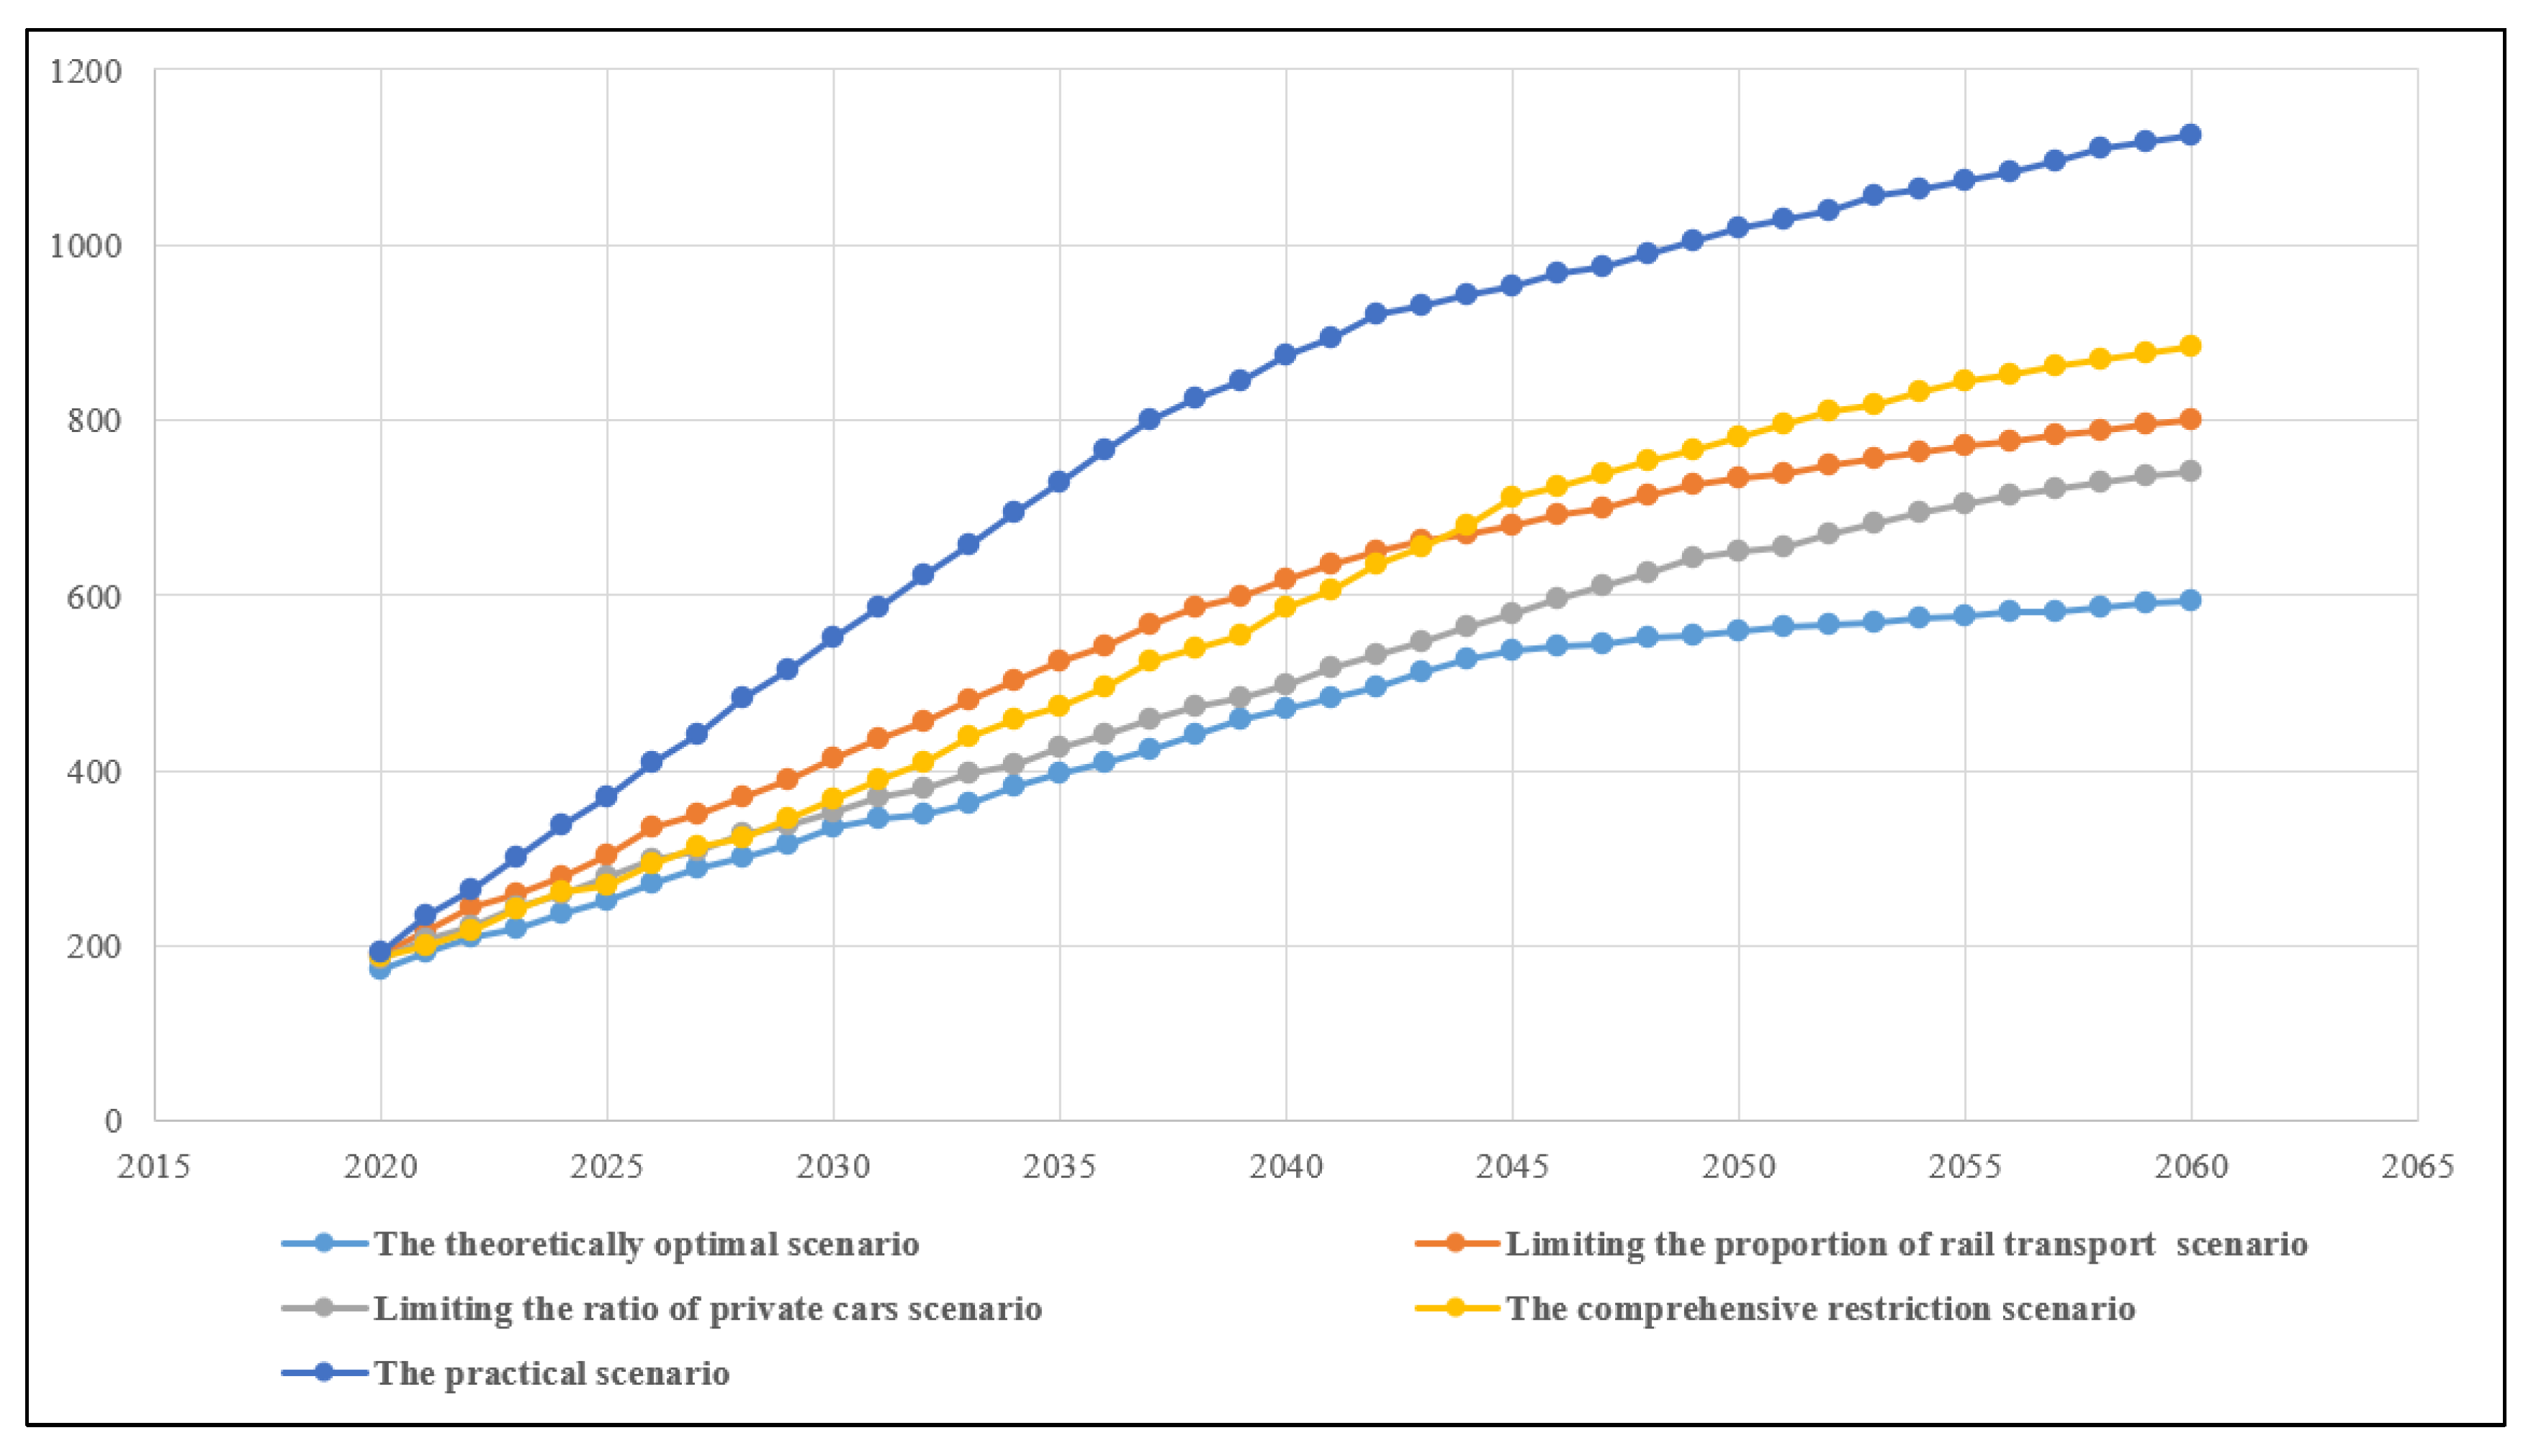
4.1. Projected Results

Based on the LEAP-Lanzhou model constructed in the previous sections and the calculation principles outlined in Equations (1)–(5), the energy consumption, carbon emissions, and pollutant emissions for the five transportation structure scenarios shown in Figure 3 were predicted for each year from 2020 to 2060. This is carried out to assess the impacts of the baseline scenario (before optimization) and the four optimized virtual scenarios on energy consumption, carbon emissions, and pollutant emissions. The results are presented in Figure 6, Figure 7 and Figure 8.
Based on the calculated energy consumption levels presented in Figure 6 under various scenarios, it can be concluded that each optimization scenario reduces the energy consumption of urban transportation. However, the upward trend of energy consumption over time remains unchanged. Between 2040 and 2045, the growth rate of energy consumption will slow down across all scenarios. Nonetheless, except for the theoretically optimal scenario, the energy consumption levels of other scenarios will continue to rise significantly after 2045, failing to meet the target requirement for energy savings to reach a peak.
As shown in Figure 7, the carbon emission levels of each scenario are relatively close, and the optimized scenarios demonstrate a certain degree of improvement in the carbon emission values, suggesting that the optimization settings are effective. However, under the context of achieving the “dual carbon” goals, “carbon peaking” implies that the growth rate of carbon emissions reaches zero. According to the data presented in Figure 7, even under the theoretically optimal scenario (the light blue line at the bottom), carbon emissions continue to rise and the rate of increase has not sufficiently declined. The carbon emission growth rate of other scenarios is faster.
Based on this situation, we can conclude that the optimization of urban transportation carbon emissions through transportation structure adjustments has already reached a bottleneck. Even under theoretically optimal scenarios, it is difficult to achieve “carbon peaking” in the urban transportation sector. According to the computational principles of the selected carbon emission prediction model, it is necessary to implement technological or managerial measures to exert sufficient influence at the “energy intensity” level, thereby slowing its growth or even driving a decline. Only through these measures can the growth rate of carbon emissions be further reduced, leading to a peak and eventually a downward trend.
Each line in Figure 8 reflects a deceleration in the growth rate of pollutant emissions, particularly under the practical scenario. This is partly due to the consideration of chemical reactions related to energy consumption in the calculation of pollutant emissions and partly due to the pre-existing pollution control parameters set in the practical scenario. For other scenarios, the growth rate of pollutant emissions only gradually decreases to lower levels after 2045. Based on this observation, we can conclude that the optimization of the transportation structure can achieve the goal of “peaking” pollutant emissions.

4.2. Comprehensive Analysis

As Lanzhou experiences economic and social development, accompanied by increasing population concentrations and the expansion of its urban transportation infrastructure, a pronounced growth trend in future energy consumption is projected for the city’s transportation sector. It is anticipated that by 2060, energy consumption will reach approximately 11,246,000 tons of coal equivalent, marking an increase of 483% relative to 2020. Notably, the period from 2040 to 2050 is characterized by a deceleration in the growth rate of energy consumption, which continues to slow post-2050. Similarly, carbon emissions from urban transportation in Lanzhou are expected to follow an upward trajectory, reaching 6,602,800 tons by 2060—189% higher than in 2020 but at a growth rate that is less steep compared to the increase in energy consumption. A critical inflection point occurs around 2040, beyond which the overall growth rate moderates, maintaining a general correspondence with the energy consumption curve. Regarding future emissions of pollutant gases from urban transportation, a significant rise is anticipated, peaking at 210.1 million tons in 2060, which constitutes a 279% increase from the base year. However, a notable slowdown in emissions growth is observed starting around 2030, persisting over the subsequent three decades.
Post-2040, both energy consumption and carbon emissions in Lanzhou will continue to rise, albeit at a decelerated pace. This sustained increase can be attributed to macro-level factors, including urban expansion, population growth, and escalating demands for mobility, which collectively drive up the number and scale of transportation modalities. At a micro level, the slowdown in growth rates is influenced by the increasing negative impact of decreasing energy intensity values year over year, which affects computational outcomes. Additionally, from a macro perspective, the accumulated effectiveness of existing energy conservation and emissions reduction strategies over time plays a crucial role. These observations suggest that while current measures prove effective to some extent, they alone may be insufficient to achieve the ambitious “dual-carbon” objectives, underscoring the need for enhanced or additional strategies.

5. Conclusions

The optimization of urban transportation structures, with a focus on energy conservation, emission reduction, and environmental sustainability, has led to a noticeable decrease in the energy consumption and emission levels of urban transport systems. Despite these advancements, carbon emissions continue to display a long-term upward trend, although the rate of growth has slightly decreased. However, these levels are still significantly short of reaching the “carbon peak”—a state where the growth rate of carbon emissions becomes zero. It is recognized that achieving peak carbon emissions in a single industry or localized sector may not be feasible. Instead, attaining regional peak carbon emissions collectively remains a plausible goal, signifying the effective realization of broader objectives.
Mechanisms such as carbon emission trading, carbon taxation, and other regulatory measures can significantly enhance societal management of carbon emissions, facilitating the attainment of peak carbon emissions at a macro level. From these observations, several key conclusions can be drawn, underscoring the complex interplay between urban transport optimization and broader environmental policy goals.
(1)
The optimization of the transportation structure can only reduce the growth rate of carbon emissions in the single domain of urban transportation; it cannot bring the growth rate to zero or achieve “carbon peaking”. This finding aligns with the principle that achieving “carbon peaking” and “carbon neutrality” in large regions requires coordinated efforts across all industries and sectors. This also indicates that the carbon emission estimation method employed in this study is reasonable and effective.
(2)
In the context of urban transportation systems, rail transit plays a more significant role in energy conservation and emission reduction. Even in scenarios where private car usage accounts for a higher proportion of trips, ensuring the efficiency and convenience of rail transit can help maintain the overall carbon emissions of the urban transportation system at relatively low levels.
(3)
The proportion of private car trips should not necessarily be minimized without consideration. On one hand, private cars offer irreplaceable advantages such as flexibility in travel time, spacious and comfortable riding conditions, and strong privacy. On the other hand, the production, manufacturing, and sales of small vehicles are also integral components of the socio-economic system. Given these considerations, both from the perspective of transportation planning and socio-economic analysis, maintaining a necessary proportion of private car usage is essential. Based on scenario-based predictions of energy consumption and emissions, while lowering the minimum proportion of private car usage may lead to increased energy consumption and emissions, it also ensures better system coordination. Achieving green transportation does not equate to simply compromising transportation needs for low-carbon solutions. Instead, it requires minimizing energy consumption and emissions while meeting transportation demands. This represents the true sustainable development concept for green transportation.
(4)
The predictive analysis of energy consumption and emissions across various scenarios demonstrates that the comprehensive restriction scenario yields superior coordination with elevated values for both metrics. This indicates that the scenario represents the most balanced and rational approach, closely aligning with the principles of sustainable transportation development. Moreover, the green transportation coordination evaluation model formulated in this study has proven to be both reasonable and effective, further validating its utility in guiding policy and planning decisions.
(5)
Although this study has yielded a relatively optimized transportation structure, there remains room for further improvement due to the limitations of the optimization model’s solving algorithms and the constraints of multi-objective programming in mathematics. The current transportation structure can still be optimized to better balance urban traffic energy consumption, carbon emission impacts, and residents’ travel demand.
(6)
Furthermore, while the development of urban rail transit has been shown to effectively alleviate the issue of excessive carbon emissions from urban traffic, questions remain about the potential balance between the development of metro systems and ground transportation. Should surface transportation give way to metro development in the process of urban construction? These questions remain unresolved and represent directions for future, in-depth research.

Author Contributions

Conceptualization, Y.Q. and Z.S.; Data curation, X.W.; Formal analysis, Y.Q., Z.S. and J.Z.; Funding acquisition, Y.Q.; Investigation, Z.S.; Methodology, J.Z.; Software, X.W.; Validation, J.Z. and M.Y.; Writing—original draft, Z.S. All authors have read and agreed to the published version of the manuscript.

Funding

This research was funded by the National Social Science Foundation of China (Grant No. 15BJY037), the Double—First Class Major Research Programs, Educational Department of Gansu Province (Grant No. GSSYLXM—04), the Philosophy and social science planning project of Gansu Province (Grant No. 2021YB058), the Higher Education Innovation Fund project of Gansu Province (Grant No. 2020B—113), and the Natural Science Foundation of Gansu Province (Grant No. 23JRRA904).

Informed Consent Statement

Informed consent was obtained from all subjects involved in this study.

Data Availability Statement

All relevant data are presented within this paper.

Conflicts of Interest

The authors declare no conflicts of interest.

References

  1. Liu, Y.J.; Zhang, X.W.; Shen, Y. Technology-driven carbon reduction: Analyzing the impact of digital technology on China’s carbon emission and its mechanism. Technol. Forecast. Soc. Chang. 2024, 200, 123124. [Google Scholar] [CrossRef]
  2. Stockholm Environment Institute. Long-Range Energy Alternatives Planning System User Guide; Stockholm Environment Institute: Stockholm, Sweden, 2018. [Google Scholar]
  3. Wang, P.; Wang, C.; Hu, Y. Analysis of energy consumption in Hunan Province (China) using a LMDI method based LEAP model. In Proceedings of the International Conference on Applied Energy, Cardiff, UK, 21–24 August 2018. [Google Scholar]
  4. Li, Y.; Bao, L.; Li, W.; Deng, H. Inventory and Policy Reduction Potential of Greenhouse Gas and Pollutant Emissions of Road Transportation Industry in China. Sustainability 2016, 8, 1218. [Google Scholar] [CrossRef]
  5. Zhang, X.; Chen, Y.; Jiang, P.; Liu, L.; Xu, X.; Xu, Y. Sectoral peak CO2 emission measurements and a long-term alternative CO2 mitigation roadmap: A case study of Yunnan, China. J. Clean. Prod. 2024, 247, 119171. [Google Scholar] [CrossRef]
  6. Huo, T.; Cao, R.; Du, H.; Zhang, J.; Cai, W.; Liu, B. Nonlinear influence of urbanization on China’s urban residential building carbon emissions: New evidence from panel threshold model. Sci. Total Environ. 2021, 772, 145058. [Google Scholar] [CrossRef]
  7. Lin, D.; Zhang, L.; Chen, C.; Lin, Y.; Wang, J.; Qiu, R.; Hu, X. Understanding driving patterns of carbon emissions from the transportation sector in China: Evidence from an analysis of panel models. Clean Technol. Environ. Policy 2019, 21, 1307–1322. [Google Scholar] [CrossRef]
  8. Zhao, R.D.; Fang, C.L.; Liu, H.M.; Liu, X. Evaluating urban ecosystem resilience using the DPSIR framework and the ENA model: A case study of 35 cities in China. Sustain. Cities Soc. 2021, 72, 102997. [Google Scholar] [CrossRef]
  9. Alnour, M.; Awan, A.; Hossain, M.E. Towards a green transportation system in Mexico: The role of renewable energy and transport public- private partnership to curb emissions. J. Clean. Prod. 2024, 442, 140984. [Google Scholar] [CrossRef]
  10. Jarosław, W.; Aleksandra, B.; Ewa, Z.; Wojciech, S. Sustainable cities and communities assessment using the DARIA-TOPSIS method. Sustain. Cities Soc. 2022, 83, 103926. [Google Scholar]
  11. Wang, Q.; Li, S.Q.; Li, R.R. Evaluating water resource sustainability in Beijing, China: Combining PSR model and matter-element extension method. J. Clean. Prod. 2019, 206, 171–179. [Google Scholar] [CrossRef]
  12. Chen, J.; Wang, W.; Sun, W.; Jiao, Y.; He, Y.; Li, D.; Gong, J. Tapping into the potential CO2 emission reduction of a crude oil transportation system from carbon footprint perspective. J. Clean. Prod. 2023, 413, 137409. [Google Scholar] [CrossRef]
  13. Zhang, L.; Long, R.; Li, W.; Wei, J. Potential for reducing carbon emissions from urban traffic based on the carbon emission satisfaction: Case study in Shanghai. J. Transp. Geogr. 2020, 85, 102733. [Google Scholar] [CrossRef]
  14. Huang, Y.; Wang, Y.; Peng, J.; Li, F.; Zhu, L.; Zhao, H.; Shi, R. Can China achieve its 2030 and 2060 CO2 commitments? Scenario analysis based on the integration of LEAP model with LMDI decomposition. Sci. Total Environ. 2023, 888, 164151. [Google Scholar] [CrossRef] [PubMed]
  15. Mancini, S.; Pezzella, F.; Pisacane, O. A path-based solution approach for the Green Vehicle Routing Problem. Comput. Oper. Res. 2019, 103, 109–122. [Google Scholar]
  16. Maxim, M.; Lyudmila, D. Economic and Information Support of Technological Integration with the use of “Green” Traffic Flows. Transp. Res. Procedia 2022, 61, 715–718. [Google Scholar]
  17. Jia, Z.Y.; Yin, J.W.; Cao, Z.P.; Wei, N.; Jiang, Z.; Zhang, Y.; Wu, L.; Zhang, Q.; Mao, H. Large-scale deployment of intelligent transportation to help achieve low-carbon and clean sustainable transportation. Sci. Total Environ. 2024, 949, 174724. [Google Scholar] [CrossRef]
  18. Duan, H.Y.; Hou, C.H.; Yang, W.; Song, J. Towards lower CO2 emissions in iron and steel production: Life cycle energy demand-LEAP based multi -stage and multi-technique simulation. Sustain. Prod. Consum. 2022, 32, 270–281. [Google Scholar] [CrossRef]
  19. Ren, H.B.; Wu, Q.; He, W.G.; Wang, W.; Luo, X.; Li, Q.; Jiang, Z. Research on regional low-carbon development path based on LEAP model. Taking the Lin-gang Special Area as an example. Energy Rep. 2022, 8 (Suppl. 15), 327–335. [Google Scholar] [CrossRef]
  20. El-Sayed, A.H.A.; Khalil, A.; Yehia, M. Modeling alternative scenarios for Egypt 2050 energy mix based on LEAP analysis. Energy 2023, 266, 126615. [Google Scholar] [CrossRef]
  21. Azam, M.; Othman, J.; Begum, R.A.; Abdullah, S.M.S.; Nor, N.G.M. Energy consumption and emission projection for the road transport sector in Malaysia: An application of the LEAP model. Environ. Dev. Sustain. 2016, 18, 1027–1047. [Google Scholar] [CrossRef]
  22. Shahid, M.; Ullah, K.; Imran, K.; Mahmood, A.; Arentsen, M. LEAP simulated economic evaluation of sustainable scenarios to fulfill the regional electricity demand in Pakistan. Sustain. Energy Technol. Assess. 2021, 46, 101292. [Google Scholar] [CrossRef]
  23. Wang, J.J.; Li, Y.; Zhang, Y. Research on Carbon Emissions of Road Traffic in Chengdu City Based on a LEAP Model. Sustainability 2022, 14, 6525. [Google Scholar] [CrossRef]
  24. Lu, Z.Y.; Huang, L.; Liu, J.; Zhou, Y.; Chen, M.; Hu, J. Carbon dioxide mitigation co-benefit analysis of energy-related measures in the Air Pollution Prevention and Control Action Plan in the Jing-Jin-Ji region of China. Resour. Conserv. Recycl. X 2019, 1, 100006. [Google Scholar] [CrossRef]
  25. Kalayarsan, M.; Murali, M. Optimization of process parameters in EDM using Taguchi method with grey relational analysis and TOPSIS for ceramic composites. Int. J. Eng. Res. Afr. 2016, 22, 83–93. [Google Scholar] [CrossRef]
  26. Hernández, K.D.; Fajardo, O.A. Estimation of industrial emissions in a Latin American megacity under power matrix scenarios projected to the year 2050 implementing the LEAP model. J. Clean. Prod. 2021, 303, 126921. [Google Scholar] [CrossRef]
  27. Bai, C.Q.; Chen, Z.J.; Wang, D.P. Transportation carbon emission reduction potential and mitigation strategy in China. Sci. Total Environ. 2023, 837, 162074. [Google Scholar] [CrossRef]
Figure 1. Location of Lanzhou.
Systems 13 00034 g001
Figure 2. Structure of the carbon emissions measurement model.
Systems 13 00034 g002
Figure 3. Proportions of traffic structure for various scenarios.
Systems 13 00034 g003
Figure 4. Distribution of coordination ranking among districts.
Systems 13 00034 g004
Figure 5. Distribution map of coordination level of each district.
Systems 13 00034 g005
Figure 6. Results of energy consumption projections for each scenario (tons of coal equivalent).
Systems 13 00034 g006
Figure 7. Carbon emission prediction results for various scenarios (ten thousand tons).
Systems 13 00034 g007
Figure 8. Pollution emission prediction results for various scenarios (tons).
Systems 13 00034 g008
Table 1. Classification table of coordination level.
Gray Relative Proximity0.4–0.450.45–0.50.5–0.550.55–0.60.6–0.65
Coordination level12345
CoordinationUncoordinated---Coordinated
Table 2. Table of data parameters for structural optimization model.
Hidden MeaningUnitBusesTaxiMetroPrivate Car
P0Total passenger traffic10,000 people5799.36
LAverage annual distance traveled per mode of travelkilometers/person8.17118.5
εEmission factors for nitrogen dioxide for all modes of travelg/(person-km)19.81407.5116.9
eEnergy consumption factorMJ/(person-km)0.7142.850.3222.795
NAverage passenger load factor for all modes of travelpeople/vehicle402.514001.5
vAverage speed in congested conditionskm/h13.821--21
tAverage delayh/day0.30.2500.4
kAverage fuel consumptionkm/L3.211.1--12
pFuel priceCNY/L5.7------
σAverage noise pollution costsCNY/vehicle24.03------
QExternal costs per vehicle accidentCNY/vehicle148.9677.78--1.73
sPer capita dynamic road aream266--6
oSubsidies for public transport operationsCNY/person3.5--0.5--
UAverage economic costCNY/person1.2515210
RResident population10,000 people334
γAverage resident travel ratetrips/person/day1.89
s0Road area per capitam222.77
hAverage time costh0.5780.4830.6330.558
ωHourly wage per capitaCNY/h18.9
Table 3. Base year parameterization.
Level I ActivitySecondary Activity LevelShare (%)Energy Intensity
Lanzhou TransportationBuses (51.23%)diesel fuel45.920.0085
(L/person-kilometer)
electricity54.080.0188
(degrees/person-kilometer)
Taxi (14.61%)diesel44.480.0280
(L/person-kilometer)
petroleum44.480.0400
(m³/person-kilometer)
electricity11.040.0528
(degrees/person-kilometer)
Metro (6.47%)electricity1000.0018
(degrees/person-kilometer)
Private cars (27.68%)diesel98.990.0567
(L/person-kilometer)
electricity1.010.0933
(degrees/person-kilometer)
Table 4. Indicator data and weights.
Indicator NameNumerical ValueInformation Entropy (Physics)Information Utility ValueWeights
Intersection crossing distance (m)24.60.7740.2260.032
Average spacing of crossing facilities (m)2860.7860.2140.03
Vehicle speed limit on slow-moving roads (km/h)600.7640.2360.033
Average daytime equivalent sound level of road traffic noise/dB68.90.7250.2750.039
Urban transport energy consumption/tons of coal equivalent/0.4040.5960.084
Carbon emissions from urban transport/tons/0.6840.3160.044
Urban transport emissions/tonne/0.5820.4180.059
Public transportation trip-sharing ratio (%)67.80.6650.3350.047
Density of slow road network (km/sq km)8.130.7040.2960.042
Percentage of walking path area (%)29.780.6260.3740.052
Percentage of bicycle path area (%)150.7230.2770.039
Population density (persons/km2)71560.6140.3860.054
Regional GDP (billions, CNY)2877.50.6330.3670.052
GDP per capita (CNY)66,5000.7560.2440.034
POI density (pcs/km2)54.160.7450.2550.036
Table 5. Gray relative proximity.
Baseline ScenarioTheoretical Optimal ScenarioLimiting Rail Transit ScenariosRestrictions on Private Car ScenariosCombined Constraints Scenarios
Gray relative proximity0.3940440.4902920.3977610.4449610.457292
Disclaimer/Publisher’s Note: The statements, opinions and data contained in all publications are solely those of the individual author(s) and contributor(s) and not of MDPI and/or the editor(s). MDPI and/or the editor(s) disclaim responsibility for any injury to people or property resulting from any ideas, methods, instructions or products referred to in the content.

