Exploring the Impact of Quantitative Easing Policy on the Business Performance of Construction Companies with the Debt Ratio as a Moderator
Abstract
1. Introduction
2. Literature Review
2.1. Data Envelopment Analysis
2.2. The Relation between Construction Company Efficiency and DEA
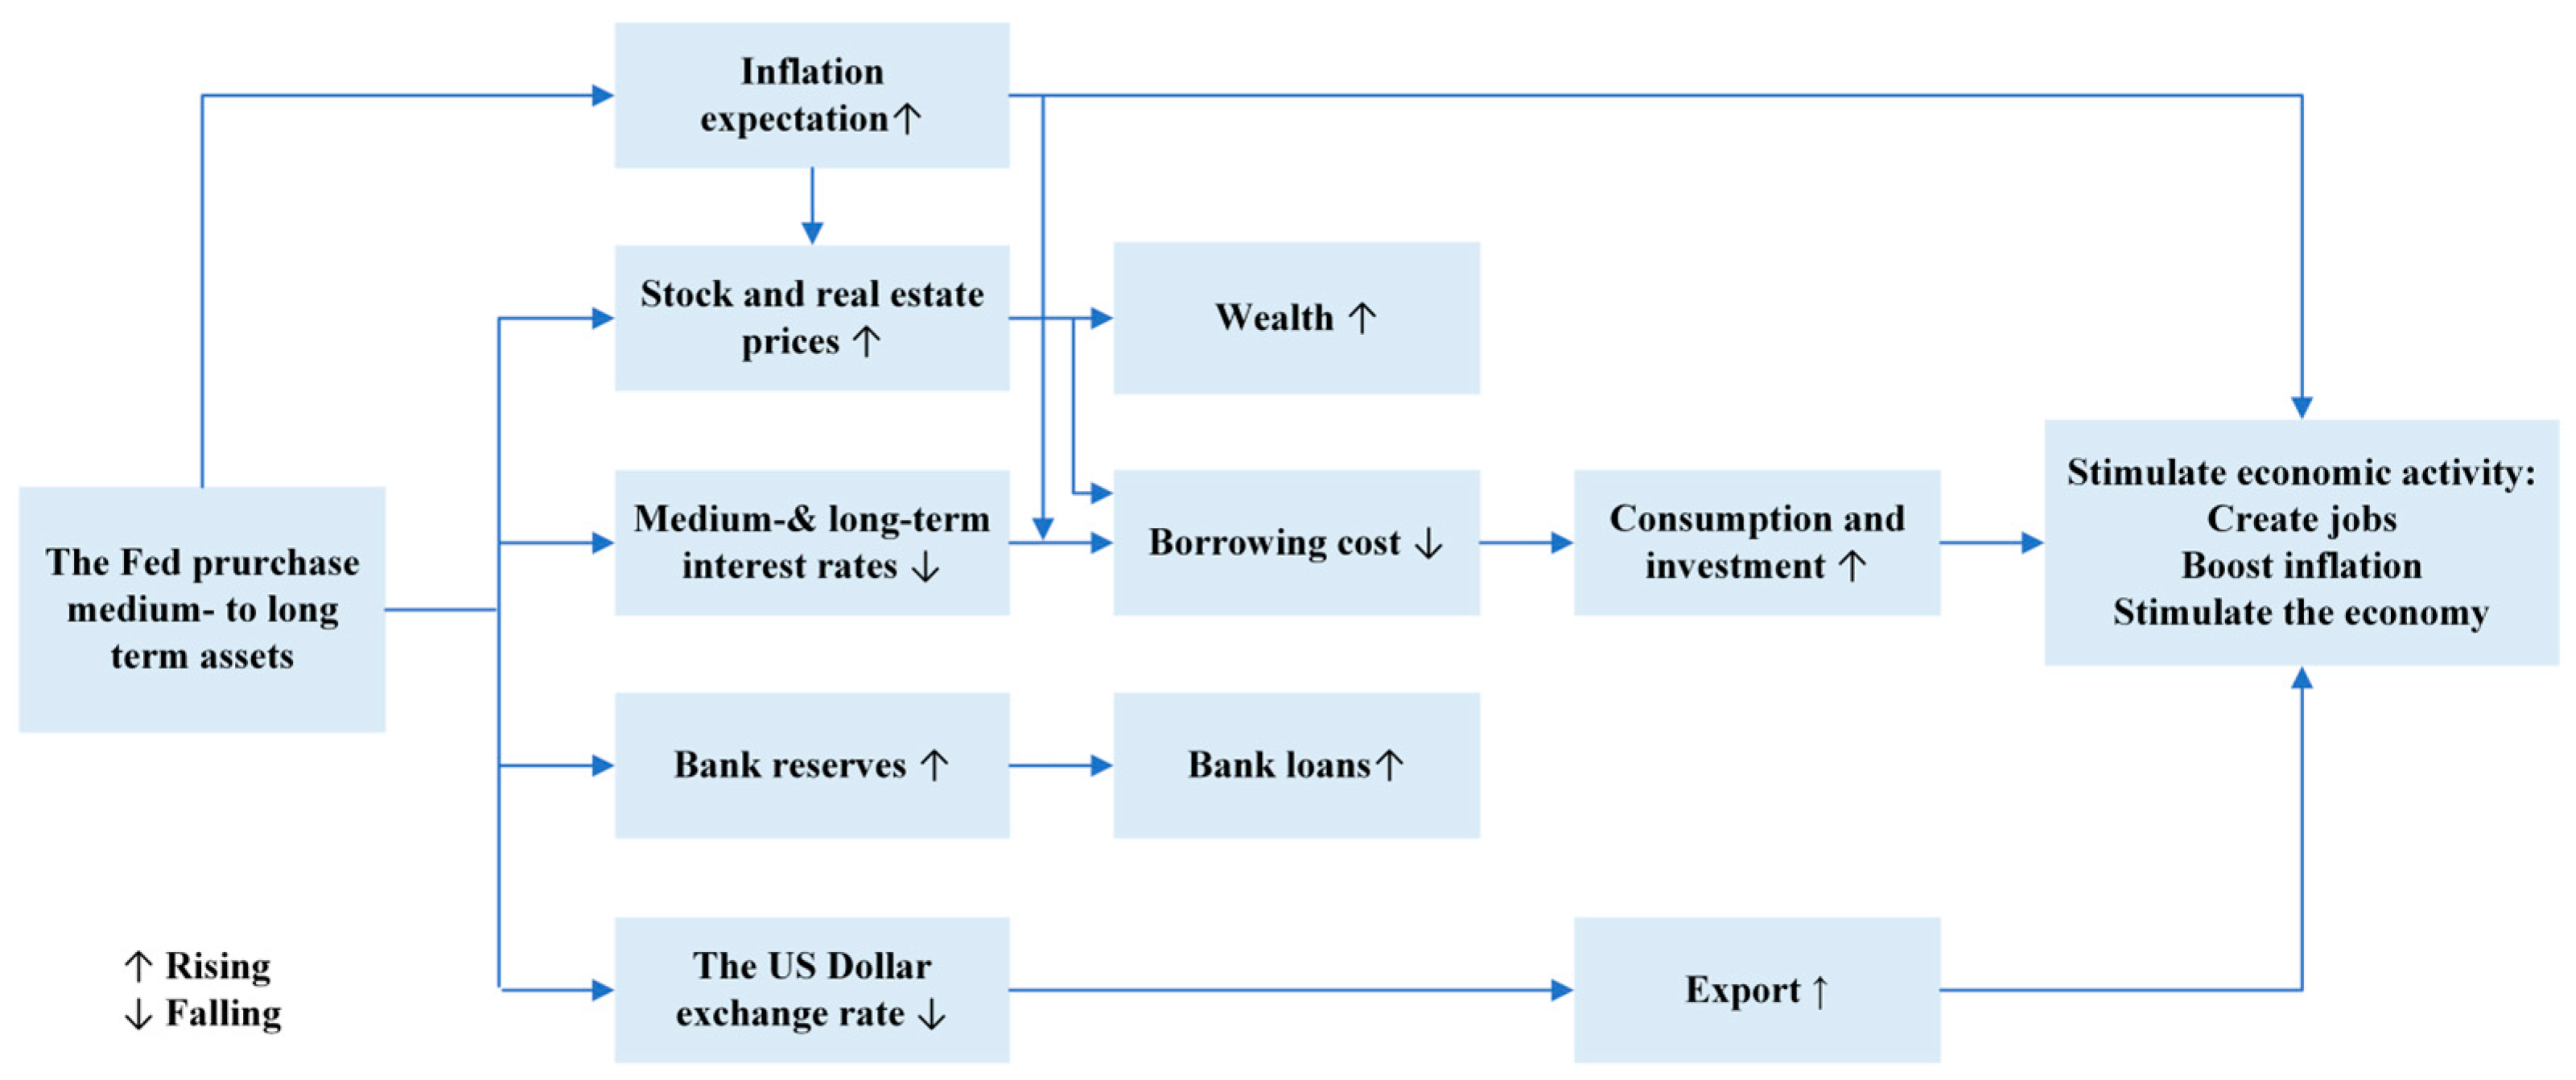
2.3. The Effect of QE Policy on Performance of Construction Companies
3. Methodology
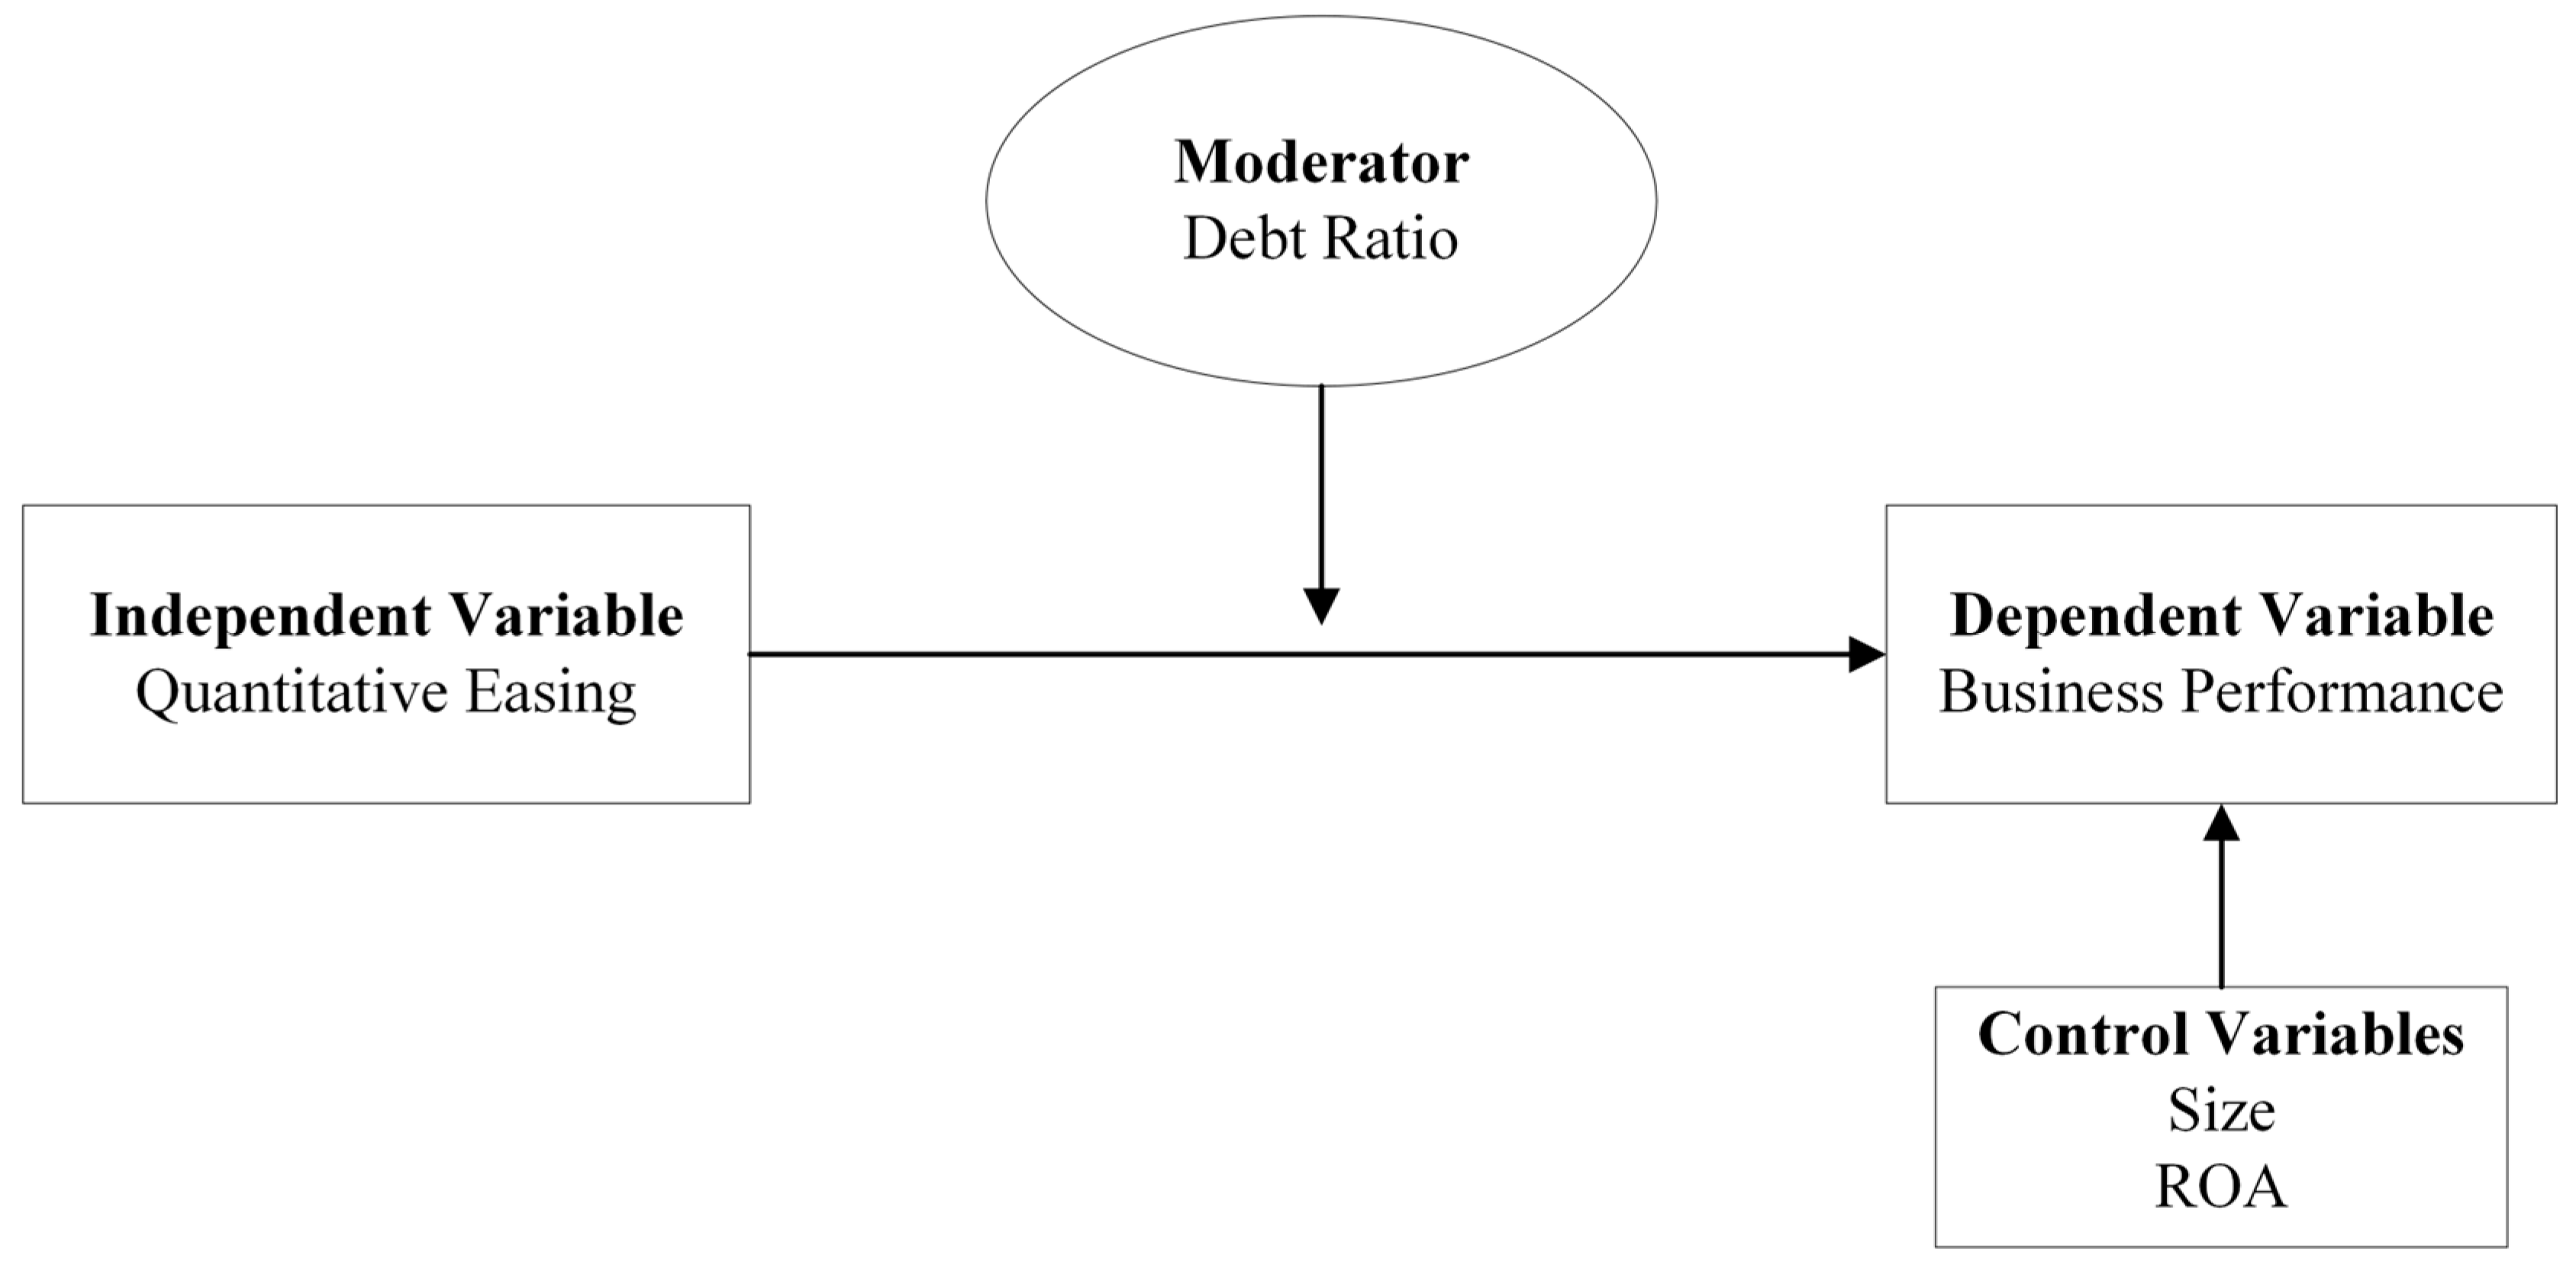
3.1. Research Framework
3.2. Sample and Data
3.3. QE Measurement
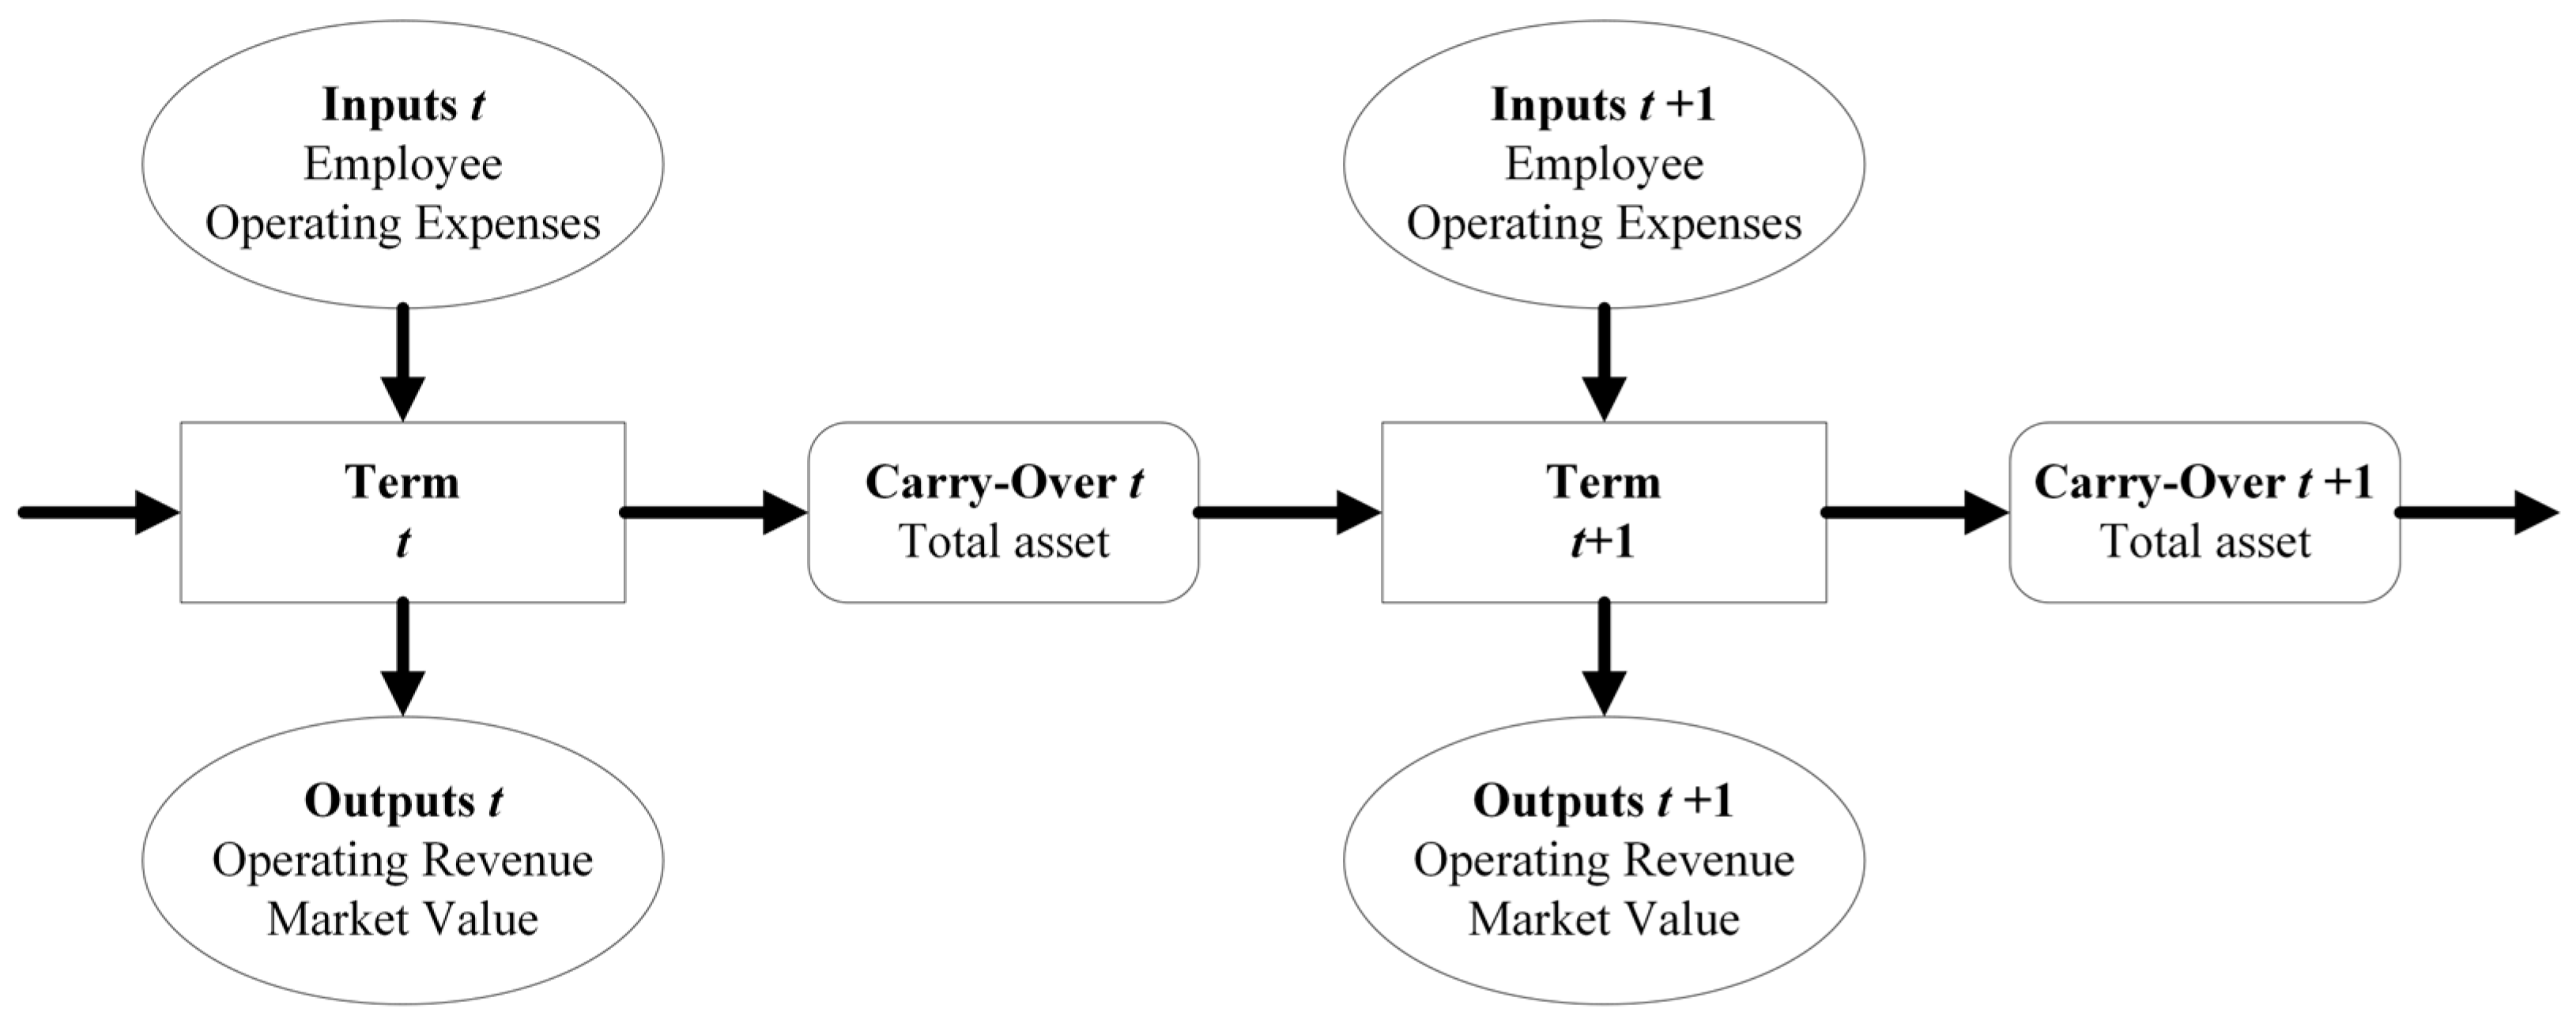
3.4. BP Measurement Using the Dynamic SBM (DSBM) Model
3.5. Debt Ratio Measurement
3.6. Control Variables
3.7. Hierarchical Regression
4. Empirical Analysis
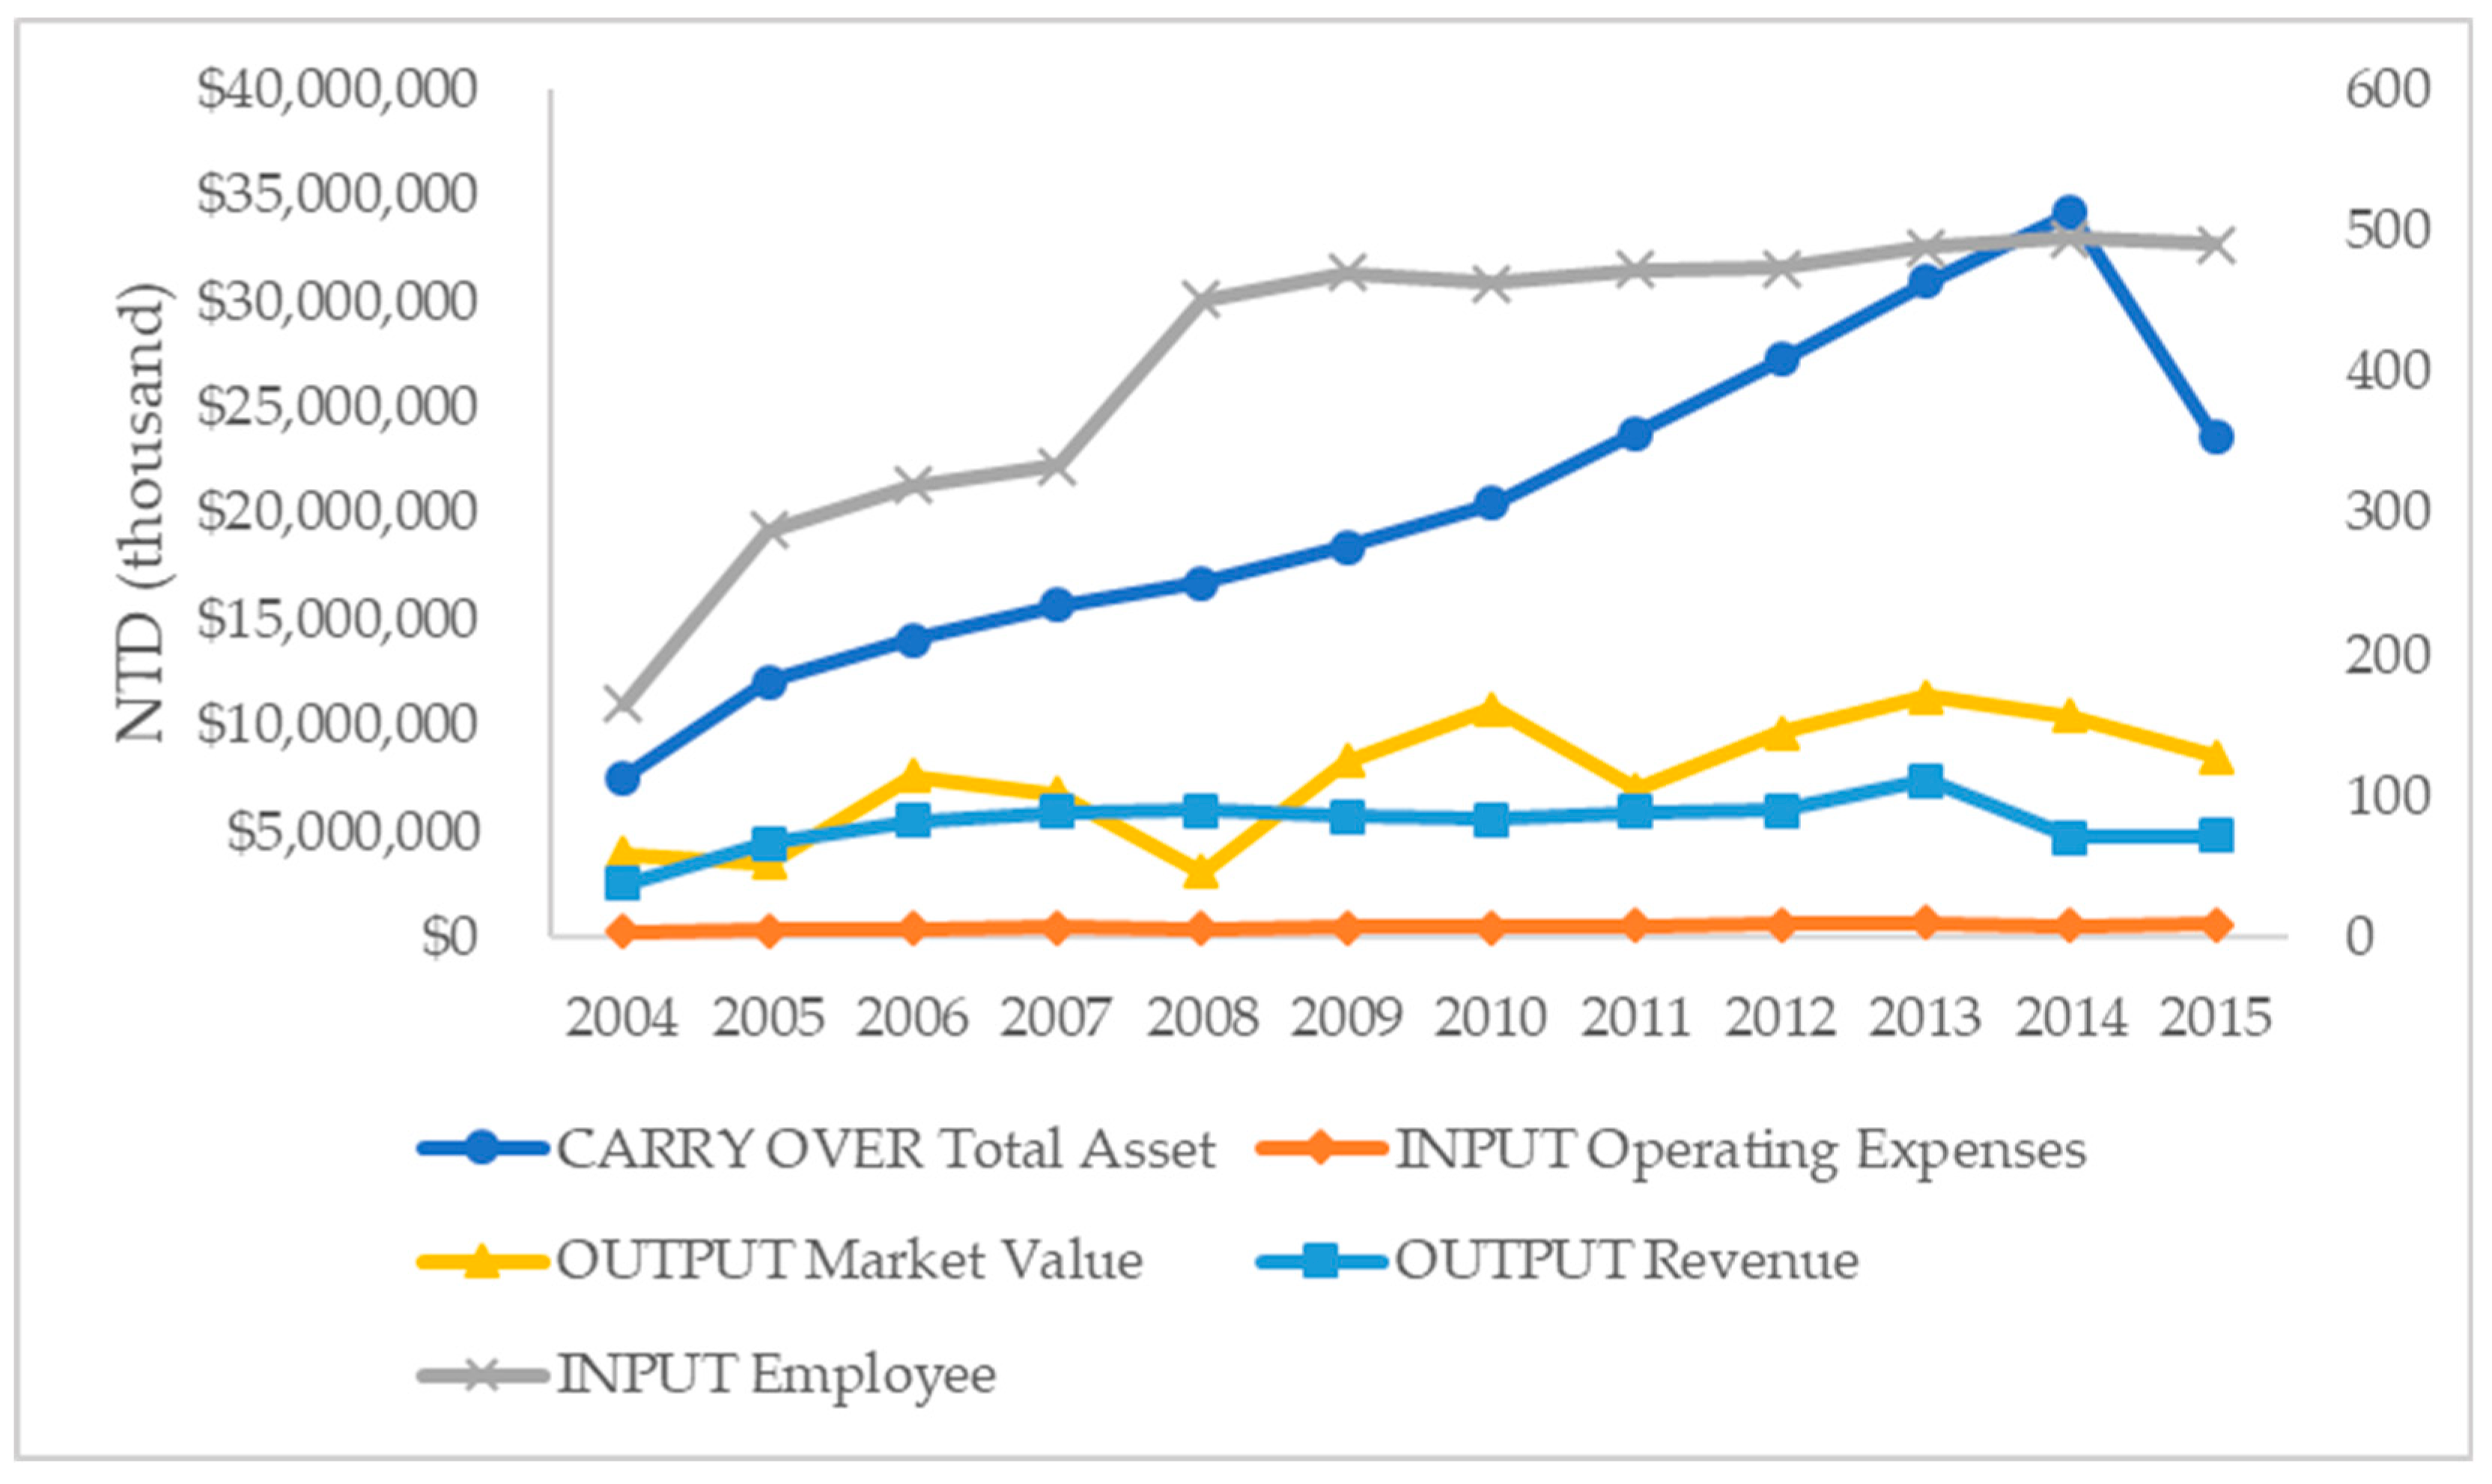
4.1. Development Trend of Variables in Listed Construction Companies
4.2. Analysis of Performance Values before and after QE
4.3. Moderator and the Influence of Control Variables
5. Discussion
6. Conclusions and Implications
6.1. Conclusions
6.2. Implications
6.3. Future Direction
Author Contributions
Funding
Data Availability Statement
Conflicts of Interest
Appendix A
| DMU | 2004 | 2005 | 2006 | 2007 | 2008 | 2009 | 2010 | 2011 | 2012 | 2013 | 2014 | 2015 |
|---|---|---|---|---|---|---|---|---|---|---|---|---|
| On Yao | 0.075 | 0.032 | 0.059 | 0.075 | 0.069 | 0.120 | 0.151 | 0.104 | 0.033 | 0.033 | 0.168 | 0.155 |
| Huayoulian | 0.421 | 0.113 | 0.094 | 1.000 | 1.000 | 0.665 | 0.026 | 1.000 | 1.000 | 1.000 | 0.685 | 0.474 |
| Three Places | 1.000 | 1.000 | 1.000 | 1.000 | 1.000 | 1.000 | 1.000 | 1.000 | 1.000 | 1.000 | 1.000 | 1.000 |
| Mingxuan | 1.000 | 1.000 | 0.393 | 0.923 | 0.665 | 0.610 | 0.611 | 0.932 | 0.717 | 0.664 | 0.735 | 0.633 |
| General | 0.058 | 0.073 | 0.026 | 0.125 | 0.221 | 0.410 | 0.363 | 0.437 | 0.310 | 0.199 | 0.315 | 0.268 |
| Baolai | 0.038 | 0.120 | 0.083 | 0.094 | 0.078 | 0.173 | 0.132 | 0.155 | 0.108 | 0.093 | 0.171 | 0.047 |
| Runlong | 0.257 | 0.397 | 0.299 | 0.282 | 0.385 | 0.255 | 0.361 | 0.382 | 0.407 | 0.121 | 0.648 | 0.446 |
| Haiyatt | 1.000 | 0.999 | 1.000 | 1.000 | 1.000 | 1.000 | 1.000 | 1.000 | 1.000 | 1.000 | 1.000 | 1.000 |
| New Meiqi | 0.948 | 0.979 | 0.989 | 0.984 | 0.871 | 0.942 | 0.495 | 0.235 | 0.177 | 0.076 | 0.175 | 0.123 |
| Guojian | 1.000 | 1.000 | 1.000 | 1.000 | 1.000 | 1.000 | 0.898 | 0.777 | 0.597 | 0.587 | 0.589 | 0.558 |
| Guo Yang | 0.146 | 0.345 | 0.474 | 0.354 | 0.363 | 0.218 | 0.437 | 0.377 | 0.354 | 1.000 | 0.317 | 0.370 |
| Too Set | 0.017 | 0.038 | 0.064 | 0.037 | 0.062 | 0.073 | 0.058 | 0.181 | 0.049 | 0.033 | 0.125 | 0.106 |
| Q-K JP | 0.320 | 0.210 | 0.197 | 0.467 | 0.222 | 0.305 | 0.301 | 0.318 | 0.463 | 0.060 | 0.017 | 0.333 |
| Edward | 0.284 | 0.300 | 0.371 | 0.194 | 0.233 | 0.240 | 0.251 | 0.227 | 0.818 | 0.251 | 0.277 | 0.238 |
| Long Bang | 1.000 | 1.000 | 1.000 | 1.000 | 1.000 | 1.000 | 1.000 | 1.000 | 1.000 | 1.000 | 1.000 | 1.000 |
| Guande | 0.305 | 0.235 | 0.239 | 0.239 | 0.289 | 0.531 | 0.502 | 0.444 | 0.249 | 0.313 | 0.372 | 0.257 |
| Capital | 1.000 | 1.000 | 1.000 | 1.000 | 0.731 | 0.897 | 0.884 | 0.839 | 1.000 | 1.000 | 1.000 | 1.000 |
| Hong Jing | 0.086 | 0.180 | 0.388 | 0.200 | 0.161 | 0.201 | 0.152 | 0.113 | 0.405 | 0.216 | 1.000 | 0.432 |
| Huangpu | 1.000 | 0.187 | 1.000 | 1.000 | 1.000 | 0.823 | 1.000 | 1.000 | 0.771 | 0.834 | 0.474 | 0.328 |
| Huajian | 0.571 | 0.162 | 0.316 | 0.661 | 0.413 | 0.484 | 0.711 | 0.632 | 0.019 | 0.172 | 0.009 | 0.758 |
| Hongsheng | 1.000 | 1.000 | 1.000 | 1.000 | 1.000 | 1.000 | 1.000 | 1.000 | 1.000 | 0.999 | 0.999 | 1.000 |
| Hongpu | 0.585 | 0.776 | 1.000 | 1.000 | 1.000 | 1.000 | 1.000 | 1.000 | 1.000 | 1.000 | 1.000 | 1.000 |
| Announcement | 0.218 | 0.159 | 1.000 | 1.000 | 1.000 | 1.000 | 1.000 | 0.714 | 0.613 | 0.486 | 0.778 | 0.690 |
| Kitai | 0.270 | 0.359 | 1.000 | 0.635 | 0.476 | 0.583 | 1.000 | 1.000 | 1.000 | 1.000 | 0.502 | 0.699 |
| Sakura BL | 1.000 | 1.000 | 1.000 | 1.000 | 1.000 | 1.000 | 1.000 | 1.000 | 1.000 | 1.000 | 1.000 | 1.000 |
| Mountain Forest | 0.141 | 0.010 | 0.018 | 0.030 | 1.000 | 1.000 | 1.000 | 1.000 | 1.000 | 1.000 | 1.000 | 0.264 |
| Hing Fu Fat | 0.373 | 0.502 | 0.491 | 0.488 | 0.766 | 1.000 | 1.000 | 1.000 | 1.000 | 0.999 | 1.000 | 1.000 |
| King Xiang | 0.407 | 0.484 | 0.663 | 0.587 | 0.999 | 1.000 | 1.000 | 1.000 | 1.000 | 1.000 | 0.714 | 0.768 |
| Nissatsu | 0.333 | 0.251 | 0.550 | 0.393 | 0.236 | 0.395 | 0.315 | 0.263 | 0.079 | 1.000 | 0.188 | 0.108 |
| Huagu | 0.381 | 1.000 | 0.997 | 1.000 | 1.000 | 1.000 | 1.000 | 1.000 | 1.000 | 0.694 | 0.768 | 0.940 |
| Scripture | 0.085 | 0.096 | 0.115 | 0.279 | 0.166 | 0.257 | 0.194 | 1.000 | 0.417 | 0.538 | 0.420 | 0.368 |
| Master | 0.048 | 0.028 | 0.023 | 0.088 | 0.119 | 0.407 | 0.408 | 0.579 | 0.572 | 0.292 | 0.360 | 0.337 |
| Rising Sun | 0.076 | 0.085 | 0.056 | 0.139 | 0.155 | 0.206 | 0.572 | 1.000 | 1.000 | 1.000 | 1.000 | 1.000 |
| Longda | 1.000 | 1.000 | 1.000 | 1.000 | 1.000 | 1.000 | 1.000 | 0.696 | 0.857 | 0.406 | 0.406 | 0.321 |
| Farglory | 1.000 | 1.000 | 1.000 | 1.000 | 1.000 | 1.000 | 1.000 | 1.000 | 1.000 | 1.000 | 1.000 | 1.000 |
| Suncheon | 0.276 | 0.365 | 0.569 | 0.427 | 0.276 | 0.359 | 0.436 | 0.462 | 0.458 | 0.255 | 0.423 | 0.463 |
| Country Forest | 0.183 | 0.289 | 0.310 | 0.544 | 0.299 | 0.483 | 0.371 | 0.324 | 0.406 | 0.231 | 0.364 | 0.260 |
| Emperor Ding | 0.388 | 0.275 | 0.249 | 0.528 | 0.486 | 0.852 | 0.519 | 0.612 | 0.399 | 0.129 | 0.433 | 0.354 |
| Changhong | 0.399 | 0.487 | 0.893 | 1.000 | 0.999 | 1.000 | 1.000 | 1.000 | 1.000 | 1.000 | 1.000 | 1.000 |
| Dali | 0.029 | 0.039 | 0.078 | 0.182 | 0.323 | 0.389 | 0.504 | 0.513 | 0.588 | 0.214 | 0.465 | 0.403 |
| Shimbaba | 0.024 | 0.015 | 0.016 | 0.028 | 0.036 | 0.023 | 0.027 | 0.150 | 0.361 | 0.152 | 0.030 | 0.213 |
| Runtaixin | 0.353 | 0.382 | 0.587 | 0.509 | 0.999 | 0.991 | 0.995 | 1.000 | 1.000 | 1.000 | 1.000 | 1.000 |
| Sanfa RE | 0.022 | 0.018 | 0.015 | 0.057 | 0.061 | 0.132 | 0.213 | 0.346 | 0.339 | 0.261 | 0.310 | 0.341 |
Appendix B
| DMU | 2016 | 2017 | 2018 | 2019 | 2020 | 2021 | 2022 |
|---|---|---|---|---|---|---|---|
| On Yao | 0.073 | 0.137 | 0.089 | 0.119 | 0.115 | 0.157 | 0.101 |
| Huayoulian | 0.235 | 0.206 | 0.191 | 0.310 | 0.225 | 0.253 | 0.288 |
| Three Places | 1.000 | 1.000 | 1.000 | 1.000 | 1.000 | 1.000 | 1.000 |
| Asent | 1.000 | 1.000 | 1.000 | 1.000 | 1.000 | 1.000 | 0.528 |
| Mingxuan | 1.000 | 0.450 | 0.345 | 0.536 | 0.471 | 0.676 | 0.685 |
| Honghe | 0.227 | 0.198 | 0.171 | 0.273 | 0.165 | 0.300 | 0.179 |
| General | 0.078 | 0.110 | 0.041 | 0.128 | 0.350 | 0.142 | 0.261 |
| I-HWA | 0.115 | 0.132 | 0.139 | 0.264 | 0.281 | 0.307 | 0.212 |
| Baolai | 0.017 | 0.117 | 0.040 | 0.121 | 0.158 | 0.324 | 0.242 |
| Runlong | 0.314 | 0.337 | 0.526 | 0.308 | 0.425 | 0.613 | 0.387 |
| Haiyatt | 0.128 | 0.177 | 0.152 | 0.169 | 0.201 | 0.314 | 0.202 |
| New Meiqi | 0.045 | 0.052 | 0.077 | 0.081 | 0.073 | 0.187 | 0.201 |
| Guojian | 1.000 | 0.605 | 0.559 | 0.464 | 0.498 | 0.486 | 0.446 |
| Guo Yang | 0.211 | 0.293 | 0.124 | 0.360 | 1.000 | 0.552 | 0.324 |
| Too Set | 0.121 | 0.104 | 0.120 | 0.098 | 0.127 | 0.174 | 0.108 |
| Q-K JP | 0.151 | 0.218 | 0.288 | 0.313 | 0.284 | 0.292 | 0.098 |
| Edward | 0.150 | 0.173 | 0.108 | 0.146 | 0.134 | 0.212 | 0.195 |
| Long Bang | 0.305 | 0.020 | 1.000 | 1.000 | 1.000 | 1.000 | 0.517 |
| Guande | 0.191 | 0.176 | 0.158 | 0.227 | 1.000 | 1.000 | 0.999 |
| Capital | 0.380 | 1.000 | 1.000 | 1.000 | 1.000 | 1.000 | 0.604 |
| Hong Jing | 0.132 | 0.046 | 0.152 | 0.223 | 0.194 | 0.383 | 0.225 |
| Huangpu | 0.165 | 0.126 | 0.516 | 0.649 | 0.207 | 0.688 | 0.625 |
| Huajian | 0.732 | 0.089 | 0.381 | 0.013 | 0.958 | 0.963 | 0.550 |
| Hongsheng | 0.393 | 0.490 | 0.503 | 0.433 | 0.273 | 0.350 | 0.392 |
| Hongpu | 1.000 | 1.000 | 1.000 | 1.000 | 1.000 | 1.000 | 1.000 |
| Announcement | 0.426 | 0.188 | 0.337 | 0.264 | 0.395 | 0.415 | 0.285 |
| Kitai | 0.259 | 0.151 | 0.062 | 0.056 | 0.186 | 0.125 | 0.192 |
| Sakura BL | 0.846 | 0.872 | 0.739 | 1.000 | 1.000 | 1.000 | 1.000 |
| Mountain Forest | 0.230 | 0.159 | 0.138 | 0.199 | 0.279 | 0.359 | 0.401 |
| Hing Fu Fat | 1.000 | 1.000 | 1.000 | 1.000 | 1.000 | 1.000 | 1.000 |
| King Xiang | 1.000 | 1.000 | 1.000 | 1.000 | 0.612 | 0.616 | 0.530 |
| Nissatsu | 0.083 | 0.164 | 0.384 | 0.130 | 0.101 | 0.122 | 0.104 |
| Huagu | 1.000 | 1.000 | 1.000 | 1.000 | 1.000 | 1.000 | 1.000 |
| Scripture | 1.000 | 1.000 | 1.000 | 1.000 | 1.000 | 1.000 | 1.000 |
| Master | 0.238 | 0.273 | 0.185 | 0.528 | 0.535 | 0.577 | 1.000 |
| Rising Sun | 0.202 | 0.179 | 0.204 | 0.284 | 0.323 | 0.252 | 0.277 |
| Longda | 0.145 | 0.166 | 0.212 | 0.298 | 0.340 | 0.343 | 0.264 |
| Farglory | 1.000 | 1.000 | 1.000 | 1.000 | 1.000 | 1.000 | 1.000 |
| Suncheon | 0.205 | 0.193 | 0.287 | 0.315 | 0.218 | 0.208 | 0.383 |
| Country Forest | 0.228 | 0.149 | 0.141 | 0.190 | 0.233 | 0.165 | 0.096 |
| Emperor Ding | 0.143 | 0.135 | 0.137 | 0.179 | 0.237 | 0.256 | 0.301 |
| Changhong | 1.000 | 1.000 | 1.000 | 1.000 | 1.000 | 1.000 | 1.000 |
| Dali | 0.149 | 0.222 | 0.126 | 0.241 | 0.214 | 0.346 | 0.290 |
| Shimbaba | 0.252 | 0.200 | 0.095 | 0.011 | 0.156 | 0.425 | 0.478 |
| Runtaixin | 1.000 | 1.000 | 1.000 | 1.000 | 1.000 | 1.000 | 1.000 |
| Sanfa RE | 0.145 | 0.136 | 0.189 | 0.337 | 0.230 | 0.286 | 0.270 |
References
- Blinder, A.S. Quantitative easing: Entrance and exit strategies. Fed. Reserve Bank St. Louis Rev. 2010, 92, 465–479. [Google Scholar] [CrossRef]
- Neely, C.J.; Fawley, B.W. Four stories of quantitative easing. Fed. Reserve Bank St. Louis Rev. 2013, 95, 51–88. [Google Scholar]
- Mukerji, P.; Saeed, K.; Tan, N. An examination of the influence of household financial decision making on the US housing market crisis. Systems 2015, 3, 378–398. [Google Scholar] [CrossRef]
- CBC. Quantitative Easing Monetary Policy; Central Bank of the Republic of China: Taipei, Taiwan, 2013.
- Bhattarai, S.; Chatterjee, A.; Park, W.Y. Effects of US quantitative easing on emerging market economies. J. Econ. Dyn. Control 2021, 122, 104031. [Google Scholar] [CrossRef]
- Boehl, G.; Goy, G.; Strobel, F. A structural investigation of quantitative easing. Rev. Econ. Stat. 2022, 1–45. [Google Scholar] [CrossRef]
- Rebucci, A.; Hartley, J.S.; Jiménez, D. An event study of COVID-19 central bank quantitative easing in advanced and emerging economies. In Essays in Honor of M. Hashem Pesaran: Prediction and Macro Modeling; Emerald Publishing Limited: Leeds, UK, 2022; Volume 43, pp. 291–322. [Google Scholar]
- Cho, D.; Rhee, C. Effects of Quantitative Easing on Asia: Capital Flows and Financial Markets; Asian Development Bank Economics Working Paper Series; Asian Development Bank: Mandaluyong, Philippines, 2013; Volume 50. [Google Scholar]
- Ho, S.W.; Zhang, J.; Zhou, H. Hot money and quantitative easing: The spillover effects of US Monetary policy on the Chinese Economy. J. Money Credit Bank. 2018, 50, 1543–1569. [Google Scholar] [CrossRef]
- Miyakoshi, T.; Li, K.-W.; Shimada, J.; Tsukuda, Y. The impact of quantitative easing and carry trade on the real estate market in Hong Kong. Int. Rev. Econ. Financ. 2020, 69, 958–976. [Google Scholar] [CrossRef]
- Xu, X.E.; Chen, T. The effect of monetary policy on real estate price growth in China. Pac. Basin Financ. J. 2012, 20, 62–77. [Google Scholar] [CrossRef]
- Farrell, M.J. The measurement of productive efficiency. J. R. Stat. Soc. Ser. A Gen. 1957, 120, 253–281. [Google Scholar] [CrossRef]
- Anderson, R.I.; Fok, R.; Springer, T.; Webb, J. Technical efficiency and economies of scale: A non-parametric analysis of REIT operating efficiency. Eur. J. Oper. Res. 2002, 139, 598–612. [Google Scholar] [CrossRef]
- Topuz, J.C.; Darrat, A.F.; Shelor, R.M. Technical, allocative and scale efficiencies of REITs: An empirical inquiry. J. Bus. Financ. Account. 2005, 32, 1961–1994. [Google Scholar] [CrossRef]
- Horta, I.M.; Camanho, A.S.; Da Costa, J.M. Performance assessment of construction companies: A study of factors promoting financial soundness and innovation in the industry. Int. J. Prod. Econ. 2012, 137, 84–93. [Google Scholar] [CrossRef]
- You, T.; Zi, H. The economic crisis and efficiency change: Evidence from the Korean construction industry. Appl. Econ. 2007, 39, 1833–1842. [Google Scholar] [CrossRef]
- Wang, X.; Lai, W.; Song, X.; Lu, C. Implementation efficiency of corporate social responsibility in the construction industry: A China study. Int. J. Environ. Res. Public Health 2018, 15, 2008. [Google Scholar] [CrossRef] [PubMed]
- Zheng, X.; Chau, K.-W.; Hui, E.C. Efficiency assessment of listed real estate companies: An empirical study of China. Int. J. Strateg. Prop. Manag. 2011, 15, 91–104. [Google Scholar] [CrossRef]
- Dinh, T.N.; Kuo, K.-C.; Lu, W.-M.; Nguyen, D.T. The effect of quantitative easing on Asian construction firms’ performance. Int. J. Constr. Manag. 2023, 23, 38–47. [Google Scholar] [CrossRef]
- Liu, X.-X.; Liu, H.-H.; Yang, G.-L.; Pan, J.-F. Productivity assessment of the real estate industry in China: A DEA-Malmquist index. Eng. Constr. Archit. Manag. 2021, 30, 1243–1270. [Google Scholar] [CrossRef]
- Wang, X.; Chen, Y.; Liu, B.; Shen, Y.; Sun, H. A total factor productivity measure for the construction industry and analysis of its spatial difference: A case study in China. Constr. Manag. Econ. 2013, 31, 1059–1071. [Google Scholar] [CrossRef]
- Xue, X.; Shen, Q.; Wang, Y.; Lu, J. Measuring the productivity of the construction industry in China by using DEA-based Malmquist productivity indices. J. Constr. Eng. Manag. 2008, 134, 64–71. [Google Scholar] [CrossRef]
- Lewis, T.M. The construction industry in the economy of Trinidad & Tobago. Constr. Manag. Econ. 2004, 22, 541–549. [Google Scholar]
- Textor, C. Contribution of the Secondary Sector to Overall GDP of Taiwan from 2011 to 2021, by Subsector. Available online: https://www.statista.com/statistics/706395/taiwan-gdp-share-across-industry-sectors/ (accessed on 3 April 2023).
- Musarat, M.A.; Alaloul, W.S.; Liew, M. Impact of inflation rate on construction projects budget: A review. Ain Shams Eng. J. 2021, 12, 407–414. [Google Scholar] [CrossRef]
- Ofori, G. Nature of the construction industry, its needs and its development: A review of four decades of research. J. Constr. Dev. Ctries 2015, 20, 115. [Google Scholar]
- Charnes, A.; Cooper, W.W.; Rhodes, E. Measuring the efficiency of decision making units. Eur. J. Oper. Res. 1978, 2, 429–444. [Google Scholar] [CrossRef]
- Banker, R.D.; Charnes, A.; Cooper, W.W. Some models for estimating technical and scale inefficiencies in data envelopment analysis. Manag. Sci. 1984, 30, 1078–1092. [Google Scholar] [CrossRef]
- Tone, K. A slacks-based measure of efficiency in data envelopment analysis. Eur. J. Oper. Res. 2001, 130, 498–509. [Google Scholar] [CrossRef]
- Kapelko, M.; Lansink, A.O. Technical efficiency and its determinants in the Spanish construction sector pre-and post-financial crisis. Int. J. Strateg. Prop. Manag. 2015, 19, 96–109. [Google Scholar] [CrossRef]
- Hu, X.; Liu, C. Measuring efficiency, effectiveness and overall performance in the Chinese construction industry. Eng. Constr. Archit. Manag. 2018, 25, 780–797. [Google Scholar] [CrossRef]
- Chen, K.; Song, Y.-Y.; Pan, J.-F.; Yang, G.-L. Measuring destocking performance of the Chinese real estate industry: A DEA-Malmquist approach. Socio-Econ. Plan. Sci. 2020, 69, 100691. [Google Scholar] [CrossRef]
- Yang, Z.; Fang, H. Research on green productivity of chinese real estate companies—Based on SBM-DEA and TOBIT models. Sustainability 2020, 12, 3122. [Google Scholar] [CrossRef]
- Horta, I.M.; Kapelko, M.; Oude Lansink, A.; Camanho, A.S. The impact of internationalization and diversification on construction industry performance. Int. J. Strateg. Prop. Manag. 2016, 20, 172–183. [Google Scholar] [CrossRef]
- Wong, W.P.; Gholipour, H.F.; Bazrafshan, E. How efficient are real estate and construction companies in Iran’s close economy? Int. J. Strateg. Prop. Manag. 2012, 16, 392–413. [Google Scholar] [CrossRef]
- Horta, I.; Camanho, A.; Johnes, J.; Johnes, G. Performance trends in the construction industry worldwide: An overview of the turn of the century. J. Product. Anal. 2013, 39, 89–99. [Google Scholar] [CrossRef]
- Park, J.-L.; Yoo, S.-K.; Lee, J.-S.; Kim, J.-H.; Kim, J.-J. Comparing the efficiency and productivity of construction firms in China, Japan, and Korea using DEA and DEA-based Malmquist. J. Asian Archit. Build. Eng. 2015, 14, 57–64. [Google Scholar] [CrossRef][Green Version]
- IMF. Regional Economic Outlook, April 2014, Asia and Pacific: Sustaining the Momentum: Vigilance and Reforms; International Monetary Fund: Washington, DC, USA, 2014. [Google Scholar]
- Bénétrix, A.S.; Eichengreen, B.; O’Rourke, K.H. How housing slumps end. Econ. Policy 2014, 27, 647–692. [Google Scholar] [CrossRef]
- Füss, R.; Zietz, J. The economic drivers of differences in house price inflation rates across MSAs. J. Hous. Econ. 2016, 31, 35–53. [Google Scholar] [CrossRef]
- Rosenberg, S. The effects of conventional and unconventional monetary policy on house prices in the Scandinavian countries. J. Hous. Econ. 2019, 46, 101659. [Google Scholar] [CrossRef]
- Ryczkowski, M. Money, credit, house prices and quantitative easing—The wavelet perspective from 1970 to 2016. J. Bus. Econ. Manag. 2019, 20, 546–572. [Google Scholar] [CrossRef]
- Zhang, X.; Pan, F. Asymmetric effects of monetary policy and output shocks on the real estate market in China. Econ. Model. 2021, 103, 105600. [Google Scholar] [CrossRef]
- Acharya, V.V.; Plantin, G. Monetary Easing, Leveraged Payouts and Lack of Investment; National Bureau of Economic Research: Cambridge, MA, USA, 2019. [Google Scholar]
- Alter, A.; Elekdag, S. Emerging market corporate leverage and global financial conditions. J. Corp. Financ. 2020, 62, 101590. [Google Scholar] [CrossRef]
- Koráb, P.; Mallek, R.S.; Dibooglu, S. Effects of quantitative easing on firm performance in the euro area. N. Am. J. Econ. Financ. 2021, 57, 101455. [Google Scholar] [CrossRef]
- Frame, W.S.; Steiner, E. Quantitative easing and agency MBS investment and financing choices by mortgage REITs. Real Estate Econ. 2022, 50, 931–965. [Google Scholar] [CrossRef]
- Lin, J.-Y.; Batmunkh, M.-U.J.; Moslehpour, M.; Lin, C.-Y.; Lei, K.-M. Impact analysis of US quantitative easing policy on emerging markets. Int. J. Emerg. Mark. 2018, 3, 185–202. [Google Scholar] [CrossRef]
- Hauzenberger, N.; Pfarrhofer, M.; Stelzer, A. On the effectiveness of the European Central Bank’s conventional and unconventional policies under uncertainty. J. Econ. Behav. Organ. 2021, 191, 822–845. [Google Scholar] [CrossRef]
- Girardin, E.; Moussa, Z. Quantitative easing works: Lessons from the unique experience in Japan 2001–2006. J. Int. Financ. Mark. Inst. Money 2011, 21, 461–495. [Google Scholar] [CrossRef]
- Bowman, D.; Cai, F.; Davies, S.; Kamin, S. Quantitative easing and bank lending: Evidence from Japan. J. Int. Money Financ. 2015, 57, 15–30. [Google Scholar] [CrossRef]
- Martin, C.; Milas, C. Quantitative easing: A sceptical survey. Oxf. Rev. Econ. Policy 2012, 28, 750–764. [Google Scholar] [CrossRef]
- Tone, K.; Tsutsui, M. Dynamic DEA: A slacks-based measure approach. Omega 2010, 38, 145–156. [Google Scholar] [CrossRef]
- Yang, G.-L.; Fukuyama, H.; Chen, K. Investigating the regional sustainable performance of the Chinese real estate industry: A slack-based DEA approach. Omega 2019, 84, 141–159. [Google Scholar] [CrossRef]
- Shin, J.; Kim, Y.; Kim, C. The perception of occupational safety and health (OSH) regulation and innovation efficiency in the construction industry: Evidence from South Korea. Int. J. Environ. Res. Public Health 2021, 18, 2334. [Google Scholar] [CrossRef]
- Kuo, K.-C.; Lu, W.-M.; Nguyen, D.T.; Wang, H.F. The effect of special economic zones on governance performance and their spillover effects in Chinese provinces. Manag. Decis. Econ. 2020, 41, 446–460. [Google Scholar] [CrossRef]
- Kuo, K.C.; Lu, W.M.; Dinh, T.N. Firm performance and ownership structure: Dynamic network data envelopment analysis approach. Manag. Decis. Econ. 2020, 41, 608–623. [Google Scholar] [CrossRef]
- Kuo, K.-C.; Yu, H.-Y.; Lu, W.-M.; Le, T.-T. Sustainability and Corporate Performance: Moderating Role of Environmental, Social, and Governance Investments in the Transportation Sector. Sustainability 2022, 14, 4095. [Google Scholar] [CrossRef]
- Kuo, K.-C.; Lu, W.-M.; Ganbaatar, O. Sustainability and profitability efficiencies: The moderating role of corporate social responsibility. Int. Trans. Oper. Res. 2023, 30, 2506–2527. [Google Scholar] [CrossRef]
- Lu, W.-M.; Wang, W.-K.; Kweh, Q.L. Intellectual capital and performance in the Chinese life insurance industry. Omega 2014, 42, 65–74. [Google Scholar] [CrossRef]
- Lu, W.-M.; Kuo, K.-C.; Tran, T.H. Impacts of positive and negative corporate social responsibility on multinational enterprises in the global retail industry: DEA game cross-efficiency approach. J. Oper. Res. Soc. 2023, 74, 1063–1078. [Google Scholar] [CrossRef]
- Wu, W.; Liang, Z.; Zhang, Q. Effects of corporate environmental responsibility strength and concern on innovation performance: The moderating role of firm visibility. Corp. Soc. Responsib. Environ. Manag. 2020, 27, 1487–1497. [Google Scholar] [CrossRef]
- Lin, F.; Lin, S.-W.; Lu, W.-M. Dynamic eco-efficiency evaluation of the semiconductor industry: A sustainable development perspective. Environ. Monit. Assess. 2019, 191, 1–16. [Google Scholar] [CrossRef]
- Tsai, W.-C.; Chen, C.-C.; Chiu, S.-F. Exploring boundaries of the effects of applicant impression management tactics in job interviews. J. Manag. 2005, 31, 108–125. [Google Scholar] [CrossRef]
- Aiken, L.S.; West, S.G.; Reno, R.R. Multiple Regression: Testing and Interpreting Interactions; Sage: Thousand Oaks, CA, USA, 1991. [Google Scholar]
| Study | Main Issuees Addressed | Region/Country | Decision-Making Units | Method |
|---|---|---|---|---|
| [13] | This study measures technical efficiency and economies of scale for REITs. | US | All REITs as listed in the NAREIT | BCC |
| [14] | This paper explores various efficiency aspects of REITs in light of their remarkable growth in the 1990s. | US | 235 equity REITs | CCR, BCC |
| [16] | This article gauges and analyses different types of efficiency for the period 1996 to 2000. | Korea | Listed construction firms | CCR |
| [22] | This paper measures the productivity changes of the Chinese construction industry from 1997 to 2003. | China | 4 regions construction industry | Malmquist index |
| [18] | This study measures the performance and efficiency of the listed real estate companies. | China | 94 listed real estate companies | CCR, BCC, Super-efficiency DEA |
| [15] | This paper examines trends in the performance of the construction industry and identify the factors that promote excellence and innovation in the sector. | Portugal | 110 major contractors laboring on public works | CCR |
| [35] | This paper explores various efficiency aspects of real estate and construction companies in Iran in light of their remarkable growth in recent years. | Iran | 12 real estate and construction companies | SBM |
| [36] | This paper assesses construction companies’ efficiency levels, exploring in particular the effect of location and activity in the efficiency levels. | Worldwide | 118 construction companies | CCR, Malmquist index |
| [30] | This paper estimates technical efficiency in the construction sector before and after the start of the financial crisis and examines the impact of socio-economic factors on technical efficiency. | Spain | construction industry | DEA |
| [37] | This study aims to compare the efficiency and productivity of Chinese, Japanese, and Korean construction firms between 2005 and 2011. | China, Japan and Korea | 32 construction firms | Malmquist index |
| [34] | This paper investigates the impact of internationalization and diversification strategies on the financial performance of construction companies. | Spain, Portugal | 90,875 construction companies | CCR |
| [31] | This paper aims to develop a simultaneous measurement of overall performance and its two dimensions of efficiency and effectiveness. | China | 31 provinces | Two-stage DEA |
| [32] | This paper aims to measure the evolution of the destocking performance of the real estate industry. | China | 62 central cities and other regions | Malmquist index |
| [33] | This paper evaluates the green productivity of real estate companies statically and dynamically. | China | 15 real estate companies | SBM, Malmquist index |
| Variables | Description | Unit | References |
|---|---|---|---|
| Inputs | |||
| Operating expenses | The expenses incurred through each construction company’s operating activities within the statistical year. | 1000 TWD | [13,14,18,35] |
| Employee | The human capital of each construction company within the statistical year. | Number of people | [15,16,17,18,20,21,22,31,32,33,35,37,54] |
| Outputs | |||
| Revenue | The income received from the operating activities of each construction company within the statistical year. | 1000 TWD | [15,16,18,20,21,30,33,35,36,37,54,55] |
| Market value | The value of each construction company within the statistical year, represented by the total outstanding shares multiplied by the price per share. | 1000 TWD | [56,57,58,59] |
| Carryover | |||
| Total asset | The resources controlled or owned by each construction company within the statistical year. | 1000 TWD | [13,15,18,20,21,22,31,32,33,34,35,37,54] |
| Year | Variable Unit | Mean | Max. | Min. | SD. | K-S Test p-Value | |
|---|---|---|---|---|---|---|---|
| 2004–2015 | CARRYOVER | Total assets | 20,399,651 | 513,765,929 | 67,456 | 49,205,101 | p < 0.01 |
| INPUT | Operating expenses | 505,458 | 4,362,085 | 8255 | 677,382 | p < 0.01 | |
| Employees | 409 | 8777 | 6 | 1081 | p < 0.01 | ||
| OUTPUT | Market value | 7,591,330 | 68,896,213 | 40,600 | 10,439,035 | p < 0.01 | |
| Revenue | 5,375,358 | 93,388,930 | 447 | 10,610,906 | p < 0.01 | ||
| 2004 | CARRYOVER | Total assets | 7,565,555 | 30,612,058 | 357,002 | 8,066,572 | |
| INPUT | Operating expenses | 286,164 | 1,421,472 | 24,278 | 324,750 | ||
| Employees | 165 | 1130 | 9 | 259 | |||
| OUTPUT | Market value | 3,931,228 | 32,467,694 | 144,400 | 5,748,799 | ||
| Revenue | 2,564,752 | 14,682,404 | 8,910 | 3,449,044 | |||
| 2005 | CARRYOVER | Total assets | 12,099,505 | 190,832,588 | 295,297 | 29,037,141 | |
| INPUT | Operating expenses | 371,649 | 2,113,411 | 14,589 | 497,708 | ||
| Employees | 288 | 1788 | 7 | 498 | |||
| OUTPUT | Market value | 3,517,519 | 24,019,468 | 116,926 | 4,684,949 | ||
| Revenue | 4,421,445 | 59,952,117 | 7288 | 9,589,124 | |||
| 2006 | CARRYOVER | Total assets | 14,073,131 | 217,834,482 | 333,846 | 33,196,029 | |
| INPUT | Operating expenses | 440,388 | 2,219,759 | 20,576 | 579,230 | ||
| Employees | 320 | 2308 | 9 | 558 | |||
| OUTPUT | Market value | 7,613,964 | 38,762,451 | 119,799 | 9,224,576 | ||
| Revenue | 5,486,979 | 59,084,516 | 6849 | 10,027,593 | |||
| 2007 | CARRYOVER | Total assets | 15,668,296 | 243,932,850 | 377,687 | 37,217,774 | |
| INPUT | Operating expenses | 471,300 | 2,429,040 | 17,486 | 587,736 | ||
| Employees | 334 | 2364 | 9 | 599 | |||
| OUTPUT | Market value | 6,742,407 | 55,630,640 | 102,068 | 9,801,478 | ||
| Revenue | 5,905,852 | 71,902,022 | 4311 | 11,603,301 | |||
| 2008 | CARRYOVER | Total assets | 16,704,320 | 256,563,380 | 565,971 | 39,304,494 | |
| INPUT | Operating expenses | 451,394 | 2,461,484 | 18,642 | 582,777 | ||
| Employees | 451 | 7746 | 11 | 1245 | |||
| OUTPUT | Market value | 3,077,756 | 16,917,873 | 51,310 | 3,785,155 | ||
| Revenue | 5,974,117 | 93,388,930 | 6098 | 14,590,413 | |||
| 2009 | CARRYOVER | Total assets | 18,424,987 | 298,661,093 | 314,939 | 45,762,671 | |
| INPUT | Operating expenses | 473,080 | 2,884,978 | 17,404 | 657,306 | ||
| Employees | 470 | 8256 | 9 | 1325 | |||
| OUTPUT | Market value | 8,338,648 | 50,011,916 | 56,070 | 10,521,434 | ||
| Revenue | 5,728,271 | 77,054,529 | 7145 | 12,238,482 | |||
| 2010 | CARRYOVER | Total assets | 20,499,210 | 332,823,105 | 260,662 | 50,962,571 | |
| INPUT | Operating expenses | 522,998 | 2,786,296 | 15,539 | 726,323 | ||
| Employees | 463 | 8777 | 6 | 1386 | |||
| OUTPUT | Market value | 10,784,411 | 55,451,066 | 67,200 | 13,403,065 | ||
| Revenue | 5,577,582 | 50,892,148 | 10,189 | 9,370,187 | |||
| 2011 | CARRYOVER | Total assets | 23,802,942 | 363,937,987 | 233,237 | 56,101,951 | |
| INPUT | Operating expenses | 557,832 | 2,953,826 | 11,774 | 751,909 | ||
| Employees | 473 | 7815 | 7 | 1266 | |||
| OUTPUT | Market value | 6,988,937 | 36,643,068 | 48,090 | 8,818,972 | ||
| Revenue | 5,949,557 | 67,769,843 | 10,340 | 11,216,922 | |||
| 2012 | CARRYOVER | Total assets | 27,289,835 | 421,631,217 | 67,456 | 65,125,582 | |
| INPUT | Operating expenses | 612,433 | 4,362,085 | 13,233 | 910,910 | ||
| Employees | 473 | 7815 | 6 | 1266 | |||
| OUTPUT | Market value | 9,701,175 | 59,777,575 | 40,600 | 12,334,021 | ||
| Revenue | 5,973,852 | 91,043,785 | 447 | 14,342,822 | |||
| 2013 | CARRYOVER | Total assets | 30,907,529 | 455,509,421 | 606,556 | 70,653,851 | |
| INPUT | Operating expenses | 691,194 | 3,793,422 | 11,489 | 844,259 | ||
| Employees | 488 | 7815 | 6 | 1265 | |||
| OUTPUT | Market value | 11,370,469 | 68,896,213 | 521,272 | 13,316,573 | ||
| Revenue | 7,416,686 | 71,023,298 | 60,914 | 12,304,434 | |||
| 2014 | CARRYOVER | Total assets | 34,193,889 | 513,765,929 | 609,515 | 79,155,427 | |
| INPUT | Operating expenses | 590,493 | 2,927,776 | 8255 | 701,977 | ||
| Employees | 495 | 7815 | 6 | 1265 | |||
| OUTPUT | Market value | 10,454,865 | 60,105,226 | 662,599 | 12,874,811 | ||
| Revenue | 4,716,964 | 37,515,171 | 9850 | 6,783,894 | |||
| 2015 | CARRYOVER | Total assets | 23,566,612 | 114,195,943 | 619,937 | 26,650,414 | |
| INPUT | Operating expenses | 596,566 | 2,989,867 | 8795 | 741,252 | ||
| Employees | 491 | 7815 | 11 | 1254 | |||
| OUTPUT | Market value | 8,574,579 | 59,707,533 | 471,091 | 11,408,340 | ||
| Revenue | 4,788,241 | 34,638,039 | 23,596 | 6,819,592 |
| Total Asset | Operating Expenses | Employee | Market Value | Revenue | |
|---|---|---|---|---|---|
| Total Asset | 1.000 | ||||
| Operating Expenses | 0.657 ** | 1.000 | |||
| Employee | 0.807 ** | 0.647 ** | 1.000 | ||
| Market Value | 0.326 ** | 0.617 ** | 0.198 ** | 1.000 | |
| Revenue | 0.807 ** | 0.795 ** | 0.720 ** | 0.400 ** | 1.000 |
| Year | 2004 | 2005 | 2006 | 2007 | 2008 | 2009 | Pre QE Mean | 2010 | 2011 | 2012 | 2013 | 2014 | 2015 | Post QE Mean |
|---|---|---|---|---|---|---|---|---|---|---|---|---|---|---|
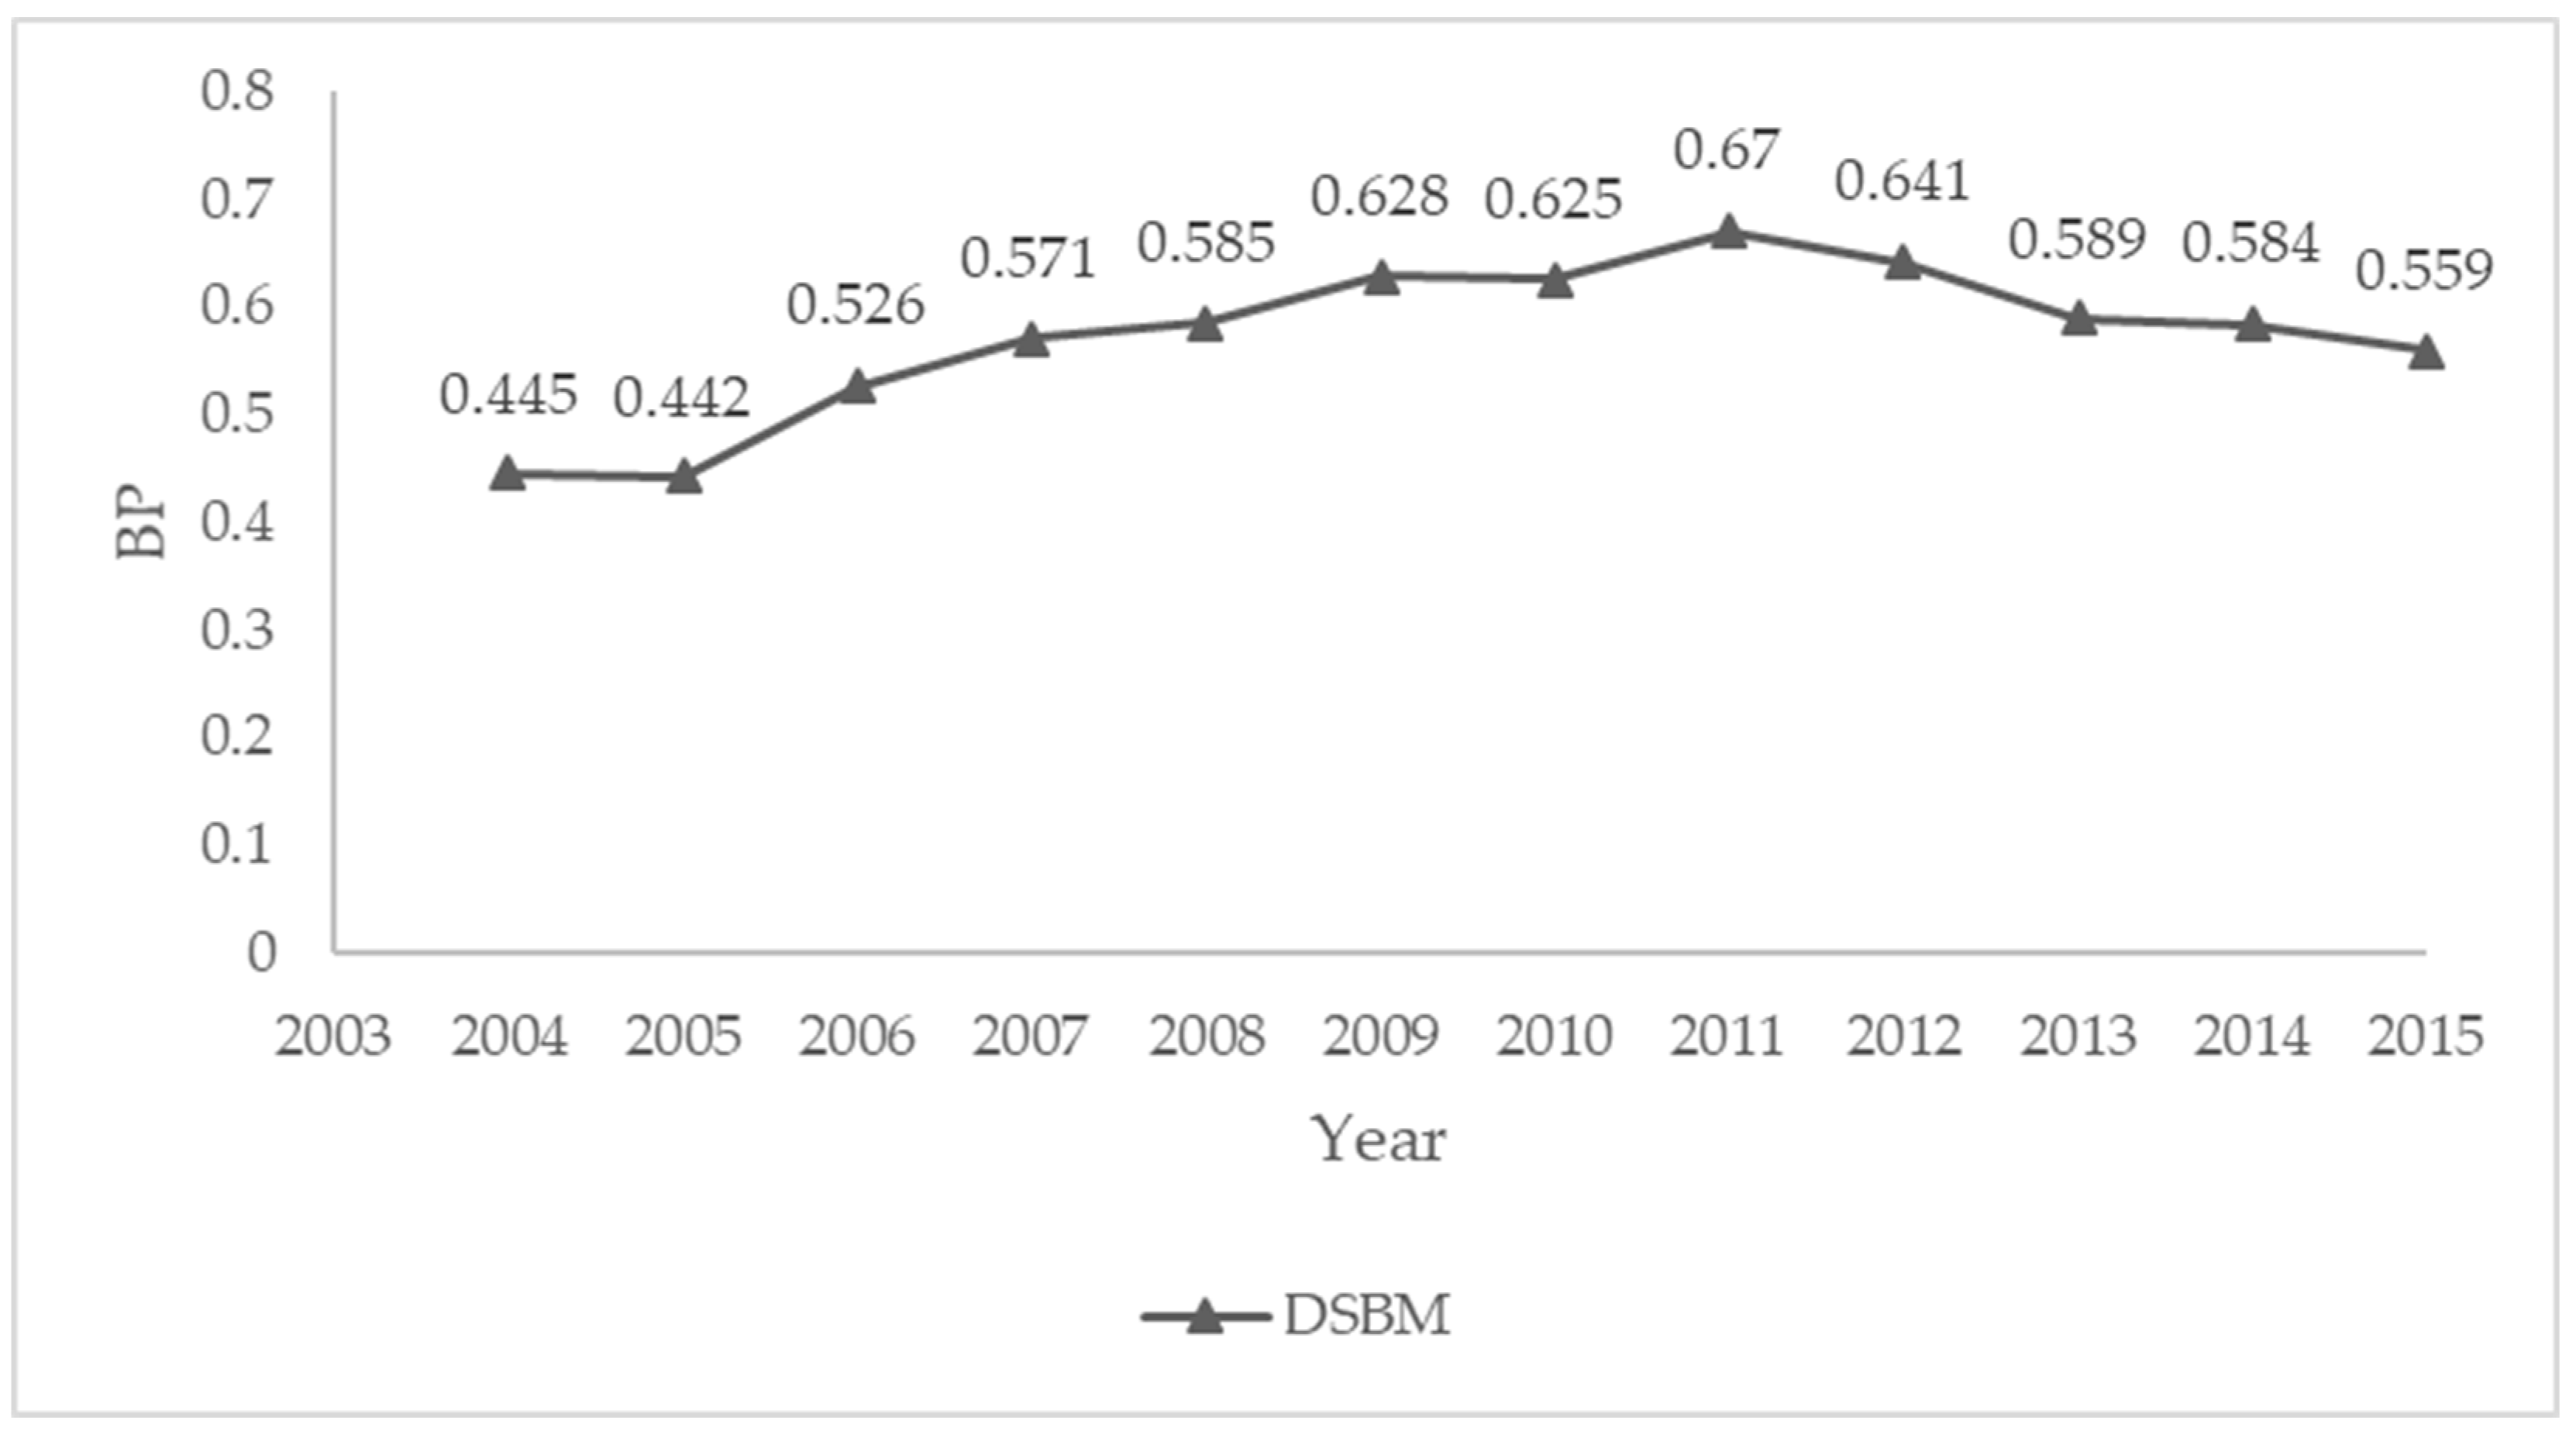
| Mean | 0.445 | 0.442 | 0.526 | 0.571 | 0.585 | 0.628 | 0.535 | 0.625 | 0.670 | 0.641 | 0.589 | 0.587 | 0.559 | 0.612 |
| Max | 1.000 | 1.000 | 1.000 | 1.000 | 1.000 | 1.000 | 1.000 | 1.000 | 1.000 | 1.000 | 1.000 | 1.000 | 1.000 | 1.000 |
| Min | 0.017 | 0.010 | 0.015 | 0.028 | 0.036 | 0.023 | 0.022 | 0.026 | 0.104 | 0.019 | 0.033 | 0.009 | 0.047 | 0.040 |
| SD. | 0.375 | 0.383 | 0.399 | 0.382 | 0.384 | 0.354 | 0.380 | 0.357 | 0.336 | 0.348 | 0.391 | 0.344 | 0.333 | 0.352 |
| DSBM in Different Time Effect | Before QE | After QE | Before QE | After QE | Before QE | After QE | K-S Test (Non-Parametric) | One-Way ANOVA (Parametric) |
|---|---|---|---|---|---|---|---|---|
| Mean | Mean | Std. Dev. | Std. Dev. | df | df | p-Value | p-Value | |
| QE One year lagging | 0.533 | 0.612 | 0.382 | 0.350 | 258 | 258 | p < 0.01 | p < 0.05 |
| QE Two years lagging | 0.546 | 0.609 | 0.380 | 0.350 | 301 | 215 | p < 0.05 | p < 0.10 |
| QE Three years lagging | 0.562 | 0.594 | 0.376 | 0.353 | 344 | 172 | p > 0.10 | p > 0.10 |
| Year | 2016 | 2017 | 2018 | 2019 | 2020 | 2021 | 2022 |
|---|---|---|---|---|---|---|---|
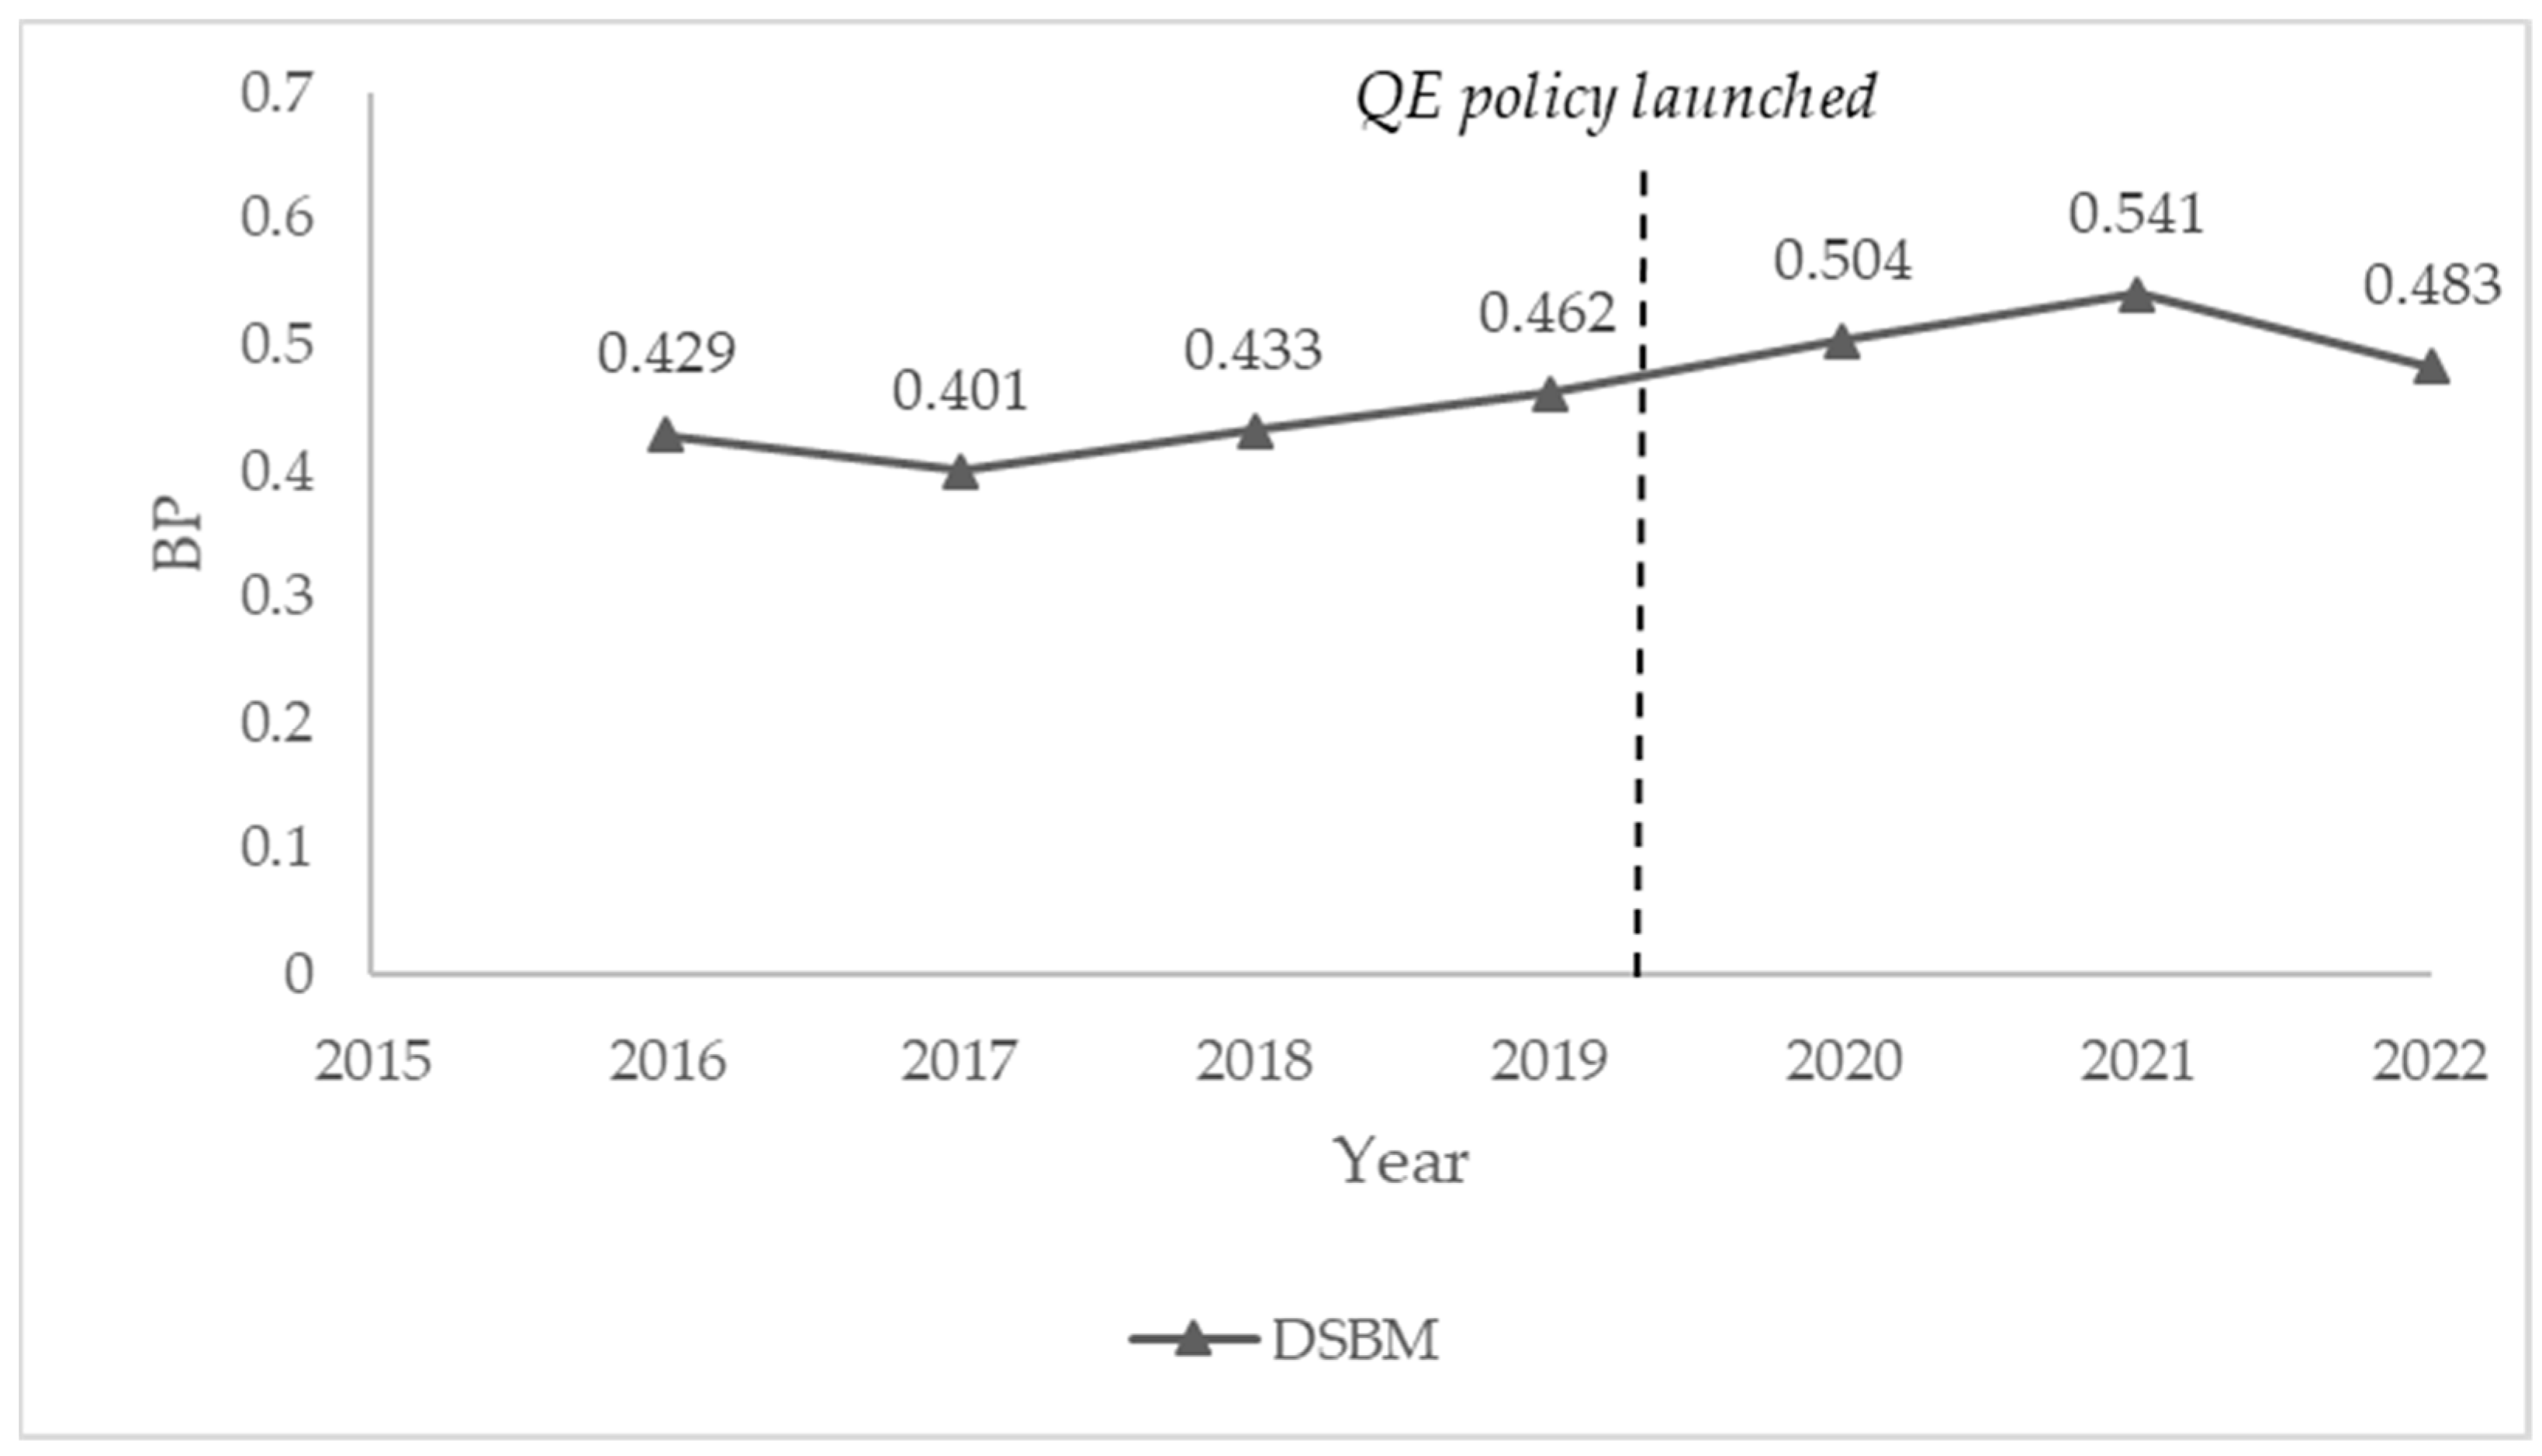
| Mean | 0.429 | 0.401 | 0.433 | 0.462 | 0.504 | 0.541 | 0.483 |
| Max | 1.000 | 1.000 | 1.000 | 1.000 | 1.000 | 1.000 | 1.000 |
| Min | 0.017 | 0.020 | 0.040 | 0.011 | 0.073 | 0.122 | 0.096 |
| SD. | 0.374 | 0.369 | 0.371 | 0.364 | 0.363 | 0.335 | 0.325 |
| BP | ||||
|---|---|---|---|---|
| Variable | Model 1 | Model 2 | Model 3 | Model 4 |
| Control variables | ||||
| SIZE | 0.224 *** | 0.215 *** | 0.222 *** | 0.245 *** |
| ROA | 0.045 | 0.041 | 0.039 | 0.029 |
| Independent variable | ||||
| QE | 0.078 * | 0.076 * | 0.073 * | |
| Moderator | ||||
| Debt Ratio | −0.022 | −0.051 | ||
| Interaction term | ||||
| QE x debt ratio | −1.18 *** | |||
| R-squared | 0.053 0.053 *** | 0.059 0.006 * | 0.059 0.000 | 0.072 0.013 *** |
| F-statistic | 14.330 *** | 3.225 * | 0.228 | 7.078 *** |
| Simple Slope (B) | Std. Error | t-Value | df | p-Value | |
|---|---|---|---|---|---|
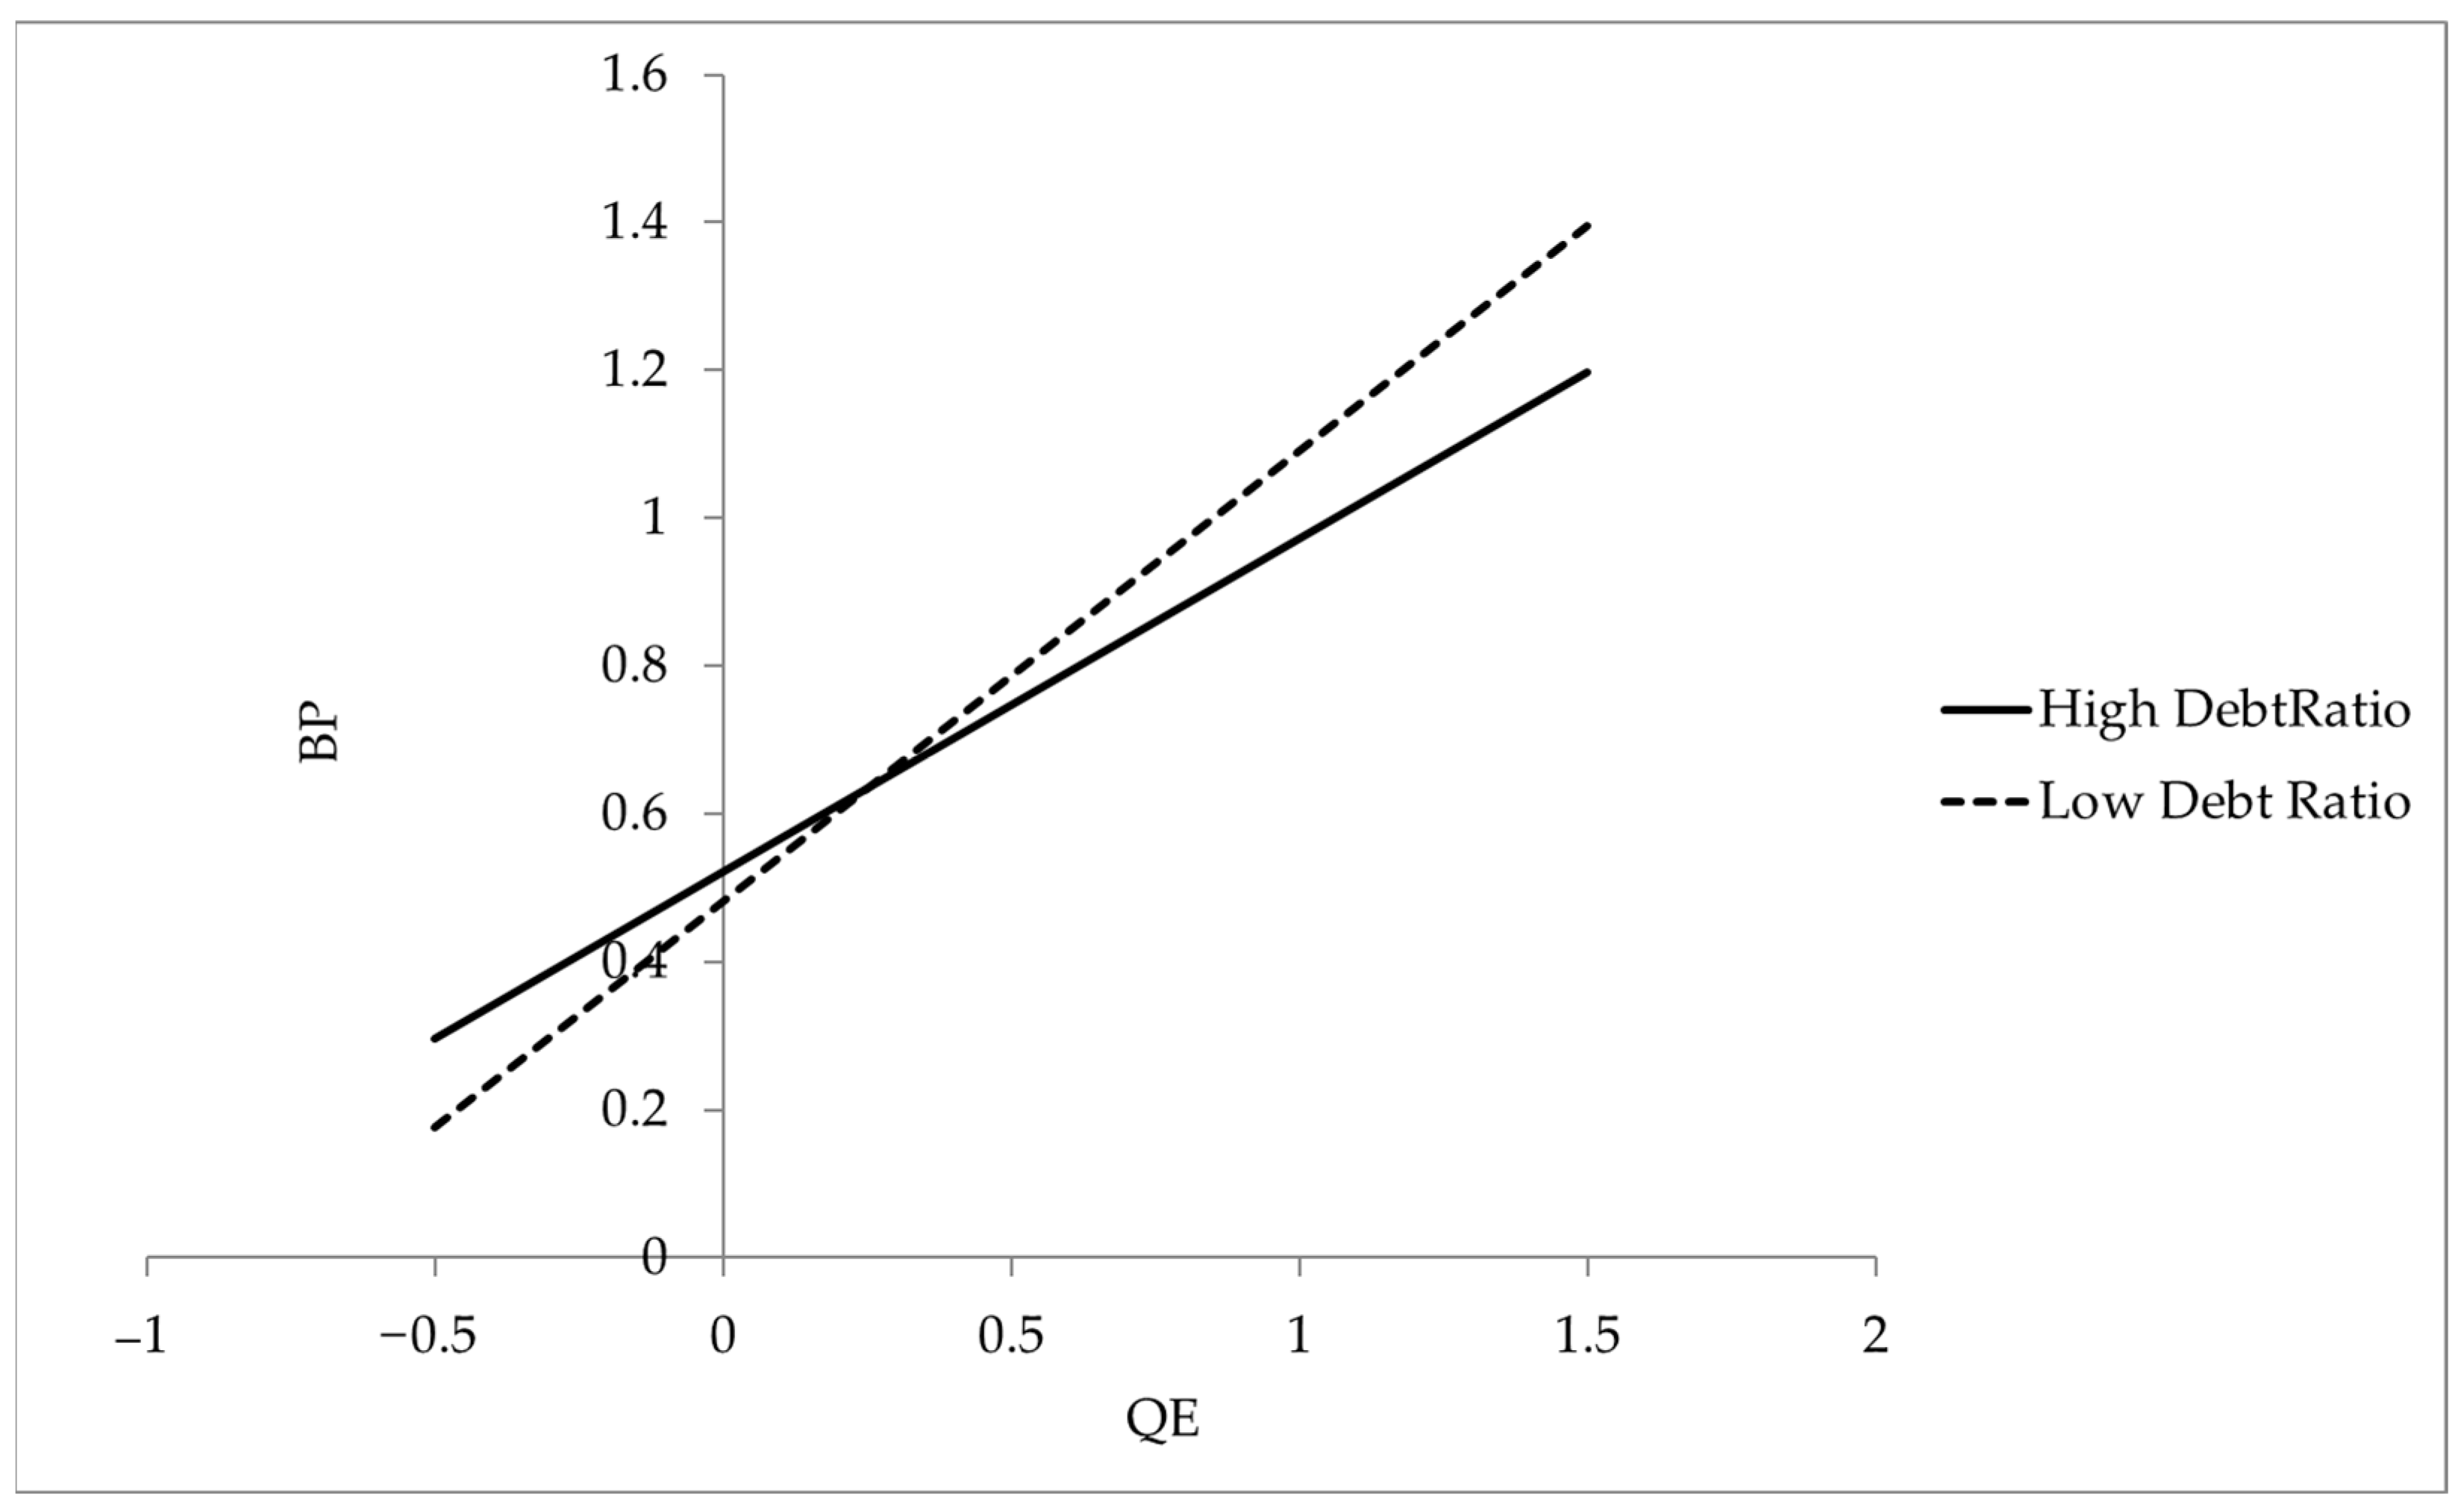
| High Debt Ratio | 0.450 | 0.046 | 9.759 | 512 | 0.000 |
| Low Debt Ratio | 0.610 | 0.045 | 13.626 | 512 | 0.000 |
Disclaimer/Publisher’s Note: The statements, opinions and data contained in all publications are solely those of the individual author(s) and contributor(s) and not of MDPI and/or the editor(s). MDPI and/or the editor(s) disclaim responsibility for any injury to people or property resulting from any ideas, methods, instructions or products referred to in the content. |
© 2024 by the authors. Licensee MDPI, Basel, Switzerland. This article is an open access article distributed under the terms and conditions of the Creative Commons Attribution (CC BY) license (https://creativecommons.org/licenses/by/4.0/).
Share and Cite
Kuo, K.-C.; Lu, W.-M.; Cheng, C.-H. Exploring the Impact of Quantitative Easing Policy on the Business Performance of Construction Companies with the Debt Ratio as a Moderator. Systems 2024, 12, 152. https://doi.org/10.3390/systems12050152
Kuo K-C, Lu W-M, Cheng C-H. Exploring the Impact of Quantitative Easing Policy on the Business Performance of Construction Companies with the Debt Ratio as a Moderator. Systems. 2024; 12(5):152. https://doi.org/10.3390/systems12050152
Chicago/Turabian StyleKuo, Kuo-Cheng, Wen-Min Lu, and Ching-Hsiang Cheng. 2024. "Exploring the Impact of Quantitative Easing Policy on the Business Performance of Construction Companies with the Debt Ratio as a Moderator" Systems 12, no. 5: 152. https://doi.org/10.3390/systems12050152
APA StyleKuo, K.-C., Lu, W.-M., & Cheng, C.-H. (2024). Exploring the Impact of Quantitative Easing Policy on the Business Performance of Construction Companies with the Debt Ratio as a Moderator. Systems, 12(5), 152. https://doi.org/10.3390/systems12050152


