Article

Can Green Credit Improve the Innovation of Enterprise Green Technology: Evidence from 271 Cities in China

1
College of International Economics & Trade, Ningbo University of Finance & Economics, Ningbo 315175, China
2
Ningbo Philosophy and Social Science Key Research Base “Research Base on Digital Economy Innovation and Linkage with Hub Free Trade Zones”, Ningbo 315175, China
3
School of Business, Ningbo University, Ningbo 315211, China
*
Author to whom correspondence should be addressed.
Systems 2024, 12(2), 63; https://doi.org/10.3390/systems12020063
Submission received: 9 January 2024 / Revised: 10 February 2024 / Accepted: 16 February 2024 / Published: 19 February 2024
(This article belongs to the Section Systems Practice in Social Science)

Abstract

:
With the promotion of the “carbon neutrality” and “carbon peak” initiatives, green credit plays an important role in helping enterprises to change their high-pollution, high-energy-consumption production methods and establishing a sound green, low-carbon, and circular economic system. This study used spatial correlation analysis and a fixed effects SDM model to examine the spatiotemporal and causal relationship between green credit levels and enterprise green technology innovation in 271 prefecture level cities in China from 2013 to 2021. It found that (1) green credit and green technology innovation levels are both highest in the eastern region, followed by the central region, and exhibit spatial correlation characteristics. The main types of agglomeration are high–high and low–low agglomeration. (2) Green credit has a significant enhancing effect on green technology innovation in enterprises, and this conclusion still holds after robustness and endogeneity tests. (3) There is significant regional heterogeneity in the impact of green credit on green technology innovation, mainly concentrated in the central and western regions. (4) Green credit can significantly increase enterprise R&D investment and enhance the level of green technology innovation through this channel. Finally, some policy implications are provided to the decision-making departments that can be used for reference.

1. Introduction

In recent years, China has achieved remarkable economic and social development. However, it is increasingly facing environmental constraints. Green finance, with green credit as its core, is an important driving force for China’s green development and there is an inevitable need to promote the comprehensive green transformation of economic and social development. Against the backdrop of green transformation gradually becoming an international consensus, enterprises, as one of the main contributors to China’s carbon emissions, play a crucial role in realizing the “dual carbon” goals through green technological innovation and improving the efficiency of green transformation [1]. As a major carbon emitter, China needs to take on more responsibility in green development and low-carbon emissions reduction. In 2022, the National Development and Reform Commission and the Ministry of Science and Technology jointly issued the “Implementation Plan for Further Improving Market-Oriented Green Technological Innovation System (2023–2025)”, which emphasized the need to strengthen financial support for green technologies by providing green credit and green bonds [2,3]. The scale of green credit has been continuously expanding, and the construction of the market system has been continuously improving. The balance of green credit in China has reached CNY 22.03 trillion, displaying a year-on-year increase of 38.5%, which is 28.1 percentage points higher than the growth rate of various loans.
Numerous scholars have begun to explore the relationship between green credit and sustainable development. As an emerging research object, many scholars conduct research from different perspectives. The main research content can be divided into the following three aspects.
Firstly, there is a focus on green credit, including the connotations, products, business implications, and implementation. Different scholars have different views on the connotations of green credit. Most scholars view green credit as a product with the goal of helping enterprises to reduce their energy consumption [4], save resources [5], introduce more financial resources into the green and low-carbon field, change the development mode of enterprises, and enhance sustainable development capabilities [6]. Different commercial banks design differentiated green credit products based on their own capital capacity and implementation conditions to meet the funding needs of different industries and enterprises [7]. Scholars also perform analysis from the perspective of banks regarding what conditions are required for the development of green credit business, as well as the difficulties and obstacles that may be faced, and then propose relevant solutions [8]. Moreover, some scholars have paid attention to the significance and value of green credit in the construction of green financial product systems and the promotion of industrial green development with relevant data and cases [9,10].
Secondly, green credit as a policy tool can be used to evaluate pollution reduction and carbon reduction, green development, corporate financing costs, and environmental protection [11,12]. As an environmental policy, the policy effect of green credit cannot be ignored. Scholars generally believe that green credit is a financial policy formulated by a country in the face of environmental protection requirements and emission reduction pressures, with the aim of transforming economic growth patterns, promoting green technology innovation [13], and achieving sustainable development [14,15]. Therefore, many scholars use policy evaluation methods to assess the implementation effectiveness of green credit [16]. Some studies have focused on enterprises, while others not only focused on enterprises, but also on industries, cities, regions, and a country [17,18,19], analyzing and exploring the impact of green credit from different perspectives. The general conclusion drawn by scholars is that green credit can effectively reduce pollutant emissions and improve green development capabilities, but this effect may also have multiple heterogeneous characteristics.
Thirdly, as financial institutions are the main recipients of green credit, the interaction between green credit and commercial banks is also an important research field. Commercial banks can channel funds into projects, enterprises, and industries that are conducive to environmental protection through differentiated pricing and targeted loan placements [20], achieving green and efficient allocation of financial resources [21]. At the same time, commercial banks utilize their advantages to effectively avoid operational risks [22], reduce non-performing loan ratios [23], increase profits, and promote green development. Some scholars have also paid attention to the various negative impacts that green credit may have on commercial banks, and emphasized that through product optimization, institutional design, business process reengineering, and institutional mechanism improvement, green credit can effectively play a role in promoting green development [24].
In summary, the research results on green credit are constantly being enriched, and the research methods are becoming increasingly diverse. The research related to green credit has gradually attracted the attention and interest of scholars. Meanwhile, we believe that the following aspects can be explored in depth. Firstly, further analysis and exploration are needed of the various economic and social impacts that the issuance of green credit may have. Secondly, current scholars focus on the relationship between green credit, pollution reduction, carbon reduction, and environmental protection [25]. However, the realization of environmental benefits depends on the continuous improvement of the green innovation level. However, the research results related to green credit and green innovation still need to be enriched and improved.
Therefore, this paper attempts to focus on green credit as the main research object, analyzes the relationship between green credit and green technology innovation, and explores the underlying mechanisms, in order to provide policy inspiration and a reference for improving the role of green credit in promoting green development.
This paper takes the green credit and corporate green technological innovation levels of 271 prefecture-level cities in China as the research objects. Differing from most provincial-level studies, it explores the influence of green credit on corporate green technological innovation from the perspective of prefecture-level cities, which fills in the important gap regarding the link between provincial-level studies and prefecture-level cities.

2. Research Methods and Data Sources

2.1. Spatial Correlation Analysis

Spatial autocorrelation analysis can be used to examine the correlation between a given element and its neighboring spatial elements. Among the methods used to measure spatial autocorrelation, the most widely used is Moran’s I [26]. In this study, we utilized Stata 16 software to construct an adjacency spatial weight matrix for 271 cities based on the distribution of prefecture-level cities in China. By combining the levels of green credit and corporate green technological innovation in these 271 cities, we calculated the global Moran’s I and plotted a scatterplot of local Moran’s I for the period from 2013 to 2021. This analysis allowed us to analyze the changing trend of spatial correlation. The formula for Moran’s I is as follows.
I = n i = 1 n j = 1 n w i j ( x i x ¯ ) ( x j x ¯ ) i = 1 n j = 1 n w i j i = 1 n ( x i x ¯ ) 2
where n is the total number of provincial units, xi denotes the observed value of the ith region, x ¯ denotes the average value of all provinces observed, and wij is the value of the spatial weight matrix. The value of Moran’s Index ranges from −1 to 1. A positive value indicates positive spatial autocorrelation, suggesting the presence of spatial clustering. A negative value indicates negative spatial autocorrelation, indicating the absence of spatial clustering [27]. Additionally, the larger the absolute value of Moran’s I, the stronger the correlation.

2.2. Spatial Measurement Modeling

2.2.1. Model Setup

The ordinary panel regression model is a commonly used method for quantitatively revealing causal relationships between variables. The spatial econometric model is a statistical analysis model for spatial data, which deeply considers the autocorrelation and heterogeneity of spatial data, and helps to explain the distribution characteristics and interrelationships of spatial data. The core of the spatial econometric model lies in spatial correlation—that is, the interaction between the various elements in the space. This effect is particularly pronounced at a distance, and gradually diminishes as the distance increases. In order to provide the most accurate estimation of the causal relationships between variables, it was necessary to first test whether variables such as green technological innovation and green credit exhibit significant spatial correlation. If this characteristic existed, it was then necessary to further analyze the data using spatial regression models.
To further investigate the impact of green credit on enterprise green technological innovation, this study employed a panel econometric model with dual fixed effects to examine the relationship. The basic model is specified as the Equation (2).
ln G r e e n   T i t = α + γ ln G r e e n   P i t + ϕ c o n t r o l i t + a i + λ t + u i t
In the above equation, Green T denotes corporate green technology innovation; Green P denotes green credit; control denotes each control variable; ϕ denotes the coefficients of each control variable; γ denotes the constant term; i and t denote the region and the year, respectively; a i and λ t denote the individual and time effects, respectively; and u i t denotes the random error term.
On this basis, a spatial econometric modeling that incorporated spatial relationships into the measurement was further constructed to capture more accurate causal relationships between variables, and a spatial Durbin model was constructed as shown in the Equation (3), in which W represents the spatial weighting matrix; WlnGreen T, WlnGreen P, and Wcontrol denote the spatial lags of green technological innovation, green credit, and the control variables of the enterprises, respectively; and ρ , ξ , ζ are the coefficients. The rest of the variables are consistent with those in the Equation (2).
ln G r e e n   T i t = α 1 + ρ W ln G r e e n   T i t + γ 1 ln G r e e n   P i t + ξ W ln G r e e n   P i t + ϕ c o n t r o l s i t + ζ W c o n t r o l s i t + a i + λ t + u i t
Furthermore, when considering the impact of green credit on enterprise green technological innovation, this study further investigated whether green credit affects the level of enterprise green technological innovation through the mediating variable of scientific research investment. Therefore, this study established a mediation effect model with the total R&D investment of all enterprises in each prefecture-level city as the mediating variable, denoted as R&D, as follows:
ln G r e e n   T i t = α 2 + γ ln G r e e n   P i t + ϕ c o n t r o l i t + a i + λ t + u i t
ln m e d i a t o r i t = β + γ 2 ln G r e e n   P i t + ϕ c o n t r o l i t + a i + λ t + u i t
ln G r e e n   T i t = δ + γ 3 ln G r e e n   P i t + η ln m e d i a t o r i t + ϕ c o n t r o l i t + a i + λ t + u i t
In the above equation, mediator represents the mediating variable R&D, and the rest of the variable settings are consistent with Equation (2). The validation steps were as follows: firstly, we tested γ , γ 2 and η in the Equations (4)~(6). If all three coefficients were significant, this indicated that there is a mediating effect. Then, we compared whether γ 3 in the Equation (6) was lower than γ in the Equation (2), which was used to indicate whether the mediating variables play a significant role in mediation.

2.2.2. Description of Variables

The dependent variable in this study was enterprise green technological innovation (Green T), measured by the number of green patents obtained by all enterprises in each prefecture-level city in the current year. The selected independent variable in this study was green credit (Green P), measured by multiplying the value added of the six major high-energy-consuming industries in prefecture-level cities by the proportion of interest expenses of the six major high-energy-consuming industries in each province. The control variables in this study were enterprise size (size), leverage ratio (lev), current ratio (flowr), capital structure ratio (caps), years of business establishment (age), and cash flow ratio (cfo). Regarding the selection of the mediating variable, to further investigate whether green credit affects the level of enterprise green technological innovation through the mediating variable of scientific research investment, this study adopted the total scientific research and development investment of all enterprises in each prefecture-level city as the mediating variable, denoted as R&D, and established a mediation effect model for testing. Moreover, for the selection of instrumental variables, this study utilized the average value of green credit in all other regions in the current year as the instrumental variable. The development of the green credit level has a high degree of temporal dependence, meaning that the green credit level in previous years has a significant impact on the green credit level in the current year. This satisfies the criterion for the correlation between the instrumental variable and the endogenous variable. Additionally, using the average value of green credit in all other regions in the current year as the instrumental variable fulfills the exogeneity assumption of instrumental variables. This is because the spatial spillover effects of green credit development, especially from neighboring regions, can promote the development of green credit level in the local region to some extent, thereby further influencing the level of enterprise green technological innovation in the local region. The specific variable selection is shown in Table 1.

2.3. Data Sources

This study used a sample of 271 prefecture-level cities in China from 2013 to 2021, excluding the prefecture-level cities with severe issues regarding missing data n Guangxi Zhuang Autonomous Region, Hainan Province, Qinghai Province, and Tibet Autonomous Region. In terms of data sources, the urban-level data for green credit were obtained from the statistical yearbooks of each prefecture-level city and the China Economic and Social Big Data Research Platform. The data on enterprise green technological innovation were based on all A-share listed companies in China from 2013 to 2021. According to the registration location of each enterprise, the data were aggregated to the prefecture-level city level. Data were obtained from the China Stock Market & Accounting Research Database as well as the CSR Report text database.

3. Characterization Facts

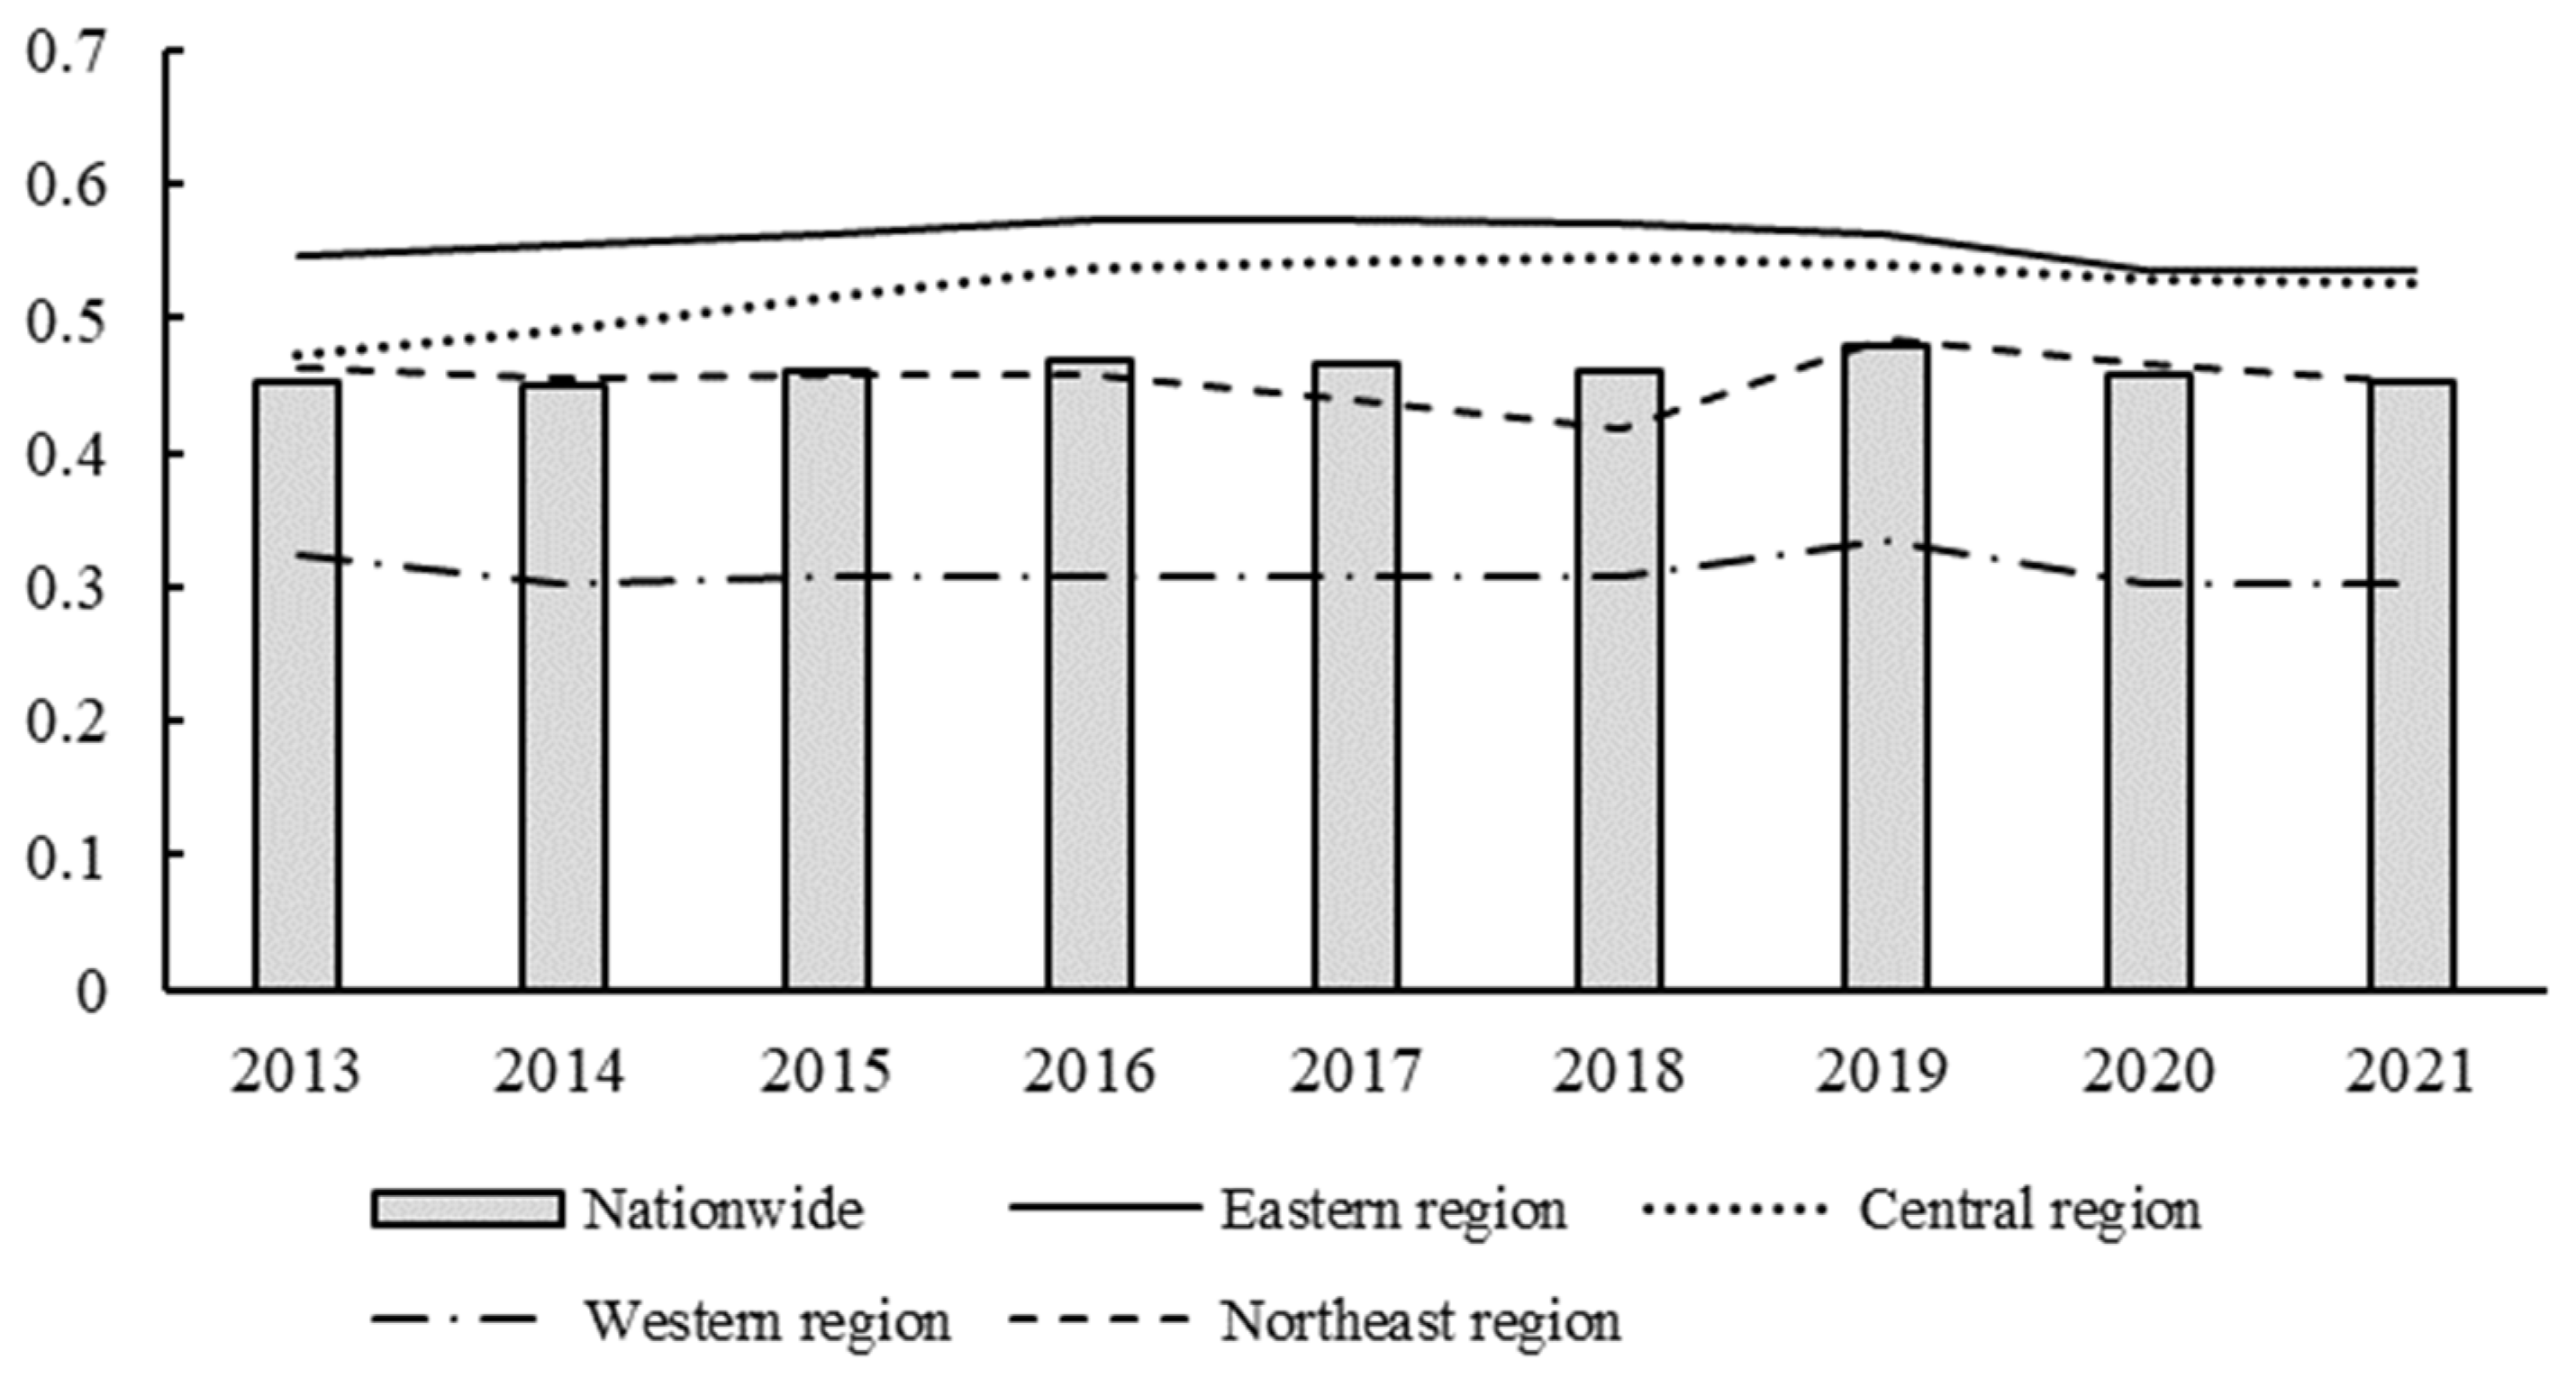
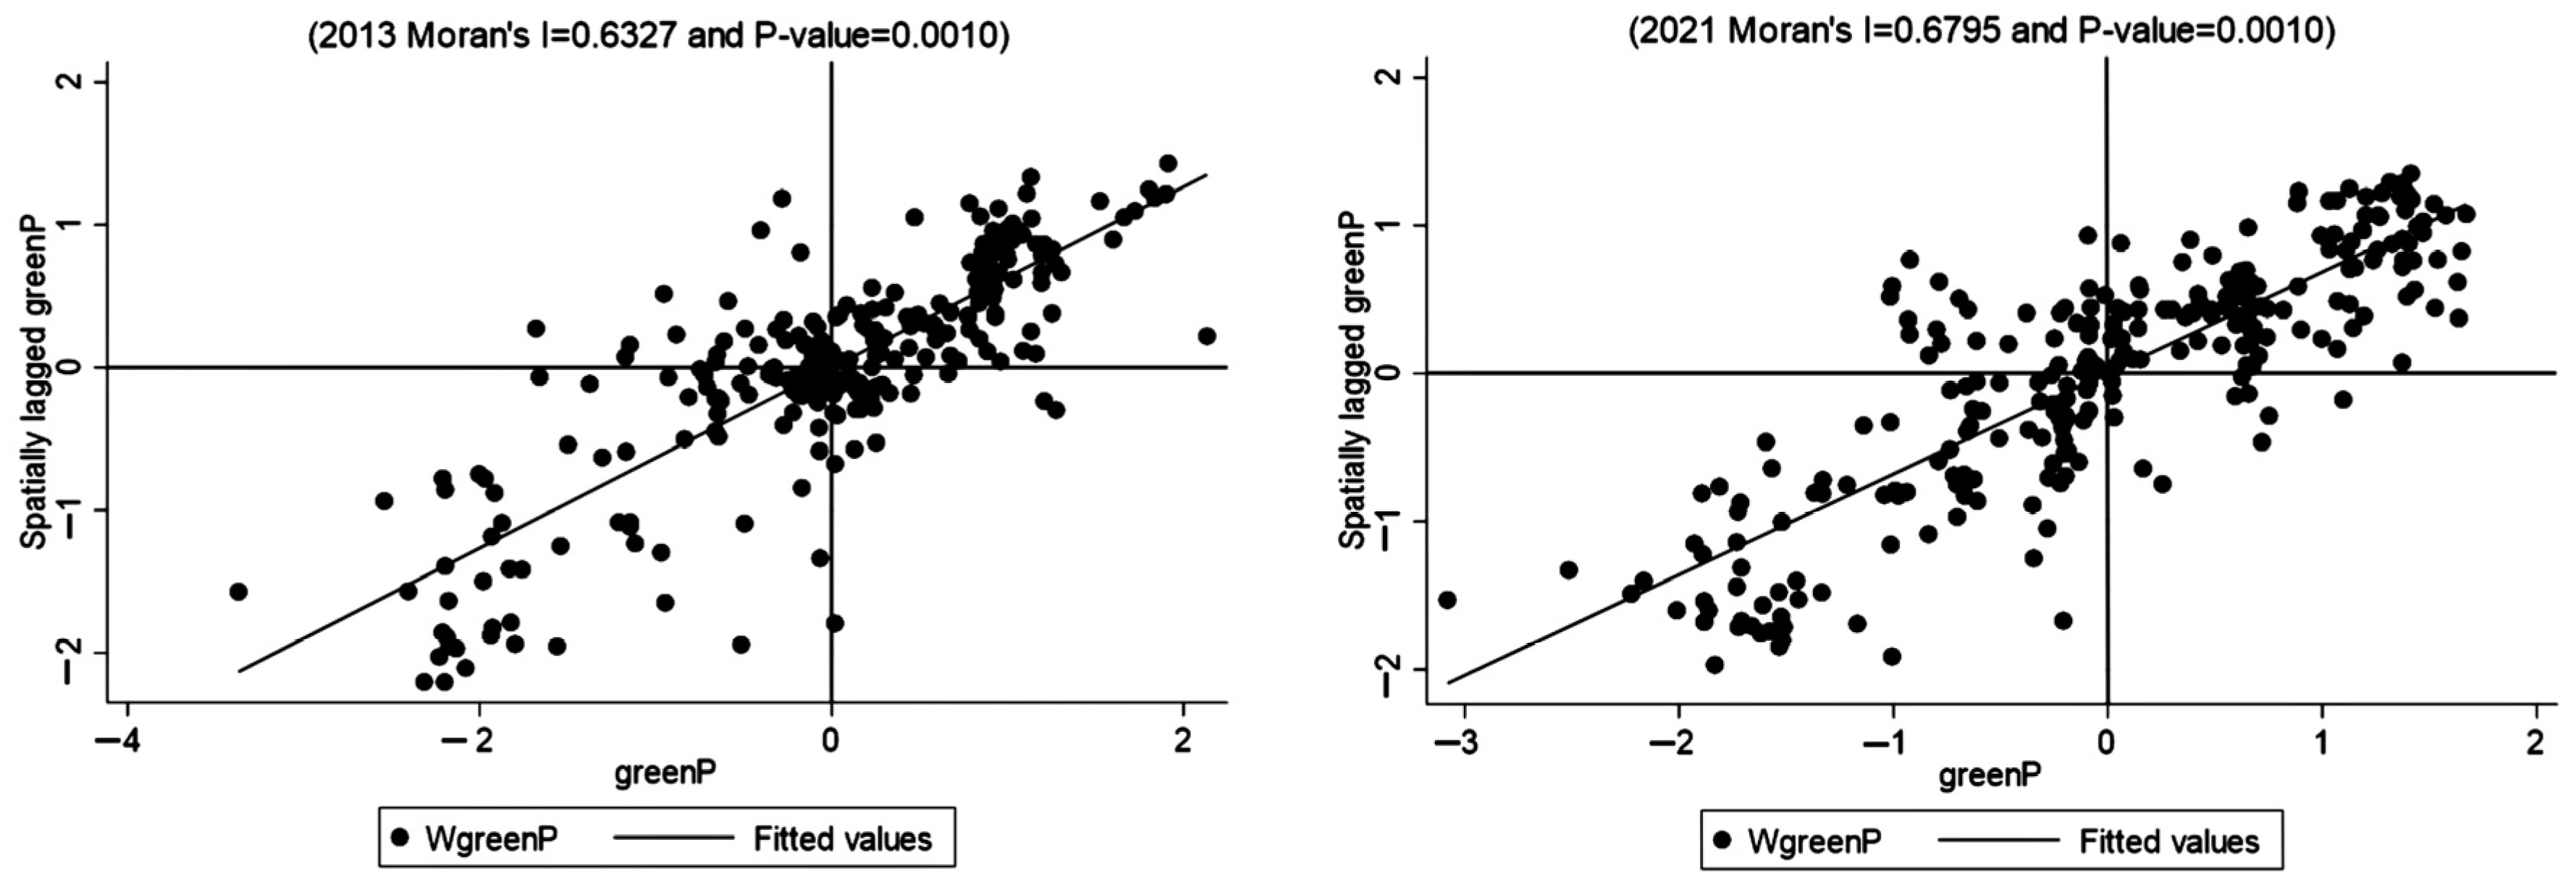
3.1. Spatial and Temporal Characteristics of Green Credit

The national and regional averages of green credit levels are calculated and summarized, as shown in Figure 1. The average green credit level across the nation ranges from 0.4 to 0.5 from 2013 to 2021, indicating that the overall level of green credit in China has reached a moderate level. However, there are significant differences in the average green credit levels among the four regions, ranked from high to low as the eastern, central, northeastern, and western regions. Moreover, the curves of the four regions approach each other gradually during the research period, particularly in the eastern and central regions, where the green credit levels are 0.5372 and 0.5281, respectively, in 2020, indicating that the development gap of green credit levels among the four regions in China is gradually narrowing, and the central region is making significant progress. In terms of the gap between the average green credit levels in the four regions and the national average, the western and northeastern regions are lower than the national average, while the eastern and central regions are higher than the national average. The level of green credit is closely related to factors such as local economic development, environmental policies, and industrial foundations. Given the economic prosperity and the resulting environmental pressures in the eastern region, there is a greater demand for green development [28,29]. Consequently, the green credit level in the eastern region is noticeably higher than in other regions.
To explore the spatial correlation of urban green credit levels, this study analyzes it based on the global Moran’s I. Through calculations, it is found that the Moran’s I of green credit fluctuates within the range of 0.65 to 0.74 from 2013 to 2021, and the calculated indexes for each year are greater than 0. Through a significance level test at 1%, it is indicated that there is a significant positive spatial autocorrelation of green credit levels among Chinese prefecture-level cities.
Furthermore, in order to explore the clustering characteristics and changing trends of green credit levels among Chinese prefecture-level cities, this study draws local Moran scatter plots for 2013 and 2021 (Figure 2). The first quadrant represents high–high agglomeration areas, the second quadrant represents low–high agglomeration areas, the third quadrant represents low–low agglomeration areas, and the fourth quadrant represents high–low agglomeration areas. Generally speaking, in 2013 and 2021, the green credit levels of Chinese prefecture-level cities mainly cluster in the first and third quadrants, i.e., high–high and low–low areas, especially with large-scale clustering at the quadrant centers, where the first quadrant is the densest and presents a positive correlation. The density of low–low areas increases significantly from 2013 to 2021, and the Moran’s I also slightly decreases, indicating that the spatial correlation of green credit levels among Chinese prefecture-level cities weakened and the development gap narrowed from 2013 to 2021.
Next, an analysis of the spatial distribution characteristics of green credit in China is conducted by calculating the average green credit values for 27 major cities nationwide from 2013 to 2021. The results are shown in Table 2. The overall average level of green credit in major Chinese cities from 2013 to 2021 is 0.4247. Among them, 17 cities, including Shanghai, Beijing, Nanjing, and Nanchang, have green credit levels higher than the overall average, with Shanghai being the highest at 0.6724. On the other hand, 10 cities, including Urumqi, Lanzhou, and Hohhot, have green credit levels lower than the overall average, with Kunming being the lowest at only 0.1222. This indicates that there is still a certain development gap in green credit levels among major cities in China, but the majority of cities have surpassed the moderate level. In particular, Shanghai, Beijing, Nanjing, Guangzhou, and Hangzhou have significantly higher green credit levels than other cities, all above 0.6. The overall average level of green credit in major Chinese cities from 2013 to 2021 remained at a relatively low level, especially in Urumqi, Lanzhou, Hohhot, Kunming, Haikou, Guiyang, and Yinchuan, which are at a lower level. Therefore, the government needs to focus on promoting green credit construction in these areas and reducing the development gap with other developed cities. There is also a significant development gap in green credit levels among major cities, with the overall green credit level being higher in developed cities in the south and north than in the central and western regions. This indicates that the level of green credit is closely related to the economic development level of cities.

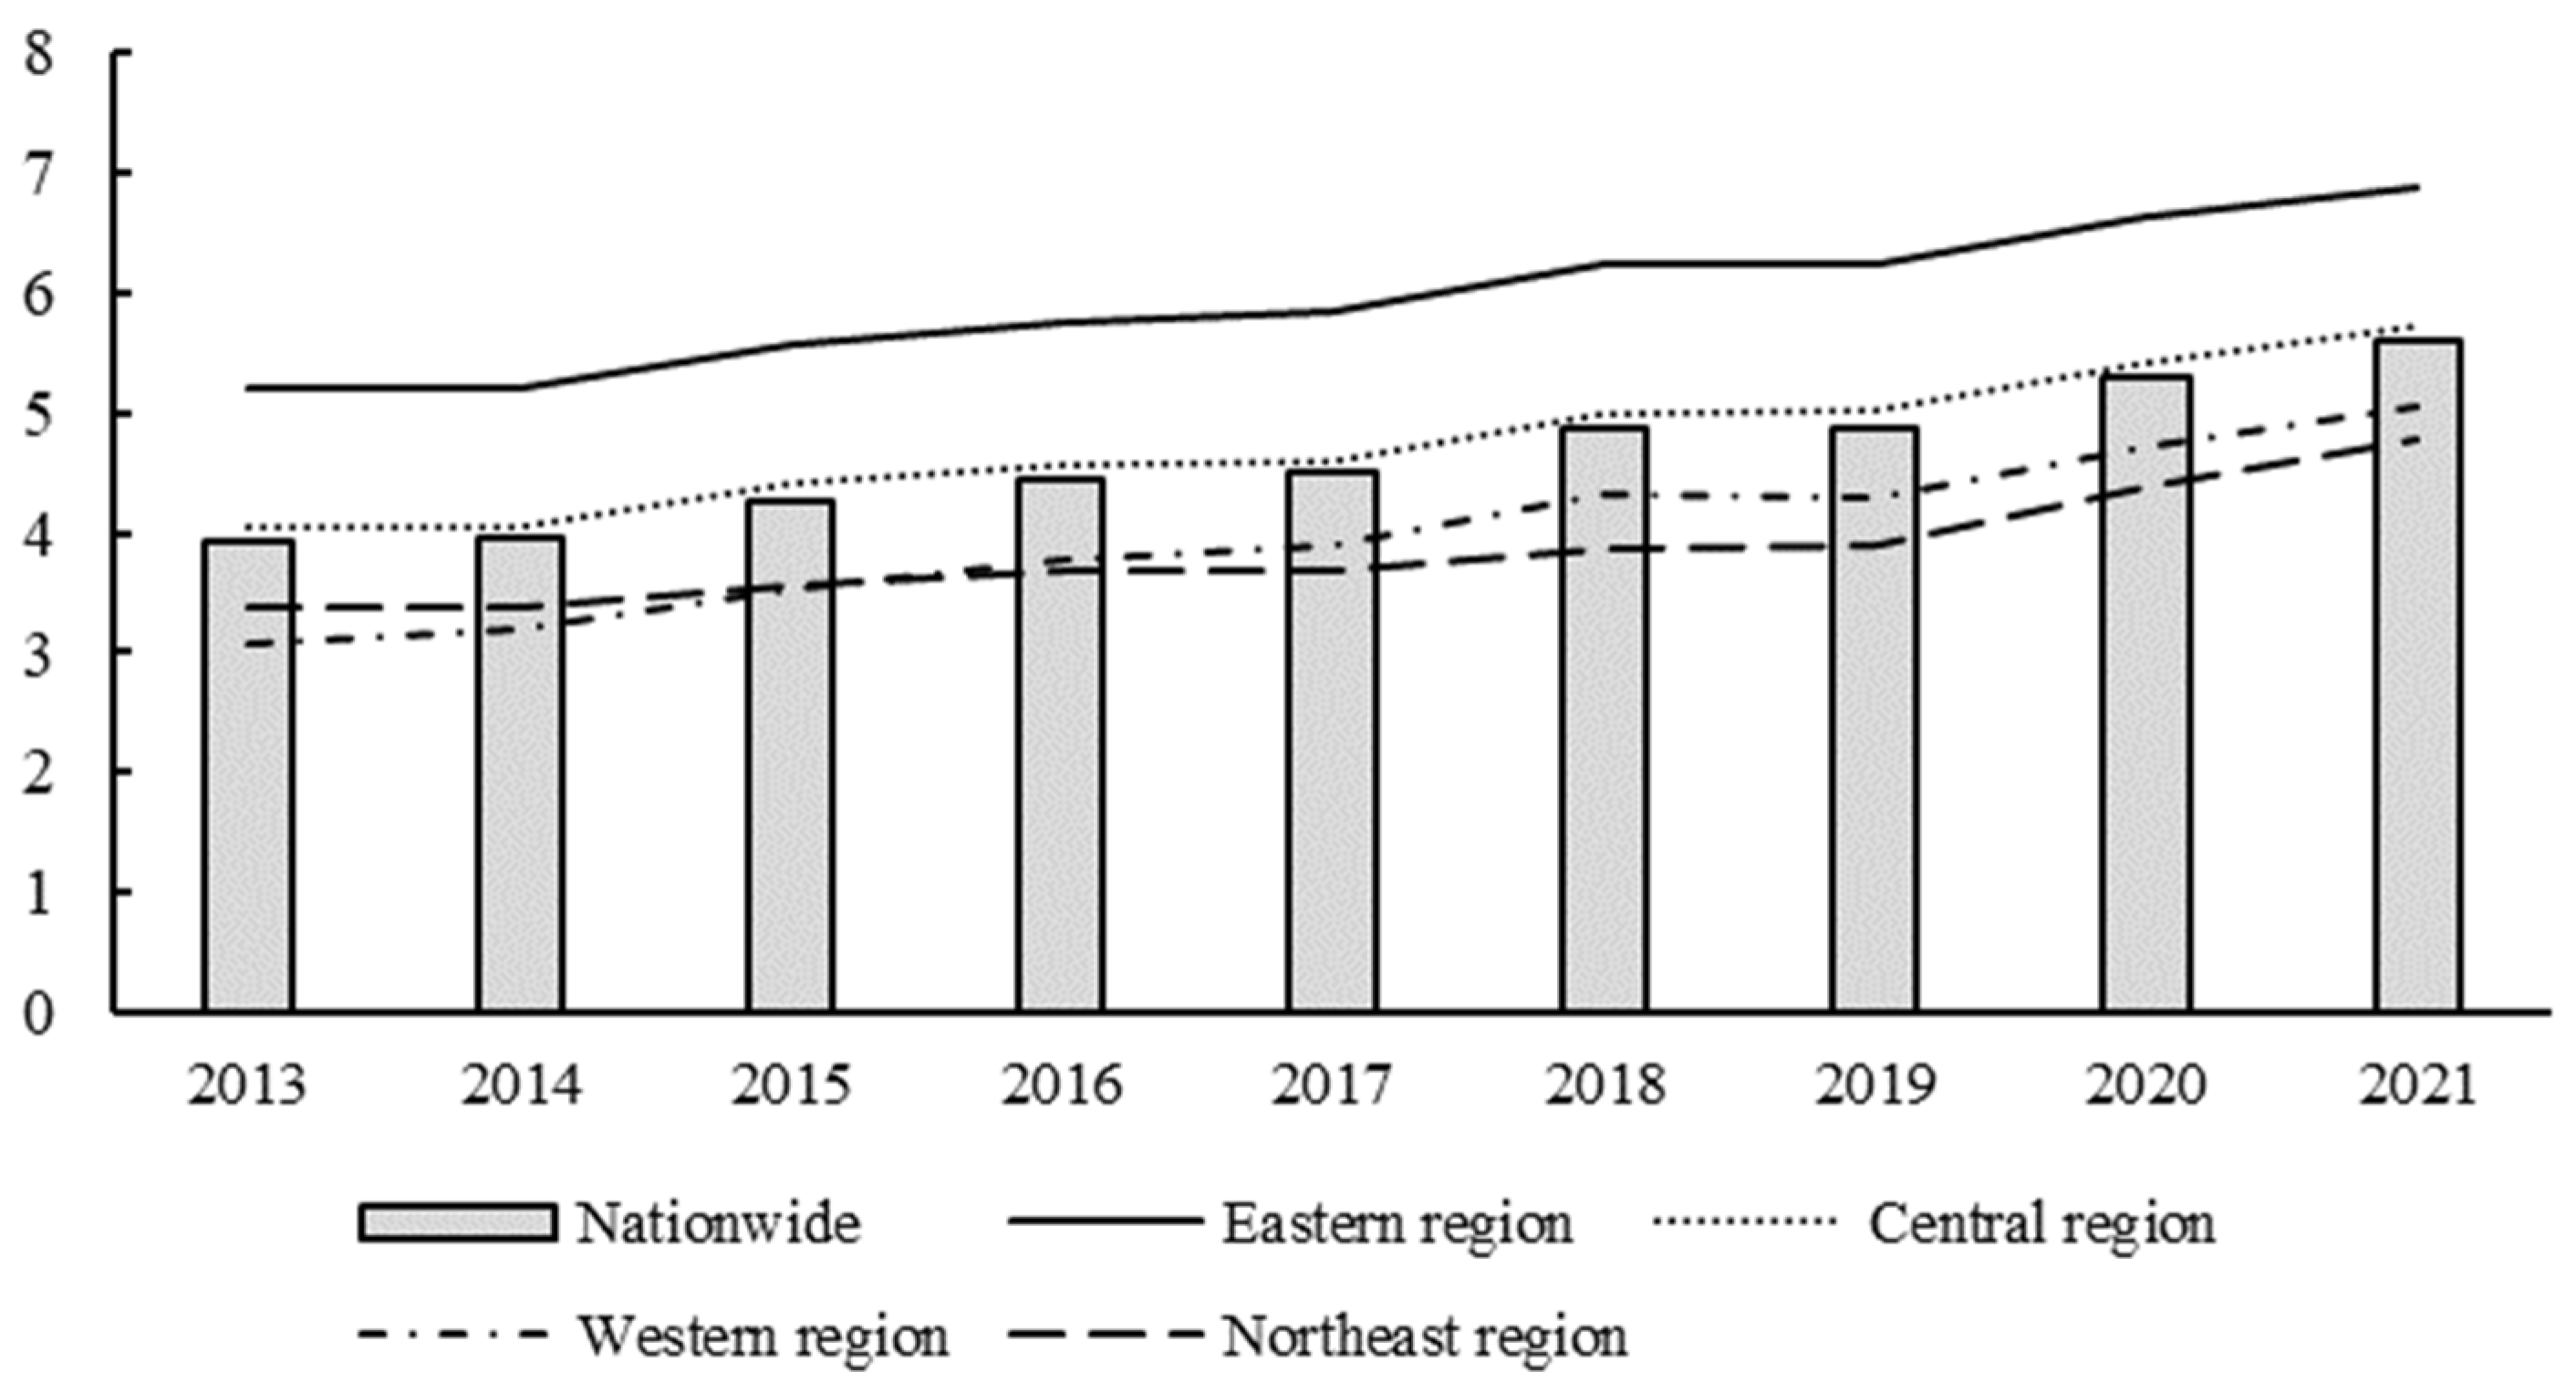
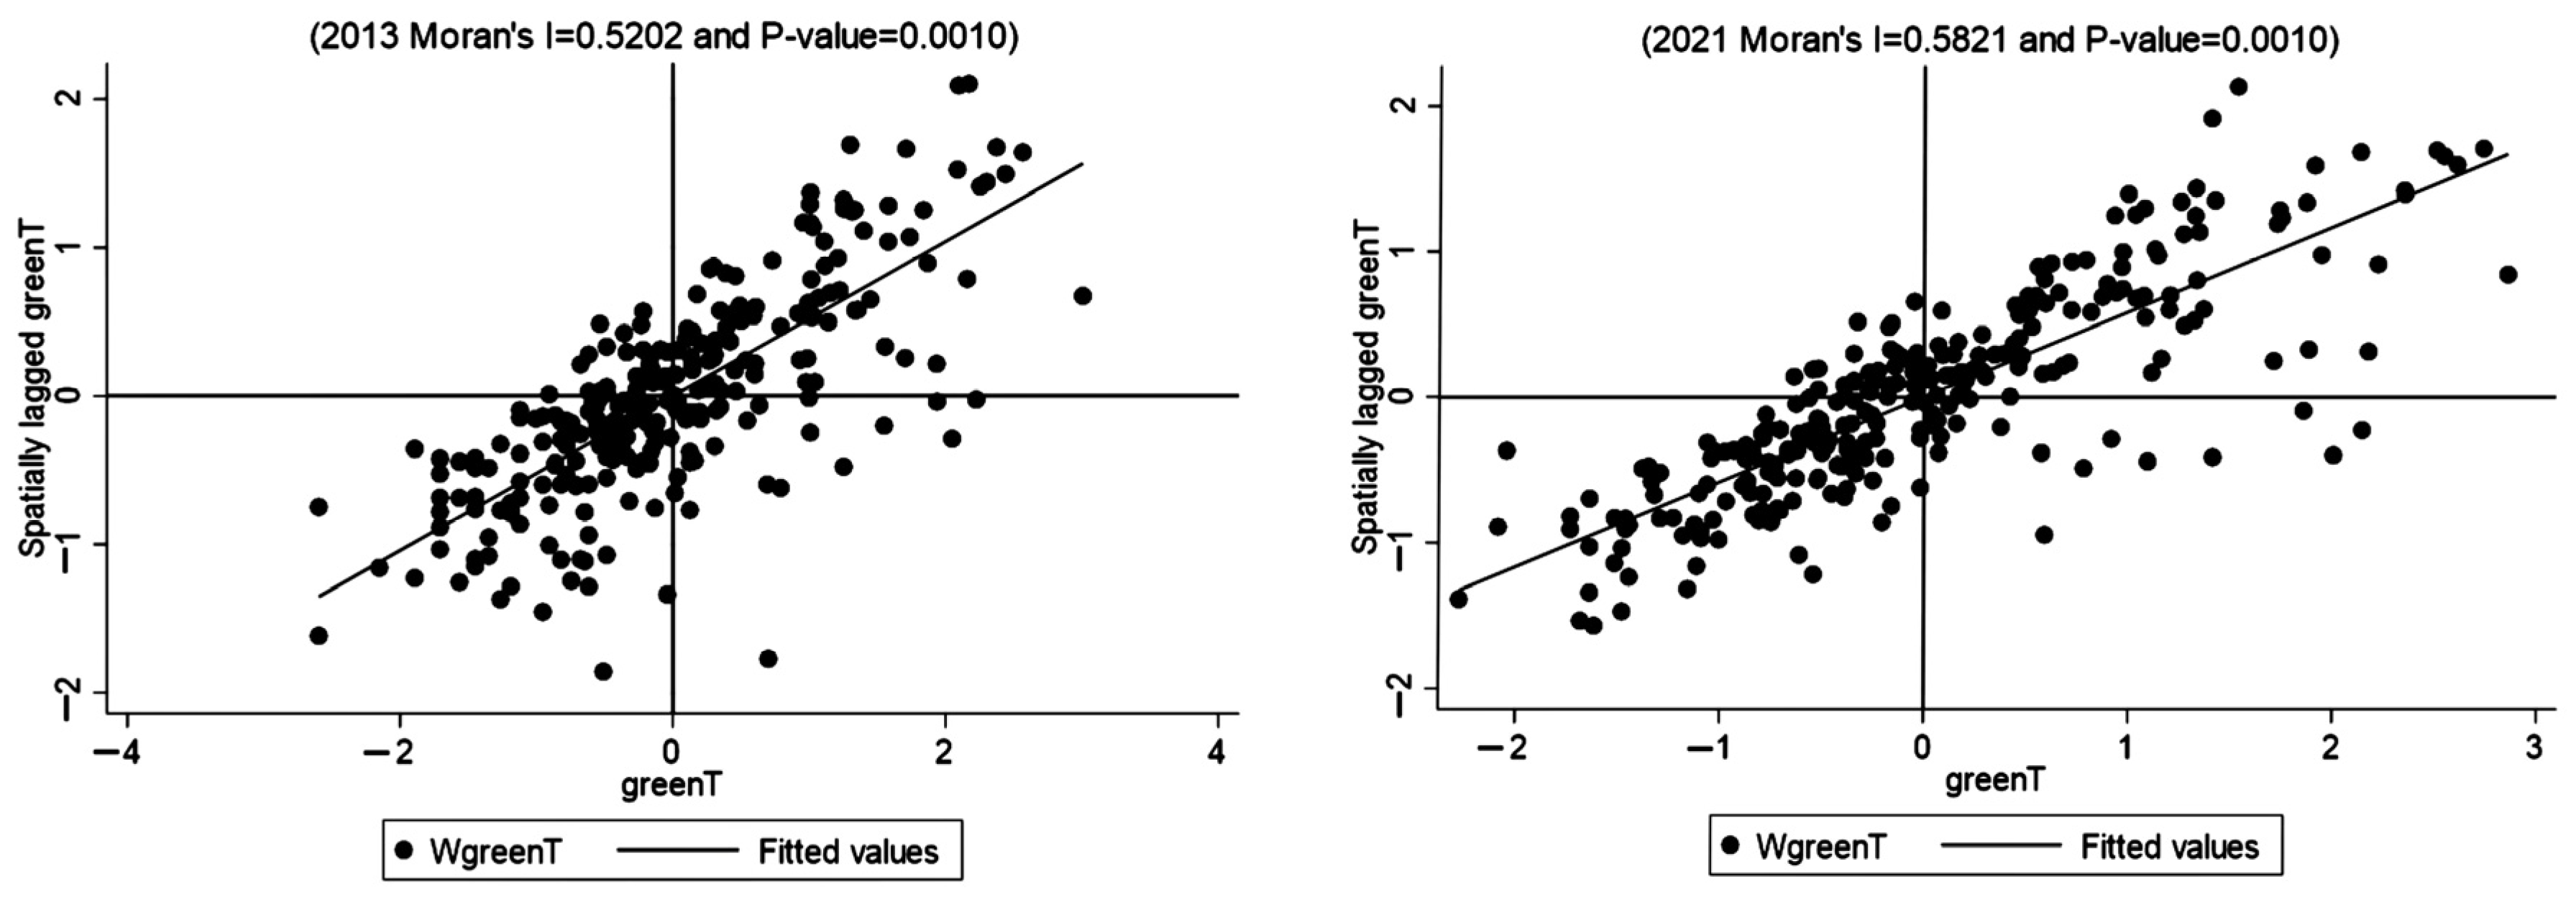
3.2. Spatial and Temporal Characteristics of Enterprises Green Technological Innovation

Based on the green technology innovation level of 271 prefecture-level cities from 2013 to 2021, is the results are summarized into four regions and the overall national average level of green technology innovation is presented in Figure 3. This figure depicts a relatively uniform development trend. The overall green technology innovation level of Chinese enterprises increased from 3.9210 in 2013 to 5.5975 in 2021. At the same time, the average level of green technology innovation for enterprises in each of the four regions has also steadily increased, indicating that the transformation and upgrading of traditional enterprises and green technology innovation have become an inevitable trend. The significant increase in China’s enterprise green technology innovation level is inseparable from the gradual improvement of government funding and talent support for enterprises and environmental regulations.
The average values of enterprise green technology innovation in the four major regions are still in the order of eastern, central, western, and northeastern region, with the eastern region reaching 6.8818 in 2021 and the northeastern region averaging 4.7609 in 2021. However, as time goes by, the curves of the average levels of green technology innovation for enterprises in the four regions are approaching each other, and the development gap is narrowing. The curve of the average level of green technology innovation for enterprises in the eastern region is significantly higher than that in other regions, and there is still a large development gap between other regions and the eastern region in terms of enterprise green technology innovation level. Only the eastern region has surpassed the overall national average level of enterprise green technology innovation and has continued to rise to a higher level year by year, while other regions are gradually approaching the overall national average.
Through the calculation of the global Moran’s I, it is found that the Moran’s I for the years 2013 to 2021 fluctuates within the range of 0.39 to 0.44. Additionally, the Moran’s I for each year is greater than 0 and passes the significance test at the 1% level. This indicates the presence of significant intra-regional positive spatial autocorrelation in the level of corporate green technology innovation across prefecture-level cities in China.
Local Moran scatter plots were created for the years 2013 and 2021, as shown in Figure 4. The corporate green technology innovation of China’s prefecture-level cities mainly cluster in the first and third quadrants, representing high–high and low–low regions. In particular, large-scale clusters appear near the quadrant centers. Overall, the third quadrant exhibits the highest density and shows positive correlation. From 2013 to 2021, there is a significant increase in the density of the high–high and low–low regions, as well as an increase in the Moran Index. This indicates that the spatial correlation of corporate green technology innovation levels among China’s prefecture-level cities gradually strengthened during this period.
To analyze the distribution characteristics of China’s green technology innovation level, this paper adopts the method of calculating the average value of the green technology innovation level in major cities nationwide from 2013 to 2021, and the results are shown in Table 3. Among the major cities in China, 13 cities, including Shanghai, Beijing, Nanjing, and Tianjin, have a higher level of enterprise green technology innovation than the overall average, with Beijing having the highest level at 9.2639. However, except for Nanning, Haikou, and Xining, 14 cities, including Urumqi, Lanzhou, Nanchang, and Hohhot, have a lower level of green credit compared to the overall average, with Hohhot having the lowest average, at only 5.3197. This indicates that there is still a certain development gap in the green technology innovation level among major cities in China, especially with Shanghai and Beijing showing significantly higher levels of enterprise green technology innovation at 8.6182 and 9.2639, respectively. This is closely related to the important strategic positions, financial strength, and availability of advanced talents and resources in these two regions. From 2013 to 2021, the overall average level of enterprise green technology innovation in major cities in China reached a relatively high level of 7.1103.

4. Mechanism Analysis and Empirical Testing

4.1. Mechanism Analysis

Green credit is an important component of green finance, commonly referred to as sustainable financing or environmental financing. With the continuous development of the economy and society, traditional development methods have caused serious pollution and damage to the environment [30,31]. Faced with important issues related to human sustainable development such as environmental pollution, resource depletion, and ecological imbalance, green credit will play an increasingly important role. One of the important purposes of green credit is to improve the relationship between the financial industry and sustainable development. Local governments hope to provide more financial support for ecological and industrial green development through green credit policies and optimize and improve the green financial system. Specifically, as a new financing tool, green credit can guide fund allocation through credit channels, introducing more funds into environmental protection industries or enterprises undergoing green and low-carbon transformation [32,33,34]. By increasing the loan utilization rate and lowering the loan utilization threshold, green credit will help promote green technology innovation. With the implementation of green credit policies, enterprises with strong environmental responsibility awareness, high environmental performance, and environmental friendliness will receive more loan funds, thereby creating conditions for their green development [35,36,37]. On the contrary, if a company has characteristics such as heavy environmental pollution, high pollutant emissions, and outdated environmental technology, it is not easy to obtain green credit [38,39,40]. Therefore, the first hypothesis is proposed here that green credit helps to attract more funds into green environmental protection industries or projects, and through financial support, it can help enterprises to carry out green technology innovation.
Meanwhile, we are also interested in examining the regional heterogeneity of the impact of green credit on corporate green technology innovation. It is generally believed that the eastern region has a high level of economic and social development, a high degree of financial marketization, and sufficient capital in the financial industry, which can provide more high-quality, sustainable, and stable green loans for environmental protection industries or projects [41,42]. These convenient conditions will make the impact of green credit on green technology innovation more apparent in the eastern region than in the central and western regions. However, we also consider that in the economically developed eastern region, enterprises can obtain funds through various channels to achieve green and low-carbon development. Green credit, as only one of the loan channels, may not have a significant effect on green technology innovation. For the central and western regions, due to the relatively lagging economic development, funds for green development of enterprises are relatively scarce. Green credit, as a special fund to promote green and low-carbon development of enterprises, may have a greater effect or role to play. Therefore, a second hypothesis is proposed here that the effect of green credit on green technology innovation may not be significant in economically developed regions, but may be more pronounced in economically underdeveloped regions.
Considering the issue of capital investment, after obtaining green credit funds, enterprises will use them for green and low-carbon projects, facility and equipment upgrades, technological process upgrades, efficient resource utilization, and pollutant reduction. These areas require large-scale financial support in order to innovate green technologies. Therefore, the third hypothesis is proposed here, which is that green credit drives innovation in green enterprises by increasing their R&D investment. This can be seen in Figure 5.

4.2. Model Testing and Selection

In addition to the testing of spatial correlation, a multicollinearity test should be conducted. In this study, a multicollinearity test is performed, and it is found that the VIF (variance inflation factor) values for each variable are below 10, indicating the absence of multicollinearity issues among the variables.
To study the impact of green credit on corporate green technological innovation and select an appropriate spatial econometric model, this paper conducts a test of the applicability of spatial econometric models. As shown in Table 4, all p-values are 0, indicating that the models pass the 1% significance test. This also suggests that the most suitable model is the Spatial Durbin Model (SDM), which combines both spatial lag effects and spatial error effects. Furthermore, through the Hausman test and the LR test, the p-values are both 0, passing the 1% significance level. Therefore, this paper selects the Spatial Durbin Model with fixed effects. In addition, the Wald test is used to examine the possibility of the Spatial Durbin Model degrading into a spatial lag model or a spatial error model. The p-value remains less than 0.1, indicating that the Spatial Durbin Model does not degrade into a spatial lag or spatial error model. Based on the above tests, this paper chooses the SDM model with double fixed effects.

4.3. Benchmark Regression Results

Table 5 reflects the causal relationship between green credit and green technology innovation. The results show that the estimated coefficient of green credit for green technology innovation is positive; in other words, green credit helps to improve green technology innovation [43]. Therefore, the hypothesis mentioned earlier is validated. It can be seen that the issuance of green credit can provide more funds for green and low-carbon projects of enterprises, can broaden their green financing channels, can help promote the implementation process of green projects, can improve the efficiency of green project execution, and can strengthen the effectiveness of green project implementation, ultimately supporting the improvement of green technology innovation. We conclude that China’s green credit policy is correct and effective. This policy helps to change the extensive development model, reduce resource consumption and strengthen resource utilization efficiency, which guiding China towards green development through green technology innovation. Therefore, this conclusion can also serve as evidence of the effectiveness of implementing green credit policies.

4.4. Analysis of Regional Heterogeneity

Using an econometric model to examine the regional heterogeneity of the impact of green credit on green technology innovation, the results are shown in Table 6. It is found that there is indeed significant regional heterogeneity in the impact of green credit on green technology innovation. In the eastern region, green credit has not significantly promoted green technology innovation, while in the central and western regions, green credit has a significant driving effect on green technology innovation. In the northeast region, this significant effect does not exist. The possible reason for this phenomenon is that the eastern region has a relatively developed economic society with a relatively advanced industrial structure, a high added value of enterprises, and relatively less pollution, while also having good green production capacity. Therefore, green credit has not displayed a significant role in green technology innovation. Meanwhile, due to the relatively developed financial industry in the eastern region, enterprises can obtain financing through various channels to achieve green development, among which green credit is just one option. This may also lead to a less significant effect of green credit on green technology innovation. However, the economy in the central and western regions is relatively less developed, and the production methods of enterprises are relatively extensive, resulting in lower environmental performance. The financing channels for enterprises to promote green development are relatively single, so the loan funds obtained are also relatively small. In the case, green credit can provide important financial support for enterprises, and effectively expand their financing channels. Thus, it plays a relatively positive role in their green technology innovation.

4.5. Robustness Tests

This study selects the economic distance weight matrix as the spatial weight matrix. However, the inverse distance weight matrix, nearest neighbor spatial weight matrix, and adjacency weight matrix are also commonly used [44]. To verify the robustness of the model regression results, this study conducts robustness tests on the other three types of spatial weight matrices. The test results in Table 7 show that the coefficient signs and significance levels of the variables do not change significantly, which indicates that the variation in spatial weight matrices does not affect the relationship between green credit and green technology innovation of enterprises. Therefore, the research findings of this study are robust.

4.6. Endogeneity Test

4.6.1. DIF-GMM Estimation

The above model test results indicate that green credit is conducive to the green technological innovation of enterprises to a certain extent. However, it is influenced by multiple dependent variables such as firm size, liquidity ratio, and years since establishment, and there are significant regional differences in the dependent variables across different regions. In order to address endogeneity issues such as measurement errors in dependent variables and reverse causality, this paper employs the instrumental variable method and DIF-GMM to further ensure the reliability of empirical results, as shown in Table 8. AR(1) was less than 0.05, AR(2) was greater than 0.05, Sargan was greater than 0.05, and the variable coefficient was significant. Therefore, the models constructed in this paper are well considered and fully verified and have rationality and validity.

4.6.2. Instrumental Variables

The instrumental variable method, as an important approach to address endogeneity issues, has been widely used in previous relevant literature and similar studies. Thus, the two-stage least squares estimation (2SLS) method is chosen for instrumental variable regression. In this study, the average value of green credit in all other regions in the same year is selected as the instrumental variable. This choice of instrumental variable satisfies the assumptions of exclusivity and relevance. The results can be seen in Table 8. The Phase I results show that the absolute value of the F statistic is greater than 10, indicating that there is no weak instrumental variable problem in this study. In Phase II, enterprise green technology innovation is used as the dependent variable to regress the fitted value of the green credit. The coefficient is 1.001, and positive at the 1% significance level. This further proves that green credit has a positive impact on corporate green technology innovation.

4.6.3. Adding Control Variables

In order to eliminate the adverse effects of omitted variables on the model estimation, this paper chooses enterprises’ R&D investment as a new control variable for regression analysis to test for model result bias [45,46]. The test results are shown in Table 9. The direct effect, indirect effect, and total effect coefficients are all positive, and both the indirect effect and total effect pass the significance test at the 1% level. After adding the control variable of enterprises’ R&D investment, the coefficients of other variables align closely with the results of benchmark regression (Table 4), and their significance levels remain relatively unchanged. This indicates that the conclusion that green credit promotes green technology innovation in enterprises is credible.

4.6.4. Conduction Mechanism Test

The results of the mesomeric effect are presented in Table 10. In Model 1 and Model 2, the coefficients of green credit are significantly positive at the 1% level, indicating that green credit has a positive effect on enterprise green technological innovation. In Model 3, enterprises’ R&D investment serves as the mediating variable, and the dependent variable, the coefficient of green credit, is positive and significant at the 1% level, suggesting that green credit has a significant promoting effect on enterprises’ R&D investment.
In Model 2, the coefficients for enterprises’ R&D investment and green credit are significantly positive at the 1% level. The green credit policy enables enterprises to obtain financial support, thereby promoting the development of their green technological innovation and greatly enhancing their market competitiveness. A large and sustainable investment in R&D is a necessary condition for the long-term enterprise green technological innovation [47]. As analyzed above, there exists a pathway of “green credit–research and development investment–enterprise green technological innovation”. Enterprises are gradually realizing a virtuous cycle of financing–scientific research–innovation–refinancing. When the dependent variable is enterprise green technological innovation, the total effect is 1.518, the direct effect is 1.449, and the mediated effect is 0.069, indicating that enterprises’ R&D investment plays a certain mediating role between green credit and enterprise green technological innovation.

5. Conclusions and Policy Implications

5.1. Conclusions

Green credit, as a financial tool, uses the pollution level of enterprises as a threshold for loan access, aiming to incentivize highly polluting and high-emission industries to transform their economic development structure [48,49]. The purpose of this paper is to investigate whether there is a bidirectional causal relationship between green credit and corporate green technology innovation. Therefore, this paper uses a sample of 271 prefecture-level cities in China from 2013 to 2021 to analyze the impact of green credit on enterprise green technological innovation using a double fixed SDM model. It comprehensively applies research methods such as spatial correlation analysis, robust testing, and endogeneity testing to conduct in-depth research. In addition, we further explore the spatial spillover effects of green credit on the level of corporate green technological innovation in Chinese prefecture-level cities.
The main conclusion of this article is as follows. Firstly, the level of green credit is highest in the eastern region, followed by the central region. The development level of green credit in the western and northeastern regions is relatively low. Moreover, the level of green credit in the four major regions shows a fluctuating trend over time. Green credit exhibits spatial correlation characteristics, with the main clustering types being high–high clustering and low–low clustering. Across the country, there are significant differences in the level of green credit among different cities, but most cities have already exceeded the moderate level of green credit. Secondly, compared to the level of green credit, the level of enterprise green technology innovation displays a clear upward trend. Whether it is the four major regions or the national average, the level of green innovation of enterprises is constantly improving. Similar to the spatial characteristics of green credit, the level of enterprise green technology innovation also shows significant spatial clustering characteristics, and the clustering characteristics continue to strengthen over time. Thirdly, through empirical analysis, it was found that green credit has a significant enhancing effect on enterprise green technology innovation, and this conclusion still holds after robustness and endogeneity tests. Green credit is an important force in enhancing the level of green technology innovation in enterprises. In addition, there is significant regional heterogeneity in the impact of green credit on green technology innovation, with the main significant impact concentrated in the central and western regions. At the same time, we also found that green credit can significantly increase enterprise R&D investment and improve the level of green technology innovation through this channel.

5.2. Policy Implications

Firstly, in the empirical analysis section, we found that green credit helps to promote green technology innovation and will play an important role in green development. Therefore, we suggest that local governments continue to promote the implementation of green credit policies. Local governments need to further improve their green credit policies, strengthen enterprise information disclosure, reduce information search costs for commercial banks, and improve the efficiency of green credit implementation. At the same time, we also suggest optimizing and improving the supporting system of green credit, including green credit product design, operation and promotion, effect evaluation, execution standards, green reviews, and many other aspects [50,51,52].
Meanwhile, we also found that due to China’s vast territory and significant disparities in economic and social development among different regions, the impact of green credit on green technology innovation exhibits significant regional heterogeneity [53,54]. Therefore, it is necessary to promote the implementation of green credit policies based on the actual economic and financial development situation of each region. For the eastern region, we believe that we should further strengthen the precise allocation of green credit to green, low-carbon, environmentally friendly projects and enterprises, and enhance the positive role of green technology innovation. In the process of actively promoting economic development, the central and western regions guide enterprises to actively participate in green innovation activities by utilizing green credit funds. Moreover, the central and western regions should strengthen cooperation and exchange in green technology innovation with the eastern region in order to better enhance the overall level of green innovation.
Finally, we also found that green credit can enhance the level of green technology innovation by increasing research and development investment. Research and development investment is an effective mediator variable. Therefore, we suggest that enterprises continue to increase their R&D investment and continuously improve their level of green innovation after obtaining loan funds. This is the core driving force for achieving green development. In addition, enterprises should also broaden their channels of capital utilization, attract high-tech talents, expand brand influence, and strengthen industry cooperation to better promote green technology innovation.

6. Discussion

Through this research, we believe that the relationship between green credit and green development can be analyzed at different research scales, such as enterprises, industries, cities, and regions, which may provide more beneficial findings for the development of green innovation. Meanwhile, it is necessary to combine data analysis with qualitative research methods in subsequent research, and systematically study the relationship between green credit and green technology innovation through case analysis.
The limitation of this paper is that there is little consideration of policy factors, and only the impact of green credit on corporate green technology innovation is considered, while other policy factors such as green bonds are not considered. In addition, this paper ignores policy gaps between regions, and some regions may have unique policy factors. Therefore, our future research direction will focus on further exploring other policy factors that affect corporate green technology innovation while considering the policy differences between different regions. Considering the effect of the economic situation, financial market, enterprise size and characteristics of each country on the impact of green credit on enterprises’ green technology innovation, an in-depth understanding of the situation of other countries and targeted analysis is necessary. At the international level, the research results are of great significance for countries seeking to learn from China’s experience and promote their implementation of green credit policies. Countries can make contributions to the development of the global green economy by adjusting the green credit policy system, promoting green technology innovation, strengthening international cooperation, and jointly discussing and formulating international standards.

Author Contributions

Conceptualization, methodology, software, validation, formal analysis, writing-original draft preparation, K.M., R.Z. and Z.C.; investigation, resources, data curation, writing-review and editing, supervision X.Z. and K.M.; project administration, fund acquisition K.M. All authors have read and agreed to the published version of the manuscript.

Funding

This work is supported by The National Social Science Fund of China (Grant No.22CJY070).

Data Availability Statement

Data used in this paper can be found in Section 2.3. Data Sources.

Acknowledgments

The authors would like to thank the editors and anonymous reviewers for their thoughtful and constructive comments.

Conflicts of Interest

The authors declare no conflict of interest.

References

  1. Boubaker, S.; Liu, P.Z.; Ren, Y.S.; Ma, C.Q. Do anti-corruption campaigns affect corporate environmental responsibility? Evidence from China. Int. Rev. Financ. Anal. 2024, 91, 102961. [Google Scholar] [CrossRef]
  2. Fan, M.; Yang, P.; Li, Q. Impact of environmental regulation on green total factor productivity: A new perspective of green technological innovation. Environ. Sci. Pollut. Res. 2022, 29, 53785–53800. [Google Scholar] [CrossRef]
  3. Cui, X.; Wang, P.; Sensoy, A.; Nguyen, D.K.; Pan, Y.Y. Green Credit Policy and Corporate Productivity: Evidence from a quasi-natural experiment in China. Technol. Forecast. Soc. Change 2022, 177, 121516. [Google Scholar] [CrossRef]
  4. Hua, Y.B. Assessing financial inclusion co-movement with low-carbon development index: Implications for regional development. Environ. Sci. Pollut. Res. 2023, 30, 104791–104804. [Google Scholar] [CrossRef]
  5. Matiiuk, Y.; Liobikiene, G. The role of financial, informational, and social tools on resource-saving behaviour in Lithuania: Assumptions and reflections of real situation. J. Clean. Prod. 2021, 326, 129378. [Google Scholar] [CrossRef]
  6. Madaleno, M.; Nogueira, M.C. How Renewable Energy and CO2 Emissions Contribute to Economic Growth, and Sustainability—An Extensive Analysis. Sustainability 2023, 15, 4089. [Google Scholar] [CrossRef]
  7. Li, X.; Wu, M.; Shi, C.M.; Chen, Y. Impacts of green credit policies and information asymmetry: From market perspective. Resour. Policy 2023, 81, 103395. [Google Scholar] [CrossRef]
  8. Umar, M.; Ji, X.F.; Mirza, N.; Naqvi, B. Carbon neutrality, bank lending, and credit risk: Evidence from the Eurozone. J. Environ. Manag. 2021, 296, 113156. [Google Scholar] [CrossRef] [PubMed]
  9. He, W.H.; Liu, P.; Lin, B.R.; Zhou, H.; Chen, X.S. Green finance support for development of green buildings in China: Effect, mechanism, and policy implications. Energy Policy 2022, 165, 112973. [Google Scholar] [CrossRef]
  10. Cui, H.R.; Wang, R.Y.; Wang, H.R. An evolutionary analysis of green finance sustainability based on multi-agent game. J. Clean. Prod. 2020, 269, 121799. [Google Scholar] [CrossRef]
  11. Chang, Y.; Fang, Z.; Li, Y.F. Renewable energy policies in promoting financing and investment among the East Asia Summit countries: Quantitative assessment and policy implications. Energy Policy 2016, 95, 427–436. [Google Scholar] [CrossRef]
  12. Yu, B.; Liu, L.; Chen, H. Can green finance improve the financial performance of green enterprises in China? Int. Rev. Econ. Financ. 2023, 88, 1287–1300. [Google Scholar] [CrossRef]
  13. Lv, C.C.; Fan, J.F.; Lee, C.C. Can green credit policies improve corporate green production efficiency? J. Clean. Prod. 2023, 39, 136573. [Google Scholar] [CrossRef]
  14. Tang, Y.M.; Wang, L.; Peng, S.G. Green credit policy, government subsidy, and enterprises “shifting from virtual to real”. Environ. Sci. Pollut. Res. 2024, 31, 3976–3994. [Google Scholar] [CrossRef] [PubMed]
  15. Lin, B.Q.; Pan, T. The impact of green credit on green transformation of heavily polluting enterprises: Reverse forcing or forward pushing? Energy Policy 2023, 184, 113901. [Google Scholar] [CrossRef]
  16. Luo, S.M.; Yu, S.H.; Zhou, G.Y. Does green credit improve the core competence of commercial banks. Based on quasi-natural experiments in China. Energy Econ. 2021, 100, 105335. [Google Scholar] [CrossRef]
  17. Lian, Y.H.; Gao, J.Y.; Ye, T. How does green credit affect the financial performance of commercial banks?—Evidence from China. J. Clean. Prod. 2022, 344, 131069. [Google Scholar] [CrossRef]
  18. Lai, X.; Yue, S.; Chen, H. Can green credit increase firm value? Evidence from Chinese listed new energy companies. Environ. Sci. Pollut. Res. 2022, 29, 18702–18720. [Google Scholar] [CrossRef]
  19. An, X.; Ding, Y.; Wang, Y. Green credit and bank risk: Does corporate social responsibility matter? Financ. Res. Lett. 2023, 58, 104349. [Google Scholar] [CrossRef]
  20. Wang, Y.Y.; Zhang, Y.Y. Remanufacturer’s production strategy with capital constraint and differentiated demand. J. Intell. Manuf. 2017, 28, 869–882. [Google Scholar] [CrossRef]
  21. Chinzara, Z.; Lahiri, R.; Chen, E.T. Financial liberalization and sectoral reallocation of capital in South Africa. Empir. Econ. 2017, 52, 309–356. [Google Scholar] [CrossRef]
  22. Nguyen, T.T. An Analysis of Non-Performing Loans, Non-Performing Loans to Loan Loss Reserves, and Diversification Effects on Lending: Three Essays; University of Southampton: Southampton, UK, 2021. [Google Scholar]
  23. Akhter, N. Determinants of commercial bank’s non-performing loans in Bangladesh: An empirical evidence. Cogent Econ. Financ. 2023, 11, 2194128. [Google Scholar] [CrossRef]
  24. Tian, J.F.; Sun, S.Y.; Cao, W.; Bu, D.; Xue, R. Make every dollar count: The impact of green credit regulation on corporate green investment efficiency. Energy Econ. 2024, 130, 107307. [Google Scholar] [CrossRef]
  25. Zhou, J.; Yin, Z.C.; Yue, P.P. The impact of access to credit on energy efficiency. Financ. Res. Lett. 2023, 51, 103472. [Google Scholar] [CrossRef]
  26. Wang, H.R.; Cui, H.R.; Zhao, Q.Z. Effect of Green Technology Innovation on Green Total Factor Productivity in China: Evidence from Spatial Durbin Model Analysis. J. Clean. Prod. 2020, 288, 125624. [Google Scholar] [CrossRef]
  27. Montmartin, B.; Herrera, M. Internal and external effects of R&D subsidies and fiscal incentives: Empirical evidence using spatial dynamic panel models. Res. Policy 2015, 44, 1065–1079. [Google Scholar]
  28. Zhou, F.X.; Wang, X.Y. The carbon emissions trading scheme and green technology innovation in China: A new structural economics perspective. Econ. Anal. Policy 2022, 74, 365–381. [Google Scholar] [CrossRef]
  29. Fernando, Y.; Wah, W.X.; Shaharudin, M.S. Does a firm’s innovation category matter in practising eco-innovation? Evidence from the lens of Malaysia companies practicing green technology. J. Manuf. Technol. Manag. 2016, 27, 208–233. [Google Scholar] [CrossRef]
  30. Duan, Y.L.; Mu, C.; Yang, M.; Deng, Z.Q.; Chin, T.C.; Zhou, L.; Fang, Q.F. Study on early warnings of strategic risk during the process of firms’ sustainable innovation based on an optimized genetic BP neural networks model: Evidence from Chinese manufacturing firms. Int. J. Prod. Econ. 2021, 242, 108293. [Google Scholar] [CrossRef]
  31. Zhang, J.X.; Ding, X.H.; Bao, L.Y.; Zhang, Y.D. Can the Greening of Financial Markets Be Transmitted to the Real Economy as Desired in China? Systems 2023, 11, 11030161. [Google Scholar] [CrossRef]
  32. Zhang, J.J.; Luo, Y.C.; Ding, X.H. Can green credit policy improve the overseas investment efficiency of enterprises in China? J. Clean. Prod. 2022, 340, 130785. [Google Scholar] [CrossRef]
  33. Meng, Z.S.; Sun, H.K.; Liu, X.T. Impact of green fiscal policy on the investment efficiency of renewable energy enterprises in China. Environ. Sci. Pollut. Res. 2022, 29, 76216–76234. [Google Scholar] [CrossRef] [PubMed]
  34. Guo, S.; Zhang, Z.X. Green credit policy and total factor productivity: Evidence from Chinese listed companies. Energy Econ. 2023, 128, 107115. [Google Scholar] [CrossRef]
  35. Hussain, J.; Lee, C.C.; Chen, Y. Optimal green technology investment and emission reduction in emissions generating companies under the support of green bond and subsidy. Technol. Forecast. Soc. Change 2022, 183, 121952. [Google Scholar] [CrossRef]
  36. Zhang, H.; Zhang, F.R.; Gong, B.; Zhang, X.; Zhu, Y.F. The Optimization of Supply Chain Financing for Bank Green Credit Using Stackelberg Game Theory in Digital Economy Under Internet of Things. J. Organ. End User Comput. 2023, 35, 318474. [Google Scholar] [CrossRef]
  37. Geng, L.M.; Yin, W.X.; Wu, X.X.; Zhang, C. How green credit affects corporate environmental information disclosure: Evidence from new energy listed companies in China. Front. Ecol. Evol. 2023, 11, 1301589. [Google Scholar] [CrossRef]
  38. Wu, S.; Zhou, X.Y. A theoretical framework for modeling dual-track granting orientation in green credit policy. Econ. Anal. Policy 2024, 81, 249–268. [Google Scholar] [CrossRef]
  39. Wang, H.T.; Qi, S.Z.; Zhou, C.B.; Huang, X.Y. Green credit policy, government behavior and green innovation quality of enterprises. J. Clean. Prod. 2021, 331, 129834. [Google Scholar] [CrossRef]
  40. Trujillo-Gallego, M.; Sarache, W.; Jabbour, A.B.L.D. Digital technologies and green human resource management: Capabilities for GSCM adoption and enhanced performance. Int. J. Prod. Econ. 2022, 249, 108531. [Google Scholar] [CrossRef]
  41. Zhou, D.Q.; Yu, Y.; Wang, Q.W.; Zha, D.L. Effects of a generalized dual-credit system on green technology investments and pricing decisions in a supply chain. J. Environ. Manag. 2019, 247, 269–280. [Google Scholar] [CrossRef] [PubMed]
  42. Tian, X.L.; Kou, G.; Zhang, W.K. Geographic distance, venture capital and technological performance: Evidence from Chinese enterprises. Technol. Forecast. Soc. Change 2020, 158, 120155. [Google Scholar] [CrossRef]
  43. Zhen, L.; Huang, L.F.; Wang, W.C. Green and Sustainable Closed-Loop Supply Chain Network Design under Uncertainty. J. Clean. Prod. 2019, 227, 1195–1209. [Google Scholar] [CrossRef]
  44. Wang, H.M.; Wang, S.Y.; Zheng, Y. China green credit policy and corporate green technology innovation: From the perspective of performance gap. Environ. Sci. Pollut. Res. 2023, 30, 24179–24191. [Google Scholar] [CrossRef]
  45. Amores-Salvadó, J.; Martin-De Castro, G.; Navas-López, J.E. The importance of the complementarity between environmental management systems and environmental innovation capabilities: A firm level approach to environmental and business performance benefits. Technol. Forecast. Soc. Change 2015, 96, 288–297. [Google Scholar] [CrossRef]
  46. He, L.Y.; Liu, R.Y.; Zhong, Z.Q.; Wang, D.Q.; Xia, Y.F. Can green financial development promote renewable energy investment efficiency? A consideration of bank credit. Renew. Energy 2019, 143, 974–984. [Google Scholar] [CrossRef]
  47. Ma, H.D.; Li, L.X. Could environmental regulation promote the technological innovation of China’s emerging marine enterprises? Based on the moderating effect of government grants. Environ. Res. 2021, 202, 111682. [Google Scholar] [CrossRef]
  48. Hall, B.H.; Moncada-Paternò-Castello, P.; Montresor, S.; Vezzani, A. Financing constraints, R&D investments and innovative performances: New empirical evidence at the firm level for Europe. Econ. Innov. New Technol. 2015, 25, 183–196. [Google Scholar]
  49. Song, M.L.; Wang, S.H.; Zhang, H.Y. Could Environmental Regulation and R&D Tax Incentives Affect Green Product Innovation? J. Clean. Prod. 2020, 258, 120849. [Google Scholar]
  50. Qiu, L.; Hu, D.; Wang, Y. How do firms achieve sustainability through green innovation under external pressures of environmental regulation and market turbulence? Bus. Strategy Environ. 2020, 29, 2695–2714. [Google Scholar] [CrossRef]
  51. Fang, Z.M.; Kong, X.R.; Sensoy, A.; Cui, X.; Cheng, F.Y. Government’s awareness of Environmental protection and corporate green innovation: A natural experiment from the new environmental protection law in China. Econ. Anal. Policy 2021, 70, 294–312. [Google Scholar] [CrossRef]
  52. Luo, Y.S.; Salman, M.; Lu, Z.N. Heterogeneous impacts of environmental regulations and foreign direct investment on green innovation across different regions in China. Sci. Total Environ. 2021, 759, 143744. [Google Scholar] [CrossRef] [PubMed]
  53. Yin, X.M.; Chen, D.D.; Ji, J.Y. How does environmental regulation influence green technological innovation? Moderating effect of green finance. J. Environ. Manag. 2023, 342, 118112. [Google Scholar] [CrossRef] [PubMed]
  54. Hamid, S.; Wang, Q.; Wang, K. Intertemporal evolution and influencing determinants of environmental productivity in South Asia’s electric power sectors: Technological heterogeneity perspective. Int. J. Environ. Sci. Technol. 2023, 23, 13762. [Google Scholar] [CrossRef]
Figure 1. Average green credit level in China as a whole and in the four major regions.
Systems 12 00063 g001
Figure 2. Green credit local Moran scatter plot.
Systems 12 00063 g002
Figure 3. The average value of green technology innovation in the country and the four major regions.
Systems 12 00063 g003
Figure 4. Local Moran scatter plot of enterprises green technology innovation.
Systems 12 00063 g004
Figure 5. Mechanisms of green credit influencing enterprise green technology innovation. (The dashed frames separate different mechanisms of action for better interpretation and the arrows represent the direction of the role of green credit in enterprise technological innovation.)
Systems 12 00063 g005
Table 1. Variable selection and description.
Variable TypeVariable NameNotationVariable Definition
Explained VariableEnterprise green technology innovationGreen Tln(number of green patents acquired by firms in that prefectural city in the year +1)
Explanatory VariableGreen creditGreen PValue added of the six major energy-intensive industries multiplied by (1—percentage of interest expenses of the six major energy-intensive enterprises in each province)
Control VariableEnterprise sizesizeTotal assets
Leverage ratiolevEnterprise size/total liabilities
Current ratioflowrCurrent assets/current liabilities
Capital structure ratiocapsTotal liabilities/total owners’ equity
Years of business establishmentageln(age of enterprise + 1)
Cash flow ratiocfoNet cash flows from operating activities/current liabilities
Instrumental VariableAverage value of green creditsavgAverage value of green credits for the year in all other regions
Intermediary VariableEnterprise R&D investmentR&DTotal scientific research investments of all enterprises in each prefecture-level city
Table 2. Average value of green credit in major Chinese cities.
City Level of Green CreditCity Level of Green CreditCity Level of Green Credit
Shanghai0.6724Tianjin0.5438Shijiazhuang 0.3711
Urumqi 0.1826Taiyuan0.5897Fuzhou 0.4592
Lanzhou0.1869Guangzhou 0.6242Xi’an0.4212
Beijing0.6633Chengdu0.3761Guiyang 0.2119
Nanjing0.6069Kunming 0.1222Zhengzhou 0.4627
Nanchang 0.4475Hangzhou 0.6518Chongqing0.5530
Hefei 0.6024Wuhan city 0.4961Yinchuan 0.2351
Hohhot 0.2907Shenyang 0.4079Changchun 0.4480
Harbin0.5182Jinan0.5202Changsha 0.4902
Overall average0.4247
Table 3. Average value of green technology innovation of enterprises in major cities in China.
City Green Technology
Innovation Level of Enterprises
City Green Technology
Innovation Level of Enterprises
CityGreen Technology
Innovation Level of Enterprises
Shanghai8.6182Tianjin8.1758Shijiazhuang 6.6113
Urumqi 5.8203Taiyuan6.3391Fuzhou 6.7877
Lanzhou5.9012Guangzhou 8.2417Xian7.6909
Beijing, 9.2639Chengdu8.0239Guiyang 6.2989
Nanjing8.2085Kunming 6.8204Zhengzhou 7.3708
Nanchang 6.4066Hangzhou 8.1936Chongqing7.6844
Hefei 6.3391Wuhan7.8133Yinchuan 5.3235
Hohhot 5.3197Shenyang 6.7403Changchun 6.3944
Harbin6.7483Jinan7.5067Changsha 7.3353
Overall average7.1103
Table 4. Spatial econometric model applicability test table.
Test MethodsInspection VolumeStatisticsp-Value
LM testLM-spatial lag1069.9280.000
Robust LM-spatial lag630.5780.000
LM-spatial error442.2700.000
Robust LM-spatial error2.9190.000
Likelihood-ratio testInd442.150.000
Time4759.240.000
LR-spatial lag253.630.000
LR-spatial error573.270.000
Wald testWald-spatial lag248.750.000
Wald-spatial error464.400.000
Table 5. Dual fixed SDM model effect decomposition results.
VariantDirect EffectIndirect EffectAggregate Effect
Green p0.091
(0.137)
0.612 **
(0.258)
0.702 ***
(0.256)
size0.037 ***
(0.014)
−0.088 ***
(0.031)
−0.050
(0.036)
lev−0.133 *
(0.073)
−0.506 ***
(0.179)
−0.640 ***
(0.203)
flowr0.009
(0.008)
−0.036 **
(0.018)
−0.027
(0.021)
caps−0.002
(0.011)
−0.013
(0.037)
−0.015
(0.040)
age−0.110
(0.042)
−0.095
(0.096)
−0.206 *
(0.110)
cfo0.025
(0.051)
−0.000
(0.128)
0.245
(0.147)
R20.5400
n2439
Note: ***, **, * indicate significant at 1%, 5%, and 10% level, respectively.
Table 6. Regional heterogeneity of green credit influencing corporate green technology innovation.
Dependent VariablesEastern RegionCentral RegionWestern RegionNortheastern Region
CoefficientRobust
Std. Err.
CoefficientRobust
Std. Err.
CoefficientRobust
Std. Err.
CoefficientRobust
Std. Err.
Green p−0.4190.2702.229 ***0.3221.235 ***0.301−4.392 ***0.808
size0.177 ***0.0340.126 ***0.0230.126 ***0.033−0.0100.037
lev−0.720 ***0.280−0.464 **0.206−0.590 **0.2600.729 **0.336
flower0.0470.0560.171 ***0.0450.116 ***0.0350.0770.077
caps0.0240.050−0.091 **0.039−0.209 ***0.0550.186 **0.091
age0.644 ***0.0480.503 ***0.0500.604 ***0.0570.811 ***0.066
cfo−0.451 *0.249−0.1360.1910.565 **0.2590.025 *0.276
R20.73230.52560.64250.6116
n2439
Note: ***, **, and * indicate significance at the 1%, 5%, and 10% level, respectively.
Table 7. Spatial weight matrix regression analysis.
Dependent VariableInverse Distance Weight MatrixNearest Neighbor Special Weight MatrixAdjacency Weight Matrix
Direct
Effect
Indirect EffectTotal EffectDirect
Effect
Indirect EffectTotal EffectDirect
Effect
Indirect EffectTotal Effect
Green p0.061
(0.138)
15.347 *
(8.055)
15.407 *
(8.056)
0.032
(0.137)
0.540 **
(0.213)
0.573 **
(0.222)
0.141
(0.134)
0.375
(0.238)
0.516 **
(0.246)
size0.030 *
(0.016)
−1.900
(1.505)
−1.871
(1.512)
0.031 **
(0.144)
−0.092 ***
(0.032)
−0.061
(0.038)
0.039 ***
(0.015)
−0.014
(0.032)
0.026
(0.035)
lev−0.235 ***
(0.084)
−20.705 *
(11.329)
−20.941 *
(11.372)
−0.144
(0.072)
−0.400 **
(0.162)
−0.544 ***
(0.187)
−0.15 **
(0.073)
0.076
(0.151)
−0.074
(0.167)
flowr0.015
(0.009)
0.729
(0.873)
0.744
(0.877)
0.011
(0.008)
−0.005
(0.019)
0.006
(0.023)
0.009
(0.008)
−0.008
(0.017)
0.001
(0.022)
caps−0.016
(0.013)
−2.137
(1.507)
−2.153
(1.513)
−0.006
(0.011)
−0.015
(0.028)
−0.021
(0.032)
−0.003 *
(0.011)
0.051
(0.032)
0.048
(0.035)
age−0.097 **
(0.044)
−2.596
(2.504)
−2.694
(2.513)
−0.096 **
(0.042)
−0.152 *
(0.078)
−0.247 ***
(0.094)
−0.111 ***
(0.043)
−0.105
(0.089)
−0.216 **
0.099
cfo0.047
(0.055)
5.301
(4.659)
5.348
(4.683)
0.017
(0.051)
−0.048
(0.114)
−0.031
(0.137)
0.027
(0.051)
−0.034
(0.122)
−0.007
(0.138)
R20.18220.35860.3904
n2439
Note: ***, **, and * indicate significance at the 1%, 5%, and 10% level, respectively.
Table 8. DIF-GMM estimation and instrumental variable results.
VariablesDIF-GMMPhase IPhase II
CoefficientCorrected
Std. Err.
CoefficientRobust
Std. Err.
CoefficientRobust
Std. Err.
Instrumental variables (avg) −216.368 ***6.992
Green T (L1)0.850 ***0.036
Green P−0.1150.237 1.001 ***0.225
size0.0120.020−0.004 ***0.0010.102 ***0.016
lev−0.2450.188−0.021 **0.009−0.275 **0.133
flowr0.057 ***0.014−0.0000.0010.047 **0.021
caps−0.070 ***0.0180.0020.001−0.078 ***0.029
age0.103 **0.0420.007 ***0.0030.569 ***0.029
cfo0.338 ***0.1290.0050.0080.0920.138
F-statistic 959.612959.612
AR(1)0.000
AR(2)0.064
Sargan0.418
Note: ***, ** indicate significance at the 1%, 5% level, respectively.
Table 9. Regression results after adding control variables.
VariablesDirect EffectIndirect EffectAggregate Effect
Green p0.124
(0.137)
0.703 ***
(0.261)
0.827 ***
(0.268)
size0.046 ***
(0.015)
−0.118 ***
(0.033)
−0.072 *
(0.038)
lev−0.144 *
(0.074)
−0.518 ***
(0.183)
−0.662 ***
(0.219)
flowr0.009
(0.008)
−0.035 *
(0.020)
−0.026
(0.023)
caps0.000
(0.011)
−0.011
(0.035)
−0.011
(0.039)
age−0.126 ***
(0.043)
−0.227 **
(0.103)
−0.352 ***
(0.113)
cfo0.009
(0.051)
−0.024
(0.122)
−0.015
(0.142)
R&D−0.012
(0.011)
0.121 ***
(0.029)
0.109 ***
(0.031)
R20.5067
n2439
Note: ***, **, and * indicate significance at the 1%, 5%, and 10% level, respectively.
Table 10. Mesomeric effect test results.
Dependent VariablesIndependent Variables
Model 1Model 2Model 3
Green TGreen TR&D
R&D 0.088 ***
(0.015)
Green P1.518 ***
(0.139)
1.449 ***
(0.139)
0.788 ***
(0.185)
size0.148 ***
(0.015)
0.082 ***
(0.019)
0.755 ***
(0.020)
lev−0.637 ***
(0.130)
−0.486 ***
(0.132)
−1.707 ***
(0.172)
flowr0.084 ***
(0.019)
0.076 ***
(0.019)
0.085 ***
(0.026)
caps−0.114 ***
(0.025)
−0.099 ***
(0.025)
−0.165 ***
(0.033)
age0.619 ***
(0.025)
0.584 ***
(0.026)
0.400 ***
(0.033)
cfo0.188 *
(0.113)
0.161
(0.112)
0.309 **
(0.150)
R20.69260.69680.8093
n2439
Note: ***, **, and * indicate significance at the 1%, 5%, and 10% level, respectively.
Disclaimer/Publisher’s Note: The statements, opinions and data contained in all publications are solely those of the individual author(s) and contributor(s) and not of MDPI and/or the editor(s). MDPI and/or the editor(s) disclaim responsibility for any injury to people or property resulting from any ideas, methods, instructions or products referred to in the content.

