Article

Blue Sky Protection Campaign: Assessing the Role of Digital Technology in Reducing Air Pollution

Institute of Quantitative Economics, Huaqiao University, Xiamen 361021, China
*
Author to whom correspondence should be addressed.
Systems 2024, 12(2), 55; https://doi.org/10.3390/systems12020055
Submission received: 9 December 2023 / Revised: 24 January 2024 / Accepted: 4 February 2024 / Published: 5 February 2024

Abstract

:
Air pollution severely threatens people’s health and sustainable economic development. In the era of the digital economy, modern information technology is profoundly changing the way governments govern, the production mode of enterprises, and the living behavior of residents. Whether digital technology can bring ecological welfare needs to be further studied. Based on panel data from 269 Chinese cities from 2006 to 2021, this study empirically examines the impact of digital technology on air pollution by using the two-way fixed effect model. The results show that digital technology will significantly reduce the concentration of fine particles in the air and help protect the atmospheric environment. The results are still valid after using the interactive fixed effect model and the two-stage least square method after the robustness test and causality identification. Digital technology can also reduce the air pollution by promoting green innovation, improving energy efficiency, and easing market segmentation. The effect of digital technology on reducing the concentration of fine particles in the air is heterogeneous. Digital technology plays a more substantial role in reducing pollution in resource-based cities and areas with a high degree of modernization of the commodity supply chain. The positive effect of digital technology in reducing air pollution is affected by the amount of air pollutants emitted. When the concentration of PM2.5 in the air is high, the role of digital technology in protecting the atmosphere will be strongly highlighted. This research is a beneficial exploration of protecting the atmospheric environment by using digital technology while building an ecological civilization society. The conclusion will help urban managers, the public, and business operators entirely use modern equipment such as 5G, remote sensing, and the Internet of Things in their respective fields to protect the atmospheric environment.

1. Introduction

The environment is people’s livelihoods, the green mountains are beautiful, and the blue sky is also happiness. As a latecomer to modernization, China has become the world’s second-largest economy and created a miracle of economic development in just a few decades of reform and opening up. According to data from the Ministry of Industry and Information Technology of China, the proportion of added value of China’s manufacturing industry worldwide has increased from 22.5% in 2012 to 29.8% in 2021. However, at the same time, the deepening of urbanization and industrialization has driven the rapid development of cities and led to environmental pollution problems, including air pollution (AP), which continues to be highlighted. Substantial environmental costs, such as resource depletion, environmental pollution, and ecological damage, accompany China’s economic development. The traditional extensive mode of production, which sacrifices natural resources and destroys the ecological environment to obtain economic growth, needs to be changed urgently; the green transformation is imperative and imminent. China has introduced strategic measures for AP prevention and control in the increasingly sharp contradiction between economic development and environmental protection. To shoulder its ecological responsibility as the world’s largest developing country, China has solemnly declared its determination to combat world AP. Since the beginning of the new era, China has successfully explored a road of AP control: “government-led, interconnected departments, responsible enterprises, and public participation.” China has become the country with the fastest improvement in air quality in the world, and the happiness of the people in the blue sky has significantly increased. The 2023 Air Quality Life Index (AQLI) report from the Energy Policy Institute at the University of Chicago (EPIC) shows that the global challenge of reducing AP may seem daunting; however, thanks to China’s efforts, the global average level of AP is slowly falling 1. Since the Chinese government announced the start of the battle against pollution in 2014, the average pollution in China has been reduced by 42.3 percent and the average life expectancy in China is expected to be extended by 2.2 years. The measures and technological innovation adopted by China have positively contributed to global emission reduction and environmental improvement [1]. Of course, China’s air control work has yet to reach the optimistic moment fully. According to data from the State of the Ecological Environment Bulletin, the concentration of delicate particulate matter in all Chinese cities in 2022 was 29 μg/m3, about six times the World Health Organization standard, which is still very harmful to the human body 2. There is still a long way to go in China’s AP control. The structural, root, and trend pressures on China’s ecological and environmental protection have not yet been fundamentally alleviated, and environmental pollution has become the Achilles heel of China’s sustainable development. What is worse, the thorniest problem of how to completely remove AP is gradually evolving into localization and complexity problems without ready reference answers, and more independent exploration and practical experience must be called for. If not, it will hurt China’s green transformation and even high-quality development in the new era.
The deep integration and application of digital technology (DT) in resources, energy, and the environment have drawn much attention to its role in protecting the atmospheric environment [2]. In the context of the information age, the digital infrastructure, the development of digital industries, and the transformation of industrial digitalization will lead to significant changes in social production methods and profound changes in human lifestyles, providing a new perspective for environmental governance, energy conservation, and emission reduction. China’s pollution emission (especially the heavy chemical industry) involves a wide variety of products, a wide range of raw material sources, long process flows, and many pollution production links and has the essential characteristics of a large pollution volume, high pollution load, prominent combined pollution, substantial toxicity, high carbon emission intensity, and so on. Timely and accurate identification of pollution sources and optimizing treatment plans based on this is the key to protecting the atmospheric environment. In the era of big data, the application of artificial intelligence and DT can effectively expand the time and space scope of environmental governance, optimize the decision-making mechanism of local government environmental pollution control, identify primary environmental pollution sources in the region, achieve dynamic environmental pollution supervision of enterprises, and improve the efficiency of environmental pollution control. The research questions to be answered in this study are as follows:
  • Can DT based on modern electronic information technology bring ecological welfare in preventing and controlling AP? In the context of enterprise digital transformation and digital industrialization, can DT become the golden key to ecological protection of the environment and harmonious coexistence between man and nature? In other words, whether digital technology can reduce the concentration of pollutants in the air is what this paper will focus on.
  • If DT contributes to blue sky goals, what are the indirect economic mechanisms and is there heterogeneity based on urban factor endowments?
Answering these questions will help solve the ecological problems of energy shortage, environmental degradation, and AP and is a top priority in achieving the United Nations Sustainable Development Goal 11 (focus on urban air quality).

2. Literature Review

2.1. Does DT Have a Positive Effect on Reducing AP?

The economic benefits of DT development have been widely proven, but the issue of whether DT can achieve ecological benefits needs further discussion. Ecological civilization, as a kind of advanced civilization form of harmonious coexistence between man and nature, is built based on developed science and technology. The ongoing digital transformation is widely believed to be transforming the ecological environment [3]. However, like many discussions of emerging technologies, the environmental impact of DT is highly controversial: whether DT enhances ecological welfare remains an open question.
The impact of DT on environmental sustainability may be a pessimistic scenario because of the high energy consumption characteristics of DT and the short life cycle of electronic products. Critics claim that “the rapid development of DT will destroy the planet.” Although customized production processes, system optimization, and energy use management can help reduce energy consumption, efficient reproduction may offset potential energy savings, which will exacerbate environmental pollution [3]. For example, the wide application of robots and the Internet of Things directly increases the demand for energy consumption in society and aggravates the environmental pollution caused by electronic appliances and discarded digital equipment. The consumption of personal electronics, especially lightweight mobile digital devices such as personal computers, mobile phones, and wearable electronic watch platforms, is contributing to environmental pollution when people mine precious rare earth materials and minerals, as well as e-waste generated when these electronic devices are discarded [4]. Correspondingly, people’s demand for DT services and products is snowballing, resulting in a significant increase in derivative demand for energy supply from electronic equipment and service providers, thus aggravating environmental pollution [5]. The “new choice” caused by new technological changes induces people to increase the consumption of resources and energy, which leads to the phenomenon of energy rebound while reducing production energy consumption and further aggravates environmental pollution [6]. Digital devices and their supporting facilities have a high demand for electricity and continue to release carbon dioxide throughout their life cycle. The process of enterprise digital transformation itself has a carbon lock-in effect. The pollution behind the operation of DT is considerable. In a simulation study, researchers found that the simulation process of a single deep learning training model for complex natural language tasks can produce the equivalent of about 300 tons of CO2, equivalent to five times the carbon emissions of a car over its average lifetime [7]. Digital ecosystems result from interactions between humans, the digital infrastructure, and devices and rely on large-scale energy consumption; the digital economy constructed by DT is not inherently environmentally sustainable.
On the other hand, proponents believe that DT can provide information support for environmental and climate governance, reduce dependence on resources and energy, help improve production efficiency, and promote technology spillover [8]. Adhering to the view that technological innovation is a crucial factor in achieving economic sustainability, they counter that “DT are the solution to achieving environmental sustainability” [9,10]. With the deep integration of DT and the real economy and the continuous development of industrial digitalization and digital industrialization, an unprecedented digital revolution is occurring in the economy and society. In production, DT uses data flow as the driving force to drive the all-round, multi-angle, and whole-chain transformation and innovation of the industry, thus improving output and efficiency [11]. New industries, new models, new formats, and new technologies derived from DT, including but not limited to the industrial Internet, intelligent manufacturing, digital twins, data mining, and the Internet of Things, are profoundly changing the form and process of the industrial capital cycle. DT facilitates the digital transformation of enterprises. It enables the exemplary management of processes such as material input, factor allocation, product manufacturing, and marketing, which can reduce energy consumption and waste in production, thus having a positive impact on pollution control [12]. With the support of DT, traditional labor-intensive factories are transforming into capital-intensive and technology-intensive intelligent factories and robots are replacing the inaccuracy and inefficiency of human labor. “Machine replacement” changes the entire production process [13]. Enterprises can monitor production scheduling, equipment services, and quality control through intelligent production, data analysis, and scientific decision making, reducing pollution emissions. In this section of life, the emerging digital platform provides the technical pathway and incentive mechanism for the public to participate in environmental protection, endow green behaviors with more prosperous attributes, and expand the potential influence of daily green consumption behaviors (such as green travel, travel reduction, recycling, paper and plastic reduction, high efficiency, and energy saving) [14].

2.2. Literature Gap

In the view of reducing environmental pollutants via DT, the existing literature also analyzes its potential mechanism channels from the perspectives of technological innovation, financial development, industrial upgrading, industrial agglomeration, and energy efficiency [15,16,17,18,19,20,21,22]. In the field of digital economy, scholars have used big data [23], broadband China strategy [24,25], and smart cities [26,27,28] to conduct a large number of policy evaluations for the carriers of DT; the conclusions are inconsistent. Overall, the existing literature on whether DT can reduce AP is still controversial. Therefore, the potential contribution of this study is as follows:
First, this study provides a comprehensive research framework for urban economy environmental protection, which not only provides a new perspective for urban air governance but also expands the research field of environmental ecology and environmental economics. In the era of digital economy, it is very important to analyze the role of modern information technology in ecological welfare. Although there are abundant studies on the development of the digital economy to reduce carbon emissions and smog, the net effect of the digital economy on environmental protection is still unresolved. Within the digital economy system, this study innovatively constructs a research framework of “economy-technology-environment” from the perspective of the digital economy. The research conclusions help fully understand the benefits of advanced technology to the environment.
Second, at this stage, it is still worth thinking about how to quantitatively evaluate the development level of DT at the city level. This study uses the installed density of industrial and service robots as a proxy variable for DT, providing a feasible scheme for quantifying the development status of DT at the city level.
Third, the study also identifies a new institutional path based on energy efficiency and green technology innovation, namely, DT can reduce AP by reducing market segmentation and facilitating the formation of a large domestic market. At present, the analysis of the mechanism of digital technology affecting environmental pollution focuses on technological innovation, industrial structure, and energy structure, but the economic phenomenon of market integration has not been studied.
Finally, when analyzing urban heterogeneity, the existing literature is often based on the perspective of geographical location, economic income, and city size, but these mature approaches are not enough to draw surprising conclusions. Because geographical location and climatic conditions cannot be changed even if city managers work hard, this study analyzes the heterogeneity of environmental pollution reduction by DT from the perspective of economic policies and resource endowments. Therefore, the classification criteria adopted in the heterogeneity analysis of this study are also brand new and the research conclusions are more realistic and revelatory.
In general, this study is a beneficial discussion on technology to reduce haze pollution in the context of building an ecological civilization society and achieving Chinese-style modernization and the conclusions are helpful for the government, enterprises, and residents to make full use of digital media to play their role in the blue-sky defense.

3. Theoretical Mechanism and Research Hypothesis

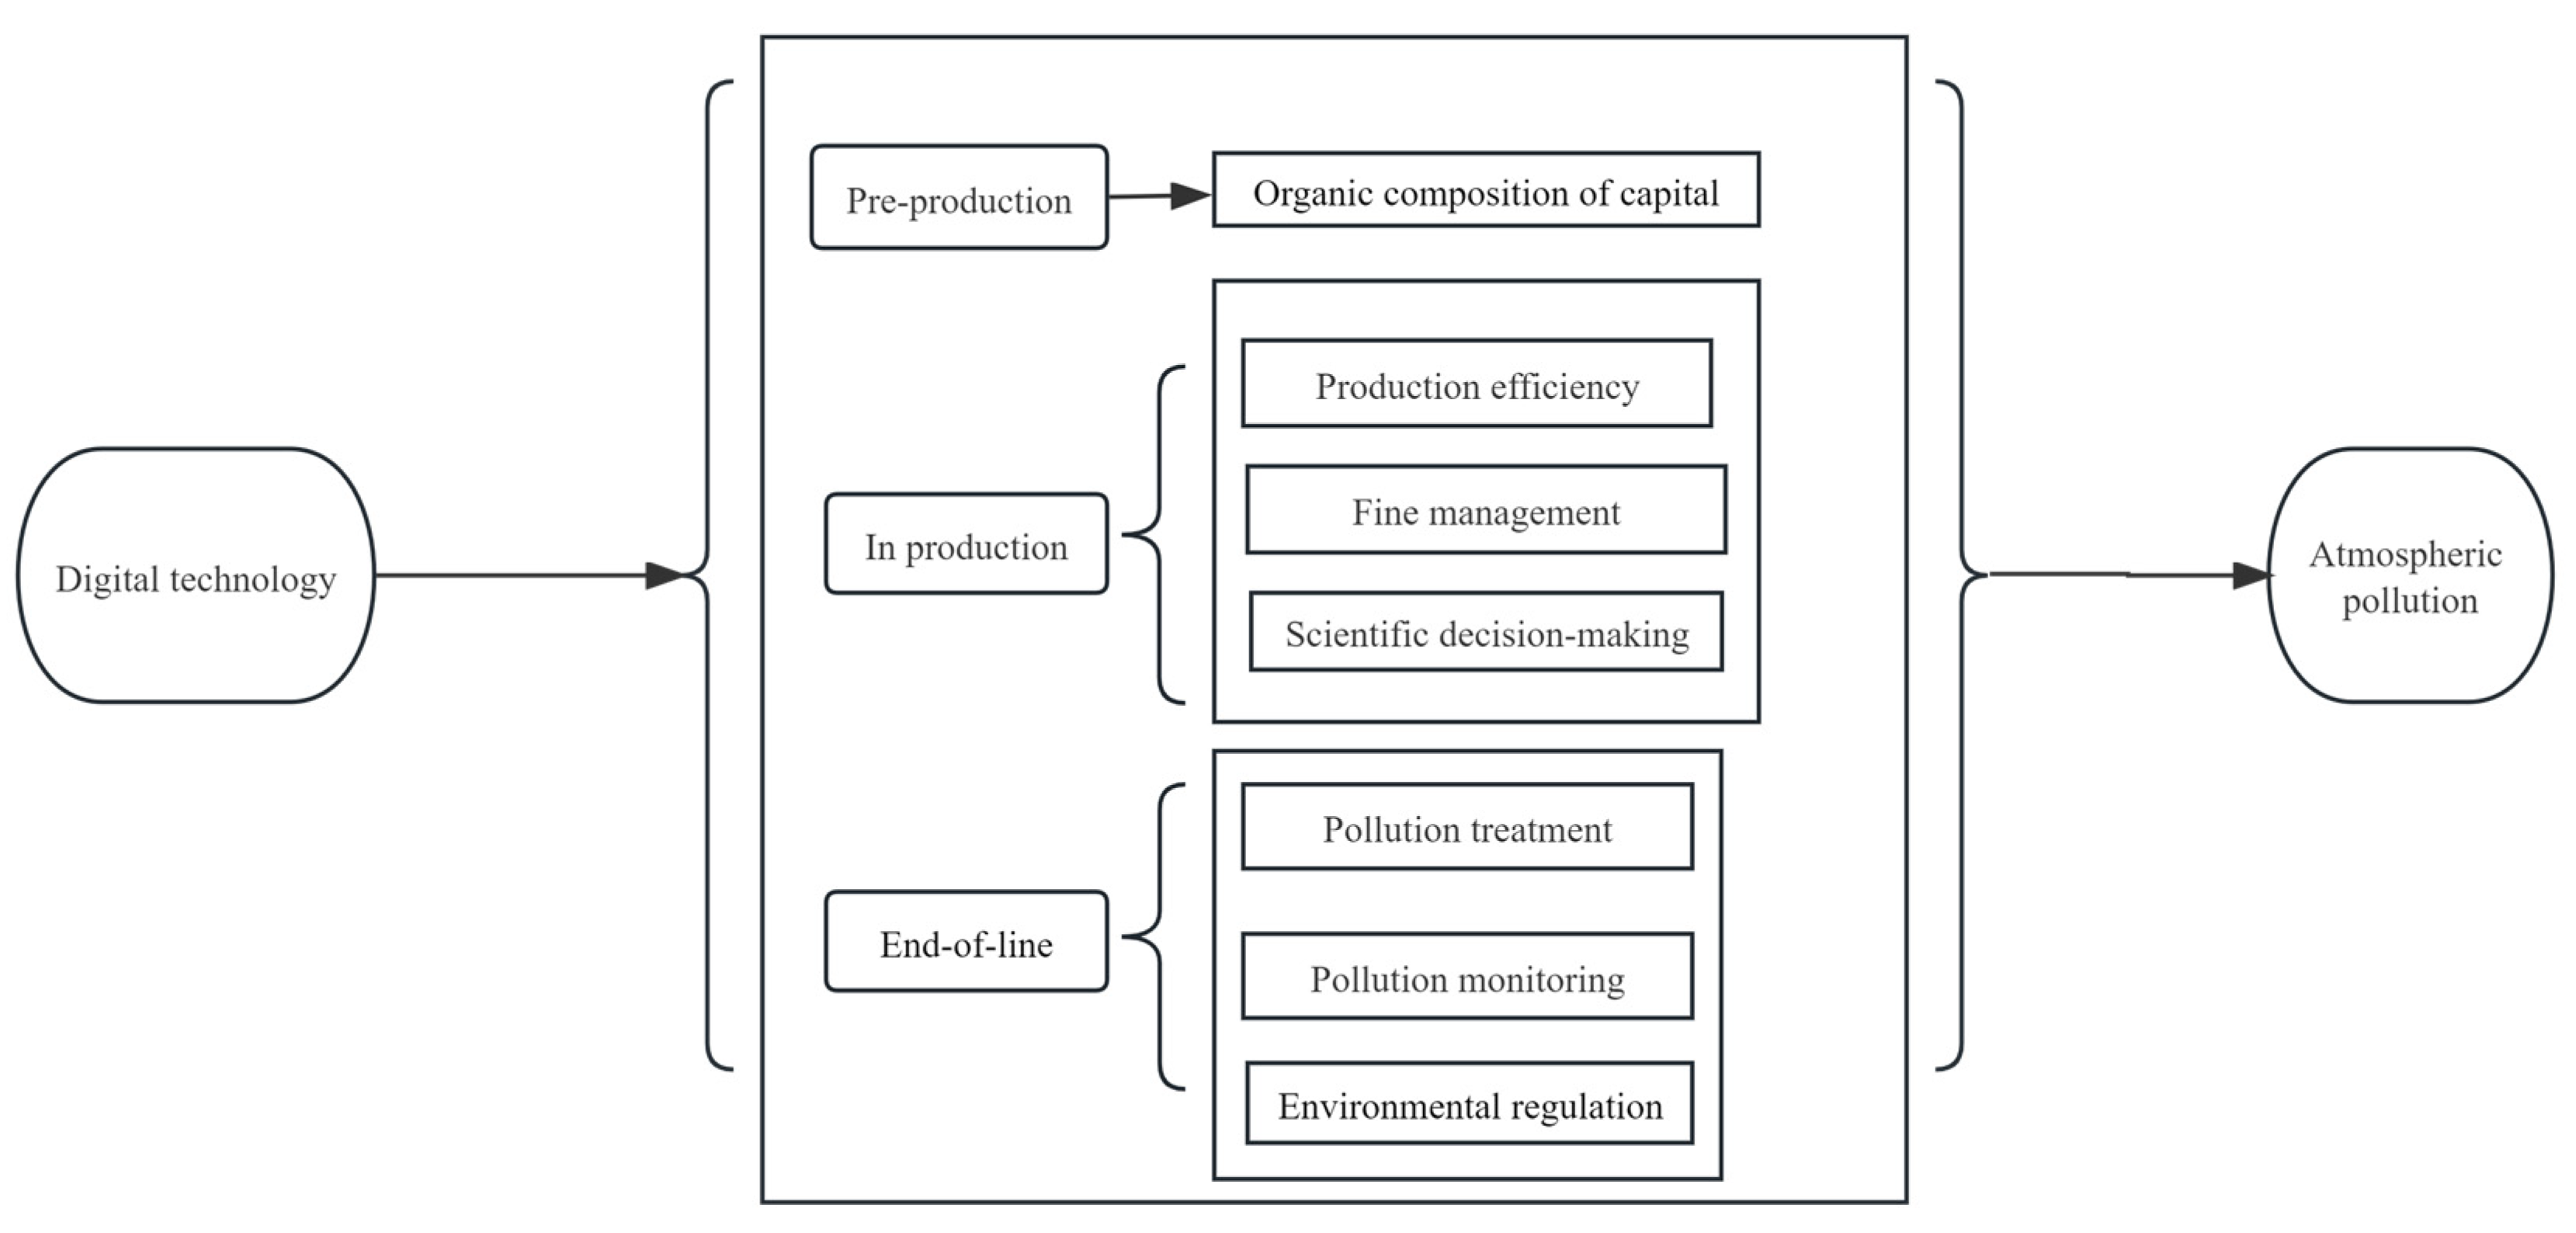
3.1. The Direct Impact of DT on AP

The application, innovation, and development of DT can not only provide refined, scientific, and operational decision-making solutions for the environmental planning of market players but also provides opportunities and technical support for the optimization and efficiency improvement of top-down environmental regulation models that will help achieve the goal of reducing air pollutant emissions.
As a typical representative of modern information technology, DT has a distinct “green bias” [29]. DT can unlock the potential of cleaner production by optimizing production and management processes and facilitating the efficient allocation of resource elements. The control of pollutant emissions in the production of products can be roughly from the end of production management, production front control, and production process management, and these three processes are inseparable from the support of advanced technology. Regarding the front end of production, introducing artificial intelligence and robot equipment to replace human labor can avoid or reduce the waste of resources and environmental pollution caused by the inefficiency of manual operation [30]. For example, in industrial production, fully automated spraying robots can improve the spraying quality and material utilization, reduce paint and solvent waste that may be caused by manual operation, and thus reduce the production of volatile organic compounds such as benzene and xylene. By performing the same process repeatedly with very high precision, collaborative robots can help businesses reduce waste and save resources. At the same time, collaborative robots based on DT require less operating space than traditional automated robots, which means that enterprises can organize production in smaller spaces to reduce heat and energy consumption. With the support of the Internet information platform and the new generation of artificial intelligence technology, the rapid flow of knowledge, information, and population migration accelerates the cross-regional flow of knowledge and technology spillover, improves the probability of on-the-job workers acquiring knowledge and technology through working, and maximizes the value of human capital and the update of advanced technology in the production sector. Strong, profound learning ability and swarm intelligence technology can accelerate technological innovation and diffusion, improve the contribution of human capital and technological progress to output efficiency, and thus provide intellectual and technical support for the healthy development of capital-intensive and technology-intensive entities, contributing to the maximum improvement of green total factor productivity [31,32]. From the perspective of the production end, using DT allows enterprises to increase a small amount of green investment, which can maximize the efficiency of the enterprise end treatment, improve pollution treatment capacity, and thus reduce pollution emissions [33]. For example, in pollution monitoring, the traditional pollutant concentration tester requires workers to hold the instrument in the polluted environment and judge the pollutant concentration through the reading, whereas the remote-controlled excavation robot integrates the environmental pollution monitoring platform, realizes the remote automatic operation of the machinery and the warning and reminder functions, and can stop the environmental accidents caused by the leakage of pollutants. In the waste purification process, the operator can adjust the parameters of the machine and equipment according to the characteristics of different air pollutants to improve the purification accuracy of the waste and reduce pollution emissions. At the recycling stage, the fully automated closed working space brings excellent convenience for valuable gas recovery and waste disposal. For example, centralized catalytic combustion destroys waste gas to achieve complete purification and avoid secondary pollution. In summary, this study proposes the first hypothesis:
Hypothesis 1 (H1):
DT has a significant negative impact on atmospheric pollution by virtue of its advantages in data processing, information flow, program simulation and monitoring, and treatment.

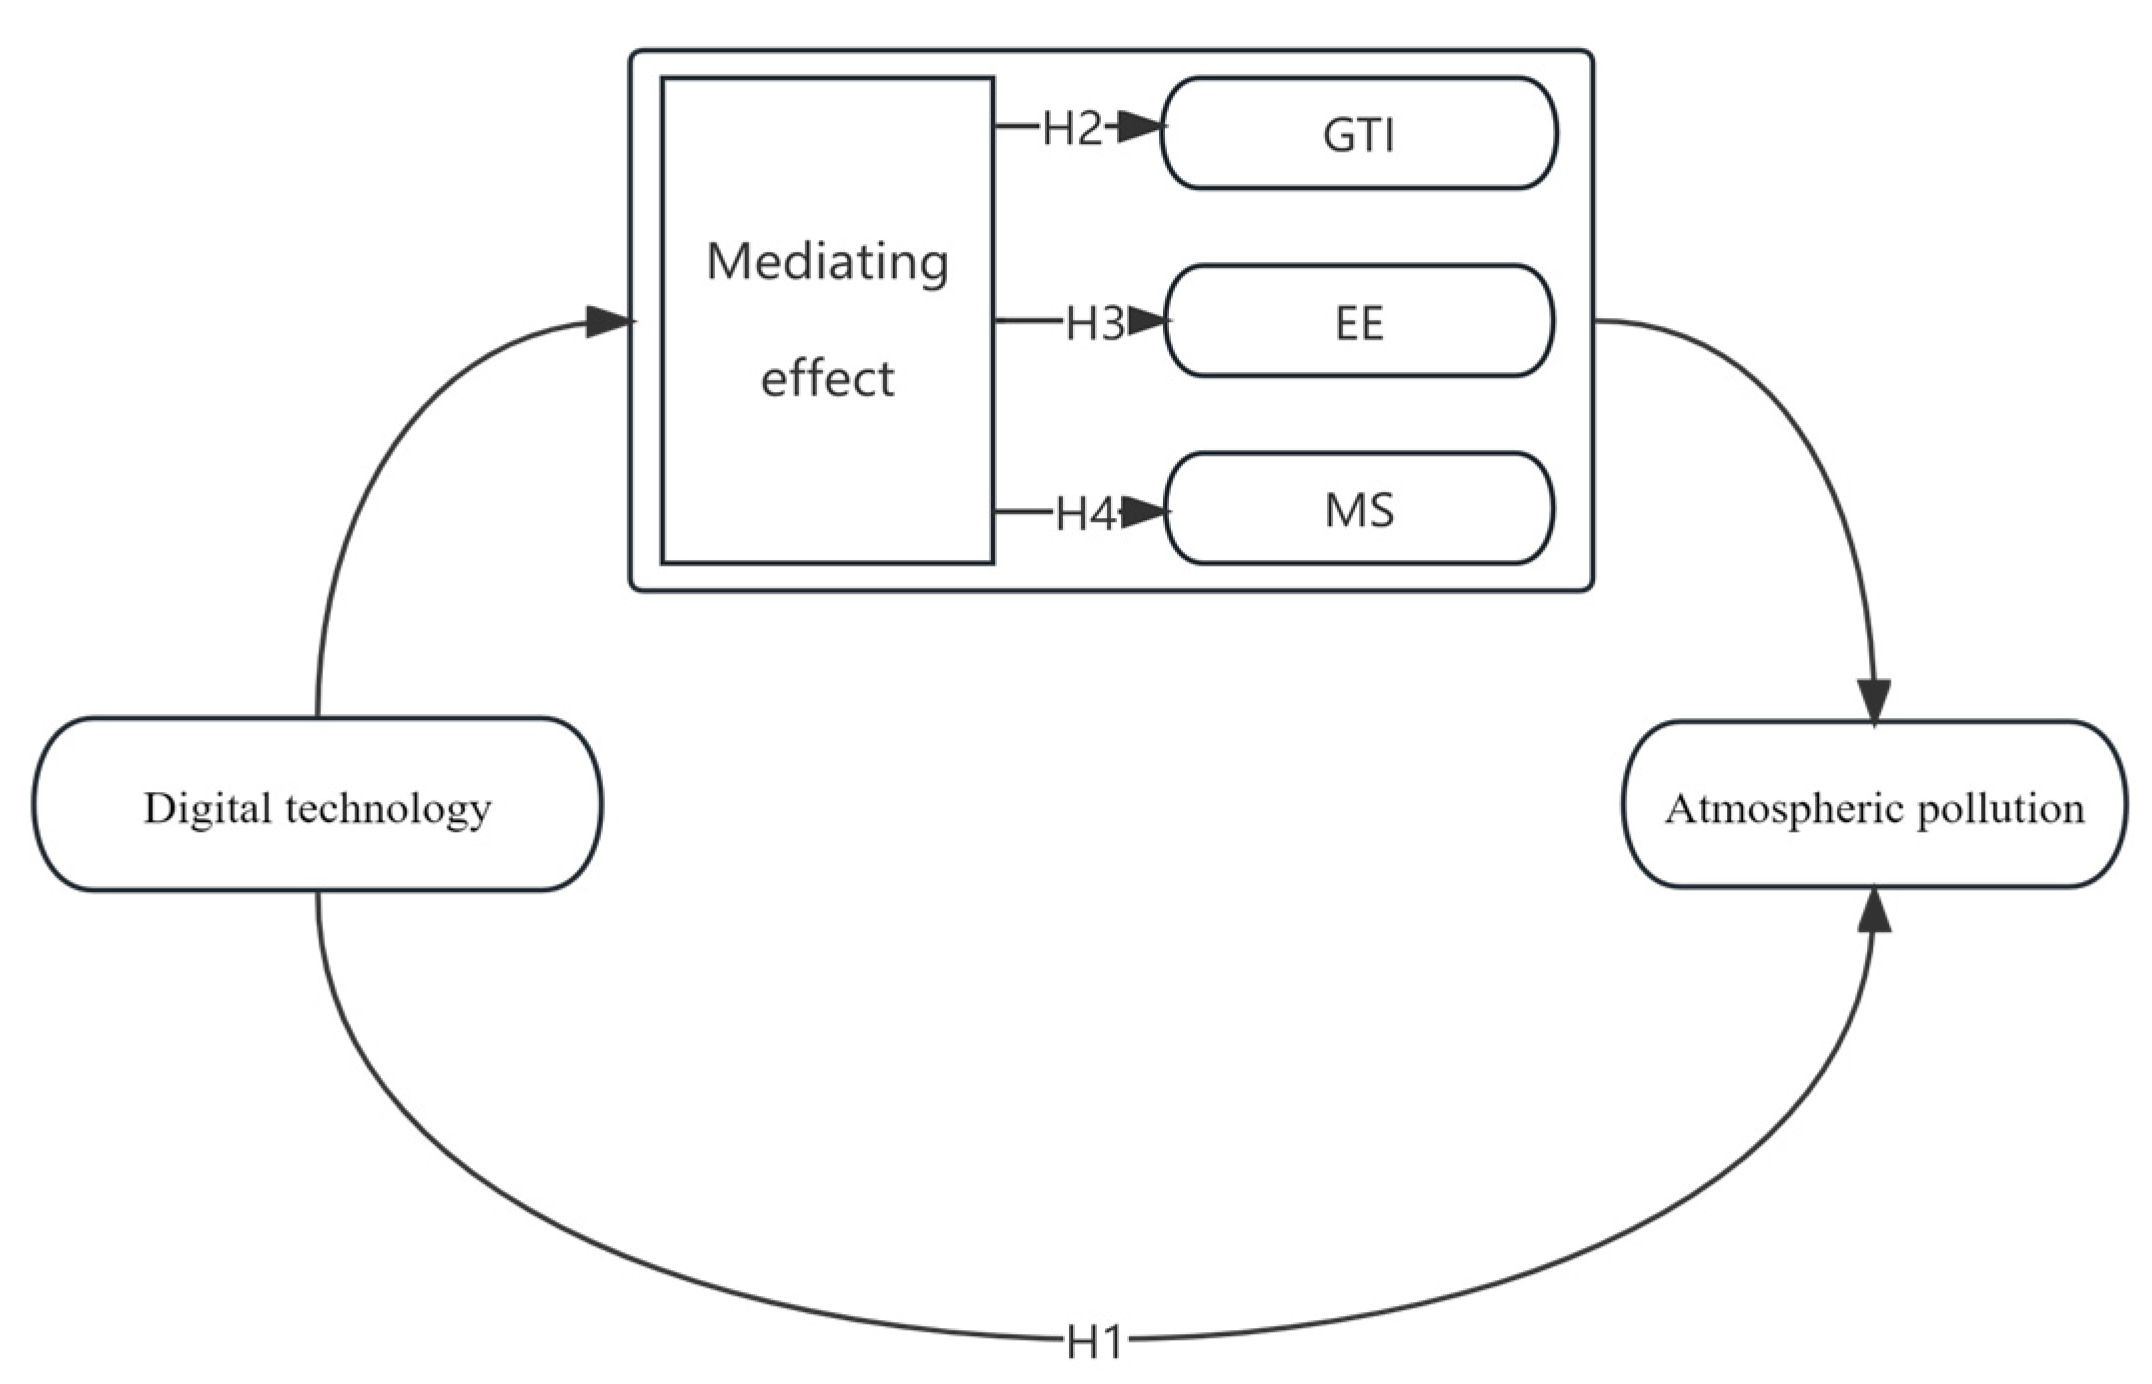
3.2. Indirect Channels for Digital Technologies to Reduce AP

3.2.1. The Role of Green Technology Innovation

Cleaner and more efficient technological innovation is the fundamental way to improve enterprises’ pollution control ability and promote energy conservation and emission reduction [34,35,36]. According to the theory of a natural-resource-based view, various internal factors, including technical capability, are the basis for enterprises to maintain market competitiveness. The research and development of green technology requires enterprises to invest a lot of capital and labor, accompanied by multiple rounds of trial-and-error processes and high sunk costs [37]. DTs rely on Internet platforms and digital applications to accelerate the flow of information, make knowledge spillover and interaction cheaper and faster, and help enterprises achieve efficient and low-cost green technology innovation [38]. DT can help enterprises connect technology, data, and knowledge chains, provide virtual experiment space and models that map reality, and provide favorable conditions for enterprises to make green innovations. The multi-component digital simulation platform and virtual experiment platform based on information technology break through the limitation of physical factors on research and development and provide a low-cost and high-efficiency application scenario for the acquisition, integration, and development of technological innovation elements. Enterprises can use smart devices and cloud computing platforms to conduct green technology research, develop different solutions, and constantly revise and improve the future innovation path based on the existing historical experimental data. This advantage broadens the efficiency of the allocation of internal resources and the spatial storage capacity of resources to ensure that enterprises can efficiently achieve predictable green technology innovation. Therefore, DT helps reduce the risk of failure of technological innovation and the cost of capital and time required for technological innovation [39]. According to the innovation theory, the essence of innovation is to recombine production factors to form a new production function. Moreover, the factor supply of the external environment and market competition will affect the innovation strategy of enterprises [40]. The permeability, borderlessness, and open characteristics of DT make the barriers between industries gradually and significantly change the external environment of enterprises. The traditional closed technological innovation has also evolved from the internal activities of a single real economy to the open innovation of multiple real economies using cyberspace to share resources and knowledge. Valuable ideas and technologies can be obtained and commercialized outside and inside the company. Enterprises can realize innovation by utilizing complementary innovation resources inside and outside the company, which can help accelerate the efficiency of knowledge transformation, improve the competitiveness of enterprises in trial production, and solve the problem of environmental sustainability [23,41]. Therefore, DT can expand knowledge-sharing channels through swarm intelligence technology, accelerate green technology innovation and product research and development, and help reduce pollutant emissions in the front and middle stages of enterprise production [42].
DT can innovate the mode and way of environmental governance and improve the efficiency of ecological governance. With breakthroughs in the underlying technologies of digital applications such as big data mining, cloud computing, algorithms, and AI large models, digital general technologies and platforms such as computer vision, intelligent speech, and natural language processing have gradually realized industrial development and digital technologies have entered a stage of high-speed iteration and large-scale application. The key for DT to promote urban fine management is to improve the efficiency of each node of environmental governance. In terms of environmental pollution monitoring, DT, represented by artificial intelligence, infrared sensing, and remote sensing, can improve the speed of pollution source information acquisition by city managers and carry out a risk assessment and analysis of the environmental conditions in the region on this basis, thus improving the decision-making efficiency of environmental regulators. The super-strong perception ability of information and communication technology and the Internet of Things can more efficiently identify the source of environmental information and make essential judgments about the status quo of the environment. For example, sensors based on artificial intelligence technology can quickly identify, locate, and predict AP through electromagnetic wave monitoring technology and the Lambert–Beer law, map the AP density in a region into different spots through spectral analysis, and track and detect the regional AP status in real time. In terms of resource allocation for pollution prevention and control, city managers can use big data analysis technology to more accurately understand the environmental requirements of the market, the status quo of the city’s environment, the prominent areas of environmental problems, and the concentrated distribution of pollution sources. Only after mastering the primary environmental conditions in the jurisdiction can city managers optimize the regional allocation of pollution control technology, resources, and equipment to achieve the purpose of energy saving, emission reduction, and quality and efficiency improvement. Regarding regulatory efficiency, the government can use DT to establish an environmental information coordination center integrating the online monitoring of data information, real-time transmission of video images, and real-time reporting of environmental pollution status to realize environmental grid management while conducting the off-site supervision of enterprises. Such a platform could help the central government supervise grassroots officials in implementing various environmental regulations and improve regulatory efficiency. The government can also introduce third-party governance institutions through data sharing to form a governance model in which the government, enterprises, and society participate [43]. Data sharing and transparency reduce the incidence of corruption, such as data falsification and collusion between government and business, leading to more effective environmental governance across different administrative levels [44]. DT has also given rise to second-hand e-commerce and recycling platforms. Many idle items, especially electronic waste and clothing, are recycled on these platforms, avoiding the environmental burden caused by disposal. Effective recycling will significantly reduce the AP caused by repeated production and direct incineration and help consumers promote the formation of savings, simple, shared sustainable consumption concepts, and behavior patterns. Intelligent temperature control systems and sensors can monitor the temperature change of the surrounding environment in real time and automatically adjust the operation of air conditioning facilities, optimize the lighting and ventilation system of the building, reduce unnecessary energy resource consumption, and reduce pollution gas emissions.
The analytical framework for the direct reduction of AP by digital technologies is shown in Figure 1. Accordingly, this paper puts forward research hypothesis 2:
Hypothesis 2 (H2):
DT can reduce AP through channels that promote green technology innovation.

3.2.2. The Role of Energy Efficiency

Relevant theories of environmental economics usually regard energy consumption as the direct source of environmental pollution [45]. Air pollutants are mainly produced in traditional heavy industries, especially in power plants, petrochemical industries, metal smelting, and machinery manufacturing. These industries produce large amounts of carbon dioxide, soot, and nitrogen oxides. In daily life, the fuels commonly used by residents (coal, liquefied petroleum gas, and natural gas) cause many low-altitude emissions of pollutants when burned incompletely. Due to the rapid development of the transportation industry, cars, trains, ships, and planes that are mainly powered by petroleum products such as diesel and gasoline are running longer and more frequently in cities. The combustion of petroleum products will produce much particulate matter, carbon monoxide, nitrogen, and hydrocarbon oxides. Among manufactured pollution sources, improving energy efficiency in transportation, industrial production, and daily life is essential to protect the atmosphere and environment.
To mitigate the harmful effects of energy production and consumption on the ecological environment, humans need to continue exploring new technological solutions [46]. Traditional energy production is resource oriented; by exploring and exploiting abundant one-time natural resources and constructing matching production, marketing, storage, and transportation infrastructure, we can ensure energy security and support social and economic development. Under the goal of protecting clean air and building a digital China, the shape of the energy system is profoundly evolving and changing, energy types are more diversified, the number of power sources is significantly increased, the grid architecture is more complex, and the energy consumption is flexible and changeable. Traditional centralized management and control make it difficult to meet the timeliness requirements of power grid operation and maintenance, communication and transmission, and information processing of the master station system. The transformation train with DT at its core is accelerating in the energy and power industry. The DT brought by digital transformation and its continuous improvement attributes effectively promote the development of enterprise production technology and energy management technology and improve the energy efficiency of enterprises. The application of DT can not only optimize the energy business and break down the “energy silos” but also achieve the integration of energy types and promote the efficiency of the entire industry chain [47]. The deep cross-integration of digital and energy technology has given birth to new technologies, models, and business forms in the energy industry. Smart grids based on DT (an energy infrastructure that continuously monitors and effectively matches energy supply and demand) give the power grid more robust perception, decision-making, and execution capabilities. It relies on critical technologies to maximize the consumption of distributed power, actively adapting grid coordination and control and optimizing the operation of demand-side resources. DT aggregates massive power side adjustable resources through the Internet of Things and blockchain technology to build a “virtual power plant,” guide the majority of power users to use electricity reasonably, promote the bidirectional organic interaction between the power generation side and the load side, and thus improve the elasticity and power use efficiency of the power grid [48]. Based on the data mixing model, digital devices use machine learning to excavate the hidden rules of the operation of the machine equipment and edge computing to achieve parameter optimization. This provides analytical tools for production to achieve the optimal control of denitrification, desulfurization, and dust removal to achieve cleaner production. Digital twins and 5G communication technology can enable unmanned and visual precision exploration, mining, and all-round intelligent monitoring in resource exploration. This significantly improves the efficiency of resource extraction and reduces the emission of pollutants. IoT technology enables real-time data collection, processing, and analysis during coal mining, deploying smart devices to reduce safety and environmental risks during operations. Therefore, this paper proposes a third research hypothesis:
Hypothesis 3 (H3):
The advantages of DT represented by big data, artificial intelligence, and blockchain as digital twins in energy scheduling, market operations, and production planning help to improve energy efficiency, thereby reducing AP.

3.2.3. The Role of Market Integration

Under the “tournament” promotion model of government officials, local economic development is mainly subject to “local thinking” and short-term behavior, resulting in misalignment of government functions, excessive intervention in market behavior, serious segmentation of factor resources and commodity and service markets, and the formation of an “administrative region market economy”. Market segmentation refers to the non-integration of the market caused by the trade barriers set by local protectionism, in which the heterogeneous local governments restrict the inter-regional flow of resources to protect their interests under the decentralized system. The phenomenon of market segmentation caused by the artificial market policies set up by local governments directly leads to the “fragmentation” mode of regional economic development, hindering the integrated development of the regional economy and the market-oriented allocation of production factors, resulting in the spatial mismatch of resource factors [49]. Although the market segmentation strategy of “each fighting for itself” may be an advantageous strategy for local governments in the short term, it will face the prisoner’s dilemma in the long run, which is not only detrimental to the development of the whole region but also leads to the restriction of urban development by market size, resulting in severe scale diseconomies [50]. Under the fiscal decentralization system, local governments protect traditional manufacturing enterprises with large tax bases but weak competitiveness. These enterprises also have the characteristics of high energy consumption and high pollution. Therefore, market segmentation provides enterprises with administrative protection from market competition and weakens enterprises’ market initiative and technological innovation motivation.
Market integration (the opposite of market segmentation) can eliminate inter-regional trade barriers, promote cooperative cooperation and specialized division of labor among local governments, and promote the flow of technological factors and technological spillover effects [51]. In terms of the industrial structure and industrial agglomeration, market integration will break the “beggar-thy-neighbor” protection strategy adopted by local governments for the development of the local economy and cooperation, collaboration, and sharing will become the new mode of local industrial development. The phenomenon of duplicate construction, disorderly competition, and resource waste will be reduced [52]. The free flow of factors caused by inter-city cooperation will trigger the agglomeration of related industries or enterprises in geographical space, which is not only conducive to exerting economies of scale and agglomeration externalities but also reduces the innovation cost and risk of enterprises through the specialized production structure and “collective learning” mechanism at the end of the industrial chain. This will strengthen enterprises’ development and the application of energy-saving and emission-reduction technologies [53]. Smooth cooperation will also stimulate the enthusiasm of local governments to establish cross-regional technology exchange platforms and trading centers, increase the support and cultivation of enterprise research and innovation, and promote the development of clean industries. Regarding environmental governance, city managers realize joint prevention and control and collaborative comprehensive governance through environmental governance information sharing, technical cooperation, and market-oriented outsourcing services. Environmental collaborative governance is conducive to improving the pollution control capacity of cities and forming a “race to the top” situation in environmental governance among cities, thus improving urban air quality [54]. In terms of market competition, the broken market segmentation makes the economic activities of enterprises spread out in a larger geographical space. The final result is that the inter-regional market competition is more intense and active. After enterprises or industries with low production efficiency, low technical content, and low competitiveness lose policy protection, they are accelerated out or forced to transform and upgrade in the fierce market competition and market selection effect. DT has significantly enhanced the scale and network effects of market economies. It can not only break down regional trade barriers through data factor markets but also give the government new anti-monopoly regulatory tools, improve information communication efficiency, and optimize resource allocation. For example, the digital platform developed from the digital information technology platform is a typical form of enterprise organization in the era of the digital economy, which mainly includes search engines, social media, e-commerce platforms, short-video platforms, and application stores. By integrating the construction of network infrastructure and the application of DT, the digital platform brings together a variety of four transaction entities, collects massive big data information such as industry entities, product entities, logistics, sales, service, and evaluation, and encourages all kinds of market entities to communicate directly, find partners, and connect market entities distributed throughout the country with all aspects of the enterprise. To improve the operation efficiency of the industry and reduce transaction costs. Various enterprises use digital platforms to open up the blocked points in the production, exchange, and sales links, make the flow of information and logistics smoother, promote the vertical extension of the industry, improve the supply efficiency of the industrial chain, and thus help alleviate market segmentation. Based on this, the paper proposes the fourth research hypothesis:
Hypothesis 4 (H4):
The advantages of DT and network platforms in information exchange, market smoothing, and technology spillover can help mitigate market segmentation and reduce AP by promoting the entire flow of high-quality production factors and technologies through channels that promote market integration.
The analysis framework of indirect channels for DT to reduce AP is shown in Figure 2.
Therefore, according to theoretical analysis and related research hypotheses, we can develop the research framework shown in Figure 3.

4. Study Design and Data Sources

4.1. Variable Setting

4.1.1. Explained Variable

Air pollution (AP). The primary sources of air pollutants are unreasonable emissions from chimneys, industrial exhaust pipes, and vehicle and aircraft exhausts. At present, hundreds of atmospheric pollutants have caused harm to human health, production, and life, which can be summarized as granular pollutants (such as dust, coal dust, smoke, and metal particles) and gaseous pollutants (such as SO2, NOx, CO, CH4, ammonia compounds, and halogen compounds) according to their existence. The results of epidemiological studies show that AP not only causes severe respiratory and cardiovascular diseases [55,56] but can also affect the nervous system (related to cognitive ability), cause long-term harm to academic and employment performance, and seriously threaten human health and safety [57,58]. Among all kinds of AP, particulate matter with an aerodynamic diameter of less than 2.5 μm (PM2.5) is continuously deposited into the blood circulation system in the alveoli, which can cause diseases related to cardiopulmonary dysfunction, and asthma, cough, dyspnea, cardiovascular diseases, and other diseases may occur; PM2.5 can even cause liver failure. PM2.5 has become the air pollutant with the most significant impact on the global burden of disease [59]. The Action Plan for the Prevention and Control of Air Pollution issued by The State Council, China’s cabinet, also specifies the task requirements for reducing PM2.5 concentrations. Therefore, PM2.5 concentrations were selected to measure urban AP in this study. AP is measured in μg/m3. Figure 4 shows the spatial–temporal distribution of AP by city in 2006 and 2021.
As can be seen from Figure 4, the regions with the highest PM2.5 concentrations in 2006 and 2021 are mainly located in Hebei, Henan, and Shandong. The border areas of Gansu, Inner Mongolia, and Shaanxi provinces also saw PM2.5 levels exceeding the standard. Most importantly, the concentration of PM2.5 in the air in Chinese cities shows a significant downward trend in 2021. These data confirm that China’s atmospheric environment is changing for the better.

4.1.2. Core Explanatory Variable

Digital technology (DT). Robots are a kind of intelligent machine that can work semi-autonomously or fully autonomously, with essential characteristics such as perception, decision making, and execution; they are known as the “pearl in the crown of manufacturing.” Robots embody the centralized application of modern DT such as artificial intelligence, intelligent manufacturing, hardware, networks, the IoT, and cloud computing in machines and equipment. Moreover, their flexibility and intelligence are constantly improving and their adaptability to the scene is getting stronger and stronger [60,61]. Recently, the artificial intelligence technology breakthrough represented by ChatGPT has enabled robots to create content (data) automatically and is developing in the direction of data fusion application, data value development, and big data utilization. Because of the need for complementary digital systems and their digital characteristics, this study uses robot installation density as a proxy variable for DT. In line with the existing literature, this study uses the shift-share instrumental variable method to calculate the density of robot installations at the city level [61,62,63].
D T i t = R o b o t i t / L a b o r i t = [ j = 1 J ( W j i , t = 2006 × R o b o t j t ) ] / L a b o r j i , t = 2006
In Equation (1), L a b o r i t represents the total number of employees in all industries in city i in year t and W j i , t = 2006 represents the proportion of employees in industry j in city i in the total number of employees in this industry in the country in 2006. This weight is used as the base share to extend to other years. According to the Ministry of Industry and Information Technology statistics, the application of industrial robots has covered 60 industry categories and 168 industry categories in China’s national economy. It has become the world’s largest industrial robot application country for nine consecutive years. Therefore, taking the employment share in 2006 as the benchmark share to extend to other years has a specific externality for the development scale of China’s digital economy. R o b o t j t represents the number of installations in industry j in year t. J represents the number of industries that need to be added up. R o b o t i t represents the number of robot installations in city i in year t. In order to portray the overall application of robots in China as well as possible, on the basis of the 14 industrial categories provided by International Federation of Robotics (IRF), this study also calculated the installation density of robots in service industries such as education and urban public services according to the availability of data. The unit of the installation density of industrial robots is a thousand people/set. Figure 5 reports the spatial and temporal evolution of DT development in 269 cities in China from 2006 to 2021. It can be clearly seen that the highest level of DT development in Chinese cities in 2006 was in the range of 3.025 to 6.184. This standard range falls within the median range for 2021. The highest range of DT development in 2021 is 15.778 to 26.477. It can be asserted that the pace of digital technology development in China is remarkably rapid, with leading cities experiencing a four to fivefold increase in their level of advancement within less than two decades.

4.1.3. Mediating Variables

Green technology innovation (GTI) follows the principle of “industrial ecology” and the law of economic development, extends the boundaries and attributes of traditional technological innovation, and is a new form of technological innovation from the perspective of ecological civilization that can achieve the dual goals of “economic growth and environmental protection” [64]. Green technology innovation generally contributes to new technologies, new processes, new products, or organizational management processes that reduce the absolute amount of pollutant emissions and energy use and improve the efficiency of green development [65]. This study identifies and screens the number of green invention patent applications of listed enterprises each year as a measure of green technology innovation according to the “Green List of International Patent Classification” and matches them to cities according to information such as the registration locations and postcodes disclosed by enterprises. The unit of GTI is item.
The study uses single-factor energy efficiency as a measure of energy efficiency (EE), which is the intensity of energy consumption per unit of gross domestic product. The unit of EE is the standard ton of coal/CHY 10,000.
Market segmentation (MS). Market integration and market segmentation are related. The measurement methods of market segmentation are mainly divided into price, production, trade law, business cycle, and questionnaire survey methods [66]. The relative price variance reflects the characteristics of relative price fluctuations in different stages, and the market difference degree reflected by commodity information comprehensively reflects the segmentation degree of factors and commodity markets. If goods can flow freely and without any cost, the price of the same type of goods in different regions will converge, that is, the “Law of One Price” will be satisfied, and the relative price of the same kind of goods in two places will equal 1. When there are barriers to the flow of goods, as long as the factors can flow freely, the price of goods will eventually converge and eventually form a pattern of market integration. When the factors of production or commodities cannot flow freely in the market, prices are difficult to converge, resulting in market segmentation. According to the “iceberg cost” theory, due to transportation costs and transaction costs, a part of the commodity will be fused in the transaction process like the transportation glacier, that is, the product’s value will suffer a specific loss. Therefore, even if the two markets are fully integrated and there are no arbitrage barriers, the prices of the two places will still not be equal and the relative prices will fluctuate within a specific range. The relative price method based on the “law of one price” and the “glacier cost” theory is applied to panel data and is now widely used to measure market segmentation [50,67,68]. Generally speaking, the market in economics consists of two parts: the commodity market and factor market. Because China’s factor market is restricted by many factors, such as the flow of labor factors being restricted by the household registration system, social security system, and local government policies, the flow of labor is more complex than that of commodities. Therefore, this study only uses the information reflected in commodity prices to analyze the commodity markets according to the existing literature [50,67,68]. This study calculates the relative price variance of various types of commodities in different regions year by year and then merges it to obtain the market segmentation degree of each region in any year.
First, the study uses a price index to calculate the relative price differences of retail goods between neighboring cities:
| Δ Q x y , t k | = | ln ( P x , t k / P b , t k ) ln ( P a , t 1 k / P y , t 1 k ) |
In Equation (2), x and y ( x y ) represent the two cities where prices are compared, k is different types of retail goods, P is the price of k goods, and Δ Q x y , t k is the relative price of k goods in the year t between the two cities. Since the price index available in the statistical grade is the sequential price, this equation uses the relative price of the value of the price and then the first-order difference to solve the relative price to construct the index reflecting the market segmentation degree. Using the absolute value of relative price can avoid affecting the variance value of relative price due to the different position order between regions. In order to more accurately measure the degree of segmentation in a particular market, the study also needs to address the incomparability problem caused by commodity heterogeneity in relative prices. The de-mean approach eliminates the systematic bias caused by fixed effects directly associated with this particular commodity category. Suppose | Δ Q x y , t k | = ω k + φ x y , t k , where ω k is the price change of the class k commodity due to its own attributes and φ x y , t k is the price change caused by the special market system (market segmentation) of the two cities. Using the method of de-mean, we can obtain:
q x y , t k = | Δ Q x y , t k | | Δ Q t k ¯ | = ( ω k ω k ¯ ) + ( φ x y , t k φ x y , t k ¯ )
In Equation (3), Δ Q t k ¯ represents the mean of the relative prices Δ Q x y , t k of a combination of all the cities compared in year t. The relative price fluctuation calculated by eliminating the price fluctuation generated by its own factors is shown in Equation (4).
q x y , t k = φ x y , t k φ x y , t k ¯ = | Δ Q x y , t k | | Δ Q t k ¯ |
Then, the variance of relative prices of all commodities between neighboring cities is calculated to reflect the degree of product market segmentation between the two cities, which can be obtained:
V a r ( q x y , t k ) = V a r ( | Δ Q x y , t k | | Δ Q t k ¯ | )
In Equation (5), V a r ( q x y , t k ) is the variance of the relative price. According to the glacier model, arbitrage intervals are generated due to transaction costs or city-specific market systems. The larger the arbitrage range, the greater the degree of market segmentation. In order to sort out the panel data of the market segmentation degree of each city at each time, this study conducted an intra-group weighted average for all the combinations containing city x to obtain the market segmentation index. For the price P in Equation (2), this study is based on the availability of city-level data and existing studies [69,70] and is represented by the price index of eight commodities, namely food, beverages, tobacco and alcohol products, clothing, household appliances, education, culture and entertainment, daily necessities and services, transportation and communication supplies, and medical care [71,72]. The market segmentation degree of all commodities at the city level is shown in Equation (6):
M S x y , t = k = 1 8 V a r ( q x y , t k )

4.1.4. Control Variables

In order to minimize the bias caused by the omission of important variables, seven covariables at the economic and natural levels are selected to control the differences in urban characteristics. Population per square kilometer is used to measure population density. The per capita domestic production is always used to measure the level of economic development (km2/10,000 people). The per capita loan balance is used to measure the financial development level (person/CHY). The value added of the secondary industry as a share of GDP is used to measure the degree of industrialization (%). FDI is the foreign direct investment actually utilized by cities (USD). Macroeconomic control refers to the proportion of local government fiscal expenditure to GDP (%). The air ventilation coefficient (AVC) is the wind speed of each city’s atmosphere (the wind speed at 10 m is multiplied by the boundary layer height data) (m3/h/year). Detailed calculations of the AVC can be found in a published article [73].

4.2. Identification Strategy

In order to test whether DT can reduce AP, combined with research hypothesis 1, this paper establishes the following panel econometrics model:
A P i t = a 0 + a 1 D T i t + a 2 C V i t + λ i + ν t + ε i t
In Equation (7), the subscripts t and i and represent the time and individual, respectively. λ i , ν t , and ε i t represent the individual effect, time effect, and random disturbance terms, respectively. a 0 is the constant term, a is the parameter to be fitted, and CV is a series of control variables. It should be noted that the focus of the equation is to check whether the regression coefficient of the digital technique is as expected, that is, whether a 1 is significantly negative. If it satisfies this condition, it indicates that hypothesis 1 of this paper is valid. In order to verify the channel mechanism of DT to reduce AP, combined with research hypothesis 2 and 3, this study constructs the second stage equation of the intermediate-effect equation set according to the research ideas of Giuli and Laux [74]:
E E i t = b 0 + b 1 D T i t + b 2 C V i t + λ i + ν t + ε i t
G T I i t = c 0 + c 1 D T i t + c 2 C V i t + λ i + ν t + ε i t
M S i t = d 0 + d 1 D T i t + d 2 C V i t + λ i + υ t + ε i t
In Equations (8–10), EE, GTI, and MS are mediating variables. b 2 , c 2 , and d 2 represent the regression coefficients of the control variables in the different equations. b 0 , c 0 , and d 0 represent constant terms. b 1 , c 1 , and d 1 represent the regression coefficients for DT. The meanings of the remaining symbols are consistent with Equation (7). In the two-stage system of mediating effects, this study needs to test whether the regression coefficients of the mediating variables by DT meet the expectations (sign direction and significance).

4.3. Data Sources

Following the principles of comparability, systemic, and availability, this paper uses the balanced panel data from 269 cities (excluding county-level cities) in China from 2006 to 2021 as an investigation sample and robot installation data from the International Federation of Robotics. The economic and social data involved in the control variables are mainly from the China Urban Statistical Yearbook, China Urban Construction Statistical Yearbook, China Labor Statistical Yearbook, and the Express Professional Superior data platform. Data on green patents comes from the State Intellectual Property Office. Due to the late establishment of air monitoring stations in China, the data obtained could not meet the requirements of long-time series data for this study. Concerning the existing literature [75,76,77], the study used Atmospheric Composition Analysis Group at Washington University, St. Louis. The average annual PM2.5 concentration data of high-resolution (0.01° × 0.01°) satellite remote sensing in China provided by the United States was used as an indicator of AP. Its collection and calculation process can be referred to in the published articles [78,79]. For the missing values of some indicators, this paper used the moving mean method and the industry growth rate published by the data source and the previous year’s data for calculations. In order to mitigate the heteroscedasticity and reduce the bias caused by significant differences of orders of magnitude, the study also performed a logarithmic transformation of some variables. Descriptive statistical analysis of the variables is shown in Table 1.

5. Result

5.1. The Result of Baseline Regression

The regression models commonly used for panel data mainly include fixed effect (FE), random effect (RE), and pooled ordinary least square (POLS). The results of the F-test and Hausmann test both reject the null hypothesis at a 1% level and indicate that the fixed effect model is the most suitable for the sample data in this paper. In order to reveal the impact of DT on AP from the perspective of historical experience, the two-way fixed effect model (TWFE) was used to regress the empirical model (7) and the results in Table 2 were obtained.
As shown in Table 2, the TWFE results show that the regression coefficient of DT on AP is −0.0126 and significant at the 1% level. Consistent with the conclusions of the existing literature [80,81], the results of this study confirm that DT can significantly reduce the concentration of delicate particulate matter in the air, that is, DT can reduce haze pollution and help achieve the goal of protecting the blue sky. Research hypothesis 1 is tested. From the results of the POLS and FE, the regression coefficient of DT on AP is still significantly negative, indicating that the TWFE results have a certain degree of robustness. DT, as a new scientific and technological means and innovative way of thinking, provides an opportunity for urban air governance. As mentioned in the study’s inference section of Hypothesis 1, DT and digital transformation can affect enterprises’ production modes, environmental regulation, and pollutant treatment capacity, thereby reducing pollutant emissions. At the production end of the enterprise, the enterprise uses modern equipment, the Internet of things, and data elements to effectively integrate production information resources to plan and make decisions on materials, processes, and products, achieve high efficiency and cleanliness of the whole production process, and thus reduce pollutant emissions. At the regulatory end of the government and the public, under the realistic background of diversified pollution sources and complicated pollutants, the disadvantages of the traditional regulatory model, such as the backward supervision method, untimely data updates, and low regulatory efficiency, are challenging for meeting the needs of the strict environmental constraints. Advances in DT such as remote sensing, cloud computing, and sensors have strongly supported improving and optimizing the government’s environmental supervision methods in terms of technology. From the perspective of the means of social supervision, the current public perception of environmental quality is mainly through reports of relevant departments and news networks, which cannot correctly assume the responsibility of environmental supervision through public opinion, supervision, suggestions, and other means. The rapid development of DT, digital platforms, and network carriers with technology as the core have unimpeded the communication mechanism between the government and the public, helped to fully stimulate the public’s awareness of supervision and initiative, and promoted the multi-party collaborative governance of “government-enterprise-residents” in the field of environmental protection [82].

5.2. Robustness Test

5.2.1. Method 1

The proxy variable of DT is replaced. In the era of the digital economy, data has become the most active factor of technological innovation in the new round of the global industrial revolution, after labor, capital, and land, and a vital driving force for improving the quality of China’s economic growth [83]. The national big data comprehensive pilot zone (NBDCPZ) has set seven tasks and objectives for big data in resource sharing, innovative application, resource center integration, industrial agglomeration, information circulation, international cooperation, and institutional innovation to achieve cross-domain development of the digital economy. As can be seen from the development goals of the NBDCPZ, the establishment of the NBDCPZ is not only to develop the big data industry itself but to explore it further and use data elements to strengthen the integration of the digital economy and the real economy. It is foreseeable that the reform pilot policy is the concentrated embodiment of industrial digitalization and digital industrialization, accompanied by technological updates, infrastructure improvement, and data application, which will help promote the innovation and change of DT [84]. Therefore, this study takes the NBDCPZ implemented in batches in 2015 and 2016 as the proxy variable for DT and uses the time-varying difference-in-differences (DID) method to regress. The list of provinces (cities) in the NBDCPZ is shown in Table 3. It can be seen from column (1) of Table 4 that the results of policy evaluation using the DID model show that the regression coefficient of DT on AP is −0.0203 and this is significant at the 5% level. The results show that the baseline regression results are still robust after replacing the proxy variables of DT.

5.2.2. Method 2

Add policy missing variables. Policy pilots can stably make institutional changes and innovation within the original institutional framework to achieve the effect of “seeking new changes in stability”. In the progressive economic and social transformation process, the “policy pilot” represented by various pilot projects and pilot zones has played a crucial role. In China, the policy pilot will be from the local governance and the central initiative to explore the accumulated experience injected into the national governance, giving rise to the national policy. This is an effective way to promote policy and system innovation and avoid reform shocks and policy implementation obstacles, providing a good opportunity for economic development. Therefore, three policies related to DT or environmental protection were selected as control variables to be added to the model to slow endogeneity. The three policies are: First, the green finance pilot policy that was implemented in batches in Zhejiang, Jiangxi, Guizhou, and Xinjiang in 2017. Second, the Notice on the Action Plan for the Prevention and Control of Air Pollution released in 2013 mentioned that targets were set for reducing PM2.5 concentrations in the Beijing–Tianjin–Hebei region, the Yangtze River Delta, and the Pearl River Delta. The third is the energy use policy implemented in the Sichuan, Henan, Fujian, and Zhejiang provinces in 2016. As can be seen from column (2) of Table 4, after adding the three policy omitted variables, the regression coefficient of DT on AP is −0.0116 and significant at the 1% level, indicating that the results of the baseline regression are robust.

5.2.3. Method 3

Replace the econometric model. The interactive fixed effects model developed by Bai [85] based on a linear panel data model can help researchers control for the combined effects of individual heterogeneity and time changes and eliminate the influence of fixed but unobserved confounding factors on causal estimation results. This method is very suitable for endogeneity problems in panel data and can also capture time-varying characteristics and improve the goodness of fit. The improved model not only fully considers the impacts of various uncertain factors in the real economy and the heterogeneity of individual responses to these impacts but also expands the general form of the bidirectional fixed effects model. Based on the principles of principal component analysis and the recognition strategies provided by the existing literature [86,87,88], this study revised Equation (7) to the following form:
A P i t = e 0 + e 1 D T i t + e 2 C V i t + λ i + ν t + λ i F t + ε i t
In Equation (11), e 1 is the regression coefficient of dt, e 2 is the regression coefficient of the control variable, e 0 is the random disturbance term, λ i is the factor load, F t is the common factor, and λ i F t is the interaction fixed effect. From the results of column (3) in Table 4, it can be found that the regression coefficient of DT on AP is −0.0088, which is significant at the 1% level. This result indicates that, after eliminating the negative impact of multidimensional time shocks and individual heterogeneity on result estimation, the result of the benchmark regression is still valid.

5.3. Causal Recognitional

Although this study used as many covariates as possible to control for the heterogeneity of urban characteristics, the reverse causal relationship between DT and AP still threatens the robustness and accuracy of the benchmark regression results. This study follows the causal inference paradigm of economics and uses the instrumental variable method to eliminate the bias caused by endogeneity issues in the estimation results. Specifically, the two-stage least squares (2SLS) method was used to examine the causal relationship between digital technology and AP.
Based on the principles of correlation and exclusivity, the article selects each city’s terrain undulation (elevation standard deviation), which has evolved due to natural forces such as crustal movement and wind erosion, as the instrumental variable. Intuitively, terrain undulation can affect the cost and difficulty of building broadband infrastructure. For example, the greater the terrain undulation, the higher the technical standards required for laying internet and broadband hardware devices. In addition, mountainous terrain can also affect the transmission quality and speed of mobile network signals, thereby limiting the operational efficiency and application scenarios of DT and digital capital [89]. Air pollutants originate from the various consumption and combustion actions of human economic activities. As a natural variable, terrain undulation does not generate air pollutants or directly affect environmental pollution. Instead, it can only indirectly affect the environment by adjusting natural characteristics such as wind speed, circulation, and the local climate after generating pollutants. Therefore, this variable is independent of the AP generated by the economic system and has a correlation with DT, meeting the prerequisite conditions required for instrumental variables. According to the study by You et al. [90], the terrain undulation of each city is based on the elevation of 500 m above sea level of the middle and low mountains in the Chinese landform type. The geographic units with a maximum elevation difference of less than or equal to 30 m within 25 km2 are considered flat land. Terrain undulation is cross-sectional data that does not change over time in a short period and is difficult to calculate accurately using fixed effect models. Therefore, this study introduces an economic variable containing time trends (the frequency of digital-economy-related vocabulary in provincial government work reports) based on the two-dimensional method adopted by existing research and generates interaction terms with terrain undulation, endowing it with dynamic characteristics over time to jointly construct instrumental variables [91,92]. To some extent, the frequency of words in the work report reflects the provincial government’s attention and willingness to allocate resources for the digital economy in the coming year, which is related to DT and not directly related to environmental pollution. The indirect impact of the work attention of the provincial government and urban AP still needs to be manifested through the administrative management of lower-tier city governments and there are multiple intermediaries in the transmission path, thus possessing exogenous characteristics.
The first-stage results in column (4) in Table 4 show that the regression coefficient of the instrumental variables on DT is −0.0099 and that this is significant at the 1% level, indicating that the correlation principle of instrumental variables is met. The LM statistic of the unrecognizable test is 36.501 and rejects the original hypothesis at the 1% level, indicating that the instrumental variable is identifiable. The Cragg–Donald Wald F-statistic for the weak instrumental variable test is 36.625, which is significantly more significant than the 10% critical value of 16.38. Therefore, we can reject the original hypothesis of the weak instrumental variable. Because the article only has one instrumental variable, it happens to be in another situation, so there is no need for over-identification testing. Based on the results of the above three tests, the instrumental variables constructed in this study meet the principles of validity and correlation. The second-stage results in column (5) in Table 4 show that the regression coefficient of DT on AP is −0.1372 and that this is significant at the 1% level. This result indicates that the conclusion that DT can reduce the concentration of air pollutants after eliminating the endogenous problem is still valid. In other words, the logic of causal inference confirms that DT can achieve blue-sky goals.

6. Mechanism Test and Heterogeneity Analysis

6.1. The Results of Mechanism Test

To test the channel mechanism of DT in reducing AP, combined with the research hypothesis mentioned earlier, this study used a bidirectional fixed effects model to fit Equations (8) and (10), whereas Equation (9) used the panel Poisson regression model. The reason for using an additional method for Equation (9) is that the number of green patent applications is a non-negative integer. It has a counting type that does not meet the normal distribution, so using a general linear regression model will cause the result to produce bias [93].
According to the results in Table 5, the regression coefficients of DT on energy efficiency and green technology innovation are −0.0119 and 0.0196, respectively, and significant at the 1% level. The results indicate that DT can reduce the emissions of atmospheric pollutants by improving energy efficiency (reducing energy consumption per unit of GDP) and promoting green innovation. H2 and H3 were tested. As mentioned earlier, the role of DT in reducing research and development costs, facilitating knowledge flow, and simulating research and development scenarios contributes to green technology innovation in enterprises. Meanwhile, the intelligent grid, real-time scheduling, and virtual power plants derived from DT can help optimize the allocation of energy consumption. Enterprises and public institutions use data element circulation to connect all links of the entire energy industry chain, achieve collaboration and sharing to the maximum extent, and improve the efficiency of energy production, transportation, consumption, and other links, which will better promote the achievement of the goals of the Clean Atmosphere Plan. From Table 5, it can also be observed that the regression coefficient of DT on market segmentation is −0.0279 and that this is significant at the 5% level, indicating that the mediating effect of market segmentation is valid. This result indicates that research hypothesis 4 is valid. With the continuous development of DT, the robust and cohesive force of “digital bridges” is constantly blurring the geographical and industrial boundaries of various regions, promoting the flow of crucial services and information across regions, and helping to promote the optimization of regional industrial structure and a more balanced division of labor [94]. In the era of the digital economy, the advantages of DT in information communication and facilitating trade allow enterprises to seek partners in a larger market. The supply chain, organizational management models, and production processes of enterprises are fully optimized with the support of network platforms and digital infrastructure and the improvement of total factor productivity helps to reduce the pollution caused by factor consumption. The timely collection and processing of sea data through DT such as big data, cloud computing, blockchain, and e-commerce platforms will reduce the circulation costs of production factors (such as labor, capital, and knowledge) between regions. At the same time, it can also promote the cross-regional flow of information; help improve the efficiency of information exchange; enable manufacturers and consumers, goods and services, and markets to match on digital platforms efficiently; and break market segmentation under administrative trade barriers. The final result is a more rapid cycle of production and consumption of goods. In addition to the explicit digital infrastructure, the data elements derived from DT and platforms also help enterprises break through the limitations of market space. The data element market integrates the economic data reflecting enterprises, industries, departments, and regions. Enterprises and administrative departments use data mining and algorithms to induce and analyze data, which helps to improve the allocation efficiency of factors among departments, strengthen the horizontal connection between enterprises, promote the vertical extension of the industrial chain, and optimize the market structure and industrial division.

6.2. Heterogeneity

6.2.1. Heterogeneity of Resource Endowments

Resource endowment will affect the city’s industrial development path and modernization process, and DT will affect the emission of air pollutants by affecting the industrial structure. According to the list published in the National Sustainable Development Plan for Resource-Based Cities (2013–2020), the study divided samples into resource-based and non-resource-based categories for regression. As can be seen from Table 6, the regression coefficients of DT on AP in resource-based cities and non-resource-based cities are −0.0821 and −0.0085, respectively, and both are significant at the 1% level. The results show that the impact of DT on AP does not show an opposite effect due to different resource endowments of cities but shows a consistent positive effect. The results of the inter-group coefficient difference based on the seemingly unrelated regressions (SUR) show that the difference between the two regression coefficients is −0.0732 and that this is significant at the 5% level, indicating that the positive role of DT in resource-based cities is significantly more significant than that in non-resource-based cities. In the traditional economic development model, due to the strong resource directivity and dependence, resource-based cities often form a “rigid” industrial path dependence and “function locking”, resulting in a resource abundance that does not play a “resource Gospel” role for high-quality economic development but is a “resource curse” phenomenon. However, the application of intelligent technologies such as big data and cloud computing is changing the production and operation mode of traditional industries, greatly improving the operation efficiency and energy use efficiency in energy, power, urban management, transportation, industrial production, and other fields. This promotes the transformation and upgrading of traditional industries. On the one hand, using DT mining in coal mining, transportation, stripping, and other production management process data, mining potential rules and patterns, and improving production efficiency energy utilization can help to reduce AP. On the other hand, through the traditional processes of the coal industry, DT can improve technology, such as using intelligent equipment to achieve intelligent unmanned mining, shortening the process and reducing the labor costs to reduce AP emissions. With the support of DT, the industrial structure of resource-based cities has been optimized and upgraded, resource dependence has been gradually reduced, diversified industrial models are emerging, and AP has been significantly reduced [95]. Therefore, thoroughly enjoying the ecological dividend brought by digital welfare, the marginal impact of technology on pollution is significantly higher than that of non-resource-based cities.

6.2.2. Heterogeneity of Supply Chain Modernization Degree

DT not only promotes the transformation of information and intelligent processes within enterprises but also promotes the transformation of the organizational structure to be agile and borderless, reshaping traditional business models. Digital transformation realizes information sharing and business integration between enterprises and supply chain partners. It helps enterprises build a market interconnection decision-making mechanism from the “supply side” to the “client-side”. In 2018, eight departments, including the Ministry of Commerce, jointly issued the Notice on Announcing the List of National Supply Chain Innovation and Application Pilot Cities and Enterprises, identifying 55 pilot cities, including Beijing, Shanghai, and Xiamen. The policy emphasized the innovation transformation and cost reduction and efficiency increase in pilot enterprises and cities, the most important goal of which is to explore the establishment of big data support, network sharing, an intelligent collaboration system mechanism, and a market environment by establishing a digital supply chain platform with strong resource integration and timeliness matching ability to help enterprises form long-term competitive advantages. The creation of supply chain innovation and application demonstration is significant in improving supply chain resilience, enhancing urban regional competitiveness, and promoting the digital transformation of supply chain enterprises. Predictably, an efficient supply system and intelligent logistics system will help create a green supply chain and achieve the goal of reducing pollution. The study divided a sample of cities into a first pilot list to examine whether differences in supply intelligence and modern industrial clusters affected the impact of DT in reducing AP.
As can be seen from Table 6, the regression coefficients of DT on AP in pilot cities and non-pilot cities are −0.0221 and −0.0068, respectively, and both are significant at the 1% level. The results show that the impact of DT on AP does not show an opposite effect due to the difference in the degree of intelligence and convenience in the commodity supply chains of cities but shows a consistent positive effect. The results of the inter-group coefficient difference based on SUR show that the difference between the two regression coefficients is −0.0142, which is significant at the 10% level, indicating that the positive role of DT in pilot cities is significantly more significant than that in non-pilot cities. Once again, it is confirmed that the results of DT reducing urban pollution are robust; however, its coefficient is significantly different. Through the integration of cross-border resources, high-quality supply chain management can eliminate the information asymmetry between the front end of design, the middle end of production, and the end of after-sales, reducing transaction costs and improving the cluster network’s coordination ability. Therefore, the pilot city’s infrastructure, industrial structure, supply chain efficiency, and technological innovation ability have obvious advantages, so the positive role of DT in reducing AP is more obvious.

6.2.3. Analysis of the COVID-19 Outbreak

In the period following the emergence of coronavirus disease 2019 (COVID-19) infections in Wuhan, China in 2019, the Chinese government quickly took a series of necessary measures to prevent the further deterioration of the public health incident. These emergency measures restricted economic and social activities, including the movement of people, factory production, and business operations. Some research evidence suggests that China’s AP and carbon emissions showed a significant downward trend during the COVID-19 pandemic because of reduced traffic and restrictions on goods production [96,97]. In order to analyze the impact of DT development on AP in China during the COVID-19 pandemic, the study conducted heterogeneity tests based on 2020 (because the study used annual data, urban lockout policies adopted at the end of 2019 had a smaller impact on AP in 2019) as a time break point.
It can be found from Table 7 that in the two samples, the regression coefficients of DT for AP are −0.0134 and −0.0088 and that these are significant at 1% and 5% levels, respectively. The results mean that DT significantly reduced AP in both periods but had a smaller positive effect during the COVID-19 pandemic. The reason for this result may be related to the city blockade and the restriction of commercial production and operation activities. In other words, under the strict urban blockade policy, transportation and residents’ travel are restricted, and the reduction of vehicles on the road and "working from home" and other factors significantly reduce AP emissions, which affects the ecological welfare brought by DT.

7. Conclusions and Policy Implications

7.1. Conclusions

Breathing clean air is important for the well-being of the population, and the prevention and control of AP is also important to meet the people’s aspirations for a clean environment and sustainable cities. In the era of big data, the application of artificial intelligence technology is an essential means to solve the problem of environmental pollution. Although there is still a long way to go in China’s AP control, the country’s use of DT to reduce AP in the past decade is worthy of recognition. The success of China’s AP control fully proves that if other countries implement strong pollution control policies and give full play to the role of modern science and technology in pollution control, they may also achieve good results in the future. Based on panel data from 269 cities in China from 2006 to 2021, the study used two-way fixed effect models, dynamic panel threshold models, and Poisson models to empirically examine the impact of DT on AP and the mechanisms of this. The results of baseline regression show that the DT measured by the robot has a positive effect on reducing the concentration of PM2.5 in the atmosphere. The result is still valid after the robustness test of the three methods. Importantly, this study constructs instrumental variables for the interaction terms of topographic relief and provincial government digital-economy-related word frequency and verifies the reliability of the conclusion that DT reduces AP from the perspective of causal inference by using the two-stage least square method. With the rapid development of network infrastructure and digital platforms, DT has also derived other intermediary paths in reducing AP. Our results confirm that DT can reduce AP by promoting green technology innovation, easing market segmentation, and improving energy efficiency. Finally, the study’s results also suggest that although DT can reduce AP in cities, the benefits of technology will vary between cities. Specifically, DT play a greater positive role in reducing AP in resource-based cities and cities with more efficient supply chains. Thanks to the urban lockdown policy, AP emissions in Chinese cities decreased significantly during the COVID-19 pandemic, making the positive effect of digital technology on AP less intense than during non-COVID-19 periods.
In order to give full play to the role of DT in air governance, the authors of this study believe that local governments should speed up the implementation of the “cloud with data intelligence” action, promote the construction of a digital economy, digital industry, digital society, digital government, and digital people’s livelihood, and drive the transformation of production modes, lifestyles, and ecological governance modes with digital intelligence transformation. Local governments should promote the deep integration of DT and manufacturing, strengthen the layout and application of block-chain, Internet of Things, artificial intelligence, and other technologies, encourage innovation entities to speed up the process of autonomy in key chips, basic components, basic materials, essential software, and other industrial basic fields, and improve the independent and controllable ability of industrial chain and supply chain. In terms of improving energy efficiency, using limited “watt” electricity to promote the development of unlimited “bit” data, enterprises must comprehensively consider the location of clean energy and the power grid layout, build data centers nearby, increase the supply of renewable energy compatible with digital infrastructure such as data centers and 5G base stations, and reduce AP. In terms of the industrial chain, relevant departments need to vigorously support “chain master” enterprises and key platforms to build digital platforms in combination with the common needs of the industrial chain, supply chain, and value chain, with the circulation and application of data elements as the core, to promote upstream and downstream capacity sharing and supply chain interoperability. Through the transformation of digital intelligence, we should complement the shortcomings of the industrial chain, highlight the substantial chain extension, promote the high-end, intelligent, and green development of the industrial chain, build a strategic and overall industrial chain, and improve the integrity and comprehensive competitiveness of the industrial chain. At the same time, government departments should encourage small- and medium-sized enterprises to accelerate the development of digital management, platform design, personalized customization, network collaboration, and service extension and enhance the modernization level of the manufacturing industry chain. City managers need to continuously optimize the top-level system design, build a legal system of the national unified standard data factor market from the perspective of regional collaboration, and constantly optimize its spatial layout. It is indispensable to build a factor market of data property rights, data transaction supervision, and data open sharing to eliminate inter-departmental, inter-regional, inter-platform, and inter-enterprise circulation barriers and to improve the circulation efficiency of data in data element markets in various regions. It would also be beneficial to establish a complete regulatory system for the data element market, hold the data security defense line, and use data security governance measures such as risk assessment, early warning, and risk processing. Governments will encourage key innovation in DT, use new technologies to solve data element security problems, and promote the data element market construction. The regulatory authorities must adhere to the principle of inclusive prudential supervision, innovate digital supervision methods, promote the gradual shift from the post-antitrust supervision of digital platforms to pre-event and in-process supervision, improve the market rules and order of platforms, restrict the behavior of platform enterprises, and prevent the disorderly expansion of a new digital capital monopoly and leading enterprises. Enterprises should actively apply the new generation of information technology and DT through the use of advanced communication technology, artificial intelligence, and the industrial Internet to transform the process flow of traditional industries, optimize energy scheduling, accurately implement cascade utilization, and release the potential of industry in terms of pollution reduction.

7.2. Research Limitations

The study used panel data from 269 cities in China from 2006 to 2021 to examine the impact of DT on AP using econometric models. Therefore, the conclusions obtained in this study are only applicable to the economic reality in China during the sample period. Different countries should prudently refer to China’s experience and our policy advice according to their national conditions. The digital economy has grown rapidly in the wake of the COVID-19 pandemic and related industrial structure production models and job types have been affected by sudden public events. An examination of the impact of DT on AP based on nearly three years of micro-data (especially the data obtained from field research) is urgent. When conducting empirical analysis, it is advantageous to combine case studies of enterprises that are undergoing digital transformation. Although the two-way fixed effect model and instrumental variable method can represent the conclusion of causal inference to a certain extent, they do not prove causal inference in a strict sense. Due to the lack of good policy pilots in industrial robots and digital parks, the topic cannot be thoroughly evaluated for policy and the calculation of ecological welfare. In future research, researchers can look for policies and systems such as big data pilot zones, intelligent industrial parks, and digital economy demonstration zones to perform the policy evaluation of quasi-natural experiments. It is beneficial to use the difference-in-differences (DID) method, regression discontinuity (RD), and synthetic control method (SCM) to conduct regression. In addition, the diffusion effect caused by introducing and installing industrial robots will lead to the flow of labor between regions, resulting in a potential spatial spillover effect. Finally, because carbon emissions and AP have the same origin characteristics, in the context of actively responding to climate change, it is very useful to explore DT research for the collaborative governance of pollution reduction and carbon reduction.

Author Contributions

Conceptualization, Y.S.; methodology, Y.S.; software, Y.S.; validation, Y.S.; formal analysis, Y.S.; investigation, Y.S.; resources, X.Z.; data curation, Y.S.; writing—original draft preparation, Y.S.; writing—review and editing, Y.S.; visualization, Y.S.; supervision, X.Z.; project administration, X.Z.; funding acquisition, X.Z. All authors have read and agreed to the published version of the manuscript.

Funding

This work was financially supported by the Natural Science Foundation of Fujian Province (grant number: 2022J01320).

Data Availability Statement

The data used in this study are publicly available and have been correctly cited. Data sets used or analyzed in the current study are available from the corresponding authors upon reasonable request.

Conflicts of Interest

The authors declare no conflicts of interest.

Notes

1
2
Ministry of Ecology and Environment of the People’s Republic of China: https://www.mee.gov.cn/hjzl/sthjzk/zghjzkgb/ (accessed on 21 October 2023).

References

  1. Li, C.; van Donkelaar, A.; Hammer, M.S.; McDuffie, E.E.; Burnett, R.T.; Spadaro, J.V.; Chatterjee, D.; Cohen, A.J.; Apte, J.S.; Southerland, V.A.; et al. Reversal of trends in global fine particulate matter air pollution. Nat. Commun. 2023, 14, 5349. [Google Scholar] [CrossRef] [PubMed]
  2. Chen, L.; Lu, Y.; Meng, Y.; Zhao, W. Research on the nexus between the digital economy and carbon emissions -Evidence at China’s province level. J. Clean. Prod. 2023, 413, 137484. [Google Scholar] [CrossRef]
  3. Bianchini, S.; Damioli, G.; Ghisetti, C. The environmental effects of the “twin” green and digital transition in European regions. Environ. Resour. Econ. 2023, 84, 877–918. [Google Scholar] [CrossRef]
  4. Hynes, M. Virtual consumption: A review of digitalization’s “green” credentials. Front. Sustain. 2023, 3, 969329. [Google Scholar] [CrossRef]
  5. Lefèvre, T.; Déméné, C.; Arpin, M.; Elzein, H.; Genois-Lefrançois, P.; Morin, J.; Cheriet, M. Trends characterizing technological innovations that increase environmental pressure: A typology to support action for sustainable consumption. Front. Sustain. 2023, 3, 901383. [Google Scholar] [CrossRef]
  6. Lange, S.; Frick, V.; Gossen, M.; Pohl, J.; Rohde, F.; Santarius, T. The induction effect: Why the rebound effect is only half the story of technology’s failure to achieve sustainability. Front. Sustain. 2023, 4, 1178089. [Google Scholar] [CrossRef]
  7. Strubell, E.; Ganesh, A.; McCallum, A. Energy and Policy Considerations for Deep Learning in NLP. arXiv 2019. [Google Scholar] [CrossRef]
  8. Ishida, H. The effect of ICT development on economic growth and energy consumption in Japan. Telemat. Inform. 2015, 32, 79–88. [Google Scholar] [CrossRef]
  9. Ansari, M.A. Re-visiting the Environmental Kuznets curve for ASEAN: A comparison between ecological footprint and carbon dioxide emissions. Renew. Sustain. Energy Rev. 2022, 168, 112867. [Google Scholar] [CrossRef]
  10. Wang, S.; Zhang, R.; Yang, Y.; Chen, J.; Yang, S. Has enterprise digital transformation facilitated the carbon performance in Industry 4.0 era? Evidence from Chinese industrial enterprises. Comput. Ind. Eng. 2023, 184, 109576. [Google Scholar] [CrossRef]
  11. Yi, Y.; Cheng, R.; Wang, H.; Yi, M.; Huang, Y. Industrial digitization and synergy between pollution and carbon emissions control: New empirical evidence from China. Environ. Sci. Pollut. Res. 2023, 30, 36127–36142. [Google Scholar] [CrossRef]
  12. Luo, H.; Li, W.; Cai, Z.; Luo, H. The environmental effects of digital economy: Evidence from province-level empirical data in China. Environ. Sci. Pollut. Res. 2023, 30, 63272–63288. [Google Scholar] [CrossRef]
  13. Wang, L.; Chen, Q.; Dong, Z.; Cheng, L. The role of industrial intelligence in peaking carbon emissions in China. Technol. Forecast. Soc. Change 2024, 199, 123005. [Google Scholar] [CrossRef]
  14. Tang, Y.; Zhang, X.; Lu, S.; Taghizadeh-Hesary, F. Digital finance and air pollution in China: Evolution characteristics, impact mechanism and regional differences. Resour. Policy 2023, 86, 104073. [Google Scholar] [CrossRef]
  15. Li, G.; Zhang, R.; Feng, S.; Wang, Y. Digital finance and sustainable development: Evidence from environmental inequality in China. Bus. Strategy Environ. 2022, 31, 3574–3594. [Google Scholar] [CrossRef]
  16. Ali, K.; Du, J.; Kirikkaleli, D.; Mentel, G.; Altuntaş, M. Testing the role of digital financial inclusion in energy transition and diversification towards COP26 targets and sustainable development goals. Gondwana Res. 2023, 121, 293–306. [Google Scholar] [CrossRef]
  17. Xu, S.; Yang, C.; Huang, Z.; Failler, P. Interaction between digital economy and environmental pollution: New evidence from a spatial perspective. Int. J. Environ. Res. Public Health 2022, 19, 5074. [Google Scholar] [CrossRef]
  18. Wan, Q.; Shi, D. Smarter and cleaner: The digital economy and environmental pollution. China World Econ. 2022, 30, 59–85. [Google Scholar] [CrossRef]
  19. Bai, L.; Guo, T.; Xu, W.; Liu, Y.; Kuang, M.; Jiang, L. Effects of digital economy on carbon emission intensity in Chinese cities: A life-cycle theory and the application of non-linear spatial panel smooth transition threshold model. Energy Policy 2023, 183, 113792. [Google Scholar] [CrossRef]
  20. Ren, S.; Hao, Y.; Wu, H. Digitalization and environment governance: Does internet development reduce environmental pollution? J. Environ. Plan. Manag. 2023, 66, 1533–1562. [Google Scholar] [CrossRef]
  21. Liu, J.; Chen, Y.; Liang, F.H. The effects of digital economy on breakthrough innovations: Evidence from Chinese listed companies. Technol. Forecast. Soc. Chang. 2023, 196, 122866. [Google Scholar] [CrossRef]
  22. Shen, Y.; Zhang, X. Intelligent manufacturing, green technological innovation and environmental pollution. J. Innov. Knowl. 2023, 8(3), 100384. [Google Scholar] [CrossRef]
  23. Liu, Y.; Xie, Y.; Zhong, K. Impact of digital economy on urban sustainable development: Evidence from Chinese cities. Sustain. Dev. 2023. [Google Scholar] [CrossRef]
  24. Li, G.; Zhou, X.; Bao, Z. A win–win opportunity: The industrial pollution reduction effect of digital economy development—A quasi-natural experiment based on the “broadband China” strategy. Sustainability 2022, 14, 5583. [Google Scholar] [CrossRef]
  25. Zhu, D.; Li, Y. Digital supply Chain reform and firm labor investment efficiency: Empirical evidence from supply chain innovation and application pilot. Commer. Res. 2023, 539, 49–57. [Google Scholar] [CrossRef]
  26. Guo, K.; Yuan, Y. Is the sky of smart city bluer? Evidence from satellite monitoring data. J. Environ. Manag. 2022, 317, 115483. [Google Scholar] [CrossRef] [PubMed]
  27. Feng, Y.; Hu, S. The effect of smart city policy on urban haze pollution in China: Empirical evidence from a quasi-natural experiment. Pol. J. Environ. Stud. 2022, 31, 2083–2092. [Google Scholar] [CrossRef]
  28. Wang, L.; Xie, Q.; Xue, F.; Li, Z. Does smart city construction reduce haze pollution? Int. J. Environ. Res. Public Health 2022, 19, 16421. [Google Scholar] [CrossRef] [PubMed]
  29. Geng, W.; Liu, X.; Liao, X. Mechanism analysis of the influence of intelligent manufacturing on carbon emission intensity: Evidence from cross country and industry. Environ. Dev. Sustain. 2023. [Google Scholar] [CrossRef]
  30. Chen, H.; Yan, X.; Zhu, B. The impact of robot use on pollution discharge: A theoretical mechanism and empirical research. China Econ. Stud. 2021, 328, 126–138. [Google Scholar] [CrossRef]
  31. Thanh, T.T.; Ha, L.T.; Dung, H.P.; Huong, T.T.L. Impacts of digitalization on energy security: Evidence from European countries. Environ. Dev. Sustain. 2023, 25, 11599–11644. [Google Scholar] [CrossRef]
  32. Hou, S.; Song, L.; He, J. Greening the digital revolution: Assessing the impact of digital transformation on green total factor productivity in Chinese enterprises. Environ. Sci. Pollut. Res. 2023, 30, 101585–101598. [Google Scholar] [CrossRef] [PubMed]
  33. Sheng, D.; Bu, W. The usage of robots and enterprises’ pollution emission in China. J. Quant. Technol. Econ. 2022, 39, 157–176. [Google Scholar] [CrossRef]
  34. Adebayo, T.S.; Ullah, S.; Kartal, M.T.; Ali, K.; Pata, U.K.; Ağa, M. Endorsing sustainable development in BRICS: The role of technological innovation, renewable energy consumption, and natural resources in limiting carbon emission. Sci. Total Environ. 2023, 859, 160181. [Google Scholar] [CrossRef] [PubMed]
  35. Sakariyahu, R.; Lawal, R.; Etudaiye-Muhtar, O.F.; Ajide, F.M. Reflections on COP27: How do technological innovations and economic freedom affect environmental quality in Africa? Technol. Forecast. Soc. Chang. 2023, 195, 122782. [Google Scholar] [CrossRef]
  36. Lu, Y.; Chen, L.; Meng, Y. How does science and technology innovation improve carbon productivity?—Evidence at China’s province level. Environ. Sci. Pollut. Res. 2023, 30, 101296–101316. [Google Scholar] [CrossRef] [PubMed]
  37. Schoenecker, T.; Swanson, L. Indicators of firm technological capability: Validity and performance implications. IEEE Trans. Eng. Manag. 2002, 49, 36–44. [Google Scholar] [CrossRef]
  38. Yin, W. Does digital transformation matter to green innovation: Based on TOE framework and configuration perspective. Environ. Sci. Pollut. Res. 2023, 30, 100046–100057. [Google Scholar] [CrossRef]
  39. Chen, S.; Tan, Z.; Mu, S.; Wang, J.; Chen, Y.; He, X. Synergy level of pollution and carbon reduction in the Yangtze River Economic Belt: Spatial-temporal evolution characteristics and driving factors. Sustain. Cities Soc. 2023, 98, 104859. [Google Scholar] [CrossRef]
  40. Schumpeter, J.A. The Theory of Economic Development: An Inquiry into Profits, Capital, Credit, Interest, and the Business Cycle; Harvard University Press: Cambridge, MA, USA, 1934. [Google Scholar]
  41. Wang, X.; Qin, C.; Liu, Y.; Tanasescu, C.; Bao, J. Emerging enablers of green low-carbon development: Do digital economy and open innovation matter? Energy Econ. 2023, 127, 107065. [Google Scholar] [CrossRef]
  42. Lyu, Y.; Wu, Y.; Wu, G.; Wang, W.; Zhang, J. Digitalization and energy: How could digital economy eliminate energy poverty in China? Environ. Impact Assess. Rev. 2023, 103, 107243. [Google Scholar] [CrossRef]
  43. Chen, S.; Wang, J. Digital economy development and haze pollution: Evidence from China. Environ. Sci. Pollut. Res. 2022, 29, 73210–73226. [Google Scholar] [CrossRef]
  44. Hao, Y.; Xu, L.; Gao, Y.; Wu, H. The inducing factors of environmental emergencies: Do environmental decentralization and regional corruption matter? J. Environ. Manag. 2022, 302, 114098. [Google Scholar] [CrossRef] [PubMed]
  45. Shao, S.; Zhang, K.; Dou, J. Effects of economic agglomeration on energy saving and emission reduction:Theory and empirical evidence from China. J. Manag. World 2019, 35, 36–60. [Google Scholar] [CrossRef]
  46. Gardiner, N.J.; Roberts, J.J.; Johnson, J.; Smith, D.J.; Bond, C.E.; Knipe, R.; Haszeldine, S.; Gordon, S.; O’donnell, M. Geosciences and the energy transition. Earth Sci. Syst. Soc. 2023, 3, 10072. [Google Scholar] [CrossRef]
  47. Ma, X.; Zhang, D. Digitalization of the economy for fossil fuels efficiency and carbon neutrality. Resour. Policy 2023, 86, 104133. [Google Scholar] [CrossRef]
  48. Wu, J.; Lin, K.; Sun, J. Improving urban energy efficiency: What role does the digital economy play? J. Clean. Prod. 2023, 418, 138104. [Google Scholar] [CrossRef]
  49. Yu, Y.; Hu, S.; Yang, F. The barrier to domestic economic cycle: Efficiency loss of regional market segmentation. China Ind. Econ. 2022, 417, 108–126. [Google Scholar] [CrossRef]
  50. Bian, Y.; Song, K.; Bai, J. Market segmentation, resource misallocation and environmental pollution. J. Clean. Prod. 2019, 228, 376–387. [Google Scholar] [CrossRef]
  51. Zhang, K.; Shao, S.; Fan, S. Market integration and environmental quality: Evidence from the Yangtze river delta region of China. J. Environ. Manag. 2020, 261, 110208. [Google Scholar] [CrossRef]
  52. Zhou, J.; Jiang, N.; Zhao, Z. On the impact and mechanism of market integration in Yangtze River Delta on industrial air pollution reduction and its mechanism. J. Nantong Univ. (Soc. Sci. Ed.) 2022, 38, 44–55. [Google Scholar] [CrossRef]
  53. Qin, Q.; Yu, Y.; Liu, Y.; Zhou, J.; Chen, X. Industrial agglomeration and energy efficiency: A new perspective from market integration. Energy Policy 2023, 183, 113793. [Google Scholar] [CrossRef]
  54. Zhang, Z.; Luo, X.; Hu, H.; Du, J.; Xu, B. Market integration and urban air quality: Evidence from the Yangtze river economic belt of China. Econ. Anal. Policy 2023, 80, 910–928. [Google Scholar] [CrossRef]
  55. Stevens, M.; Yang-Huang, J.; Nieboer, D.; Zhou, S.; Osman, K.A.; Raat, H.; van Grieken, A. Multidimensional energy poverty and acute respiratory infection in children under 5 years of age: Evidence from 22 low-income and middle-income countries. J. Epidemiol. Community Health 2023, 77, 687–693. [Google Scholar] [CrossRef]
  56. Odo, D.B.; Yang, I.A.; Dey, S.; Hammer, M.S.; van Donkelaar, A.; Martin, R.V.; Dong, G. Ambient air pollution and acute respiratory infection in children aged under 5 years living in 35 developing countries. Environ. Int. 2022, 159, 107019. [Google Scholar] [CrossRef] [PubMed]
  57. He, G.; Liu, T.; Zhou, M. Straw burning, PM2.5, and death: Evidence from China. J. Dev. Econ. 2020, 145, 102468. [Google Scholar] [CrossRef]
  58. Tan, J.; Chen, N.; Bai, J.; Yan, P.; Ma, X.; Ren, M.; Maitland, E.; Nicholas, S.; Cheng, W.; Leng, X.; et al. Ambient air pollution and the health-related quality of life of older adults: Evidence from Shandong China. J. Environ. Manag. 2023, 336, 117619. [Google Scholar] [CrossRef] [PubMed]
  59. Luo, H.; Zhang, Q.; Niu, Y.; Kan, H.; Chen, R. Fine particulate matter and cardiorespiratory health in China: A systematic review and meta-analysis of epidemiological studies. J. Environ. Sci. 2023, 123, 306–316. [Google Scholar] [CrossRef] [PubMed]
  60. Zhang, Y.; Wang, T.; Liu, C. Beyond the modern productivity paradox: The effect of robotics technology on firm-level total factor productivity in China. J. Asian Econ. 2024, 90, 101692. [Google Scholar] [CrossRef]
  61. Shen, Y.; Yang, Z.; Zhang, X. Impact of digital technology on carbon emissions: Evidence from Chinese cities. Front. Ecol. Evol. 2023, 11, 1166376. [Google Scholar] [CrossRef]
  62. Yang, Z.; Shen, Y. The impact of intelligent manufacturing on industrial green total factor productivity and its multiple mechanisms. Front. Env. Sci. 2023, 10, 1058664. [Google Scholar] [CrossRef]
  63. Shen, Y.; Zhang, X. The impact of artificial intelligence on employment: The role of virtual agglomeration. Humanit. Soc. Sci. Commun. 2024, 11, 122. [Google Scholar] [CrossRef]
  64. Schiederig, T.; Tietze, F.; Herstatt, C. Green innovation in technology and innovation management – An exploratory literature review. R D Manag. 2012, 42, 180–192. [Google Scholar] [CrossRef]
  65. Lin, Z.; Li, Y. Inter-city environmental regulation heterogeneity and green innovation quality: A knowledge influence perspective. Sci. Technol. Prog. Policy 2022, 39, 33–44. [Google Scholar] [CrossRef]
  66. Ren, S.; Hao, Y.; Wu, H. Government corruption, market segmentation and renewable energy technology innovation: Evidence from China. J. Environ. Manag. 2021, 300, 113686. [Google Scholar] [CrossRef] [PubMed]
  67. Parsley, D.C.; Wei, S. Limiting Currency Volatility to Stimulate Goods Market Integration: A Price-Based Approach; National Bureau of Economic Research: Cambridge, MA, USA, 2021. [Google Scholar]
  68. Gui, Q.; Chen, M.; Chen, Z. China’s domestic commodity market tends to be segmented or integrated: An analysis based on the relative price method. J. World Econ. 2006, 2, 20–30. [Google Scholar]
  69. Lai, A.; Wang, Q.; Cui, L. Can market segmentation lead to green paradox? Evidence from China. Energy 2022, 254(Part C), 124390. [Google Scholar] [CrossRef]
  70. Gan, Q.; Chen, S. Effect of market integration on green economic growth: Evidence from 30 Chinese provinces. J. Southeast Univ. (Engl. Ed.) 2023, 39, 256–268. [Google Scholar] [CrossRef]
  71. Wang, Y.; Sun, K. Has the domestic product market transferred from segmentation to integration?—Empirical evidence from the Chinese city level. Economist 2023, 298, 98–108. [Google Scholar] [CrossRef]
  72. Hu, C.; Huang, J.; Gao, Y.; Lin, R. Can high-speed railway promote regional market integration? Evidence from China. Res. Transp. Bus. Manag. 2023, 51, 101057. [Google Scholar] [CrossRef]
  73. Broner, F.; Bustos, P.; Carvalho, V.M. Sources of Comparative Advantage in Polluting Industries; NBER Working Paper; National Bureau of Economic Research: Cambridge, MA, USA, 2012; No. 18337. [Google Scholar] [CrossRef]
  74. Giuli, A.D.; Laux, P.A. The effect of media-linked directors on financing and external governance. J. Financ. Econ. 2022, 145, 103–131. [Google Scholar] [CrossRef]
  75. Cheng, H.; Zhu, L.; Meng, J. Fuzzy evaluation of the ecological security of land resources in mainland China based on the Pressure-State-Response framework. Sci. Total Environ. 2022, 804, 150053. [Google Scholar] [CrossRef] [PubMed]
  76. Chen, X.; Zhou, P.; Hu, D. Influences of the ongoing digital transformation of the Chinese economy on innovation of sustainable green technologies. Sci. Total Environ. 2023, 875, 162708. [Google Scholar] [CrossRef]
  77. Liu, Y.; Hao, Y. How does coordinated regional digital economy development improve air quality? New evidence from the spatial simultaneous equation analysis. J. Environ. Manag. 2023, 342, 118235. [Google Scholar] [CrossRef]
  78. Hammer, M.S.; van Donkelaar, A.; Li, C.; Lyapustin, A.; Sayer, A.M.; Hsu, N.C.; Levy, R.C.; Garay, M.J.; Kalashnikova, O.V.; Kahn, R.A.; et al. Global estimates and long-term trends of fine particulate matter concentrations (1998–2018). Environ. Sci. Technol. 2020, 54, 7879–7890. [Google Scholar] [CrossRef]
  79. van Donkelaar, A.; Hammer, M.S.; Bindle, L.; Brauer, M.; Brook, J.R.; Garay, M.J.; Hsu, N.C.; Kalashnikova, O.V.; Kahn, R.A.; Lee, C.; et al. Monthly global estimates of fine particulate matter and their uncertainty. Environ. Sci. Technol. 2021, 55, 15287–15300. [Google Scholar] [CrossRef]
  80. Wen, H.; Lee, C.; Song, Z. Digitalization and environment: How does ICT affect enterprise environmental performance? Environ. Sci. Pollut. Res. 2021, 28, 54826–54841. [Google Scholar] [CrossRef]
  81. Zhao, X.; Lu, S.; Yuan, S. How does the digitization of government environmental governance affect environmental pollution? spatial and threshold effects. J. Clean. Prod. 2023, 415, 137670. [Google Scholar] [CrossRef]
  82. Lu, J.; Xiao, Q.; Wang, T. Does the digital economy generate a gender dividend for female employment? Evidence from China. Telecommun. Policy 2023, 47, 102545. [Google Scholar] [CrossRef]
  83. Bu, H.; Li, G.; Yu, X.; Xun, Z. Is smart carbon emission reduction justified in China? Evidence from national big data comprehensive pilot zones. Heliyon 2023, 9, e17744. [Google Scholar] [CrossRef]
  84. Wang, W.; Zhang, H.; Sun, Z.; Wang, L.; Zhao, J.; Wu, F. Can digital policy improve corporate sustainability? Empirical evidence from China’s national comprehensive big data pilot zones. Telecommun. Policy 2023, 47, 102617. [Google Scholar] [CrossRef]
  85. Bai, J. Panel data models with interactive fixed effects. Econometrica 2009, 77, 1229–1279. [Google Scholar] [CrossRef]
  86. Valizadeh, P.; Fischer, B.; Bryant, H.L. SNAP enrollment cycles: New insights from heterogeneous panel models with cross-sectional dependence. Am. J. Agric. Econ. 2023. [Google Scholar] [CrossRef]
  87. Wen, J.; Yin, H.T.; Jang, C.L.; Uchida, H.; Chang, C.P. Does corruption hurt green innovation? Yes – Global evidence from cross-validation. Technol. Forecast. Soc. Chang. 2023, 188, 122313. [Google Scholar] [CrossRef]
  88. Bai, F.; Huang, Y.; Shang, M.; Ahmad, M. Modeling the impact of digital economy on urban environmental pollution: Empirical evidence from 277 prefecture-level cities in China. Front. Environ. Sci. 2023, 10, 991022. [Google Scholar] [CrossRef]
  89. Yang, Y.; Gu, R.; Ma, S.; Chen, W. How does digital technology empower urban green development efficiency in the Beijing-Tianjin-Hebei region—Mechanism analysis and spatial effects. Environ. Sci. Pollut. Res. 2023, 30, 31471–31488. [Google Scholar] [CrossRef] [PubMed]
  90. You, Z.; Feng, Z.; Yang, Y. China Terrain Fluctuation Kilometer Grid Dataset. Electron. J. Glob. Chang. Data Warehous. (Chin. Engl.) 2018. [Google Scholar] [CrossRef]
  91. Nunn, N.; Qian, N. US food aid and civil conflict. Am. Econ. Rev. 2014, 104, 1630–1666. [Google Scholar] [CrossRef]
  92. Dimitrakopoulos, S. Accounting for persistence in panel count data models. An application to the number of patents awarded. Econ. Lett. 2018, 171, 245–248. [Google Scholar] [CrossRef]
  93. Tang, Y.; Li, F.; Liang, W. The theoretical logic, policy and path of how digital economy promoting the construction of a national unified market. Bus. Econ. Rev. 2022, 23, 37–50. [Google Scholar] [CrossRef]
  94. Zhu, M.; Lu, S. Effects of ICT diffusion on environmental pollution: Analysis of industrial reallocation effects in China. Environ. Sci. Pollut. Res. 2023, 30, 7358–7379. [Google Scholar] [CrossRef] [PubMed]
  95. Kou, D.; Zhang, C. Impact of digital economy on industrial agglomeration mode: Based on specialization and diversity perspective. J. Shandong Univ. Financ. Econ. 2023, 35, 75–87. [Google Scholar] [CrossRef]
  96. He, G.; Pan, Y.; Tanaka, T. The short-term impacts of COVID-19 lockdown on urban air pollution in China. Nat. Sustain. 2020, 3, 1005–1011. [Google Scholar] [CrossRef]
  97. Gao, C.; Zhang, F.; Fang, D.; Wang, Q.; Liu, M. Spatial characteristics of change trends of air pollutants in Chinese urban areas during 2016–2020: The impact of air pollution controls and the COVID-19 pandemic. Atmos. Res. 2023, 281, 106539. [Google Scholar] [CrossRef] [PubMed]
Figure 1. DT directly reduces AP.
Systems 12 00055 g001
Figure 2. Mechanisms of DT to reduce AP.
Systems 12 00055 g002
Figure 3. Research framework.
Systems 12 00055 g003
Figure 4. Space–time evolution of AP. (a) Distribution of AP at the city level in 2006. (b) Distribution of AP at the city level in 2021.
Systems 12 00055 g004
Figure 5. Space–time evolution of DT. (a) The level of DT development in 2006. (b) The level of DT development in 2021.
Systems 12 00055 g005
Table 1. The descriptive statistics of the variables.
VariableCodeMeanStandard ErrorMinMax
Atmospheric pollutionAP3.76490.38012.33364.6606
Digital technologyDT0.59291.59770.000226.4768
Population densityPD5.81720.89181.54758.0805
Economic development levelEDL10.50810.70864.595113.0557
Financial development levelFDE10.28311.12697.583514.1371
IndustrializationInd3.81390.25722.36844.4502
Foreign direct investmentFDI9.94281.86191.098614.9413
Macroeconomic regulationMR−1.83790.4925−13.58331.7562
Energy efficiencyEE4.40321.20380.20888.4948
Green technology innovationGTI4.30061.50882.302610.1828
Market segmentationMS−8.57710.5833−10.3972−5.7632
Air ventilation coefficientAVC7.06790.38865.67238.2591
Table 2. The result of baseline regression.
VariablePOLSFETWFE
DT−0.0355 ***−0.0319 ***−0.0126 ***
(−10.57)(−6.07)(−4.65)
Control variablesYesYesYes
Individual effectNoYesYes
Time effectNoNoYes
R-sq0.42760.47110.6999
Hausman test 146.20 ***231.79 ***
F-test 137.16 ***409.50 ***
N430443044304
Note: *** is significant at the 1% level and the t statistic is reported in parentheses.
Table 3. List of national big data comprehensive pilot zones.
YearPilot Zone
2015Guizhou
2016Beijing, Tianjin, Hebei, Guangdong, Shanghai, Henan, Chongqing, Shenyang, Inner Mongolia
Table 4. Endogenous test.
VariableMethod 1Method 2Method 32SLS
(1)(2)(3)(4)(5)
DT−0.0203 **−0.0116 ***−0.0088 *** −0.1372 ***
(−2.66)(−4.41)(−5.03)(−4.98)
IV −0.0099 ***
(−6.05)
Control variablesYesYesYesYesYes
Individual effectYesYesYesYesYes
Time effectYesYesYesYesYes
LM statistic 36.501 ***
F statistic 36.625
Note: *** significant at the level of 1%. The t-statistic is reported in the parentheses in columns (1) to (4), whereas the z-statistic is reported in parentheses in column (5). Methods 1 to 3 are to replace the proxy indicators of digital technology, increase the policy missing variables, and replace the econometric model.
Table 5. The results of the mechanism test.
VariableEEGTIMS
DT−0.0119 ***0.0196 ***−0.0279 **
(−4.09)(8.33)(−2.36)
Control variablesYesYesYes
Individual effectYesYesYes
Time effectYesYesYes
Note: *** and ** indicate significance at the 1% and 5% levels, respectively, and the t-statistic is reported in parentheses.
Table 6. Results of the heterogeneity test.
VariableResource-Based CityNon-Resource-Based CityPilot CityNon-Pilot City
DT−0.0821 ***−0.0085 ***−0.0221 ***−0.0068 ***
(−4.97)(−4.87)(−7.00)(−3.82)
Coefficient difference test−0.0732 **−0.0142 *
(−2.30)(−1.68)
Control variablesYesYesYesYes
Individual effectYesYesYesYes
Time effectYesYesYesYes
Note: ***, **, and * indicate significance at the 1%, 5%, and 10% levels, respectively, and the t-statistic is reported in parentheses.
Table 7. The temporal heterogeneity of COVID-19 outbreaks.
Variable2006–20192020–2021
DT−0.0134 *** (−3.54)0.0082 ** (−2.12)
Control variablesYesYes
Individual effectYesYes
Time effectYesYes
Note: *** and ** indicate significance at the 1% and 5% levels, respectively, and the t-statistic is reported in parentheses.
Disclaimer/Publisher’s Note: The statements, opinions and data contained in all publications are solely those of the individual author(s) and contributor(s) and not of MDPI and/or the editor(s). MDPI and/or the editor(s) disclaim responsibility for any injury to people or property resulting from any ideas, methods, instructions or products referred to in the content.

