Article

Constant Companionship Without Disturbances: Enhancing Transparency to Improve Automated Tasks in Urban Rail Transit Driving

by
Tiecheng Ding
1,
Jinyi Zhi
1,*,
Dongyu Yu
1,
Ruizhen Li
1,
Sijun He
2,
Wenyi Wu
3 and
Chunhui Jing
1
1
School of Design, Southwest Jiaotong University, Chengdu 611730, China
2
School of Art and Design, Xihua University, Chengdu 610039, China
3
Beijing Aerospace Measurement & Control Technology Co., Ltd., Beijing 100076, China
*
Author to whom correspondence should be addressed.
Systems 2024, 12(12), 576; https://doi.org/10.3390/systems12120576
Submission received: 11 November 2024 / Revised: 12 December 2024 / Accepted: 17 December 2024 / Published: 18 December 2024
(This article belongs to the Topic Theories and Applications of Human-Computer Interaction)

Abstract

:
Enhancing transparency through interface design is an effective method for improving driving safety while reducing driver workloads, potentially fostering human–machine collaboration. However, to ensure system usability and safety, operator psychological factors and operational performance must be well balanced. This study investigates how the introduction of transparency design into urban rail transit driving tasks influences drivers’ situational awareness (SA), trust in automation (TiA), sense of agency (SoA), workload, operational performance, and visual behavior. Three transparency driver–machine interface (DMI) information conditions were evaluated: DMI1, which provided continuous feedback on vehicle operating status and actions; DMI1+2, which added inferential explanations; and DMI1+2+3, which further incorporated proactive predictions. Results from simulated driving experiments with 32 participants indicated that an appropriate level of transparency significantly enhanced TiA and SoA, thereby yielding the greatest acceptance. High transparency significantly aided in predictable takeover tasks but affected gains in TiA and SoA, increased workload, and disrupted perception-level SA. Compared with previous research findings, this study indicates the presence of a disparity in transparency needs for low-workload tasks. Therefore, caution should be exercised when introducing high-transparency designs in urban rail transit driving tasks. Nonetheless, an appropriate transparency interface design can enhance the driving experience.

1. Introduction

Railway transportation has experienced a rapid development of automation technology. Table 1 shows the Grade of Automation (GoA) standards for urban rail transit operations developed by the International Association of Public Transport. This GoA has five levels, ranging from a complete manual driving mode to full automation. Most urban rail transit lines operate at GoA-2, indicating the assistance of automatic train protection (ATP). However, some low-capacity lines use the GoA-3 mode. The GoA-4 level of full automation has been implemented in mega-cities such as London, Tokyo, and Dubai [1]. The increasing use of automation has resulted in many benefits, such as a reduction in human errors and the assurance of on-time train operations [2]. Automation has also contributed to improved operational efficiency [3] and decreased energy consumption [4]. Driven by advancements in electronic information technology, the exploration of the safeguarding of train safety through automated systems continues. Advancements in this area include precisely transitioning between modes during operation [5], ensuring safe distances between trains [6], conducting efficient operational scheduling [7], proactively predicting emergency braking requirements [8], and meticulously calibrating vehicle speed and position [9]. However, the implementation of higher levels of automation (LOAs) remains controversial for several reasons, including incomplete system interpretability [10], insufficient emergency procedures [11], partial public acceptance [12], and the unclear determination of social and legal responsibilities [13]. Consequently, some regions may still need to employ GoA-2, a less advanced LOA, where a driver is responsible for monitoring the cabin environment and taking over driving operations in the case of an emergency.
While automation technology for trains advances comprehensively and rapidly, human adaptation proceeds at a much slower pace. It is widely recognized that the actual task of urban rail transit today is not characterized by driving, but rather by humans interacting with automated systems and responding to errors [15,16]. The system contains a large amount of detailed information; however, the driver–machine interface (DMI) between the operator and system only conveys basic vehicle status and takeover commands. Consequently, the above functionalities are largely unclear to operators, leading to the sensation of “driving in an information vacuum” [17]. An increasing level of automation coupled with a lack of transparency poses an imminent risk: if operators are unaware of what the automated system is doing, their situational awareness (SA) regarding current traffic conditions may suffer negative impacts, leading to an inability to make autonomous decisions and a lack of awareness, which can negatively affect safety performance [18].
Against the backdrop of overwhelming developmental disparities between humans and machines, achieving new task objectives necessitates the formation of a collaborative relationship between operators and automated systems to accurately and continuously comprehend automation capabilities and operating environments. Within this consensus [19], the system is no longer perceived as a mere tool but instead as a partner, thereby emphasizing autonomous decision-making conducted in a blended, proactive manner that is aimed at enhancing operator performance and reducing workload. Human operators identify system states and intervene when faults are likely to occur [20]. Mutual communication fosters human–machine interaction, enhances trust in automation (TiA), and improves psychological states [21]. This operator-centered collaborative relationship is closely associated with the idea of system transparency [22,23]. Likewise, modern train driving skills are likened to the endeavor for improved displays and stress the gradual revelation of opaque system features [24]. Therefore, in the context of urban rail transit automation, fostering human–machine cooperation through automation transparency is crucial.
Interface design is considered an effective and convenient means for providing agent transparency [25], which can facilitate understanding of the fundamental principles of automation and the consequences of following automated suggestions [26]. To guide the design of automation transparency, Chen et al. [27] proposed the Situation Awareness Agent-Based Transparency (SAT) model, which comprehensively describes three levels of transparency: perception of the current environment (Level 1), understanding the rationale behind suggestions (Level 2), and predicting future state information (Level 3). Bhaskara et al. [28] found that increasing transparency in the connected control of autonomous vehicles can enhance decision accuracy without increasing decision time and subjective workloads. Roth et al. [29] showed that increasing automation transparency in unmanned aerial vehicle management tasks can support the planning and execution of complex missions, enhance SA, and improve task performance.
This study is grounded in the demand for human–machine collaboration within the current context of automation tasks. We consider the introduction of transparency in DMI designs to enhance automated driving in urban rail transit.

Research Gap and Motivation

While increased transparency has been shown to aid in automated operations, its benefits are not exhaustive, and it can lead to an increased decision-making time [30], heightened information-processing workload [31], and decreased sensitivity to perceived threats [32]. Different task environments, particularly those with lower workloads, may demand varying levels of transparency [33]. Therefore, solely aiming to maximize agent transparency is not necessarily ideal; indeed, lower levels of transparency may be more beneficial in some ways than higher levels because the continuous feedback, explanations, and proactive predictions facilitated by transparency can contribute to reduced performance. Accordingly, we analyze the gap between increased transparency (DMI1: continuous feedback; DMI1+2: continuous feedback + explanations; and DMI1+2+3: continuous feedback + explanation + proactive prediction) and current designs, which enables us to identify comprehensive factors to consider when enhancing DMI transparency and to establish them as the basis for our research hypotheses.
Continuous feedback entails the consistent display of the characteristics and operational modes of automation, rather than merely alerting drivers to faults or the need for vehicle recovery, thereby enabling drivers to understand the system’s actions and status. Continuous feedback enables operators to more accurately understand automation [34], effectively mitigating “mode confusion” [35] and enhancing mode perception. This effective perception of automation is defined as a sense of agency (SoA) [36]. Additionally, continuous feedback is expected to enhance TiA because when system states are presented, operators gain a clearer understanding of the automation process [36,37]. Continuous feedback has been recognized as being beneficial for manual driving modes. Jansson et al. [38] aggregated interview findings from six professional drivers, proposing that ongoing feedback should encompass operational phases such as station departure, travel en route, and station approach. Such feedback can assist operators in sustaining optimal attention and operational conditions. In the context of greater automation, would further increasing continuous feedback regarding automation status be advantageous for operators?
H1: 
Continuous feedback contributes to an improvement in SoA and TiA when transparency is low (DMI1).
Explanations facilitate the implementation of automation, relieving drivers from the need to monitor the driving environment and helping them understand the system’s intentions and behaviors. This makes the system easier to comprehend, learn, and use [39]. Furthermore, explanations help reduce anxiety during takeover events and enhance the acceptance of automation. For instance, stating “Take over; there is a vehicle malfunction ahead” is more effective than simply stating “Take over” [40]. The benefits of explanation also manifest during the stage of automation adjustment, enabling operators to ascertain the correctness of their actions and thereby enhancing their understanding of the environment and facilitating further TiA calibration [41]. For example, stating “Vehicle is automatically slowing down due to pedestrian cobblestone path ahead” is more informative than stating “Vehicle is about to slow down” [42]. Interestingly, even within the same urban transit system, there may be no consensus on the design of the DMI with added explanations. For instance, Line 11 in Shanghai provides explanatory guidance on operation methods, Line 12 only displays basic operational instructions. The standardization of equipment for large vehicles is beneficial to reduce production costs and improve safety.
H2: 
Medium transparency (DMI1+2), characterized by additional explanations relative to low transparency (DMI1), results in further enhancements in TiA and SoA, along with increased acceptance.
Proactive prediction is regarded as a further intelligent decision-making method in automation involving the advanced indication of future states and uncertain information before state transitions. Proactive prediction serves as a crucial means of ensuring good out-of-the-loop performance, aiding operators in self-regulation and clarifying self-functional transitions under automation mode switches, in addition to helping prevent decreased alertness, over-reliance on automation, loss of SA, and manual skill degradation [43]. Importantly, proactive prediction is considered to go beyond mere takeover requests [44], providing sufficient time for safe control transitions [45] and rapidly enhancing SA required for decision-making based on attentional shifts [46]. Proactive prediction also enables early planning for secondary tasks [47,48], offering significant benefits compared with conventional interface takeover performance. Research has been conducted on the timing of predictive anticipation. Gold et al. [49] concluded that a budget of 5–7 s is sufficient for drivers to respond to critical hazards in highly automated driving. Previous research on future train driving introduced the concept of proactive prediction design, which incorporates a planning window in the interface to help drivers anticipate road conditions [50]. However, technological limitations during that time posed challenges such as delayed data transmission and difficulty achieving localized optimization [51]. Fortunately, advancements in infrastructure [52] and information technology [53] have allowed systems to reliably transmit consistent information to drivers.
H3: 
High transparency (DMI1+2+3) incorporating proactive prediction provides a higher level of SA than low (DMI1) and medium transparency (DMI1+2) while also delivering quicker system-predicted takeover assistance.
It is worth noting that not all predictive information evolves into direct threats. This leads to a research gap where the failure of predicted information to materialize as threats may result in the “cry wolf” effect [54], disrupting the original driving state and undermining trust in automation [55]. Moreover, when there is too much predictive information, or when the transition to predictive assistance is premature, operators may devote unnecessary attention to monitoring the system, which can affect not only risk perception sensitivity [19] but also the performance of tasks other than the takeover task [56]. In urban rail transit systems, operators rely more heavily on real-time control prompts from the system, with infrequent occurrence of uncertain information prompts. In such cases, would the limitations of high-level transparency become more pronounced?
H4: 
In high transparency (DMI1+2+3), uncertain predictive information prompts hinder the ongoing enhancement of trust and agency perception. Moreover, the increased volume of information increases the workload, adversely affecting takeover performance beyond the scope of prediction.
Intriguingly, the assistance provided by transparency in operational behavior does not necessarily equate to psychological perceptual benefits. For example, Wright et al. [57] demonstrated that while Level 2 transparency did not significantly improve performance, it yielded the highest performance satisfaction. In their subsequent experiments, Wright et al. [33] obtained similar findings. Especially in systems with relatively fixed operating modes, even if high transparency significantly aids operations, it may affect the SoA of operators, who may be reluctant to perceive it as a teammate [58]. Therefore, compared with other domains, the application of transparency in urban rail transit may lead to more significant changes in system design and have a greater impact on operational modes. Operators may also tend to prefer more conservative transparency modes. Striking a balance between the assistance provided by transparency and its perceived psychological benefits is crucial. Satisfaction with the application of automation technology will influence its further dissemination [59].
H5: 
Although medium transparency (DMI1+2) might not provide optimal takeover performance assistance, it may still receive the highest user preference.
As previously mentioned, the transparency of agents affects not only takeover performance, SA, and workload but also TiA, SoA, and acceptance. Differences in the task context further exacerbate these effects. Urban rail transit driving, as a continuous, monotonous, and highly automated task environment, presents an intriguing setting for the introduction of transparency, which holds significance for advancing its overall research. As the application of automation is now irreversible, we explore the impact of enhanced transparency on urban rail transit driving tasks through simulated driving experiments to explore human–machine collaboration in the traditional industrial task domain, thereby facilitating better adaptation to automated driving tasks. The research question is vividly framed as whether “this companion” needs to persistently accompany, patiently explain, or even intelligently anticipate to enhance takeover performance, improve SA, reduce workload, increase trust, and achieve optimal acceptance.
The contributions of this study are as follows:
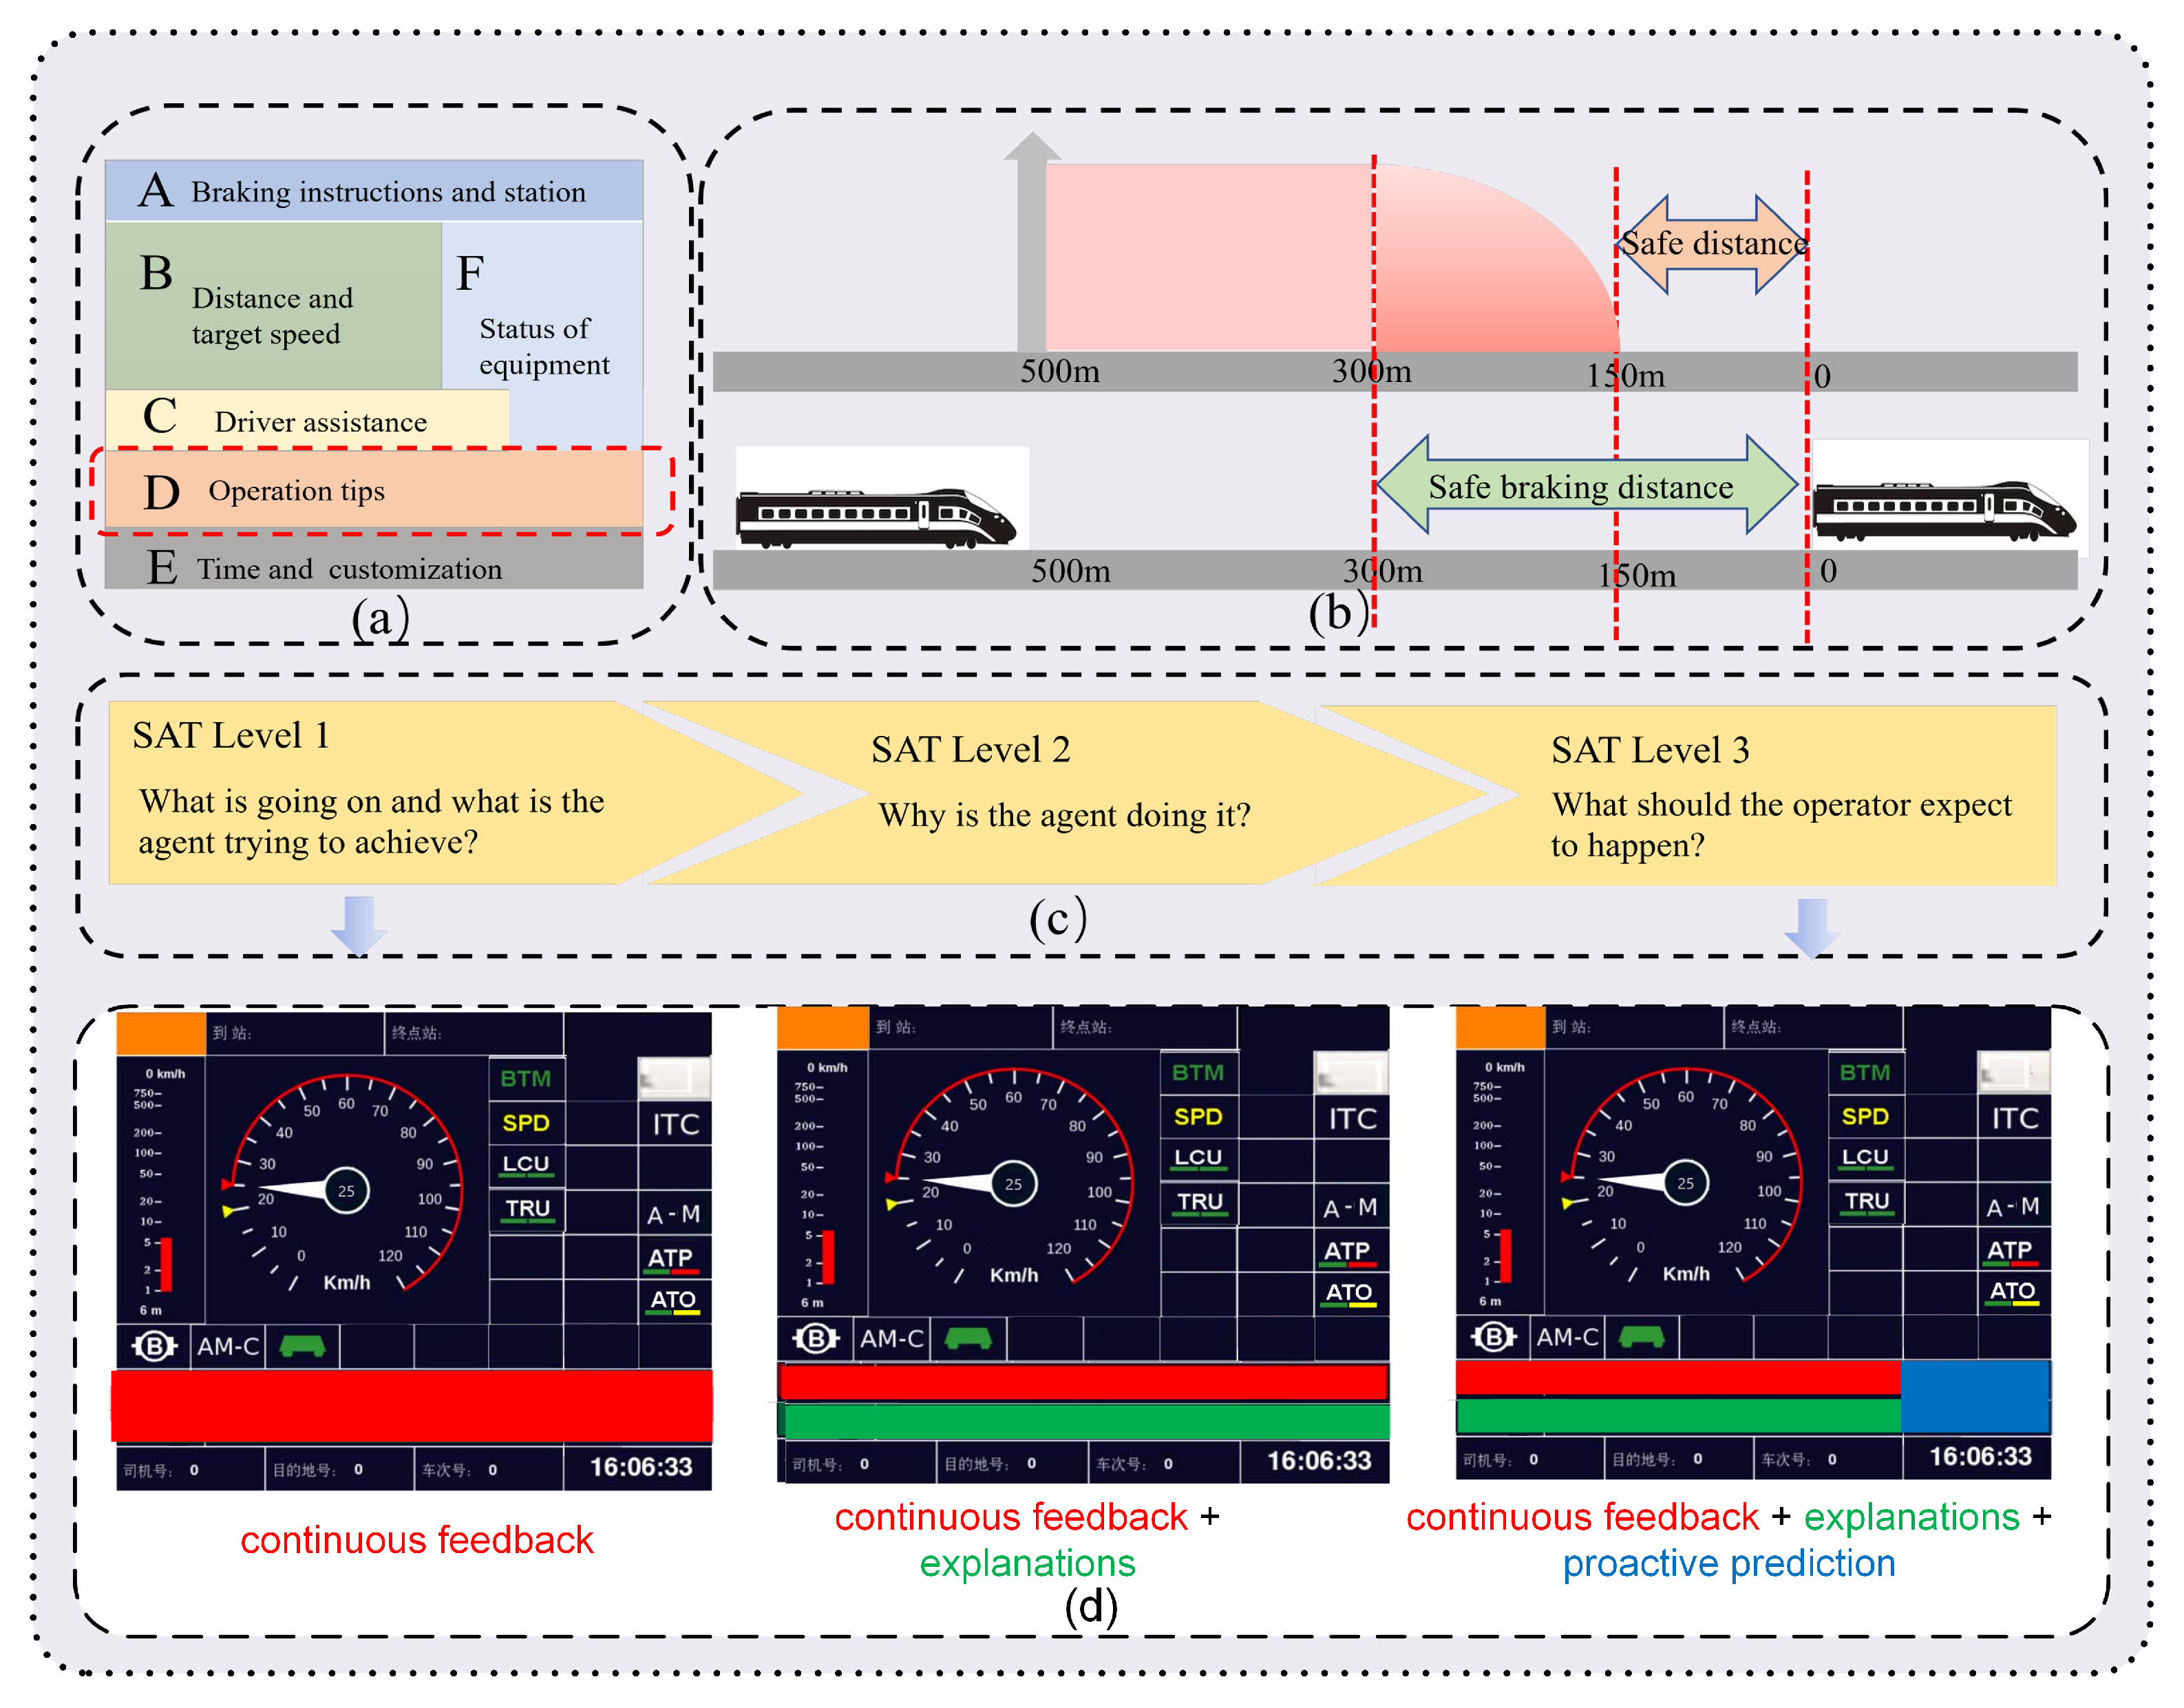
  • A transparent design framework that includes continuous feedback, explanatory notes, and advance predictions for different automation states during urban rail transit driving is proposed.
  • The impact of different transparency levels on task performance is revealed using multidimensional metrics including SA, TiA, SoA, workload, takeover performance, and visual behavior with the help of simulated driving trials.
  • The advantages and limitations of different levels of transparency are clarified using reasoning analysis combining experimental data and participant interviews, thus providing practical guidance for optimizing urban rail transit interfaces.

2. Methods

To test our hypothesis, professionally trained participants were enlisted to engage in a simulated driving experiment. We devised three distinct levels of transparency within the DMI: DMI1 (continuous feedback), DMI1+2 (continuous feedback + explanations), and DMI1+2+3 (continuous feedback + explanations + proactive prediction). We then examined their effects on all outcome variables, encompassing SA, TiA, SoA, takeover performance, workload, acceptance, and visual behavior.

2.1. Participants

According to calculations made using G*Power 3.1.9.7, the minimum required number of participants for the experiment was 29, with an effect size of 0.25, an 80% confidence interval, and a 0.05 margin of error. To safeguard against potential data loss, a total of 32 participants were recruited. Additionally, in consideration of gender diversity trends in rail transportation employment, the participants included 12 women. The participants’ ages ranged from 20 to 23 years (M = 22.25), and they were all selected from the same cohort of railway professionals, thereby mitigating the influence of driving experience and training methods. All participants met the admission criteria for this study, underwent comprehensive driving skill training, possessed relevant knowledge of railway driving, and were highly familiar with standard train driving procedures. Upon completion of the experiment, each participant received a compensation of CNY 100.
This study underwent safety and ethics review by the Industrial Engineering Department Review Committee at Southwest Jiaotong University. All participants provided their written informed consent.

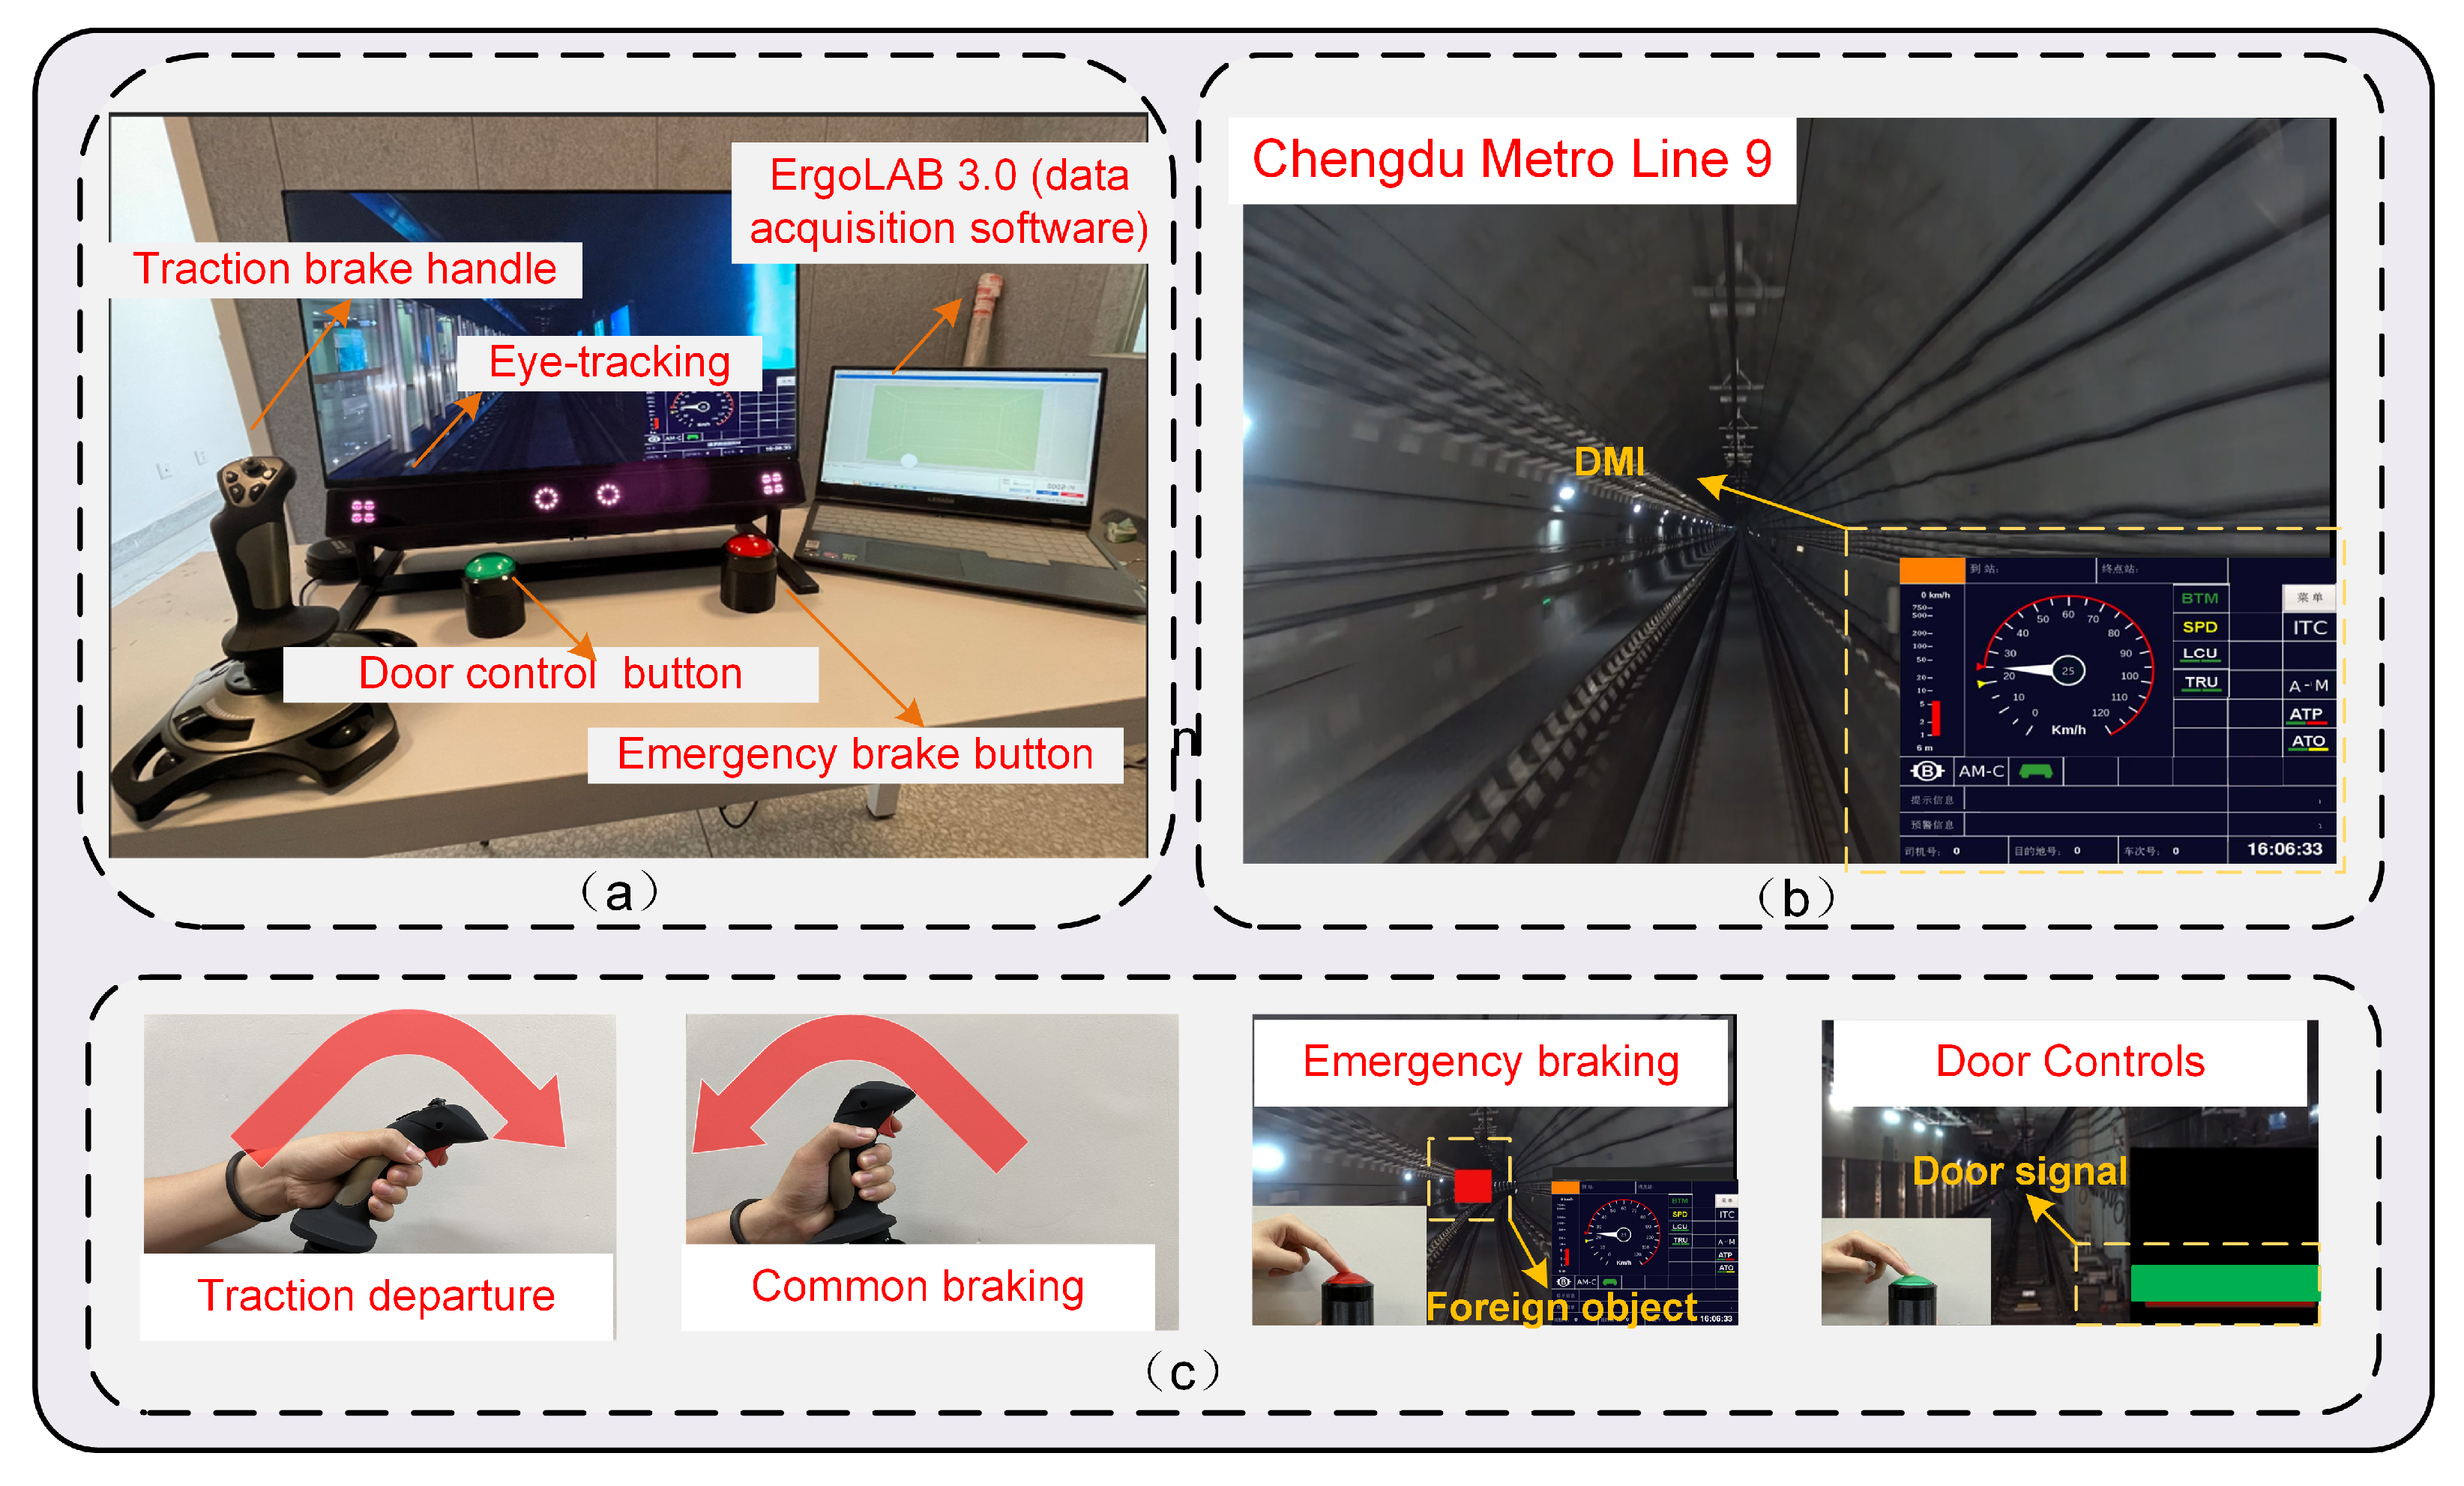
2.2. Experiment Environment

We referenced the studies of Dunn and Williamson [60] and Olsson [61] for the layout of the experimental setup for train driving experiments (Figure 1a). Given that trains operate along tracks and do not require vertical or lateral steering, a single-screen external scene was deemed suitable for simulating train driving [61]. A 23.8-inch display screen equipped with a Tobii S1200 eye tracker (Tobii AB, Danderyd, Sweden) was used for the experimental scene display. The screen had an aspect ratio of 16:9 with a resolution of 1920 × 1080. Recordings of the experimental scene were conducted during actual operations on Chengdu Metro Line 9 (Figure 1b). The eye tracker was connected to a laptop equipped with ErgoLAB3.0 software (KingFar International Inc., Beijing, China) to record operational times. Furthermore, the driving simulator was equipped with two buttons and a PXN2119Pro joystick (PXN Inc., Shenzhen, China). The joystick was used for speed control, as well as for the general braking of the train. Pushing the joystick forward indicates traction acceleration, while pulling it backward signals regular braking deceleration. The red button is designated for emergency braking in response to system prompts or track obstructions, while the green button is used to manage door operations during station stops while following system prompts. The operational methods are depicted in Figure 1c.

2.3. Interface Design

The design of the experimental interface was inspired by three aspects: layout structure, technical support, and theoretical logic. Regarding layout structure, we used the specifications of the human–machine interface in rail transit vehicles (Figure 2a) as a reference, dedicating Area D to display driver operation information prompts [62]. Regarding technical support, we considered the example of the safe distance control function, where the interface uses communication-based train control (CBTC; Figure 2b). This allows for the provision of pre-warning information, including common braking when approaching a distance less than the safe braking distance and emergency braking when approaching a distance less than the safe distance. In terms of theoretical logic, three transparency interfaces were developed following the SAT model (Figure 2c) [27]. The final interface design is depicted in Figure 2d.
DMI1: Featuring a feedback area, this interface offers participants essential vehicle dynamics. It provides data regarding the vehicle’s location, speed, transitions between automated and manual modes, automated adjustments, and notifications for faults. Instructions are consistently presented until the subsequent state transition takes place. For instance: “The vehicle is departing, please maintain manual traction”, “The recommended speed has been reached, please switch to autonomous driving mode”, and “Immediate emergency braking required, decelerate to 25 km/h”.
DMI1+2: This interface integrates both a feedback area and an explanation section. The explanation area elaborates on feedback information using operational parameters, aiding in the comprehension of autonomous driving reliability (e.g., “Automatic acceleration is normal at the recommended speed”) and mode transition rationale (e.g., “The distance to the preceding vehicle is less than the safe braking distance.”).
DMI1+2+3: This interface enhances functionality by incorporating a predictive area. It offers two stages of information: before a state transition, it presents predictions (e.g., “The train is approaching the station, prepare for automatic deceleration”). During the state transition, it forecasts the duration of the state (e.g., “Automatic deceleration is expected to conclude in approximately 20 s, please attend to platform conditions”).
As all participants were native Chinese speakers, interface instructions were displayed in Chinese. Three railway experts verified the comprehensibility of the information. During normal operation, a subtle gong sound was used to indicate instruction changes, while fault instructions were distinguished by a double-beep sound (2800 Hz, 74 dB). Specific instructions were fully explained depending on the setup of the scene.

2.4. Scenario

The experimental scenario was based on Chengdu Metro Line 9, with alternating operations between tunnel sections and station platforms. Each tunnel driving scenario spanned 2 to 4 min, with approximately 30 s allotted for each station stop.
Modern train multitasking models [24] and drivers’ visual strategy requirements [16] were consulted for reference. Operators need feedback on vehicle position, system status, and fault alerts, as well as instructions for temporary adjustments in special situations (e.g., large passenger volume or route changes). In light of this, five non-routine events were incorporated, comprising two automated temporary adjustment events, one automated reminder fault event, one potential fault event, and one un-notified sudden fault event. These events were designed based on studies of automated assistive functionalities [5,6,7,8,9] and typical train accidents [63].
As these events are all closely tied to DMI instructions, we discuss concepts related to DMI design below in the context of specific experimental scenarios.
General operating procedure: Operators are required to manually traction the train out of the station within each operational interval, reach the recommended speed, adhere to speed restrictions, activate the ATP, obey signal indications, monitor the system for steady cruising, and allow for automatic deceleration when the train approaches the station, followed by the manual operation of door controls. DMI1 continually provides feedback to the operator regarding specific vehicle driving modes or manual operation requirements, with instructions updating based on changes in status. DMI1+2 enhances the understanding of vehicle state transitions and verifies the normalcy of operations. DMI1+2+3 further provides predictions for the duration of each state and changes in vehicle spacing, along with real-time prediction of the completion of each state using a countdown mechanism. Moreover, it emphasizes the provision of prompts before mode switching, with a lead time set at 5 s, based on the study of Gold et al. [49]. In summary, DMI1 conveys what must be done, or what automation is doing. DMI1+2 supplements with why something is done and whether it is done correctly. DMI1+2+3 indicates how long it should take to do something and what is next while providing details (e.g., acceleration/deceleration time to target speed, following distance, and stopping point distance). Figure 3 shows the design of DMI instructions.
Automated temporary adjustments: There are two automated temporary adjustment events during which operators are not required to take any action. The first is a temporary adjustment of the speed limit due to the need to navigate through a sharp curve. The second is influenced by passenger volume, prompting the temporary acceleration of trains and decreasing the following distance. These events do not affect the operator’s original driving mode; therefore, DMI1 provides real-time feedback on the adjustment event and instructs the operator to maintain the automatic driving mode. DMI1+2 adds explanatory information regarding the event. DMI1+2+3 provides a warning and predicts the completion time of adjustments. Figure 4 illustrates the design of DMI instructions for automated temporary adjustments.
Automated reminder fault event: The scenario was inspired by the Beijing Changping Line subway rear-end collision accident that occurred on 14 December 2023. On that day, due to severe weather conditions, drivers were asked to temporarily operate in manual mode. However, due to a lack of system instructions, the driver failed to apply the brakes promptly after receiving the deceleration alert. Additionally, the snowy conditions caused a delay in braking, leading to a serious rear-end collision. With the assistance of CBTC (Figure 2b), in this fault event, the system issues two takeover reminders. The first occurs when the distance falls below the safe braking distance. In response, the operator is required to engage the manual brake by manipulating the handle, reducing the speed to the prescribed level, and maintaining visual observation for a specified distance. The second reminder occurs when the distance becomes less than the safe distance, prompting the operator to immediately press the emergency brake button, thereby bringing the train to a complete stop. The operator should then wait for a command from the system to restore the fault release, drive manually to the next station, and resume the normal driving process. Consequently, DMI1 provides specific braking instructions based on feedback regarding the abnormal distance. DMI1+2 explains the abnormal distance scenario. When approaching an abnormal distance, DMI1+2+3 provides warnings, predicts the time required for fault recovery, and displays real-time adjustments to the distance from the preceding vehicle during the fault resolution process. Figure 5 illustrates the commands during the fault process.
Potential fault event: The stability of urban rail transit operating systems relies on the collective maintenance of multiple vehicle systems. Therefore, there are instances in which a potential fault may be approaching, but other vehicle systems prioritize control, thus averting the development of a direct threat to the vehicle. In such cases, because there is no change in the operator’s task mode, DMI1 and DMI1+2 provide no feedback or explanation regarding the fault. However, DMI1+2+3 still issues predictive prompts due to the proximity of the fault. For instance, if the vehicle distance decreases but does not reach the safe braking distance, DMI1 and DMI1+2 remain unchanged, whereas DMI1+2+3 issues a warning.
Un-notified sudden fault event: In the event of a failure in the track recognition system, train sensors may occasionally fail to fully identify objects on the track. In such a scenario, the system issues no instructions or alerts. Operators are required to rely on their own responsiveness to identify objects on the track and immediately press the emergency brake button to bring the train to a direct stop. For illustrative purposes, to distinguish this from system-prompted emergency braking, this is defined as unexpected braking.

2.5. Measurement

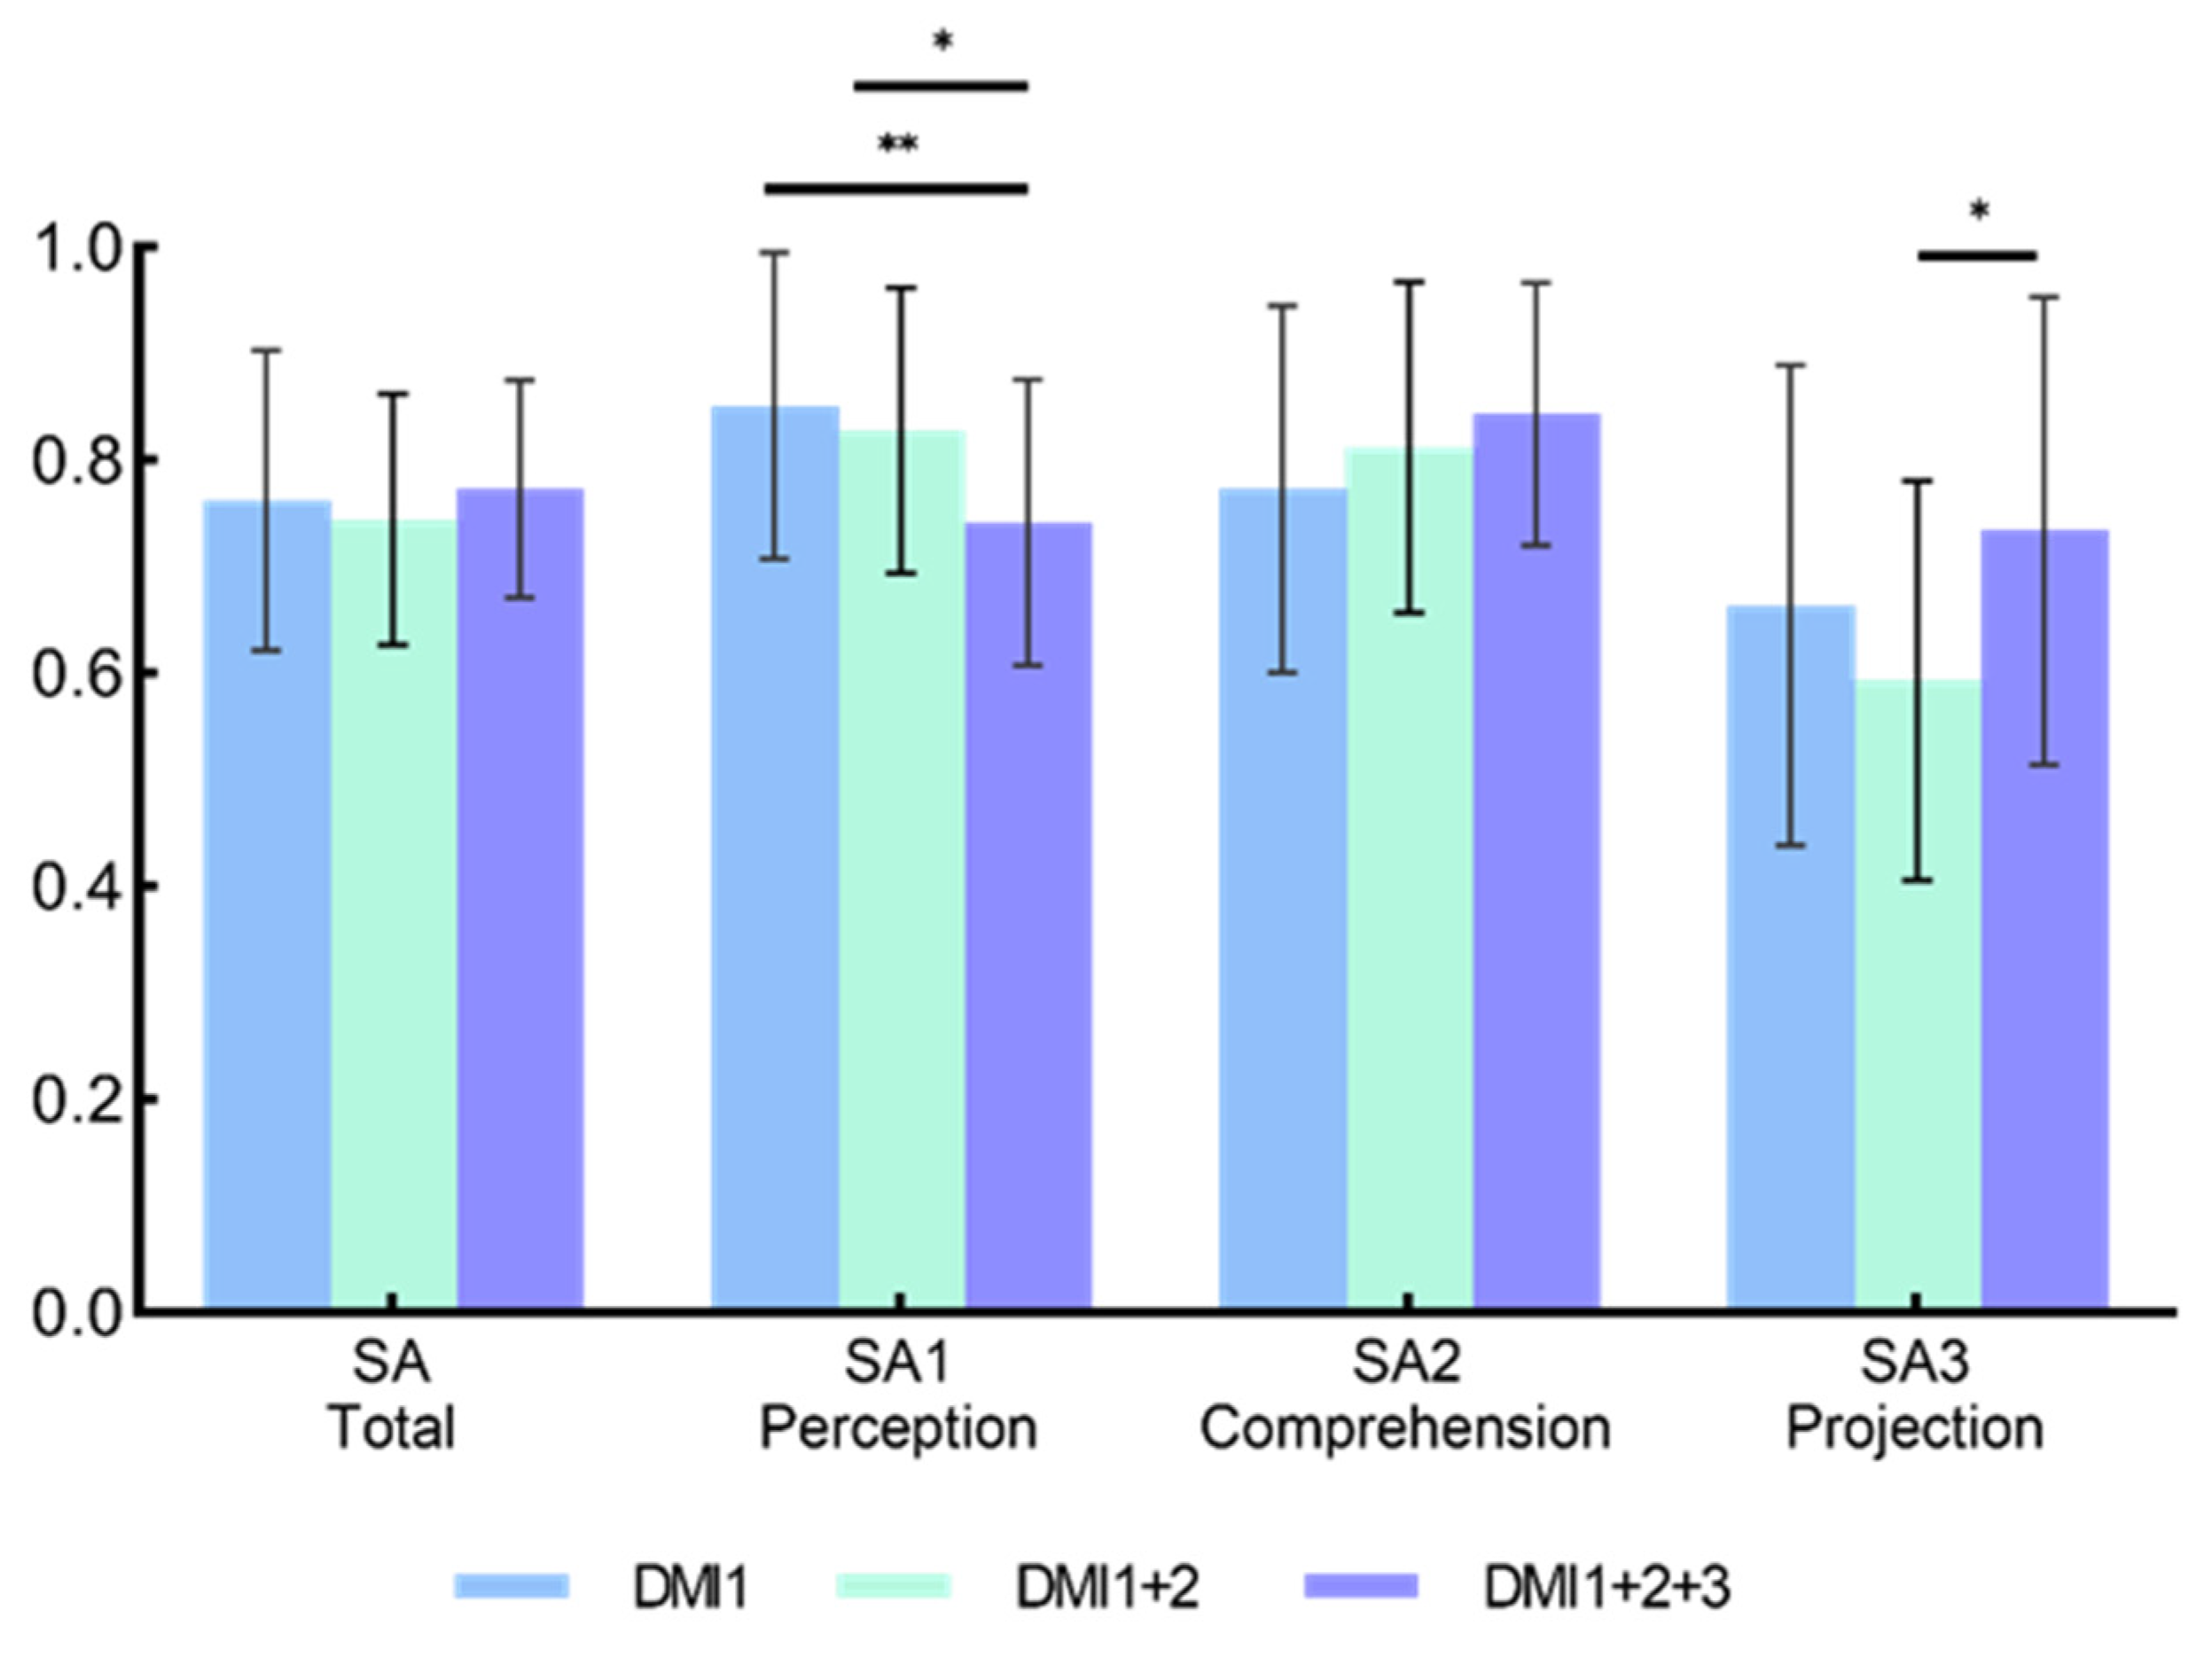
2.5.1. Situational Awareness Global Assessment Technique

We used the Situation Awareness Global Assessment Technique (SAGAT) to evaluate participants’ SA. Following the standard SAGAT procedure, pages containing SAGAT questions were fully overlaid at several points on the display screen (freeze points), prompting participants to promptly respond to questions regarding their comprehension of the current situation, encompassing levels 1 SA (perception), 2 SA (comprehension), and 3 SA (projection) [64]. The formulation of questions drew from the Driver’s Task Handbook and railway SA requirements [65,66], which aimed to assess various pieces of driving-related information such as current speed and direction, recent signal and road condition updates, and anticipated speed and driving status.
In a single simulated driving task, each participant underwent random exposure to two freeze points, each lasting for 60 s, during which two questions were randomly selected for each SA level. This resulted in a total of six questions. The time allotted for answering and the difficulty of the questions were determined based on a pre-test. After completing three full trials, participants experienced a total of six freeze points, with each SA level measured 12 times. SA levels were determined by response accuracy.

2.5.2. Operational Performance Indicators

Operational performance encompasses the response time for both control tasks and fault operations, with the latter including common braking and emergency braking procedures based on interface warning messages, as well as unexpected braking for foreign object intrusions during automated fault detection. The response times for each task are defined as follows.
  • Common brake task response time: the time between the system issuing the deceleration command and the participant pulling the handle backward by more than 10% [67];
  • Emergency brake response time: the time between the system issuing the stopping command and the participant pressing of the brake button;
  • Unexpected brake response time: the time from when a foreign object appears in the tunnel to when the participant presses the brake button.

2.5.3. Questionnaires

A questionnaire was employed to determine whether participants’ fatigue levels met the experimental criteria and to collect dependent variables including workload, TiA, SoA, acceptance, and interface preferences.
  • Fatigue levels were measured using the Karolinska Sleepiness Scale (KSS), a nine-point Likert scale ranging from 1 (very alert) to 9 (very sleepy). Scores below 3 indicate a state of alertness, while scores above 7 indicate extreme drowsiness [68];
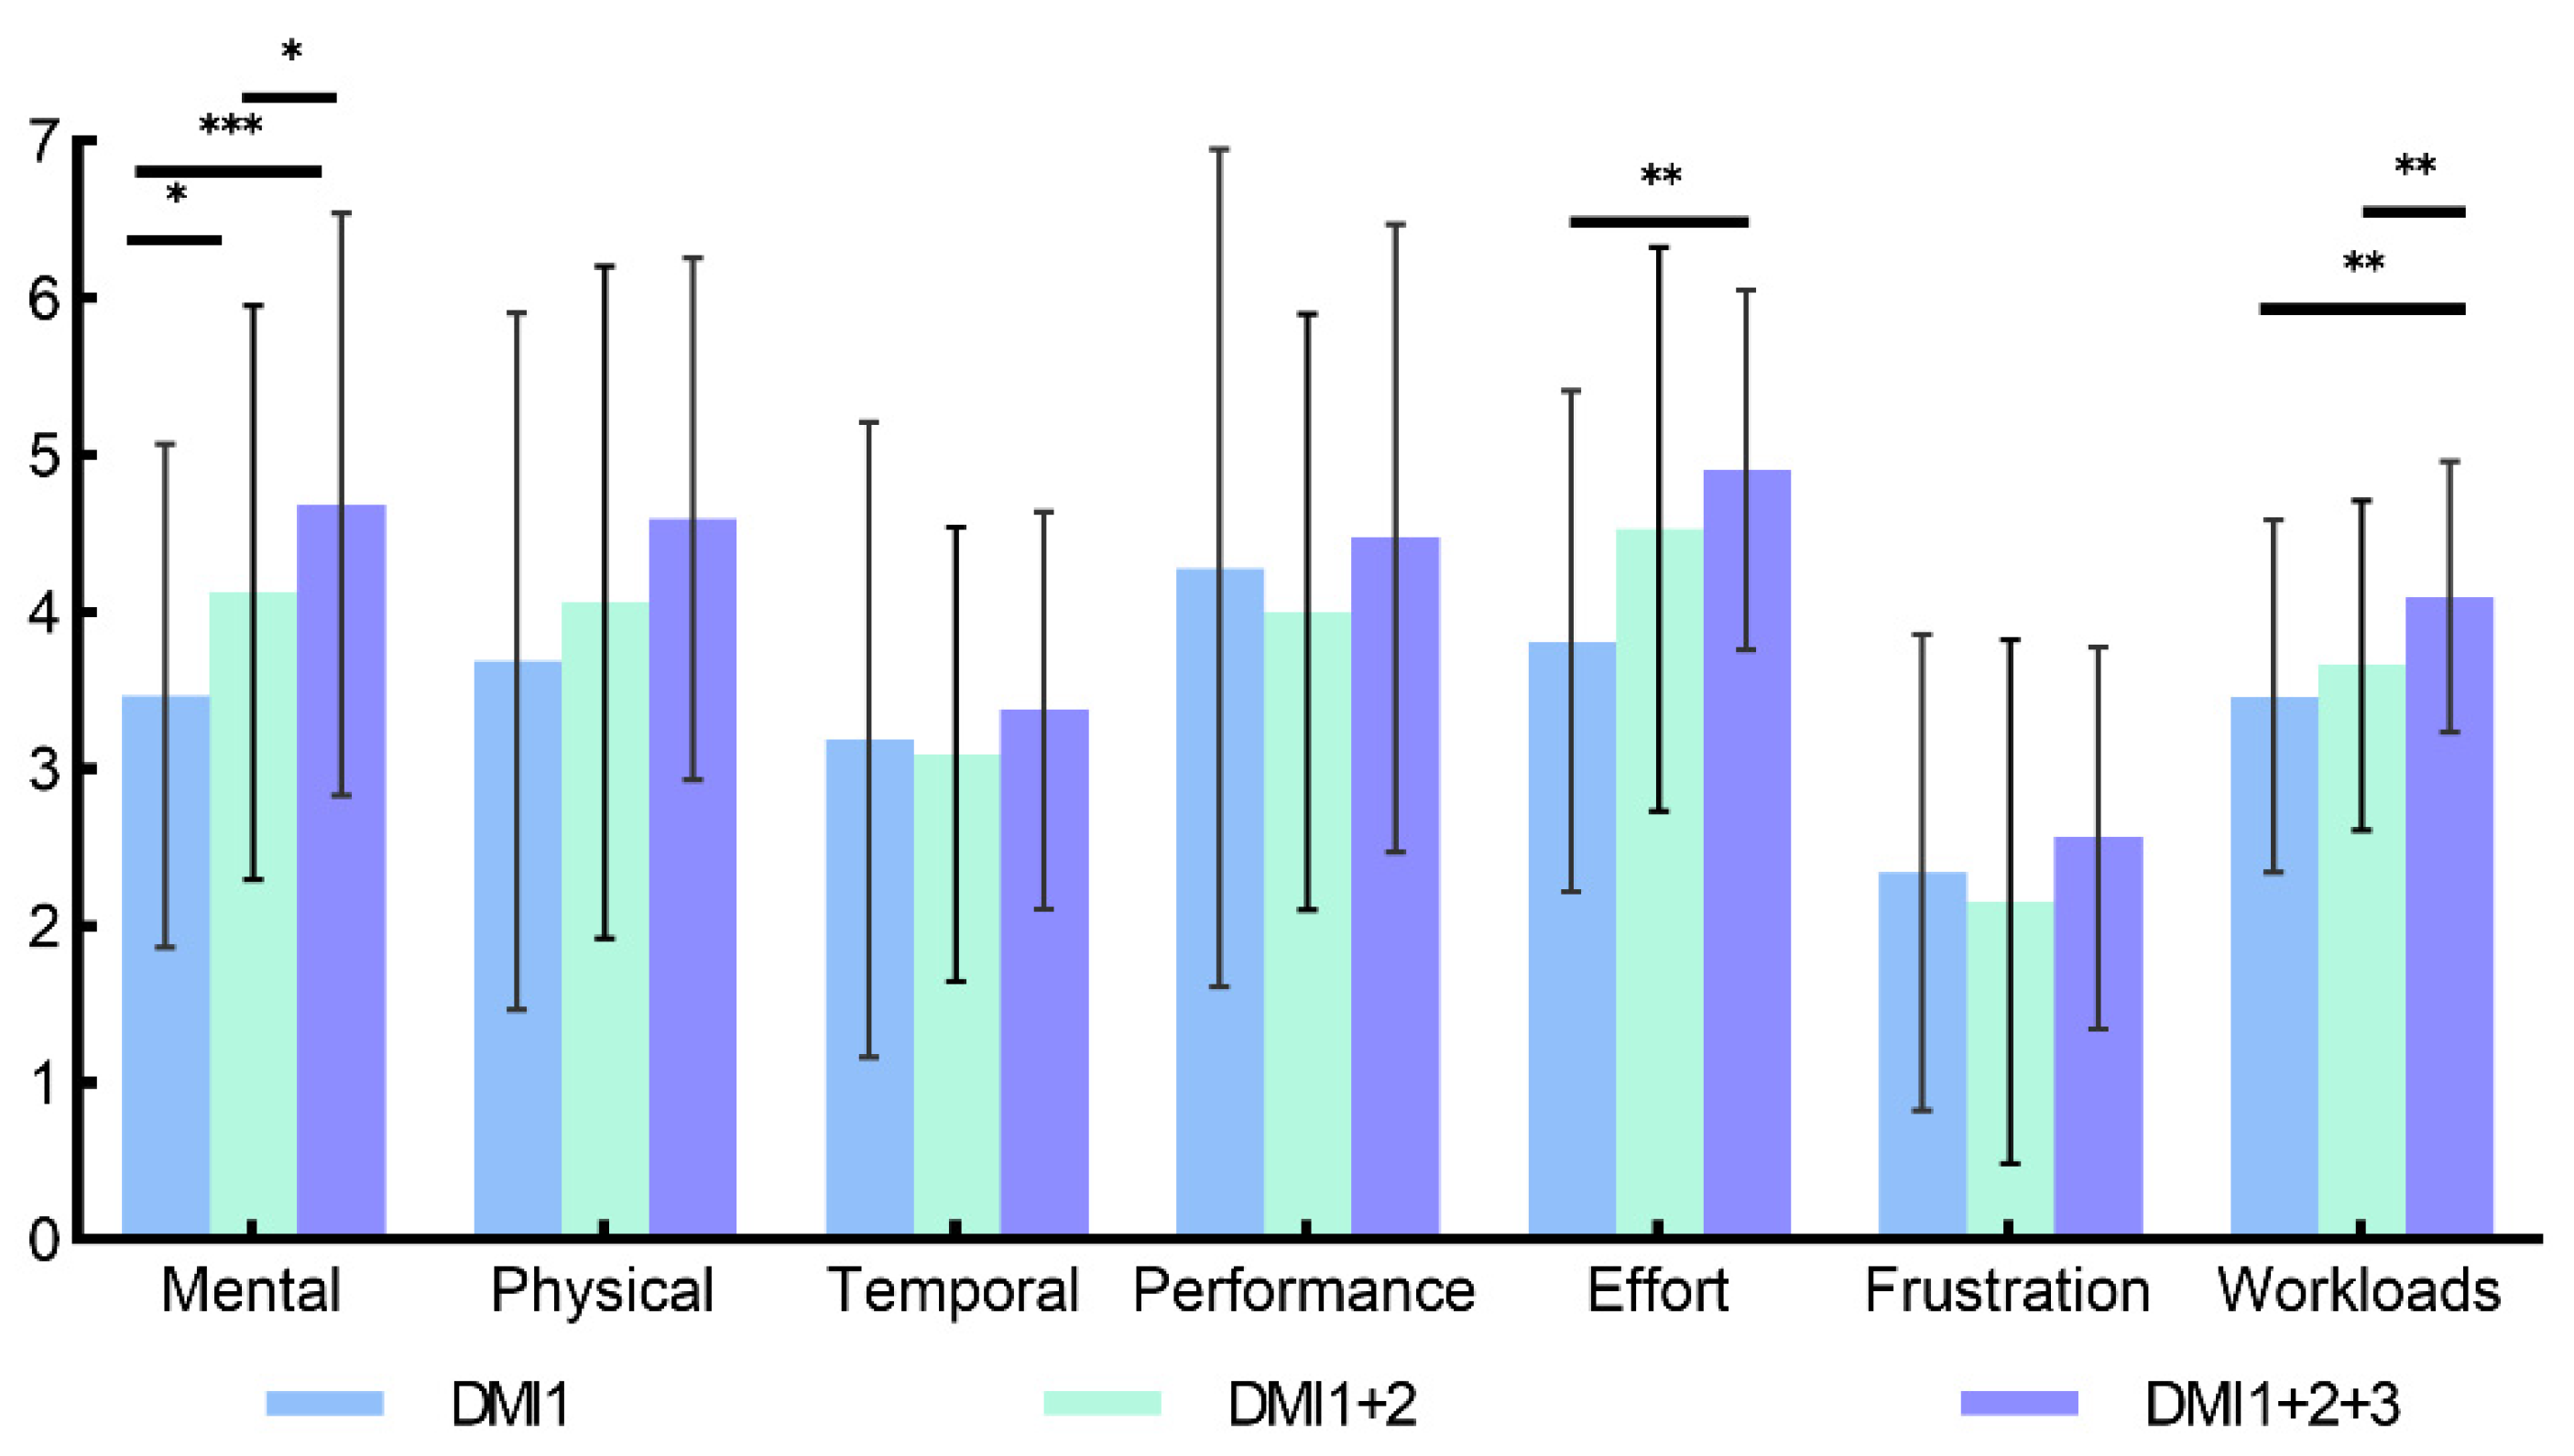
  • Workload was measured using the NASA Task Load Index (NASA-TLX), requiring participants to rate their workloads across the dimensions of mental demand, physical demand, temporal demand, performance, effort, and frustration [69];
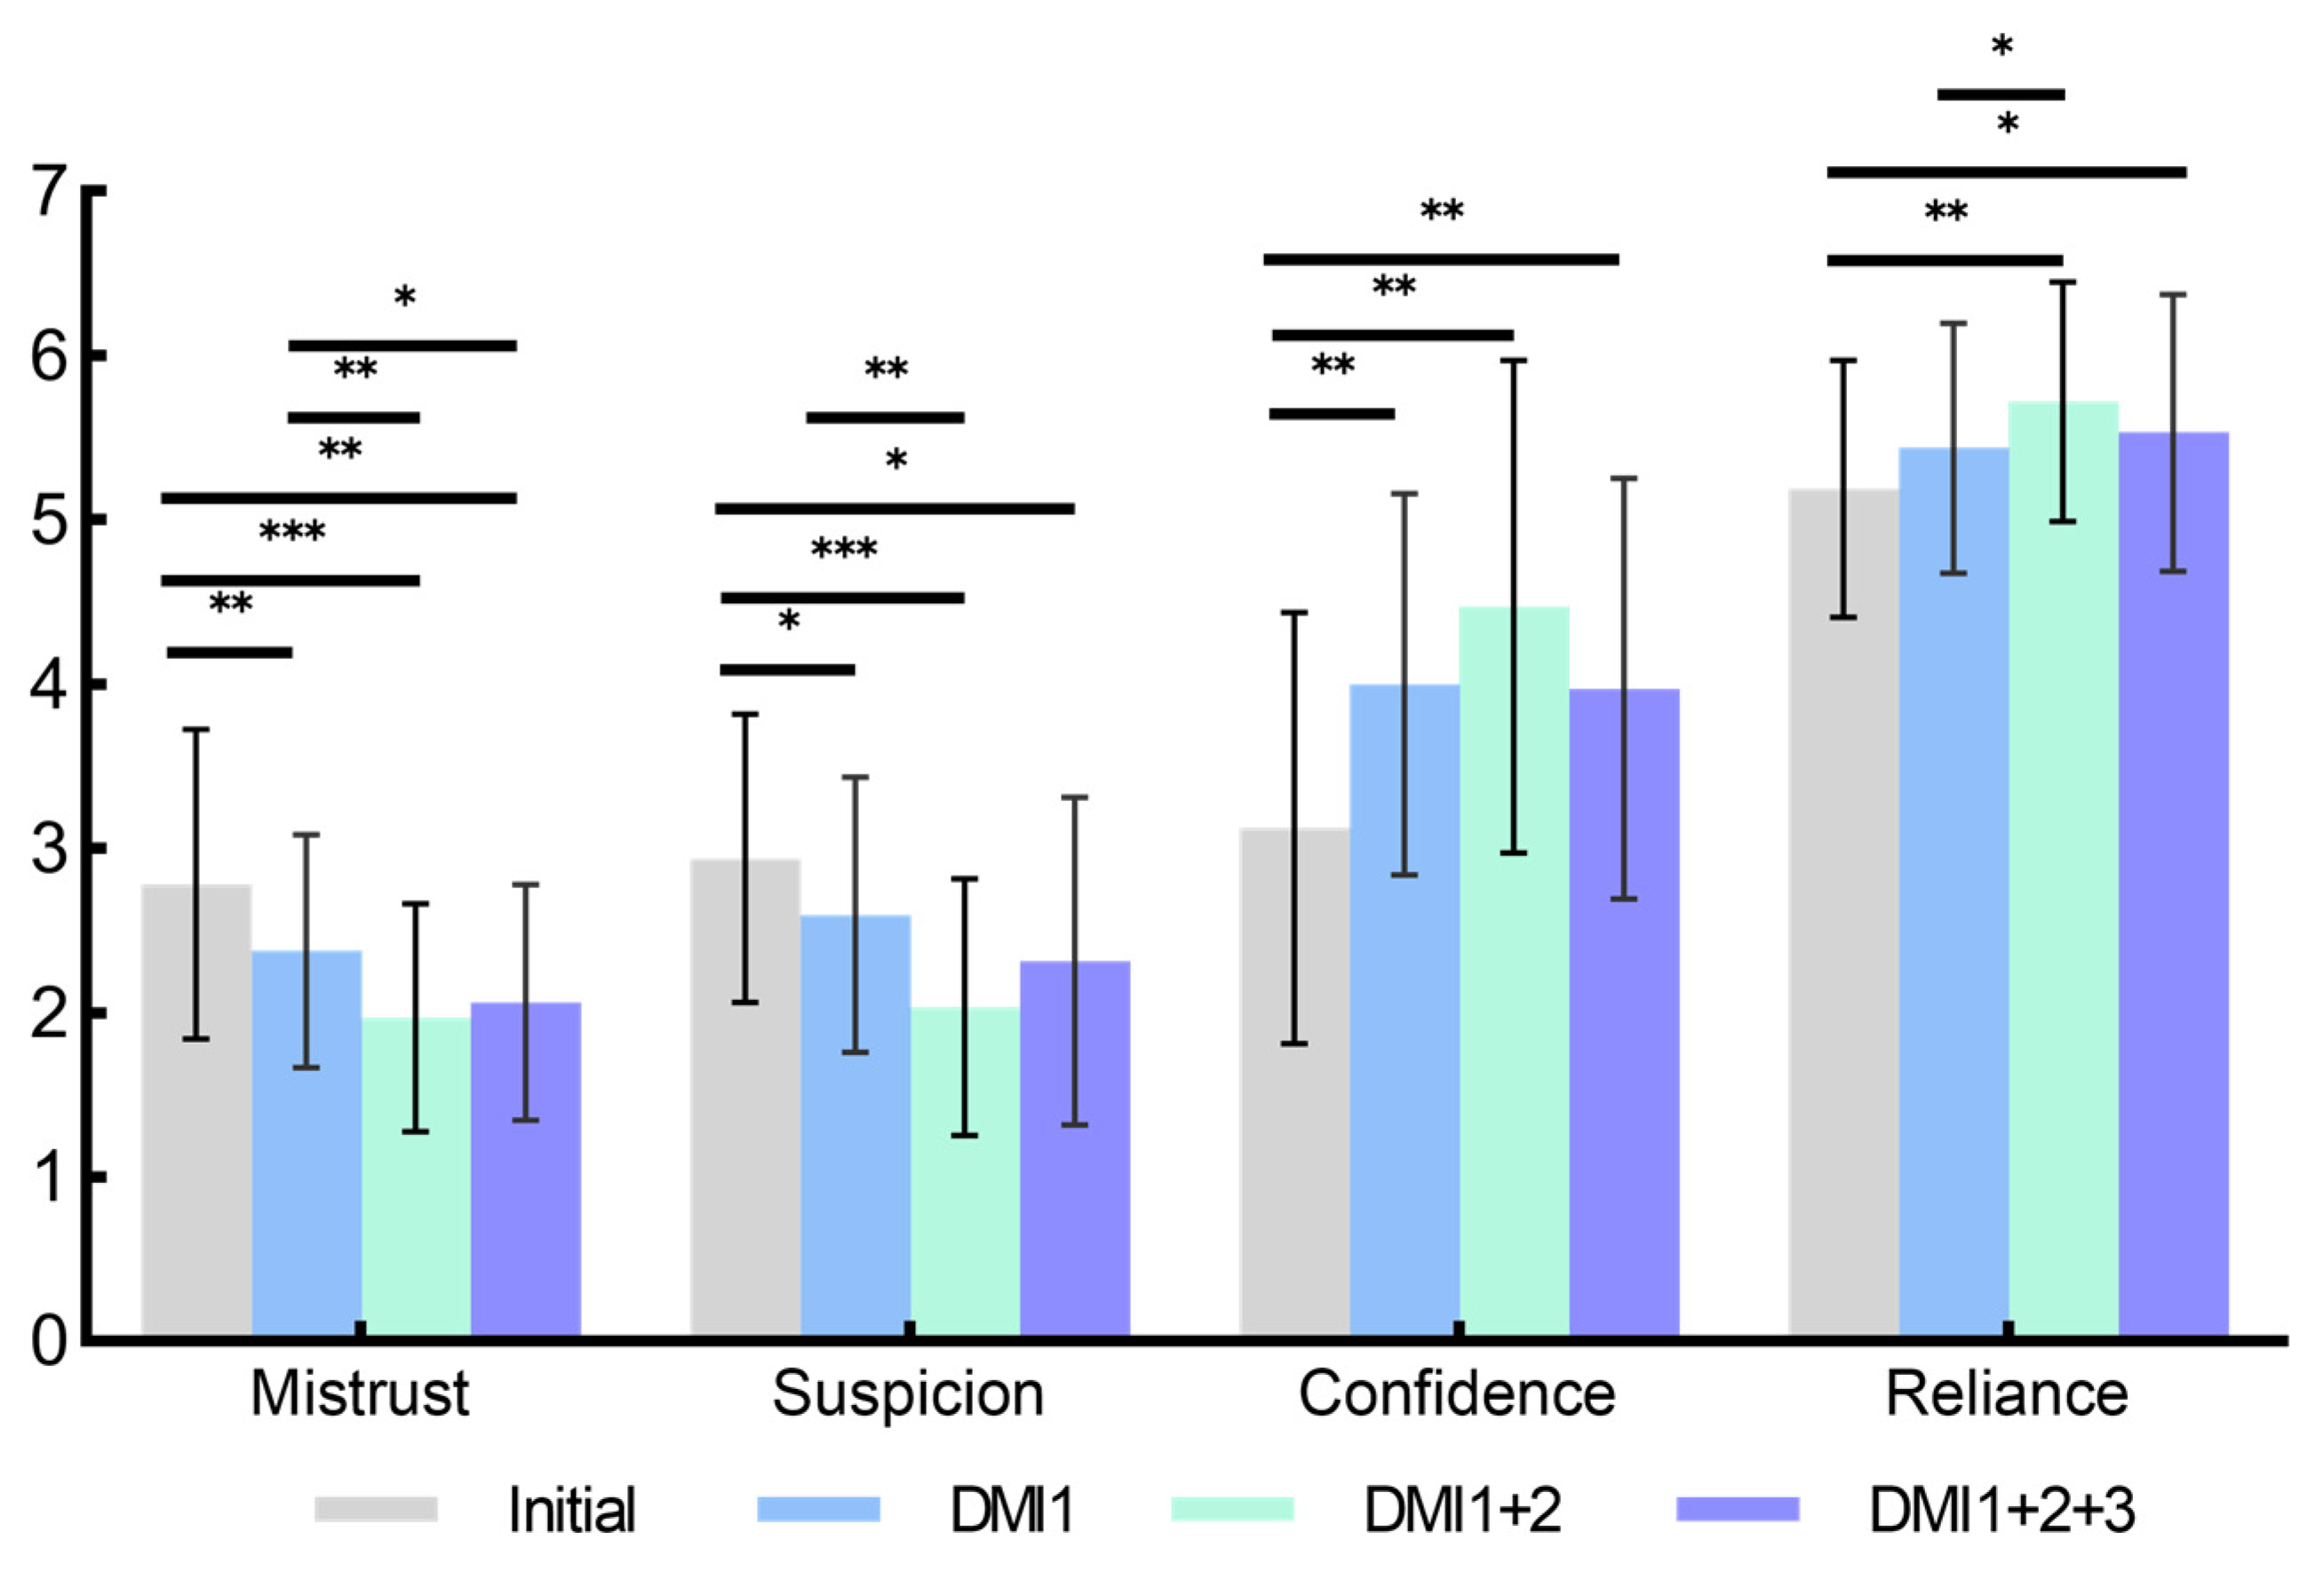
  • TiA was assessed using a seven-point Likert scale questionnaire based on the study of Jian et al. [70], encompassing four trust-related items: mistrust (“the system behaves in an underhanded manner”), suspicion (“I am suspicious of the system’s intended action or outputs”), confidence (“I am confident in the system”), and reliance (“the system is reliable”);
  • SoA was evaluated using a seven-point Likert scale questionnaire designed to assess the perceived degree of control during the task [71];
  • Acceptance was assessed using a seven-point Likert scale questionnaire comprising nine items: (1) useful to useless, (2) pleasant to unpleasant, (3) bad to good, (4) nice to annoying, (5) effective to redundant, (6) stimulating to displeasing, (7) aiding to no help, (8) unwelcome to welcome, and (9) enhancing vigilance to sleep-inducing. Scores for items 1, 2, 4, 5, 7, and 9 were reversed during calculation [72];
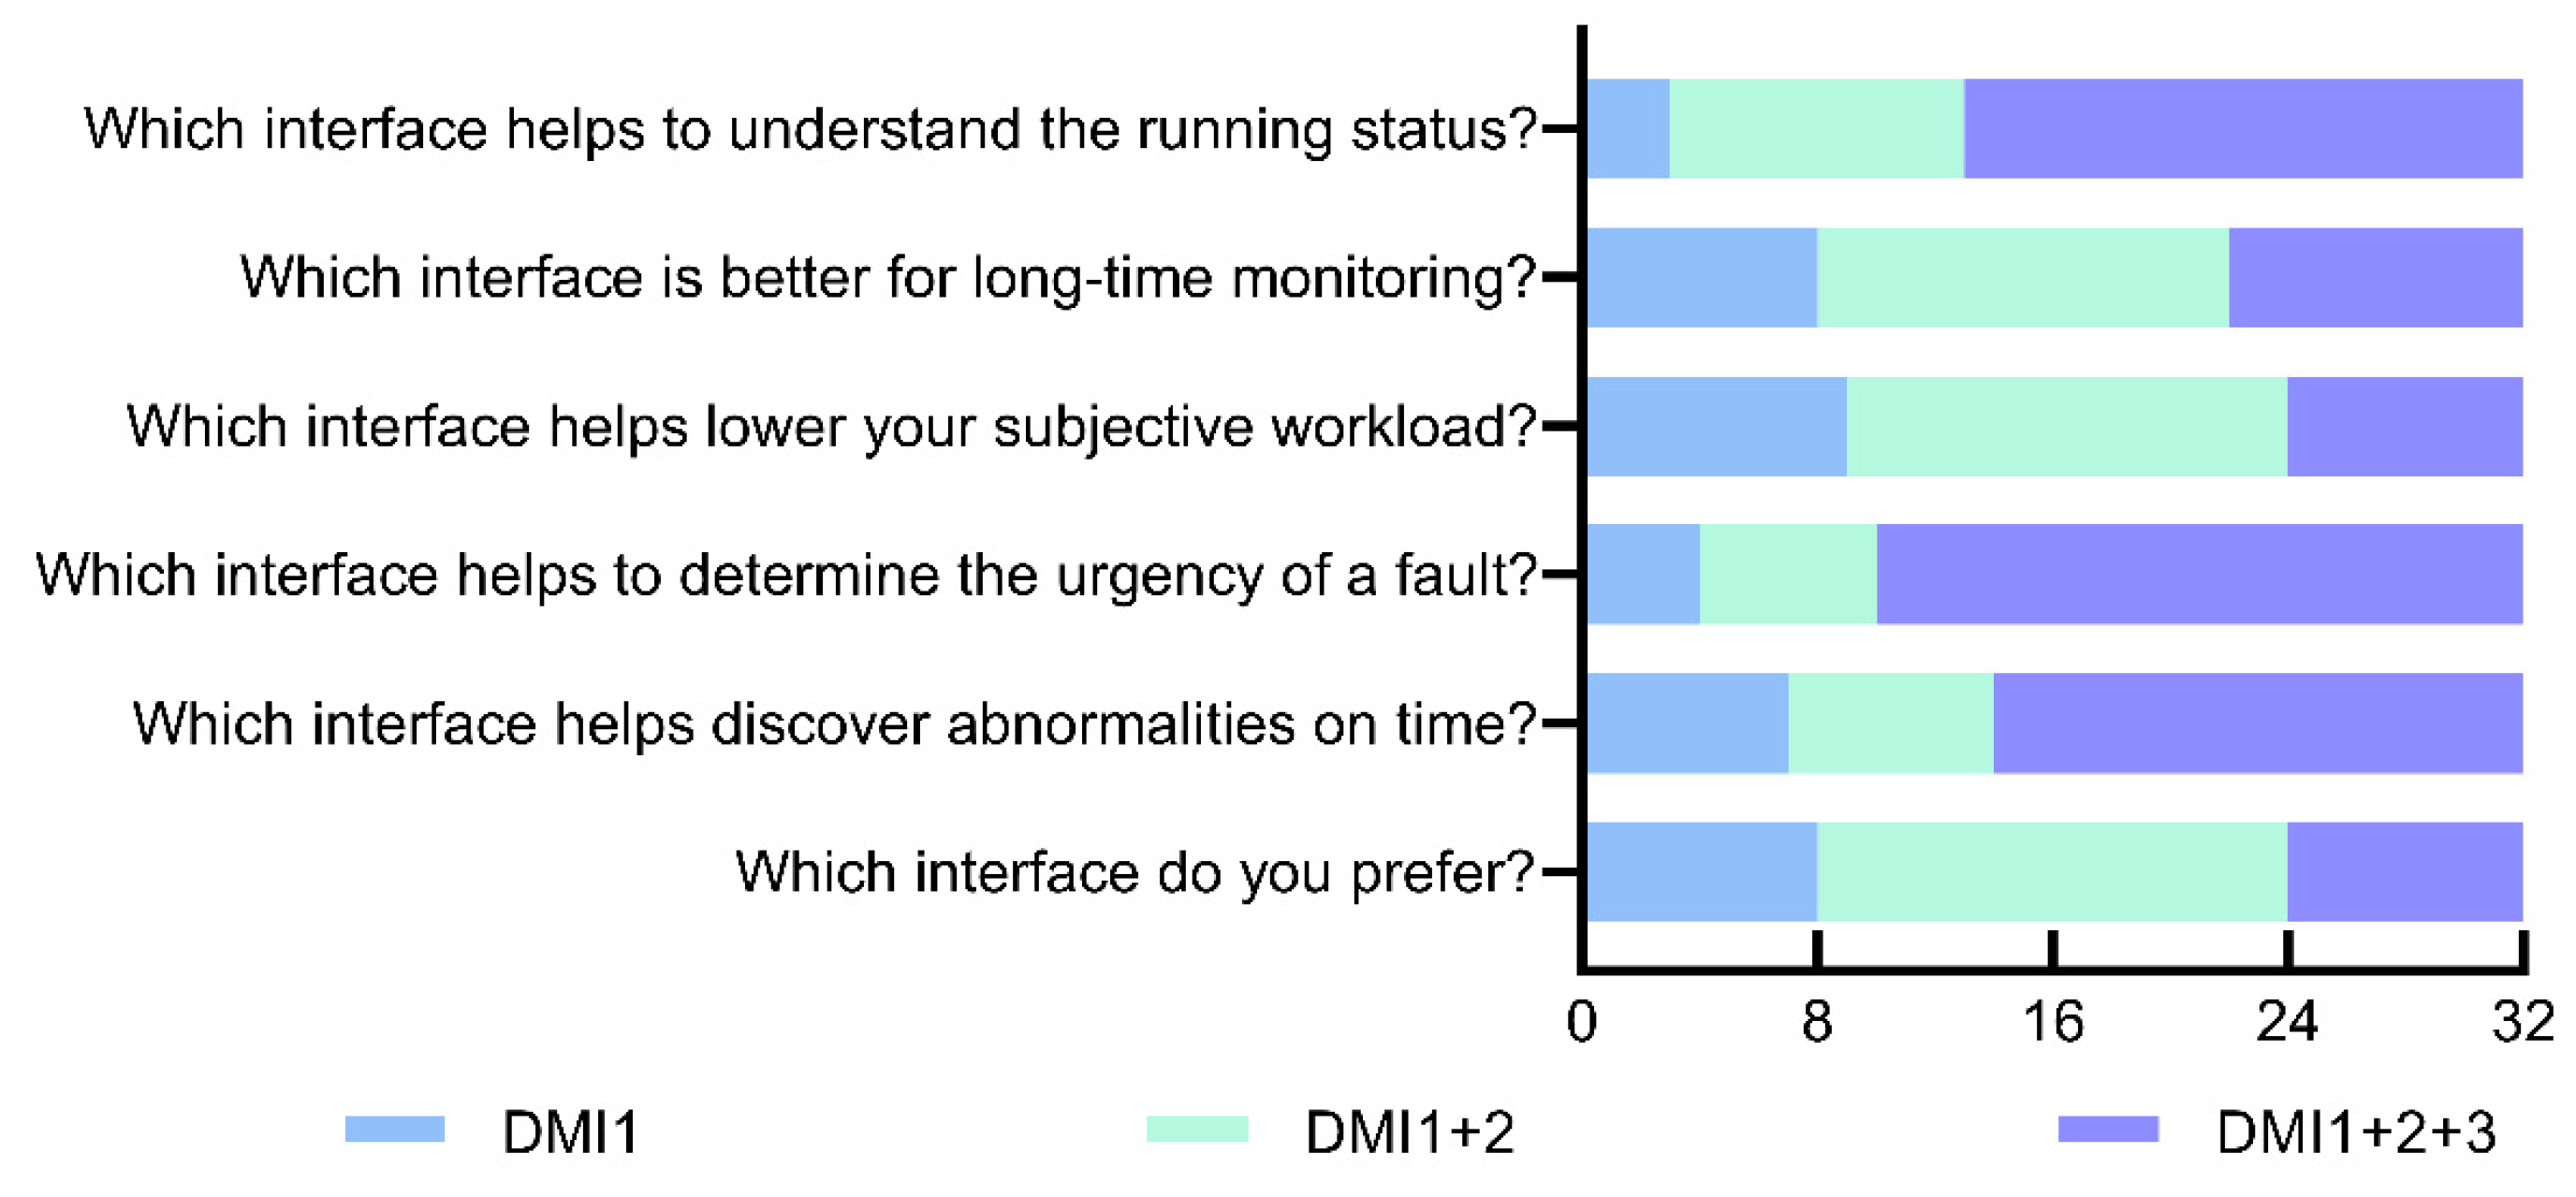
  • Interface preference was collected using a questionnaire based on the study of Wu et al. [73] and encompassed six aspects: preference for overall design; timeliness of alarm detection; judgment of alarm urgency; workload introduced by judging alarm levels; support for prolonged monitoring; and support for parameter trend perception. Participants ranked all DMIs in order of preference based on the questionnaire after completing all tests.

2.5.4. Visual Behavior Indicators

Considering the impact of transparency on the characteristics of interactions involving the entire DMI, we referred to interface studies to define the entire DMI as the region of interest [74,75]. In addition, referring to previous studies on eye-tracking experiments in railway driving, we selected three visual behavioral metrics: total fixation duration, total fixation count, and average fixation duration [76]. Finally, considering the interference of interface information with driving tasks and the impact of driving fatigue, we also included the visual behavioral metrics of saccade count and average pupil diameter [77,78].

2.6. Procedure

Each participant was required to complete one trial using each interface, resulting in a total of three driving experiments. To control for potential learning effects, participants used each interface in a randomized order. An individual driving task consisted of traversing eight sections between stations and lasted for approximately 30 min. It has been demonstrated that continuous train driving for over 20 min reduces driver vigilance levels and causes fatigue [79]. The experimental steps are as follows.
  • Information gathering: Upon arrival, participants were provided with an informed consent form for the experiment. They then filled out basic demographic information, including age, gender, and visual acuity. They also completed a questionnaire to report their experiences with daily driving tasks and their perceptions of the initial TiA and SoA based on the baseline DMI design;
  • Training: Participants received training to ensure their familiarity with the operation of the simulated driving platform and the practical tasks of the experiment, and they were subsequently tested to assess their proficiency;
  • Fatigue confirmation and eye tracker calibration: Before commencing the experiment, participants completed the KSS questionnaire to assess fatigue levels, and it was ensured that they were below level 3. We assisted participants in performing eye tracker calibration using a five-point method;
  • Experimental test: Participants engaged in tasks based on the GoA-2 mode that involved both autonomous driving supervision and manual tasks. During each driving test, participants were subjected to two SAGAT measurements and encountered five non-routine events. Throughout the experiment, SAGAT interrogations and occurrences of non-routine events were randomly ordered to avoid the memory effect, and participants were not informed of their frequency. Even if participants did not answer SAGAT questions or failed in fault operations, the experimental tasks were not interrupted. A railway training expert remotely monitored and evaluated compliance with operations;
  • Single questionnaire and intergroup breaks: Upon the completion of each trial, participants were required to fill out the NASA-TLX, TiA, SoA, and acceptance questionnaires, and they were then provided with a minimum of one hour of rest to ensure that their subsequent KSS questionnaire results did not fall below 3, as well as to allow them to recover and maintain adequate alertness for the next phase of the experiment;
  • Post-experiment interview: After completing three trials, participants underwent semi-structured interviews in conjunction with the interface preference questionnaire to gather feedback on their actual operational experience and interface preferences. These interviews provided insights into their subjective perceptions and preferences.

3. Results

All data were first analyzed for validity. Railroad experts assessed the validity of SAGAT using video playback, questionnaire validity was evaluated using Cronbach’s alpha, and visual behavior was retained for analysis only if the collection accuracy was greater than 90%. We then conducted statistical analyses using IBM SPSS Statistics (version 27.0, Armonk, NY, USA, IBM Corp.) software to examine the relationship between the independent variable (the three levels of interface transparency conditions) and dependent variables (SA, operational performance, visual behavior, and other questionnaire results). We used the Shapiro–Wilk test to assess the normality of the data for the dependent variables. Because each participant experienced all three transparency interface conditions, if the dependent variables met the criteria of a normal distribution, we used one-way repeated-measures analysis of variance (ANOVA) and conducted Bonferroni post hoc tests for pairwise comparisons. For Mauchly’s test of sphericity, the sig value under the hypothetical sphericity was used as the significance test result. Otherwise, the sig value was corrected using the Greenhouse–Geisser method. When the assumption of normality was not met, we used the Friedman test as an alternative method. In the presence of significant differences, post hoc comparisons were performed using the Wilcoxon signed-rank test. All effects were tested against a significance level of p < 0.05.

3.1. Situational Awareness

The overall SA level ( x 2(2) = 2.075, p   = 0.354) and comprehension level (SA2) ( x 2(2) = 2.608, p   = 0.271) did not exhibit significant differences. However, significant differences were observed in the perception level (SA1) ( x 2(2) = 10.169, p = 0.006) and the prediction level (SA3) ( x 2(2) = 7.505, p   = 0.023). Specifically, the perception levels of DMI1 ( p   = 0.003) and DMI1+2 ( p   = 0.027) were significantly higher than that of DMI1+2+3. Moreover, the prediction level of DMI1+2+3 was significantly higher than that of DMI12 ( p   = 0.018). These findings are illustrated in Figure 6, which presents the specific paired comparison of SA levels. These results indicate that enhancing transparency significantly improves the predictive aspect of SA while also influencing its perceptual aspect.

3.2. Operational Performance

All participants completed all operational tasks, and Table 2 presents their performance results. There was no significant difference in reaction time for unexpected breaks among different interface transparency conditions ( F (1.74, 54.01) = 1.648, p = 0.205, η p 2 = 0.050). However, significant differences were observed in performance for common braking ( F (1.81, 56.09) = 36.30, p < 0.001, η p 2 = 0.539) and emergency braking (F(1.99, 61.72) = 46.11, p < 0.001, η p 2 = 0.598) among different transparency levels. Figure 7 illustrates the pairwise comparison results of performance using the three interface conditions. These results demonstrate the significant assistance provided by high transparency in operational performance.

3.3. Questionnaire Results

After adjusting for item consistency, validity testing was conducted using Cronbach’s analysis, and it was confirmed that all questionnaires met the validity criteria (Cronbach’s alpha > 0.7). The detailed questionnaire results are provided in Table 3.

3.3.1. Trust in Automation

Figure 8 illustrates the paired comparison results between initial TiA and TiA with different levels of transparency. Increasing transparency significantly enhanced TiA in terms of mistrust ( x 2(3) = 26.689, p < 0.001), suspicion ( x 2(3) = 17.988, p < 0.001), confidence ( x 2(3) = 13.802, p = 0.003), and reliability ( x 2(3) = 9.417, p = 0.024). Moreover, the transparency levels all exhibited an increasing trend: DMI1 noticeably enhanced initial TiA, and DMI1+2 further improved TiA compared with DMI1; however, DMI1+2+3 significantly decreased TiA compared with DMI1+2.

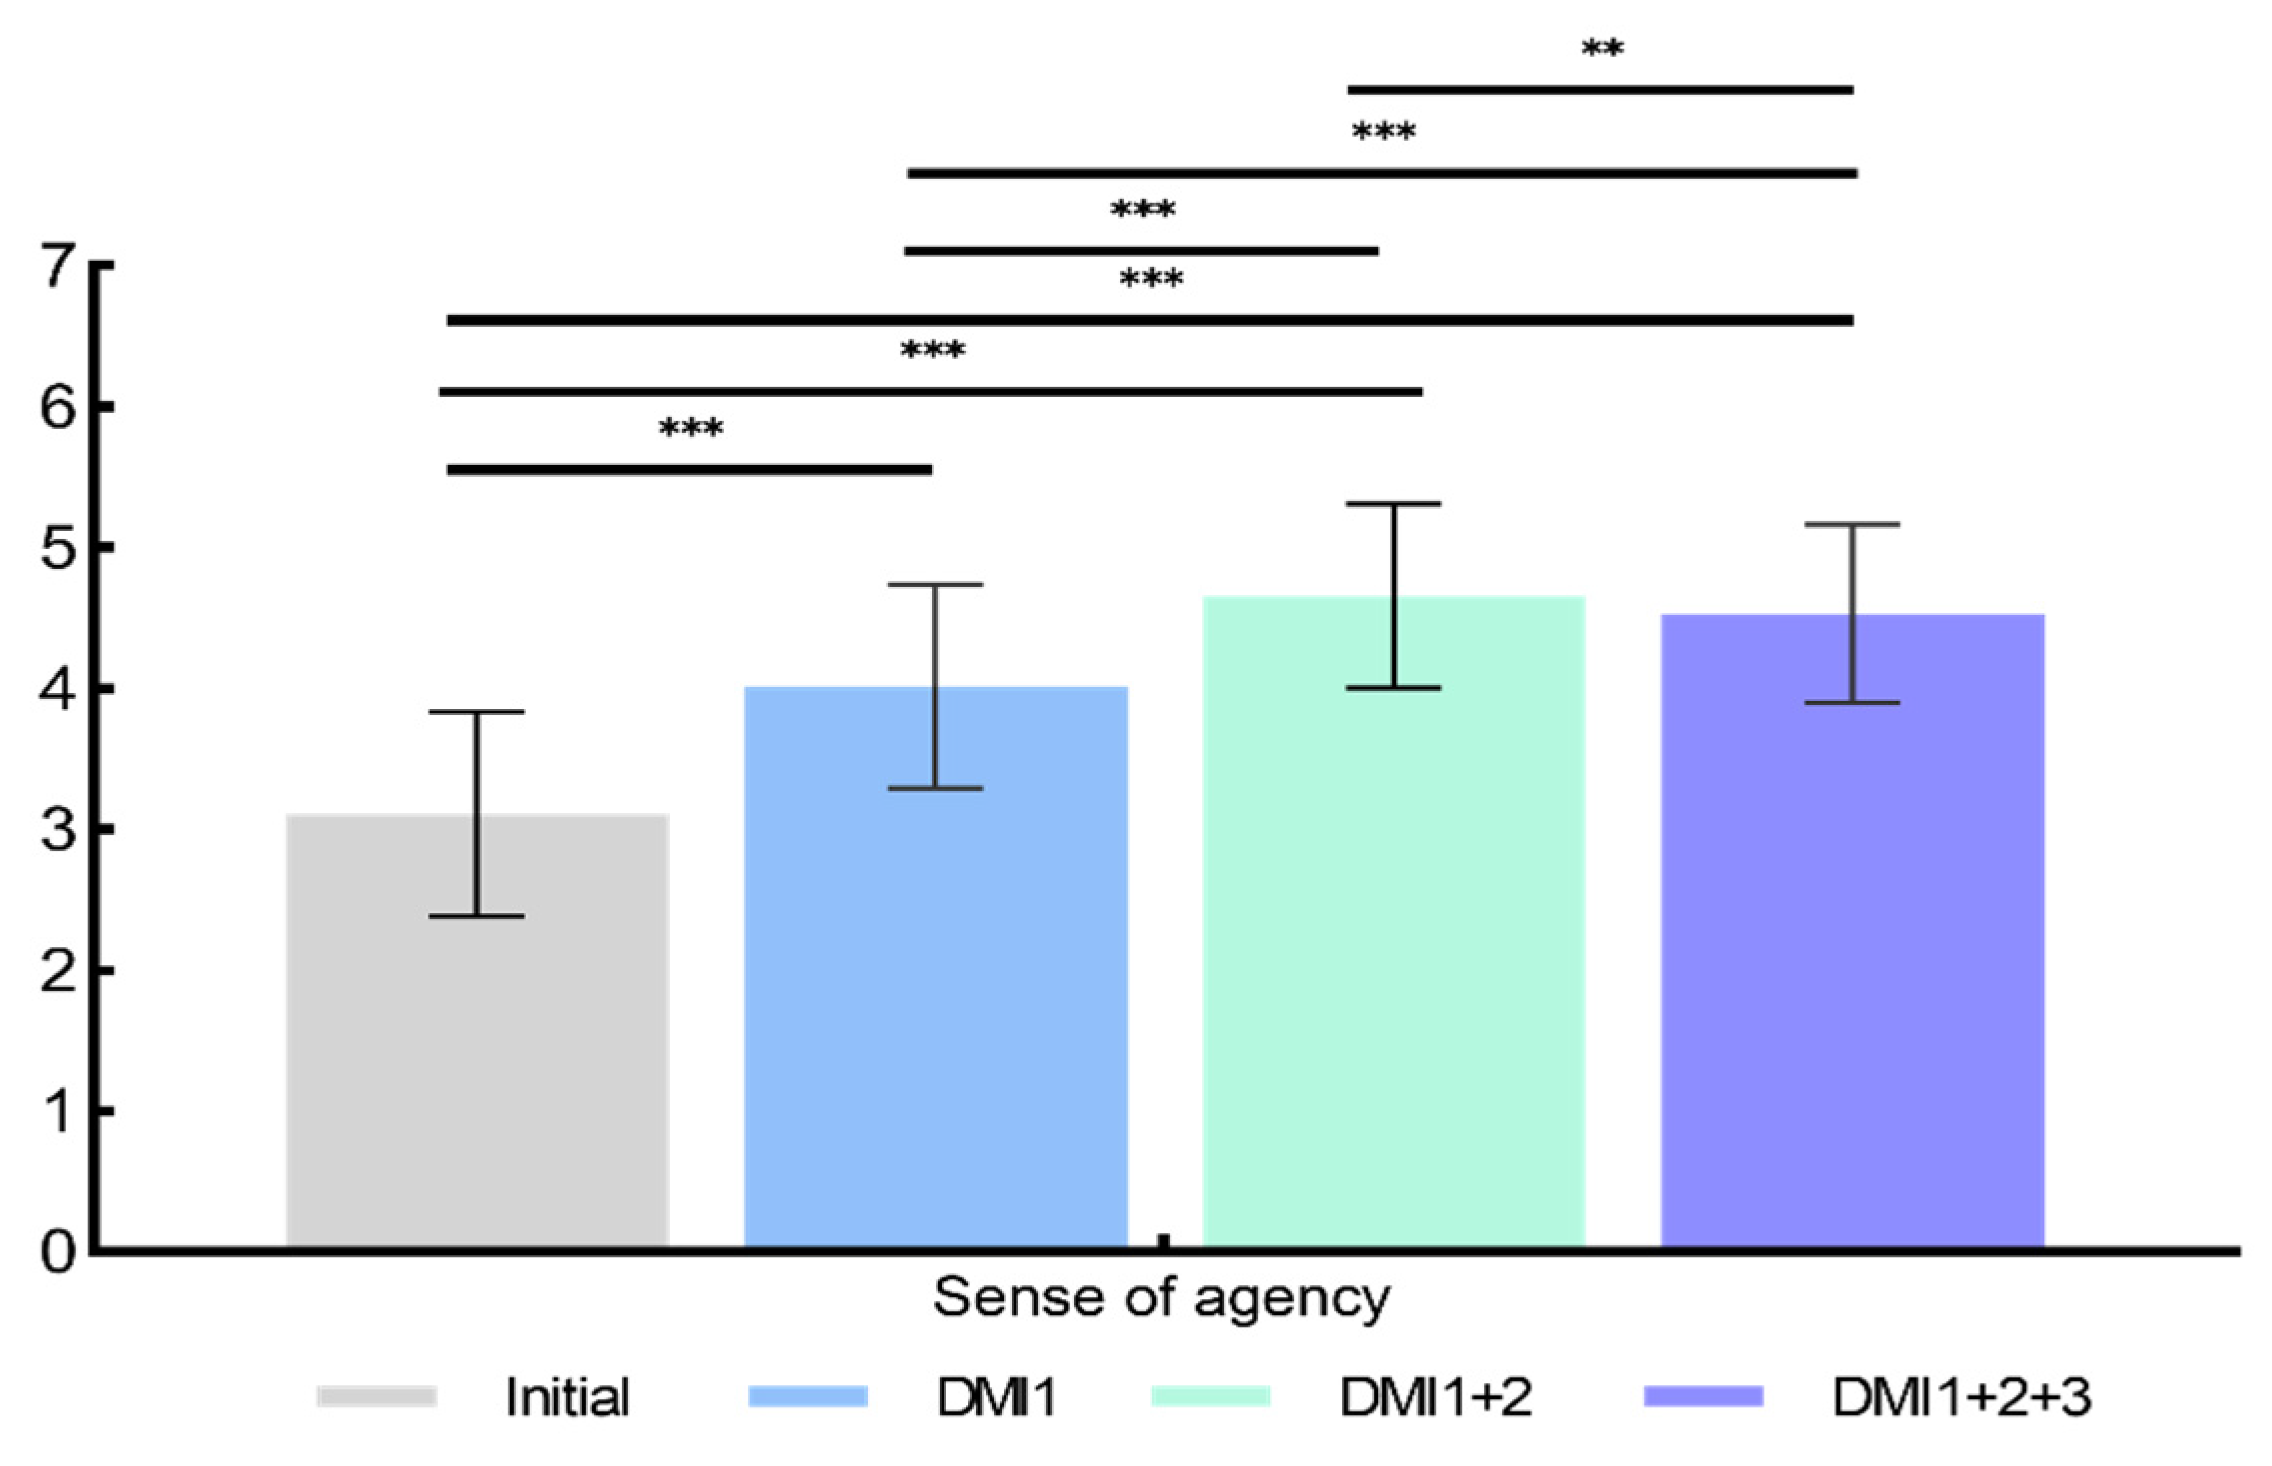
3.3.2. Sense of Agency

Figure 9 illustrates the paired comparison between initial SoA and SoA at different transparency levels. The results indicated that there was a significant increase in initial SoA with increased transparency ( x 2(3) = 55.500, p < 0.001), with DMI1+2 exhibiting the highest level, followed by DMI1+2+3.

3.3.3. Acceptance

There were significant differences in participants’ acceptance of DMI at different levels of transparency ( F (1.91, 59.17) = 4.331, p = 0.019, η p 2 = 0.123). Participants showed significantly higher acceptance levels for DMI1+2 than DMI1 ( p = 0.043).

3.3.4. NASA-TLX

We conducted separate analyses using the Friedman test to analyze the mean values and individual dimensions of NASA-TLX. The results demonstrated that interface transparency had a significant impact on average workload ( x 2(2) = 9.066, p = 0.011), mental demand ( x 2(2) = 19.592, p < 0.001), and effort ( x 2(2) = 7.549, p = 0.004). However, there was no significant effect on physical demand ( x 2(2) = 5.830, p = 0.054), temporal demand ( x 2(2) = 2.205, p = 0.332), performance evaluation ( x 2(2) = 4.145, p = 0.126), or frustration level ( x 2(2) = 3.973 p = 0.137). Figure 10 illustrates the pairwise comparison results among the three interface conditions. These results indicate that a high level of transparency increased participants’ workload across multiple dimensions.

3.3.5. Interface Preferences

Figure 11 presents the subjective preference results, with DMI1+2+3 considered to be the most effective level of transparency for understanding operational status, detecting faults, and assessing the urgency of faults; despite this, it received fewer preference selections than DMI1+2. Conversely, DMI1+2 was perceived to significantly reduce workload and to be suitable for prolonged monitoring, and it received the highest number of preference selections. DMI1 was found to somewhat decrease workload, but it had the weakest performance in fault detection and long-term monitoring and so, consequently, obtained the fewest preference choices.

3.4. Visual Behavior

We analyzed five eye-tracking metrics for the 28 participants whose sampling accuracy met the criteria. The results are summarized in Table 4. Using the Friedman test or a one-factor repeated-measures ANOVA, significant differences were observed in total saccade count ( x 2(2) = 27.714, p < 0.001), total fixation count ( F (1.77, 47.70) = 141.72, p < 0.001, η p 2 = 0.84), and total fixation duration ( F (1.57, 42.43) = 48.29, p < 0.001, η p 2 = 0.64). However, no significant differences were found in average fixation duration ( x 2(2) = 1.207, p = 0.55) or average pupil diameter ( x 2(2) = 4.07, p = 0.13). Post hoc comparisons revealed that the total saccade count, total fixation count, and total fixation duration were significantly higher when using DMI1+2+3 than when using DMI1 ( p < 0.001) and DMI1+2 ( p < 0.001). These results indicate that while participants’ visual behaviors did not significantly differ between the low- and moderate-transparency conditions, high transparency significantly affected visual behavior.

4. Discussion

This study aimed to incorporate transparency into the design of urban rail transit driving interfaces to improve driving performance. In this study, we conducted a simulated driving experiment using eye-tracking technology to investigate the effects of enhanced transparency on SA, workloads, TiA, SoA, and operational performance. We also measured participants’ acceptance and preferences for different levels of transparency.

4.1. Benefits of Appropriate Transparency

Appropriately improving transparency significantly enhances TiA and SoA, leading to the highest task satisfaction and optimal preferences. Compared with the initial condition with DMI1, the increase in TiA and SoA supported H1, aligning with previous research findings [37,80]. Post-interviews with operators revealed that continuous feedback on automation status aided operators in adjusting their states and visual attention, including by allowing them to focus on achieving the recommended speed when deceleration was explained during exiting and by enabling them to pay attention to platform safety when reminded about approaching platforms. The addition of explanatory feedback further enhanced TiA and SoA and increased acceptance, supporting H2. This finding is consistent with results from studies on road traffic [40,81]. Our study indicates that increasing explanations also benefits the rail transit domain, allowing operators to effectively clarify their operational status and evaluate the appropriateness of temporary train adjustments. The preference for DMI1+2 is intriguing, as experimental results indicated that it did not significantly improve SA or operational performance compared with other DMIs and that it even exhibited a high consistency in terms of workload assessment and visual behavior with DMI1. However, this result is consistent with the conclusion of Wright et al. [33], who found that even when transparency information does not directly support task performance, it influences human perceptions of automation, thus supporting H5. This result is not surprising, as higher TiA [82,83] and SoA [84] have been widely demonstrated to effectively enhance task satisfaction. Higher TiA indicates that operators confidently delegate control to the system, while higher SoA suggests that they do not feel constrained by the transfer of control and thus engage in more proactive voluntary actions, effectively improving satisfaction through a positive interaction between the system and operators.
Overall, our experiment positively responds to the initial concept of train driving interface design proposed by Jansson et al. [38]. Furthermore, our study, which is integrated with an automation background, extends upon theirs by adding explanations and clarifications for train adjustment functions, further improving operator states. This result encourages the further exploration of human–machine interactions in train systems. Train driving is mentally taxing work that is often described as being “trapped in the system”, and the long-term monotonous environment has a significant impact on psychological well-being [85]. In addition to assistance with actual driving tasks, operators need psychological support. Similar references have been made regarding tasks such as maritime navigation, where operators express the desire to “converse with the system”, thereby improving their psychological state [86].

4.2. Advantages of High Transparency

High transparency significantly aids in interface reminder fault handling. Operators demonstrate unparalleled performance in takeover tasks when using DMI1+2+3, whether it involves initial common braking or subsequent emergency braking operations, thus supporting H3 regarding partial takeover. This can be attributed to the predictability established by high transparency in fault detection. With predictive information, participants focus their attention on the interface before takeover, and the high-transparency interface provides assistance similar to a two-stage takeover [87,88]. We also observed that high transparency aids in the rapid execution of emergency braking following common braking, which underscores the potential of high transparency in maintaining stability during secondary accident operations, which is crucial in real accident scenarios, as the failure and fatality rates of secondary accidents are nearly twice those of normal events [89]. It is worth mentioning that the experiment simplistically sets the braking mode as “input (system prompt)–output (braking)”, but in actual scenarios, it should follow an “input–processing–output” mode. Different faults require special handling, and an adequate cognitive response time should be reserved for takeover operations [90]. Therefore, the potential of continuous steady-state takeover with high transparency deserves further exploration in conjunction with the actual tasks of the train.
In addition, in potential fault scenarios, none of the operators engaged in additional braking actions due to uncertain information prompts, which is inconsistent with the findings of Xu et al. [91] for automated vehicle driving. We believe this discrepancy can be attributed to the specific context of rail transit, in which takeover reminders are not as frequent as in automotive scenarios, and because operators do not have additional non-driving related tasks, they have more attentional resources, allowing them to carefully assess whether to engage in braking actions.
Based on these two analyses, we can identify several advantages of transparency. However, it is worth noting that the implementation of high-transparency design relies on sophisticated algorithms and hardware integration to provide more accurate distance predictions and stable data transmission. Nonetheless, the design logic of presenting all relevant railway operational information to the driver can limit system flexibility and optimization quality, especially under high-traffic conditions [51]. Based on the findings of this study, we propose using a modular design strategy to optimize the distribution and transmission efficiency of information while maintaining the required level of transparency.
In this framework, fixed elements of the track, such as switch positions and station distances, can be encapsulated within the train system and transmitted directly via location sensors, thereby reducing dependence on real-time calculations from the central system. This approach enhances data transmission efficiency and stability. Additionally, for temporary operational adjustments, such as short-term speed changes or route modifications, a generic processing module can be designed to be flexible enough for different rail scenarios, thus reducing the complexity of development and maintenance while ensuring quick and consistent responses to operational changes.
For rare but critical fault events that require rapid responses, we propose the development of dedicated calculation and analysis modules. These modules would provide precise real-time assessments, supporting quick decision-making by the driver. Furthermore, considering potential overlaps with existing interface information, we propose that the modular design includes functions for information filtering and integration, unifying the logic for presenting information from different sources. This would reduce redundancy and prevent information overload, thereby minimizing driver distraction. Finally, to address the adaptation challenges posed by this new interface, we recommend training programs to help drivers adapt to the updated system and its modules effectively.

4.3. Limitations of High Transparency

The limitations of high transparency are reflected in SoA, TiA, and workload, supporting H4. However, the SA results are somewhat unexpected and do not support H3 regarding SA.
First, the highest transparency level affected SoA. This is not surprising; in fact, every vehicle has its own “personality”, and subtle design changes can lead to different behaviors in response to acceleration and braking by the main controller [92]. Moreover, operators showed a significant increase in scanning and fixation frequencies when using DMI1+2+3. Repeated interactions with automated systems can influence individuals’ experiences of their behaviors and choices [93]. However, the B737 MAX 8 accidents demonstrate that the weakening of pilots’ sense of control due to high transparency levels can have serious consequences [94]. Considering this factor, if a high-transparency design is to be further applied, effective training is needed to help operators understand the characteristics and adapt their behaviors accordingly.
Second, the highest level of transparency did not result in sustained TiA gains, which is inconsistent with current transparency research focused on road traffic [81,95]. However, it is worth noting that railway traffic operators differ from road traffic operators in that they are more specialized and undergo more training, meaning that differences in driver characteristics may lead to drastically different results [96]. For example, DMI1+2+3 underwent more design modifications than the other DMIs, but due to their extensive training and familiarity with the original driving mode, the operators exhibited lower acceptance, with unconscious subjective preferences influencing implicit TiA and dominating operator perspectives [97]. Additionally, TiA levels under the highest level of transparency may be influenced by workload; as their cognitive load increases, operators may become more prone to fatigue and anxiety [80] and perceive there to be higher levels of risk [98]. However, TiA is not a binary, all-or-nothing quantity, and high TiA levels can translate into dependence [99]. Therefore, regarding DMI1+2+3, TiA cannot be fully defined as a limitation of high transparency.
Third, high-transparency interfaces have been found to consume more cognitive resources and impose a higher workload than low-transparency ones, which aligns with the findings of Guznov et al. [31]. This highlights the inherent limitations of transparency design: increasing transparency provides additional information that requires extra cognitive resources to process. However, in train driving, a slight increase in cognitive demand can mitigate the adverse effects of a sustained monitoring workload [60]. One potential design solution to address this issue is adaptive automation, in which the salience of information is based on its importance [100]. This allows the attention of the operator to shift from tunnel monitoring to transparency information when it is most likely to be necessary, such as when automation reliability or performance significantly declines [101,102,103].
Finally, with the assistance of comprehensive predictive information, the highest transparency level significantly enhanced projection-level SA. However, this improvement comes at the cost of reducing perceptual-level SA. The incomplete assistance in SA contradicts the findings of several previous studies [29,33,104]. However, this can be reasonably explained by the significant impact of high transparency on visual behavior and SoA. High transparency alters the task mode from a single-task to a concurrent-task form, leading to a redistribution of attention, which is particularly evident when using DMI1+2+3, where fixation counts significantly increase. This concurrent-task form may affect the attention required to maintain SA. When participants used DMI1 and DMI1+2, they still operated within the traditional single-task mode of monitoring the tunnel, during which the interface merely served as an auxiliary driving aid. However, DMI1+2+3 required participants to invest additional attention in supervising the interface, constituting a concurrent-task form of simultaneously monitoring the tunnel and the interface. This finding resonates with the results of Tatasciore et al. [102], indicating that parallel tasks affect the benefits of transparency. Moreover, the mechanism for generating SA in trains has been proven to be different from other transportation operation domains. Train operations involve more routine and less engaging segments than road driving [92], and trains do not require navigating through continuously changing dynamic environments, as ships do [105]. SA generation largely relies on individuals’ long-term memory representations and schemata, and a decrease in SoA indicates that operators’ driving habits have been affected.
Further interviews with participants revealed a deeper limitation of SA: the influence of operators’ cognitive mechanisms for initially acquiring information. Figure 12 depicts a perceptual cycle model based on participant responses. The Neisser [106] perceptual cycle model was employed to describe the cognitive decision-making process. Participants interacted with the environment to modify schemas [107] based on environmental information, generating bottom-up interactions, while adjusting behaviors and observing the world top-down based on their understanding of the situation [108]. The world can be either latent or directly accessible [109]; in this experiment, participants actively observed latent information such as tunnel curvature, signal lights, or nearby platforms nearby, while directly accessible information mainly consisted of system prompts, with DMI1+2+3 being more direct and comprehensive than the other DMIs. Under normal circumstances, operators should repeatedly observe the environment, combine it with their experience, and make behavioral judgments (e.g., feeling significant curvature ahead, sensing the need to slightly reduce speed, checking if the speed is abnormal, confirming that the system is making appropriate adjustments, and indicating that there are no anomalies). However, in the case of high transparency, operators unconsciously rely on the system to directly provide the cognitive resources needed to take action (e.g., “the system prompts no anomalies, so I confidently maintain the automatic driving mode”) and reduce their expectations of obtaining latent information by observing the road surface (e.g., “I just need to wait for the system to give me the next instruction”), leading to a decrease in perceptual-level SA due to insufficient environmental exploration. Therefore, as Plant and Stanton [108] asserted, information for special task participants, such as highly skilled pilots, should be directly actionable without articulation of the schema. Similarly, urban rail transit operators do not require excessive predictive explanations; the system only needs to provide key actions, and they can then rely on their experience to actively judge and adjust their status.
Considering the limitations of the participants’ experiences and the experimental setting, we also interviewed six railroad domain experts, using their practical task experience to uncover two additional effects of high transparency limiting SA generation:
  • Excessive and non-intuitive perceptual elements: Current designs include multiple elements—such as speed, distance, and time—that require the driver to switch cognitive focus and perform additional calculations, thus hindering the efficiency of higher-level SA. One possible way to solve this problem is to choose generic perceptual element types and show the deviation between the current condition and the planned condition [110].
  • Continuous, indiscriminate information input leading to cognitive conflict: Some elements in the high-transparency design, such as station distance and track junction position, can be intuitively observed by the driver and do not require predictive information. Displaying all information simultaneously leads to sensory overload, limiting the effective generation of SA [111]. To address this shortcoming, goal-directed task analysis can be used to mitigate cognitive overload and enhance SA generation by prioritizing and filtering information based on the importance of the task [112].
Van de Merwe et al. [25] described the process of designing transparency as a “free lunch” in reference to the ability to mitigate some of the effects of automation failures without reducing its benefits. However, as reflected upon by Jamieson et al. [93], in light of the B737 MAX 8 accidents, this “free lunch” comes at a high cost. Despite the evident enhancement of automation takeover performance, high transparency inevitably increases workload, undermines trust and SoA, and, most importantly, affects the generation of SA.

4.4. Limitations and Future Research

Several limitations should be considered when interpreting the results of this study. First, the experimental environment, though functional, lacked careful consideration of realistic train dynamics and comprehensive visual stimuli due to its simplified design. This may have affected the ecological validity of the findings. While input from railway experts helped refine the study design, future research should leverage advanced simulation technologies to replicate more realistic operational scenarios, facilitating a more accurate evaluation of transparency design in complex and varied urban rail transit contexts.
Second, this study relied on questionnaires and eye-tracking data to measure drivers’ task perception and performance. While these methods are informative, they cannot dynamically capture real-time fluctuations in participants’ perceptions during tasks. Future research should explore the use of real-time data collection tools, such as sliding scales or continuous rating interfaces, to monitor evolving perceptions. Furthermore, integrating physiological metrics (e.g., heart rate variability) with eye-tracking data and retrospective evaluations supported by video playback could improve the accuracy and depth of insights into driver responses.
Third, this study included 32 participants, a sample size consistent with that included in previous research and that is sufficient for statistical analysis. However, the relatively small sample size may limit the generalizability of the findings. Future research should aim to include larger and more diverse participant groups to enhance the robustness and applicability of the results across different user populations.
Additionally, this study primarily explored transparency design in a single-line urban rail transit scenario, which does not fully encompass the complexity of real-world operations. Diverse traffic conditions and challenges, such as door malfunctions and track failures, were beyond the scope of this research. Masanori Yoshida et al. [113] found that traffic complexity significantly influences drivers’ cognitive understanding of DMI cues and their SA, so expanding future research to include varied and complex scenarios would improve the understanding and applicability of transparency design.
In summary, while this study has provided foundational insights into transparency design for urban rail transit, addressing these limitations through dynamic data collection, larger participant samples, realistic simulation environments, and comprehensive scenario coverage will enable the development of more applicable DMI systems.

5. Conclusions

This study has provided an initial exploration of the concept of transparency in the design of urban rail transit interfaces through an experimental approach. First, the proposed framework significantly improved psychological perceptions of automation, including TiA, SoA, and acceptance, through continuous feedback and explanations. This validates the effectiveness of transparency design and underscores the value of “continuous companionship” in human–machine cooperation. Second, high transparency demonstrated clear advantages in improving takeover performance by providing essential situational context; however, it also presented challenges, including increased workload and reduced SA in monotonous automated tasks, revealing the dual impact of transparency on task performance. Addressing these challenges requires a careful calibration of transparency levels to match task demands and operator capacity. In the future, we will select meaningful predictions, reduce unnecessary “disturbances”, and assist participants in achieving a balance between psychological perception and task performance in a manner of “constant companionship without disturbances”.

Author Contributions

T.D.: Conceptualization, Methodology, Formal analysis, Writing—Original Draft. J.Z.: Validation, Supervision, Project administration, Funding acquisition. D.Y.: Investigation, Visualization, Validation. R.L.: Validation, Investigation, Software. S.H.: Validation, Resources. W.W.: Validation, Investigation, Software. C.J.: Conceptualization, Writing—Review and Editing, Project administration. All authors have read and agreed to the published version of the manuscript.

Funding

This work was supported by the National Key R&D Program of China (grant number: 2022YFB4301202-20); the National Natural Science Foundation of China (grant number: 52175253); the Natural Science Foundation of Sichuan Province of China (grant number 22NSFSC0865); and the Degree and postgraduate education and teaching reform project of Southwest Jiaotong University (grant number YJG5-2022-Y038).

Data Availability Statement

Data will be made available on request.

Conflicts of Interest

Author Wenyi Wu was employed by the company Beijing Aerospace Measurement & Control Technology Co., Ltd. The remaining authors declare that the research was conducted in the absence of any commercial or financial relationships that could be construed as a potential conflict of interest.

References

  1. Moccia, L.; Allen, D.W.; Laporte, G.; Spinosa, A. Mode boundaries of automated metro and semi-rapid rail in urban transit. Public Transp. 2022, 14, 739–802. [Google Scholar] [CrossRef]
  2. Su, S.; Wang, X.; Cao, Y.; Yin, J. An Energy-Efficient Train Operation Approach by Integrating the Metro Timetabling and Eco-Driving. IEEE Trans. Intell. Transp. Syst. 2020, 21, 4252–4268. [Google Scholar] [CrossRef]
  3. Diab, E.; Shalaby, A. Metro transit system resilience: Understanding the impacts of outdoor tracks and weather conditions on metro system interruptions. Int. J. Sustain. Transp. 2020, 14, 657–670. [Google Scholar] [CrossRef]
  4. Yuan, W.; Frey, H.C. Potential for metro rail energy savings and emissions reduction via eco-driving. Appl. Energy 2020, 268, 114944. [Google Scholar] [CrossRef]
  5. Bai, Y.; Cao, Y.; Yu, Z.; Ho, T.K.; Roberts, C.; Mao, B. Cooperative Control of Metro Trains to Minimize Net Energy Consumption. IEEE Trans. Intell. Transp. Syst. 2020, 21, 2063–2077. [Google Scholar] [CrossRef]
  6. Song, H.; Liu, J.; Schnieder, E. Validation, verification and evaluation of a Train to Train Distance Measurement System by means of Colored Petri Nets. Reliab. Eng. Syst. Saf. 2017, 164, 10–23. [Google Scholar] [CrossRef]
  7. Hasanzadeh, S.; Zarei, S.F.; Najafi, E. A Train Scheduling for Energy Optimization: Tehran Metro System as a Case Study. IEEE Trans. Intell. Transp. Syst. 2023, 24, 357–366. [Google Scholar] [CrossRef]
  8. Amendola, A.; Barbareschi, M.; De Simone, S.; Mezzina, G.; Moriconi, A.; Saragaglia, C.L.; Serra, D.; De Venuto, D. A real-time vital control module to increase capabilities of railway control systems in highly automated train operations. Real-Time Syst. 2023, 59, 636–661. [Google Scholar] [CrossRef]
  9. Carvajal-Carreño, W.; Cucala, A.P.; Fernández-Cardador, A. Fuzzy train tracking algorithm for the energy efficient operation of CBTC equipped metro lines. Eng. Appl. Artif. Intell. 2016, 53, 19–31. [Google Scholar] [CrossRef]
  10. Rjabovs, A.; Palacin, R. The influence of system design-related factors on the safety performance of metro drivers. Proc. Inst. Mech. Eng. Part F J. Rail Rapid Transit 2016, 231, 317–328. [Google Scholar] [CrossRef]
  11. Niu, K.; Fang, W.; Song, Q.; Guo, B.; Du, Y.; Chen, Y. An Evaluation Method for Emergency Procedures in Automatic Metro Based on Complexity. IEEE Trans. Intell. Transp. Syst. 2021, 22, 370–383. [Google Scholar] [CrossRef]
  12. Kim, H. Trustworthiness of unmanned automated subway services and its effects on passengers’ anxiety and fear. Transp. Res. Part F Traffic Psychol. Behav. 2019, 65, 158–175. [Google Scholar] [CrossRef]
  13. Zhao, J.; Yang, F.; Guo, Y.; Ren, X. A CAST-Based Analysis of the Metro Accident That Was Triggered by the Zhengzhou Heavy Rainstorm Disaster. Int. J. Environ. Res. Public Health 2022, 19, 10696. [Google Scholar] [CrossRef] [PubMed]
  14. Hyde, P.; Ulianov, C.; Liu, J.; Banic, M.; Simonovic, M.; Ristic-Durrant, D. Use cases for obstacle detection and track intrusion detection systems in the context of new generation of railway traffic management systems. Proc. Inst. Mech. Eng. Part F J. Rail Rapid Transit 2022, 236, 149–158. [Google Scholar] [CrossRef]
  15. Wang, A.; Guo, B.; Du, H.; Bao, H. Impact of Automation at Different Cognitive Stages on High-Speed Train Driving Performance. IEEE Trans. Intell. Transp. Syst. 2022, 23, 24599–24608. [Google Scholar] [CrossRef]
  16. Naweed, A.; Balakrishnan, G. Understanding the visual skills and strategies of train drivers in the urban rail environment. Work 2014, 47, 339–352. [Google Scholar] [CrossRef] [PubMed]
  17. Jansson, A.; Olsson, E.; Kecklund, L. Acting or reacting? A cognitive work analysis approach to the train driver task. In Rail Human Factors; Routledge: London, UK, 2017; pp. 40–49. [Google Scholar]
  18. Andreasson, R.; Jansson, A.A.; Lindblom, J. The coordination between train traffic controllers and train drivers: A distributed cognition perspective on railway. Cogn. Technol. Work 2019, 21, 417–443. [Google Scholar] [CrossRef]
  19. Wohleber, R.W.; Stowers, K.; Barnes, M.; Chen, J.Y.C. Agent transparency in mixed-initiative multi-UxV control: How should intelligent agent collaborators speak their minds? Comput. Hum. Behav. 2023, 148, 107866. [Google Scholar] [CrossRef]
  20. Carsten, O.; Martens, M.H. How can humans understand their automated cars? HMI principles, problems and solutions. Cogn. Technol. Work 2019, 21, 3–20. [Google Scholar] [CrossRef]
  21. Wohleber, R.W.; Calhoun, G.L.; Funke, G.J.; Ruff, H.; Chiu, C.Y.P.; Lin, J.; Matthews, G. The Impact of Automation Reliability and Operator Fatigue on Performance and Reliance. Proc. Hum. Factors Ergon. Soc. Annu. Meet. 2016, 60, 211–215. [Google Scholar] [CrossRef]
  22. Pokam, R.; Debernard, S.; Chauvin, C.; Langlois, S. Principles of transparency for autonomous vehicles: First results of an experiment with an augmented reality human–machine interface. Cogn. Technol. Work 2019, 21, 643–656. [Google Scholar] [CrossRef]
  23. Vössing, M.; Kühl, N.; Lind, M.; Satzger, G. Designing Transparency for Effective Human-AI Collaboration. Inf. Syst. Front. 2022, 24, 877–895. [Google Scholar] [CrossRef]
  24. Naweed, A. Investigations into the skills of modern and traditional train driving. Appl. Ergon. 2014, 45, 462–470. [Google Scholar] [CrossRef]
  25. van de Merwe, K.; Mallam, S.; Nazir, S. Agent Transparency, Situation Awareness, Mental Workload, and Operator Performance: A Systematic Literature Review. Hum. Factors 2022, 66, 180–208. [Google Scholar] [CrossRef] [PubMed]
  26. Scott, O.; Tracy, S.; Florian, J.; Peter, H.; Jessie, Y.C.C. Determinants of system transparency and its influence on trust in and reliance on unmanned robotic systems. In Unmanned Systems Technology XVI; SPIE: Bellingham, WA, USA, 2014; p. 90840E. [Google Scholar]
  27. Chen, J.Y.C.; Lakhmani, S.G.; Stowers, K.; Selkowitz, A.R.; Wright, J.L.; Barnes, M. Situation awareness-based agent transparency and human-autonomy teaming effectiveness. Theor. Issues Ergon. Sci. 2018, 19, 259–282. [Google Scholar] [CrossRef]
  28. Bhaskara, A.; Duong, L.; Brooks, J.; Li, R.; McInerney, R.; Skinner, M.; Pongracic, H.; Loft, S. Effect of automation transparency in the management of multiple unmanned vehicles. Appl. Ergon. 2021, 90, 103243. [Google Scholar] [CrossRef]
  29. Roth, G.; Schulte, A.; Schmitt, F.; Brand, Y. Transparency for a Workload-Adaptive Cognitive Agent in a Manned–Unmanned Teaming Application. IEEE Trans. Hum.-Mach. Syst. 2020, 50, 225–233. [Google Scholar] [CrossRef]
  30. Skraaning, G.; Jamieson, G.A. Human Performance Benefits of The Automation Transparency Design Principle: Validation and Variation. Hum. Factors 2019, 63, 379–401. [Google Scholar] [CrossRef] [PubMed]
  31. Guznov, S.; Lyons, J.; Pfahler, M.; Heironimus, A.; Woolley, M.; Friedman, J.; Neimeier, A. Robot Transparency and Team Orientation Effects on Human–Robot Teaming. Int. J. Hum. Comput. Interact. 2020, 36, 650–660. [Google Scholar] [CrossRef]
  32. Wright, J.L.; Chen, J.Y.C.; Barnes, M.J.; Hancock, P.A. The Effect of Agent Reasoning Transparency on Complacent Behavior: An Analysis of Eye Movements and Response Performance. Proc. Hum. Factors Ergon. Soc. Annu. Meet. 2017, 61, 1594–1598. [Google Scholar] [CrossRef]
  33. Wright, J.L.; Chen, J.Y.C.; Lakhmani, S.G. Agent Transparency and Reliability in Human–Robot Interaction: The Influence on User Confidence and Perceived Reliability. IEEE Trans. Hum. Mach. Syst. 2020, 50, 254–263. [Google Scholar] [CrossRef]
  34. Cohen-Lazry, G.; Borowsky, A.; Oron-Gilad, T. The impact of auditory continual feedback on take-overs in Level 3 automated vehicles. Transp. Res. Part F Traffic Psychol. Behav. 2020, 75, 145–159. [Google Scholar] [CrossRef]
  35. Tinga, A.M.; van Zeumeren, I.M.; Christoph, M.; van Grondelle, E.; Cleij, D.; Aldea, A.; van Nes, N. Development and evaluation of a human machine interface to support mode awareness in different automated driving modes. Transp. Res. Part F Traffic Psychol. Behav. 2023, 92, 238–254. [Google Scholar] [CrossRef]
  36. Wohleber, R.W.; Stowers, K.; Chen, J.Y.C.; Barnes, M. Effects of agent transparency and communication framing on human-agent teaming. In Proceedings of the 2017 IEEE International Conference on Systems, Man, and Cybernetics (SMC), Banff, AB, Canada, 5–8 October 2017; pp. 3427–3432. [Google Scholar]
  37. Sonoda, K.; Wada, T. Displaying System Situation Awareness Increases Driver Trust in Automated Driving. IEEE Trans. Intell. Veh. 2017, 2, 185–193. [Google Scholar] [CrossRef]
  38. Jansson, A.; Olsson, E.; Erlandsson, M. Bridging the gap between analysis and design: Improving existing driver interfaces with tools from the framework of cognitive work analysis. Cogn. Technol. Work 2006, 8, 41–49. [Google Scholar] [CrossRef]
  39. Körber, M.; Prasch, L.; Bengler, K. Why Do I Have to Drive Now? Post Hoc Explanations of Takeover Requests. Hum. Factors 2017, 60, 305–323. [Google Scholar] [CrossRef] [PubMed]
  40. Koo, J.; Kwac, J.; Ju, W.; Steinert, M.; Leifer, L.; Nass, C. Why did my car just do that? Explaining semi-autonomous driving actions to improve driver understanding, trust, and performance. Int. J. Interact. Des. Manuf. (IJIDeM) 2015, 9, 269–275. [Google Scholar] [CrossRef]
  41. Tinga, A.M.; Cleij, D.; Jansen, R.J.; van der Kint, S.; van Nes, N. Human machine interface design for continuous support of mode awareness during automated driving: An online simulation. Transp. Res. Part F Traffic Psychol. Behav. 2022, 87, 102–119. [Google Scholar] [CrossRef]
  42. Ruijten, P.A.M.; Terken, J.M.B.; Chandramouli, S.N. Enhancing Trust in Autonomous Vehicles through Intelligent User Interfaces That Mimic Human Behavior. Multimodal Technol. Interact. 2018, 2, 62. [Google Scholar] [CrossRef]
  43. Liu, W.; Li, Q.; Wang, Z.; Wang, W.; Zeng, C.; Cheng, B. A Literature Review on Additional Semantic Information Conveyed from Driving Automation Systems to Drivers through Advanced In-Vehicle HMI Just Before, During, and Right After Takeover Request. Int. J. Hum. Comput. Interact. 2023, 39, 1995–2015. [Google Scholar] [CrossRef]
  44. Lu, Z.; Zhang, B.; Feldhütter, A.; Happee, R.; Martens, M.; De Winter, J.C.F. Beyond mere take-over requests: The effects of monitoring requests on driver attention, take-over performance, and acceptance. Transp. Res. Part F Traffic Psychol. Behav. 2019, 63, 22–37. [Google Scholar] [CrossRef]
  45. Pipkorn, L.; Tivesten, E.; Dozza, M. It’s about time! Earlier take-over requests in automated driving enable safer responses to conflicts. Transp. Res. Part F Traffic Psychol. Behav. 2022, 86, 196–209. [Google Scholar] [CrossRef]
  46. Marti, P.; Jallais, C.; Koustanaï, A.; Guillaume, A.; Mars, F. Impact of the driver’s visual engagement on situation awareness and takeover quality. Transp. Res. Part F Traffic Psychol. Behav. 2022, 87, 391–402. [Google Scholar] [CrossRef]
  47. Chen, K.-T.; Chen, H.-Y.W.; Bisantz, A. Adding visual contextual information to continuous sonification feedback about low-reliability situations in conditionally automated driving: A driving simulator study. Transp. Res. Part F Traffic Psychol. Behav. 2023, 94, 25–41. [Google Scholar] [CrossRef]
  48. Ou, Y.-K.; Huang, W.-X.; Fang, C.-W. Effects of different takeover request interfaces on takeover behavior and performance during conditionally automated driving. Accid. Anal. Prev. 2021, 162, 106425. [Google Scholar] [CrossRef] [PubMed]
  49. Gold, C.; Damböck, D.; Lorenz, L.; Bengler, K. “Take over!” How long does it take to get the driver back into the loop? Proc. Hum. Factors Ergon. Soc. Annu. Meet. 2013, 57, 1938–1942. [Google Scholar] [CrossRef]
  50. Display, T.D.; Stjernstrm, R.; Borlv, E.; Olsson, E.; Sandblad, B. User-Centred Design of a Train Driver Display; Department of Information Technology, Uppsala University Sweden: Uppsala, Sweden, 2001. [Google Scholar]
  51. Panou, K.; Tzieropoulos, P.; Emery, D. Railway driver advice systems: Evaluation of methods, tools and systems. J. Rail Transp. Plan. Manag. 2013, 3, 150–162. [Google Scholar] [CrossRef]
  52. Saeed Tariq, U.; Alabi Bortiorkor, N.T.; Labi, S. Preparing Road Infrastructure to Accommodate Connected and Automated Vehicles: System-Level Perspective. J. Infrastruct. Syst. 2021, 27, 06020003. [Google Scholar] [CrossRef]
  53. He, R.; Ai, B.; Zhong, Z.; Yang, M.; Chen, R.; Ding, J.; Ma, Z.; Sun, G.; Liu, C. 5G for Railways: Next Generation Railway Dedicated Communications. IEEE Commun. Mag. 2022, 60, 130–136. [Google Scholar] [CrossRef]
  54. Getty, D.J.; Swets, J.A.; Pickett, R.M.; Gonthier, D. System Operator Response to Warnings of Danger: A Laboratory Investigation of the Effects of the Predictive Value of a Warning on Human Response Time. J. Exp. Psychol. Appl. 1995, 1, 19–33. [Google Scholar] [CrossRef]
  55. Tijerina, L.; Blommer, M.; Curry, R.; Swaminathan, R.; Kochhar, D.S.; Talamonti, W. An Exploratory Study of Driver Response to Reduced System Confidence Notifications in Automated Driving. IEEE Trans. Intell. Veh. 2016, 1, 325–334. [Google Scholar] [CrossRef]
  56. Wang, S.; Liu, Y.; Li, S.; Liu, Z.; You, X.; Li, Y. The effect of two-stage warning system on human performance along with different takeover strategies. Int. J. Ind. Ergon. 2023, 97, 103492. [Google Scholar] [CrossRef]
  57. Wright, J.L.; Chen, J.Y.C.; Barnes, M.J.; Hancock, P.A. Agent Reasoning Transparency’s Effect on Operator Workload. Proc. Hum. Factors Ergon. Soc. Annu. Meet. 2016, 60, 249–253. [Google Scholar] [CrossRef]
  58. Lyons, J.B.; Havig, P.R. Transparency in a Human-Machine Context: Approaches for Fostering Shared Awareness/Intent. In Proceedings of the Virtual, Augmented and Mixed Reality. Designing and Developing Virtual and Augmented Environments, Heraklion, Greece, 22–27 June 2014; Shumaker, R., Lackey, S., Eds.; Springer International Publishing: Cham, Switzerland, 2014; pp. 181–190. [Google Scholar]
  59. Tausch, A.; Kluge, A. The best task allocation process is to decide on one’s own: Effects of the allocation agent in human–robot interaction on perceived work characteristics and satisfaction. Cogn. Technol. Work 2022, 24, 39–55. [Google Scholar] [CrossRef]
  60. Dunn, N.; Williamson, A. Driving monotonous routes in a train simulator: The effect of task demand on driving performance and subjective experience. Ergonomics 2012, 55, 997–1008. [Google Scholar] [CrossRef]
  61. Olsson, N. A validation study comparing performance in a low-fidelity train-driving simulator with actual train driving performance. Transp. Res. Part F Traffic Psychol. Behav. 2023, 97, 109–122. [Google Scholar] [CrossRef]
  62. Zhang, W.; Wang, C.; Chen, N. Design and implementation of on-board human-machine interface for CBTC system. Railw. Signal. Commun. 2016, 52, 80–82. [Google Scholar]
  63. Wang, Y.; Sheng, K.; Niu, P.; Chu, C.; Li, M.; Jia, L. A comprehensive analysis method of urban rail transit operation accidents and safety management strategies based on text big data. Saf. Sci. 2024, 172, 106400. [Google Scholar] [CrossRef]
  64. Endsley, M.R.; Selcon, S.J.; Hardiman, T.D.; Croft, D.G. A Comparative Analysis of Sagat and Sart for Evaluations of Situation Awareness. Proc. Hum. Factors Ergon. Soc. Annu. Meet. 1998, 42, 82–86. [Google Scholar] [CrossRef]
  65. Golightly, D.; Ryan, B.; Dadashi, N.; Pickup, L.; Wilson, J.R. Use of scenarios and function analyses to understand the impact of situation awareness on safe and effective work on rail tracks. Saf. Sci. 2013, 56, 52–62. [Google Scholar] [CrossRef]
  66. Rose, J.; Bearman, C.; Naweed, A.; Dorrian, J. Proceed with caution: Using verbal protocol analysis to measure situation awareness. Ergonomics 2019, 62, 115–127. [Google Scholar] [CrossRef] [PubMed]
  67. Zhou, H.; Kamijo, K.; Itoh, M.; Kitazaki, S. Effects of explanation-based knowledge regarding system functions and driver’s roles on driver takeover during conditionally automated driving: A test track study. Transp. Res. Part F Traffic Psychol. Behav. 2021, 77, 1–9. [Google Scholar] [CrossRef]
  68. Åkerstedt, T.; Gillberg, M. Subjective and Objective Sleepiness in the Active Individual. Int. J. Neurosci. 1990, 52, 29–37. [Google Scholar] [CrossRef] [PubMed]
  69. Hart, S.G.; Staveland, L.E. Development of NASA-TLX (Task Load Index): Results of empirical and theoretical research. In Advances in Psychology; Elsevier: Amsterdam, The Netherlands, 1988; Volume 52, pp. 139–183. [Google Scholar]
  70. Jian, J.-Y.; Bisantz, A.M.; Drury, C.G. Foundations for an empirically determined scale of trust in automated systems. Int. J. Cogn. Ergon. 2000, 4, 53–71. [Google Scholar] [CrossRef]
  71. Haggard, P.; Tsakiris, M. The Experience of Agency: Feelings, Judgments, and Responsibility. Curr. Dir. Psychol. Sci. 2009, 18, 242–246. [Google Scholar] [CrossRef]
  72. Van Der Laan, J.D.; Heino, A.; De Waard, D. A simple procedure for the assessment of acceptance of advanced transport telematics. Transp. Res. Part C Emerg. Technol. 1997, 5, 1–10. [Google Scholar] [CrossRef]
  73. Wu, X.; Yuan, X.; Li, Z.; Song, F.; Sang, W. Validation of “alarm bar” alternative interface for digital control panel design: A preliminary experimental study. Int. J. Ind. Ergon. 2016, 51, 43–51. [Google Scholar] [CrossRef]
  74. Kim, S.; van Egmond, R.; Happee, R. How manoeuvre information via auditory (spatial and beep) and visual UI can enhance trust and acceptance in automated driving. Transp. Res. Part F Traffic Psychol. Behav. 2024, 100, 22–36. [Google Scholar] [CrossRef]
  75. Fu, R.; Liu, W.; Zhang, H.; Liu, X.; Yuan, W. Adopting an HMI for overtaking assistance—Impact of distance display, advice, and guidance information on driver gaze and performance. Accid. Anal. Prev. 2023, 191, 107204. [Google Scholar] [CrossRef]
  76. Rjabovs, A.; Palacin, R. Investigation into Effects of System Design on Metro Drivers’ Safety-Related Performance: An Eye-Tracking Study. Urban Rail Transit 2019, 5, 267–277. [Google Scholar] [CrossRef]
  77. Koo, B.-Y.; Jang, M.-H.; Kim, Y.-C.; Mah, K.-C. Changes in the subjective fatigue and pupil diameters induced by watching LED TVs. Optik 2018, 164, 701–710. [Google Scholar] [CrossRef]
  78. McConkie, G.W.; Rayner, K. The span of the effective stimulus during a fixation in reading. Percept. Psychophys. 1975, 17, 578–586. [Google Scholar] [CrossRef]
  79. Jap, B.T.; Lal, S.; Fischer, P. Comparing combinations of EEG activity in train drivers during monotonous driving. Expert Syst. Appl. 2011, 38, 996–1003. [Google Scholar] [CrossRef]
  80. Ma, R.H.Y.; Morris, A.; Herriotts, P.; Birrell, S. Investigating what level of visual information inspires trust in a user of a highly automated vehicle. Appl. Ergon. 2021, 90, 103272. [Google Scholar] [CrossRef] [PubMed]
  81. Taylor, S.; Wang, M.; Jeon, M. Reliable and transparent in-vehicle agents lead to higher behavioral trust in conditionally automated driving systems. Front. Psychol. 2023, 14, 1121622. [Google Scholar] [CrossRef] [PubMed]
  82. Hartwich, F.; Witzlack, C.; Beggiato, M.; Krems, J.F. The first impression counts—A combined driving simulator and test track study on the development of trust and acceptance of highly automated driving. Transp. Res. Part F Traffic Psychol. Behav. 2019, 65, 522–535. [Google Scholar] [CrossRef]
  83. Gegoff, I.; Tatasciore, M.; Bowden, V.; McCarley, J.; Loft, S. Transparent Automated Advice to Mitigate the Impact of Variation in Automation Reliability. Hum. Factors 2023, 66, 2008–2024. [Google Scholar] [CrossRef] [PubMed]
  84. Zanatto, D.; Bifani, S.; Noyes, J. Constraining the Sense of Agency in Human-Machine Interaction. Int. J. Hum. Comput. Interact. 2023, 40, 3482–3493. [Google Scholar] [CrossRef]
  85. Byun, J.; Kim, H.-R.; Lee, H.-E.; Kim, S.-E.; Lee, J. Factors associated with suicide ideation among subway drivers in Korea. Ann. Occup. Environ. Med. 2016, 28, 31. [Google Scholar] [CrossRef] [PubMed]
  86. Aylward, K.; Weber, R.; Lundh, M.; MacKinnon, S.N.; Dahlman, J. Navigators’ views of a collision avoidance decision support system for maritime navigation. J. Navig. 2022, 75, 1035–1048. [Google Scholar] [CrossRef]
  87. Ma, S.; Zhang, W.; Yang, Z.; Kang, C.; Wu, C.; Chai, C.; Shi, J.; Zeng, Y.; Li, H. Take over Gradually in Conditional Automated Driving: The Effect of Two-stage Warning Systems on Situation Awareness, Driving Stress, Takeover Performance, and Acceptance. Int. J. Hum. Comput. Interact. 2021, 37, 352–362. [Google Scholar] [CrossRef]
  88. Winkler, S.; Werneke, J.; Vollrath, M. Timing of early warning stages in a multi stage collision warning system: Drivers’ evaluation depending on situational influences. Transp. Res. Part F Traffic Psychol. Behav. 2016, 36, 57–68. [Google Scholar] [CrossRef]
  89. Li, J.; Guo, J.; Wijnands, J.S.; Yu, R.; Xu, C.; Stevenson, M. Assessing injury severity of secondary incidents using support vector machines. J. Transp. Saf. Secur. 2022, 14, 197–216. [Google Scholar] [CrossRef]
  90. Stanton, N.A.; Walker, G.H. Exploring the psychological factors involved in the Ladbroke Grove rail accident. Accid. Anal. Prev. 2011, 43, 1117–1127. [Google Scholar] [CrossRef] [PubMed]
  91. Xu, L.; Guo, L.; Ge, P.; Wang, X. Effect of multiple monitoring requests on vigilance and readiness by measuring eye movement and takeover performance. Transp. Res. Part F Traffic Psychol. Behav. 2022, 91, 179–190. [Google Scholar] [CrossRef]
  92. Callari, T.C.; Moody, L.; Mortimer, M.; Stefan, H.; Horan, B.; Birrell, S. “Braking bad”: The influence of haptic feedback and tram driver experience on emergency braking performance. Appl. Ergon. 2024, 116, 104206. [Google Scholar] [CrossRef] [PubMed]
  93. Vantrepotte, Q.; Berberian, B.; Pagliari, M.; Chambon, V. Leveraging human agency to improve confidence and acceptability in human-machine interactions. Cognition 2022, 222, 105020. [Google Scholar] [CrossRef]
  94. Jamieson, G.A.; Skraaning, G.; Joe, J. The B737 MAX 8 Accidents as Operational Experiences with Automation Transparency. IEEE Trans. Hum. Mach. Syst. 2022, 52, 794–797. [Google Scholar] [CrossRef]
  95. Kraus, J.; Scholz, D.; Stiegemeier, D.; Baumann, M. The More You Know: Trust Dynamics and Calibration in Highly Automated Driving and the Effects of Take-Overs, System Malfunction, and System Transparency. Hum. Factors 2019, 62, 718–736. [Google Scholar] [CrossRef] [PubMed]
  96. Körber, M.; Baseler, E.; Bengler, K. Introduction matters: Manipulating trust in automation and reliance in automated driving. Appl. Ergon. 2018, 66, 18–31. [Google Scholar] [CrossRef]
  97. Crawford, J.R.; Goh, Y.M.; Hubbard, E.M. Generalised Anxiety Disorder and Depression on Implicit and Explicit Trust Tendencies Toward Automated Systems. IEEE Access 2021, 9, 68081–68092. [Google Scholar] [CrossRef]
  98. Ha, T.; Kim, S.; Seo, D.; Lee, S. Effects of explanation types and perceived risk on trust in autonomous vehicles. Transp. Res. Part F Traffic Psychol. Behav. 2020, 73, 271–280. [Google Scholar] [CrossRef]
  99. Lee, J.D.; See, K.A. Trust in Automation: Designing for Appropriate Reliance. Hum. Factors 2004, 46, 50–80. [Google Scholar] [CrossRef] [PubMed]
  100. Ulahannan, A.; Thompson, S.; Jennings, P.; Birrell, S. Using Glance Behaviour to Inform the Design of Adaptive HMI for Partially Automated Vehicles. IEEE Trans. Intell. Transp. Syst. 2022, 23, 4877–4892. [Google Scholar] [CrossRef]
  101. Scerbo, M.W. Theoretical perspectives on adaptive automation. In Automation and Human Performance: Theory and Applications; CRC Press: Boca Raton, FL, USA, 2018; pp. 37–63. [Google Scholar]
  102. Tatasciore, M.; Bowden, V.; Loft, S. Do concurrent task demands impact the benefit of automation transparency? Appl. Ergon. 2023, 110, 104022. [Google Scholar] [CrossRef] [PubMed]
  103. Vagia, M.; Transeth, A.A.; Fjerdingen, S.A. A literature review on the levels of automation during the years. What are the different taxonomies that have been proposed? Appl. Ergon. 2016, 53, 190–202. [Google Scholar] [CrossRef] [PubMed]
  104. Selkowitz, A.R.; Lakhmani, S.G.; Chen, J.Y.C. Using agent transparency to support situation awareness of the Autonomous Squad Member. Cogn. Syst. Res. 2017, 46, 13–25. [Google Scholar] [CrossRef]
  105. van de Merwe, K.; Mallam, S.; Nazir, S.; Engelhardtsen, Ø. Supporting human supervision in autonomous collision avoidance through agent transparency. Saf. Sci. 2024, 169, 106329. [Google Scholar] [CrossRef]
  106. Neisser, U. Cognition and Reality; W. H. Freeman: San Francisco, CA, USA, 1976. [Google Scholar]
  107. Plant, K.L.; Stanton, N.A. Why did the pilots shut down the wrong engine? Explaining errors in context using Schema Theory and the Perceptual Cycle Model. Saf. Sci. 2012, 50, 300–315. [Google Scholar] [CrossRef]
  108. Plant, K.L.; Stanton, N.A. The process of processing: Exploring the validity of Neisser’s perceptual cycle model with accounts from critical decision-making in the cockpit. Ergonomics 2015, 58, 909–923. [Google Scholar] [CrossRef]
  109. Revell, K.M.A.; Richardson, J.; Langdon, P.; Bradley, M.; Politis, I.; Thompson, S.; Skrypchuck, L.; O’Donoghue, J.; Mouzakitis, A.; Stanton, N.A. Breaking the cycle of frustration: Applying Neisser’s Perceptual Cycle Model to drivers of semi-autonomous vehicles. Appl. Ergon. 2020, 85, 103037. [Google Scholar] [CrossRef] [PubMed]
  110. Sharma, A.; Nazir, S.; Ernstsen, J. Situation awareness information requirements for maritime navigation: A goal directed task analysis. Saf. Sci. 2019, 120, 745–752. [Google Scholar] [CrossRef]
  111. Cohen, M.A.; Dennett, D.C.; Kanwisher, N. What is the bandwidth of perceptual experience? Trends Cogn. Sci. 2016, 20, 324–335. [Google Scholar] [CrossRef] [PubMed]
  112. Endsley, M.R. A survey of situation awareness requirements in air-to-air combat fighters. Int. J. Aviat. Psychol. 1993, 3, 157–168. [Google Scholar] [CrossRef]
  113. Yoshida, M.; Shimizu, E.; Sugomori, M.; Umeda, A. Regulatory Requirements on the Competence of Remote Operator in Maritime Autonomous Surface Ship: Situation Awareness, Ship Sense and Goal-Based Gap Analysis. Appl. Sci. 2020, 10, 8751. [Google Scholar] [CrossRef]
Figure 1. Experimental environment and approach: (a) equipment; (b) scenario; and (c) operation methods.
Systems 12 00576 g001
Figure 2. Design references and interface content: (a) DMI design guidelines; (b) CBTC warning methods; (c) SAT theoretical model; and (d) three DMI transparency display areas (colors are used only to indicate the transparency information area; in the final experiment, all text was displayed in white font on a black background).
Systems 12 00576 g002
Figure 3. Instructions for general operating processes. Status is defined by four driving phases, with events encompassing both automated and manual operations. Solid boxes represent events currently underway, while dashed boxes denote forthcoming events. Continuous feedback and explanation instructions are provided for the current event, with proactive prediction instructions supplied for both the upcoming and current events.
Systems 12 00576 g003
Figure 4. Instructions for automated temporary adjustments. Speed states are adjusted due to track characteristics and passenger traffic levels. Dashed boxes indicate upcoming speed adjustments, and solid boxes indicate speed adjustments in progress. Continuous feedback and explanation instructions retain the previous instructions prior to adjustment and switch during adjustment. Proactive prediction instructions are provided concurrently for both phases.
Systems 12 00576 g004
Figure 5. Instructions for automated reminder fault events. The following distance status is defined by safety levels. Dashed boxes represent upcoming following distance statuses, while solid boxes denote current following distance statuses. Continuous feedback and explanatory instructions are provided in real time based on changes in the following distance status, and proactive prediction instructions are provided concurrently before and after changes in this status.
Systems 12 00576 g005
Figure 6. Pairwise comparison of SA levels across three interface transparency levels (*   p < 0.05; **   p < 0.01).
Systems 12 00576 g006
Figure 7. Pairwise comparison of operational performance across three interface transparency levels (***   p < 0.001).
Systems 12 00576 g007
Figure 8. Paired comparisons of initial TiA and TiA across three interface transparency levels (* p < 0.05, ** p < 0.01, and *** p < 0.001).
Systems 12 00576 g008
Figure 9. Paired comparisons of initial SoA and SoA across three interface transparency levels (** p < 0.01 and *** p < 0.001).
Systems 12 00576 g009
Figure 10. Pairwise comparison of NASA-TLX across three interface transparency levels (* p < 0.05, ** p < 0.01, and *** p < 0.001).
Systems 12 00576 g010
Figure 11. Subjective preference results for three transparency interfaces.
Systems 12 00576 g011
Figure 12. Perceptual cycle model based on participant responses.
Systems 12 00576 g012
Table 1. Different automation grades for urban rail transit systems [14].
GoA LevelDriving ModeDoor ClosureSetting Train in MotionStopping TrainOperation in Case of Disruption
GoA-0Run on sight (ROS)DriverDriverDriverDriver
GoA-1Automatic train protection (ATP)DriverDriverDriverDriver
GoA-2Semi-automatic train operation (STO)DriverAutomaticAutomaticDriver
GoA-3Automatic train operation
(ATO)
AttendantAutomaticAutomaticAttendant
GoA-4Unattended train operation (UTO)AutomaticAutomaticAutomaticAutomatic
Table 2. Operational performance with different interface transparency levels.
Operational PerformanceDMI1DMI1+2DMI1+2+3
MeanSDMeanSDMeanSD
Common braking (s)1.660.351.680.401.100.32
Emergency braking (s)1.510.431.430.420.770.30
Unexpected braking (s)1.410.311.390.391.520.40
Table 3. Questionnaire results with different interface transparency levels.
QuestionnaireItemDMI1DMI1+2DMI1+2+3
MeanSDMeanSDMeanSD
TiAMistrust2.380.711.970.692.060.72
Suspicion2.590.842.030.782.311.00
Confidence4.001.164.471.503.971.28
Reliance5.440.765.720.735.530.84
SoATotal4.020.724.660.654.530.63
AcceptanceAverage4.050.554.460.544.220.49
NASA-TLXMental demand3.471.614.131.834.691.86
Physical demand3.692.224.062.144.591.66
Temporal demand3.192.023.091.443.381.26
Perform4.282.674.001.904.472.00
Effort3.811.604.531.804.911.15
Frustration2.341.522.161.672.561.22
Workload (average)3.461.123.661.054.100.86
Table 4. Results of visual behavior analysis.
Visual Behavioral IndicatorsDMI1DMI1+2DMI1+2+3
MeanSDMeanSDMeanSD
Total saccade count158.4642.23180.6460.32251.6165.71
Total fixation count400.07105.45450.57104.43737.96153.90
Total fixation duration (s)94.9733.79104.6735.69179.3753.97
Average fixation duration (s)0.230.060.220.050.240.05
Average pupil diameter (mm)3.760.763.810.593.750.67
Disclaimer/Publisher’s Note: The statements, opinions and data contained in all publications are solely those of the individual author(s) and contributor(s) and not of MDPI and/or the editor(s). MDPI and/or the editor(s) disclaim responsibility for any injury to people or property resulting from any ideas, methods, instructions or products referred to in the content.

