1. Introduction
In recent years, the problems of climate change and global warming have increasingly intensified, posing serious threats and impacts to ecology and the environment. Countries around the world expect to jointly curb the trend of global warming. According to the 2015 global carbon dioxide emissions released by the International Energy Agency, the transportation sector ranks second in carbon dioxide emissions, and road transportation accounts for 75% of those emissions [
1]. In order to reduce emissions from the transportation sector, hydrogen energy is widely recognized as an effective energy source for reducing greenhouse gases and air pollution from transportation [
2]. The methods for manufacturing it are diverse, and it can be produced from fossil fuels or renewable energy sources such as wind power, solar energy, and geothermal energy [
3]. Many cities in some countries, such as the United States, the European Union, Japan, China, etc., have introduced fuel cell buses (FCBs) into urban transportation systems [
4]. FCBs have many technical advantages, such as high energy efficiency and low pollution and noise [
5]. In the next two decades, fuel cell cars will likely become a substitute for traditional cars and battery cars [
6].
All fuels pose some degree of hazard. Through understanding of the characteristics of the fuels, fuel systems with safety controls can be designed. The safety of hydrogen use has attracted much attention, and related papers have proposed that hydrogen fuel cell vehicles improve risk factors and preventive measures during hydrogen transportation, storage, and use [
7,
8,
9]. The stability of the hydrogen energy supply is linked to the entire supply chain, which includes hydrogen production, storage, transportation, and utilization technologies. Related papers have discussed the challenges of constructing a supply chain from different angles and proposed solutions [
10,
11,
12]. As research on hydrogen energy continues to grow, supply safety and stability improvements can increase confidence that hydrogen can be as safe as the widely used fuels available today.
The most commonly used fuel cell in the transportation sector is the proton exchange membrane fuel cell (PEMFC). According to the research on the application of different fuel cells in electric vehicles, the PEMFC has a high power-to-weight ratio and power density [
13]. When using hydrogen as fuel, electricity, through an electrochemical reaction, discharges only water. The advantages of the PEMFC are quite numerous, including high energy efficiency, high power density, low-temperature operation, short startup time, simple design, long life, etc. [
14,
15]. Compared with diesel buses, trolleybuses, and battery buses, PEMFC buses have the following advantages [
16]:
- (1)
The only emission is water, which can achieve zero pollution compared with diesel buses.
- (2)
The speed and climbing ability are the same as those of traditional diesel buses, but the noise and vibration amplitude are quite low, and comfort is high.
- (3)
The mileage per unit of hydrogen is relatively high, and the cruising range of the bus is high, with an average cruising range of about 300 to 450 km when fully charged (compared with lithium battery buses, for which the average cruising range is only 180 to 250 km).
- (4)
It takes only 5 min to refill the hydrogen for an FCB but a few hours to charge a battery bus. The bus usage rate is better.
- (5)
FCBs have better route planning flexibility, while trackless trains and battery buses need to have infrastructure built along the way, such as elevated tram lines and charging facilities. Because of the fast replenishment of hydrogen, it is necessary only to build a hydrogen refueling station.
- (6)
There are many ways to produce hydrogen, and local resources can be chosen to ensure energy security and reduce energy transportation costs.
Compared with FCBs, diesel buses and electric buses are more mature. Previous studies have analyzed the impacts of different passenger capacities, driving patterns, road congestion levels, road types, and gradients on fuel consumption and carbon emissions for diesel buses [
17]. A bi-objective decision-making framework based on three optimal planning factors, charging infrastructure, fleet size, and battery capacity, was proposed to reduce overall costs and greenhouse gas emissions for battery electric bus systems; this framework was applicable to various real-world scenarios [
18]. Electric buses have also been analyzed in regard to different vehicle types, numbers of charging stations, and charging methods, as well as the impact of renewable energy and transformer load on costs [
19]; at the same time, the differences between diesel buses and electric buses have been compared, including fuel costs, construction costs, vehicle utilization, and carbon emissions [
20,
21,
22].
An analysis utilized current and future developments to evaluate the emissions reductions, capital costs, maintenance costs, and energy expenses associated with battery and fuel cell electric bus technologies. Australian data were employed to compare various electrification strategies for the bus fleet. The findings included evidence of reductions in CO
2 emissions and the costs associated with converting a diesel bus fleet to a fully green tailpipe fleet [
23]. A comparative evaluation of the total cost of ownership (TCO) for battery electric buses and hydrogen fuel cell buses was conducted using historical data and market price forecasts. By 2030, TCO results for electric buses were projected to reveal significant cost reductions of 23.5% compared with conventional diesel buses. Additionally, the overall TCO for hydrogen buses was expected to be slightly lower than that for diesel buses. Reducing fuel costs will be crucial for decreasing the total TCO of hydrogen buses [
24]. To guide the development of a sustainable transport system, an environmental model based on a life-cycle assessment approach was proposed. This model evaluated the impact of energy carrier consumption while driving, as well as the sources of electricity used to power electric buses and produce hydrogen. Research indicated that modernizing legacy bus fleets with hydrogen and electricity could significantly reduce global warming [
25]. However, studies have yet to be found to plan the hydrogen supply of the fuel cell bus transportation system (FCBTS) and consider the impact of different hydrogen supply methods on the cost.
This study used FCBs that convert hydrogen to electricity in the bus transportation system, so hydrogen had to be produced for the operation of the bus and stored for replenishment during the day. Common hydrogen production methods include natural gas reforming, coal gasification, partial oxidation of oil, water splitting, etc. Among them, natural gas reforming accounts for the largest proportion but leads to a large amount of carbon dioxide emissions. If hydrogen production is considered in an environmentally friendly way, water electrolysis is the best choice. Hydrogen is produced from water through electrochemical reactions and can be produced using renewable energy [
26].
There are two common ways to store hydrogen: high-pressure hydrogen storage and low-temperature liquid hydrogen storage. High-pressure hydrogen storage pressurizes hydrogen to 700 bar and stores it as a gas in a steel container. Because of the low boiling point of hydrogen, liquid hydrogen storage is maintained at −252.9 °C, and special containers with thermal insulation must be used. The type of hydrogen storage depends on the amount of hydrogen required and the access time. Although the density of liquid hydrogen is higher than that of gaseous hydrogen, the storage method is costly. Based on the estimates from this study, the entire system in the Tainan fuel cell bus transportation system requires only about a thousand kilograms of hydrogen per day. According to reference [
27], gaseous hydrogen has potential advantages in cost and efficiency in small-scale storage. Considering factors such as hydrogen transportation and the day–night electricity price differential, gaseous hydrogen storage was the more suitable storage method for this study.
This study used two hydrogen production methods (decentralized and centralized hydrogen production) for operation simulation and cost analysis. In centralized hydrogen production, a hydrogen production station is next to the largest transfer station, and hydrogen is transported to the remaining transfer stations. There are three main ways of hydrogen transportation: gaseous hydrogen transportation, liquid hydrogen transportation, and pipeline transportation. Gaseous and liquid hydrogen are transported mainly by tank trucks. In gaseous hydrogen transportation, hydrogen must be pressurized to greater than 70 atm. The advantages are that the loss of hydrogen is small and that the compression cost is low. In liquid hydrogen transportation, hydrogen must be liquefied, and the temperature must be lowered to below −252.9 °C. The amount of hydrogen transportation is larger than that of gaseous hydrogen transportation, but the liquefaction cost is high [
28]. Pipeline transportation involves building pipelines or utilizing existing natural gas pipelines for hydrogen transportation, and the transportation range can reach hundreds of kilometers. Although the construction cost is high, the maximum volume can be transported [
29]. Small- and medium-sized hydrogen production plants are more suitable for gaseous and liquid hydrogen transportation, while large-scale hydrogen production plants are suitable for pipeline transportation [
30]. The hydrogen consumption in this study needed only a small hydrogen production plant, which was suitable for high-pressure gaseous hydrogen transportation by gaseous tank trucks.
In 2005, Karaboga proposed the artificial bee colony (ABC) algorithm. Because of its simple structure and easy implementation, it has high stability in solving optimization problems and can effectively solve NP-complete problems. Therefore, it has received extensive attention in recent years [
31]. The ABC algorithm has been applied to different types of optimization problems, including multiobjective optimization, combinatorial optimization, numerical cluster analysis, salesperson problems, no-waiting flow shop scheduling problems, robot path planning, etc. [
32]. This study belongs to the combinatorial optimization problem of NP-complete, which is suitable to be solved by ABC. Because of practical application requirements, the ABC (artificial bee colony) algorithm was chosen for this study for the following reasons: (1) the ABC algorithm can handle parameter variations better than other metaheuristic algorithms, reducing the chances of unsatisfactory results due to improper parameter tuning; (2) with fewer adjusting parameters, the ABC algorithm minimizes the time needed for tuning, making it well suited for practical use; (3) some algorithms may struggle with the complexity of the problem, leading to slow convergence or failure to converge. However, the ABC algorithm addresses this challenge through the onlooker bee mechanism, which involves performing neighborhood searches around high-quality food sources.
This study took the Tainan bus transportation system as the research object, simulated the operation status of the system, replaced all existing buses with FCBs under the existing routes and timetables, and used two methods, decentralized hydrogen production and centralized hydrogen production. The amount of physical equipment, the maximum hydrogen storage capacity of the buses, the supplementary hydrogen capacity of the buses, and the hydrogen production startup condition were the optimized parameters. The research included the construction costs of hydrogen production stations, hydrogen storage stations, hydrogen refueling stations, FCBs and hydrogen transport vehicles, electricity consumption for hydrogen production and storage, water, maintenance fees for fixed mileages of bus running, etc. Operating costs, and the differences in electricity prices in the summer/nonsummer months and in the day and night, were included, but personnel costs and fuel costs for the operation of the hydrogen hauler were not. In the paper, the ABC was used for optimization, and the differences in the construction and operating costs of the two hydrogen production methods were analyzed.
This study presents novel insights and differentiates itself from the existing literature in several ways. First, an actual bus transportation system in a city with over one million residents was analyzed to develop a hydrogen supply method specifically for fuel cell buses. Second, a model that integrates bus operation with hydrogen consumption was created. All aspects of the research, including model construction and optimization algorithms, were programmed in C++, a highly portable programming language. Third, the study took into account operating costs, such as time-of-use electricity rates and water charges, in addition to hardware expenses. Adjustable variables were utilized as optimization parameters to minimize both construction and operating costs. Fourth, the optimization method was designed to be adaptable, allowing for easy adjustments and reuse when the bus system changes. This makes it a valuable tool for sustainable hydrogen supply planning within the public bus transportation system. Finally, the study explored the application of the ABC algorithm in the transportation field, demonstrating that the results were practical and viable.
3. Optimization Method: Artificial Bee Colony (ABC)
The ABC is a global optimization algorithm proposed by Karaboga in 2005. It observes that in the process of bees collecting honey, different bees perform different activities by division of labor and communicate all the obtained results and information to find the best solution to the problem [
31].
In the ABC, each nectar source represents a potential solution to a problem of concern, and there are three types of bees: worker bees, scout bees, and observer bees. Half of the bees are worker bees, and half are observer bees. The steps of the artificial bee colony algorithm are as follows [
31]:
- (1)
Set the parameters, including the number of worker bees, the maximum iteration number, and the limit of the number of unimproved nectar sources. The worker bees explore the nectar source according to Equation (1) and find the initial solution:
where
is the initial value of the
ith worker bee in the
jth dimension,
is the minimum value of the
jth dimension of the search space,
is the minimum and maximum value of the
jth dimension of the search space, rand(0,1) is a random number between 0 and 1
i ∈ {1, 2, 3, …,
SN},
j ∈ {1, 2, 3, …,
D},
SN is the number of worker bees, and
D is the number of optimization parameters.
- (2)
After initialization, each worker bee explores around the nectar source according to Equation (2):
where
is the new position of the
ith worker bee after moving after the
jth dimension,
is the position of a randomly selected worker bee
k in the
jth dimension,
is a random number between −1 and 1,
,
, and
.
- (3)
After the worker bees share the income of the nectar source with the observer bee, the observer bee evaluates the information obtained by the worker bee and selects a nectar source with the best possibility. The probability is calculated by Equation (3):
where
is the probability that the
ith food source is selected,
is the profitability of the
ith nectar source, and
SN is the total number of food sources.
- (4)
When observing bees searching for nectar sources, if they still have poor performance after limited searches or find a nectar source with better profitability, the nectar source is discarded. Another scout bee is sent to find a nectar source to replace it according to Equation (1).
- (5)
Record the current honey source with the highest yield as the best solution for this optimization. Repeat the cycle from step 2 to step 4 until the conditions are met or the maximum number of iterations is reached.
In this study, the bee colony algorithm was used to minimize the construction and operation costs of the two architectures of the FCBTS, decentralized and centralized hydrogen production. The optimized parameters were the number of hardware devices, the maximum hydrogen storage capacity of the bus, the hydrogen supplementary capacity of the bus, and the hydrogen storage station’s starting hydrogen production capacity. The total cost of construction and operation of the above bus transportation system for ten years was taken as the adaptation value, and five minutes was taken as the simulation interval.
The optimized parameters in this study are described as follows:
- (1)
Number of hardware devices
The hardware equipment was divided into three items: hydrogen production stations, hydrogen storage stations, and hydrogen refueling stations. Under the structure of decentralized hydrogen production, each transfer station is equipped with a hydrogen production station, so there were only two optimization parameters: the numbers of hydrogen production stations and hydrogen storage stations. Under the centralized hydrogen production structure, only hydrogen production stations are set up at the hydrogen production transfer stations in each region, and the hydrogen required by the other transfer stations is transported by hydrogen transport vehicles. Therefore, the optimized parameters were the number of hydrogen production stations in the hydrogen production transfer station, the number of hydrogen storage stations at the Tainan transfer station, and the number of hydrogen storage stations at other transfer stations. Each transfer station is fixed with a hydrogen refueling station, so the refueling stations were not included in the optimization parameters.
- (2)
Maximum hydrogen storage for buses.
This optimization parameter was intended to limit the maximum hydrogen storage capacity of the bus. The bus replenishes hydrogen to its maximum storage capacity each time. If the value is too large, more hydrogen from the hydrogen storage station is consumed during the day, causing the hydrogen production station to produce hydrogen at the daily electricity price, resulting in a cost increase.
- (3)
Hydrogen refueling condition of buses
The remaining hydrogen is assessed after a bus completes one shift. If the remaining hydrogen falls below a specified threshold, it takes 5 min to travel to the hydrogen refueling station to refuel.
- (4)
Hydrogen production startup condition for the hydrogen storage station
The remaining hydrogen amount in the hydrogen storage station is checked before each simulation period. If the hydrogen storage capacity drops below a specified level, the hydrogen production station will initiate hydrogen production. If it meets or exceeds this level, hydrogen production will cease.
The objective function, related parameters, and constraints of this study are described below. The ten-year construction and operation cost of the FCBTS with a centralized hydrogen production structure included electricity, water, maintenance fees, FCBs, hydrogen production stations, hydrogen storage stations, and hydrogen refueling stations for each transfer station, as well as the transportation of hydrogen from the hydrogen production transfer station to other transfer stations. The objective function and constraints were as follows.
Objective function:
where
is the electricity consumption of the transfer station
t in the period
i;
is the electricity price in period
i, which considers the difference between peak and off-peak and between summer and nonsummer months;
is the water fee of transfer station
t in the period
i;
is the maintenance cost of transfer station
t in period
i; and
is the cost of the FCBs, hydrogen production stations, hydrogen storage stations, and hydrogen refueling stations at transfer station
t:
where
is the number of FCBs at transfer station
t,
BP is the price of an FCB,
is the number of hydrogen production stations at transfer station
t,
PP is the price of a hydrogen production station,
is the number of hydrogen storage stations at transfer station
t,
SP is the price of a hydrogen storage station price,
is the number of hydrogen refueling stations at transfer station
t,
AP is the price of a hydrogen refueling station,
is the number of hydrogen transport vehicles at transfer station
t, and
OP is the price of a hydrogen transporter.
Among them, Equation (5) represents the total cost of hardware equipment, which includes FCBs, hydrogen production stations, hydrogen storage stations, hydrogen refueling stations, and hydrogen transport vehicles. Equations (6)–(8) are limited by non-negative integers. Equations (9) and (10) indicates that each transfer station has at least one hydrogen storage station and hydrogen refueling station.
Compared with the centralized hydrogen production structure, the decentralized hydrogen production
reduces the cost of the last transporter, (
), and restriction (7) is deleted. Since each transfer station for centralized hydrogen production must be equipped with at least one hydrogen production station, hydrogen storage station, and hydrogen refueling station, Equation (8) is modified as follows:
4. Results
This section discusses the application of the proposed method to the Tainan bus transportation system. Decentralized and centralized hydrogen production were separately used as case studies, and the differences between the cases were compared. Currently, there are 121 operating routes in the Tainan bus transportation system, including 20 urban bus routes, 85 branch bus routes, 6 sightseeing routes, 1 double-decker bus route, 2 high-speed rail express bus routes, and 7 flexible shuttle bus routes. Because of the wide distribution of bus routes, all routes depart from 14 transfer stations belonging to five passenger transport companies. This paper used the actual bus timetable and route to simulate the operation of the bus, considering the urban bus and six groups of branch lines, totaling 112 routes, and their 14 transfer stations.
Table 3 shows the prices of FCBTS-related equipment in this study, as well as water and electricity costs. The service life of the FCBs, hydrogen transport vehicles, hydrogen production stations, hydrogen storage stations, and hydrogen refueling stations was ten years.
4.1. Case 1: Decentralized Hydrogen Production
This case was a decentralized hydrogen production structure. Each transfer station was equipped with a hydrogen production station and a hydrogen storage station. No other transfer stations were required to assist in supplying hydrogen, and each transfer station operated independently. The optimized parameters were the number of hydrogen production stations in each transfer station, the number of hydrogen storage stations in each transfer station, the maximum hydrogen storage capacity of the buses, the hydrogen refueling condition of the buses, and the hydrogen production startup condition for the hydrogen storage station. The number of ABC worker bees was 10, the maximum number of iterations was 200, and the limit for the number of unimproved nectar sources was 10.
Figure 4 shows that after optimization, taking the largest Tainan transfer station in the bus system as an example, the construction and operation cost over ten years was reduced to a minimum at about 60 iterations, and a total of one hydrogen production station and four hydrogen storage stations were required. At the station, the maximum hydrogen storage capacity of the buses was maintained at 27 kg, and the hydrogen refueling condition of the buses was initially 30% and then gradually decreased to 15% after gradual convergence. The hydrogen production startup condition for the hydrogen storage station started at 80% and then gradually decreased. The results showed that when appropriate numbers of hydrogen production stations and hydrogen storage stations were built, at night, each transfer station replenished all buses and hydrogen storage stations to the maximum hydrogen storage capacity, which reduced the number of times that buses were replenished with hydrogen and avoided using the electricity price during the day to produce hydrogen, which would cause excessive costs.
Under the decentralized hydrogen production structure, each transfer station needed only one hydrogen production station, one to ten hydrogen storage stations, and one hydrogen refueling station for all buses to refuel. The largest number of buses was at the Tainan Transit Station, with 1033 daily departures, requiring 122 FCBs to maintain operation. The smallest number was at a security transfer station with only 17 departures a day, where only one FCB was required. The Baihe and Jiali stations required the maximum 10 hydrogen storage stations because the ratio of the daily operating mileage of the two stations divided by the number of buses was the highest. The higher this ratio was, the more likely it was that hydrogen supplemented at night would be not enough to supply the operation, meaning that more hydrogen storage stations would be needed to meet demand.
In regard to the optimization parameters, the maximum hydrogen storage capacity of buses at each transfer station was close to the maximum value of 27 kg, so as to reduce the hydrogen production during the day and reduce the number of FCBs. The maximum hydrogen reserve of the buses at the Baoan transfer station was the lowest, the main reason being that there were only 17 departures per day, and the demand for hydrogen was relatively small. The hydrogen refueling condition of the buses ranged from 0% to 99%, and the transfer stations with more than 100 daily trips were all lower than 50%, reducing the number of trips to refuel hydrogen. The hydrogen production capacities of the hydrogen storage stations were close to 0%, which means that hydrogen production was not done during the day, and the cost of electricity was not increased.
In terms of electricity consumption, water consumption, and annual maintenance costs, the daytime electricity consumption of each transfer station was the electricity consumption to maintain the operation of the hydrogen storage station. In addition to maintaining the operation of the hydrogen storage station, the nighttime electricity consumption was used to supplement all FCBs and hydrogen storage stations to their maximum reserves. Each transfer station used water for hydrogen production, and the annual maintenance cost was multiplied by the total mileage of all shifts multiplied by the maintenance cost per kilometer. The 10-year total construction and operation cost of the Tainan transfer station FCBTS without hydrogen supply was USD 355.66 million.
4.2. Case 2A: Centralized Hydrogen Production (Single Hydrogen Production Transfer Station)
This case was a hydrogen supply structure for centralized hydrogen production. The only hydrogen production transfer station was Tainan transfer station. Hydrogen was produced only at this transfer station and then transported to other transfer stations by hydrogen transport vehicles. The optimized parameters were the number of hydrogen production stations in the hydrogen production transfer station, the numbers of hydrogen production transfer stations and hydrogen storage stations in other transfer stations, the maximum storage capacity of the buses, the hydrogen refueling condition of the buses, and the hydrogen production startup condition for the hydrogen storage station. For the ABC parameters, the number of worker bees was 10, the maximum iteration number was 250, and the limit of the number of unimproved nectar sources was 10.
Figure 5 shows the best results for the Tainan transfer station after optimization. The total construction and operation cost over ten years was reduced to the lowest at about 190 iterations. A total of eight hydrogen production stations, three hydrogen storage stations, and 16 hydrogen transport vehicles were required, and the remaining transfer stations each required three hydrogen storage stations. The maximum hydrogen storage capacity of the buses was initially 10.56 kg and then increased to 26.97 kg. The hydrogen refueling condition of the buses was initially 1% and then increased to 26%. The initial hydrogen production startup condition for the hydrogen storage station was 12%, and the optimization result was 100%, which means that the hydrogen production station produced hydrogen in each simulation period. The results showed that each transfer station built an appropriate number of hydrogen storage stations and that the maximum hydrogen storage capacity of the buses was close to the maximum value, which increased the hydrogen storage capacity of the transfer station. The eight hydrogen production stations at Tainan transfer station could continuously produce hydrogen day and night; they could thus meet the full-day shift needs of all transfer stations and supplement the buses and hydrogen storage stations to their maximum hydrogen storage capacities at night. At the same time, the optimization result of the hydrogen refueling condition of the bus was 26%, which reduced the number of trips to the hydrogen refueling station to replenish hydrogen, and the number of hydrogen transport vehicles, to a minimum.
Under the centralized hydrogen production structure, in terms of the amount of equipment, the Tainan transfer station needed eight hydrogen production stations and three hydrogen storage stations to produce and store hydrogen, and 16 hydrogen transport vehicles were responsible for transporting hydrogen to the remaining transfer stations. Except for the Tainan transfer station, the other transfer stations required three hydrogen storage stations to store hydrogen and set up a hydrogen refueling station for hydrogen refueling to supply all the FCB needs of the station. The Tainan transfer station required a maximum of 122 FCBs, and the Baoan transfer station needed only 1.
In regard to the optimization parameters, the maximum hydrogen storage capacity of the buses was 26.97 kg. The closer the maximum hydrogen storage capacity of the buses was to the upper limit value, the fewer instances of hydrogen refueling would occur, avoiding the use of daytime hydrogen production. The buses refueled to 26% of the hydrogen capacity, which also reduced the amount of hydrogen refueling. The condition required for starting hydrogen production at the hydrogen storage station was 100%, which meant that the hydrogen production station produced hydrogen in each simulation period.
In terms of electricity consumption, water consumption, and operating mileage throughout the year, because hydrogen was produced at the Tainan transfer station, the electricity consumption was the highest during the day and night. The electricity of the remaining transfer stations was used only to maintain the operation of the hydrogen storage station. The annual water consumption of the Tainan transfer station was related to hydrogen production, and the water consumption of the other transfer stations was zero. Because it was responsible for the manufacturing and delivery of hydrogen, the construction and operation costs of the Tainan transfer station were the highest. The total construction cost of the FCBTS for supplying hydrogen by transport vehicles for ten years was USD 331.41 million.
4.3. Case 2B: Centralized Hydrogen Production (Two Hydrogen Transfer Stations)
This case examines a centralized hydrogen supply structure designed to optimize costs. Because of high hydrogen demand across various transfer stations, particularly in Tainan, additional transport vehicles were necessary. To address this challenge, the stations were divided into two regions: the southern region, which included eight transfer stations, such as Tainan, Rende, and Anping Industrial Area, and the northern region, comprising six stations, including Xinying and Madou. Hydrogen production was centralized at the Tainan and Xinying transfer stations, from which it was transported to other stations. The optimization process focused on parameters such as the number of hydrogen production and storage stations, vehicle storage capacities, and operational conditions for hydrogen production and refueling. The results indicated that at 170 iterations, the total construction and operation cost for the Tainan transfer station over ten years was reduced to USD 193.81 million. This configuration included one production station, one storage station, and one transport vehicle. Notably, the maximum hydrogen storage capacity of the buses increased from 18.97 kg to 27.00 kg, with hydrogen utilization efficiency significantly improved, resulting in minimal hydrogen production during each simulation period.
Figure 6 shows the best result after optimizing the backstage south transfer station. The total construction and operation cost of the Tainan transfer station in ten years was reduced to its lowest at about 170 iterations, with a lowest value of USD 193.81 million and a total of one hydrogen production station, one hydrogen storage station, and one hydrogen transport vehicle. The maximum hydrogen storage capacity of the bus started at 18.97 kg and then increased to 27.00 kg. The hydrogen capacity of the bus was initially 26% and finally dropped to 1%. The hydrogen production capacity was initially 44%, and the optimized result was 1%, which means that almost no hydrogen was produced in each simulation period of the hydrogen production station.
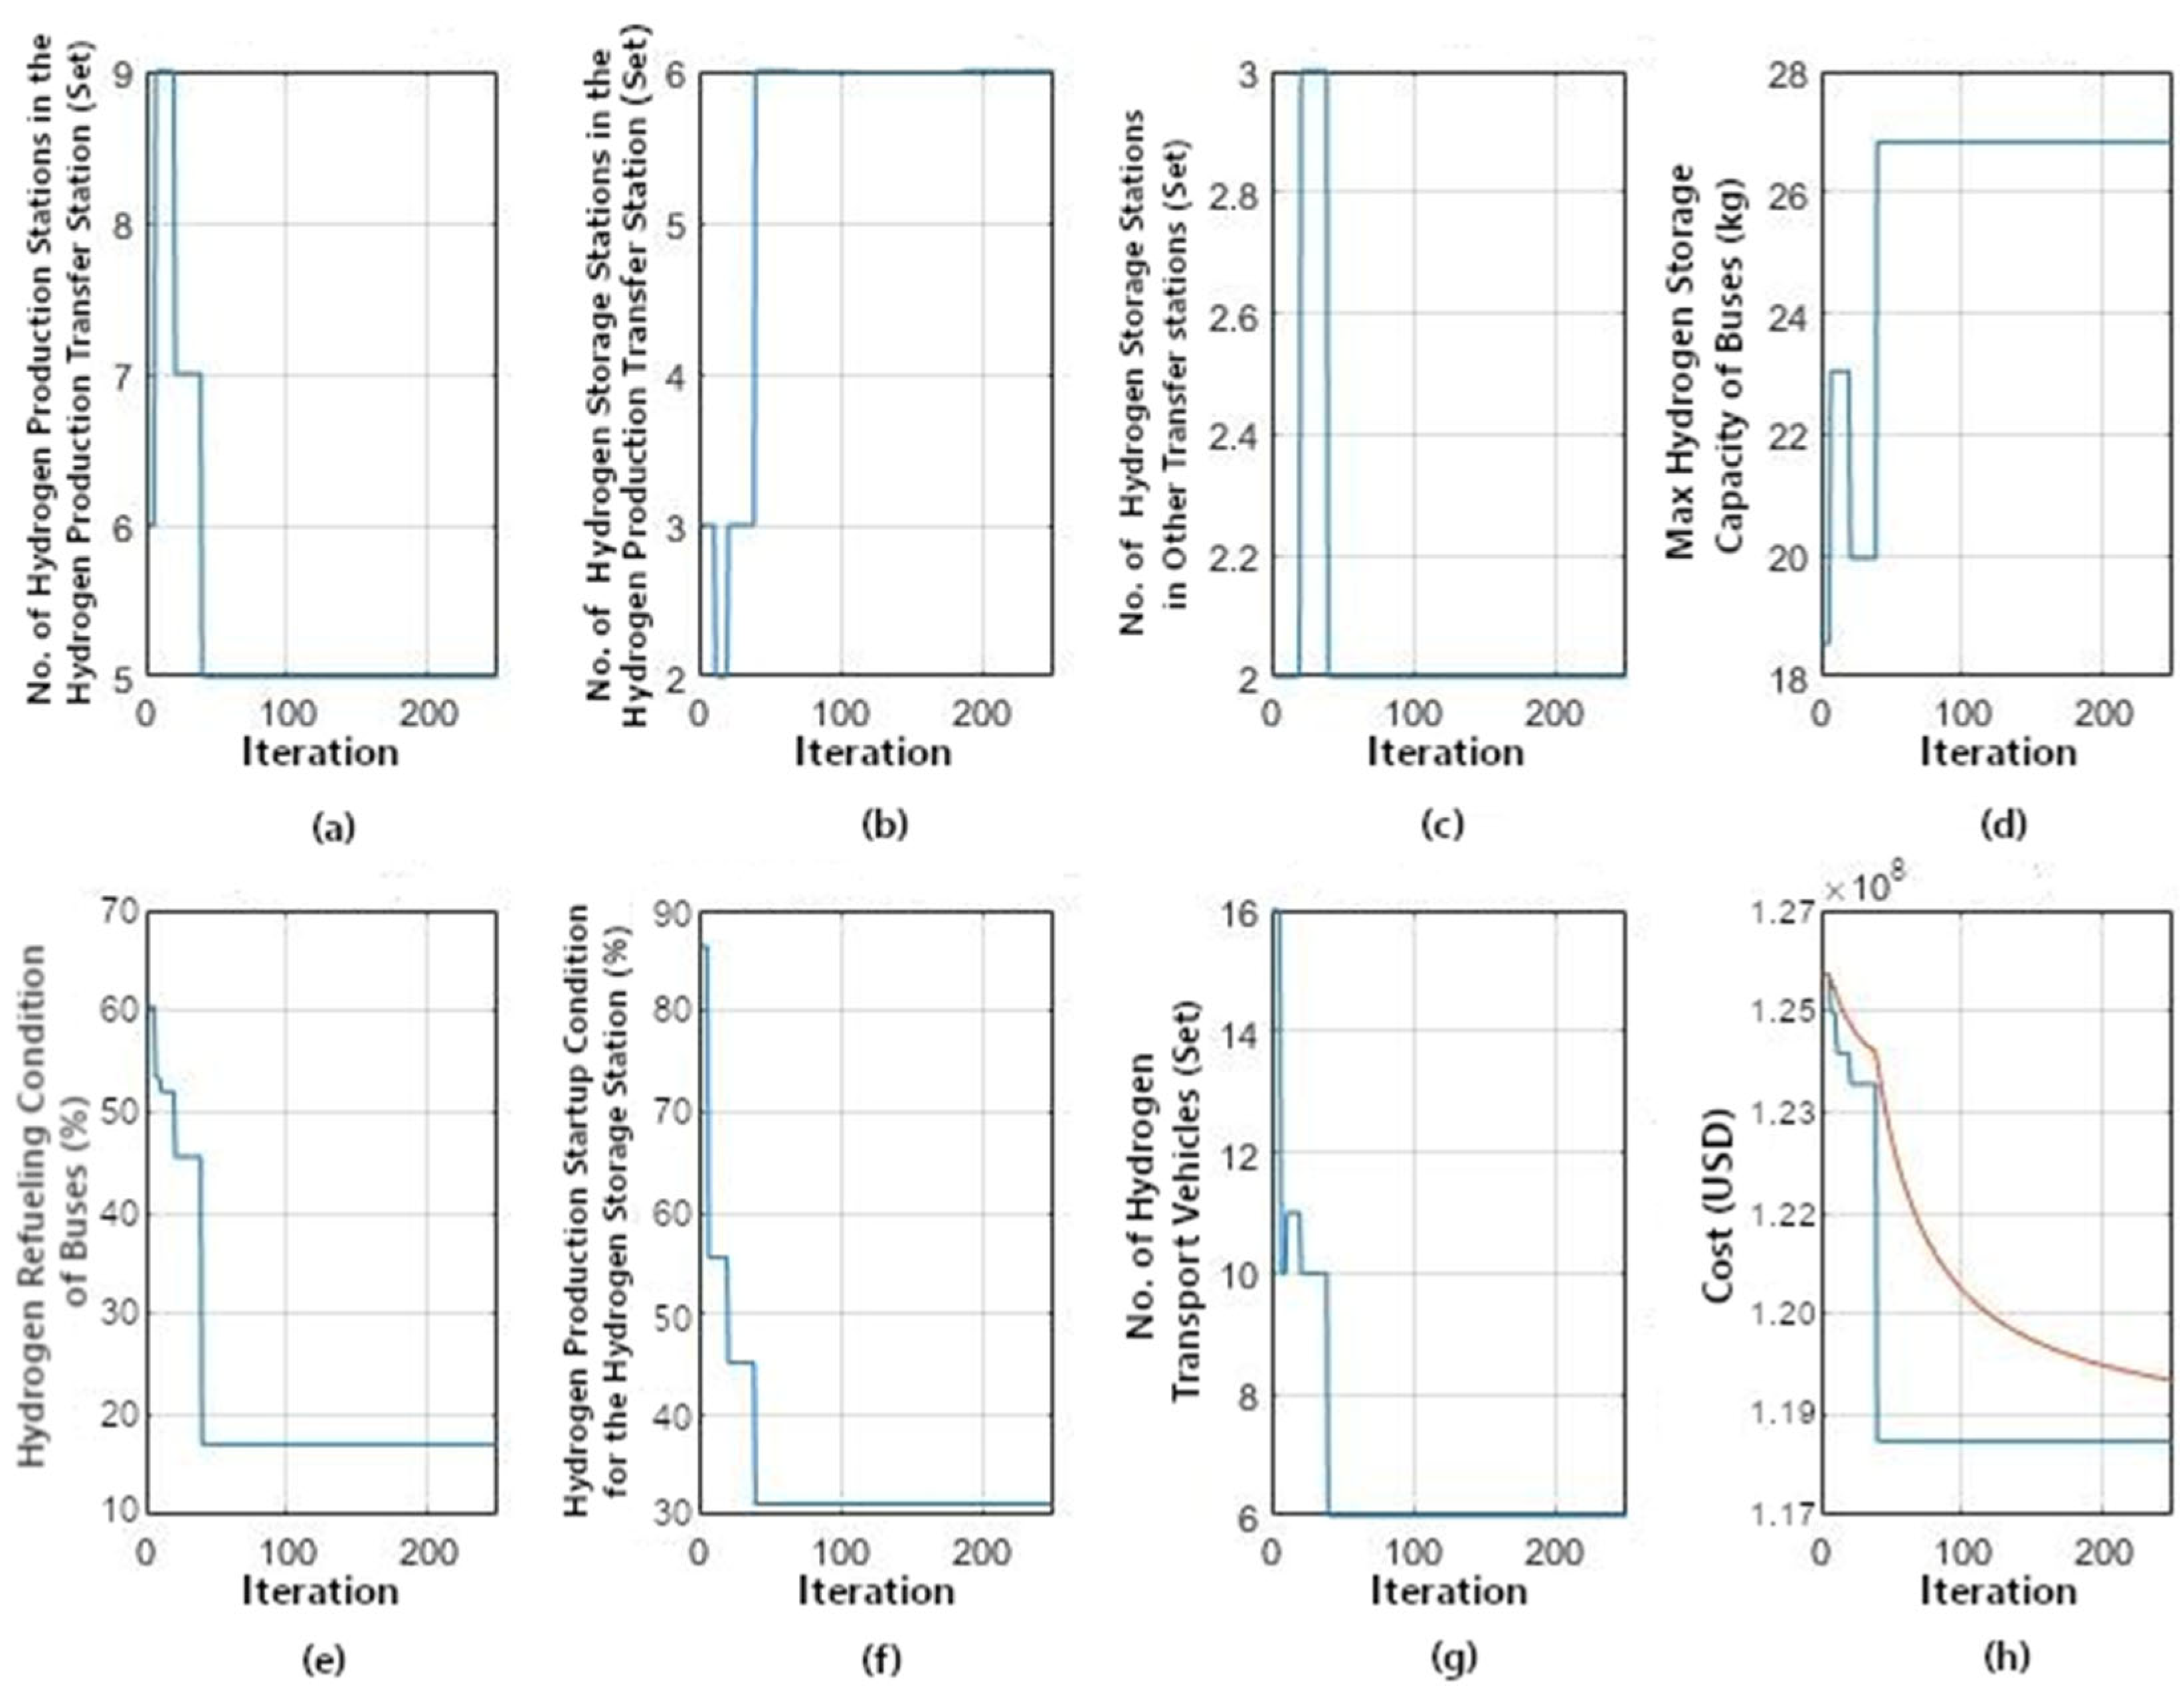
Figure 7 shows the best results for the Xinying transfer station after hydrogen optimization. The total construction and operation cost of the Xinying transfer station in ten years was reduced to its lowest at about 40 iterations, and the amount was USD 118.31 million. There were five hydrogen production stations, six hydrogen storage stations, and six hydrogen transport vehicles. The maximum hydrogen storage capacity of the bus started at 18.54 kg and then increased to 26.82 kg. The hydrogen refueling condition of the buses was initially 60% and finally dropped to 17%. The hydrogen production startup condition for the hydrogen storage station was initially 86%, and the optimized result was 31%.
Under the centralized hydrogen production structure with two production stations, the southern region used Tainan as the hydrogen production transfer station, requiring only one production station, one storage station, and one transport vehicle. It served 199 fuel cell buses (FCBs). In the northern region, Xinying served as the hydrogen production transfer station, requiring five production stations, six storage stations, and six transport vehicles to support 80 FCBs. Xinying needed 23 FCBs, while Shanhua required the least, 6. Optimization results showed that the southern region’s buses had a maximum hydrogen storage capacity of 27.0 kg, with minimal refueling needs (1%). The northern region’s buses had a maximum capacity of 26.82 kg, with refueling conditions at 17%. Hydrogen production started when storage fell to 30%. Tainan and Xinying bore the highest costs because of their hydrogen production and delivery responsibilities. The total construction and operation cost for supplying hydrogen over ten years was USD 311.97 million.
4.4. Case 2C: Centralized Hydrogen Production (Three Hydrogen Transfer Stations)
This case was a hydrogen supply structure for centralized hydrogen production. After observing Case 2B, the demand for hydrogen in the transfer stations other than the hydrogen production station in the northern district was still high, and more hydrogen transport vehicles were required to carry hydrogen. Therefore, in this case, an attempt was made to divide all transfer stations into three regions, northern, central, and southern, in order to reduce the overall construction cost. The southern region included eight transfer stations, such as Tainan, Rende, and Anping Industrial Zone. The central region had three transfer stations, including Jiali, Madou, and Shanhua, while the northern region also had three, including Yujing, Baihe, and Xinying. Tainan, Jiali, and Xinying served as the hydrogen production transfer stations for the south, central, and north regions, respectively.
The three regions operated independently. Optimization parameters included the numbers of production and storage stations, the bus storage capacity, the refueling conditions, and the hydrogen production startup condition for storage stations. The optimization was conducted with 10 ABC parameters, a maximum of 250 iterations, and a limit of 10 unimproved nectar sources. The results, as shown in
Figure 8, revealed that after 170 iterations, the Tainan transfer station achieved the lowest total construction and operation cost over ten years. This setup involved one hydrogen production station, one storage station, and one transport vehicle. The maximum hydrogen storage capacity of buses increased from 18.97 kg to 27.00 kg, while the refueling condition of buses dropped from 26% to 1%. The hydrogen production startup condition for the storage station decreased from 44% to 1%, indicating minimal hydrogen production in each simulation period.
Figure 9 shows the best results for the Jiali transfer station after optimization. The total construction and operation cost of the Jiali transfer station in ten years was reduced to the lowest at about 150 iterations, at an amount of USD 47.72 million and a total of four hydrogen production stations, 10 hydrogen storage stations, and four hydrogen transport vehicles. The maximum hydrogen storage capacity of the buses was 18.76 kg at first and then rose to 27.00 kg. The hydrogen refueling condition of the buses started at 44% and increased to 54% at the end. The hydrogen production startup condition for the hydrogen storage station started at 95%, and the optimized result was 14%.
Figure 10 shows the best results for the Xinying transfer station after optimization. The total construction and operation cost of the Xinying transfer station in ten years was reduced to the lowest at about 150 iterations, at an amount is USD 62.69 million and a total of two hydrogen production stations, nine hydrogen storage stations, and five hydrogen transport vehicles. The maximum hydrogen storage capacity of the buses was 18.76 kg at first and then increased to 26.39 kg. The hydrogen refueling condition of the buses was 44% at the beginning and 37% at the end. The hydrogen production startup condition for the hydrogen storage station started at 96%, and the optimized result was 4%.
Under the centralized hydrogen production structure of three hydrogen production stations, in terms of the number of pieces of equipment, only one hydrogen production station was required in the southern district, only one hydrogen storage station was required for all of the other transfer stations, and one hydrogen transport vehicle was required to deliver hydrogen. The total number of FCBs was 199 units; the Tainan transfer station needed the maximum of 122 FCBs, and the Baoan transfer station needed only 1. The central district hydrogen production transfer station required four hydrogen production stations and 10 hydrogen storage stations to maintain operation. The remaining transfer stations needed only need one hydrogen storage station and four hydrogen transport vehicles. The total number of FCBs was 31, and the Jiali transfer station needed up to 15 FCBs, though only 6 were needed at the Shanhua transfer station. The north district hydrogen production transfer station required two hydrogen production stations and nine hydrogen storage stations, and five hydrogen transport vehicles, and the remaining transfer stations needed two hydrogen storage stations to store hydrogen. The total number of FCBs was 47, and the Xinying transfer station needed the most FCBs, 23, while the Yujing transfer station required the fewest, 8.
In regard to the optimized parameters, the maximum hydrogen storage capacity of the buses in the southern district was 27.0 kg, which was the upper limit of the parameter, and the hydrogen refueling condition of the buses was 1%, which means that the buses hardly needed to be hydrogenated. The hydrogen production capacity of the hydrogen storage station was 1%, which meant that there was almost no need to use daytime hydrogen production. The maximum hydrogen storage capacity of the buses in the central district was 27.00 kg, which was the upper limit of the parameter. The hydrogen refueling condition of the buses was 54%, and hydrogenation was carried out when the remaining hydrogen of the buses was close to half. The hydrogen storage station activated at 14% of the hydrogen production capacity, reducing the degree of electricity consumption during the day. The maximum hydrogen storage capacity of the buses in the north district was 26.39 kg, which was close to the upper limit of the parameters. The hydrogen of the buses was supplemented by 34%, which reduced the frequency of hydrogen refueling for the buses. The hydrogen production capacity of the hydrogen storage station was 4%, which greatly reduced electricity consumption during the day. All transfer stations were divided into three areas, and the ten-year total construction cost of the FCBTS to supply hydrogen by transport vehicles was USD 304.22 million.
4.5. Discussion
Table 4 shows a comparison of the number of pieces of equipment, water and electricity consumption, and construction and operating costs in four cases of decentralized and centralized hydrogen production architectures. The comparisons are described as follows:
- (1)
Buses: Case 1 had the largest number of buses, 291 in total, followed by 279 in Case 2B and the lowest number of 277 in Cases 2A and 2C. The number of buses in the five transfer stations of Yujing, Baihe, Jiali, Xinhua, and Xinying in case 1 was more than 14 in cases 2A and 2C.
- (2)
Hydrogen storage stations: In case 1, there was a large number of seven transfer stations in Tainan (Sifang), Yujing, Baihe, Jiali, Madou, Xinhua, and Xinying. The aforementioned transfer stations are exactly the top seven by ratio of daily operating mileage to number of buses; if these ratios were higher, the buses would need to store more hydrogen, and hydrogen storage stations could not meet the daily operational needs. For case 1, decentralized hydrogen production, to avoid the use of daytime hydrogen production, more buses and hydrogen storage stations were added after optimization, the hydrogen was stored after nighttime hydrogen production, and the overall cost was reduced.
- (3)
Hydrogen production stations: Case 1 had the largest number because each transfer station had to set up at least one hydrogen production station when hydrogen production was dispersed. In centralized hydrogen production, it was necessary only to set up an appropriate number of hydrogen production transfer stations. After optimization, cases 2A, 2B, and 2C required eight, six, and seven hydrogen production stations, respectively.
- (4)
Hydrogen refueling station: Each transfer station was equipped with a hydrogen refueling station, and the four cases were not different.
- (5)
Hydrogen transport vehicle: Because of the decentralized hydrogen production in Case 1, there was no need for a hydrogen transport vehicle. Cases 2A, 2B, and 2C had centralized hydrogen production, requiring 16, 7, and 10 hydrogen transport vehicles, respectively.
- (6)
Electricity consumption during the day: Case 1 did not use hydrogen production during the day, but the 59 hydrogen storage stations maintained operation during the day, so electricity still needed to be consumed. Under the centralized hydrogen production structure, the more hydrogen production stations were transshipped, the less hydrogen demand each hydrogen production transfer station was responsible for on average. Therefore, the daily electricity consumption could be reduced, but the daytime system was still utilized.
- (7)
Electricity consumption at night: Case 1 had the highest nighttime electricity consumption among the four cases. The decentralized hydrogen production architecture did not use hydrogen production during the day, so it has the largest number of buses and hydrogen storage stations among the four cases, and at the same time produced more hydrogen at night to replenish all buses and hydrogen storage stations to the storage limit. The three cases of the centralized hydrogen production architecture all used hydrogen production during the day, so the amount of hydrogen produced at night decreased.
- (8)
Water consumption and operating mileage: The four cases had no differences in water consumption throughout the year. The reason for this is that the routes and timetables of each transfer station were the same, and the total mileage in operation was the same, so the daily required amount and use of hydrogen were the same, requiring the same amount of water.
- (9)
Cost reduction rate: Case 1 used decentralized hydrogen production as the benchmark. The cost of case 2A dropped by 6.9%, that of case 2B dropped by 12.3%, and that of case 2C dropped by 14.5%.
5. Conclusions
This paper proposed a complete operation simulation method for a fuel cell bus transportation system using electrolyzed water to produce hydrogen, and completed the timetable and route of the Tainan bus transportation system with a full fuel cell bus fleet. This bus transportation system included 14 transfer stations and 112 routes. Considering the decentralized and centralized hydrogen supply methods, with decentralized hydrogen production, hydrogen production stations and hydrogen storage stations were set up at each transfer station to operate independently. There were three cases of centralized hydrogen production. Tainan City was divided into one to three regions, hydrogen production stations were set up at the transfer stations with the largest departure frequency and hydrogen demand in each region, and then hydrogen transport vehicles transported hydrogen to the remaining transfer stations. In the four cases, the optimal adjustment parameters were the number of hydrogen production stations, the number of hydrogen storage stations, the maximum hydrogen storage capacity of the buses, the capacity of the buses to supplement their hydrogen, and the hydrogen production capacity of the hydrogen storage station to start up.
Under decentralized hydrogen production, more hydrogen production stations were set up, which required more hydrogen storage stations and buses. Although daytime hydrogen production was not used, the equipment cost was relatively high, and the cost was the highest among all cases. The centralized hydrogen production structure used hydrogen production during the day, which increased the cost of hydrogen transport vehicles but reduced the equipment cost at the transfer stations through hydrogen transportation and reduced the electricity consumption for maintaining the operation of the hydrogen storage stations. In addition, under centralized hydrogen production, the transfer stations were divided into several areas, and each area was equipped with a hydrogen production transfer station, which reduced the demand for hydrogen and reduced electricity consumption during the day, thereby reducing the cost. Compared with the cost of the decentralized case, the costs of cases 2A, 2B, and 2C dropped by 6.9%, 12.3%, and 14.5%, respectively. The results show that adopting a centralized hydrogen production structure and dividing appropriate areas can effectively reduce construction and operating costs.
This paper makes several significant contributions. First, it examines an urban and rural bus transportation system that serves over one million people, allowing the research methodology to apply to most public bus transportation systems. Second, it proposes a hydrogen supply method specifically designed for these bus systems that aims to enhance the use of hydrogen energy in public transit. Third, the optimization method effectively reduces construction and energy costs associated with hydrogen bus transportation systems. Only the parameters must be adjusted to adapt to the new system when relevant costs change.
There are several limitations and suggestions to this study. First, this paper primarily proposes a planning method for a fuel cell public bus transportation system. Because of space constraints, we were unable to discuss other systems, such as electric buses, simultaneously. A comparison of these systems will be included in the next phase of our work. Second, while the study focuses on the application of hydrogen energy in public transportation, it does not delve deeply into the environmental impacts and economic costs associated with hydrogen production, storage, and transportation. Future research will address these factors to provide a more comprehensive evaluation of the system. Third, cost considerations may vary between different cities because of the differing locations of station sites. Our study did not extensively explored these variations, which may require adopting more varied methods to optimize, solve, or even redefine the problem. In terms of cost and environmental simulations, we can establish stricter requirements and limitations. At the same time, we should employ more flexible and diverse methods to comprehensively define cost considerations and planning.


