


Numerical Design Structure Matrix–Genetic Algorithm-Based Optimization Method for Design Process of Complex Civil Aircraft Systems


Abstract
1. Introduction
2. Related Works
2.1. Process Modeling
2.2. Algorithm for Process Optimization
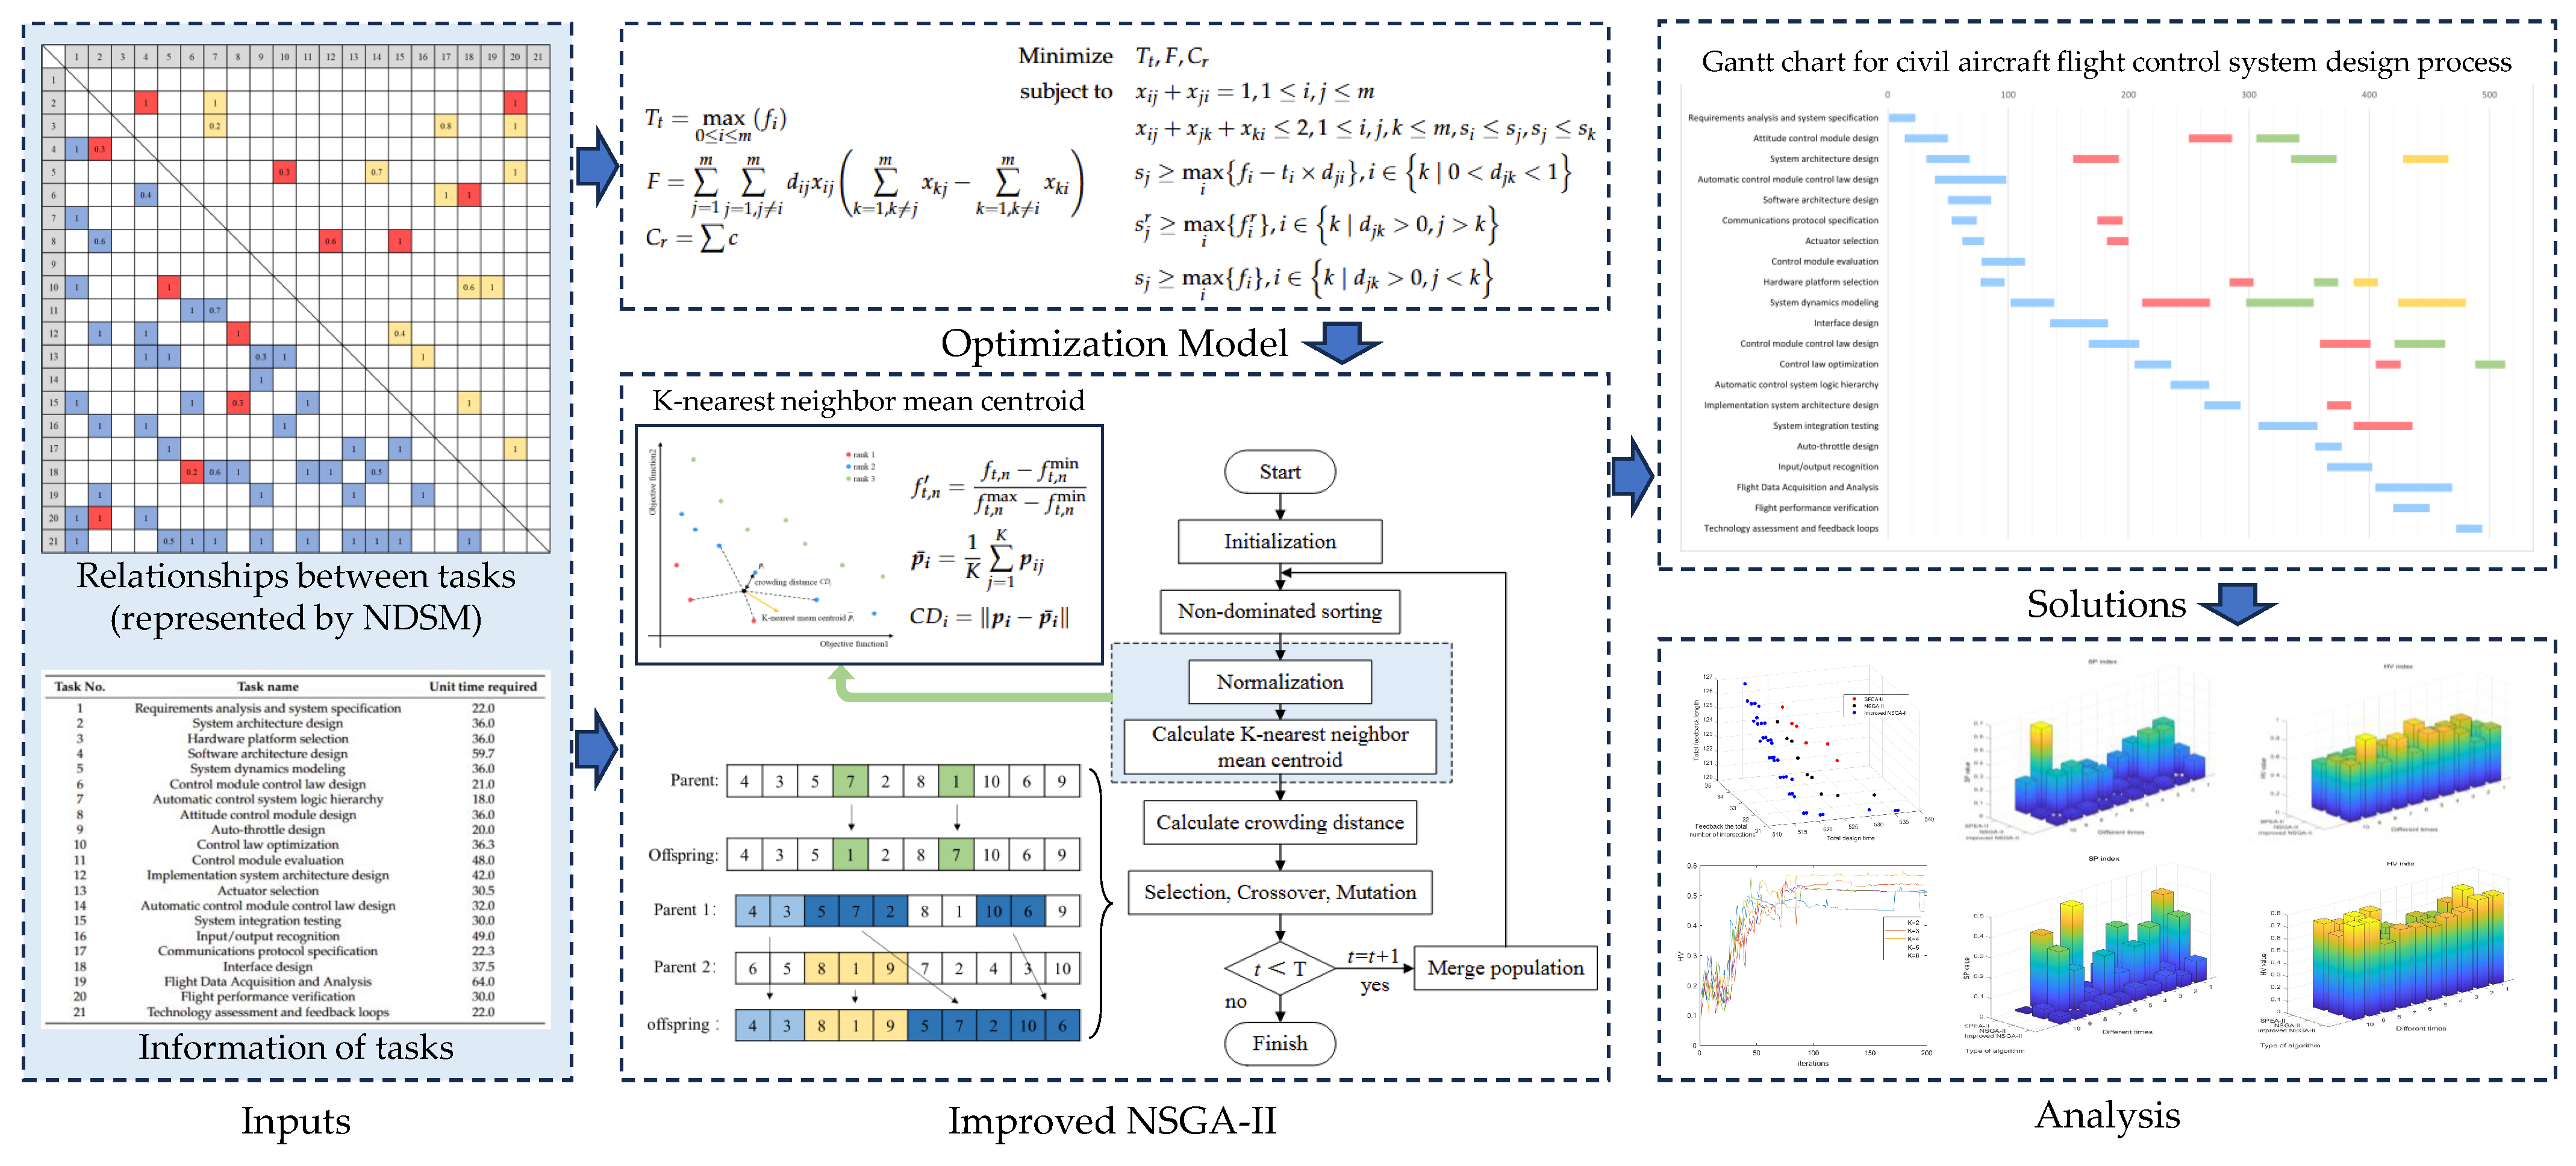
3. Description of the System Design Process Optimization Problem
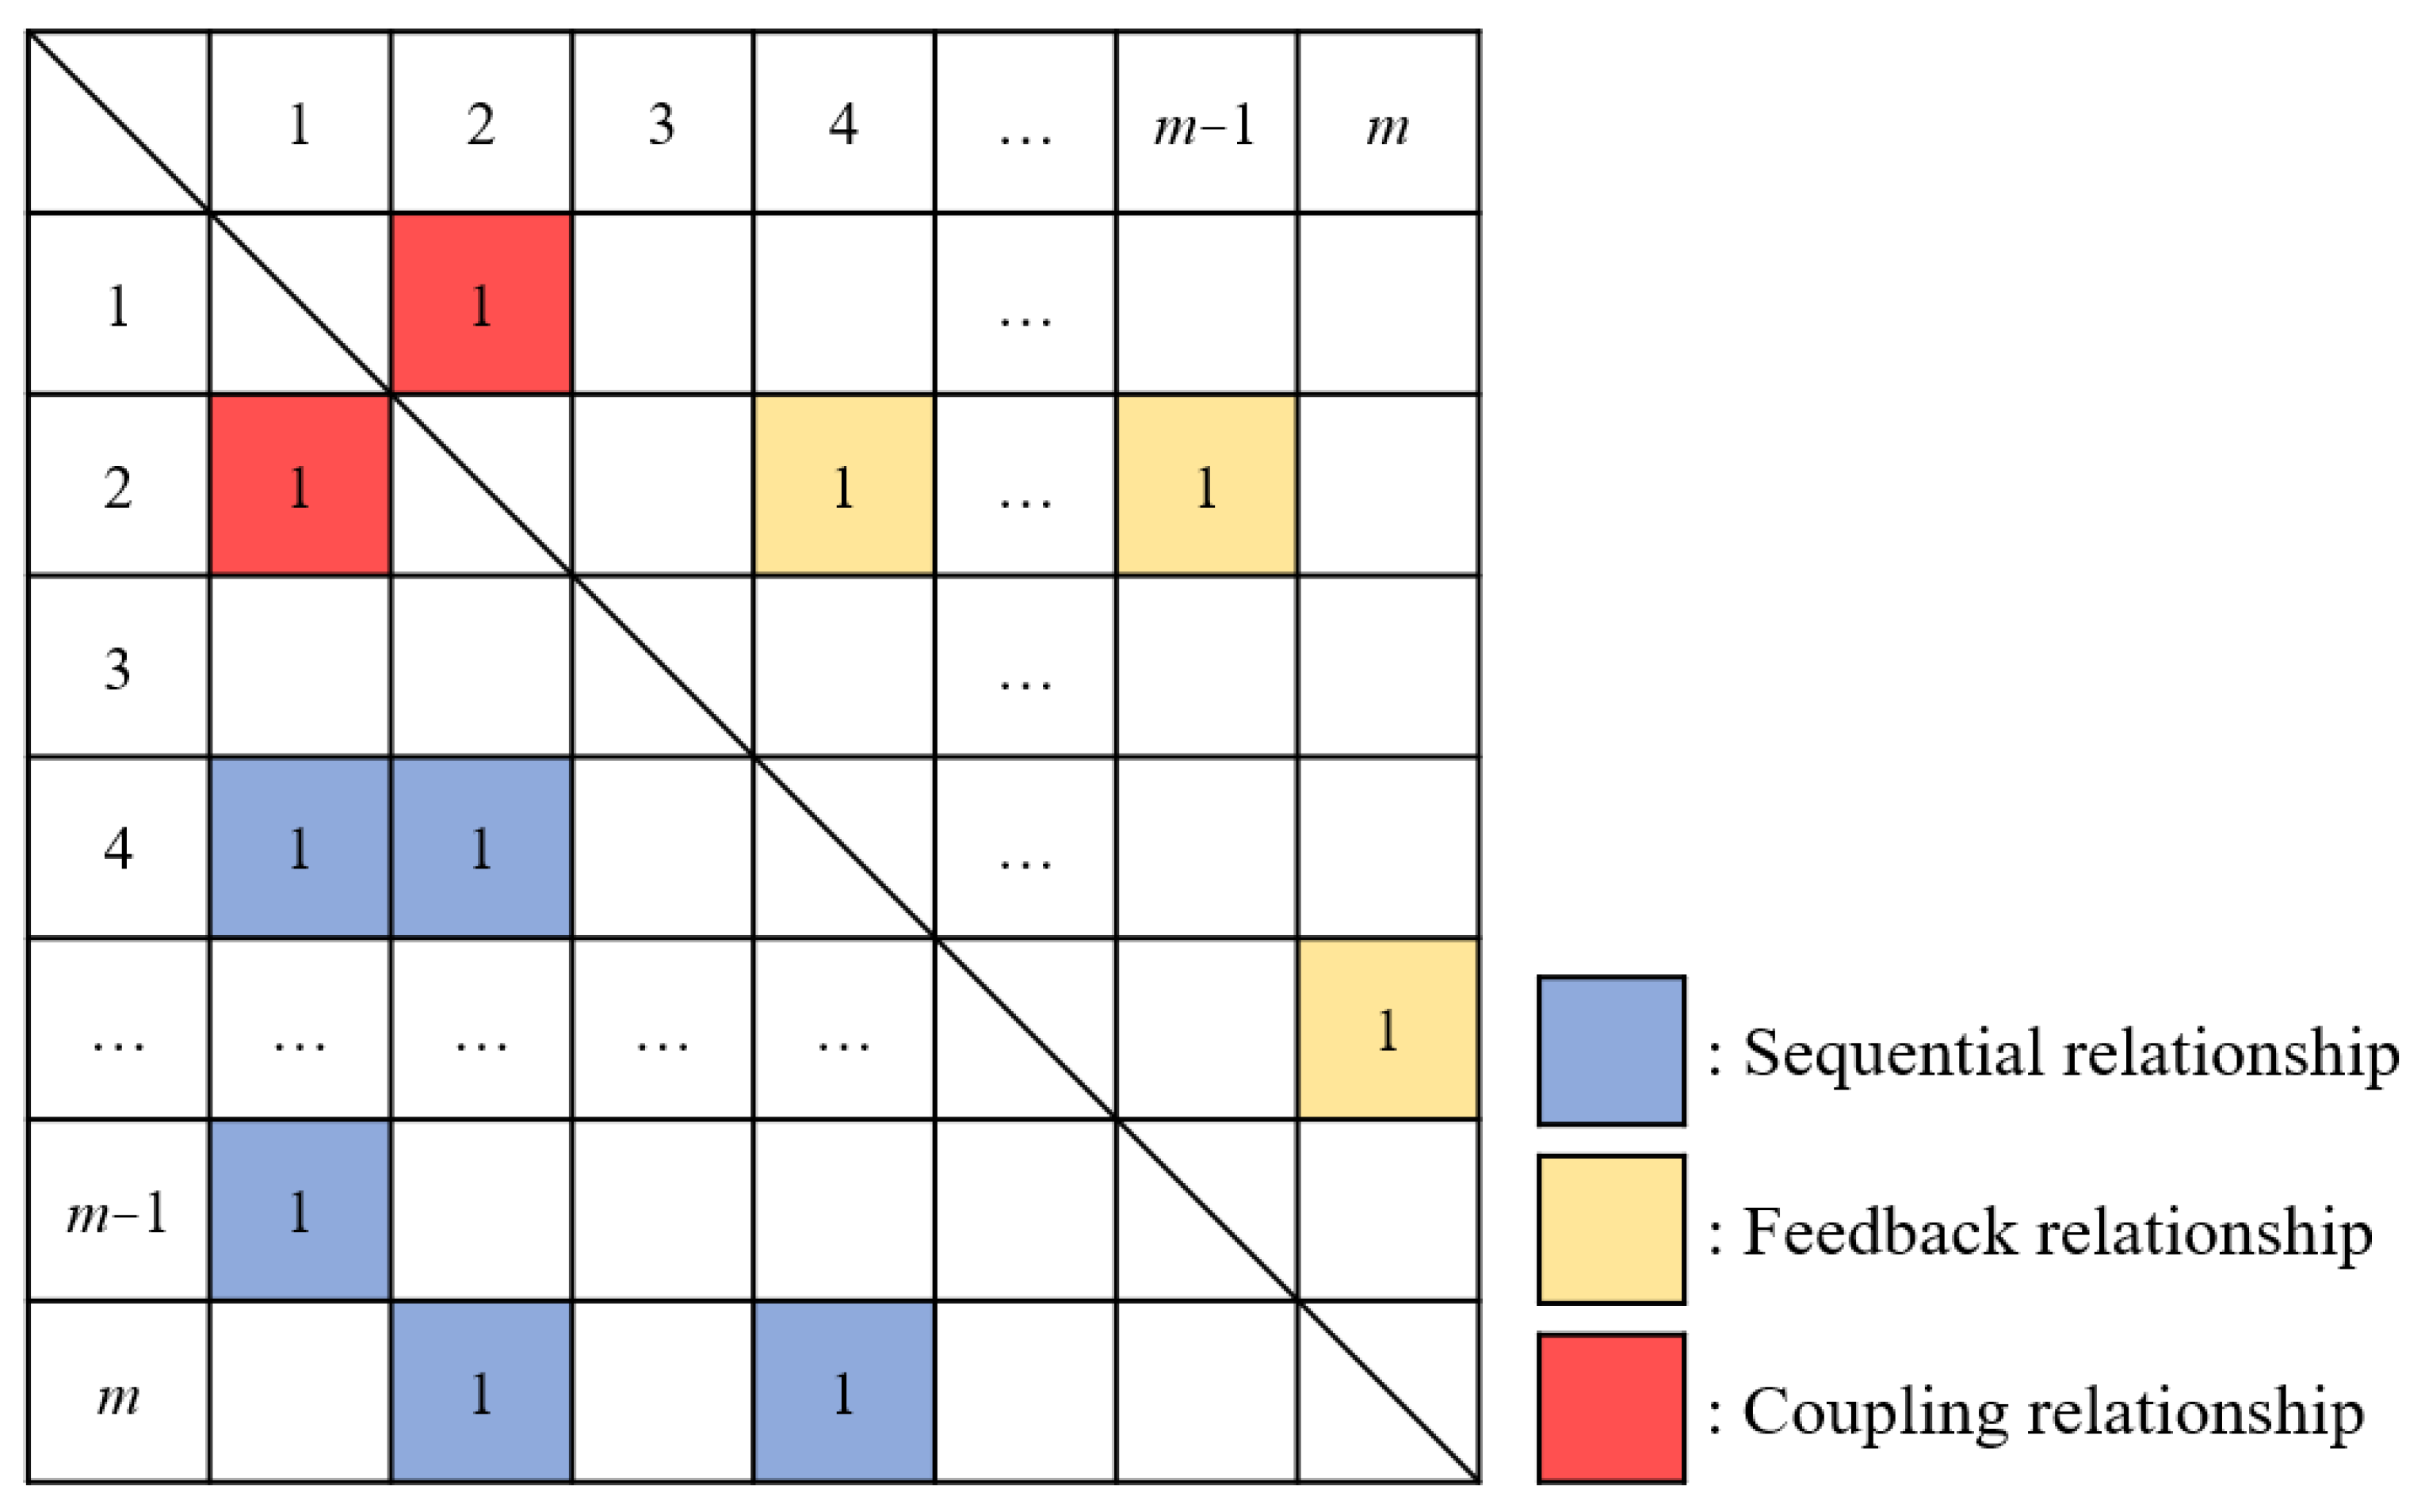
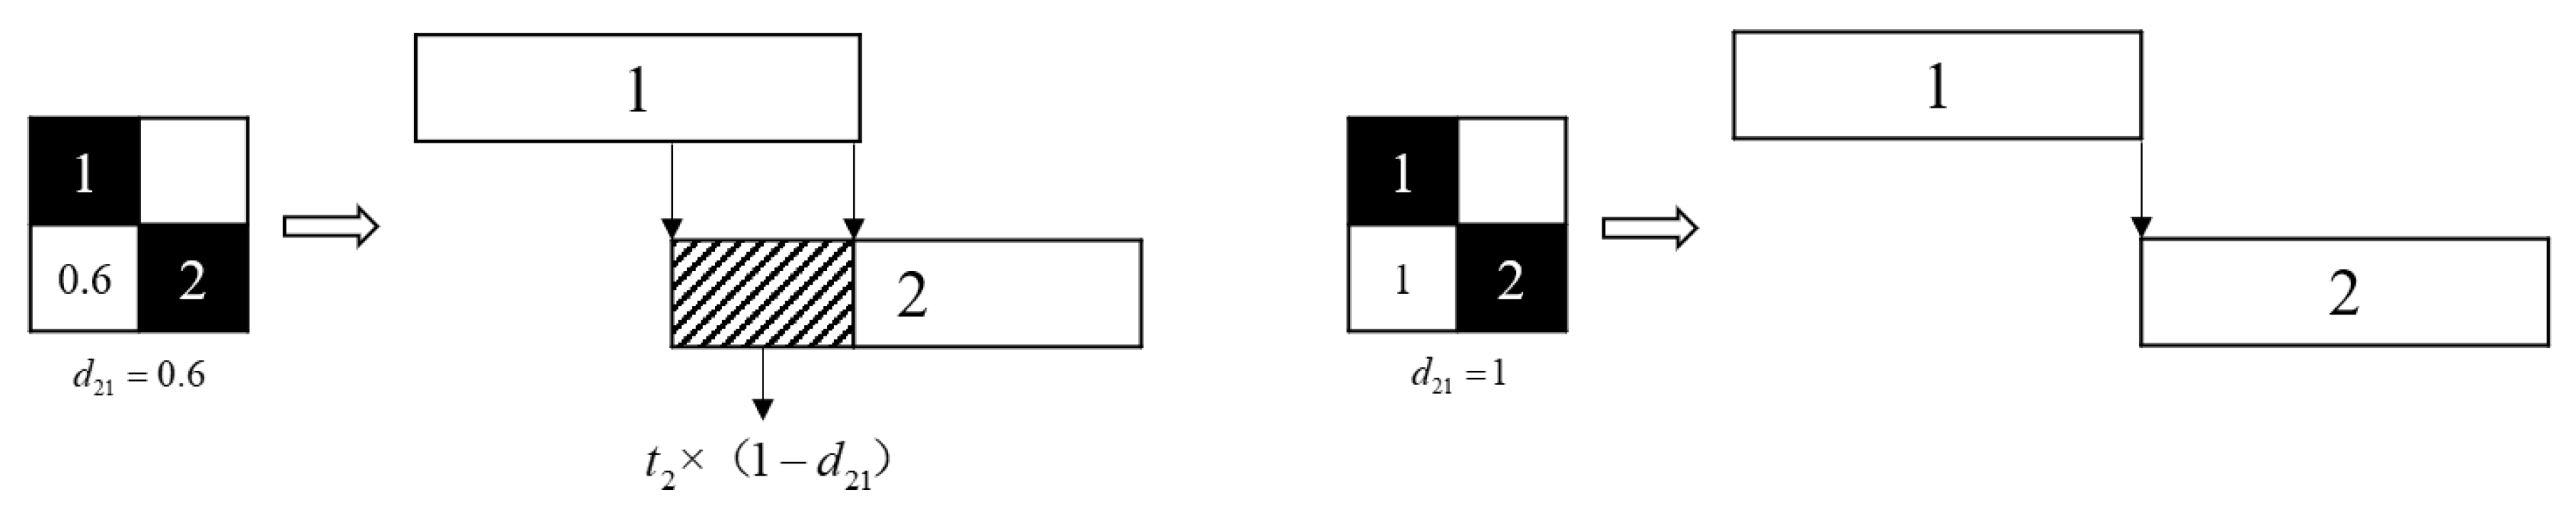
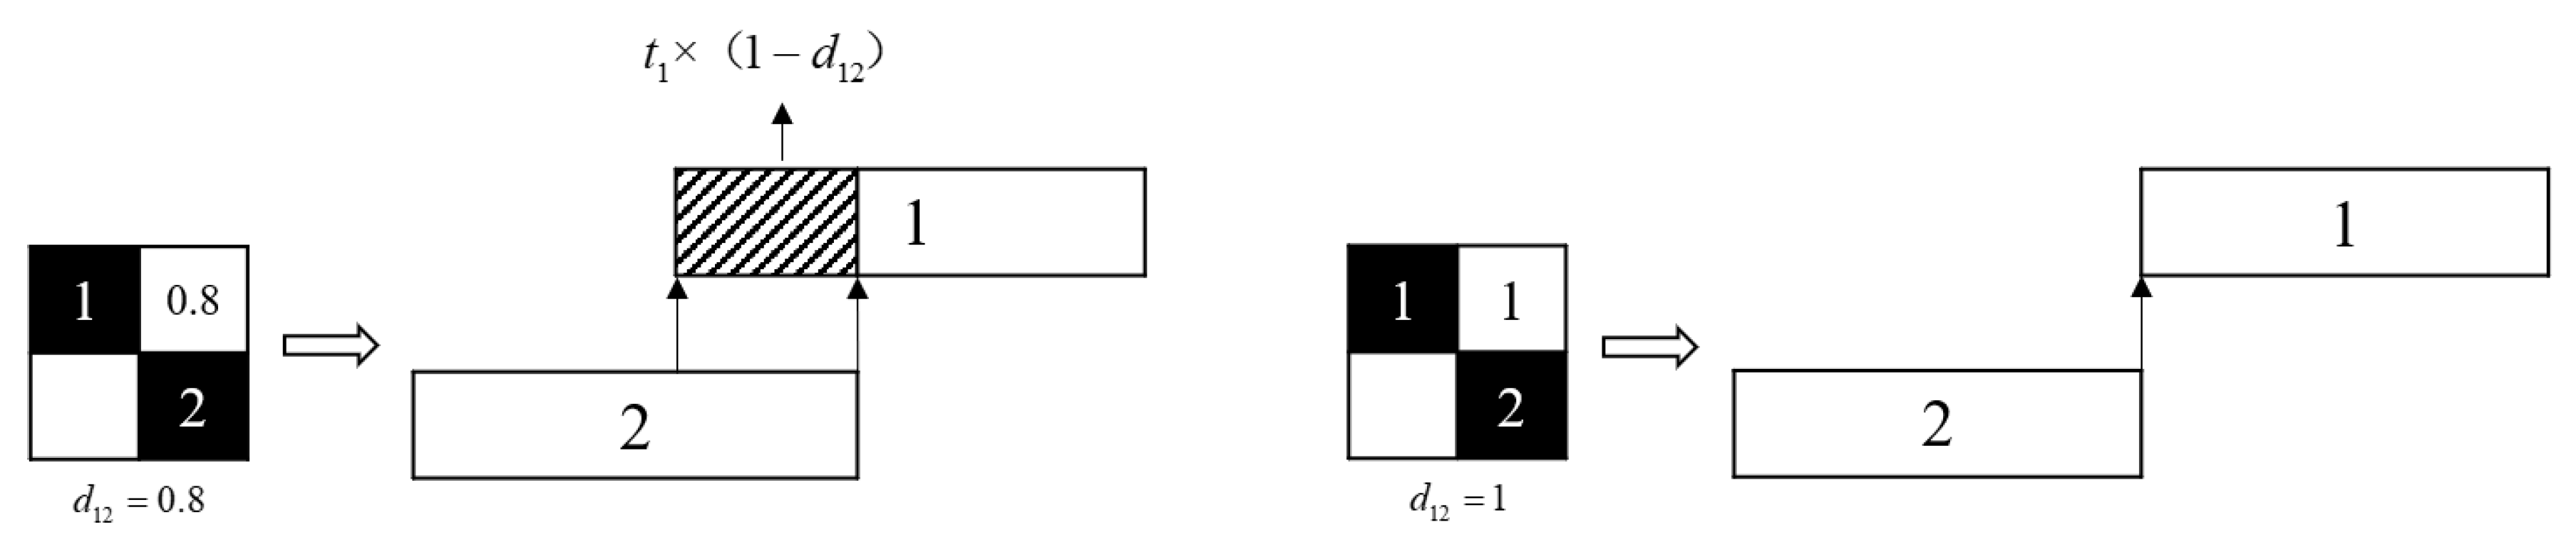
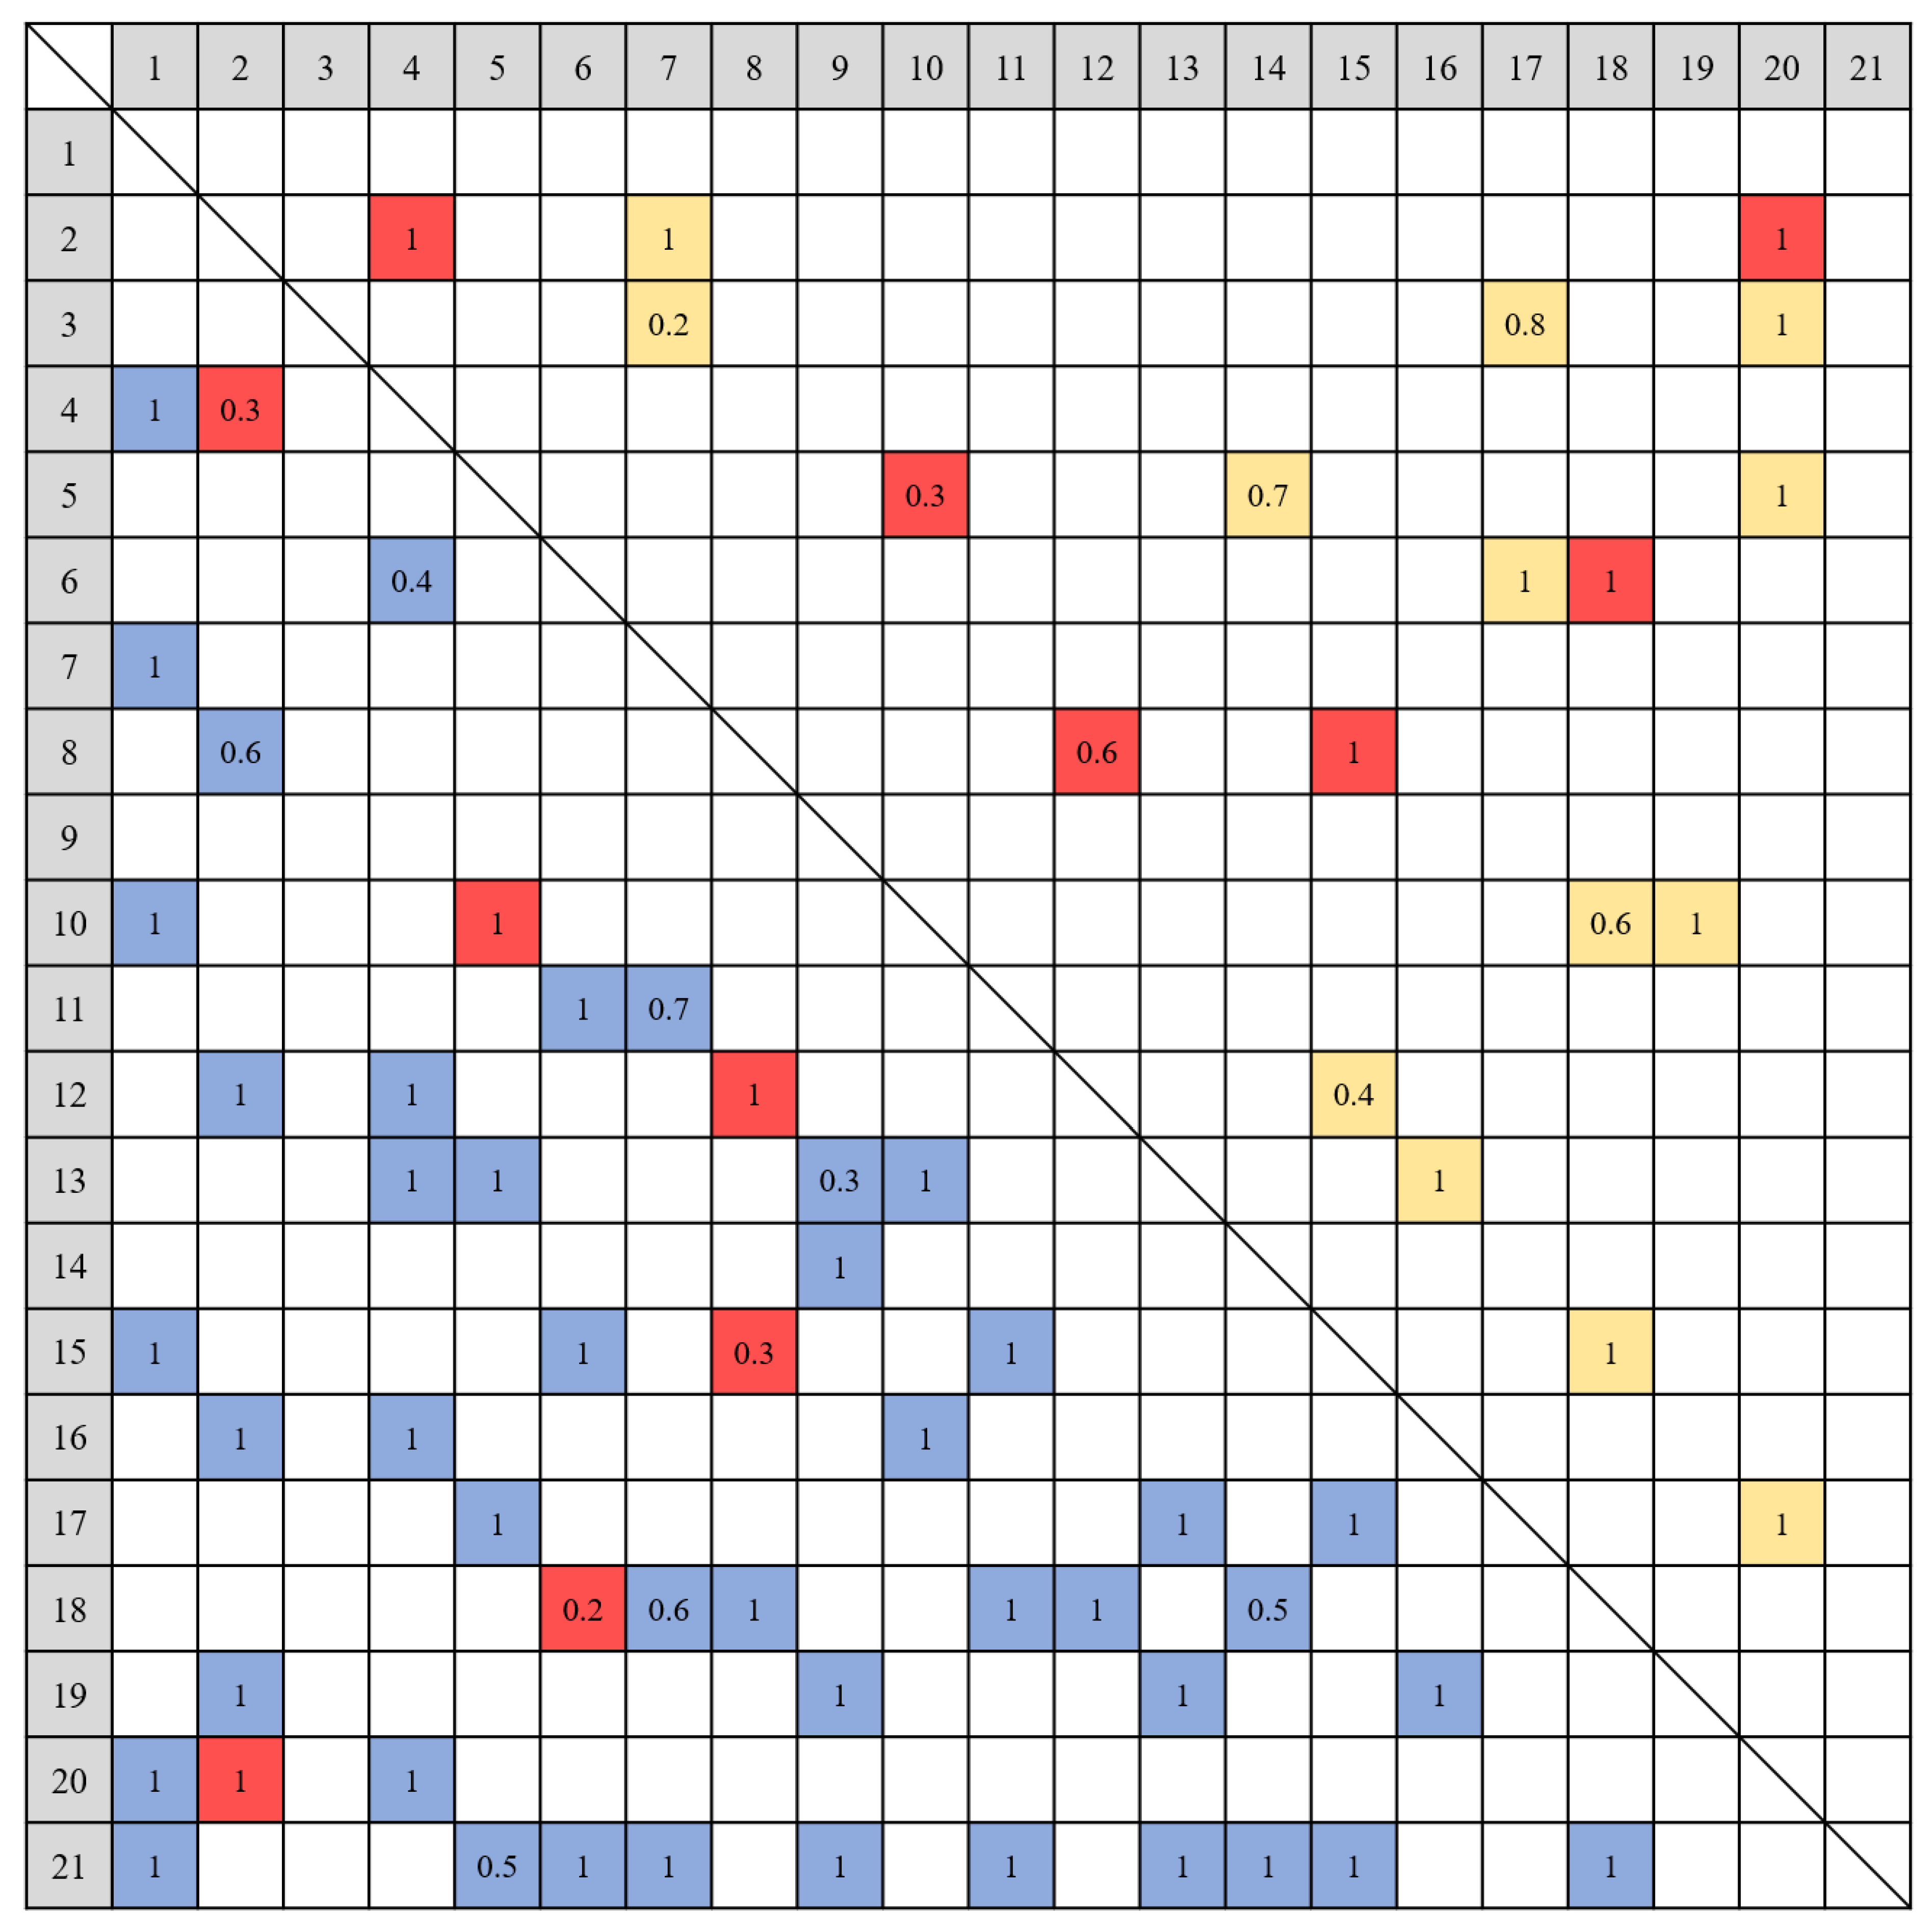
3.1. Numerical DSM-Based Modeling for Design Process Optimization
3.2. Analysis and Establishment of Design Process Optimization Model
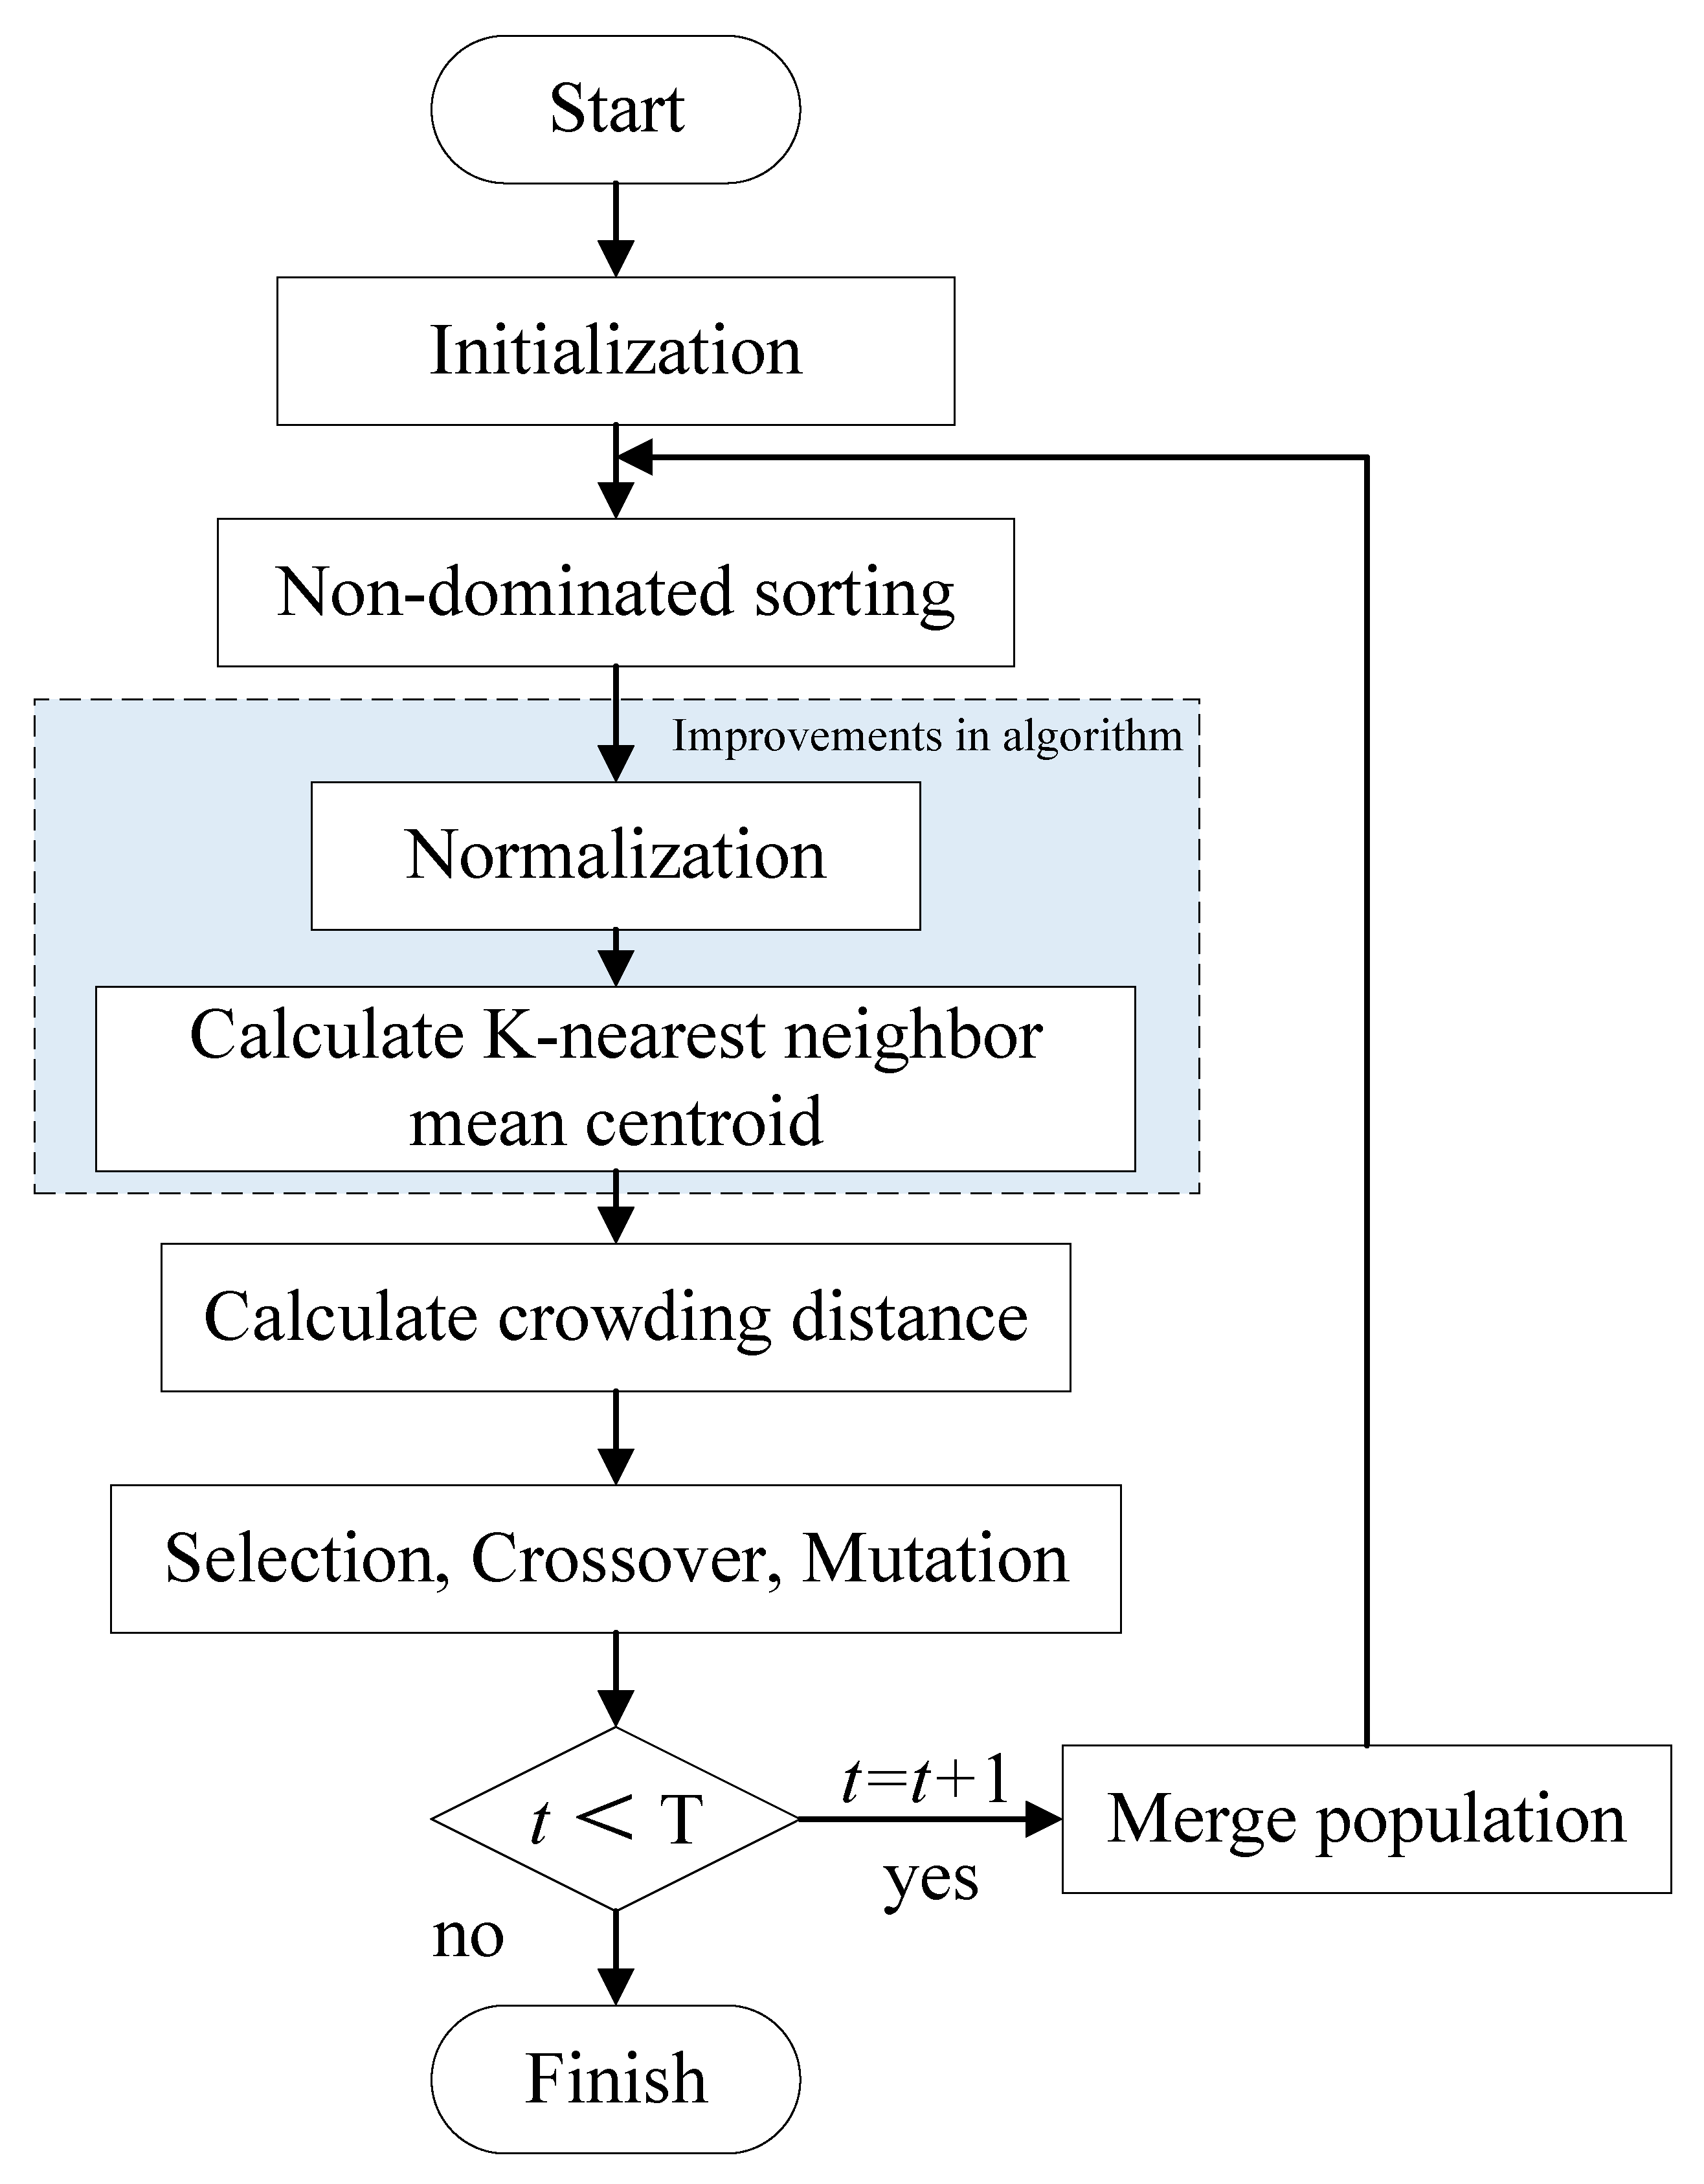
3.3. Optimization of NSGA-II Based on K-Nearest Neighbors’ Mean Centroid
4. Validation and Analysis of Flight Control System Design Case
4.1. Study Case
4.2. Analysis and Discussion
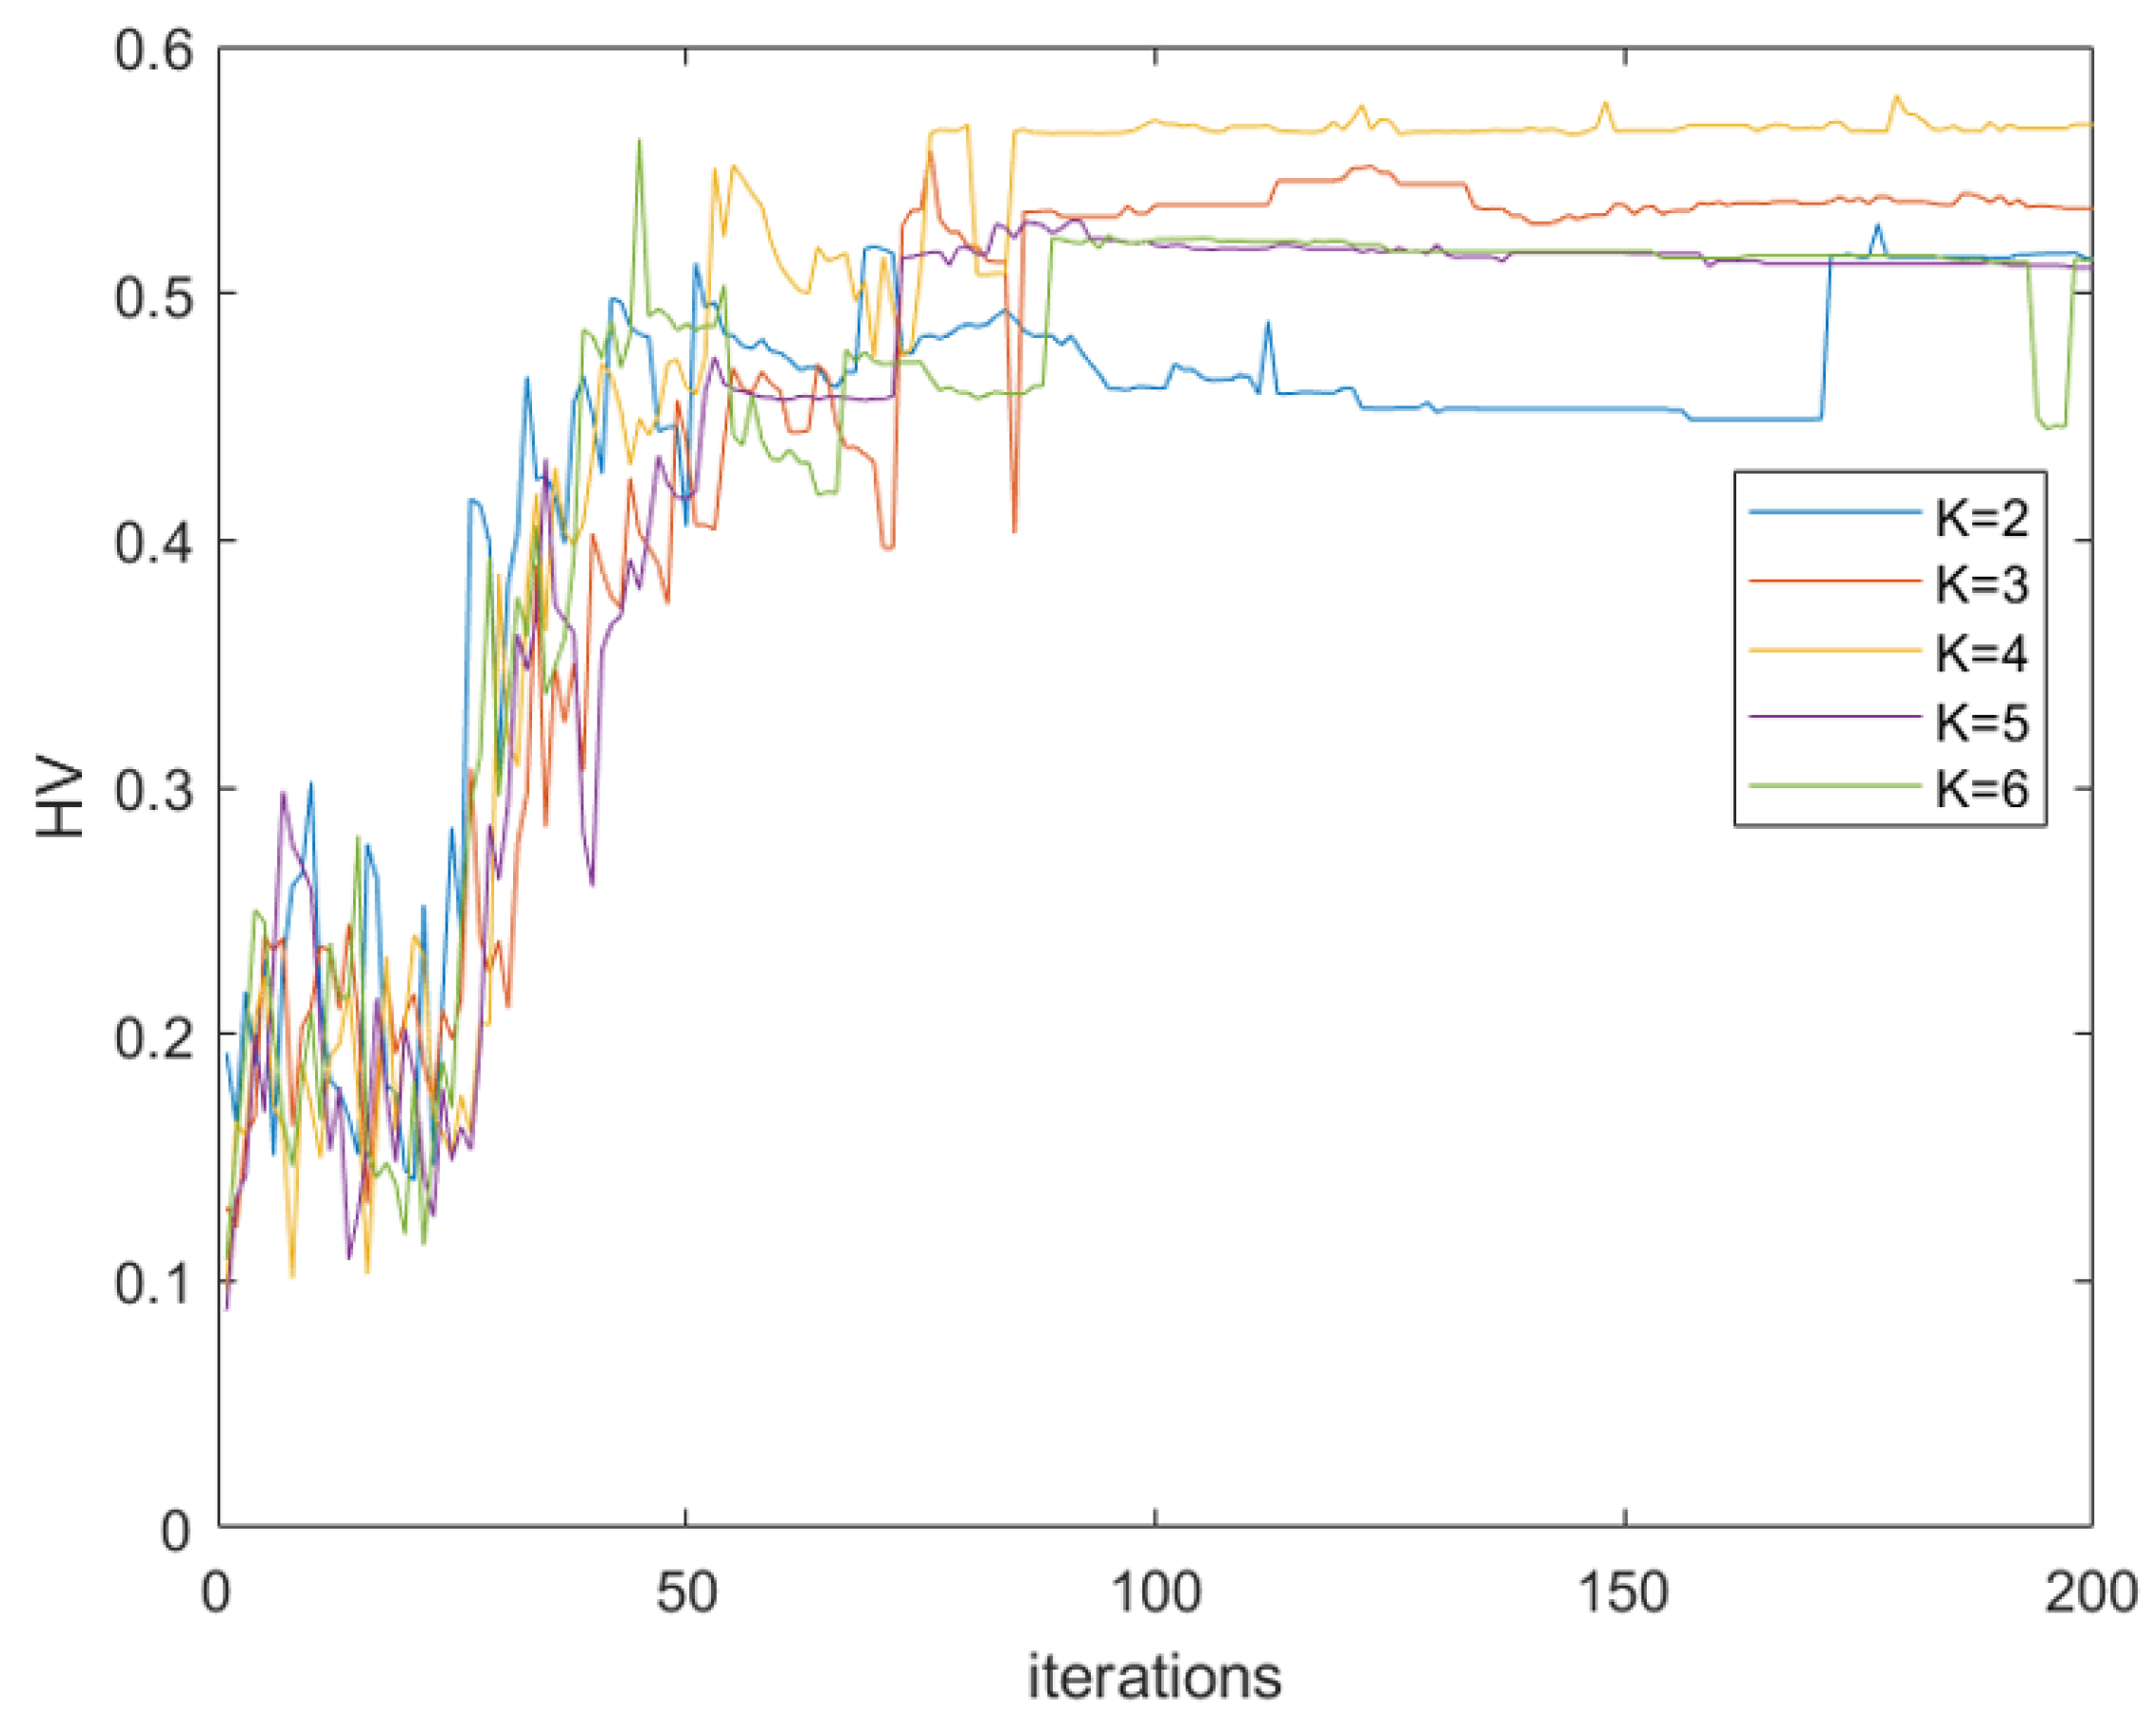
4.2.1. Discussion on the Number of Nearest Neighbors K
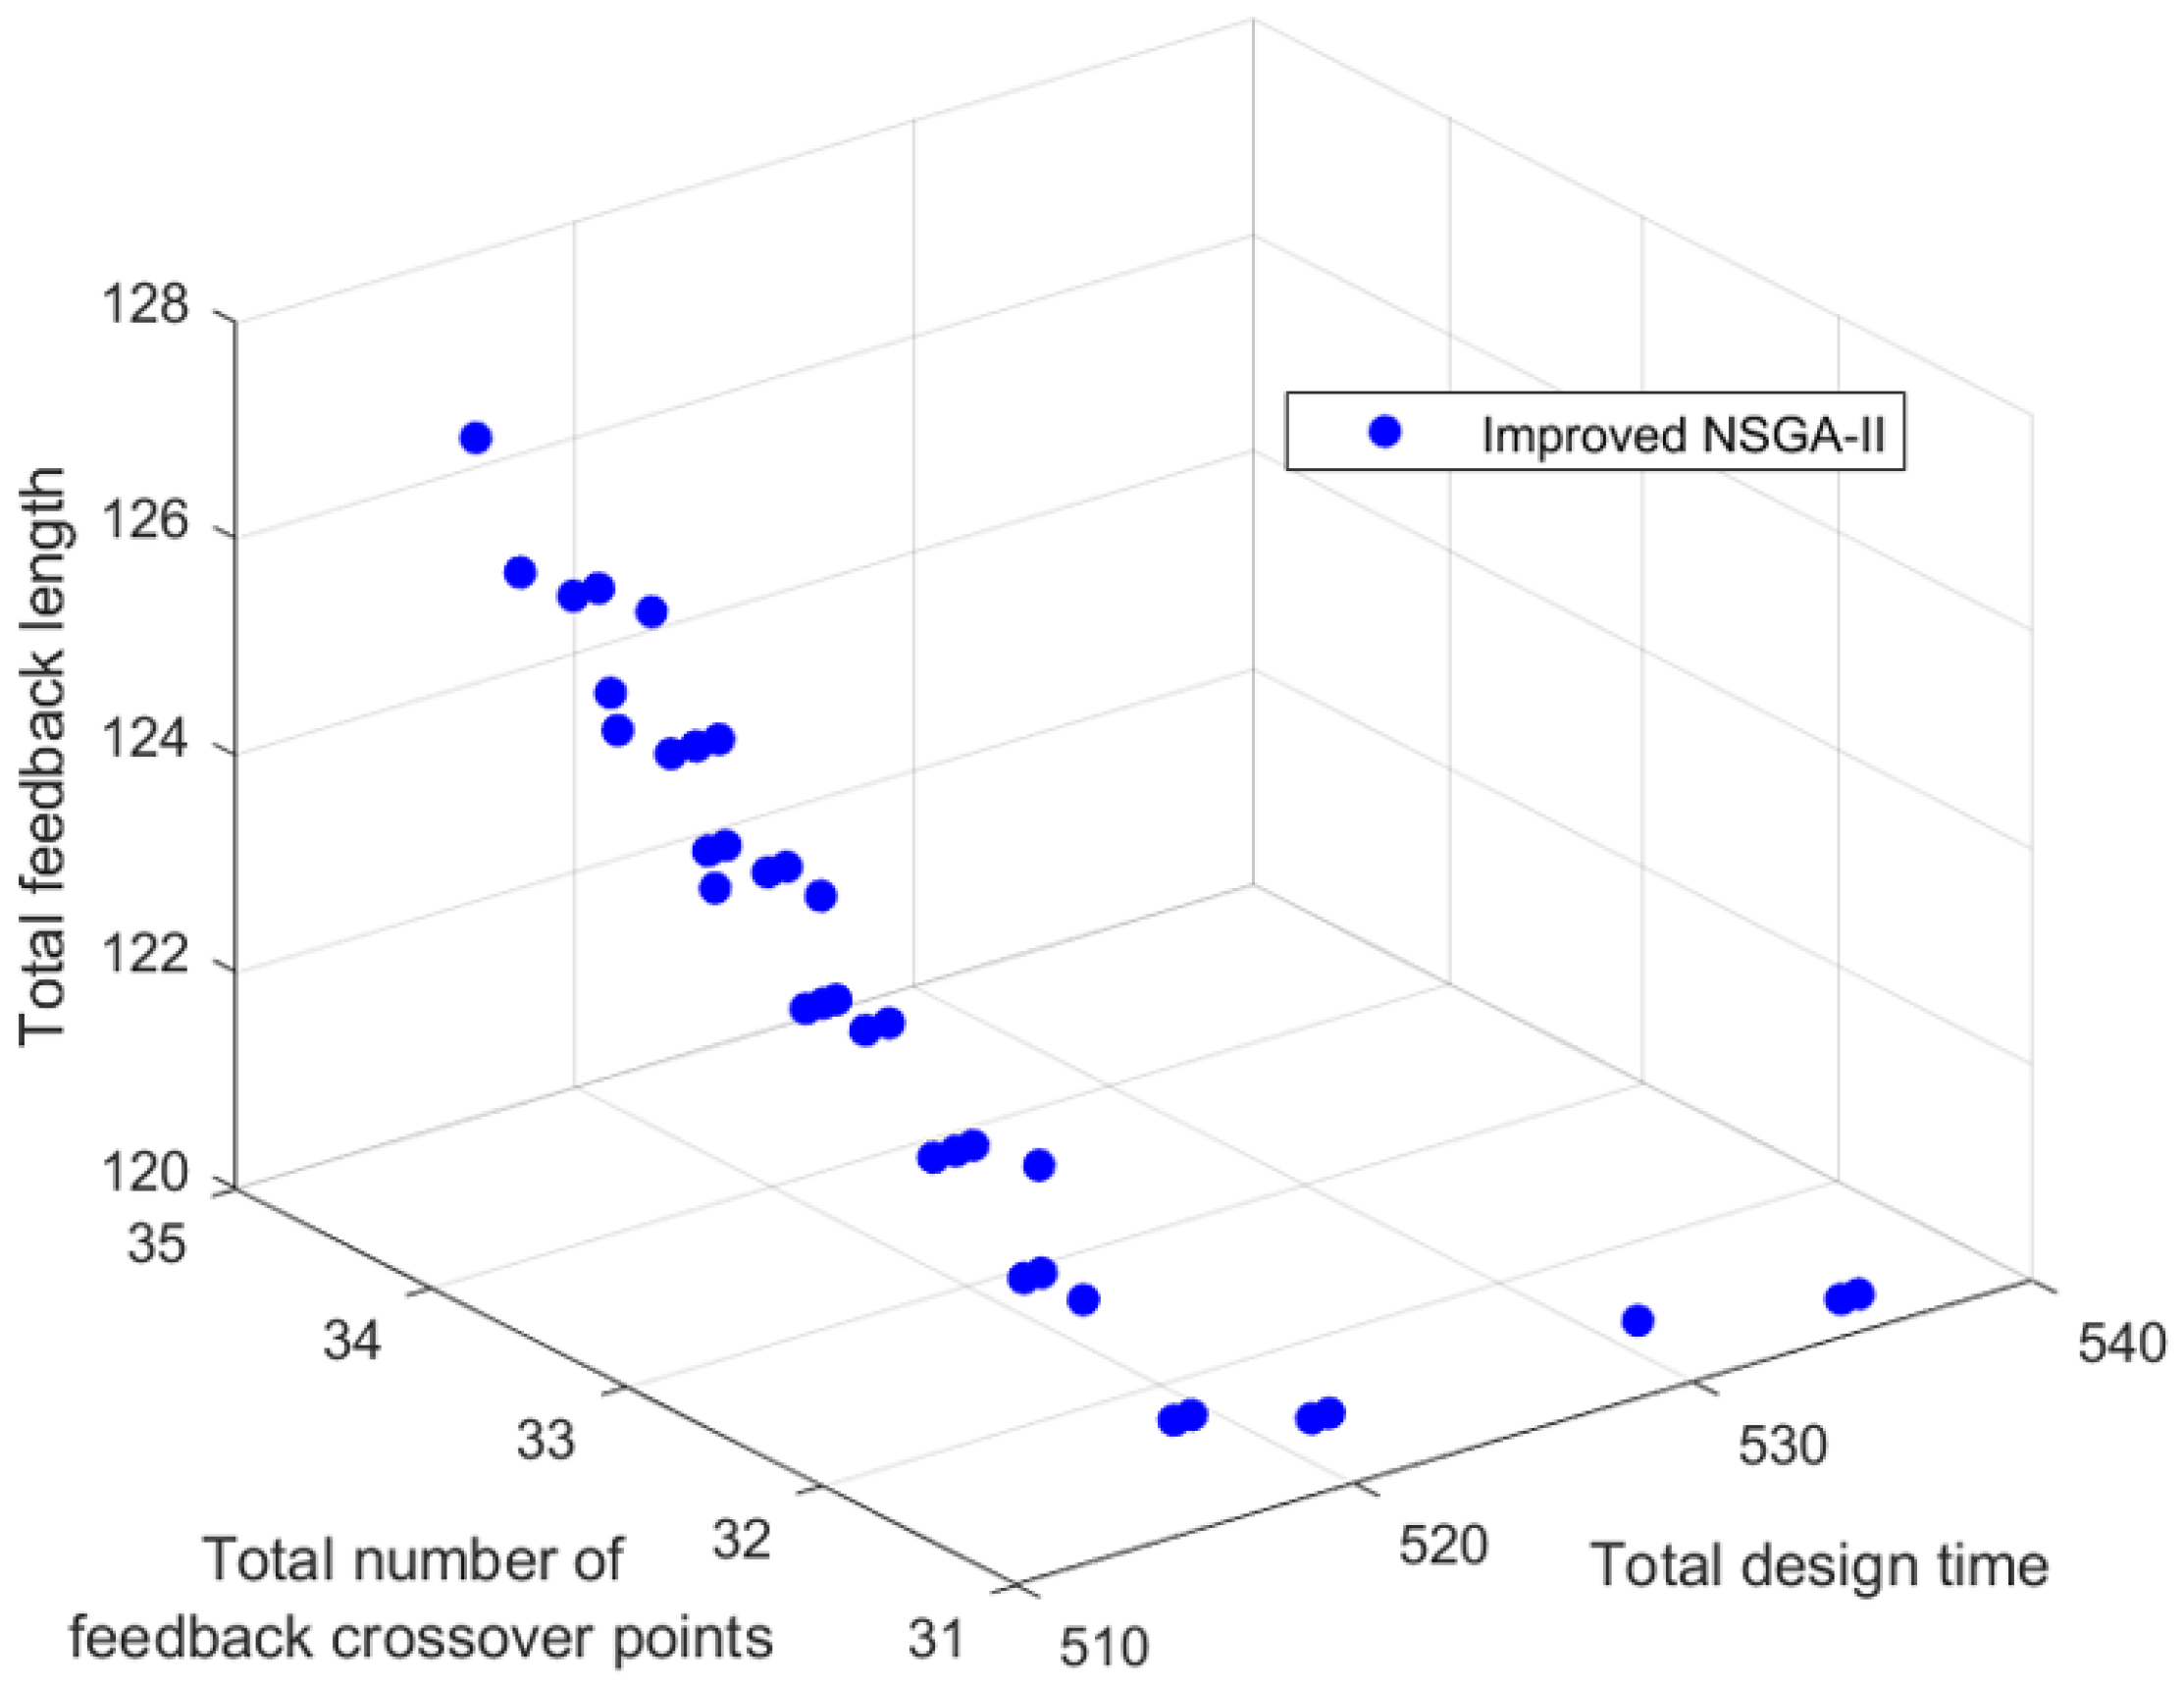
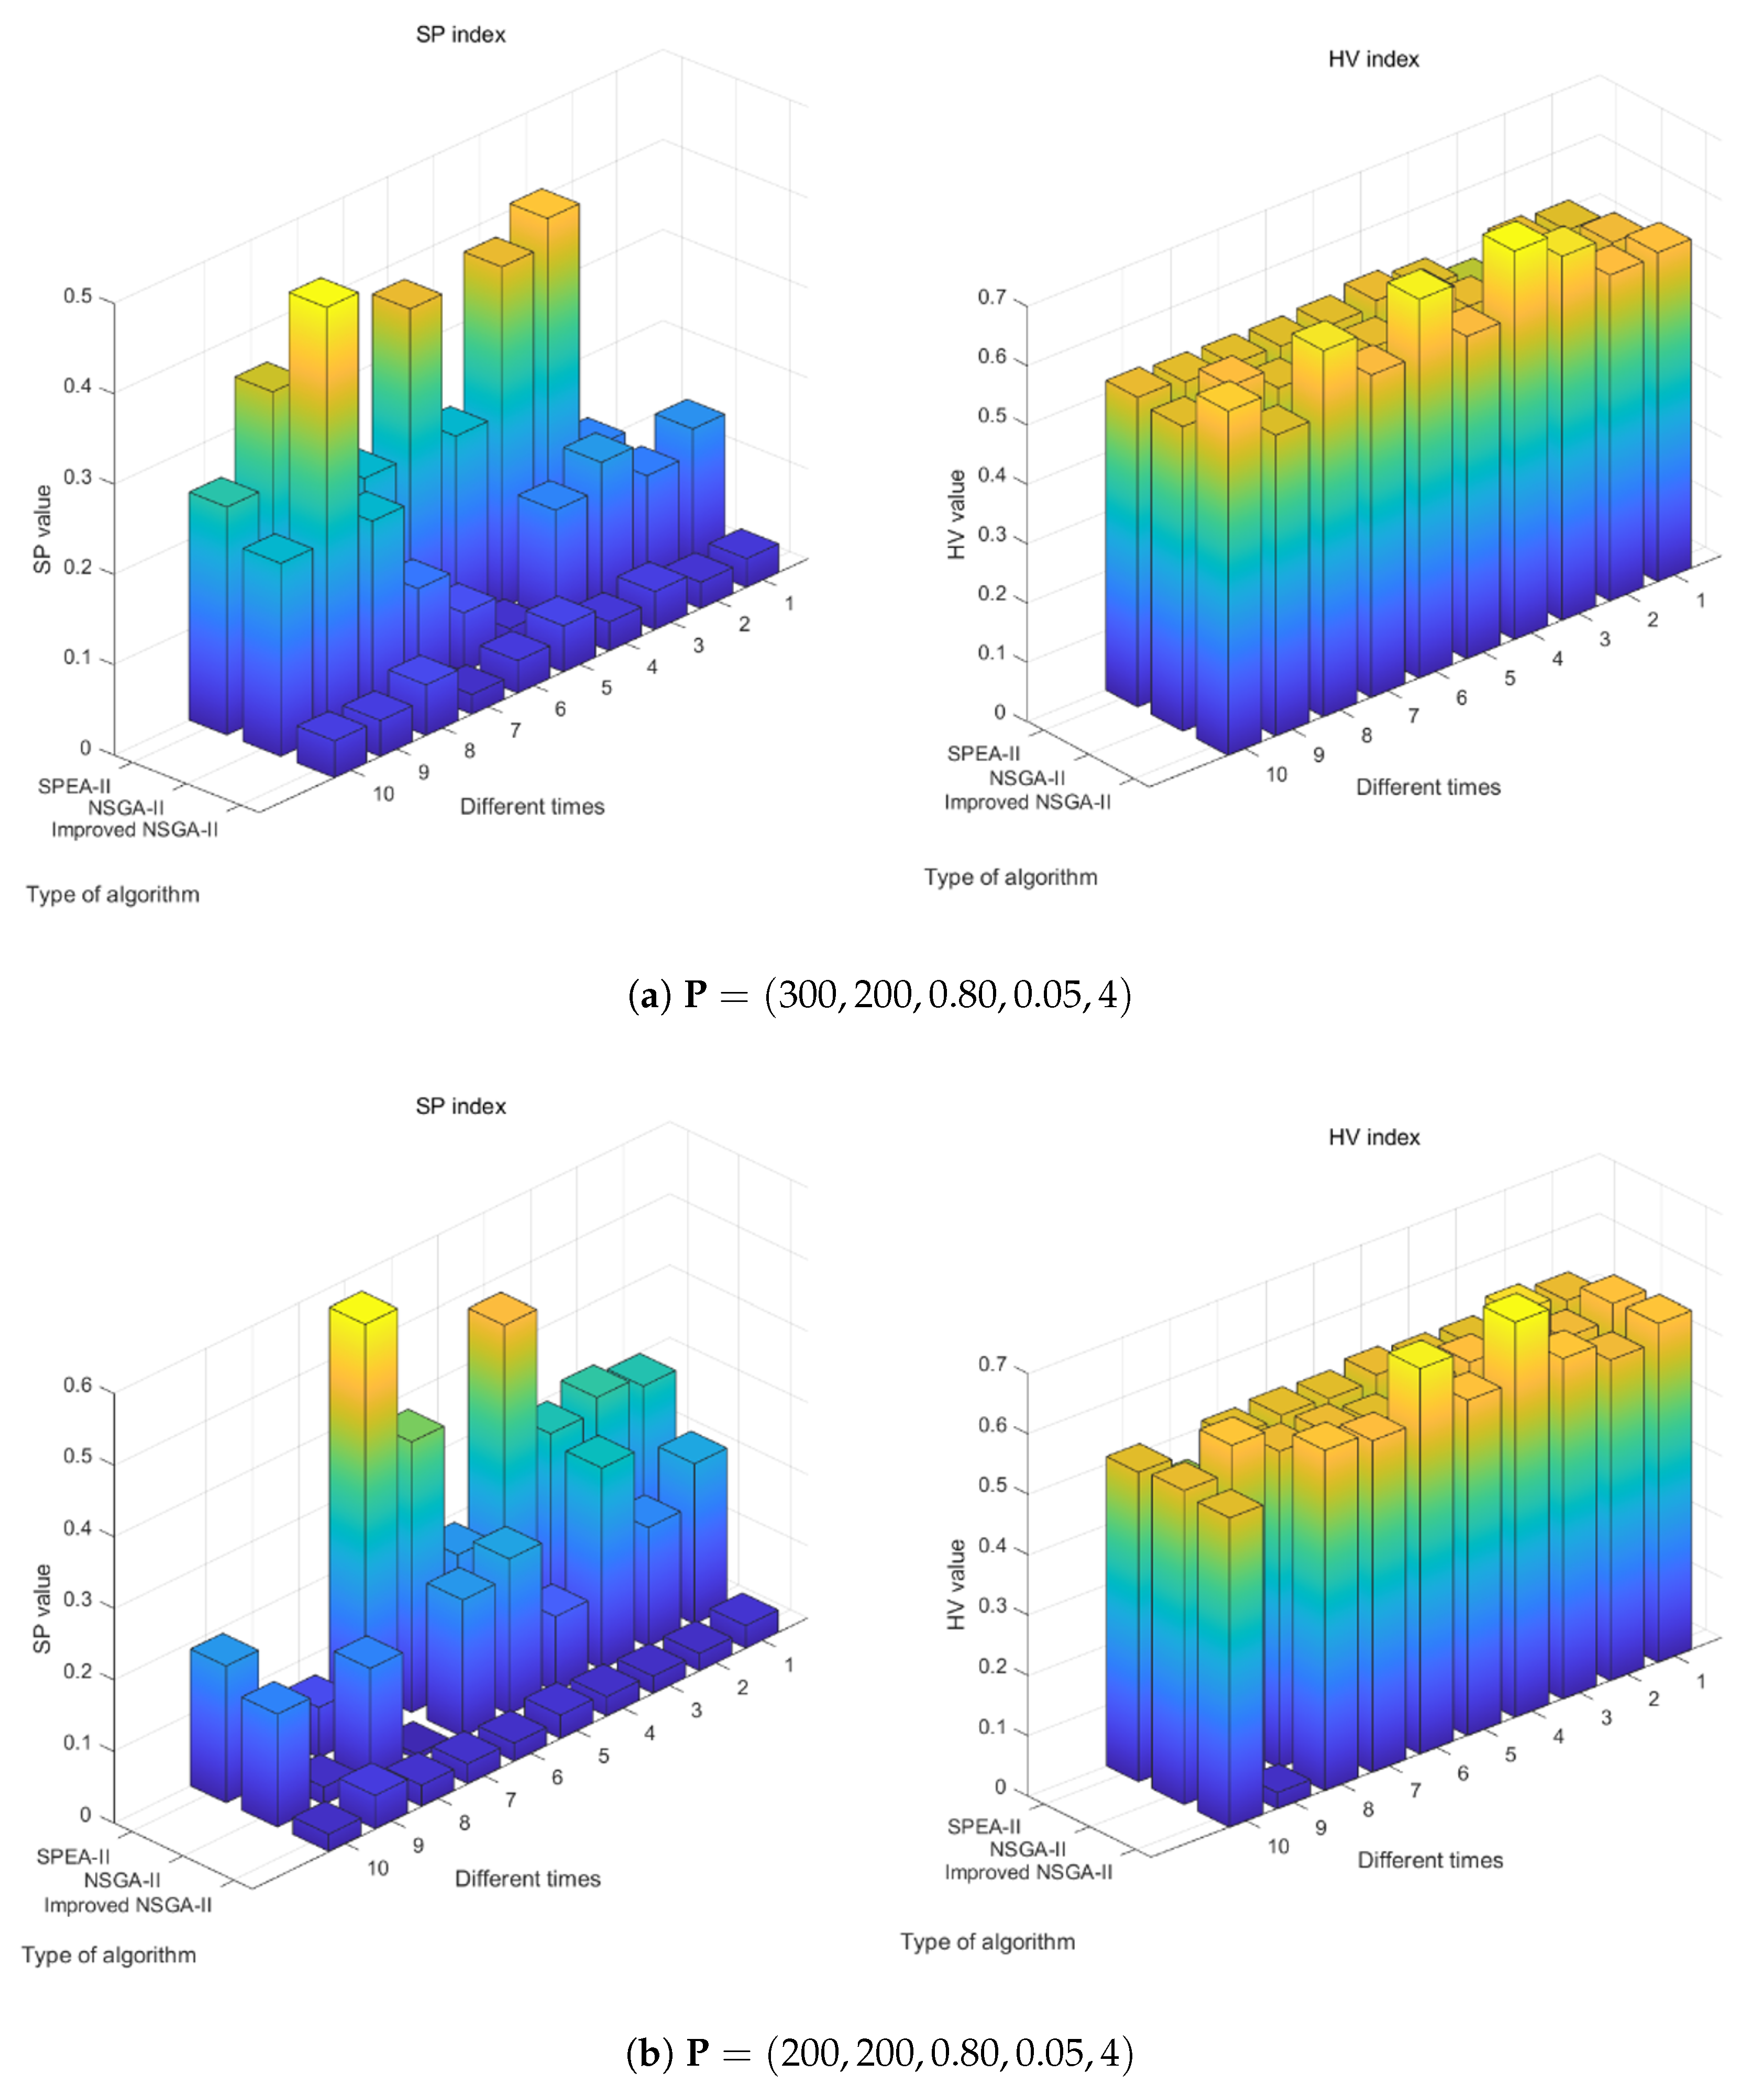
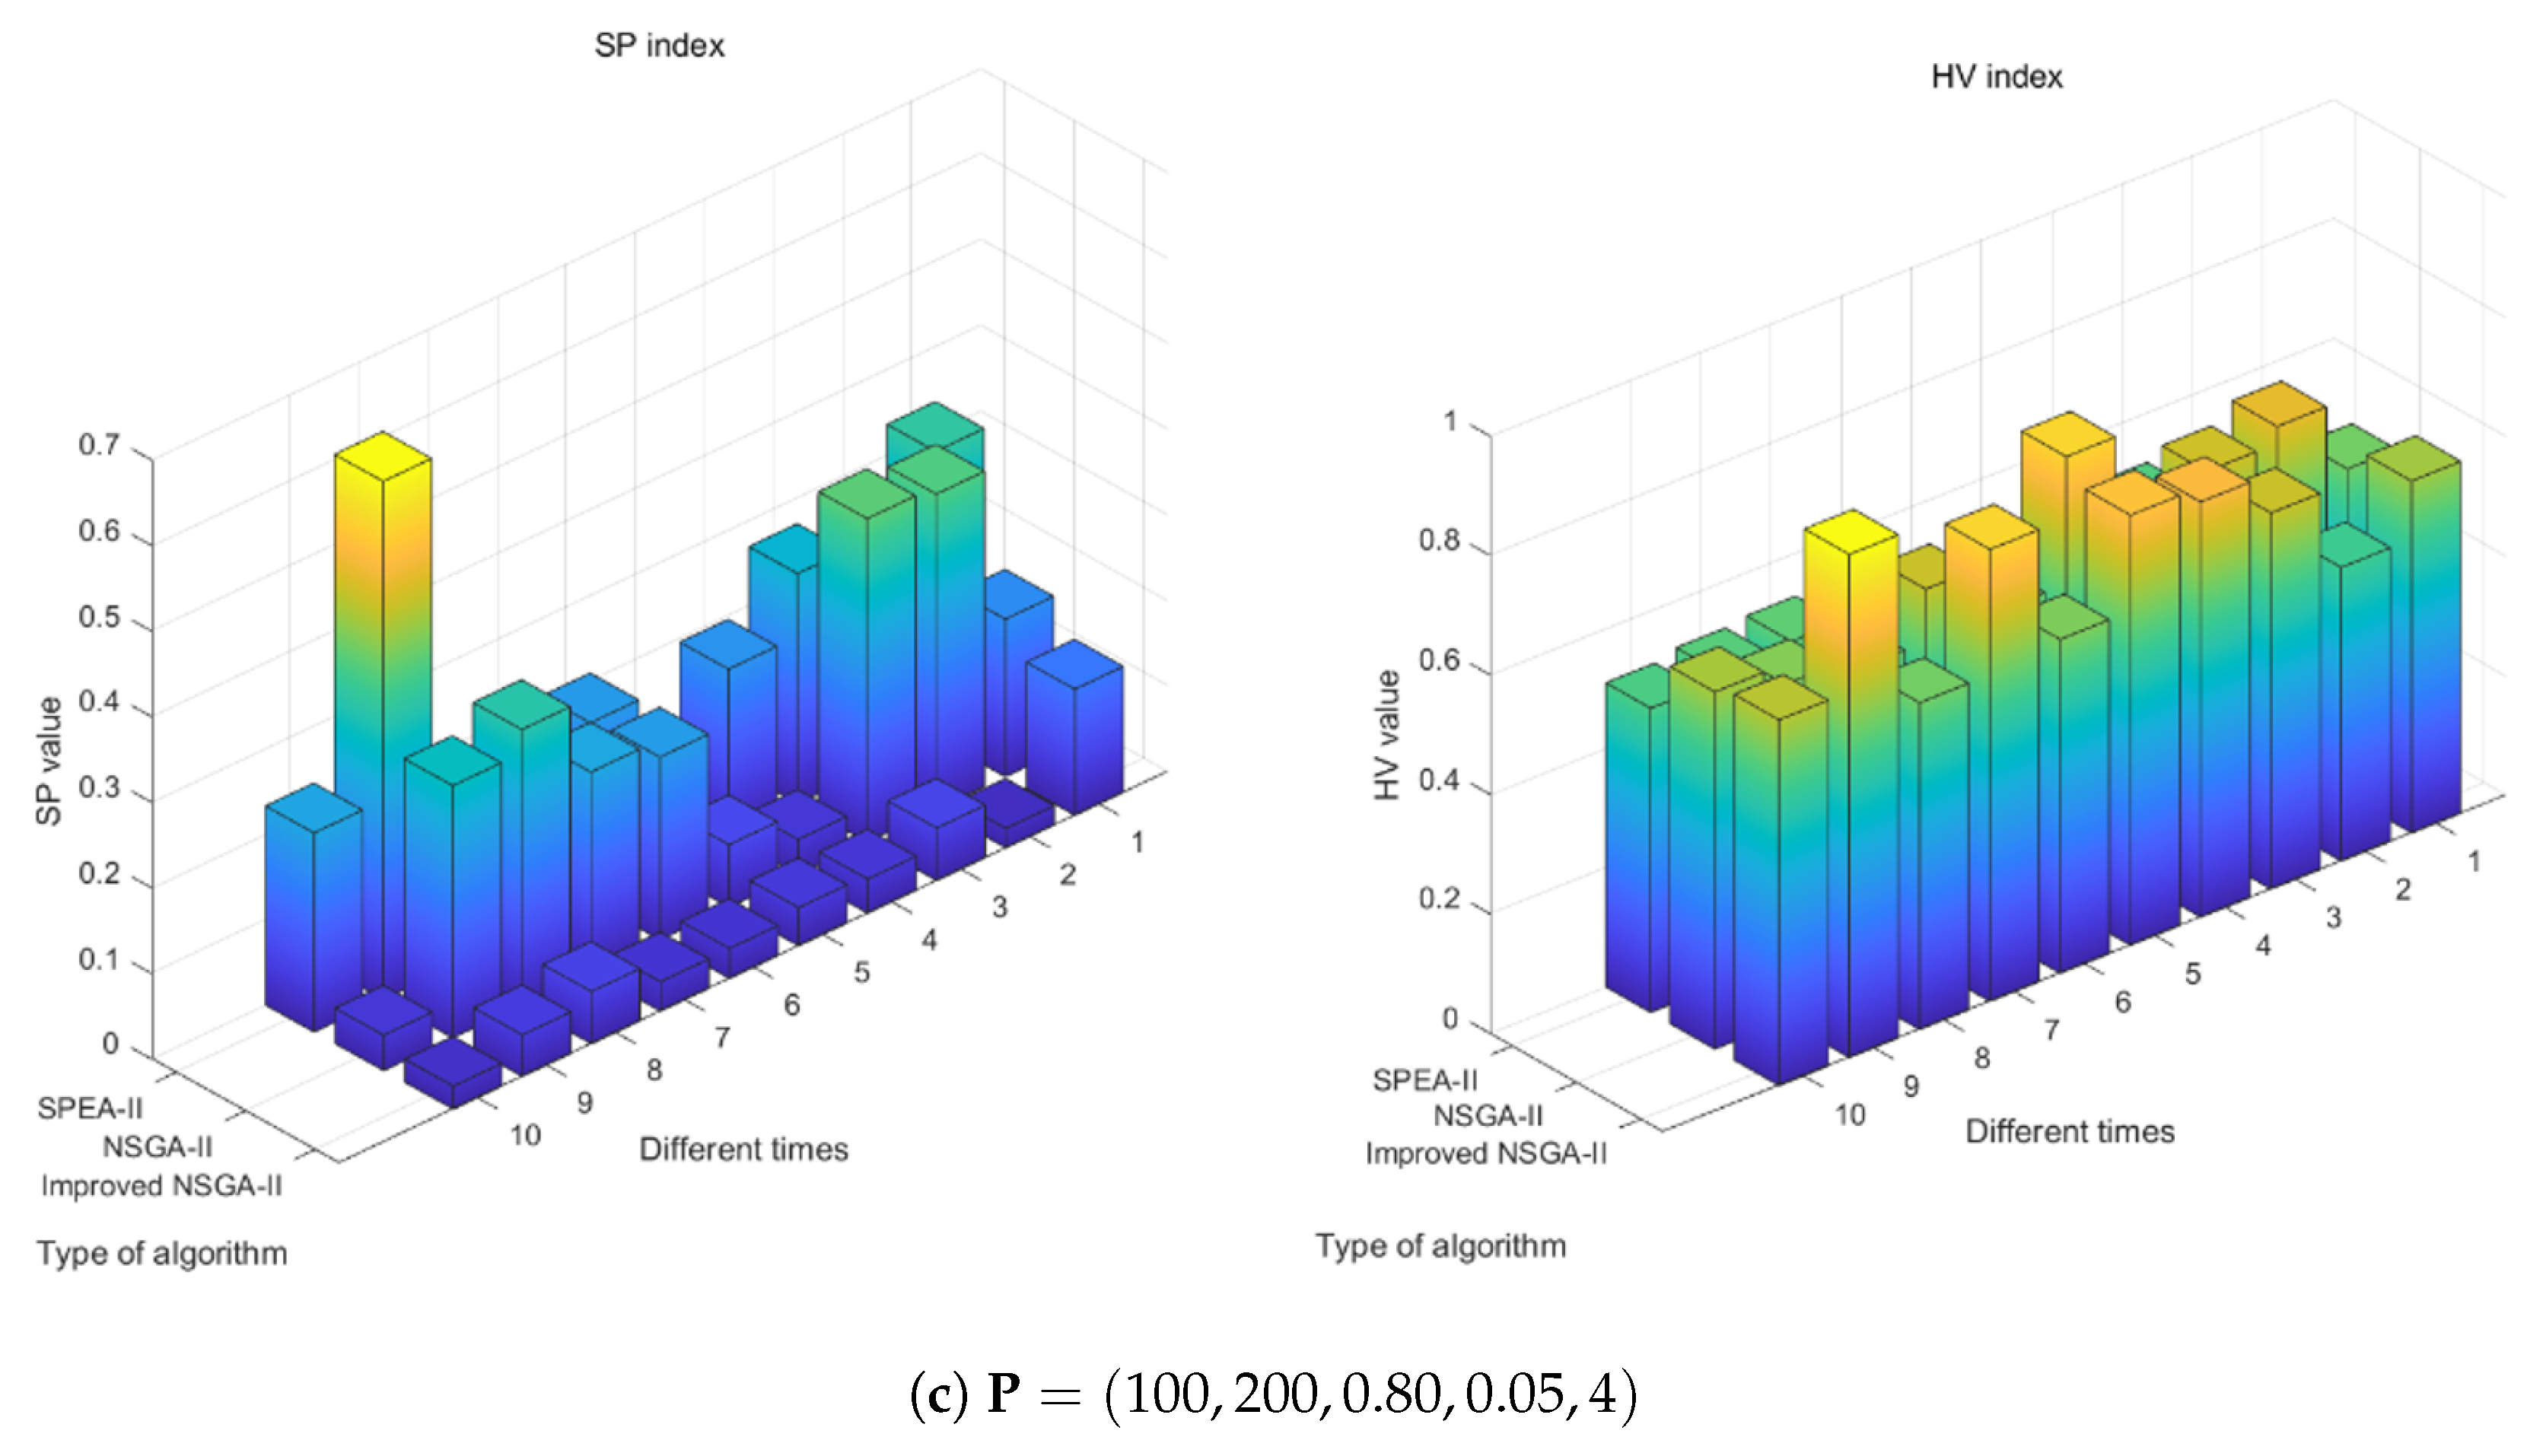
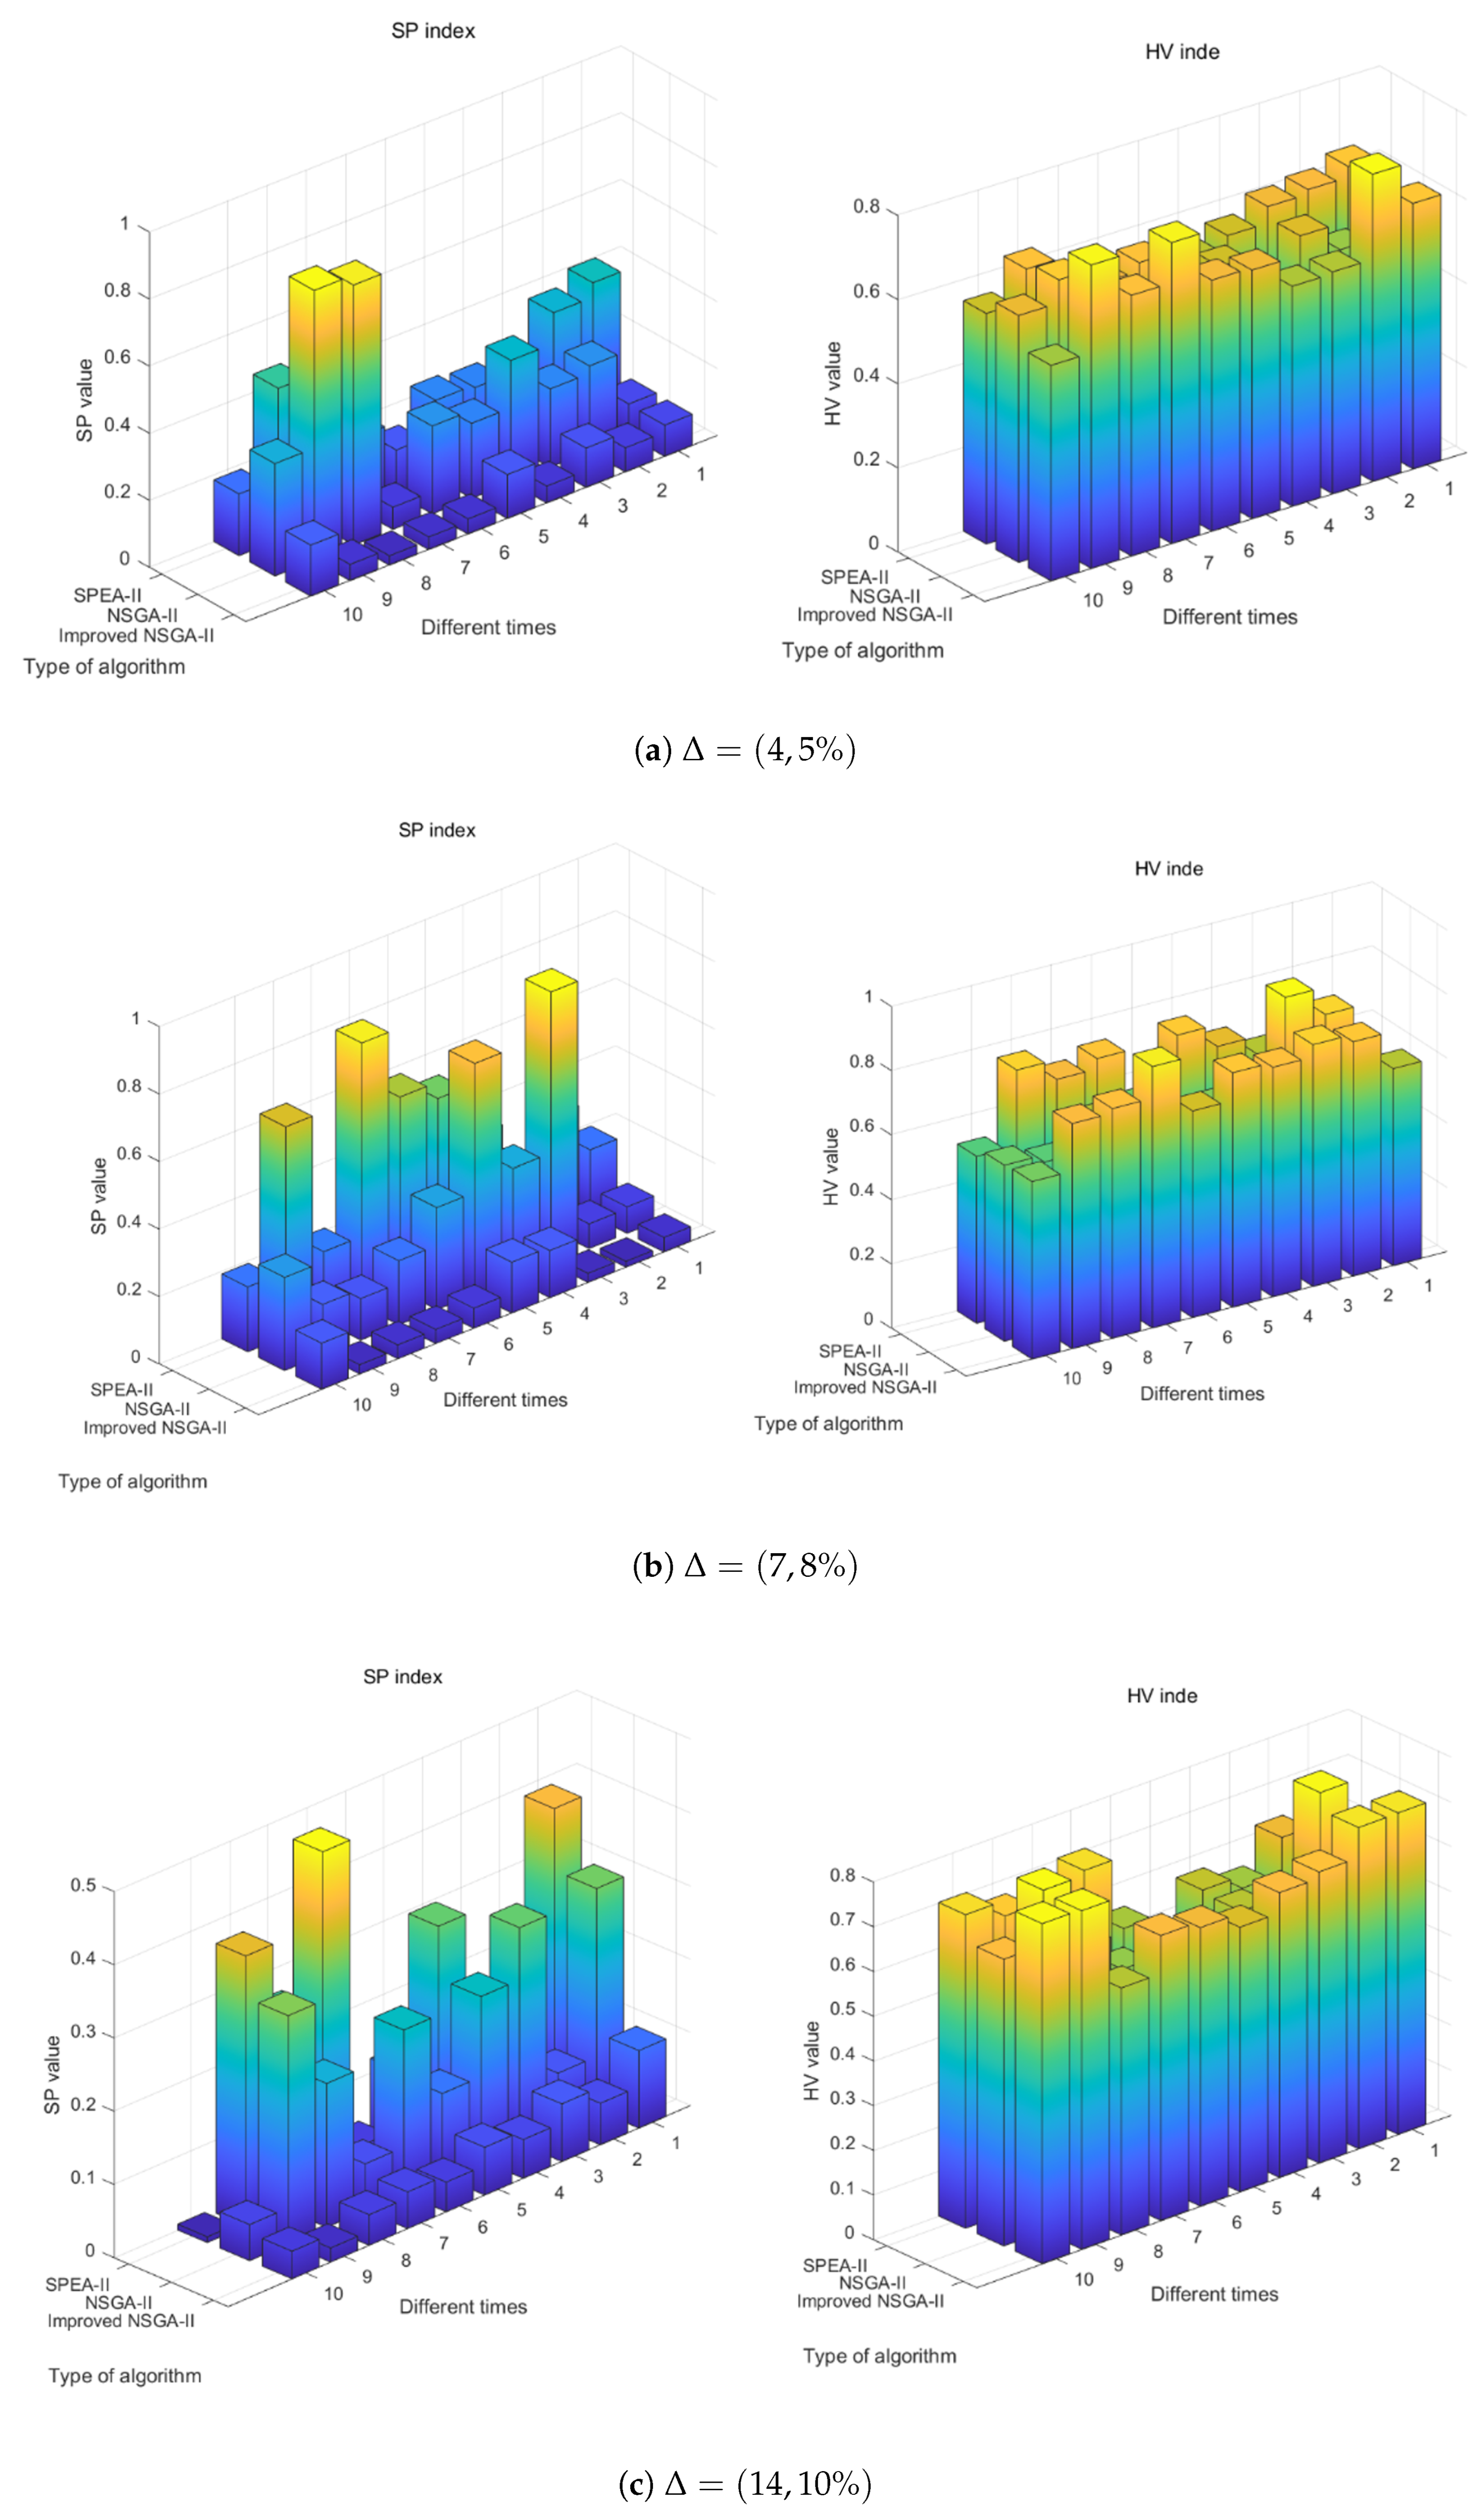
4.2.2. Comparison with Other Algorithms
5. Conclusions and Future Work
Author Contributions
Funding
Data Availability Statement
Conflicts of Interest
References
- Wu, S.; Wang, G.; Lu, J.; Hu, Z.; Yan, Y.; Kiritsis, D. Design ontology for cognitive thread supporting traceability management in model-based systems engineering. J. Ind. Inf. Integr. 2024, 40, 100619. [Google Scholar] [CrossRef]
- Schluse, M.; Priggemeyer, M.; Atorf, L.; Rossmann, J. Experimentable digital twins—Streamlining simulation-based systems engineering for industry 4.0. IEEE Trans. Ind. Inform. 2018, 14, 1722–1731. [Google Scholar] [CrossRef]
- Wade, J.; Adcock, R.; McDermot, T.; Strawser, L. Future systems engineering research directions. In Disciplinary Convergence in Systems Engineering Research; Springer: Berlin/Heidelberg, Germany, 2018; pp. 1165–1179. [Google Scholar]
- Mazeika, D.; Morkevicius, A.; Aleksandraviciene, A. MBSE driven approach for defining problem domain. In Proceedings of the 2016 11th System of Systems Engineering Conference (SoSE), Kongsberg, Norway, 12–16 June 2016; IEEE: Piscataway, NJ, USA, 2016; pp. 1–6. [Google Scholar]
- Henderson, K.; Salado, A. Value and benefits of model-based systems engineering (MBSE): Evidence from the literature. Syst. Eng. 2021, 24, 51–66. [Google Scholar] [CrossRef]
- D’Ambrosio, J.; Soremekun, G. Systems engineering challenges and MBSE opportunities for automotive system design. In Proceedings of the 2017 IEEE International Conference on Systems, Man, and Cybernetics (SMC), Banff, AB, Canada, 5–8 October 2017; IEEE: Piscataway, NJ, USA, 2017; pp. 2075–2080. [Google Scholar]
- Lu, J.; Ma, J.; Zheng, X.; Wang, G.; Li, H.; Kiritsis, D. Design ontology supporting model-based systems engineering formalisms. IEEE Syst. J. 2021, 16, 5465–5476. [Google Scholar] [CrossRef]
- Ma, J.; Wang, G.; Lu, J.; Vangheluwe, H.; Kiritsis, D.; Yan, Y. Systematic literature review of MBSE tool-chains. Appl. Sci. 2022, 12, 3431. [Google Scholar] [CrossRef]
- Fan, Q.; Bi, W.; Wang, Y.; Li, M.; Zhang, A. Research on the Method of Constructing a Meta-model for the Civil Aircraft Design Process. In Proceedings of the 2023 Asia-Pacific International Symposium on Aerospace Technology (APISAT 2023), Lingshui, China, 16–17 October 2023; Springer: Berlin/Heidelberg, Germany, 2023; pp. 411–421. [Google Scholar]
- Bruggeman, A.L.M.; La Rocca, G. From Requirements to Product: An MBSE Approach for the Digitalization of the Aircraft Design Process. In Proceedings of the 33rd Annual INCOSE International Symposium, Honolulu, HI, USA, 15–20 July 2023; Wiley Online Library: Hoboken, NJ, USA, 2023; Volume 33, pp. 1688–1706. [Google Scholar]
- Fan, Q.C.; Bi, W.H.; Zhang, A.; Wang, W.H. MBSE modeling method of civil aircraft altitude control system. Syst. Eng. Electron. 2022, 44, 164. [Google Scholar] [CrossRef]
- Ahmadi, R.; Roemer, T.A.; Wang, R.H. Structuring product development processes. Eur. J. Oper. Res. 2001, 130, 539–558. [Google Scholar] [CrossRef]
- Tang, H.; Zhong, Q.; Chen, C. Process optimization for post disaster reconstruction project based on industrial design structure matrix (DSM). Soft Comput. 2022, 26, 8731–8743. [Google Scholar] [CrossRef]
- Sinha, K.; Han, S.Y.; Suh, E.S. Design structure matrix-based modularization approach for complex systems with multiple design constraints. Syst. Eng. 2020, 23, 211–220. [Google Scholar] [CrossRef]
- Yang, X. DSM Based Optimization to the Design Process of Prefabricated Construction. In Proceedings of the 9th International Conference on Civil Engineering (ICCE2022), Nanchang, China, 24 December 2022; Springer Nature: Singapore, 2022; pp. 275–290. [Google Scholar]
- Suryono, Y.B.; Hasbullah, H. Analysis of new production line project improvement through critical path method (cpm), design structure matrix (dsm) and program evaluation and review (pert). J. Ind. Eng. Manag. Res. 2020, 1, 9–17. [Google Scholar]
- Arnarsson, Í.Ö.; Gustavsson, E.; Jirstrand, M.; Malmqvist, J. Modeling industrial engineering change processes using the design structure matrix for sequence analysis: A comparison of multiple projects. Des. Sci. 2020, 6, e6. [Google Scholar] [CrossRef]
- Pons, W.; Cordero, S.S.; Vingerhoeds, R. Design structure matrix generation from open-source mbse tools. In Proceedings of the 2021 IEEE International Symposium on Systems Engineering (ISSE), Vienna, Austria, 3 September–13 October 2021; IEEE: Piscataway, NJ, USA, 2021; pp. 1–8. [Google Scholar]
- Sosa, M.E.; Eppinger, S.D.; Rowles, C.M. The misalignment of product architecture and organizational structure in complex product development. Manag. Sci. 2004, 50, 1674–1689. [Google Scholar] [CrossRef]
- Lu, G.; Gang, Y.; Xianhui, L.; Enze, Z.; Hu, C.; Xiaohui, W. An architecture decomposition method of pneumatic catapult system based on OPM and DSM. Chin. J. Aeronaut. 2023, 36, 168–181. [Google Scholar]
- Eppinger, S. Design Structure Matrix Methods and Applications; MIT Press: Cambridge, MA, USA, 2012. [Google Scholar]
- Clarkson, P.J.; Simons, C.; Eckert, C. Predicting change propagation in complex design. J. Mech. Des. 2004, 126, 788–797. [Google Scholar] [CrossRef]
- Minogue, P. Part II: Project and process management: Project Risk Management using DSMs. In Reducing Risk in Innovation; Scheurmann, E., Maurer, M., Schmidt, D., Lindemann, U., Eds.; William Andrew Publishing: Norwich, NY, USA, 2013; pp. 27–36. [Google Scholar] [CrossRef]
- Jiang, Y.; Yin, B.; Jia, D. Research for aircraft design process optimization based on design structure matrix. J. Phys. Conf. Ser. 2021, 1732, 012042. [Google Scholar] [CrossRef]
- Giffin, M.; de Weck, O.; Bounova, G.; Keller, R.; Eckert, C.; Clarkson, P.J. Change Propagation Analysis in Complex Technical Systems. J. Mech. Des. 2009, 131, 081001. [Google Scholar] [CrossRef]
- Wang, Y.; Mou, S.; Wu, Y. Storage assignment optimization in a multi-tier shuttle warehousing system. Chin. J. Mech. Eng. 2016, 29, 421–429. [Google Scholar] [CrossRef]
- Fava, L.P.; Furtado, J.C.; Helfer, G.A.; Barbosa, J.L.V.; Beko, M.; Correia, S.D.; Leithardt, V.R.Q. A multi-start algorithm for solving the capacitated vehicle routing problem with two-dimensional loading constraints. Symmetry 2021, 13, 1697. [Google Scholar] [CrossRef]
- Boysen, N.; Stephan, K. A survey on single crane scheduling in automated storage/retrieval systems. Eur. J. Oper. Res. 2016, 254, 691–704. [Google Scholar] [CrossRef]
- Alikar, N.; Mousavi, S.M.; Ghazilla, R.A.R.; Tavana, M.; Olugu, E.U. Application of the NSGA-II algorithm to a multi-period inventory-redundancy allocation problem in a series-parallel system. Reliab. Eng. Syst. Saf. 2017, 160, 1–10. [Google Scholar] [CrossRef]
- Whitfield, R.I.; Duffy, A.H.; Coates, G.; Hills, W. Efficient process optimization. Concurr. Eng. 2003, 11, 83–92. [Google Scholar] [CrossRef]


| DSM [14,15] | Petri Net | IDEFx | CPM and ERT [16] | |
|---|---|---|---|---|
| Ability to describe the process | Strong | Strong | Strong | Strong |
| Ability to analyze iterations | Strong | Normal | Normal | Normal |
| Reusability of model | Normal | Strong | Normal | weak |
| Performance of dynamic representation | Normal | Normal | Weak | Weak |
| Support for time performance analysis | No | Yes | No | Yes |
| Support for simulation software | Yes | Yes | No | Yes |
| Task No. | Task Name | Units of Time Required |
|---|---|---|
| 1 | Requirements analysis and system specification | 22.0 |
| 2 | System architecture design | 36.0 |
| 3 | Hardware platform selection | 36.0 |
| 4 | Software architecture design | 59.7 |
| 5 | System dynamics modeling | 36.0 |
| 6 | Control module control law design | 21.0 |
| 7 | Automatic control system logic hierarchy | 18.0 |
| 8 | Attitude control module design | 36.0 |
| 9 | Auto-throttle design | 20.0 |
| 10 | Control law optimization | 36.3 |
| 11 | Control module evaluation | 48.0 |
| 12 | Implementation system architecture design | 42.0 |
| 13 | Actuator selection | 30.5 |
| 14 | Automatic control module control law design | 32.0 |
| 15 | System integration testing | 30.0 |
| 16 | Input/output recognition | 49.0 |
| 17 | Communications protocol specification | 22.3 |
| 18 | Interface design | 37.5 |
| 19 | Flight data acquisition and analysis | 64.0 |
| 20 | Flight performance verification | 30.0 |
| 21 | Technology assessment and feedback loops | 22.0 |
| F | |||||
|---|---|---|---|---|---|
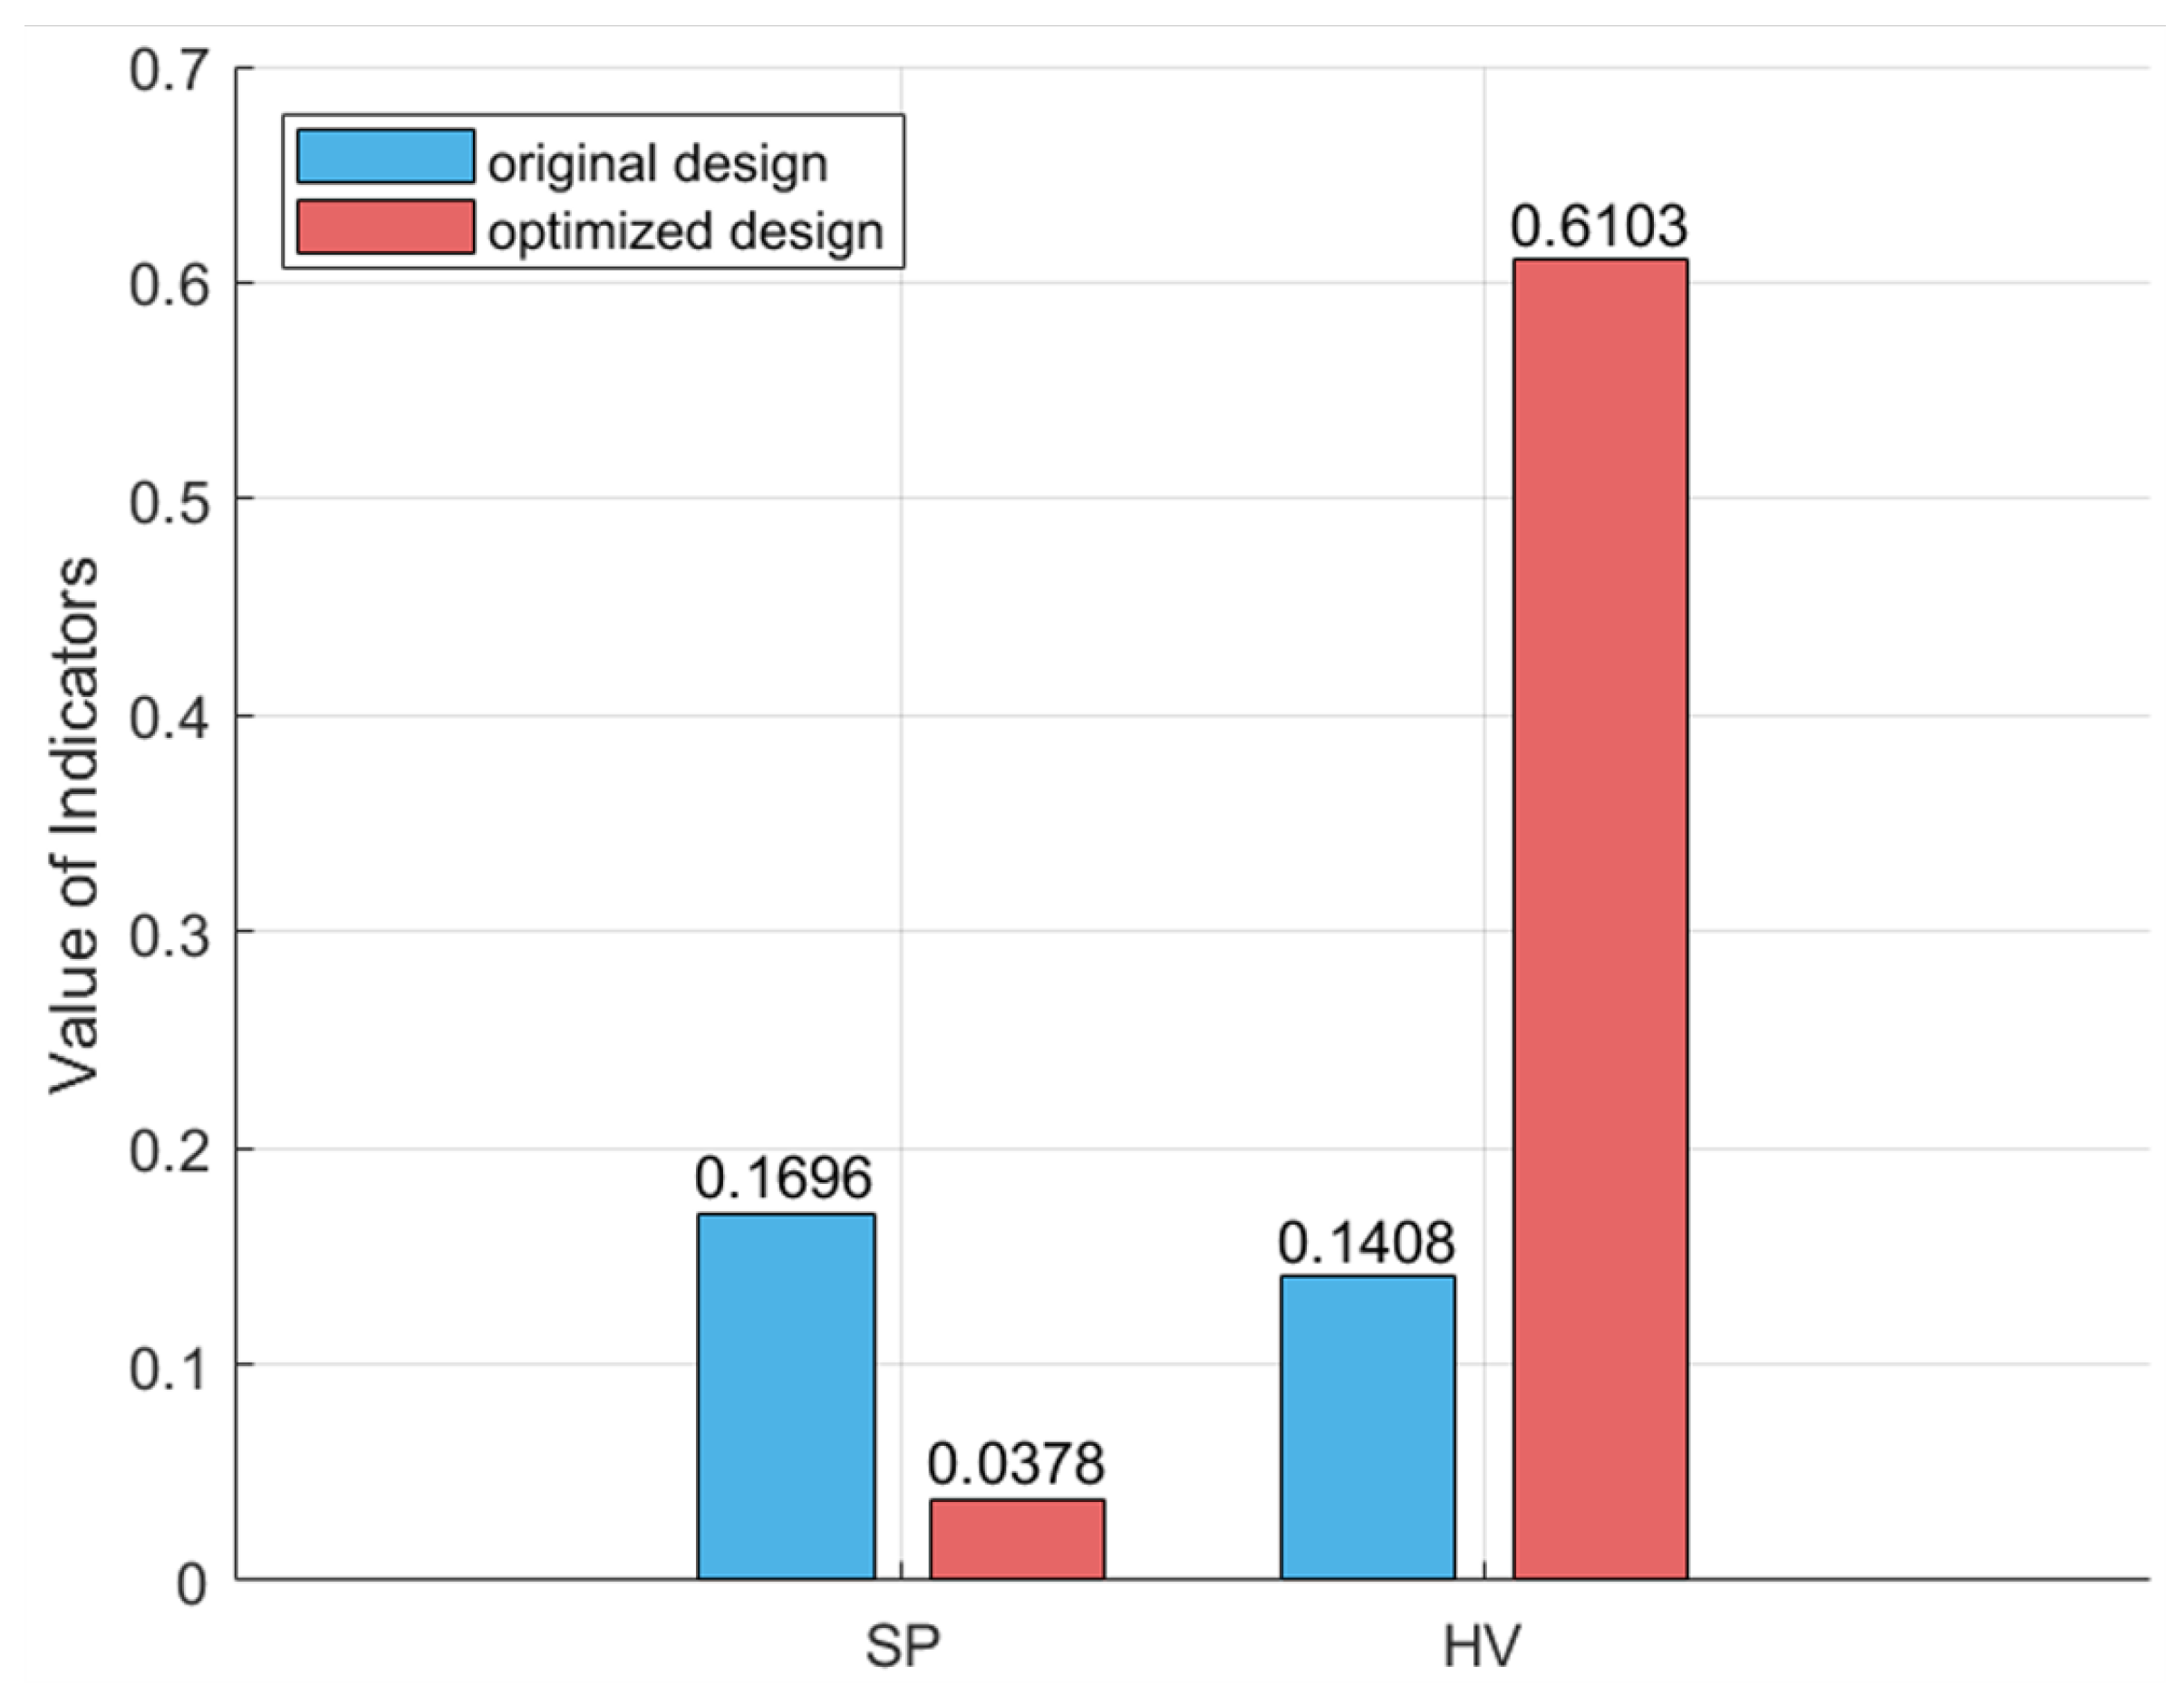
| Original design | 701 | 196 | 46 | 0.1696 | 0.1408 |
| Optimized design | 515 | 121 | 31 | 0.0378 | 0.6103 |
| Optimization effect | −26.53% | −38.27% | −32.61% | −77.71% | 333.45% |
Disclaimer/Publisher’s Note: The statements, opinions and data contained in all publications are solely those of the individual author(s) and contributor(s) and not of MDPI and/or the editor(s). MDPI and/or the editor(s) disclaim responsibility for any injury to people or property resulting from any ideas, methods, instructions or products referred to in the content. |
© 2024 by the authors. Licensee MDPI, Basel, Switzerland. This article is an open access article distributed under the terms and conditions of the Creative Commons Attribution (CC BY) license (https://creativecommons.org/licenses/by/4.0/).
Share and Cite
Fan, Q.; Han, Y.; Zhang, A.; Bi, W. Numerical Design Structure Matrix–Genetic Algorithm-Based Optimization Method for Design Process of Complex Civil Aircraft Systems. Systems 2024, 12, 566. https://doi.org/10.3390/systems12120566
Fan Q, Han Y, Zhang A, Bi W. Numerical Design Structure Matrix–Genetic Algorithm-Based Optimization Method for Design Process of Complex Civil Aircraft Systems. Systems. 2024; 12(12):566. https://doi.org/10.3390/systems12120566
Chicago/Turabian StyleFan, Qiucen, Yanlong Han, An Zhang, and Wenhao Bi. 2024. "Numerical Design Structure Matrix–Genetic Algorithm-Based Optimization Method for Design Process of Complex Civil Aircraft Systems" Systems 12, no. 12: 566. https://doi.org/10.3390/systems12120566
APA StyleFan, Q., Han, Y., Zhang, A., & Bi, W. (2024). Numerical Design Structure Matrix–Genetic Algorithm-Based Optimization Method for Design Process of Complex Civil Aircraft Systems. Systems, 12(12), 566. https://doi.org/10.3390/systems12120566