
Optimal Weigh-in-Motion Planning for Multiple Stakeholders


Abstract
1. Introduction
2. Stakeholders and Game Scenarios
3. Formulations
3.1. Upper-Level Problem (Leader’s Strategy)
3.1.1. First Scenario
3.1.2. Second Scenario
3.2. Lower-Level Problem (Follower’s Strategy)
| Algorithm 1. Numerical algorithm to find the user equilibrium for given WIM strategy . |
| Input: , , , , and the other parameters Initialization: Find a feasible for . Set |
|
Step 1. Solve the above problem with the pre-set using the following objective:
Step 2. The resulting with the optimal from step 1 yields If converges terminate. Otherwise, set and go to Step 1. |
| Output: and |
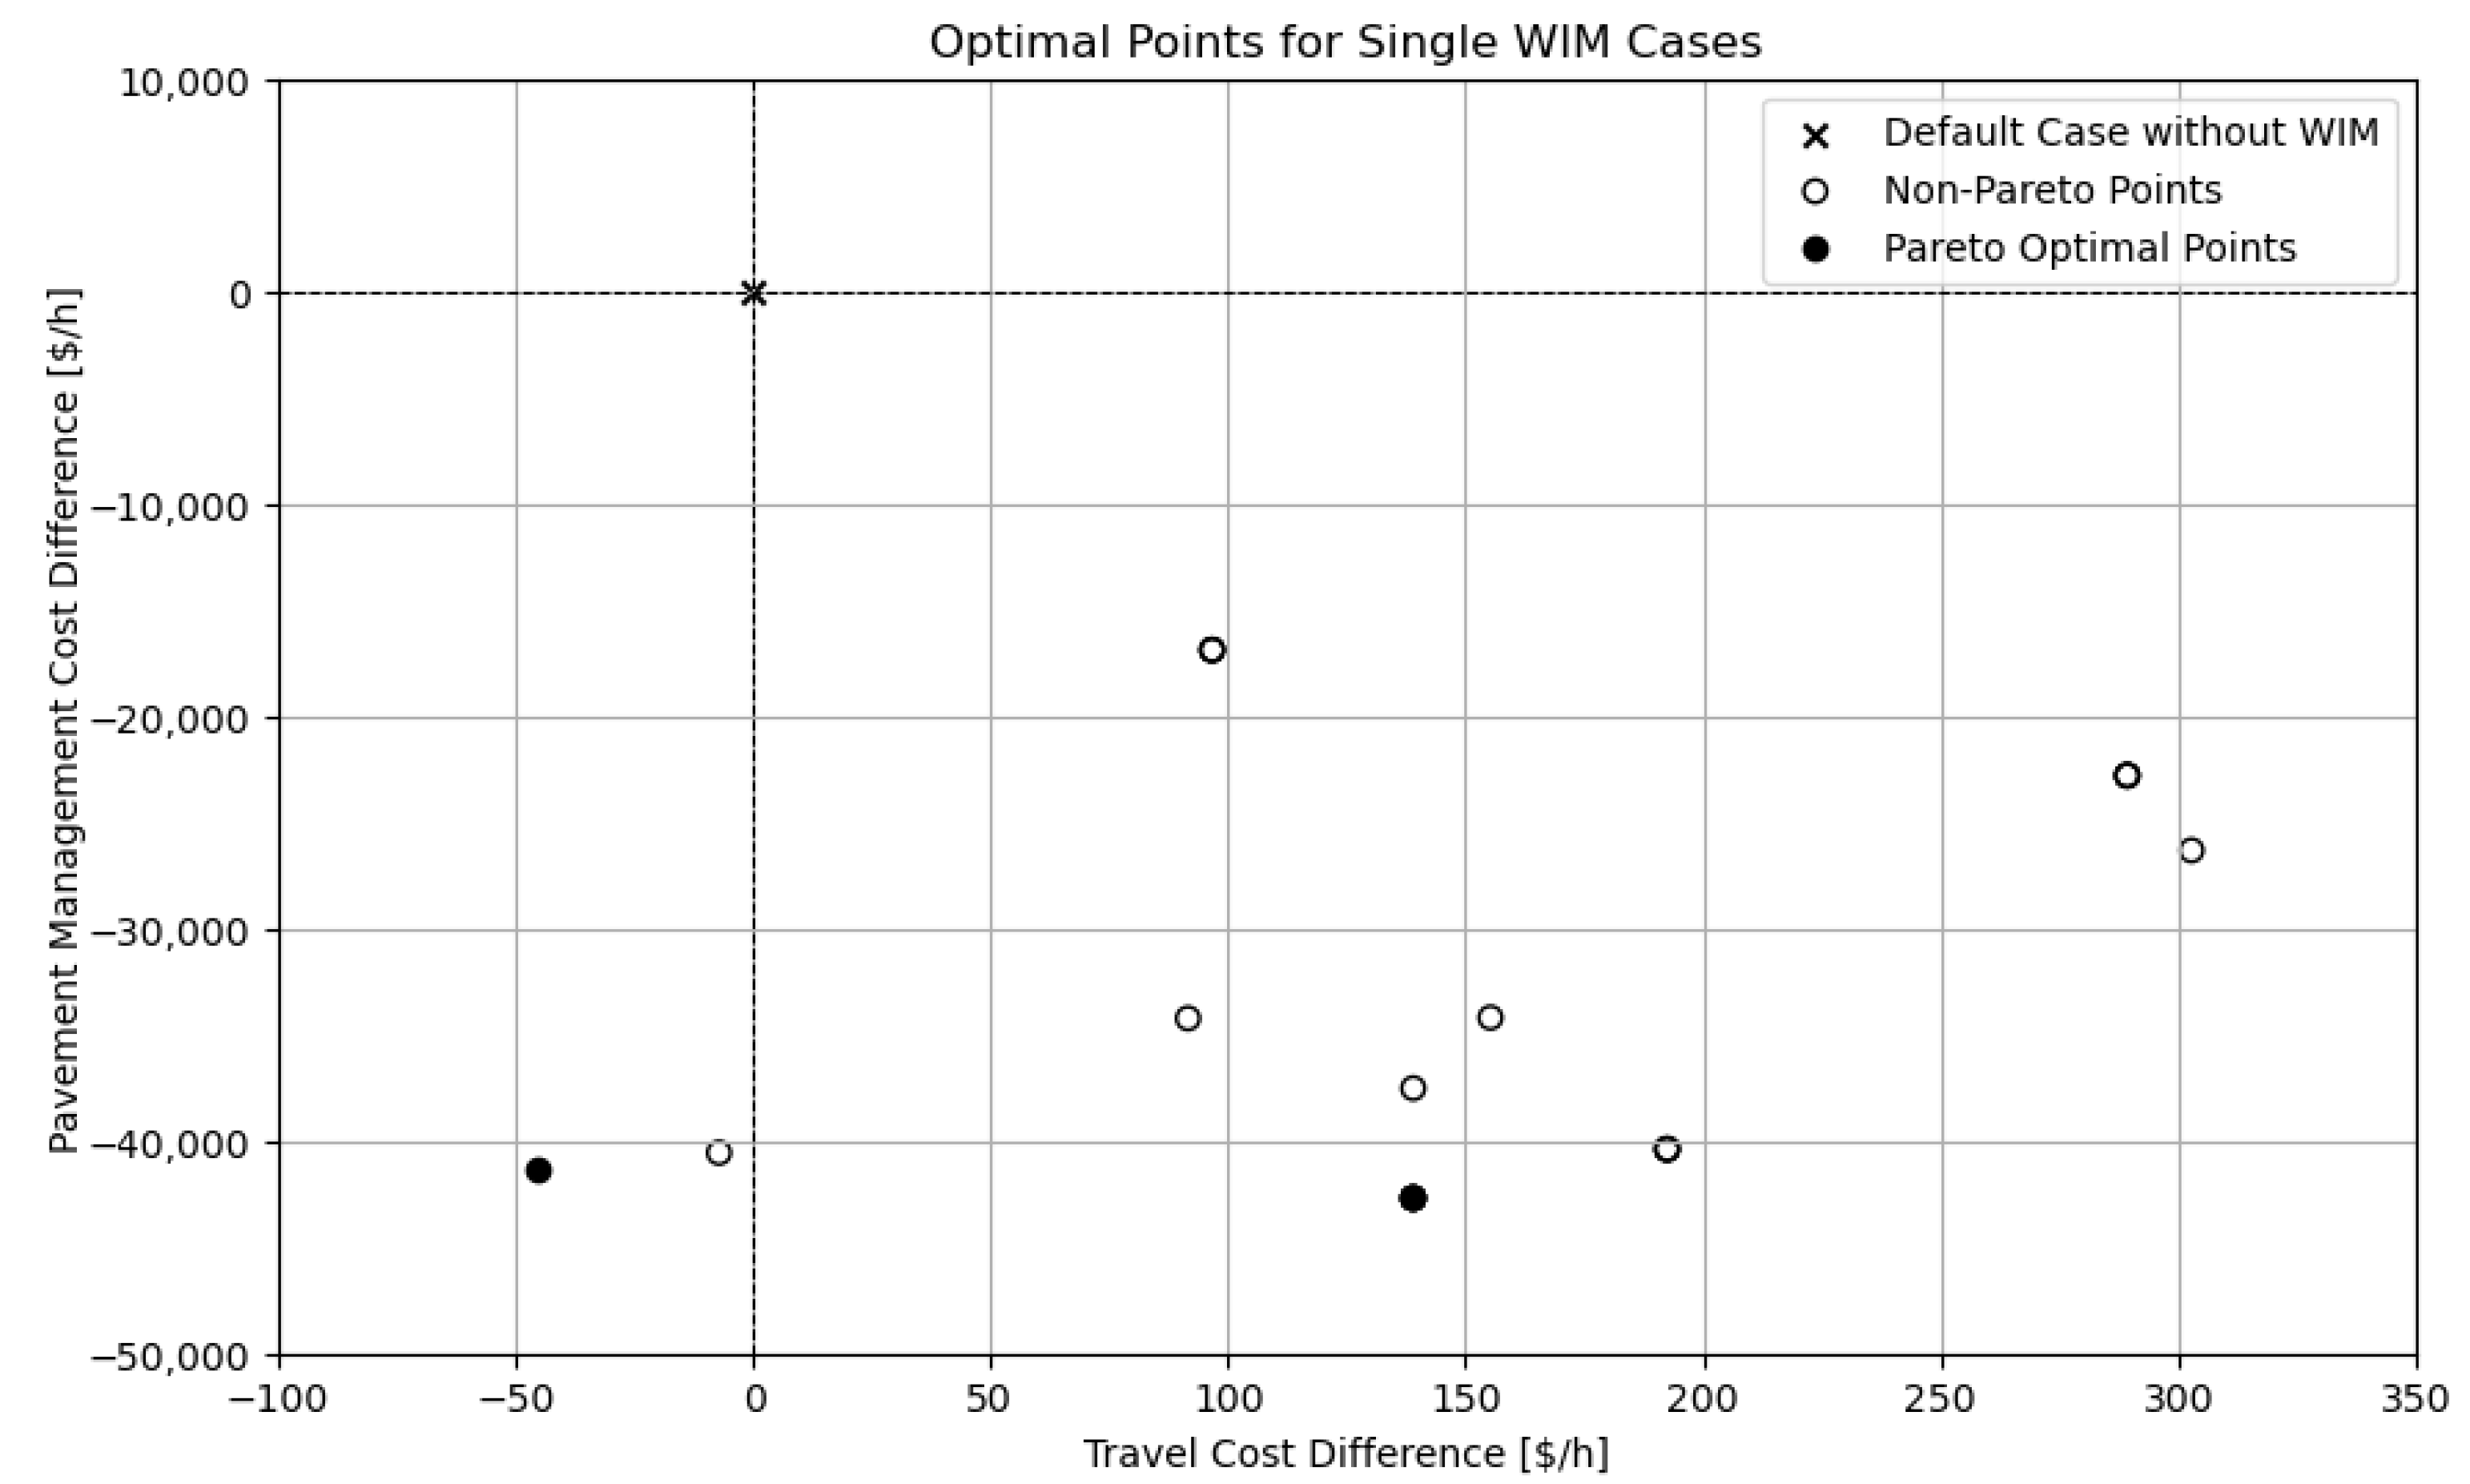
4. Case Study
5. Discussion
Author Contributions
Funding
Data Availability Statement
Conflicts of Interest
Appendix A. Notations for Mathematical Modeling

| Roadway network graph , comprising the of nodes N and arcs A | |
| Index of nodes | |
| Index of arcs | |
| Length of arc | |
| WIM installation candidate arcs | |
| The set of the arcs where WIM is installed | |
| Binary variables whether a WIM is implemented on candidate arc | |
| Origin–destination (O-D) matrices for different vehicle types | |
| The demand for different vehicle types from node to node | |
| Origin–destination (O-D) matrices for different vehicle types after the WIM strategy is implemented | |
| The total flow rate on link | |
| The flow rate of vehicle type on link | |
| Travel costs for all link | |
| Pavement management costs for all link | |
| The non-negative and non-dimensional weight factor | |
| The average unit travel time costs per vehicle for vehicle type | |
| The travel time of link for vehicle type | |
| Fuel efficiency costs for vehicle type | |
| Paths between OD pair to | |
| The indicator variable whether link is included in path between and for vehicle type | |
| The flow on path for vehicle type between and | |
| The free-flow travel time on link for vehicle type | |
| Capacity of link | |
| Positive coefficients for vehicle type of BPR function | |
| Positive coefficients of BPR function | |
| Undiscounted prorated pavement management costs with single rehabilitation costs on link | |
| The steady-state rehabilitation period of link | |
| The traffic loading of link | |
| The elapsed time since the last rehabilitation | |
| The pavement condition of link at | |
| The condition right after rehabilitation | |
| Positive parameter of deterioration model for pavement condition | |
| Positive parameter of deterioration model for pavement condition | |
| Vehicle-group-specific parameter | |
| Predetermined pavement condition threshold | |
| The WIM number constraint | |
| The maximum allowable disruption level | |
| The lowest-cost path travel time for vehicle type between origin node to destination node under | |
| The lowest-cost path distance for vehicle type between origin node to destination node under | |
| The extra income from overloading between and | |
| The overloading benefit between origin node to destination node under | |
| The overloading penalty | |
| The lowest-cost path travel time for vehicle type between origin node to destination node after the WIM strategy is implemented | |
| The lowest-cost path distance for vehicle type between origin node to destination node after the WIM strategy is implemented | |
| The number of reduced overloaded trucks between and | |
| The conversion factor between the increased number of non-overloaded trucks when a single overloaded truck is reduced | |
| The lowest-cost path travel time for vehicle type between origin node to destination node after the WIM strategy is implemented considering reduced overloaded trucks | |
| The lowest-cost path distance for vehicle type between origin node to destination node after the WIM strategy is implemented considering reduced overloaded trucks | |
| Super-network with three layers of , , and , dedicated to overloaded trucks, non-overloaded trucks, and regular vehicles | |
| Dummy node connected to origin node | |
| Dummy node connected to destination node | |
| Directed link between nodes and | |
| Directed link between nodes and | |
| The flow rate of the super-network layer (by vehicle types) on link | |
| The monetized link travel costs of the super-network layer (by vehicle types) on link |
References
- Pais, J.C.; Amorim, S.I.; Minhoto, M.J. Impact of Traffic Overload on Road Pavement Performance. J. Transp. Eng. 2013, 139, 873–879. [Google Scholar] [CrossRef]
- Lee, C. (A) Study on the Reducing Overloaded Vehicles in Expressway. Master’s Thesis, Pusan National University, Busan, Republic of Korea, 2014. [Google Scholar]
- Santero, N.J.; Nokes, W.; Harvey, J.T. Virtual Weigh Stations: The Business Case; UC Davis Research Reports; UC Davis: Davis, CA, USA, 2005. [Google Scholar]
- Mulyono, A.T.; Parikesit, D.; Antameng, M.; Rahim, R. Analysis of loss cost of road pavement distress due to overloading freight transportation. In Proceedings of the Eastern Asia Society for Transportation Studies; Eastern Asia Society for Transportation Studies: Tokyo, Japan, 2009; Volume 7, p. 139. [Google Scholar]
- Rys, D.; Judycki, J.; Jaskula, P. Analysis of Effect of Overloaded Vehicles on Fatigue Life of Flexible Pavements Based on Weigh in Motion (WIM) Data. Int. J. Pavement Eng. 2016, 17, 716–726. [Google Scholar] [CrossRef]
- Marković, N.; Ryzhov, I.O.; Schonfeld, P. Evasive Flow Capture: Optimal Location of Weigh-in-Motion Systems, Tollbooths, and Security Checkpoints. Networks 2015, 65, 22–42. [Google Scholar] [CrossRef]
- Stephens, J.E.; Carson, J.; Reagor, D.; Harrington, M. An Evaluation of Montana’s State Truck Activities Reporting System; State of Montana, Department of Transportation, Motor Carrier Services and Planning Divisions: Helena, MT, USA, 2003.
- Cottrell, B.H. The Avoidance of Weigh Stations in Virginia by Overweight Trucks; Publication VTRC 93-R2; Virginia Transportation Research Council (VTRC): Charlottesville, VA, USA, 1992.
- Marković, N.; Ryzhov, I.O.; Schonfeld, P. Evasive Flow Capture: A Multi-Period Stochastic Facility Location Problem with Independent Demand. Eur. J. Oper. Res. 2017, 257, 687–703. [Google Scholar] [CrossRef]
- Arslan, O.; Jabali, O.; Laporte, G. Exact Solution of the Evasive Flow Capturing Problem. Oper. Res. 2018, 66, 1625–1640. [Google Scholar] [CrossRef]
- Bogyrbayeva, A.; Kwon, C. Pessimistic Evasive Flow Capturing Problems. Eur. J. Oper. Res. 2021, 293, 133–148. [Google Scholar] [CrossRef]
- Holguin-Veras, J.; Cetin, M. Optimal tolls for multi-class traffic: Analytical formulations and policy implications. Transp. Res. Part A Policy Pract. 2009, 43, 445–467. [Google Scholar] [CrossRef]
- Takama, T.; Preston, J. Forecasting the effects of road user charge by stochastic agent-based modelling. Transp. Res. Part A Policy Pract. 2008, 42, 738–749. [Google Scholar] [CrossRef]
- Albert, G. Analysis of the Influence of Tolls in a Congested Transport System; Research Report; Technion—Israel Institute of Technology: Haifa, Israel, 2001. [Google Scholar]
- Bell, M.G.H. Games, heuristics, and risk averseness in vehicle routing problems. J. Urban Plan. Dev. 2004, 130, 37–41. [Google Scholar] [CrossRef]
- Bell, M.G.H. A game theory approach to measuring the performance reliability of transport network. Transp. Res. Part B 2000, 34, 533–545. [Google Scholar] [CrossRef]
- Ji, A.; Xue, X.; Ha, Q.P.; Luo, X.; Zhang, M. Game theory–based bilevel model for multiplayer pavement maintenance management. Autom. Constr. 2021, 129, 103763. [Google Scholar] [CrossRef]
- Paterson, W.D. Road Deterioration and Maintenance Effects: Models for Planning and Management; National Academies: Washington, DC, USA, 1987. [Google Scholar]
- Sheffi, Y. Urban Transportation Networks (Volume 6); Prentice-Hall: Englewood Cliffs, NJ, USA, 1985. [Google Scholar]
- Ouyang, Y. Pavement resurfacing planning for highway networks: Parametric policy iteration approach. J. Infrastruct. Syst. 2007, 13, 65–71. [Google Scholar] [CrossRef]
- Bushman, R.; Pratt, A.J. Weigh in motion technology-economics and performance. In Proceedings of the North American Travel Monitoring Exhibition and Conference (NATMEC), Charlotte, NC, USA, 11–15 May 1998. [Google Scholar]


| Origin | Destination | Link | (veh/h) | (km) |
|---|---|---|---|---|
| 1 | 5 | 1 | 300 | 7 |
| 1 | 12 | 2 | 200 | 9 |
| 4 | 5 | 3 | 200 | 9 |
| 4 | 9 | 4 | 200 | 12 |
| 5 | 6 | 5 | 350 | 3 |
| 5 | 9 | 6 | 400 | 9 |
| 6 | 7 | 7 | 500 | 5 |
| 6 | 10 | 8 | 250 | 13 |
| 7 | 8 | 9 | 250 | 5 |
| 7 | 11 | 10 | 300 | 9 |
| 8 | 2 | 11 | 500 | 9 |
| 9 | 10 | 12 | 550 | 10 |
| 9 | 13 | 13 | 200 | 9 |
| 10 | 11 | 14 | 400 | 6 |
| 11 | 2 | 15 | 300 | 9 |
| 11 | 3 | 16 | 300 | 8 |
| 12 | 6 | 17 | 200 | 7 |
| 12 | 8 | 18 | 300 | 14 |
| 13 | 3 | 19 | 200 | 11 |
| (veh/h) | |||||
|---|---|---|---|---|---|
| Origin | Destination | Overloaded | Non-Overloaded | Regular | Total |
| 1 | 2 | 30 | 60 | 210 | 300 |
| 1 | 3 | 50 | 100 | 350 | 500 |
| 4 | 2 | 30 | 60 | 210 | 300 |
| 4 | 3 | 20 | 40 | 140 | 200 |
(USD/h/veh) | (USD/h/veh) | Fuel Price (USD/L) | Fuel Efficiency (km/L) | (USD/km) | ||||
|---|---|---|---|---|---|---|---|---|
| Regular | Non-Overloaded | Overloaded | Regular | Non-Overloaded | Overloaded | |||
| 5 | 1 | 0.15 | 15 | 3.5 | 1.5 | 0.01 | 0.043 | 0.1 |
| (veh/h) | |||||
|---|---|---|---|---|---|
| Origin | Destination | Link | Regular | Non-Overload | Overload |
| 1 | 5 | 1 | 341.79 | 97.66 | 48.83 |
| 1 | 12 | 2 | 218.21 | 62.34 | 31.17 |
| 4 | 5 | 3 | 170.00 | 48.57 | 24.29 |
| 4 | 9 | 4 | 180.00 | 51.43 | 25.71 |
| 5 | 6 | 5 | 377.44 | 107.84 | 53.92 |
| 5 | 9 | 6 | 134.36 | 38.39 | 19.19 |
| 6 | 7 | 7 | 377.44 | 107.84 | 53.92 |
| 6 | 10 | 8 | 104.90 | 29.97 | 14.99 |
| 7 | 8 | 9 | 202.23 | 57.78 | 28.89 |
| 7 | 11 | 10 | 175.20 | 50.06 | 25.03 |
| 8 | 2 | 11 | 315.54 | 90.15 | 45.08 |
| 9 | 10 | 12 | 132.15 | 37.76 | 18.88 |
| 9 | 13 | 13 | 182.21 | 52.06 | 26.03 |
| 10 | 11 | 14 | 237.05 | 67.73 | 33.86 |
| 11 | 2 | 15 | 104.46 | 29.85 | 14.92 |
| 11 | 3 | 16 | 307.79 | 87.94 | 43.97 |
| 12 | 6 | 17 | 104.90 | 29.97 | 14.99 |
| 12 | 8 | 18 | 113.30 | 32.37 | 16.19 |
| 13 | 3 | 19 | 182.21 | 52.06 | 26.03 |
| (USD) | (1/h) | (1/(ESALs × hour)) | (m/km) | (m/km) | |||
|---|---|---|---|---|---|---|---|
| Regular | Non-Overloaded | Overloaded | |||||
| 0.040 | 4 | 1.5 | 0.0004 | 2.578 | 6.458 | ||
| WIM Install Link | Pavement Management Cost Difference (USD/h) | Travel Cost Difference (USD/h) |
|---|---|---|
| 5 | −41,372 (−0.56%) | −46 (−0.34%) |
| 3, 7, 14, 19 1 and 9, 1 and 12, 1 and 17, …, 11 and 19 | −42,629 (−0.58%) | 139 (+1.05%) |
Disclaimer/Publisher’s Note: The statements, opinions and data contained in all publications are solely those of the individual author(s) and contributor(s) and not of MDPI and/or the editor(s). MDPI and/or the editor(s) disclaim responsibility for any injury to people or property resulting from any ideas, methods, instructions or products referred to in the content. |
© 2024 by the authors. Licensee MDPI, Basel, Switzerland. This article is an open access article distributed under the terms and conditions of the Creative Commons Attribution (CC BY) license (https://creativecommons.org/licenses/by/4.0/).
Share and Cite
Jung, Y.; Lee, J. Optimal Weigh-in-Motion Planning for Multiple Stakeholders. Systems 2024, 12, 557. https://doi.org/10.3390/systems12120557
Jung Y, Lee J. Optimal Weigh-in-Motion Planning for Multiple Stakeholders. Systems. 2024; 12(12):557. https://doi.org/10.3390/systems12120557
Chicago/Turabian StyleJung, Yunkyeong, and Jinwoo Lee. 2024. "Optimal Weigh-in-Motion Planning for Multiple Stakeholders" Systems 12, no. 12: 557. https://doi.org/10.3390/systems12120557
APA StyleJung, Y., & Lee, J. (2024). Optimal Weigh-in-Motion Planning for Multiple Stakeholders. Systems, 12(12), 557. https://doi.org/10.3390/systems12120557