Abstract
Highways are one of the most suitable scenarios for automated driving technology. For conditionally automated driving, drivers are required to take over the vehicle when the system reaches its boundary. Therefore, it is necessary to evaluate the driver’s takeover performance and take-over safety differences under typical segments of highways. The experiment was conducted in a driving simulator. Three typical highway segments were constructed: a long straight segment, a merging segment and a diverging segment. Under each segment, a 2 × 2 factorial design was adopted, including two traffic densities (high density and low density) and two kinds of time budget (5 s and 7 s). The results showed that time budget and traffic density affected drivers’ take-over performance and safety. As the time budget decreased, the driver’s reaction time decreased and the braking amplitude increased. As traffic density increased, the lateral deviation rate increased. The maximum steering angle and steering wheel reversal rate in general tended to increase with scenario urgency. Meanwhile, drivers paid more attention to the longitudinal control on the long straight segment, which was reflected in the maximum braking amplitude and directional reversal rate. However, drivers paid more attention to the lateral control on the diverging segment, which was reflected in the maximum lateral deviation rate and the minimum steering wheel reversal rate. The study will contribute to the safety assessment of take-over behavior in highway avoidance scenarios and provide a theoretical basis for the design of a human–machine interaction system.
1. Introduction
1.1. Current Development of Automated Driving Technology
Automated driving technology is regarded as an effective approach to reducing traffic accident rates. It has garnered significant attention from governments and automotive companies. Traditional automakers, as well as technology giants like Google, have introduced automated driving vehicles equipped with Level 3 capabilities, and have set up various road zones for field testing. Fully automated vehicles offer notable benefits in terms of rule adherence, efficiency, safety and energy consumption.
SAE J3016, proposed by the American Society of Automotive Engineers, is one of the international standards for the classification of automated driving vehicles [1]. The standard classifies automated driving vehicles into six levels from L0 to L5. Most of the automated driving vehicles on the market are currently at L2 and L3 levels, and have yet to achieve fully automated driving.
The California Department of Motor Vehicles counted the field tests of automated driving vehicles conducted by different vehicle manufacturers in 2019 and found that 105 accidents occurred and 8883 take-overs occurred [2]. These emergencies primarily occurred due to three reasons. Firstly, the automated driving system itself made errors, such as failing to recognize lane lines or obstacles. Second, the automated driving system prompted the driver to take over, but the driver was not able to take over correctly, resulting in an accident. Lastly, accidents resulted from drivers forcefully taking over without comprehending the intentions of the automated driving system.
For the second reason, if the driver takes improper take-over behavior during the take-over process, it is highly likely to cause the traffic accidents. Therefore, the study of the take-over behavior is important to ensure the driving safety and improve the stability of the automatic driving system.
1.2. Influencing Factors of Take-Over Performance
The factors affecting take-over performance mainly include three aspects: human factors, human–machine interaction system and traffic environment. This study mainly explores the effects of human–machine interaction system and traffic environment on take-over performance based on objective factors.
1.2.1. Human–machine Interaction System
For the human–machine interaction system, there are two main influencing factors. First is the setting of the take-over time budget (TB), and second is the choice of the take-over prompting method.
Time budget is an important parameter in a human–machine interaction system. A reasonable time budget facilitates the driver to take over the vehicle safely. The time budget is the time from the take-over request to the system limit, which directly reflects the urgency of the take-over scenario [3]. In general, the shorter the time budget, the faster the driver can make decisions and react faster, but the poorer the quality of the take-over [4]. Ito found that for L2 and L3 automated vehicles, a time budget of 5 s was required even when the driver was more alert [5]. Samuel investigated the ability of drivers to anticipate latent threats with a time budget of 4 s, 6 s, 8 s and 12 s. It was found that at least 8 s of time budget was needed to detect most of the hazards [6]. Eriksson conducted a review of recent studies related to take-over request times for automated driving, showing that the mean take-over request time set in the current study was 6.37 s (with a standard deviation of 5.36 s), and that a take-over request time of about 7 s was appropriate for automated driving [7].
Take-over prompting methods are generally a session box prompt, voice prompt, vibration prompt, or a combination of prompting modes [8,9,10,11]. Different prompting methods also have an impact on take-over performance. Petermeijer found that vibrotactile stimuli can be effective as warning signals [12]. Forster found that visual prompt had some advantages when facing complex scenarios [13]. However, in emergency scenarios, an auditory prompt can help drivers react more quickly than a visual prompt. Meanwhile, a faster speech rate created a greater sense of urgency and command for the driver than a slower speech rate [14]. Short phrases such as “Danger, take over” can create a higher subjective sense of urgency than “Please take over”. A high-urgency voice style produced a higher subjective sense of urgency than a monotonous voice style [15]. Therefore, this study adopted a faster speech rate to broadcast the take-over prompt for the driver.
1.2.2. Traffic Environment
The driver’s take-over process includes the process of situational awareness recovery. In this process, the complexity of the traffic environment is the main factor that affects take-over performance. Previous studies have focused on the complexity of the traffic environment in terms of both traffic density and road attribute [16,17].
For the traffic environment, Gold found that in complex traffic density led to longer take-over time and poorer take-over quality for drivers [18]. In high-density traffic scenarios, the dynamics of surrounding vehicles forced drivers to take more conservative maneuvers, such as using steering or acceleration carefully, resulting in more frequent braking [19]. Radlmayr showed that the danger of take-over during conditional automated driving became greater with increasing traffic density [20].
For the road attribute, the special segment is the main factor affecting take-over performance. For the special segment, such as highways, mountain roads and tunnels, researchers have conducted various safety evaluation methods [20,21]. For example, Chen developed an accident prediction model for a single-lane expressway exit ramp and used it to evaluate the factors that influence the occurrence of different types of accidents in this area [22]. Zahabi quantified the effects of driver age, ramp signage configuration on the driving performance and attention allocation when exiting a highway ramp through simulated driving experiment [23]. However, due to the immaturity of automated driving technology, automated driving vehicles are currently driven in closed scenarios. Therefore, this study selected three typical segments of the highway in the simulation environment as test scenarios to evaluate the driver’s take-over safety.
1.3. Evaluation Indicators
Automated driving take-over performance refers to the ability of the driver to take over the vehicle correctly and timely to ensure the safe operation of the vehicle if the automated vehicle is abnormal or unable to drive automatically. Previous studies have evaluated take-over performance in terms of both take-over time and take-over quality. In terms of take-over time, scholars have investigated the effects of different factors on take-over time, including non-driving related tasks, driver age and gender, and traffic density. In terms of take-over quality, there are many indicators to evaluate take-over performance, such as speed, collision time, and reaction time [7,24,25]. Generally, these evaluation indicators can be divided into three categories: driver-related indicators, operation-related indicators and vehicle-related indicators.
For the driver-related indicators, researchers have used physiologic changes (heart rate and pupil diameter) to assess take-over performance [26,27]. Reaction time is one of the key evaluation indicators. Wu statistically found a total of 45 papers using this indicator in 90 relevant papers in recent five years [28]. For the vehicle-related indicators, Happee found that minimum time to collision (minTTC) and spacing from obstacles were considered to be better alternative safety evaluation indicators for emergency avoidance maneuvers [29]. For the operating-related indicators, Kountouriotis found that the steering wheel reversal rate showed better reaction to the driver’s lateral control behavior [30]. Additionally, Kountouriotis used standard deviation of lateral position and steering reversal rates as the primary evaluation indicators for lateral operation [31]. Wrle proposed the Take-Over Controllability rating (TOC-rating) to evaluate the take-over performance. TOC-rating mainly included braking reaction, lane change, vehicle operation and other indicators [32].
In summary, previous studies have examined some influencing factors that determine take-over performance. Nevertheless, driving performance for drivers with different urgency under a typical segment of highway during conditional automated driving has not been well investigated. The purpose of this study was to analyze the impact of time budget and traffic density on the drivers’ take-over safety. This study created different urgency by varying the traffic density (high density and low density) and time budget (5 s and 7 s) in each scenario. A long straight segment, a merging segment and a diverging segment were selected as three typical segments on the highway. Five evaluation indicators were used to evaluate take-over safety. The entropy method was used to determine the weights of different take-over behavior indicators to visualize the take-over safety in each scenario. The results of the study provide guidance for the analysis of take-over behavior and provide a theoretical basis for the optimization of human–machine interaction systems. The research framework is shown in Figure 1.
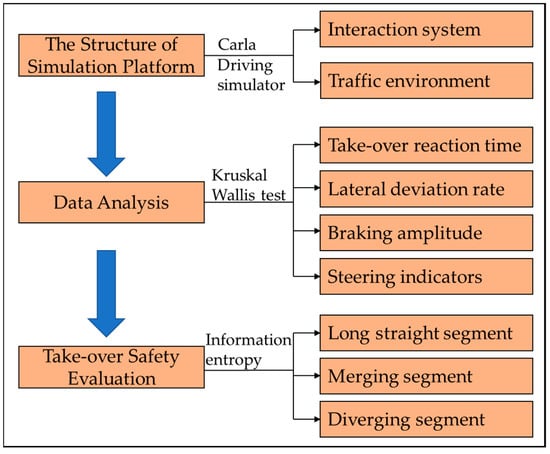
Figure 1.
The research framework.
The rest part of this paper is organized as follows. Section 2 presents information about the participants, the simulation platform, the experiment design and the experiment procedure. Section 3 describes the indicators extracted from the experiment. Finally, Section 4 analyzes the influencing factors of take-over performance and take-over safety.
2. Methods
Since the take-over type accidents in the open dataset do not provide supporting videos, it is impossible to understand the take-over behavior during the take-over process. Meanwhile, the risk of real experiments for take-over behavior is high. Therefore, this study used simulated driving to collect driver behavioral data and vehicle data to analyze take-over performance.
2.1. Participants
Thirty drivers (15 male and 15 female) participated in this experiment. Considering that young people were more receptive to emerging technologies, the participants were mainly university students and young teachers. Participants’ ages ranged from 22 to 37 years old (AVG. = 26.25, S.D. = 3.01). Before the experiment, each driver was checked for good health, energy, and normal vision. Drivers had at least 3 years of driving experience and were not novice drivers. Drivers were required to understand the entire experiment procedure before the experiment and then fill out an informed consent form.
2.2. Simulation Platform
The take-over simulation experiment platform consisted of a driving simulator and simulated scenarios (built in Carla 0.9.13). The driving simulator mainly included a Logitech G29 steering wheel, a brake pedal, an accelerator pedal, a high-performance computer and a screen. The scenario was supported by Carla 0.9.13, which included automated driving simulation, traffic scenario construction, traffic flow generation, and other functions. Designers can freely configure the traffic rules and vehicle behavior in the simulation environment to simulate more risky driving scenarios. The take-over simulation experiment platform is shown in Figure 2.
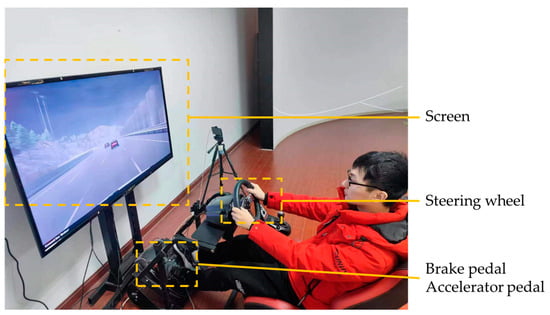
Figure 2.
The take-over simulation experiment platform.
2.3. Experiment Design
2.3.1. Independent Variables
This study used traffic density and time budget as experimental variables.
The vehicles that are too far away from the driver in the simulation environment cannot influence the driver’s driving behavior, so this study defines the traffic density as the number of free vehicles within one kilometer before and after the obstacle vehicle.
Gold classified the traffic density into three levels: zero, 10, and 20 vehicles per km while studying the take-over behavior in complex traffic situations [18]. Doubek classified the traffic density into two levels: low (5 vehicles/km) and medium (10 vehicles/km). In this study, lower than 10 vehicles/km was recorded as low-density traffic [21]. Otherwise, it was recorded as high-density traffic.
In terms of time budget, a long time budget can lead to a decrease in driver alertness when taking over, as well as a decrease in driver trust of the automated driving system. Short time budget can lead to excessive cognitive load and take-over errors. Wu conducted a literature review and found that the take-over time budget between 5–8 s is an appropriate range [28]. Therefore, in this study, the time budget was set to 5 and 7 s.
2.3.2. Scenarios
Currently, the automated driving is mainly used in highway scenarios. Therefore, this study created a three-lane highway simulation scenario. Each lane was 3.75 m wide.
The experiment scenarios consisted of three typical segments: a long straight segment, a merging segment and a diverging segment. An accident vehicle was set in each segment. The driver needed to take over the vehicle to avoid the accident vehicle under different sub-scenarios that combine various influence factors. The three typical scenarios are shown in Figure 3.
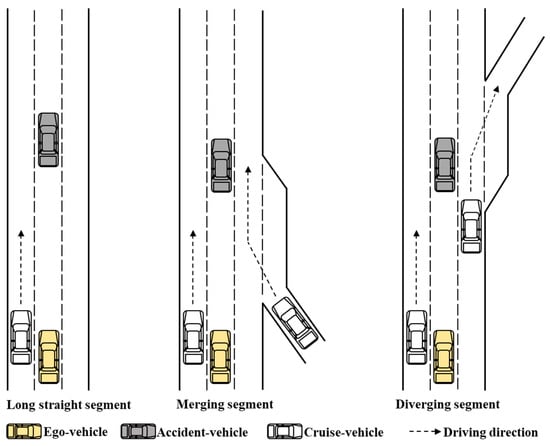
Figure 3.
Three typical take-over scenarios.
We defined that the ego-vehicle cruised on the second lane. For the long straight segment, it cruised at 90 km/h. For the merging segment and diverging segment, its cruising speed was 60 km/h. The speed of the other cruising vehicle was set at 60 km/h. When the vehicle was in the automatic driving mode, the driver’s hands can leave the steering wheel. Their feet can leave the brake pedal or accelerator pedal. When an obstacle avoidance scenario occurred, the system would ask the driver to take the appropriate avoidance action as soon as possible. Through the 2 × 2 combination of time budget and traffic density, a total of 12 obstacle avoidance scenarios were designed for this experiment.
It was assumed that when the two conditions of high-traffic density and short time budget were satisfied, the scenario was regarded as an “Urgency” scenario. When one of the conditions was satisfied, the scenario was regarded as a “Semi-urgency” scenario. When none of the conditions were satisfied, the scenario was recorded as a “Non-urgency” scenario.
The scenario parameters of the twelve obstacle avoidance scenarios are shown in Table 1.

Table 1.
Parameters of twelve obstacle avoidance sub-scenarios.
In the subsequent content, the long straight segment is represented by Segment 1; the merging segment is represented by Segment 2; and the diverging segment is represented by Segment 3. The scenario urgency for Scenarios 2, 6, 10 was represented by Semi-urgency(T), which indicated that the urgency was caused by the time budget. The scenario urgency for Scenarios 3, 7, 11 was represented by Semi-urgency(D), which indicated that the urgency was caused by the traffic density.
2.4. Procedure
Each driver was required to participate in four experiments, completing three scenarios of take-over in each experiment. Drivers were given a 3–5 min to break between two experiments to avoid fatigue or practice effects. The specific experiment steps were as follows:
- (1)
- Before starting the experiment, each driver needed to clarify the purpose of this experiment and precautions. The driver was asked to drive safely as the first priority. If the driver has any discomfort, such as dizziness or nausea, the experiment can be stopped immediately.
- (2)
- Each driver was asked to conduct a simulated driving training for 5 to 10 min to be familiar with the experiment equipment and simulation scenarios. The simulation scenario used for driver practice was not the same as the take-over scenario in the formal experiment.
- (3)
- In the formal experiment, the driver’s vehicle was generated on a fixed position. The driver needed to set the vehicle to an automated driving state after starting it. Then, the driver did not need to perform any driving task. When the automated driving vehicle reached the designated location, the vehicle would prompt the driver to take over the vehicle by voice announcement (repeatedly announcing “please take over”). When receiving the take-over command from the system, the driver needed to press the switch button and immediately steer the steering wheel or brake pedal to control the vehicle to avoid the obstacle vehicle in front. Repeat this process until three take-over process have been completed.
- (4)
- Repeat the above process until the four take-over experiments was completed for one driver. The scenario layout diagram for one experiment is shown in Figure 4.
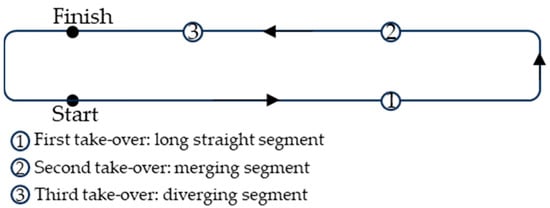 Figure 4. The scenario layout diagram for one experiment.
3. Results
3.1. Take-Over Reaction Time
The take-over reaction time is the time from the moment of the take-over prompt to the moment the driver presses the toggle button. Figure 4 shows the driver’s take-over reaction time for different road segments and different emergency levels.
In Figure 5a, in general, there is no significant difference in the take-over reaction time for the three typical segments. There is almost no difference in the mean value of the driver’s reaction time (Segment 1 = 2.280 s, Segment 2 = 2.296 s, Segment 3 = 2.289 s).
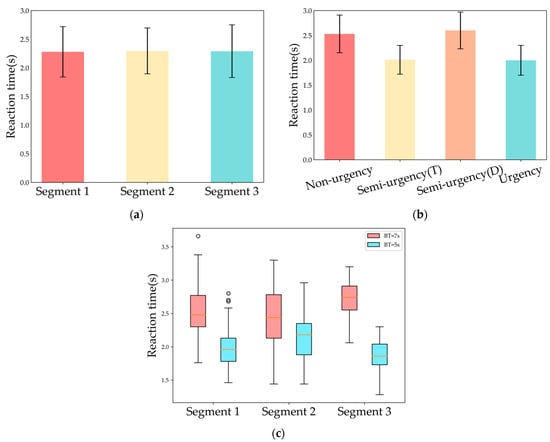
Figure 5.
The experiment results of reaction time. (a) Reaction time under different typical segments; (b) Reaction time at different urgency levels; (c) Reaction time under three typical segments with different time budgets.
Figure 5b shows the variation of reaction time for scenarios with different urgency levels. The “Non-urgency” scenario has the slowest reaction time (M = 2.531) and the “Urgency” scenario has the shortest reaction time (M = 2.013). This indicates that the driver’s reaction time decreased when the urgency of the scenario increased. The reaction time under the “Semi-urgency(D)” scenario is significantly slower than the reaction time under the “Semi-urgency(T)” scenario. This indicates that the reaction time is influenced by the time budget: faster reaction time with a shorter time budget.
Figure 5c shows the reaction time under three typical segments at different time budgets. The results of the Kruskal–Wallis test reveals that the reaction times under different time budgets are significantly different for the long straight segment (p < 0.001), merging segment (p = 0.001), and diverging segment (p < 0.001) of the highway. Among the scenarios with time budget of 7 s and 5 s, there is a significant difference in take-over reaction time under different typical segments (p < 0.001).
3.2. Lateral Deviation Rate
Traditional lateral deviation rate is the vehicle lateral deviation from the center of the lane per unit time. In this study, the lateral deviation rate is defined as the rate of the vehicle maximum lateral deviation from the center of the lane during the take-over process, as shown in Equation (1).
where is the lateral deviation rate, MaxD(t) is the maximum lateral deviation at the time t, and t0 is the moment when the vehicle starts to deviate from the center of the lane.
Figure 6 shows the lateral deviation rate under different typical segments and different emergency levels. As shown in Figure 5a, there was almost no difference between the mean value of lateral deviation rate under the long straight segment and merging segment (Segment 1 = 0.64 m/s, Segment 2 = 0.62 m/s); while the mean value of lateral deviation rate in diverging segment were higher than the other two segments (Segment 3 = 0.67 m/s). Meanwhile, there is almost no difference in the standard deviation between the long straight segment and the merging segment (Segment 1 = 0.18 m/s, Segment 2 = 0.19 m/s). However, the standard deviation of the lateral deviation rate on the diverging segment is lower than the other two segments (Segment 3 = 0.12 m/s).
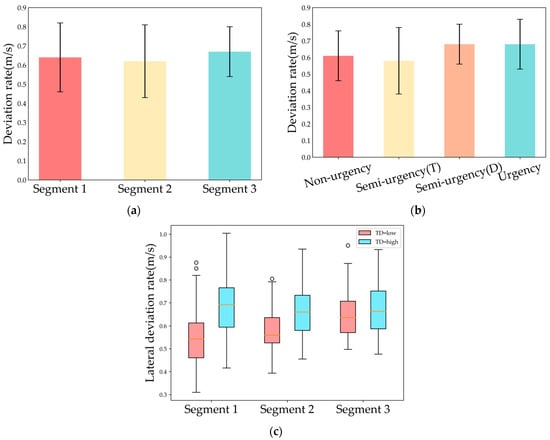
Figure 6.
The experiment results of lateral deviation rat. (a) Lateral deviation rate under different typical segments; (b) Lateral deviation rate at different urgency levels; (c) Lateral deviation rate under three typical segments with different traffic densities.
Figure 6b shows the variation of lateral deviation rate under different urgency scenarios. The mean value of lateral deviation rate is smaller for the “Non-urgency” scenario and “Semi-urgency(T)” scenario (Non-urgency = 0.61, Semi-urgency(T) = 0.58). The mean value of lateral deviation rate in the “Semi-urgency(D)” scenario and “Urgency” scenario (Semi-urgency(D) = 0.68, Urgency = 0.68) is larger than the above two values. This indicates that the lateral deviation rate is higher in the higher traffic density scenarios and lower in the lower traffic density scenarios. This implies that traffic density is an important factor affecting the lateral position fluctuation of vehicles.
Figure 6c shows the lateral deviation rate under three typical segments with different traffic densities. From the results of the Kruskal–Wallis test, the lateral deviation rate under different traffic densities is significantly different for both the long straight segment (p < 0.001) and merging segment (p = 0.001) of the highway. However, the lateral deviation rate does not differ significantly for the diverging segment (p = 0.160). Significant differences in the lateral deviation rate exists between scenarios with lower traffic density under different typical segments (p < 0.001). However, there is no difference in the lateral deviation rate under different typical segments between scenarios with higher traffic density (p = 0.458).
3.3. Braking Amplitude
The braking amplitude is the brake pedal depth during the take-over process. It ranges from 0 to 1. Furthermore, 0 indicates that the brake pedal is not depressed and 1 indicates the maximum pedal depth. The braking amplitude during the take-over process in different highway typical segments, as shown in Figure 7.
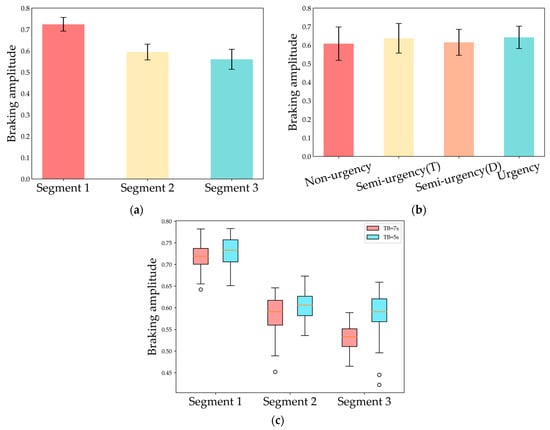
Figure 7.
The experiment results of braking amplitude. (a) Braking amplitude under different typical segments; (b) Braking amplitude at different urgency levels; (c) Braking amplitude under three typical segments with different time budgets.
Figure 7a shows the braking amplitude in different typical segments. The mean braking amplitude on the long straight segment (Segment 1 = 0.724) is significantly higher than the mean braking amplitude on the merging and diverging segments (Segment 2 = 0.594, Segment 3 = 0.560).
Figure 7b shows the braking amplitude under different levels of urgency. The average braking amplitude under the “Non-urgency” scenario and “Semi-urgency(D)” scenario are relatively close (Non-urgency = 0.608, Semi-urgency(D) = 0.615). The mean braking amplitude in the “Semi-urgency(T)” scenario and the “Urgency” scenario are similar (Semi-urgency(T) = 0.637, Urgency = 0.642). The Kruskal–Wallis test shows that there was a significant difference in the braking amplitude between the two time budget: 7 s and 5 s (p < 0.001). This implies that time budget is an important factor affecting the braking amplitude of drivers.
Figure 7c shows the braking amplitude of different time budget for three typical road segments. The effect of the time budget on the braking amplitude is not significant on the long straight segment (p = 0.710), but it is significant on the merging segment (p = 0.023) and the diverging segment (p < 0.001). For the time budget of 7 s, the effect of merging segment and diverging segment on braking amplitude is significant (p < 0.001). For the take-over time budget of 5 s, the effect of merging and diverging segment on braking amplitude is not significant (p = 0.103).
3.4. Steering Indicators
In this study, the maximum steering angle and steering wheel reversal rate were adopted as steering indicators.
The steering wheel reversal rate refers to the steering wheel rotation times per minute, which reflects the lateral steering behavior of the driver [31]. The maximum steering angle refers to the maximum angle that the driver turns the steering wheel during the obstacle avoidance process, which reflects the driving performance when steering.
The mean value of steering behavior parameters under different segments are shown in Table 2.

Table 2.
Steering indicators under different segments.
Table 2 shows that the mean value of steering wheel reversal rate is long straight segment > merging segment > diverging segment. Meanwhile, the mean value of maximum steering angle for the long straight segment and merging segment are close to each other, and the mean value of the maximum steering angle under diverging segment are larger. This indicates that under the long straight segment, drivers tended to take more steering wheel turns with small turning angles. While under diverging segment, they tended to take fewer steering wheel turns with large turning angles.
In addition, the steering behavior parameters for each type of urgency scenario under three typical road segment are further displayed in Figure 8.
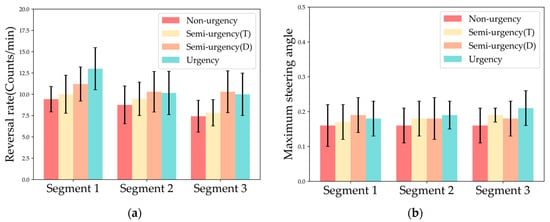
Figure 8.
Steering Indicators. (a) Steering wheel reversal rate; (b) Maximum steering angle.
As shown in Figure 8a, the overall steering wheel reversal rate tended to increase with the climb of the scenario tightness. This phenomenon is particularly significant on the long straight segments. The steering wheel reversal rate is the highest under the scenarios with “Semi-urgency(D)” under the merging segment and diverging segment. Meanwhile, the steering wheel reversal rate under S5 and S6 are significantly lower than those under S7 and S8 (S5 = 8.76, S6 = 9.46, S7 = 10.3, S8 = 10.16). The value under S9 and S10 re significantly lower than those under S11 and S12 (S9 = 7.43, S10 = 7.83, S11 = 10.30, S12 = 10.00). This indicates that the steering wheel reversal rate under “Semi-urgency(D)” and “Urgency” scenarios are significantly higher than those under “Semi-urgency(T)” and “Non-urgency” scenarios.
In Figure 8b, similar to Figure 1a, the maximum steering angle tended to increase overall. On the merging and diverging segments, this trend is more significant. For example, in the “Non-urgency” scenario, the maximum steering angle is the smallest. Under the “Urgency” scenario, the maximum steering angle reaches the highest value. Under the “Semi-urgency scenario”, there is no uniform trend of change for the “Semi-urgency(T)” scenario and the “Semi-urgency(D)” scenario. Under long straight segments, the mean value of the maximum steering angle reaches the maximum in S3 (S3 = 0.19). There is a slight decrease in the maximum steering angle in S4 (S4 = 0.18).
3.5. Take-Over Safety Evaluation
For the take-over process, previous studies have analyzed take-over performance separately from multiple indicators [18,28]. However, the quantitative assessment of the safety of automated driving takeover has not been studied thoroughly. Therefore, this study adopted the idea of entropy. The information entropy of each indicator was quantified, and the importance of each indicator to the target was decided based on the relative degree of indicator’s change. In this study, the five indicators, as discussed above, were considered as negative indicators.
It is assumed that there are m samples and n evaluation indicators. After standardizing the data, the entropy value of each indicator is calculated by Equation (2):
where (1 ≤ i ≤ m, 1 ≤ j ≤ n) is the value of the jth indicator of the ith sample.
The weights of each indicator are calculated by Equation (3):
where is the information entropy of the jth indicator.
The weights of the reaction time, lateral deviation rate, braking amplitude, steering wheel reversal rate and the maximum steering angle were 0.188, 0.086, 0.505, 0.116, 0.105, respectively. Figure 9 shows the performance scores for all take-over processes.
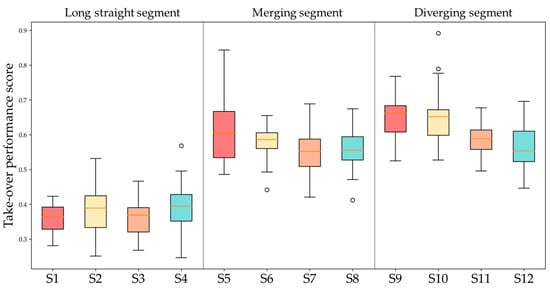
Figure 9.
The performance scores for all take-over pieces.
Figure 9 indicates that drivers had lower ratings on long straight segments compared to the diverging and merging segments. This result does not match expectations. This may be due to the following reasons:
- (1)
- Faster speed on the long straight segment led to unsafe behavior. When faced with an emergency take-over scenario on such road, drivers were more likely to engage in aggressive braking behavior with fast initial speed and untimely control.
- (2)
- The more complex traffic environment of the diverging and merging segments gave drivers a degree of risk anticipation, resulting in a lower risk of take-over on such segments.
Additionally, the take-over performance scores decreased as the urgency of the scenario increased on the merging segment and diverging segment. Figure 8 shows that braking amplitude, as the evaluation index with the greatest weight, is likely to be the important factor that caused the difference in take-over performance scores under the diverging and merging area.
4. Discussion
4.1. The Influence of Different Segments and Urgency on Reaction Time
The reaction time is an important measure of a driver’s response speed and take-over capability [33]. The results in Section 3.1 indicate that there is no significant difference in takeover reaction time across different highway segments. However, there is a significant difference in take-over reaction time in different emergency situations.
Generally, in high-urgency take-over scenarios, where drivers need to take immediate action to avoid accidents or hazardous situations, drivers need to react promptly. However, in situations with lower urgency, drivers may have more time to consider various factors before responding. Previous research has often simplified the urgency of a scenario by equating it to collision time [34]. However, the urgency of the same scenario is influenced by multiple factors such as collision time, road conditions, and traffic environment [35]. This study introduced time budget to impose time pressure on drivers and traffic density to provide environmental pressure, constructing different levels of urgency scenarios. Ultimately, we found that compared to traffic flow density, time budget played a determining role in drivers’ reaction time. In situations with shorter time budget, drivers exhibited shorter reaction times, which aligns with previous research findings [4].
However, a shorter time budget can also lead to inappropriate evasive behaviors and poorer take-over quality [36]. For example, we found an inverse relationship between reaction time and braking amplitude in different emergency situations. Faster reaction times resulted in larger braking amplitudes. Therefore, when designing human–machine interaction systems, reliable alert mechanisms should be equipped to enhance drivers’ comprehension efficiency in emergency situations, aiming to shorten reaction times.
4.2. The Influence of Different Segments and Urgency on Braking Amplitude
This study found that the variation in braking amplitude was more significant in the long straight segment compared to the other two segments. We believe this is related to the speed set by the autonomous driving system. Previous research shows that the faster the speed during braking, the higher the risk of collision [37]. In the experiment, the driver’s take-over speed was 90 km/h in the long straight segment, and the driver had a higher longitudinal risk. However, in the merging and diverging segments, the driver’s take-over speed was 60 km/h, and the driver felt relatively safe in longitudinal control. In obstacle avoidance scenarios, drivers typically employ two driving strategies, either decelerating before changing lanes or simultaneous deceleration and lane change. When drivers are unexpectedly required to take control of the vehicle, they often do not have enough time to observe the surrounding traffic environment. Therefore, in high-speed driving situations, drivers tend to apply a larger degree of braking to quickly reduce the vehicle’s speed.
In merging and diverging segments where the take-over speeds are the same, there is not much difference in braking amplitude among drivers. However, in different urgency scenarios (TB = 7 s vs. TB = 5 s), there is a significant variation in braking amplitude among drivers. In higher urgency scenarios, drivers apply greater braking amplitude. This may be due to the tendency of drivers to decrease vehicle speed for stable vehicle control in emergency situations. Yang also found that turning maneuvers and braking actions are easier to execute at lower speeds [38].
4.3. The Influence of Different Segments and Urgency on Lateral Deviation Rate
The lateral deviation rate can effectively evaluate the drastic degree of lane change in the obstacle avoidance scenarios. It is an important index to reflect the stability of vehicle lateral control. This study found that in the case of high traffic density, the lateral deflection rate of vehicles was significantly higher than in the case of low traffic density. This indicates that in high traffic density situations, the vehicles moved faster in the lateral direction. This is because higher traffic density forces drivers to take more active lane changing behavior.
In addition, the standard deviation of the lateral deviation rate under the diverging segment was significantly smaller with the long straight segment and the merging segment. This indicated that drivers’ lateral control behavior of the vehicle tended to be consistent on the diverging segment. We believe that this is because in the obstacle avoidance situations on diverging segment, drivers may perceive greater risks when taking over. This leads to their tendency towards cautious takeover behavior, which makes the heterogeneity between drivers less apparent.
4.4. The Influence of Different Segments and Urgency on Steering Indicators
For the steering indicators, it was clear that the steering wheel reversal rate showed an overall increasing trend as the scenario urgency increased. This is an overcompensation behavior, that is drivers increase the frequency of steering wheel corrections to compensate for the effect of the emergency scenario on controlling the vehicle, which maintains lane keeping performance. This was consistent with Engstroem’s study [39].
The overcompensation effect enables the driver to maintain better lateral stability, but it will increase the cognitive load on the driver. On long straight segment, the initial cognitive load of the driver was low due to the simple driving environment, and the steering wheel reversal rate increased continuously with the increase of urgency. On the merging and diverging segments, the initial cognitive load of the driver was high due to the relatively complex driving environment, and the steering wheel reversal rate tended to rise and fall. This meant that when the urgency reached a certain level, drivers took fewer lateral operations and the effect of overcompensation effect would not increase again.
For the maximum steering angle, this study considered it as a parameter related to the risk level of the scenario. For low-risk scenarios, drivers usually adapt avoidance behaviors that suit them. As the degree of scenario risk increased, drivers tended to adopt more aggressive driving behaviors, such as increasing the steering wheel angle in order to complete the avoidance behavior as soon as possible [40,41]. When the risk level of the scenario increased to a certain degree, drivers favored cautious driving strategies to ensure the safety of the avoidance process again.
In this study, the risk level of the scenario was considered to be related not only to the traffic density and time budget, but also to the speed set by the automated system [42]. In the merging and diverging segments, the driver took over slower and perceived less risk. Therefore, the maximum steering angle showed an overall upward trend. In the long straight segment, the driver took over faster and perceived higher risks. Therefore, the maximum steering angle showed a trend of increasing and then decreasing as the urgency increased.
5. Conclusions
The main contribution of this study is to discuss the influence of different traffic densities and time budgets on driver’s take-over performance, and the differences in take-over safety under long straight segments, merging segments and diverging segments of highways. It can be concluded that:
- (1)
- The time budget had a significant influence on reaction time and braking amplitude. The short time budget is beneficial to improve reaction time, and hasa disadvantage on the braking amplitude and take-over performance.
- (2)
- Traffic density had a significant influence on lateral deviation rate. The high-traffic density has a disadvantage on the lateral deviation rate and take-over safety.
- (3)
- The maximum steering angle and steering wheel reversal rate tended to rise or first rise and then fall with scenario urgency. This depends on the effect of overcompensation on the driver and the ability to perceive risk.
- (4)
- For the emergency avoidance scenario, the driver’s braking amplitude was the largest and the steering wheel reversal rate was the largest under the long straight segment; the driver’s lateral deviation rate was the largest, the steering wheel reversal rate was the smallest and the maximum steering angle was the largest under the diverging segment. Therefore, we should pay more attention to the longitudinal safety of the vehicle under the long straight segments and the lateral safety of the vehicle under the diverging segments.
This study still has several limitations. Firstly, due to the risk of field tests, the experiment can only be conducted by simulated driving. However, the risk perceived by drivers in the simulator may be less than the risk in the real world. Therefore, drivers may have more aggressive behaviors in the simulated experiment. Secondly, the age range of the participants was between 22 and 37 years old. In future studies, driver-related indicators should be paid more attention, such as different age groups, working load, etc. In addition, more micro-indicators can be considered as influencing factors of the traffic environment, such as the number of vehicles around the self-vehicle and the distance between the self-vehicle and the adjacent vehicles.
Author Contributions
Conceptualization, Z.X. and Y.L.; Methodology, Z.X.; Software, Y.L.; Data curation, Z.X.; Writing—original draft preparation, Z.X. All authors have read and agreed to the published version of the manuscript.
Funding
This research was funded by the National Natural Science Foundation of China, grant number 52202419.
Data Availability Statement
Data will be made available on reasonable request from the corresponding author.
Acknowledgments
Thanks to all the participants for attending the experiments.
Conflicts of Interest
The authors declare that they have no known competing financial interests or personal relationships that could have appeared to influence the work reported in this paper.
References
- SAE. On-Road Automated Vehicle Standards Committee. SAE J3016: Taxonomy and Definitions for Terms Related to On-Road Motor Vehicle Automated Driving Systems; SAE International: Warrendale, PA, USA, 2014. [Google Scholar]
- State of California Department of Motor Vehicles, 2019. Testing of Autonomous Vehicles with a Driver. Available online: https://www.dmv.ca.gov/portal/dmv/detail/vr/autonomous/testing (accessed on 10 June 2023).
- Gold, C.; Happee, R.; Bengler, K. Modeling Take-over Performance in Level 3 Conditionally Automated Vehicles. Accid. Anal. Prev. 2018, 116, 3–13. [Google Scholar] [CrossRef] [PubMed]
- Gold, C.; Damböck, D.; Lorenz, L.; Bengler, K. Take over! How Long Does It Take to Get the Driver Back into the Loop? In Proceedings of the Human Factors and Ergonomics Society 57th Annual Meeting, Los Angeles, CA, USA, 30 September–4 October 2013; pp. 1938–1942. [Google Scholar]
- Ito, T.; Takata, A.; Oosawa, K. Time Required for Take-Over from Automated to Manual Driving; SAE Technical Papers; SAE International: Warrendale, PA, USA, 2016. [Google Scholar]
- Samuel, S.; Borowsky, A.; Zilberstein, S.; Fisher, D.L. Minimum Time to Situation Awareness in Scenarios Involving Transfer of Control from an Automated Driving Suite. Transp. Res. Rec. 2016, 2602, 115–120. [Google Scholar] [CrossRef]
- Eriksson, A.; Stanton, N.A. Takeover Time in Highly Automated Vehicles: Noncritical Transitions to and from Manual Control. Hum. Factors 2017, 59, 689–705. [Google Scholar] [CrossRef]
- Muthumani, A.; Diederichs, F.; Galle, M.; Schmid-Lorch, S.; Forsberg, C.; Widlroither, H.; Feierle, A.; Bengler, K. How Visual Cues on Steering Wheel Improve Users’ Trust, Experience, and Acceptance in Automated Vehicles. In Advances in Human Aspects of Transportation, Proceedings of the AHFE 2020 Advances in Human Aspects of Transportation, Virtual, 16–20 July 2020; Advances in Intelligent Systems and Computing; Springer: Berlin/Heidelberg, Germany, 2020; Volume 1212, pp. 186–192. [Google Scholar]
- Politis, I.; Brewster, S.; Pollick, F. Language-Based Multimodal Displays for the Handover of Control in Autonomous Cars. In Proceedings of the 7th International Conference on Automotive User Interfaces and Interactive Vehicular Applications, Automotive UI 2015, Nottingham, UK, 1–3 September 2015; Association for Computing Machinery: New York, NY, USA, 2015; Volume 2015, pp. 3–10. [Google Scholar]
- Petermeijer, S.; Bazilinskyy, P.; Bengler, K.; de Winter, J. Take-over Again: Investigating Multimodal and Directional TORs to Get the Driver Back into the Loop. Appl. Ergon. 2017, 62, 204–215. [Google Scholar] [CrossRef] [PubMed]
- Baek, S.J.; Yang, J.H.; Yun, H. How Do Humans Respond When Automated Vehicles Request an Immediate Vehicle Control Take-Over? In Proceedings of the 11th International Conference on Automotive User Interfaces and Interactive Vehicular Applications: Adjunct Proceedings, Utrecht, The Netherlands, 21–25 September 2019; pp. 341–345. [Google Scholar]
- Petermeijer, S.M.; Cieler, S.; de Winter, J.C.F. Comparing Spatially Static and Dynamic Vibrotactile Take-over Requests in the Driver Seat. Accid. Anal. Prev. 2017, 99, 218–227. [Google Scholar] [CrossRef]
- Forster, Y.; Naujoks, F.; Neukum, A.; Huestegge, L. Driver Compliance to Take-over Requests with Different Auditory Outputs in Conditional Automation. Accid. Anal. Prev. 2017, 109, 18–28. [Google Scholar] [CrossRef]
- Bazilinskyy, P.; de Winter, J.C.F. Analyzing Crowdsourced Ratings of Speech-Based Take-over Requests for Automated Driving. Appl. Ergon. 2017, 64, 56–64. [Google Scholar] [CrossRef]
- Hellier, E.; Edworthy, J.; Weedon, B.; Walters, K.; Adams, A. The Perceived Urgency of Speech Warnings: Semantics versus Acoustics. Hum. Factors 2002, 44, 1–17. [Google Scholar] [CrossRef]
- Du, N.; Kim, J.; Zhou, F.; Pulver, E.; Tilbury, D.M.; Robert, L.P.; Pradhan, A.K.; Yang, X.J. Evaluating Effects of Cognitive Load, Takeover Request Lead Time, and Traffic Density on Drivers’ Takeover Performance in Conditionally Automated Driving. In Proceedings of the 12th International Conference on Automotive User Interfaces and Interactive Vehicular Applications, Virtual, 21–22 September 2020; pp. 66–73. [Google Scholar]
- Louw, T.; Merat, N. Are You in the Loop? Using Gaze Dispersion to Understand Driver Visual Attention during Vehicle Automation. Transp. Res. Part C Emerg. Technol. 2017, 76, 35–50. [Google Scholar]
- Gold, C.; Körber, M.; Lechner, D.; Bengler, K. Taking over Control from Highly Automated Vehicles in Complex Traffic Situations. Hum. Factors 2016, 58, 642–652. [Google Scholar] [CrossRef]
- Körber, M.; Gold, C.; Lechner, D.; Bengler, K. The Influence of Age on the Take-over of Vehicle Control in Highly Automated Driving. Transp. Res. Part F Traffic Psychol. Behav. 2016, 39, 19–32. [Google Scholar] [CrossRef]
- Radlmayr, J.; Gold, C.; Lorenz, L.; Farid, M.; Bengler, K. How Traffic Situations and Non-Driving Related Tasks Affect the Take-over Quality in Highly Automated Driving. In Proceedings of the Human Factors and Ergonomics Society Annual Meeting, Los Angeles, CA, USA, September 2014; pp. 2063–2067. [Google Scholar]
- Doubek, F.; Loosveld, E.; Happee, R.; De Winter, J. Takeover Quality: Assessing the Effects of Time Budget and Traffic Density with the Help of a Trajectory-Planning Method. J. Adv. Transp. 2020, 2020, 6173150. [Google Scholar] [CrossRef]
- Chen, H.; Zhou, H.; Zhao, J.; Hsu, P. Safety Performance Evaluation of Left-Side off-Ramps at Freeway Diverge Areas. Accid. Anal. Prev. 2011, 43, 605–612. [Google Scholar] [CrossRef] [PubMed]
- Zahabi, M.; Machado, P.; Lau, M.Y.; Deng, Y.; Pankok, C.; Hummer, J.; Rasdorf, W.; Kaber, D.B. Driver Performance and Attention Allocation in Use of Logo Signs on Freeway Exit Ramps. Appl. Ergon. 2017, 65, 70–80. [Google Scholar] [CrossRef]
- Li, S.; Blythe, P.; Guo, W.; Namdeo, A. Investigation of Older Drivers’ Requirements of the Human-Machine Interaction in Highly Automated Vehicles. Transp. Res. Part F Traffic Psychol. Behav. 2019, 62, 546–563. [Google Scholar] [CrossRef]
- Roche, F. Assessing Subjective Criticality of Take-over Situations: Validation of Two Rating Scales. Accid. Anal. Prev. 2021, 159, 106216. [Google Scholar] [CrossRef]
- Alrefaie, M.T.; Summerskill, S.; Jackon, T.W. In a Heart Beat: Using Driver’s Physiological Changes to Determine the Quality of a Takeover in Highly Automated Vehicles. Accid. Anal. Prev. 2019, 131, 180–190. [Google Scholar] [CrossRef]
- Yi, B.; Cao, H.; Song, X.; Zhao, S.; Guo, W.; Li, M. How to identify the take-over criticality in conditionally automated driving? An examination using drivers’ physiological parameters and situational factors. Transp. Res. Part F Traffic Psychol. Behav. 2022, 85, 161–178. [Google Scholar]
- Wu, H.; Wu, C.; Lyu, N.; Li, J. Does a faster takeover necessarily mean it is better? A study on the influence of urgency and takeover-request lead time on takeover performance and safety. Accid. Anal. Prev. 2022, 171, 106647. [Google Scholar]
- Happee, R.; Gold, C.; Radlmayr, J.; Hergeth, S.; Bengler, K. Take-over Performance in Evasive Manoeuvres. Accid. Anal. Prev. 2017, 106, 211–222. [Google Scholar] [CrossRef]
- Kountouriotis, G.K.; Spyridakos, P.; Carsten, O.M.J.; Merat, N. Identifying Cognitive Distraction Using Steering Wheel Reversal Rates. Accid. Anal. Prev. 2016, 96, 39–45. [Google Scholar] [CrossRef] [PubMed]
- Kountouriotis, G.K.; Merat, N. Leading to distraction: Driver distraction, lead car, and road environment. Accid. Anal. Prev. 2016, 89, 22–30. [Google Scholar] [CrossRef] [PubMed]
- Wrle, J.; Metz, B.; Baumann, M. Sleep inertia in automated driving: Post-sleep take-over and driving performance. Accid. Anal. Prev. 2021, 150, 105918. [Google Scholar] [CrossRef]
- Gong, J.; Guo, X.; Pan, L.; Qi, C.; Wang, Y. Impact of Age on Takeover Behavior in Automated Driving in Complex Traffic Situations: A Case Study of Beijing, China. Sustainability 2022, 14, 483. [Google Scholar] [CrossRef]
- Lin, Q.; Li, S.; Ma, X.; Lu, G. Understanding take-over performance of high crash risk drivers during conditionally automated driving. Accid. Anal. Prev. 2020, 143, 105543. [Google Scholar] [CrossRef] [PubMed]
- Ayoub, J.; Du, N.; Yang, X.; Zhou, F. Predicting Driver Takeover Time in Conditionally Automated Driving. IEEE Trans. Intell. Transp. Syst. 2022, 23, 9580–9589. [Google Scholar] [CrossRef]
- Wang, W.; Na, X.; Cao, D. Decision-making in driver-automation shared control: A review and perspectives. IEEE/CAA J. Autom. Sin. 2020, 7, 1289–1307. [Google Scholar] [CrossRef]
- Wang, J.; Zheng, Y.; Li, X.; Yu, C.; Kodaka, K.; Li, K. Driving risk assessment using near-crash database through data mining of tree-based model. Accid. Anal. Prev. 2015, 84, 54–64. [Google Scholar] [CrossRef]
- Yang, W.; Wu, Z.; Tang, J.; Liang, Y. Assessing the Effects of Modalities of Takeover Request, Lead Time of Takeover Request, and Traffic Conditions on Takeover Performance in Conditionally Automated Driving. Sustainability 2023, 15, 7270. [Google Scholar] [CrossRef]
- Engstroem, J.; Johansson, E.; Oestlund, J. Effects of visual and cognitive load in real and simulated motorway driving. Transp. Res. Part F Traffic Psychol. Behav. 2005, 8, 97–120. [Google Scholar] [CrossRef]
- Llopis-Castelló, D.; Camacho-Torregrosa, F.J.; Marín-Morales, J.; Pérez-Zuriaga, A.M.; García, A.; Dols, J.F. Validation of a Low-Cost Driving Simulator Based on Continuous Speed Profiles. Transp. Res. Rec. 2016, 2602, 104–114. [Google Scholar] [CrossRef]
- Ekanayake, H.B.; Backlund, P.; Ziemke, T.; Ramberg, R.; Hewagamage, K.P.; Lebram, M. Comparing Expert Driving Behavior in Real World and Simulator Contexts. Int. J. Comput. Games Technol. 2013, 2013, 891431. [Google Scholar] [CrossRef]
- Ma, Y.; Meng, H.; Chen, S.; Zhao, J.; Li, S.; Xiang, Q. Predicting Traffic Conflicts for Expressway Diverging Areas Using Vehicle Trajectory Data. J. Transp. Eng. Part A Syst. 2020, 146, 04020003. [Google Scholar] [CrossRef]
Disclaimer/Publisher’s Note: The statements, opinions and data contained in all publications are solely those of the individual author(s) and contributor(s) and not of MDPI and/or the editor(s). MDPI and/or the editor(s) disclaim responsibility for any injury to people or property resulting from any ideas, methods, instructions or products referred to in the content. |
© 2023 by the authors. Licensee MDPI, Basel, Switzerland. This article is an open access article distributed under the terms and conditions of the Creative Commons Attribution (CC BY) license (https://creativecommons.org/licenses/by/4.0/).