


New Trends in Smart Cities: The Evolutionary Directions Using Topic Modeling and Network Analysis


Abstract
1. Introduction
2. Theoretical Background
2.1. Topical Review: Smart City
2.2. Methodological Review: Topic Modeling and Smart City
3. Materials and Methods
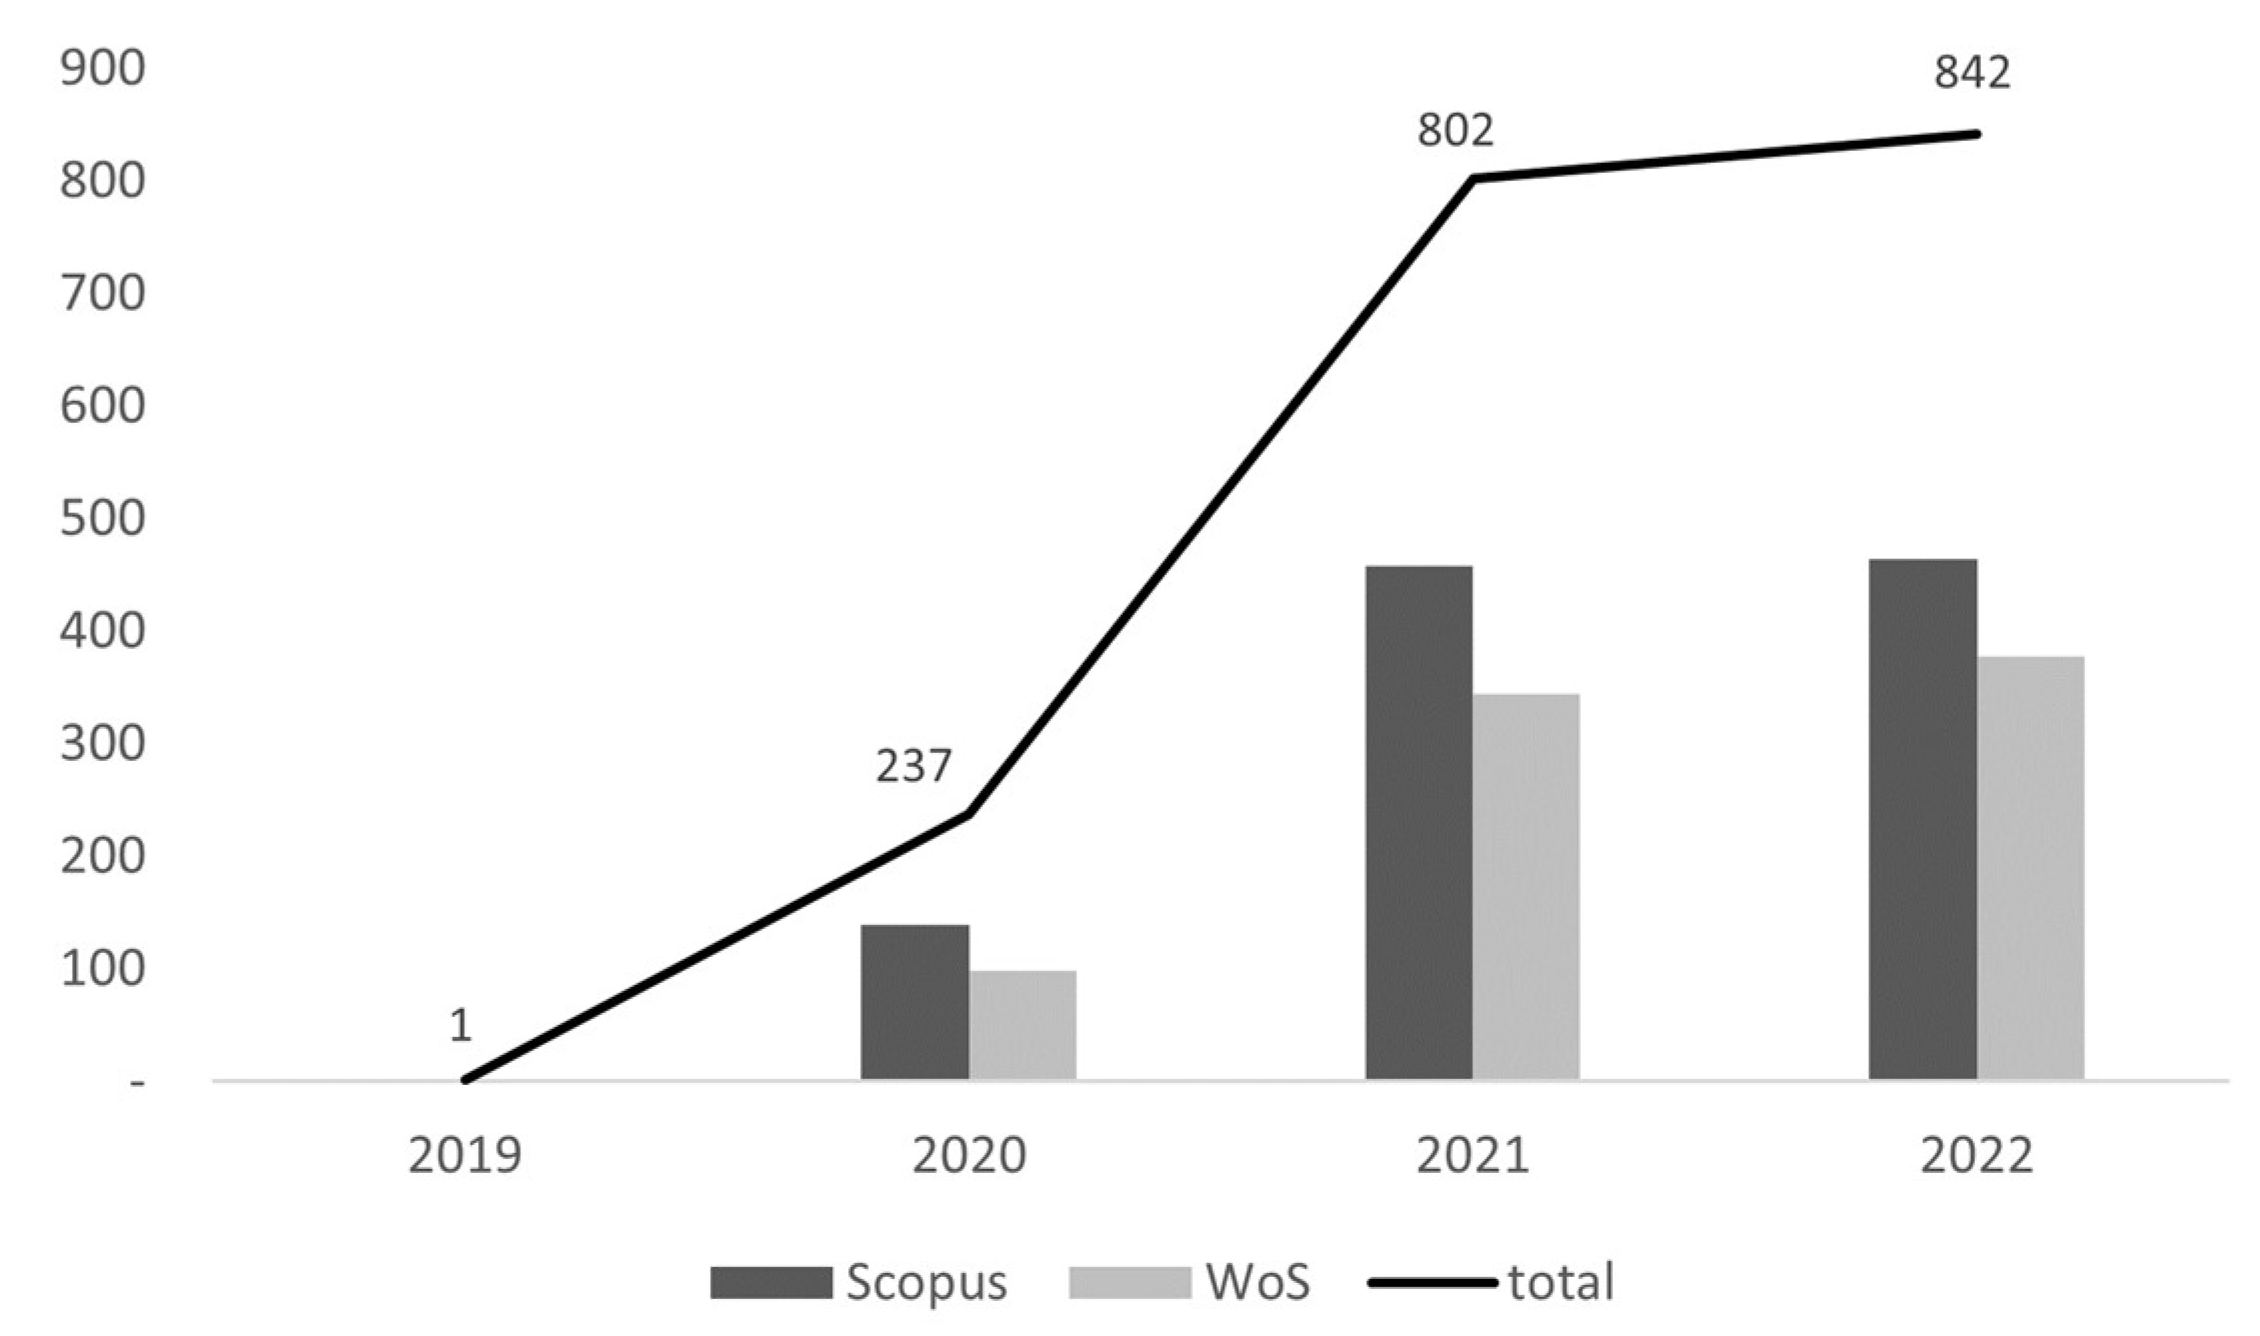
3.1. Data Collection
3.2. Data Preprocessing and Analysis Tool and Techniques
3.2.1. Preprocessing
3.2.2. Analysis Tools and Techniques
- : the number of nodes
- : the number of paths that exist between node and
4. Results
4.1. Word Frequency
4.2. TF-IDF
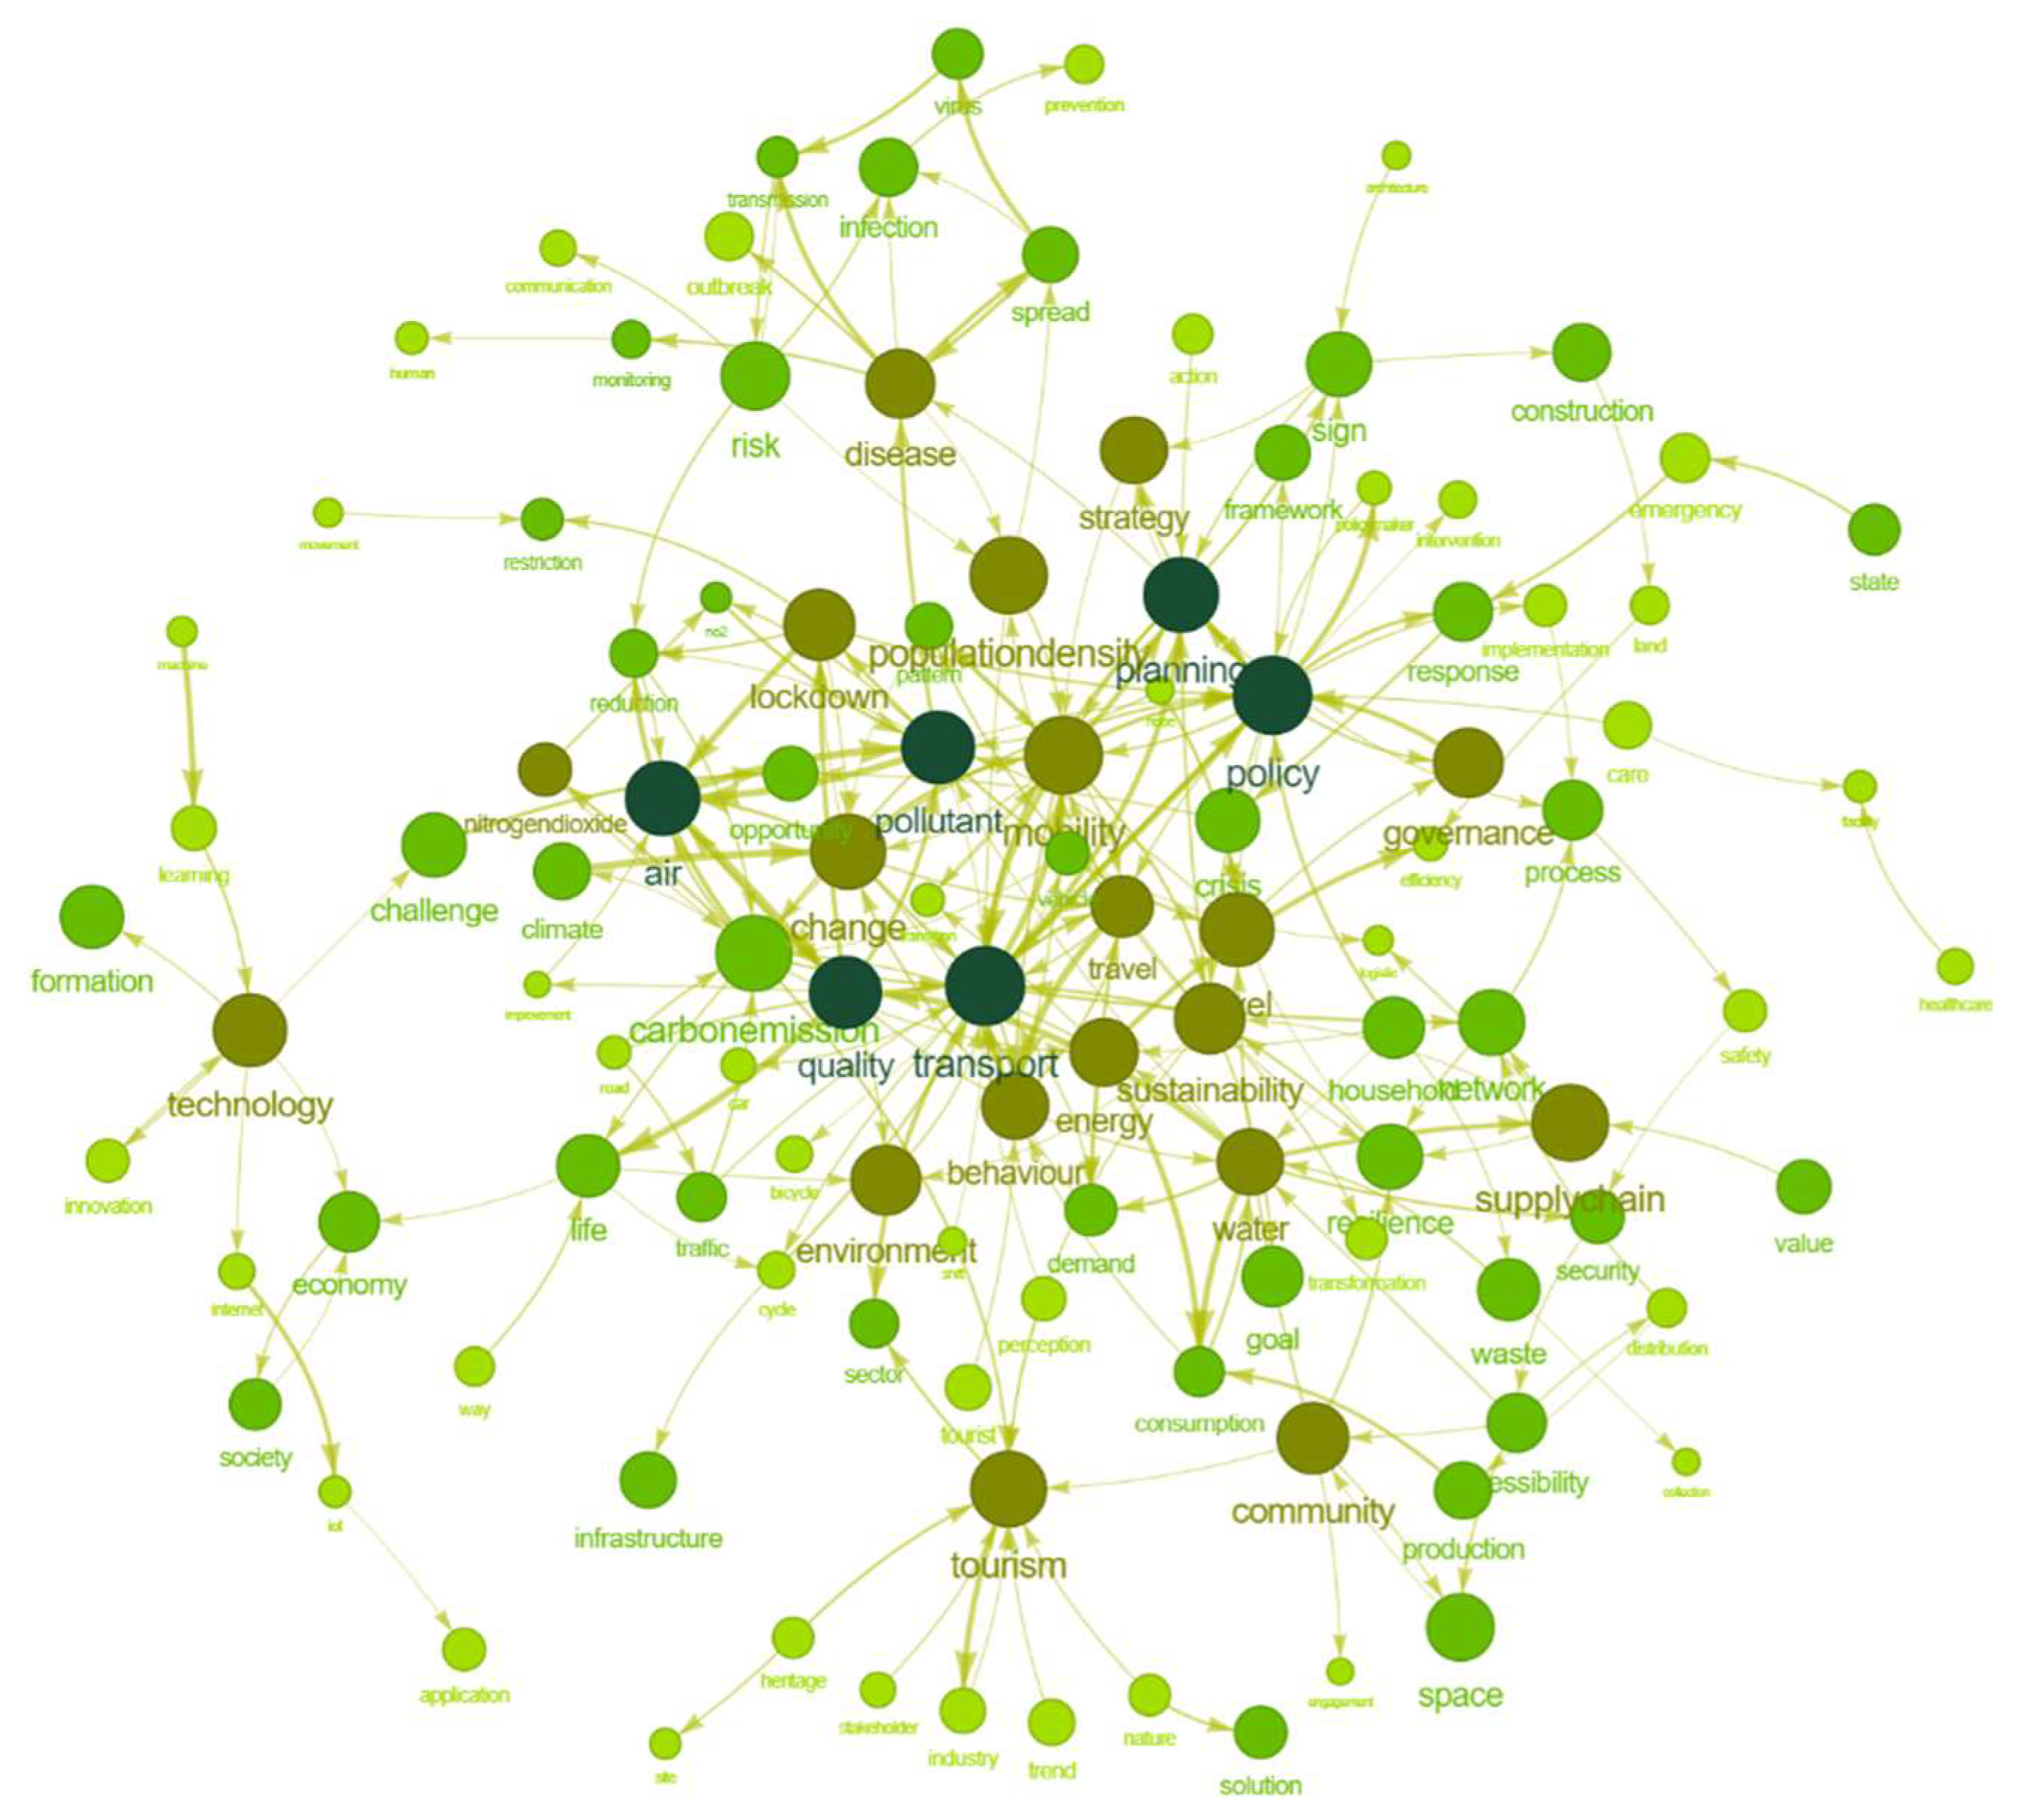
4.3. Connection Centrality
4.4. n-Gram
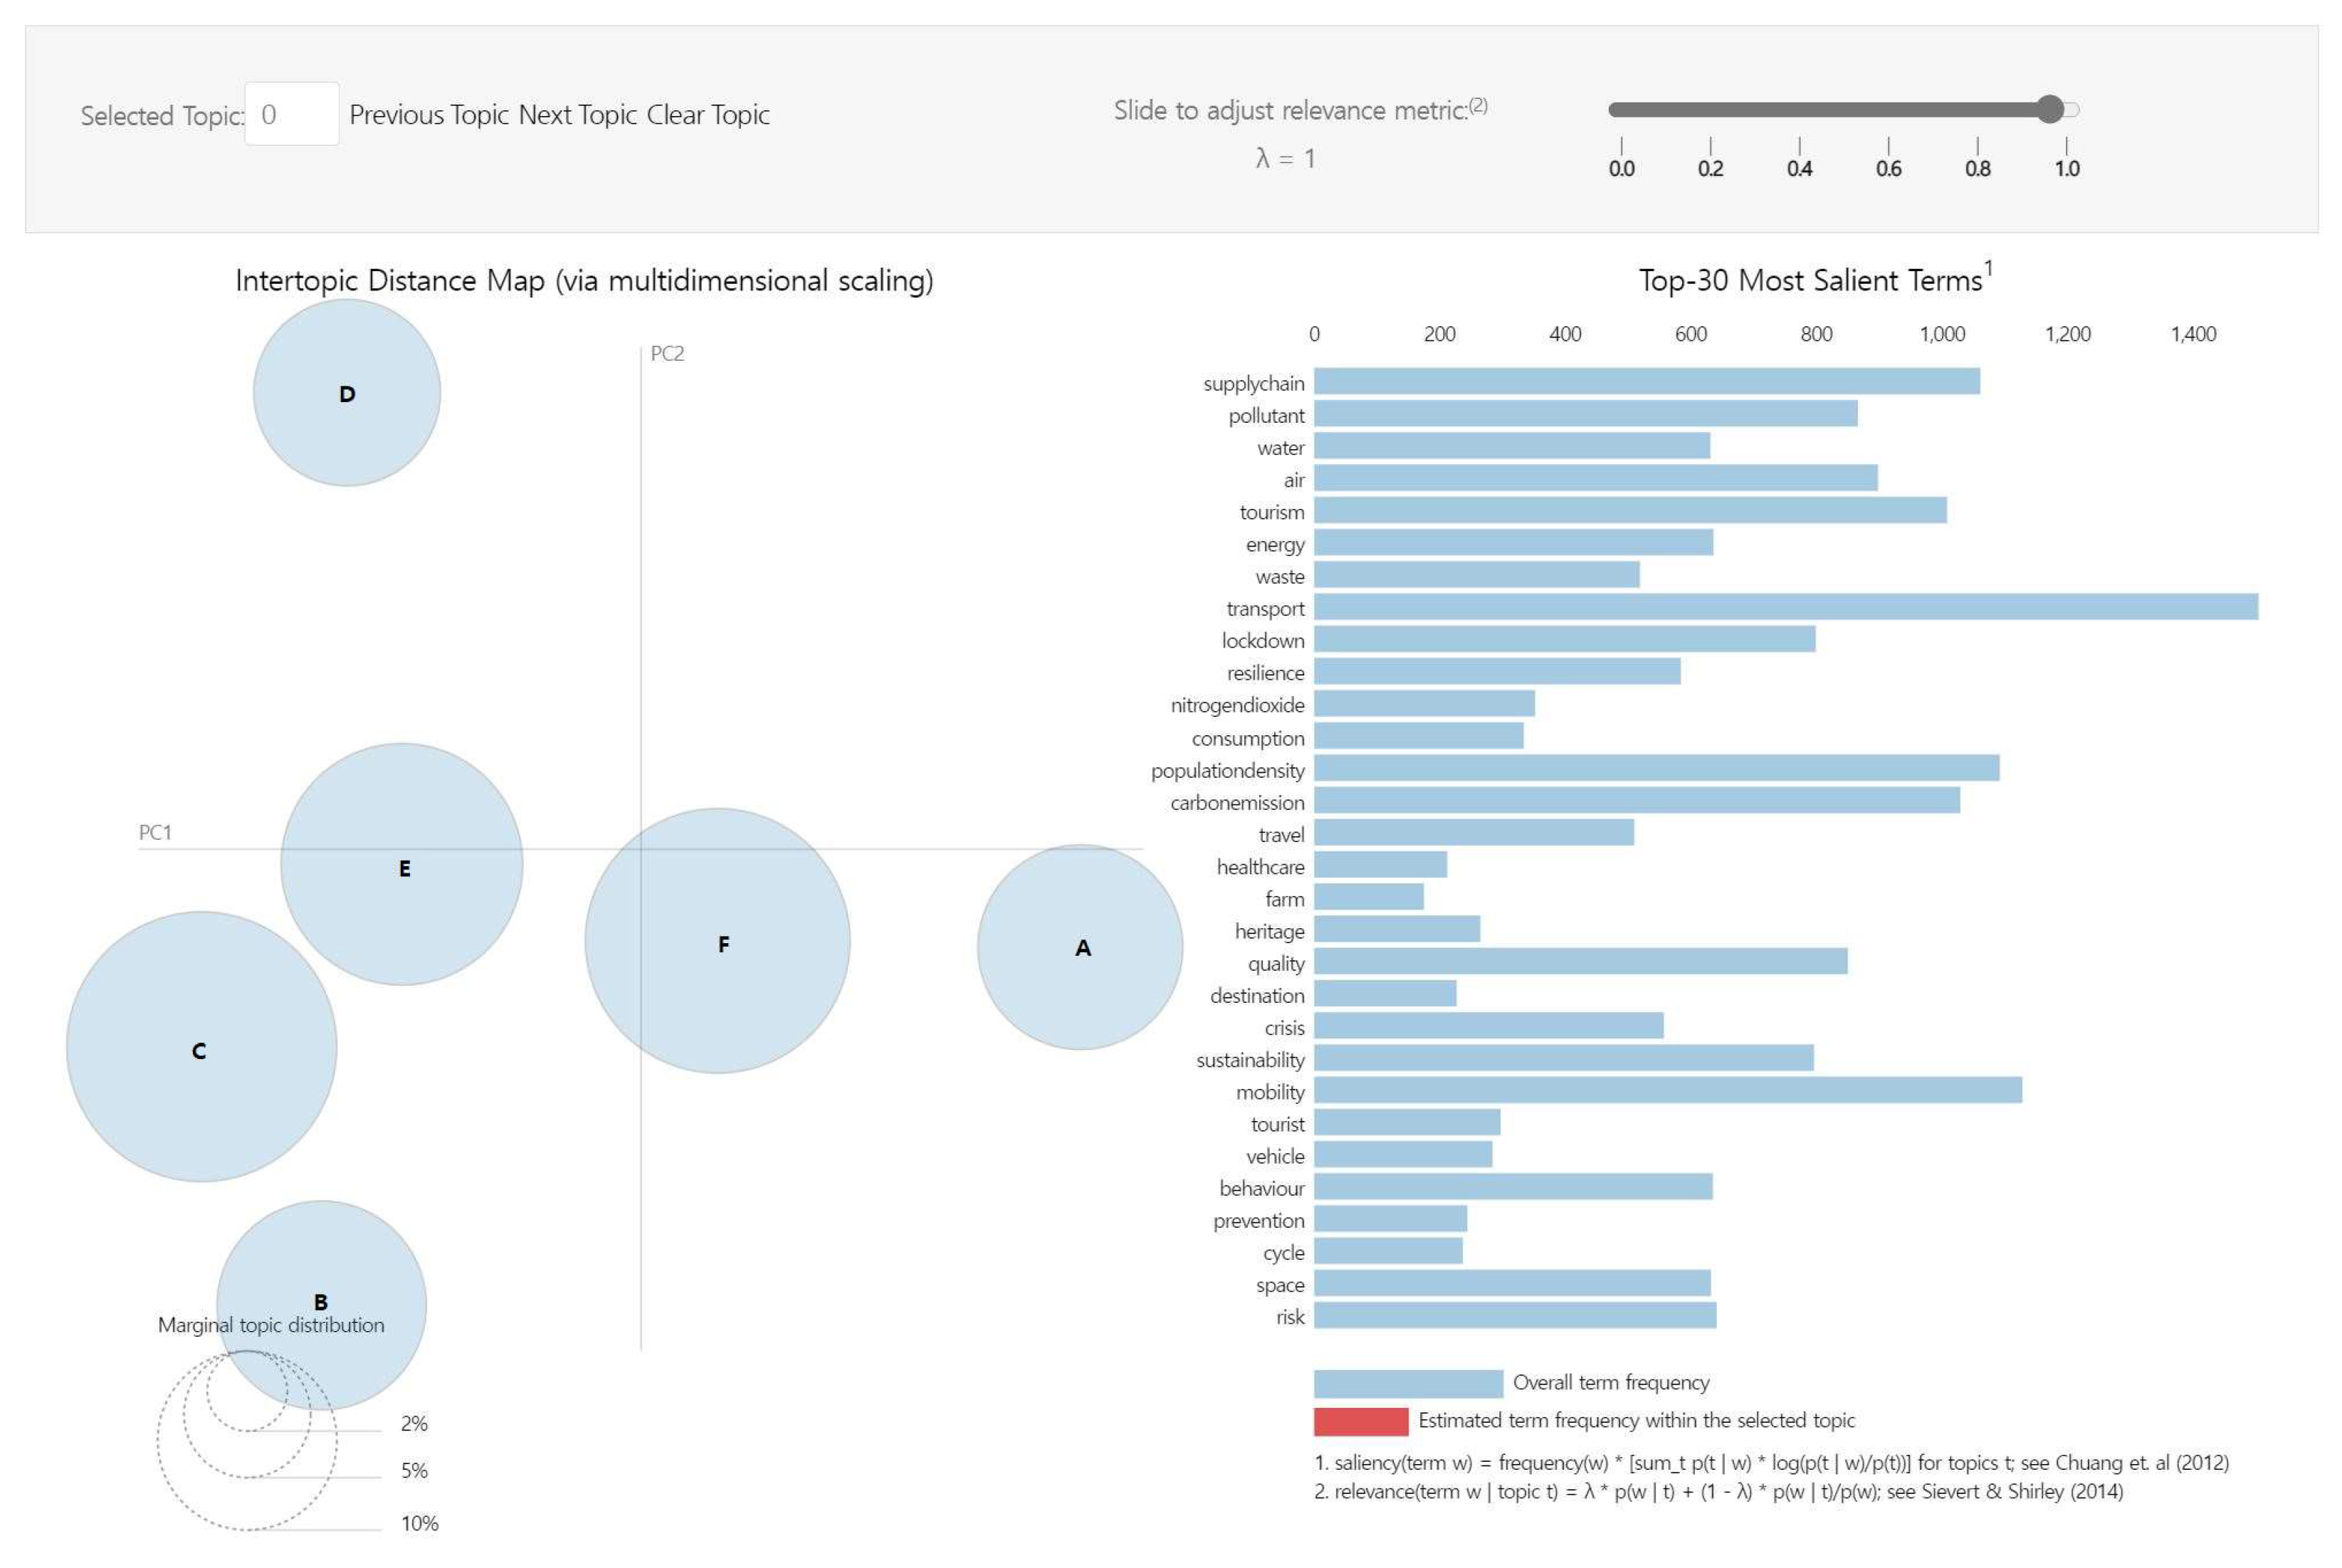
4.5. Topic Modeling
5. Concluding Remarks
5.1. Discussion and Implication
5.2. Future Studies
Author Contributions
Funding
Data Availability Statement
Conflicts of Interest
References
- Xin, B.; Qu, Y. Effects of smart city policies on green total factor productivity: Evidence from a quasi-natural experiment in China. Int. J. Environ. Res. Public Health 2019, 16, 2396. [Google Scholar] [CrossRef] [PubMed]
- Yigitcanlar, T.; Kamruzzaman, M.; Foth, M.; Sabatini-Marques, J.; da Costa, E.; Ioppolo, G. Can cities become smart without being sustainable? A systematic review of the literature. Sustain. Cities Soc. 2019, 45, 348–365. [Google Scholar] [CrossRef]
- Sharifi, A. A typology of smart city assessment tools and indicator sets. Sustain. Cities Soc. 2020, 53, 101936. [Google Scholar] [CrossRef]
- Bibri, S.E. A foundational framework for smart sustainable city development: Theoretical, disciplinary, and discursive dimensions and their synergies. Sustain. Cities Soc. 2018, 38, 758–794. [Google Scholar] [CrossRef]
- Bonato, D.; Orsini, R. Urban circular economy: The new frontier for European cities’ sustainable development. In Sustainable Cities and Communities Design Handbook; Butterworth-Heinemann: Oxford, UK, 2018; pp. 235–245. [Google Scholar]
- Bibri, S.E.; Krogstie, J. On the social shaping dimensions of smart sustainable cities: A study in science, technology, and society. Sustain. Cities Soc. 2017, 29, 219–246. [Google Scholar] [CrossRef]
- Birkeland, J. Design for Sustainability: A Sourcebook of Integrated, Eco-logical Solutions; Earthscan: Oxford, UK, 2002. [Google Scholar]
- Antonini, E.; Boulanger, S.O.M.; Gaspari, J. Multi-layered urban strategies to foster the smart cities development. WIT Trans. Ecol. Environ. 2015, 194, 23–34. [Google Scholar]
- Kang, M.; Choi, Y.; Kim, J.; Lee, K.O.; Lee, S.; Park, I.K.; Seo, I. COVID-19 impact on city and region: What’s next after lockdown? Int. J. Urban Sci. 2020, 24, 297–315. [Google Scholar] [CrossRef]
- Altan, O.; Alcántara-Ayala, I.; Baker, D.N.; Briceño, S.; Cutter, S.L.; Gupta, H.; Zhai, P. Disaster Risks Research and Assessment to Promote Risk Reduction and Management. 2015. Available online: https://www.researchgate.net/publication/305992507_Disaster_Risks_Research_and_Assessment_to_Promote_Risk_Reduction_and_Management (accessed on 11 August 2016).
- Boulanger, S.O.M. The roadmap to smart cities: A bibliometric literature review on smart cities’ trends before and after the COVID-19 pandemic. Energies 2022, 15, 9326. [Google Scholar] [CrossRef]
- Sharifi, A.; Khavarian-Garmsir, A.R. The COVID-19 pandemic: Impacts on cities and major lessons for urban planning, design, and management. Sci. Total Environ. 2020, 749, 142391. [Google Scholar] [CrossRef]
- Sharifi, A. The COVID-19 pandemic: Lessons for urban resilience. In COVID-19: Systemic Risk and Resilience; Springer International Publishing: Cham, Switzerland, 2021; pp. 285–297. [Google Scholar]
- Clerici Maestosi, P.; Andreucci, M.B.; Civiero, P. Sustainable urban areas for 2030 in a post-COVID-19 scenario: Focus on innovative research and funding frameworks to boost transition towards 100 positive energy districts and 100 climate-neutral cities. Energies 2021, 14, 216. [Google Scholar] [CrossRef]
- Kollu, P.K.; Kumar, K.; Kshirsagar, P.R.; Islam, S.; Naveed, Q.N.; Hussain, M.R.; Sundramurthy, V.P. Development of advanced artificial intelligence and IoT automation in the crisis of COVID-19 Detection. J. Healthc. Eng. 2022, 2022, 1987917. [Google Scholar] [CrossRef]
- World Bank Group. Investing in Urban Resilience: Protecting and Promoting Development in a Changing World; World Bank: Washington, DC, USA, 2016. [Google Scholar]
- Borruso, G.; Balletto, G. The image of the smart city: New challenges. Urban Sci. 2022, 6, 5. [Google Scholar] [CrossRef]
- Guo, Y.M.; Huang, Z.L.; Guo, J.; Li, H.; Guo, X.R.; Nkeli, M.J. Bibliometric analysis on smart cities research. Sustainability 2019, 11, 3606. [Google Scholar] [CrossRef]
- Bajdor, P.; Starostka-Patyk, M. Smart city: A bibliometric analysis of conceptual dimensions and areas. Energies 2021, 14, 4288. [Google Scholar] [CrossRef]
- Vujković, P.; Ravšelj, D.; Umek, L.; Aristovnik, A. Bibliometric analysis of smart public governance research: Smart city and smart government in comparative perspective. Soc. Sci. 2022, 11, 293. [Google Scholar] [CrossRef]
- Buttazzoni, A.; Veenhof, M.; Minaker, L. Smart city and high-tech urban interventions targeting human health: An equity-focused systematic review. Int. J. Environ. Res. Public Health 2020, 17, 2325. [Google Scholar] [CrossRef]
- Hassankhani, M.; Alidadi, M.; Sharifi, A.; Azhdari, A. Smart city and crisis management: Lessons for the COVID-19 pandemic. Int. J. Environ. Res. Public Health 2021, 18, 7736. [Google Scholar] [CrossRef]
- Peponi, A.; Morgado, P. Smart and regenerative urban growth: A literature network analysis. Int. J. Environ. Res. Public Health 2020, 17, 2463. [Google Scholar] [CrossRef]
- Soomro, K.; Bhutta, M.N.M.; Khan, Z.; Tahir, M.A. Smart city big data analytics: An advanced review. Wiley Interdiscip. Rev. Data Min. Knowl. Discov. 2019, 9, e1319. [Google Scholar] [CrossRef]
- Bird, S.; Klein, E.; Loper, E. Natural Language Processing with Python; O’Reilly Media, Inc.: Sebastopol, CA, USA, 2009. [Google Scholar]
- Albino, V.; Berardi, U.; Dangelico, R.M. Smart cities: Definitions, dimensions, performance, and initiatives. J. Urban Technol. 2015, 22, 3–21. [Google Scholar] [CrossRef]
- Martin, C.J.; Evans, J.; Karvonen, A. Smart and sustainable? Five tensions in the visions and practices of the smart-sustainable city in Europe and North America. Technol. Forecast. Soc. Change 2018, 133, 269–278. [Google Scholar] [CrossRef]
- ITU-T Focus Group on Smart Sustainable Cities. Smart Sustainable Cities: An Analysis of Definitions; International Telecommunication Union: Geneva, Switzerland, 2014. [Google Scholar]
- Yigitcanlar, T. Technology and the City: Systems, Applications and Implications; Routledge: Abingdon-on-Thames, UK, 2016. [Google Scholar]
- BIS. The Smart City Market: Opportunities for the UK; BIS Research Paper No. 136; Department for Business, Innovation & Science: London, UK, 2013. Available online: https://www.gov.uk/government/uploads/system/uploads/attachment_data/file/249423/bis-13-1217-smart-city-market-opportunties-uk.pdf (accessed on 11 August 2016).
- Barrionuevo, J.M.; Berrone, P.; Ricart, J.E. Smart cities, sustainable progress. IESE Insight 2012, 14, 50–57. [Google Scholar] [CrossRef]
- Guan, L. Smart steps to a better city. Gov. News 2012, 32, 24–27. [Google Scholar]
- Lazaroiu, G.C.; Roscia, M. Definition methodology for the smart cities model. Energy 2012, 47, 326–332. [Google Scholar] [CrossRef]
- Zhao, J. Towards Sustainable Cities in China: Analysis and Assessment of Some Chinese Cities in 2008; Springer Science & Business Media: Berlin, Germany, 2011. [Google Scholar]
- Chen, T.M. Smart grids, smart cities need better networks [Editor’s Note]. IEEE Netw. 2010, 24, 2–3. [Google Scholar] [CrossRef]
- Paskaleva, K.A. Enabling the smart city: The progress of city e-governance in Europe. Int. J. Innov. Reg. Dev. 2009, 1, 405–422. [Google Scholar] [CrossRef]
- Giffinger, R.; Fertner, C.; Kramar, H.; Meijers, E. City-ranking of European medium-sized cities. Cent. Reg. Sci. Vienna UT 2007, 9, 1–12. [Google Scholar]
- Bowerman, B.; Braverman, J.; Taylor, J.; Todosow, H.; Von Wimmersperg, U. The vision of a smart city. In Proceedings of the 2nd International Life Extension Technology Workshop, Paris, France, 28 September 2000. [Google Scholar]
- Van der Hoogen, A.; Scholtz, B.; Calitz, A. A smart city stakeholder classification model. In Proceedings of the 2019 Conference on Information Communications Technology and Society, Durban, South Africa, 6–8 March 2019; pp. 1–6. [Google Scholar]
- Yigitcanlar, T. Smart cities: An effective urban development and management model? Aust. Plan. 2015, 52, 27–34. [Google Scholar] [CrossRef]
- While, A.; Jonas, A.E.; Gibbs, D. The environment and the entrepreneurial city: Searching for the urban ‘sustainability fix’ in Manchester and Leeds. Int. J. Urban Reg. Res. 2004, 28, 549–569. [Google Scholar] [CrossRef]
- Kim, D.; Kim, S. Role and challenge of technology toward a smart sustainable city: Topic modeling, classification, and time series analysis using information and communication technology patent data. Sustain. Cities Soc. 2022, 82, 103888. [Google Scholar] [CrossRef]
- Kamruzzaman, M.; Deilami, K.; Yigitcanlar, T. Investigating the urban heat island effect of transit-oriented development in Brisbane. J. Transp. Geogr. 2018, 66, 116–124. [Google Scholar] [CrossRef]
- Yigitcanlar, T.; Lee, S.H. Korean ubiquitous-eco-city: A smart-sustainable urban form or a branding hoax? Technol. Forecast. Soc. Change 2014, 89, 100–114. [Google Scholar] [CrossRef]
- Fernandez-Anez, V.; Fernández-Güell, J.M.; Giffinger, R. Smart City implementation and discourses: An integrated conceptual model. The case of Vienna. Cities 2018, 78, 4–16. [Google Scholar] [CrossRef]
- Mora, L.; Bolici, R.; Deakin, M. The first two decades of smart-city research: A bibliometric analysis. J. Urban Technol. 2017, 24, 3–27. [Google Scholar] [CrossRef]
- Foth, M. Participatory urban informatics: Towards citizen-ability. Smart Sustain. Built Environ. 2018, 7, 4–19. [Google Scholar] [CrossRef]
- Fatimah, Y.A.; Govindan, K.; Murniningsih, R.; Setiawan, A. Industry 4.0 based sustainable circular economy approach for smart waste management system to achieve sustainable development goals: A case study of Indonesia. J. Clean. Prod. 2020, 269, 122263. [Google Scholar] [CrossRef]
- Feldman, R.; Sanger, J. The Text Mining Handbook: Advanced Approaches in Analyzing Unstructured Data; Cambridge University Press: Cambridge, UK, 2007. [Google Scholar]
- Nam, H.; Nam, T. Exploring strategic directions of pandemic crisis management: A text analysis of world economic forum COVID-19 reports. Sustainability 2021, 13, 4123. [Google Scholar] [CrossRef]
- Scott, J. Trend report social network analysis. Sociology 1988, 109–127. [Google Scholar] [CrossRef]
- Benckendorff, P.; Zehrer, A. A network analysis of tourism research. Ann. Tour. Res. 2013, 43, 121–149. [Google Scholar] [CrossRef]
- Chen, C.; Morris, S. Visualizing evolving networks: Minimum spanning trees versus pathfinder networks. In Proceedings of the IEEE Symposium on Information Visualization 2003 (IEEE Cat. No. 03TH8714), Seattle, WA, USA, 19–21 October 2003; pp. 67–74. [Google Scholar]
- Blei, D.M.; Ng, A.Y.; Jordan, M.I. Latent dirichlet allocation. J. Mach. Learn. Res. 2003, 3, 993–1022. [Google Scholar]
- Sharma, C.; Batra, I.; Sharma, S.; Malik, A.; Hosen, A.S.; Ra, I.H. Predicting trends and research patterns of smart cities: A semi-automatic review using latent dirichlet allocation (LDA). IEEE Access 2022, 10, 121080–121095. [Google Scholar] [CrossRef]
- Blei, D.M. Probabilistic topic models. Commun. ACM 2012, 55, 77–84. [Google Scholar] [CrossRef]
- Park, H.; Kim, D.; Chang, S. Research trend analysis on smart city based on structural topic modeling (STM). J. Digit. Contents Soc. 2019, 20, 1839–1846. [Google Scholar] [CrossRef]
- Sbalchiero, S.; Eder, M. Topic modeling, long texts and the best number of topics. Some Problems and solutions. Qual. Quant. 2020, 54, 1095–1108. [Google Scholar] [CrossRef]
- Liu, L.; Tang, L.; Dong, W.; Yao, S.; Zhou, W. An overview of topic modeling and its current applications in bioinformatics. SpringerPlus 2016, 5, 1608. [Google Scholar] [CrossRef]
- Griffiths, T.L.; Steyvers, M. Finding scientific topics. Proc. Natl. Acad. Sci. USA 2004, 101, 5228–5235. [Google Scholar] [CrossRef]
- Valença, G.; Moura, F.; de Sá, A.M. How can we develop road space allocation solutions for smart cities using emerging information technologies? A review using text mining. Int. J. Inf. Manag. Data Insights 2023, 3, 100150. [Google Scholar] [CrossRef]
- So, J.; Kim, T.; Kim, M.; Kang, J.; Lee, H.; Choi, J. A study on the concept of smart city and smart city transport. J. Korean Soc. Transp. 2019, 37, 79–91. [Google Scholar] [CrossRef]
- Park, K.; Lee, C. A study on the research trends for smart city using topic modeling. J. Internet Comput. Serv. 2019, 20, 119–128. [Google Scholar]
- Abduljabbar, R.L.; Liyanage, S.; Dia, H. The role of micro-mobility in shaping sustainable cities: A systematic literature review. Transp. Res. Part D Transp. Environ. 2021, 92, 102734. [Google Scholar] [CrossRef]
- Lim, C.; Maglio, P.P. Data-driven understanding of smart service systems through text mining. Serv. Sci. 2018, 10, 154–180. [Google Scholar] [CrossRef]
- Noh, H.; Jo, Y.; Lee, S. Keyword selection and processing strategy for applying text mining to patent analysis. Expert Syst. Appl. 2015, 42, 4348–4360. [Google Scholar] [CrossRef]
- Schofield, A.; Mimno, D. Comparing apples to apples: The effects of stemmers on topic models. Trans. Assoc. Comput. Linguist. 2016, 4, 287–300. [Google Scholar] [CrossRef]
- Bezdan, T.; Stoean, C.; Naamany, A.A.; Bacanin, N.; Rashid, T.A.; Zivkovic, M.; Venkatachalam, K. Hybrid fruit-fly optimization algorithm with k-means for text document clustering. Mathematics 2021, 9, 1929. [Google Scholar] [CrossRef]
- Hwang, S.; Cho, E. Exploring Latent Topics and Research Trends in Mathematics Teachers’ Knowledge Using Topic Modeling: A Systematic Review. Mathematics 2021, 9, 2956. [Google Scholar] [CrossRef]
- Christian, H.; Agus, M.P.; Suhartono, D. Single document automatic text summarization using term frequency-inverse document frequency (TF-IDF). ComTech Comput. Math. Eng. Appl. 2016, 7, 285–294. [Google Scholar] [CrossRef]
- Havrlant, L.; Kreinovich, V. A simple probabilistic explanation of term frequency-inverse document frequency (tf-idf) heuristic (and variations motivated by this explanation). Int. J. Gen. Syst. 2017, 46, 27–36. [Google Scholar] [CrossRef]
- Liu, J.G.; Lin, J.H.; Guo, Q.; Zhou, T. Locating influential nodes via dynamics-sensitive centrality. Sci. Rep. 2016, 6, 1–8. [Google Scholar] [CrossRef]
- Halevy, A.; Norvig, P.; Pereira, F. The unreasonable effectiveness of data. IEEE Intell. Syst. 2009, 24, 8–12. [Google Scholar] [CrossRef]
- Nadkarni, P.M.; Ohno-Machado, L.; Chapman, W.W. Natural language processing: An introduction. J. Am. Med. Inform. Assoc. 2011, 18, 544–551. [Google Scholar] [CrossRef]
- Quinn, K.M.; Monroe, B.L.; Colaresi, M.; Crespin, M.H.; Radev, D.R. How to analyze political attention with minimal assumptions and costs. Am. J. Political Sci. 2010, 54, 209–228. [Google Scholar] [CrossRef]
- Chong, M.; Habib, A.; Evangelopoulos, N.; Park, H.W. Dynamic capabilities of a smart city: An innovative approach to discovering urban problems and solutions. Gov. Inf. Q. 2018, 35, 682–692. [Google Scholar] [CrossRef]
- Nam, H.; Kim, S.; Nam, T. Identifying the directions of technology-driven government innovation. Information 2022, 13, 208. [Google Scholar] [CrossRef]
- Leydesdorff, L. The Challenge of Scientometrics: The Development, Measurement, and Self-Organization of Scientific Communications; Universal-Publishers: Irvine, CA, USA, 2021. [Google Scholar]
- Kim, B.; Yoo, M.; Park, K.C.; Lee, K.R.; Kim, J.H. A value of civic voices for smart city: A big data analysis of civic queries posed by Seoul citizens. Cities 2021, 108, 102941. [Google Scholar] [CrossRef]
- Chuang, J.; Manning, C.D.; Heer, J. Termite: Visualization techniques for assessing textual topic models. In Proceedings of the International Working Conference on Advanced Visual Interfaces, Capri Island, Naples, Italy, 22–25 May 2012; pp. 74–77. [Google Scholar]
- Sievert, C.; Shirley, K. LDAvis: A method for visualizing and interpreting topics. In Proceedings of the Workshop on Interactive Language Learning, Visualization, and Interfaces, Baltimore, MD, USA, 27 June 2014; pp. 63–70. [Google Scholar]
- Allam, Z.; Jones, D.S. On the coronavirus (COVID-19) outbreak and the smart city network: Universal data sharing standards coupled with artificial intelligence (ai) to benefit urban health monitoring and management. Healthcare 2020, 8, 46. [Google Scholar] [CrossRef]
- Bonilla, D.; Keller, H.; Schmiele, J. Climate policy and solutions for green supply chains: Europe’s predicament. Supply Chain Manag. Int. J. 2015, 20, 249–263. [Google Scholar] [CrossRef]
- Kuzior, A.; Krawczyk, D.; Brożek, P.; Pakhnenko, O.; Vasylieva, T.; Lyeonov, S. Resilience of smart cities to the consequences of the COVID-19 pandemic in the context of sustainable development. Sustainability 2022, 14, 12645. [Google Scholar] [CrossRef]
- Hao, F.; Xiao, Q.; Chon, K. COVID-19 and China’s hotel industry: Impacts, a disaster management framework, and post-pandemic agenda. Int. J. Hosp. Manag. 2020, 90, 102636. [Google Scholar] [CrossRef]
- Wen, J.; Wang, W.; Kozak, M.; Liu, X.; Hou, H. Many brains are better than one: The importance of interdisciplinary studies on COVID-19 in and beyond tourism. Tour. Recreat. Res. 2021, 46, 310–313. [Google Scholar] [CrossRef]
- Casado-Aranda, L.A.; Sánchez-Fernández, J.; Bastidas-Manzano, A.B. Tourism research after the COVID-19 outbreak: Insights for more sustainable, local and smart cities. Sustain. Cities Soc. 2021, 73, 103126. [Google Scholar] [CrossRef]
- Gretzel, U.; Fuchs, M.; Baggio, R.; Hoepken, W.; Law, R.; Neidhardt, J.; Xiang, Z. e-Tourism beyond COVID-19: A call for transformative research. Inf. Technol. Tour. 2020, 22, 187–203. [Google Scholar] [CrossRef]
- Jasiński, A. COVID-19 pandemic is challenging some dogmas of modern urbanism. Cities 2022, 121, 103498. [Google Scholar] [CrossRef]
- Sassen, S.; Kourtit, K. A post-corona perspective for smart cities: ‘Should I stay or should I go?’. Sustainability 2021, 13, 9988. [Google Scholar] [CrossRef]
- Sarkin, G. Cities at the Front Line: Public Space in the Time of the COVID-19 Pandemic; CIDOB: Barcelona, Spain, 2020. [Google Scholar]
- EC (European Commission). EC’s Website: Smart Cities. 2020. Available online: https://ec.europa.eu/info/eu-regional-and-urban-development/topics/cities-and-urban-development/city-initiatives/smart-cities_en (accessed on 11 August 2016).
- Kanda, W.; Kivimaa, P. What opportunities could the COVID-19 outbreak offer for sustainability transitions research on electricity and mobility? Energy Res. Soc. Sci. 2020, 68, 101666. [Google Scholar] [CrossRef]
- NACTO and Global Designing Cities Initiative. Streets for Pandemic Response and Recovery. 2020. Available online: https://nacto.org/publication/streets-for-pandemic-response-recovery/ (accessed on 11 August 2016).
- Pandey, A.; Brauer, M.; Cropper, M.L.; Balakrishnan, K.; Mathur, P.; Dey, S.; Dandona, L. Health and economic impact of air pollution in the states of India: The global burden of disease study 2019. Lancet Planet. Health 2021, 5, e25–e38. [Google Scholar] [CrossRef]
- Conticini, E.; Frediani, B.; Caro, D. Can atmospheric pollution be considered a co-factor in extremely high level of SARS-CoV-2 lethality in Northern Italy? Environ. Pollut. 2020, 261, 114465. [Google Scholar] [CrossRef]
- Kaginalkar, A.; Kumar, S.; Gargava, P.; Niyogi, D. Stakeholder analysis for designing an urban air quality data governance ecosystem in smart cities. Urban Clim. 2023, 48, 101403. [Google Scholar] [CrossRef]


| Source | Definitions |
|---|---|
| Yigitcanlar (2016) | An ideal form to build the sustainable cities of the 21st century, in the case that a balanced and sustainable view on economic, societal, environmental, and institutional development is realized [29]. |
| BIS (2013) | The UK Department for Business, Innovation and Skills (BIS) considers smart cities a process rather than a static outcome, in which increased citizen engagement, hard infrastructure, social capital and digital technologies make cities more livable, resilient, and better able to respond to challenges [30]. |
| Barrionuevo et al. (2012) | Being a smart city means using all available technology and resources in an intelligent and coordinated manner to develop urban centers that are at once integrated, habitable, and sustainable [31]. |
| Guan (2012) | A smart city, according to ICLEI, is a city that is prepared to provide conditions for a healthy and happy community under the challenging conditions that global, environmental, economic, and social trends may bring [32]. |
| Lazaroiu and Roscia (2012) | A city that represents the future challenge, a city model where the technology is in service to the person and to his economic and social life quality improvement [33]. |
| Zhao (2011) | A city that improves the quality of life, including ecological, cultural, political, institutional, social, and economic components without leaving a burden on future generations [34]. |
| Chen (2010) | Smart cities will take advantage of communications and sensor capabilities sewn into the cities’ infrastructures to optimize electrical, transportation, and other logistical operations supporting daily life, thereby improving the quality of life for everyone [35]. |
| Paskaleva (2009) | A city that takes advantages of the opportunities offered by ICT in increasing local prosperity and competitiveness––an approach that implies integrated urban development involving multi-actor, multi-sector, and multi-level perspectives [36]. |
| Giffinger et al. (2007) | A city well performing in a forward-looking way in economy, people, governance, mobility, environment, and living, built on the smart combination of endowments and activities of self-decisive, independent, and aware citizens [37]. |
| Bowerman et al. (2000) | A city that monitors and integrates conditions of all its critical infrastructures including roads, bridges, tunnels, rails, subways, airports, seaports, communications, water, power, even major buildings, can better optimize its resources, plan its preventive maintenance activities, and monitor security aspects while maximizing services to its citizens [38]. |
| Field | Option Introduced | |
|---|---|---|
| Queries | “COVID-19” AND (“sustainable city” OR “smart city” OR “sustainable urban” OR “smart urban”) | |
| Language | English | |
| Document type | Article | |
| Content of data | Title, abstract, keywords | |
| Period | 1 December 2019~30 November 2022 (Researchers searched and downloaded it on December 2nd week.) | |
| Database | Web of Science | SCOPUS |
| Collected items | 820 items | 1062 items |
| No. | Keyword | Freq. | % | No. | Keyword | Freq. | % |
|---|---|---|---|---|---|---|---|
| 1 | transport | 1575 | 1.37% | 26 | water | 661 | 0.57% |
| 2 | policy | 1385 | 1.2% | 27 | network | 626 | 0.54% |
| 3 | mobility | 1188 | 1.03% | 28 | resilience | 619 | 0.54% |
| 4 | population density | 1166 | 1.01% | 29 | sign | 616 | 0.53% |
| 5 | supply chain | 1106 | 0.96% | 30 | challenge | 600 | 0.52% |
| 6 | carbon emission | 1089 | 0.95% | 31 | crisis | 587 | 0.51% |
| 7 | tourism | 1047 | 0.91% | 32 | formation | 580 | 0.50% |
| 8 | change | 1008 | 0.88% | 33 | life | 551 | 0.48% |
| 9 | planning | 975 | 0.85% | 34 | waste | 543 | 0.47% |
| 10 | air | 974 | 0.85% | 35 | travel | 532 | 0.46% |
| 11 | level | 956 | 0.83% | 36 | household | 529 | 0.46% |
| 12 | technology | 945 | 0.82% | 37 | region | 524 | 0.45% |
| 13 | pollutant | 940 | 0.82% | 38 | goal | 520 | 0.45% |
| 14 | quality | 913 | 0.79% | 39 | economy | 518 | 0.45% |
| 15 | community | 877 | 0.76% | 40 | work | 513 | 0.44% |
| 16 | lockdown | 847 | 0.74% | 41 | process | 506 | 0.44% |
| 17 | sustainability | 842 | 0.73% | 42 | accessibility | 500 | 0.43% |
| 18 | environment | 837 | 0.73% | 43 | response | 497 | 0.43% |
| 19 | governance | 755 | 0.65% | 44 | infection | 483 | 0.42% |
| 20 | disease | 735 | 0.64% | 45 | construction | 449 | 0.39% |
| 21 | risk | 676 | 0.59% | 46 | production | 428 | 0.37% |
| 22 | energy | 675 | 0.58% | 47 | climate | 409 | 0.35% |
| 23 | space | 669 | 0.58% | 48 | infrastructure | 406 | 0.35% |
| 24 | strategy | 665 | 0.58% | 49 | education | 404 | 0.35% |
| 25 | behavior | 665 | 0.58% | 50 | spread | 403 | 0.35% |
| No. | Keyword | TF-IDF | No. | Keyword | TF-IDF |
|---|---|---|---|---|---|
| 1 | supply chain | 2570.44 | 26 | behavior | 1227.12 |
| 2 | tourism | 2541.11 | 27 | governance | 1207.14 |
| 3 | carbon emission | 2501.74 | 28 | environment | 1189.32 |
| 4 | transport | 2349.36 | 29 | travel | 1181.52 |
| 5 | air | 2107.49 | 30 | disease | 1173.23 |
| 6 | pollutant | 2047.07 | 31 | sustainability | 1170.85 |
| 7 | mobility | 2035.08 | 32 | sign | 1132.57 |
| 8 | water | 1926.19 | 33 | formation | 1047.30 |
| 9 | population density | 1736.52 | 34 | education | 1043.61 |
| 10 | energy | 1658.90 | 35 | economy | 1043.03 |
| 11 | waste | 1638.36 | 36 | student | 1038.42 |
| 12 | quality | 1516.76 | 37 | infection | 1027.53 |
| 13 | lockdown | 1505.10 | 38 | crisis | 1023.12 |
| 14 | policy | 1488.10 | 39 | accessibility | 1014.82 |
| 15 | technology | 1418.59 | 40 | region | 1003.47 |
| 16 | community | 1383.93 | 41 | strategy | 1001.45 |
| 17 | resilience | 1345.12 | 42 | security | 958.27 |
| 18 | planning | 1325.04 | 43 | construction | 955.19 |
| 19 | nitrogen dioxide | 1302.70 | 44 | climate | 952.78 |
| 20 | space | 1285.99 | 45 | work | 946.64 |
| 21 | change | 1270.59 | 46 | goal | 938.96 |
| 22 | network | 1263.00 | 47 | traffic | 932.45 |
| 23 | household | 1252.96 | 48 | challenge | 919.60 |
| 24 | level | 1241.61 | 49 | life | 913.83 |
| 25 | risk | 1236.13 | 50 | heritage | 912.87 |
| No. | Central Word | Centrality | No. | Central Word | Centrality |
|---|---|---|---|---|---|
| 1 | air | 0.253 | 26 | risk | 0.099 |
| 2 | transport | 0.252 | 27 | tourism | 0.096 |
| 3 | pollutant | 0.236 | 28 | reduction | 0.093 |
| 4 | carbon emission | 0.226 | 29 | sign | 0.091 |
| 5 | policy | 0.213 | 30 | space | 0.089 |
| 6 | quality | 0.206 | 31 | region | 0.085 |
| 7 | mobility | 0.188 | 32 | network | 0.082 |
| 8 | lockdown | 0.181 | 33 | challenge | 0.081 |
| 9 | change | 0.175 | 34 | infection | 0.081 |
| 10 | population density | 0.160 | 35 | traffic | 0.080 |
| 11 | level | 0.155 | 36 | formation | 0.076 |
| 12 | supply chain | 0.146 | 37 | life | 0.076 |
| 13 | planning | 0.137 | 38 | crisis | 0.075 |
| 14 | disease | 0.134 | 39 | resilience | 0.074 |
| 15 | environment | 0.133 | 40 | economy | 0.074 |
| 16 | nitrogen dioxide | 0.124 | 41 | goal | 0.073 |
| 17 | water | 0.123 | 42 | response | 0.073 |
| 18 | technology | 0.115 | 43 | accessibility | 0.071 |
| 19 | sustainability | 0.114 | 44 | waste | 0.069 |
| 20 | community | 0.111 | 45 | household | 0.069 |
| 21 | energy | 0.104 | 46 | work | 0.069 |
| 22 | strategy | 0.104 | 47 | process | 0.069 |
| 23 | governance | 0.102 | 48 | climate | 0.067 |
| 24 | behavior | 0.102 | 49 | spread | 0.067 |
| 25 | travel | 0.101 | 50 | production | 0.066 |
| No. | n-Gram (A) | n-Gram (B) | Freq. | No. | n-Gram (A) | n-Gram (B) | Freq. |
|---|---|---|---|---|---|---|---|
| 1 | air | pollutant | 446 | 26 | waste | disposal | 46 |
| 2 | air | quality | 395 | 27 | mobility | planning | 46 |
| 3 | climate | change | 227 | 28 | bicycle | share | 43 |
| 4 | travel | behavior | 138 | 29 | water | supply chain | 42 |
| 5 | quality | life | 99 | 30 | infection | risk | 42 |
| 6 | goal | SDGs | 97 | 31 | disease | transmission | 42 |
| 7 | pollutant | air | 95 | 32 | transport | sector | 42 |
| 8 | mobility | transport | 90 | 33 | quality | lockdown | 41 |
| 9 | water | quality | 84 | 34 | spread | virus | 41 |
| 10 | communication | technology | 81 | 35 | governance | policy | 41 |
| 11 | transport | policy | 79 | 36 | internet | IoT | 40 |
| 12 | formation | communication | 77 | 37 | co2 | carbon emission | 40 |
| 13 | transport | mobility | 77 | 38 | quality | air | 39 |
| 14 | originality | value | 71 | 39 | disease | spread | 39 |
| 15 | water | consumption | 69 | 40 | mobility | policy | 38 |
| 16 | lockdown | air | 66 | 41 | human | SARS | 38 |
| 17 | tourism | industry | 60 | 42 | mobility | pattern | 38 |
| 18 | machine | learning | 59 | 43 | risk | assessment | 38 |
| 19 | greenhouse | gas | 56 | 44 | quality | pollutant | 37 |
| 20 | energy | consumption | 54 | 45 | policy | transport | 36 |
| 21 | traffic | congestion | 53 | 46 | wind | speed | 36 |
| 22 | transport | planning | 53 | 47 | spread | disease | 35 |
| 23 | policy | policymaker | 50 | 48 | challenge | opportunity | 35 |
| 24 | energy | efficiency | 48 | 49 | pollutant | disease | 35 |
| 25 | carbon emission | reduction | 47 | 50 | change | mobility | 35 |
| Topic | Keyword | Topic | Keyword | ||
|---|---|---|---|---|---|
| Topic (A) | supply chain | 0.047 | Topic (D) | population density | 0.014 |
| water | 0.023 | waste | 0.013 | ||
| energy | 0.018 | disease | 0.010 | ||
| lockdown | 0.017 | mobility | 0.009 | ||
| consumption | 0.010 | healthcare | 0.007 | ||
| governance | 0.009 | life | 0.007 | ||
| household | 0.008 | work | 0.007 | ||
| farm | 0.007 | vehicle | 0.007 | ||
| risk | 0.007 | assessment | 0.007 | ||
| Topic (B) | resilience | 0.015 | Topic (E) | transport | 0.018 |
| sustainability | 0.015 | carbon emission | 0.015 | ||
| level | 0.012 | technology | 0.015 | ||
| community | 0.012 | mobility | 0.012 | ||
| change | 0.011 | network | 0.010 | ||
| crisis | 0.011 | governance | 0.008 | ||
| space | 0.010 | community | 0.007 | ||
| environment | 0.009 | infection | 0.007 | ||
| mobility | 0.009 | region | 0.006 | ||
| Topic (C) | tourism | 0.026 | Topic (F) | air | 0.027 |
| transport | 0.026 | pollutant | 0.026 | ||
| mobility | 0.016 | quality | 0.017 | ||
| travel | 0.010 | carbon emission | 0.011 | ||
| behavior | 0.009 | lockdown | 0.010 | ||
| change | 0.009 | energy | 0.010 | ||
| economy | 0.007 | nitrogen dioxide | 0.010 | ||
| heritage | 0.007 | strategy | 0.008 | ||
| planning | 0.007 | disease | 0.008 |
Disclaimer/Publisher’s Note: The statements, opinions and data contained in all publications are solely those of the individual author(s) and contributor(s) and not of MDPI and/or the editor(s). MDPI and/or the editor(s) disclaim responsibility for any injury to people or property resulting from any ideas, methods, instructions or products referred to in the content. |
© 2023 by the authors. Licensee MDPI, Basel, Switzerland. This article is an open access article distributed under the terms and conditions of the Creative Commons Attribution (CC BY) license (https://creativecommons.org/licenses/by/4.0/).
Share and Cite
Oh, M.; Ahn, C.; Nam, H.; Choi, S. New Trends in Smart Cities: The Evolutionary Directions Using Topic Modeling and Network Analysis. Systems 2023, 11, 410. https://doi.org/10.3390/systems11080410
Oh M, Ahn C, Nam H, Choi S. New Trends in Smart Cities: The Evolutionary Directions Using Topic Modeling and Network Analysis. Systems. 2023; 11(8):410. https://doi.org/10.3390/systems11080410
Chicago/Turabian StyleOh, Minjeong, Chulok Ahn, Hyundong Nam, and Sungyong Choi. 2023. "New Trends in Smart Cities: The Evolutionary Directions Using Topic Modeling and Network Analysis" Systems 11, no. 8: 410. https://doi.org/10.3390/systems11080410
APA StyleOh, M., Ahn, C., Nam, H., & Choi, S. (2023). New Trends in Smart Cities: The Evolutionary Directions Using Topic Modeling and Network Analysis. Systems, 11(8), 410. https://doi.org/10.3390/systems11080410