Article

Designing Effective Instructional Feedback Using a Diagnostic and Visualization System: Evidence from a High School Biology Class

Faculty of Artificial Intelligence in Education, Central China Normal University, Wuhan 430079, China
*
Author to whom correspondence should be addressed.
Systems 2023, 11(7), 364; https://doi.org/10.3390/systems11070364
Submission received: 26 June 2023 / Revised: 14 July 2023 / Accepted: 16 July 2023 / Published: 17 July 2023
(This article belongs to the Special Issue Human–AI Teaming: Synergy, Decision-Making and Interdependency)

Abstract

:
Although instructional feedback plays an essential role in regulating learning and improving performance, few studies have systematically investigated the needs of teachers and students for instructional feedback systems or developed designs and experiments, especially at the high school level. To address this research need, the present study investigated the needs of selected students and teachers in a high school in Hubei Province, China, and designed and developed a diagnostic visual feedback system for an experimental study with 125 students from a 10th-grade biology class in the same high school. The results showed that this diagnostic visual feedback report improved student performance (ES = 0.37) and that functions such as misconception location, knowledge diagnosis, and knowledge alert were well received by students. These findings have multiple implications for facilitating the design and development of diagnostic visual feedback systems.

1. Introduction

Instructional feedback has a pivotal role in motivating learning and learners’ acquisition of knowledge and skills [1,2,3]; it helps students to obtain a clear perception on three questions: Where am I going? How am I going there? Where to next? [4]. In other words, it helps students gain insight into their current location in the learning process and provides them with information on how to get from their current location to their desired location [5]. For this reason, feedback has been widely recognized as critical to improving student academic performance [6,7,8]. However, few people have noticed that the effectiveness of feedback is largely dependent upon its design [9].
Traditionally, there are three main challenges facing the design and delivery of instructional feedback: First, feedback is untimely. In many cases, students receive feedback only after they have taken their final exams, and by then it is too late, because the semester is over. Second, feedback is difficult for both teachers and students to integrate and utilize. The use of big data collects massive amounts of information on student behavior and performance, but improper processing and utilization not only increase teachers’ workload but also increase students’ cognitive workload. Many students complain that feedback reports are too text-based and obscure, which makes them reluctant to use such reports [10]. Third, much of the feedback is based on data about student behavior, such as hours of study or number of posts, rather than student performance. This makes the feedback somewhat inaccurate. Many existing feedback systems thus fail to satisfy the needs of both teachers and students in educational practice [11,12].
Along with the advances in technology, artificial intelligence technologies and learning analytics in education can help us deal with these challenges adequately. In terms of timeliness, learning analytics technology can collect multiple modal data (including behavior, performance, and mood) and more detailed data (including mastery of knowledge points and misconception), and the data collected are monitored and generated in real time, which increases responsivity. Visualization technology also has significant potential in terms of interpretability: It allows students and teachers to understand information at a glance without necessarily having to master complex statistical analysis techniques. Finally, in terms of accuracy, cognitive diagnostic technology can provide accurate diagnosis and analysis of students’ knowledge mastery. However, most research studies on technology-enhanced feedback systems have focused on the employment of a single technology, and there has been a lack of feedback design integrating all three technologies in educational practice.
Feedback systems also tend to lack input from frontline teachers and students in their design. We searched for papers from 1990 to 2023 using the Web of Science literature database—using feedback, instructional feedback, and feedback system as keywords—and found that feedback interventions informed by frontline teachers and students are very rare [13,14]. There is also insufficient empirical evidence supporting the effectiveness of such technology-enhanced feedback systems, especially in K–12 education [15].
In response to the above research limitations, a front-end analysis was conducted before designing and delivering the feedback system. We then developed a diagnostic visual feedback system according to the demands identified that can analyze and diagnose students’ answers to test papers and visually present the results. Finally, we conducted an empirical study on this diagnostic visual feedback system at the high school level. In this paper, we address the following three questions:
  • What kind of feedback functions are needed for teachers and students?
  • What are the technological means to achieve those feedback functions?
  • What is the overall effect of diagnostic visual feedback system? What functions are valued?

2. Literature Review

2.1. The Definition and Classification of Instructional Feedback

In this paper, instructional feedback is conceptualized as conveying information about a student’s performance to change their thinking or behavior and thereby improve learning [15]. Instructional feedback provides an assessment of student performance and guides them to engage more effectively in learning activities. It informs students of their correct and incorrect learning behaviors alongside justification and rationale for this feedback. Good feedback gives specific and relevant responses, rather than a broad and general assessment [15]. In this way, the instructional feedback gradually helps students reduce the gap between expected performance and the status quo [16].
Instructional feedback can be classified into different types. In terms of feedback source, common forms are teacher feedback, peer feedback, and machine feedback. Teacher feedback is the most common but creates an additional workload for teachers and does not ensure timeliness. Peer feedback is more appropriate when teachers do not have time to give feedback to each student, but accuracy cannot be guaranteed. Machine feedback can provide timely and quality feedback to lower the teachers’ workload. Feedback timing can be divided into indicative, formative, and summative forms. Indicative feedback is provided before the activity, and without this information someone cannot assess their progress. Formative feedback is given during the course of instruction, usually at the end of a small unit or project, while summative feedback is given at the end of the entire course after all units or projects have been completed [16,17,18]. Formative feedback is recognized as superior to summative feedback, because it is effective for real-time monitoring and analysis of the learning process. The disadvantage is that it is hard for teachers to implement, but machine feedback could make it easier to achieve formative feedback.

2.2. Benefits and Challenges of Instructional Feedback

Good instructional feedback improves student performance, and such feedback is generally formative, is timely, includes diagnostic analysis, and is easy to understand. Kebodeaux et al. [19] conducted an empirical study using a system that provides immediate feedback on problems in engineering statistics and showed that the system led to significant improvements in student performance. Alemán et al. [20] conducted a comparative study of students and found that the use of a diagnostic feedback tool improved learning outcomes in the experimental group. Molin et al. [21] conducted a randomized experiment in physics instruction and found that formative teacher feedback positively and significantly affected learning outcomes.
The literature also suggests that continuous use of instructional feedback is known to improve students’ self-regulated learning [16]. Self-regulated learning emphasizes learners’ proactive control and regulation of their own learning processes [22,23], which is particularly essential for the K–12 education due to the tender age of students. Self-regulated learning specified several key activities, including goal setting, self-evaluation, task strategy, and help seeking [24]. Those activities can inform the design and utilization of an effective feedback system. Pintrich [25] suggested that providing information in feedback can effectively promote students’ self-regulation skills, because doing so can assist students with metacognition and self-monitoring, as well as guiding them in the selection of proper learning objectives and strategies. According to Pintrich and Zusho [26], even underachieving students can improve their self-regulation through self-monitoring training with feedback.
Despite its various learning benefits, designing and developing good feedback remains difficult. Feedback design involves a combination of opinions from many parties, such as technical staff and subject experts, and especially the needs of frontline teachers and students. Developers also face many technical challenges, including, first, how to ensure the timeliness of feedback; second, how to implement the diagnostic functions for knowledge improvement; and third, how to use technology to present the information in a visual way to make the feedback easy to understand.

2.3. Technology-Enhanced Instructional Feedback Systems

Technologies such as a knowledge base, data mining, predictive analytics, feature extraction with clustering, and linguistic analysis engines are widely used in technology-enhanced feedback systems. A system will typically use multiple technologies to implement its functionality. In general, intelligent correction techniques are the most commonly used in feedback systems to determine what is right or wrong by comparing student answers with those set by the instructor [13]. Such techniques mostly provide timely feedback on specific exercises in the course and generally include answers and more detailed explanations. Singh et al. [27] developed a system that automatically generates feedback for programming assignments that told students what they had done wrong and helped them to correct it; it resulted in a 65% increase in the number of corrected answers and submitted corrections.
The dashboard/visualization technology is also commonly used to track the results of student exercises and present them in graphical form, giving learners insight into their learning performance and supporting awareness, reflection, and meaning-making. The CALMSystem developed by Kerly et al. [28] is one example of the use of dashboard technology that helped to improve students’ self-reflection and self-assessment skills. Bodily et al. [29] designed and developed a dashboard with two functions: facilitating knowledge learning and improving metacognitive strategies; 79% of students who used the dashboard found it useful and engaging. The dashboard developed by Arnold and Pistilli [30] employed Course Signals to remind students whether they needed to improve their learning in the course. When the course is red, students need to take action to improve their performance; when the course is green, course learning is on track. Students and teachers who have used this dashboard agree that the tool contributes to overall academic success.
In addition, the natural language processing (NLP) technique is commonly used to process and analyze large amounts of text data using semantic and syntactic analysis algorithms. Trausan-Matu et al. [31] used this technique to identify thematic, semantic, and discourse similarities to provide automatic feedback and support for learners. Similarly, Ono et al. [32] constructed a novel feedback system based on text-mining techniques, which generated timely feedback in foreign language speech classes. It helped students reflect more deeply on their performance, with 78% of users having a positive overall impression.

3. Method

This study used a mixed methods research design, which can be divided into three phases. The first phase involved front-end analysis, in which we conducted semi-structured interviews with teachers and students. In this phase, we focused on getting to know and collecting teachers’ and students’ demands for instructional feedback and their perceptions of feedback content. The second phase focused on instructional feedback design, and we analyzed how to achieve the demands collected earlier with the support of technology. In this phase, we eventually developed a diagnostic visual feedback system. The third phase was the empirical evaluation, in which we collected empirical evidence regarding the impact of diagnostic visual feedback in a 10th-grade biology class. We conducted an experimental study with 125 students randomly assigned to a treatment and a control group.

4. Phase 1: Front-End Analysis

4.1. Participants

A total of 20 people participated in these interviews: 10 teachers and 10 students. Both teachers and students were from a public high school in Hubei Province, China. The selection of teachers ensured that one or two were interviewed in each subject, which included Chinese (one teacher), English (one teacher), mathematics (two teachers), biology (three teachers), chemistry (two teachers), and politics (one teacher). The teachers all had 15–20 years of teaching experience. The interviewed students (six male and four female) were randomly selected from the senior class.

4.2. Interview Protocol

We interviewed teachers and students on the following three topics: daily usage, strength, and demand for current feedback. Sample questions included: What kind of instructional feedback have you used in your normal teaching or learning process (including the form, function, and purpose of feedback)? What kind of functions does this feedback have? What are the advantages of this feedback and which ones can be continuously improved? What functions of feedback do you think are urgently needed in teaching? How do you use feedback to improve teaching or learning? What functions do you think instructional feedback needs to include?
Although they taught different subjects, these teachers had overall similar opinions regarding the current feedback system used in their school, with its strengths and weaknesses consistently agreed upon. However, the requests of teachers for a future feedback system tended to vary across disciplinary domains. Teachers from the subjects of arts and humanities demanded more functions of social interaction and personalized comment, while the teachers of subjects such as mathematics and sciences placed more emphasis on knowledge diagnosis and individualized intervention. Since this study was conducted primarily in biology classrooms, we focused more on the opinions of science and mathematics teachers.

4.3. Primary Data Analysis Results

We organized and analyzed the demands and suggestions of teachers and students. In summary, we found that a technology-enhanced instructional feedback system should contain four key areas. First, the technology-enhanced instructional feedback system needs to help students engage in self-evaluation. Teachers suggested providing evaluation in multiple ways, such as scores, ranking, and knowledge mastery. Second, a technology-enhanced instructional feedback system is needed to help students diagnose errors; in this paper, we refer to errors or questions that are done incorrectly as misconceptions. Diagnosing misconceptions helps students learn to correct what has been done incorrectly and to prevent what could be going wrong. Third, a technology-enhanced instructional feedback system needs to help maintain students’ motivation to learn. Teachers believe this can be achieved through both attribution and teacher comments. Fourth, teachers and students want technology-enhanced instructional feedback systems to be presented visually. Tedious textual feedback tends to lead to student resistance, and graphical presentation is an approach that teachers and students approve of.
As discussed above, a technology-enhanced instructional feedback system needs to have two very important features: visualization and diagnostic function. We therefore determined the teachers’ preferred features based on their opinions and designed a diagnostic visual feedback system. The modules and functions of the diagnostic visual feedback system should be those shown in Table 1.

5. Phase 2: Diagnostic Visual Feedback Design

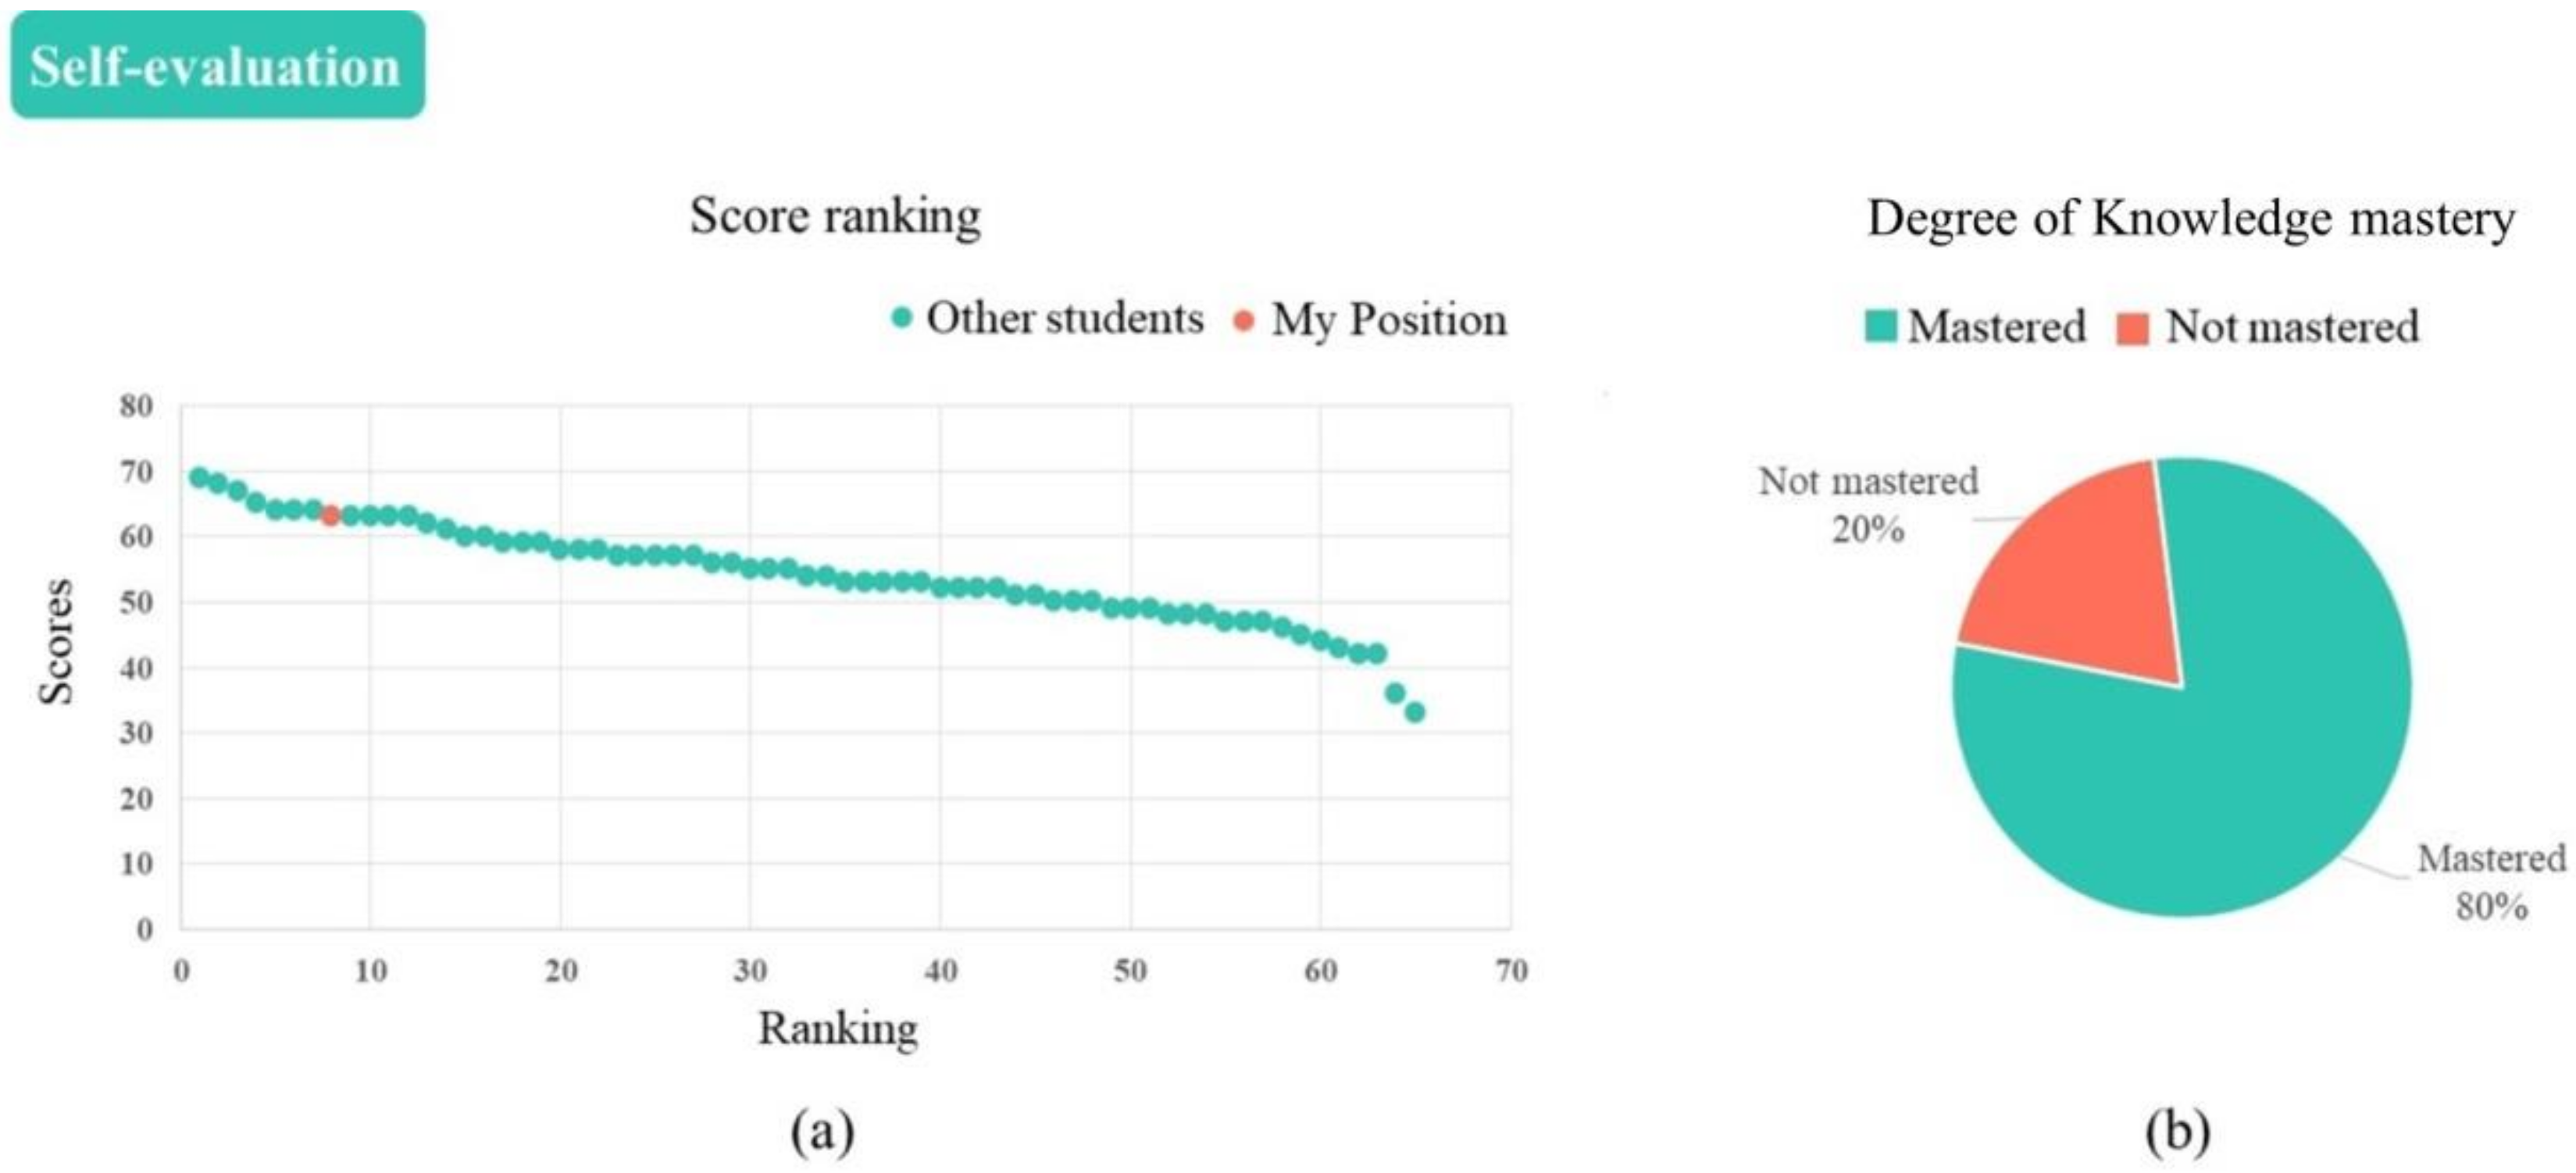
5.1. Design and Development of Self-Evaluation Module

This module consists of two parts: class score ranking and degree of knowledge mastery. Knowledge points are taken from the established curriculum standards and learning objectives. In China’s context, K–12 instruction has historically been assessment-oriented, with much emphasis placed on knowledge comprehension, rather than the development of creative and critical thinking skills. Therefore, we did not consider more complex knowledge diagnostics regarding creative and critical thinking skills. The function for the degree of knowledge mastery is implemented using learning diagnostic techniques. The main calculation for the mastery of knowledge points is shown in Formula (1), where X represents the degree of mastery of students’ knowledge points, i represents the ith knowledge point in a test paper, Ci represents the number of times the ith knowledge point was answered correctly, and Qi represents the number of times the ith knowledge point was examined in a test. To convey this information visually, the score ranking is presented as a scatter plot and the degree of knowledge mastery is presented as a pie chart, as shown in Figure 1. For example, the student who viewed Figure 1 would understand that he/she made it into the top ten in the last exam, yet about 20% of the knowledge was not mastered and compensatory learning was needed to address this issue.
X = i = 1 n C i Q i

5.2. Design and Development of Diagnostic Module

The diagnostic module includes identifying the location of the misconception and knowledge alert. We used knowledge mapping technology to implement the function for identifying the location of the misconception. The Best Matching 25 (BM25) algorithm [33] is used for knowledge matching for misconception location and is used to achieve correlation matching between test questions and chapters in the textbook. BM25 is the most mainstream algorithm in the field of text information retrieval for calculating the similarity score between queries and documents. The main steps for employing BM25 are as follows: First, the query, Q, is tokenized to generate individual words, qᵢ. Then, for each candidate document, d, the relevance score is calculated between each word, qᵢ, and the candidate document, d. Finally, the relevance scores of qᵢ relative to d are weighted and summed to obtain the relevance score between the query, Q, and document, d. The general formula for the BM25 algorithm is shown as follows:
Score Q , d = i n w i q i   d
The specific implementation of this paper consists of four steps. First, a list of documents is created to store the knowledge points from each chapter in the textbook and to number the list of documents by chapter and section. Second, the knowledge points in the documents are divided into entries; the document number corresponding to each entry is written down, which yields the inverted index file. Third, the same method is then used to obtain all of the entries for the test question, which are then matched with the previous inverted index list. We can thus determine all of the related documents containing the entries for the test question. The top N documents with the highest similarity are retained by matching. Fourth, using the BM25 algorithm, the top N entries are reordered to return the section with the highest similarity. The visualization presents the location of the misconception as a list with a bar graph showing the class error rate for that question, as shown in Figure 2.
This part of the knowledge alert system uses knowledge tracking technology. An intelligent learning diagnostic experiment platform was built, as shown in Figure 3, which derives the students’ mastery of each knowledge point. The value obtained by dividing the student’s mastery of the knowledge point by the class’s correct answer rate for the knowledge point determines whether a warning needs to be given for the knowledge point. A traffic light approach is used in the visual presentation: Red represents simple knowledge not yet mastered, yellow represents moderately difficult knowledge not yet mastered, and green represents highly difficult knowledge not yet mastered; this is combined with the knowledge map to create the knowledge alert, as shown in Figure 4.

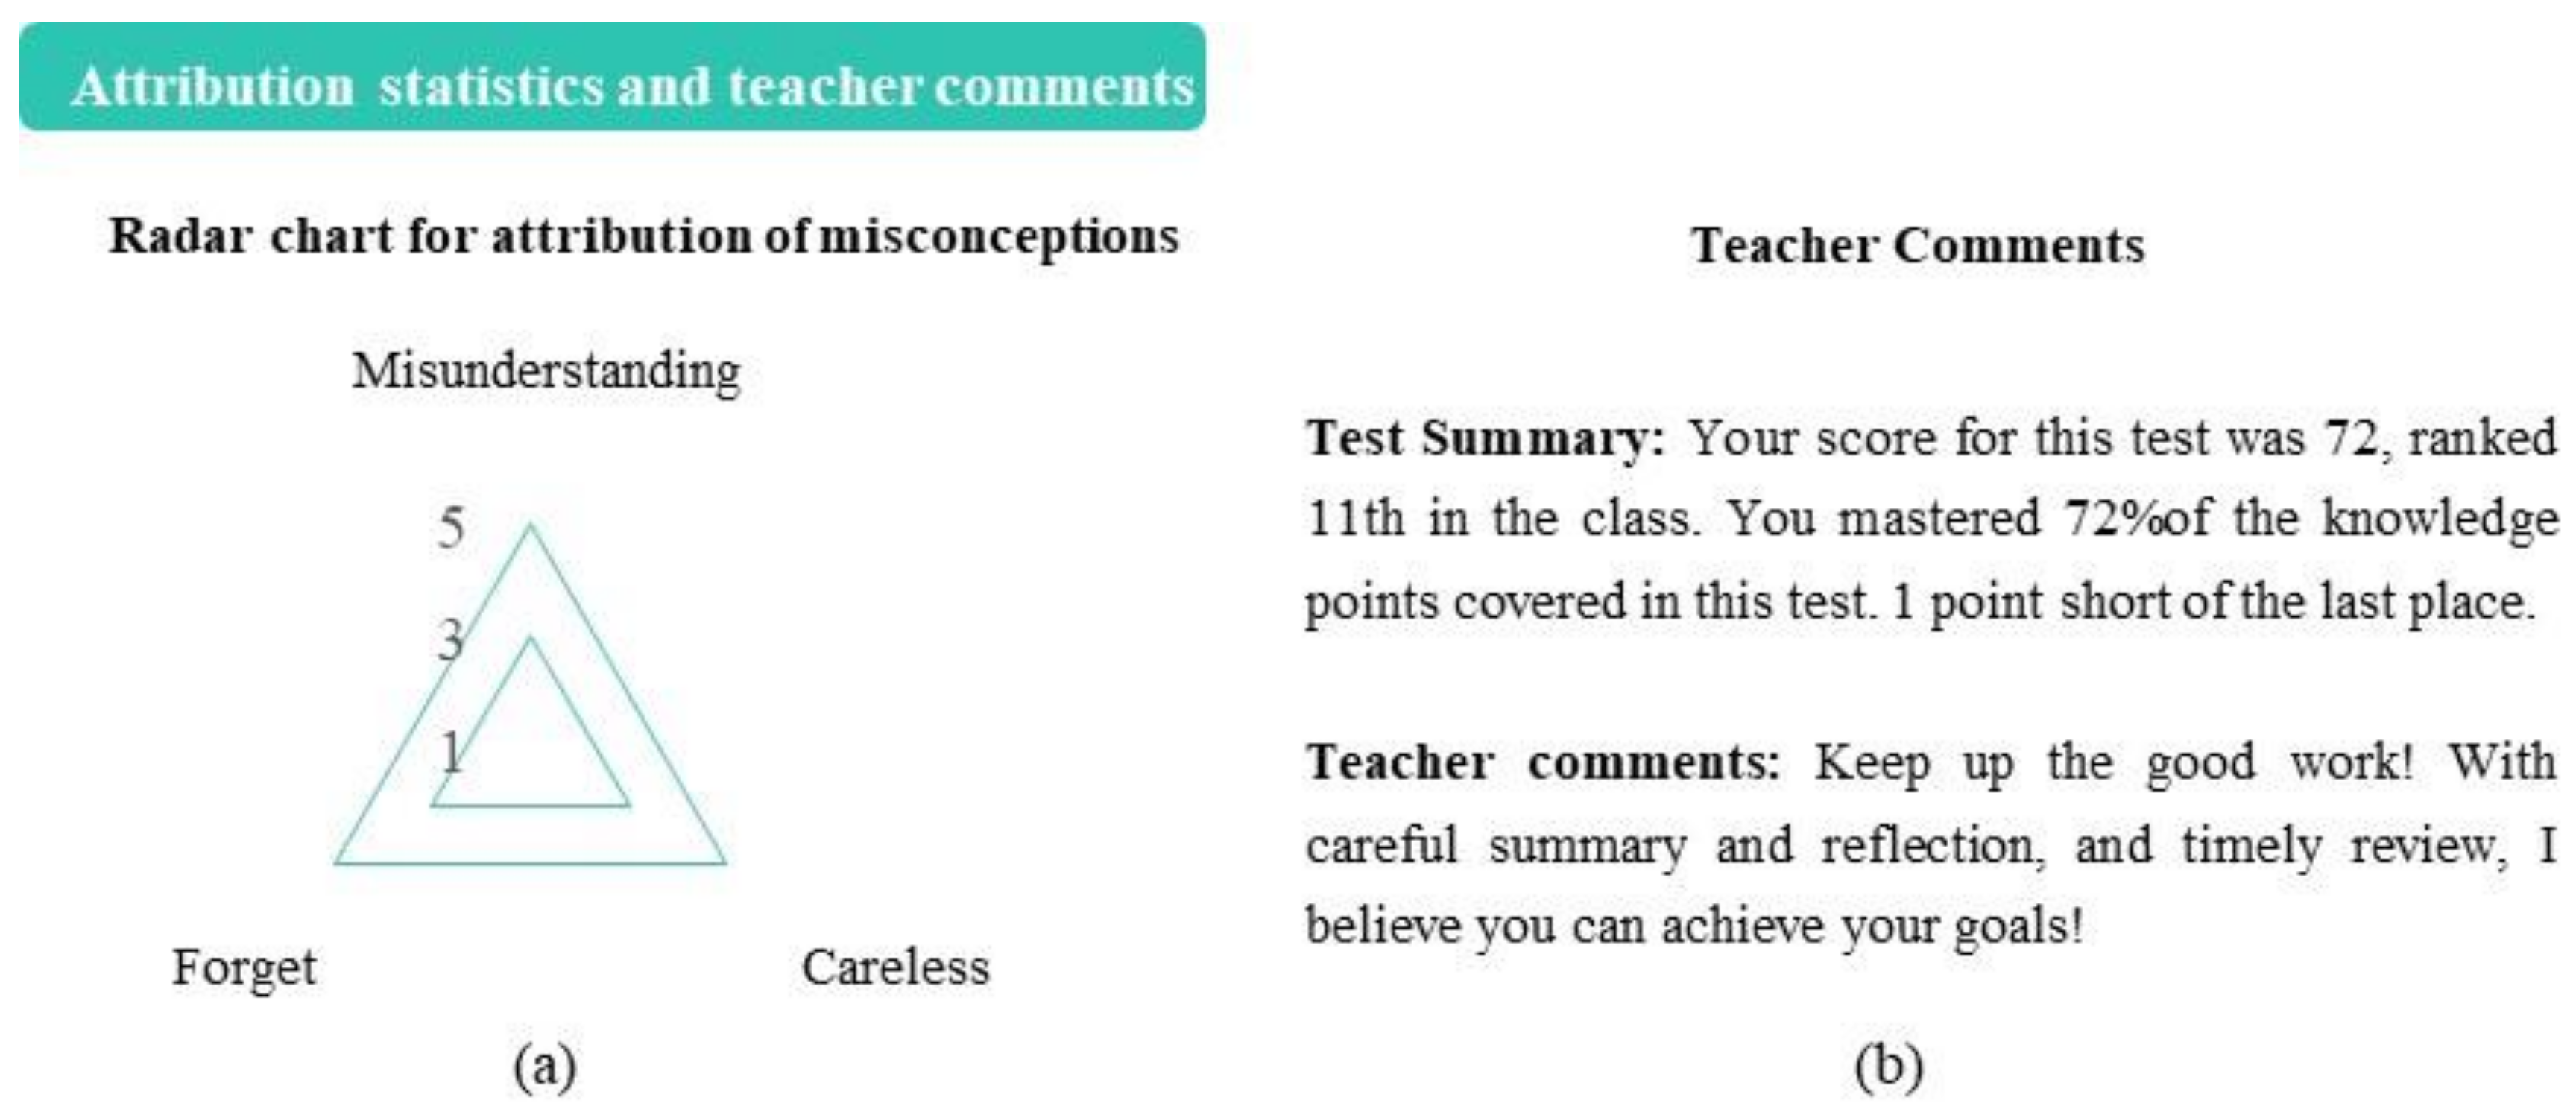
5.3. Design and Development of Motivation Module

The motivation module consists of two sections: correct attribution and motivational teacher comments, as shown in Figure 5. The correct attribution is a section that requires student participation to complete. Students need to check the attribution of each misconception in Figure 2, then count how many times each attribution was selected, and finally trace the radar chart in Figure 5a according to the number of times each attribution was selected. There are two main reasons for designing this section to require students’ hands-on work: First, only the students themselves know the causes of each misconception, so we need to guide them to attribute causes in a direction that can be improved through hard work. Second, having students do it themselves allows them to reflect on the misconception and better engage with it, instead of simply receiving the feedback passively.
For motivational teacher comments, a rule-based comment generation technique is used. Each comment consists of two parts: information about the student test summaries and teacher comments. The student test summaries are primarily the content of the self-evaluation module, as shown in Figure 5b.
Creation of the teacher comments is divided into three steps: designing the generation rules, building the corpus, and technical realization logic. For the generation rules, we assign praise to students who are progressing and encouragement to students who are regressing. When a student regresses in performance, we also add some learning strategy suggestions to the teacher’s comments, according to the student’s level of achievement. This could include metacognitive, self-regulation, and learning method strategies. For example, students with good grades are advised to pay attention when they are careless and be more careful; students with moderate grades are advised to pay attention to self-regulation and practice special exercises; and students with low grades are advised not to be discouraged, but to develop good study habits, as shown in Figure 5b.
We created three types of corpora: praise, encouragement, and learning strategies. Sentences in the praise corpus include: “Good job!” and “Excellent, and I’m so proud of you!”. Encouraging phrases from the corpus include: “You didn’t play well this time, but failure is the mother of success: I’m sure you can do it next time” and “Don’t be discouraged: prepare well and you will definitely make great progress next time”. The sentences in the learning strategies’ corpus include: “Develop the habit of taking notes” and “Pay attention to the summary”.
For the technical realization logic, we took the difference between the student’s current ranking and the last ranking; if the resulting value is greater than five, the student ranking is judged to have decreased, but if it is less than minus five, it is judged to have increased. Other cases are considered stable. Praise and encouragement rubrics are then generated based on whether the student ranking has increased or decreased. For students who remained stable, praise is given if they are in the top 50% of the rankings, while for others, encouragement is given. The logic flow chart is shown in Figure 6.

6. Phase 3: Empirical Evaluation

6.1. Research Context and Participants

We conducted an empirical study in a public high school in central China. We selected two parallel classes with comparable grades and numbers for the empirical research, one as the control class and the other as the experimental class. A total of 125 students participated in the experiment (71 boys and 54 girls), with an average age of 14 years. The entire experiment lasted six weeks, and a total of three exams were administered, including a pre-test and a post-test. Diagnostic visual feedback reports were provided for the students in the experimental group after every exam, and no intervention was made for the students in the control group.

6.2. Data Collection and Analysis

We collected two kinds of data: student scores and evaluation survey questionnaires. Student score data were collected through paper exams. The exam papers were prepared by three senior teachers with 20 years of teaching experience, led by the school’s chemistry teaching team leader. The total score for the paper was 100 marks and it included 25 questions. Three sets of exam papers were prepared, which have been used for decades and have been shown to assess knowledge accurately. The evaluation survey was designed to investigate which modules students found valuable. There was one multiple-choice question: Among the following six feedback functions, which functions do you think are useful?
To explore the effect of the diagnostic visual feedback reports on student performance, we took whether students received diagnostic visual feedback reports as the independent variable and the change in students’ performance as the dependent variable. We first conducted K–S tests on the pre-test and post-test scores from both classes, and the results showed no significant difference (p = 0.441 for the pre-test; p = 0.445 for the post-test), which indicated that the data follow normal distribution. To explore the changes in student achievement, we conducted independent samples t-tests on the pre-test and post-test scores of the two classes separately. For the questionnaire data, we applied statistical analysis and ranked the selected rate of each function. The data were analyzed using IBM SPSS software (version 21).

6.3. Results

6.3.1. Effectiveness of Diagnostic Visual Feedback System

The results of the independent samples t-test showed that there was no significant difference between the pre-test scores of the two classes (p = 0.33; M = 52.77, SD = 6.77 for the control class; M = 54.02, SD = 7.39 for the experiment class). The average score in the control class was slightly higher than the average score in the experimental class; however, there was a significant difference between the post-test scores of the two classes, and the experimental class had a higher mean score than the control class by 2.98 points (p = 0.04; M = 62.84, SD = 8.25 for the control class, M = 65.82, SD = 7.76 for the experiment class; ES = 0.37). The detailed data are shown in Table 2. This demonstrates that the diagnostic visual feedback report had a significant effect on improving student performance. Additionally, we also calculated the value of gain for the effect size between the pre-test and post-test experimental group as measured by Cohen’s d (ES = 1.79), indicating that the diagnostic visual feedback system produced a good improvement in participants’ academic performance.

6.3.2. Results of the Evaluation Questionnaire

The misconception location function was considered by students to be the most useful, with 79% of students choosing it. The second most selected function was the degree of knowledge mastery, with 73% of students choosing it. Class score ranking and knowledge alert were in third and fourth places, respectively, with more than half of the students finding them helpful to their studies. Teacher comments and the radar were the last two choices, with 47% and 37% of students, respectively, as shown in Table 3.

7. Discussion and Conclusions

7.1. Feedback Functions Needed for Teachers and Students

Based on our research results, we found that the misconception location function and degree of knowledge mastery were the types of feedback most needed by teachers and students. The function of misconception location is difficult to obtain through student analysis and is rarely seen in their usual learning, so students found this function particularly useful. The degree of knowledge mastery is a partial summative assessment that allows students to recognize the gap between their current understanding and their goals as a whole, which better motivates them to learn [26].
The functions of class score ranking and knowledge alerts formed the second tier of feedback types needed by teachers and students. The former gives students a clear idea of their ranking in the class, while the latter ensures students are clearly aware of the weak parts of their knowledge. Students appear to prefer features that inform them either of their current status or of directions for improvement. This finding is consistent with the argument of Bodily et al. [22], who designed and developed a learning dashboard presenting students’ strong and weak knowledge points to make sure that they know their current state of learning and give suggestions for improvement. In another experiment with learning analytics dashboards, Corrin and de Barba [27] also found that presenting students’ current learning can have an important impact on students and give them an objective perception of their level of academic achievement.
As for the teacher comments and radar charts for attributions, they were selected the least, perhaps because teacher comments were text-based and not as interesting as the charts, and the attribution radar charts required students to do it themselves, which may cause some less motivated students to resist them.

7.2. Technological Means to Achieve Feedback Functions

The knowledge mapping technique was used in this study to determine the location of misconceptions, and the knowledge tracking technique was used for the knowledge alerts. Teacher comments were implemented using grammar rule-based rubric generation techniques and hidden Markov models. Visualization was implemented with Python and Echart. The most useful and core technologies were still those used for diagnosis, such as knowledge mapping, knowledge tracking, and learning diagnosis technologies, but the preliminary stage still requires teachers to mark the knowledge points for the test questions, which is a fairly tedious process, and we expect better automated feedback methods at a later stage. Visualization is also an important technique, not only to calculate the result, but also to enable students to understand what the result means so that they can understand it at a glance. The teacher comment module, which our system currently generates based on rules, appears less intelligent than natural language processing techniques. We look forward to teacher comments being implemented in a more intelligent way.

7.3. Overall Effect of Diagnostic Visual Feedback System and Functions Valued

The results of this study revealed that the diagnostic visual feedback system had a moderate and statistically significant effect on improving student achievement. There are two possible reasons that could explain this finding. First, the diagnostic visual feedback system may have improved student performance by helping students to self-regulate their learning. Setting learning goals and implementing effective learning strategies were techniques provided to promote self-regulated learning [34]. In our diagnostic visual feedback system, the degree of knowledge mastery and class score ranking helped students understand where they stood in relation to their goals, and misconception location and knowledge alerts helped students adopt appropriate strategies to improve their learning. Self-regulated learning may thus be an intermediate pathway for feedback to promote improved performance.
Second, the improvement in student performance from this diagnostic visual feedback system may also be achieved by enhancing students’ motivation to learn. The feedback draws the student’s attention and then provides information that is relevant to the student’s own test results. According to the attention, relevance, confidence, and satisfaction (ARCS) theory of motivation design [35], attention and relevance are two essential design features to induce and sustain learning motivation, which in turn promotes improved academic performance.

7.4. Implications for Feedback Design

We gained the following insights from this study. First, the following modules need to be considered when designing an instructional feedback system: students’ current status, directions for improvement, and motivation for learning. For example, the class score ranking function and the degree of knowledge mastery function can be used to show students’ current status. Students can be informed of the direction of improvement with the misconception location function and the knowledge alert function. The attribution and teacher comment functions can also be used to motivate and maintain student motivation.
Second, for developers, the feedback tool needs to integrate algorithms and visualization organically to increase the accuracy and usability of performance assessment. The data types presented in each module differ, so different visualization presentation methods must be chosen for different characteristics of the data (e.g., we chose scatter plots for ranking and score presentation).
Third, teachers and students need to be involved in the process of creating and using feedback. In this study, teachers did some prework when creating the feedback, and students needed to complete modules on their own when using the feedback; these teacher–student involvement sessions made them more engaged in reflecting on their teaching or learning. We believe this also promotes a diagnostic visual feedback system that can achieve better results.

7.5. Limitations and Future Research

This study has several limitations that provide avenues for future research. First, our feedback modules are designed in the context of China where the focus of K–12 education is on knowledge comprehension rather than the development of creative and critical thinking skills. Consequently, our feedback system was designed to serve such a focus and thus certain findings might not be generalized to other educational contexts with different values and ideologies. Second, our empirical study had a small sample size of 125 individuals from two classes, which was not universal or representative. Third, we only used diagnostic visual feedback reports twice in our empirical evidence; the long-term effect was not evaluated and the novelty effect might also have contributed to the performance improvement found in this study. Fourth, our study was a quasi-experiment, not a randomized group experiment, so the influence of confounding variables cannot be eliminated. Finally, our study may have been influenced by the Hawthorne effect, i.e., participants may have changed their behavior as a result of finding themselves under observation. In the future, we recommend that specific feedback modules be developed to assess and promote higher-order thinking for students. Additionally, we recommend that researchers employ rigorous research and the pragmatic value of the study results to investigate the long-term effects of the diagnostic visual feedback, while collecting data from a larger and more diverse sample to increase both the credibility and the generalizability of the study results.

Author Contributions

Conceptualization, Z.W. and H.L.; methodology, H.L.; software, L.M.; formal analysis, L.M. and X.Z.; investigation, L.M. and X.Z.; writing—original draft preparation, L.M.; writing—review and editing, H.L.; visualization, L.M.; supervision, Z.W. and H.L.; project administration, H.L.; funding acquisition, Z.W. and H.L. All authors have read and agreed to the published version of the manuscript.

Funding

This research was funded by the National Natural Science Foundation of China, grant number 62177022, and the Key Research Project of Co-Innovation Center for Educational Informatization and Balanced Development of Basic Education, grant number xtzdwt2022–001.

Institutional Review Board Statement

The study was conducted in accordance with the Declaration of Helsinki, and approved by the Institutional Review Board of Central China Normal University, Ethic Committee, EC, Institutional Review Board (protocol code: CCNU-IRB-202110-019; date of approval: 16 October 2021).

Informed Consent Statement

Informed consent was obtained from all subjects involved in the study.

Data Availability Statement

The data presented in this study are available on request from the corresponding author.

Conflicts of Interest

The authors declare no conflict of interest.

References

  1. Moreno, R. Decreasing cognitive load for novice students: Effects of explanatory versus corrective feedback in discovery-based multimedia. Instr. Sci. 2004, 32, 99–113. [Google Scholar] [CrossRef]
  2. Narciss, S.; Huth, K. How to design informative tutoring feedback for multimedia learning. In Instructional Design for Multimedia Learning; Waxmann: Muenster, Germany, 2004; pp. 181–195. [Google Scholar]
  3. Pridemore, D.R.; Klein, J.D. Control of practice and level of feedback in computer-based instruction. Contemp. Educ. Psychol. 1995, 20, 444–450. [Google Scholar] [CrossRef]
  4. Hattie, J.; Timperley, H. The power of feedback. Rev. Educ. Res. 2007, 77, 81–112. [Google Scholar] [CrossRef] [Green Version]
  5. Stobart, G. Testing Times: The Uses and Abuses of Assessment; Routledge: London, UK, 2008. [Google Scholar]
  6. Evans, C. Making sense of assessment feedback in higher education. Rev. Educ. Res. 2013, 83, 70–120. [Google Scholar] [CrossRef] [Green Version]
  7. Hattie, J.; Gan, M. Instruction based on feedback. In Handbook of Research on Learning and Instruction; Mayer, R.E., Alexander, P.A., Eds.; Routledge: New York, NY, USA, 2010; pp. 249–271. [Google Scholar]
  8. Oakes, W.P.; Lane, K.L.; Menzies, H.M.; Buckman, M.M. Instructional feedback: An effective, efficient, low-intensity strategy to support student success. Beyond Behav. 2018, 27, 168–174. [Google Scholar] [CrossRef]
  9. Schrader, C.; Grassinger, R. Tell me that I can do it better. The effect of attributional feedback from a learning technology on achievement emotions and performance and the moderating role of individual adaptive reactions to errors. Comput. Educ. 2021, 161, 104028. [Google Scholar] [CrossRef]
  10. Burke, D. Strategies for using feedback students bring to higher education. Assess. Eval. High. Educ. 2009, 34, 41–50. [Google Scholar] [CrossRef]
  11. Fedor, D.B.; Davis, W.D.; Maslyn, J.M.; Mathieson, K. Performance improvement efforts in response to negative feedback: The roles of source power and recipient self-esteem. J. Manag. 2001, 27, 79–97. [Google Scholar] [CrossRef]
  12. Kluger, A.N.; DeNisi, A. The effects of feedback interventions on performance: A historical review, a meta-analysis, and a preliminary feedback intervention theory. Psychol. Bull. 1996, 119, 254–284. [Google Scholar] [CrossRef]
  13. Cavalcanti, A.P.; Barbosa, A.; Carvalho, R.; Freitas, F.; Tsai, Y.-S.; Gašević, D.; Mello, R.F. Automatic feedback in online learning environments: A systematic literature review. Comput. Educ. Artif. Intell. 2021, 2, 100027. [Google Scholar] [CrossRef]
  14. Li, J.; De Luca, R. Review of assessment feedback. J. Stud. High. Educ. 2014, 39, 378–393. [Google Scholar] [CrossRef]
  15. Shute, V.J. Focus on formative feedback. Rev. Educ. Res. 2008, 78, 153–189. [Google Scholar] [CrossRef]
  16. Nicol, D.J.; Macfarlane-Dick, D. Formative assessment and self-regulated learning: A model and seven principles of good feedback practice. Stud. High. Educ. 2006, 31, 199–218. [Google Scholar] [CrossRef]
  17. Brookhart, S.M. Formative Assessment Strategies for Every Classroom: An ASCD Action Tool; ASCD: Pasadena, CA, USA, 2010. [Google Scholar]
  18. Keeley, P.D. Science Formative Assessment. Volume 1: 75 Practical Strategies for Linking Assessment, Instruction, and Learning; Corwin Press: Thousand Oaks, CA, USA, 2008. [Google Scholar]
  19. Kebodeaux, K.; Field, M.; Hammond, T. Defining precise measurements with sketched annotations. In Proceedings of the Eighth Eurographics Symposium on Sketch-Based Interfaces and Modeling, Vancouver, BC, Canada, 5–7 August 2011; pp. 79–86. [Google Scholar]
  20. Alemán, J.L.F.; Palmer-Brown, D.; Draganova, C. Evaluating student response driven feedback in a programming course. In Proceedings of the 2010 10th IEEE International Conference on Advanced Learning Technologies, Sousse, Tunisia, 5–7 July 2010; pp. 279–283. [Google Scholar]
  21. Molin, F.; Haelermans, C.; Cabus, S.; Groot, W. Do feedback strategies improve students’ learning gain?—Results of a randomized experiment using polling technology in physics classrooms. Comput. Educ. 2021, 175, 104339. [Google Scholar] [CrossRef]
  22. Pintrich, P.R. The role of motivation in promoting and sustaining self-regulated learning. Int. J. Educ. Res. 1999, 31, 459–470. [Google Scholar] [CrossRef]
  23. Muilenburg, L.Y.; Berge, Z.L. Student barriers to online learning: A factor analytic study. Distance Educ. 2005, 26, 29–48. [Google Scholar] [CrossRef]
  24. Barnard, L.; Paton, V.O.; Lan, W.Y. Online Self-Regulatory Learning Behaviors as a Mediator in the Relationship between Online Course Perceptions with Achievement. Int. Rev. Res. Open Dis. 2008, 9, 1–11. [Google Scholar] [CrossRef] [Green Version]
  25. Pintrich, P.R. Understanding self-regulated learning. New Dir. Teach. Learn. 1995, 1995, 3–12. [Google Scholar] [CrossRef]
  26. Pintrich, P.R.; Zusho, A. Student motivation and self-regulated learning in the college classroom. In The Scholarship of Teaching and Learning in Higher Education: An Evidence-Based Perspective; Springer: Berlin/Heidelberg, Germany, 2007; pp. 731–810. [Google Scholar]
  27. Singh, R.; Gulwani, S.; Solar-Lezama, A. Automated feedback generation for introductory programming assignments. In Proceedings of the 34th ACM SIGPLAN Conference on Programming Language Design and Implementation, Orlando, FL, USA, 16–23 June 2013; pp. 15–26. [Google Scholar]
  28. Kerly, A.; Ellis, R.; Bull, S. CALMsystem: A conversational agentfor learner modelling. In Applications and Innovations in Intelligent Systems XV, Proceedings of AI-2007, 27th SGAI International Conference on Innovative Techniques and Applications of Artificial Intelligence, Cambridge, UK, 10–12 December 2007; Ellis, R., Allen, T., Petridis, M., Eds.; Springer: London, UK, 2007; pp. 89–102. [Google Scholar]
  29. Bodily, R.; Ikahihifo, T.K.; Mackley, B.; Graham, C.R. The design, development, and implementation of student-facing learning analytics dashboards. J. Comput. High. Educ. 2018, 30, 572–598. [Google Scholar] [CrossRef]
  30. Arnold, K.E.; Pistilli, M.D. Course signals at purdue: Using learning analytics to increase student success. In Proceedings of the 2nd International Conference on Learning Analytics and Knowledge, Vancouver, BC, Canada, 29 April–2 May 2012; pp. 267–270. [Google Scholar]
  31. Trausan-Matu, S.; Dascalu, M.; Rebedea, T. PolyCAFe—Automatic support for the polyphonic analysis of CSCL chats. Int. J. Comput. Support. Collab. Learn. 2014, 9, 127–156. [Google Scholar] [CrossRef]
  32. Ono, Y.; Ishihara, M.; Yamashiro, M. Preliminary construction of instant qualitative feedback system in foreign language teaching. In Proceedings of the 2013 Second IIAI International Conference on Advanced Applied Informatics, Los Alamitos, CA, USA, 31 August–4 September 2013; pp. 178–182. [Google Scholar]
  33. Robertson, S.; Zaragoza, H. The probabilistic relevance framework: BM25 and beyond. Found. Trends Inf. Retr. 2009, 3, 333–389. [Google Scholar] [CrossRef]
  34. Zimmerman, B.J.; Schunk, D.H. Self-regulated learning and performance: An introduction and an overview. In Handbook of Self-Regulation of Learning and Performance; Routledge: London, UK, 2011; pp. 15–26. [Google Scholar]
  35. Keller, J.M. ARCS model of motivation. Encycl. Sci. Learn. 2012, 65, 304–305. [Google Scholar]
Figure 1. Self-evaluation module. (a) Score ranking: Students’ scores are on the Y-axis; students’ class rank is on the X-axis; (b) degree of knowledge mastery: The green area represents the percentage of knowledge a student has mastered, while the red area represents the percentage of knowledge not mastered by the student.
Systems 11 00364 g001
Figure 2. Misconception location module. Each bar represents a misconception. The top serial number indicates the question number for the misconception. The descriptions that follow are the knowledge points in the question and their location in the chapter. Each misconception includes a percentage bar that represents the correct rate for the question in the grade. Students need to make an attribution for each misconception by checking one of three choices: “careless”, “forget”, and “misunderstanding”.
Systems 11 00364 g002
Figure 3. Intelligent learning diagnostic experiment platform. The Q matrix is obtained after each test by experts who label the knowledge points tested in each test question. Student test response data and the Q matrix are imported, and the platform is updated with the student’s mastery of each knowledge point.
Systems 11 00364 g003
Figure 4. An example knowledge alert.
Systems 11 00364 g004
Figure 5. Motivational module. (a) Radar chart for misconception attribution; (b) teacher comments.
Systems 11 00364 g005
Figure 6. Technology realization logic process flow chart for teacher comment generation.
Systems 11 00364 g006
Table 1. Modules and functions of the diagnostic visual feedback system.
ModulesPreferred FunctionTeachers’ Opinions
Self-evaluation moduleClass score rankingPresent information from multiple perspectives, including score, ranking, and mastery
Degree of knowledge mastery
Diagnostic moduleLocation of misconceptionLet students know what has been done incorrectly and prevent what could go wrong
Knowledge alert
Motivation moduleCorrect attributionHelp maintain students’ motivation to learn
Teacher comments
Table 2. Key statistical results of the t-test comparing pre- and post-test scores.
Score NMSDdftp
Pre-testControl class6354.027.39123−0.9790.33
Experimental class6252.776.77
Post-testControl class6362.848.251232.080.04
Experimental class6265.827.76
Table 3. The popularity of the functions of diagnostic visual feedback.
FunctionsApproval RateRank
Misconception location79%1
Degree of knowledge mastery73%2
Class score ranking58%3
Knowledge alert55%4
Teacher comments47%5
Radar chart for attribution37%6
Disclaimer/Publisher’s Note: The statements, opinions and data contained in all publications are solely those of the individual author(s) and contributor(s) and not of MDPI and/or the editor(s). MDPI and/or the editor(s) disclaim responsibility for any injury to people or property resulting from any ideas, methods, instructions or products referred to in the content.

