Article

Failure Mode and Effect Analysis with a Fuzzy Logic Approach

by
José Jovani Cardiel-Ortega
1 and
Roberto Baeza-Serrato
2,*
1
Centro de Innovación Aplicada en Tecnologías Competitivas CIATEC A.C., Omega 201, Industrial Delta, León 37545, Guanajuato, Mexico
2
Departamento de Estudios Multidisciplinarios, División de Ingenierías, Campus Irapuato-Salamanca, Universidad de Guanajuato, Yuriria 38944, Guanajuato, Mexico
*
Author to whom correspondence should be addressed.
Systems 2023, 11(7), 348; https://doi.org/10.3390/systems11070348
Submission received: 26 May 2023 / Revised: 21 June 2023 / Accepted: 5 July 2023 / Published: 7 July 2023
(This article belongs to the Topic Intelligent Systems and Robotics)

Abstract

:
Failure mode and effect analysis (FMEA) is one of the most used techniques in risk management due to its potential to solve multidisciplinary engineering problems. The role of experts is fundamental when developing the FMEA; they identify the failure modes by expressing their opinion based on their experience. A relevant aspect is a way in which the experts evaluate to obtain the indicator of the risk priority number (RPN), which is based on qualitative analysis and a table of criteria where they subjectively and intuitively determine the factor level (severity, occurrence, and detection) for each of the failures. With this, imprecision is present due to the interpretation that each one has regarding the failures. Therefore, this research proposes a fuzzy logic evaluation system with a solid mathematical basis that integrates these conditions of imprecision and uncertainty, thus offering a robust system capable of emulating the evaluation form of experts to support and improve decision making. One of the main contributions of this research is in the defuzzification stage, adjusting the centroid method and treating each set individually. With this, the RPN values approximate to the conventional technique were obtained. Simulations were carried out to test and determine the system’s best structure. The system was validated in a textile company in southern Guanajuato. The results demonstrate that the system reliably represents how experts perform risk assessment.

1. Introduction

Organizations motivated to deliver products and services aligned with customer expectations increasingly use assessment techniques to identify potential risks [1]. Prioritizing failures in a system and planning corrective actions are two essential components of risk management in any organization [2]. The Failure Mode and Effect Analysis (FMEA) is the most widely used structured and qualitative technique to identify failure modes in the system, evaluate their impact, and plan corrective actions. FMEA is the first step in reliability studies [3]. This technique has been applied in manufacturing, food, education, construction, electronics, health, aerospace, and hydrocarbons [4].
Artificial intelligence techniques are increasingly present in solving engineering problems, providing excellent results and greater reliability. A concrete example is the fuzzy logic technique that allows us to develop fuzzy systems that become indispensable tools in risk analysis. A fuzzy-rule-based system is the most common way to represent and systematically model human reasoning, using a rough and linguistic description that reflects our communication language [5]. Considering the aspects of communication and human reasoning, to develop an FMEA, the participation of a multidisciplinary team of experts is necessary to evaluate the different failure modes that can compromise the reliability and correct operation of a system or process. Each team member’s interpretations regarding the failures can generate a degree of imprecision. Therefore, when experts analyze failure modes and consider natural language, they express their point of view based on their knowledge and experience. Likewise, to determine the risk priority number (RPN), the experts develop a qualitative analysis based on a table of specific criteria. Therefore, the evaluation of the severity (S), occurrence (O), and detection (D) factors is highly subjective. Consequently, this research proposes a fuzzy logic evaluation system that mathematically models and emulates experts’ decision making when performing failure mode analysis. In this work, a Mamdani Type-1 fuzzy inference model is proposed. Different scenarios are proposed in the implication and aggregation stages, combining the fuzzy operators. The test of the evaluation system was carried out via simulations to determine the best structure of the system. Therefore, values of the risk priority number (RPN) output variable are obtained with greater reliability.
A case study was developed in the knitting department of a company in the textile sector. The evaluation system was validated, and the failure modes of the knitting machinery were prioritized. The main contribution of this research is a modification of the centroid method used in the defuzzification stage. In our proposal, defuzzification is carried out via zones of each fuzzy set to obtain results close to the conventional RPN.
This article is structured as follows. Section 2 presents the literature review, where the authors use fuzzy logic to improve the qualities of FMEA. In Section 3, the proposed methodology and approach are presented. Section 4 presents the development of the fuzzy system with a case study in the textile sector. The discussion is presented in Section 5. Finally, the main findings are concluded in Section 6.

2. Literature Review

The authors of [6] performed a comprehensive risk analysis on public–private partnership (PPP) projects for water treatment. An innovative risk assessment model is proposed based on intuitionistic fuzzy multi-objective optimization and the FMEA tool. Through interviews with experts, the literature, and the statistical frequency method, they identified five primary levels of risk and classified the degree of these risks. It should be noted that they assigned weights to each factor (O, S, and D). The domain of the RPN output variable of the case study is between (0, 1). Moreover, ref. [7] proposed a new method to classify risks in the working environment of an oil refinery. The Mamdani model and the triangular and trapezoidal functions for the linguistic variables were used. Their work is relevant because they develop a further prior evaluation of the input parameters (S, O, and D) by combining fuzzy inference systems into a single evaluation system. Therefore, with the proposed method, they obtain greater precision in risk prioritization.
Furthermore, the work of [8] developed a significant model to analyze the reasons for the failure of the logistics system during the COVID-19 pandemic. The FMEA methodology and the Analytic Hierarchy Process (AHP) method were used to calculate the weights of the factors (O, S, and D). They proposed a new fuzzy risk priority-weighted number (F-RPWN). As a result, it was determined that the most critical types of risk in the logistics system are security, commercial risks, and particular problems. The scale of the output variable in the case study to prioritize risks is less than (0.2). The models proposed by the authors [6,7,8] are novel and relevant to improving the FMEA technique. However, the scales of the RPN output variables differ significantly from the conventional RPN values. Also, ref. [9] proposes a novel methodology that combines the AHP and Partial Risk Map (PRISM) methods to assess risks based on pairwise comparison. They validated the methodology by developing a case study to assess the risks of strategic incidents in the logistic business processes of a nuclear power plant. A relevant aspect was the consistency test of the expert group after the evaluation.
The authors of [10] conducted an FMEA and tested their system in a private hospital, finding nine risk types. They use a Mamdani model with max–min operators. The invaluable implementation of this model in medical sterilization units is highlighted, in which risk analysis has been little explored. They make a comparison between two matrix approaches to classify risks. However, when a matrix approach with five levels is used for the linguistic variables, 125 IF-THEN rules are generated. Expert knowledge is based on relatively few possible combinations between variables. In our research, the knowledge base comprises 27 fuzzy rules, which is computationally practical. However, it also has greater approximation and simplicity when evaluating the RPN factors.
The researchers of [11] analyzed the risks in a hybrid fuel cell and gas turbine system for marine propulsion. With the FMEA, they determine 40 failure modes. A Mamdani-type fuzzy logic model is used for risk assessment. Their study provides an essential framework for developing a new propulsion system with safety in mind. It can be noted that the scale of the RPN output variable was (12.9, 38.0). The model we propose in this work improves the output scale with a closer approximation to the result of the score of the conventional technique. The authors of [12] propose using fuzzy logic and FMEA to analyze risks in student projects. The system integrates the agent-based model to build the membership function and classify the inference rules. They use the Mamdani model, the triangular function, and the max–min operators. The proposal provides a tool to improve the analysis and development of projects in the learning process.
The author’s research [1] focuses on the failure analysis of manufacturing systems proposing an approach based on the fuzzy cognitive map method (FCM), the FMEA for processes, and the delta-rule-learning algorithm considering the opinion of the experts. The results highlight the power of the approach with a food industry case study. The scale of the output variable RPN was (0.65, 0.97). In research [1,12], the most common membership functions are not explicitly related to the meaning of the severity, occurrence, and detection factors. This aspect is relevant and fundamental because the functions represent the degree of membership and the behavior of the system variables.
The work of [13] successfully combines fuzzy logic and product FMEA. The triangular membership function and the Mamdani model with max–min operators were used in the fuzzy system. Sixteen failure modes are analyzed in a family farming equipment cutting module to mechanize artichoke processing. The scale of the RPN output variable for the analyzed failure modes varies between (576.35, 833.47). In a numerical example presented by the authors, the output value is practically twice the value of the conventional RPN. In this present investigation, defuzzification is carried out via zones (sets). With the above, obtaining a value in the output variable close to the conventional RPN is possible.
In ref. [14], via an FMEA, the authors evaluated eight risks in Smart Networks. A combination of ICT (Information and Communication Technology) with autonomous energy equipment from the electrical network. The results demonstrate the ability to improve risk perception and classify the impact of failures. The scale of the RPN output variable was (85.2, 116). Their Mamdani-type model incorporated the impact variable as an additional factor. A relevant aspect of this work is the test of the system with two types of membership functions (triangular and Gaussian), and later they perform a comparison of the outputs. However, the functions’ relationship concerning the system variables must be explained. In this present investigation, we explain the relationship of the sigmoidal function concerning the meaning and behavior of the factors (O, S, and D).
The authors of [15] develop an FMEA to study fluid-filling systems in automobile assembly lines, finding 23 failure modes. Aspects such as expert characteristics, scale variation, four membership functions, and four defuzzification algorithms were integrated into the fuzzy model. The scale of the RPN output variable was between (46, 610). Its system improves decision making, maintenance plans, and high levels of availability and security. However, the type of model used is not specified. In this research, a Mamdani model is developed with each stage, and the fuzzy rule base is presented.
In the investigation of [16], an FMEA was carried out with a root cause analysis in mining machinery, finding 16 potential risks via a Mamdani inference model; the Gaussian membership function was used for the input variables, and the triangular function for the output variable, as well as the max–min operators. The electrical subsystem was determined as a priority failure. The scale of the RPN output variable was (32.0, 142.0). The authors of [17] studied the components of a lathe machine via a risk analysis incorporating the fuzzy aspect. The scale of the RPN output variable was (3.50, 7.41). The results show that the fuzzy FMEA approach is superior in criticality analysis.
The researchers in [18] proposed a fuzzy-rule-based model incorporating the Gupta–Ghasemian formula and the Dempster–Shafer theory to quantify uncertainty. Their study analyzed 20 failure modes of an industrial centrifugal pump using an FMEA. Ten experts evaluated the failure modes, and the scale of the RPN output variable was (2.11, 7.49). The studies of [16,17,18] present important models and applications that demonstrate the need to integrate fuzzy logic in the FMEA. However, the result of the output variables is found in ranges with low values. In this present investigation, we propose in the fuzzification stage an adjustment that allows the values of the output variable to be on a scale close to the conventional values of RPN. Moreover, the research of [19] in their study of enterprise architectures carried out an FMEA. The authors analyzed twenty failure modes with a fuzzy model incorporating an eight-step method with multi-criteria optimization. A triangular function and inference rules were used based on expert criteria and weights, best–worst, and min–max operators. The NPR output scale in their case study is (0.63, 9.66). They prioritize and identify significant priorities such as labor practice and infrastructure with their model.
Other studies focused on innovative proposals to build a failure analysis, integrating other techniques to test consistency, pairwise comparison, and ideal solution. For example, the authors of [20] propose a Mamdani-type fuzzy inference system built from the experience of experts. They validate their model in a diesel engine turbocharger system. The analysis of the mechanical system is highlighted by considering its components, subsystems, and the interdependence between failure modes. In addition, they developed a platform as an evaluation interface where experts from different disciplines can share information. In ref. [21], the authors developed a rule-based fuzzy expert system to offer a tool to assess risks associated with marine engineering and offshore transportation issues. They use three membership functions to create fuzzy sets and perform sensitivity analyses for the most critical failure modes. Thus, they demonstrate the effectiveness of their model for risk assessment.
The investigation of [22] proposes a fuzzy inference system implemented in a nuclear reliability engineering problem. They develop an FMEA in a chemical and volume control system. The results demonstrate the potential of the inference system for this class of problems. In addition, it provides the advantage of being used for systems where security data are unavailable or unreliable. The authors of [23] develop an FMEA using the fine-tuned trapezoidal fuzzy-based technique for the order of preference by similarity to the ideal solution. Its objective was to reduce the risks in the preparation or collection of data using hierarchical matrix management. The proposed model considers the interdependencies between failure modes, the relative importance of risk, and the non-subjective nature of conventional RPN functions. In the research by [24], they propose a novel method incorporating the stages of the FMEA technique. The method allows pairwise comparison, calculating the weights of importance and consistency in the evaluation by the groups of experts from the FMEA. With the above, they determine the indices of S, O, and D. By using basic mathematical operations, the method is easily applied. Previous research demonstrates the importance of integrating fuzzy logic and FMEA techniques. The most relevant characteristics of our contribution that motivate the realization of this study are as follows:
  • The modification of the centroid method is one of the main contributions of this research since it allows obtaining RPN values close to the conventional technique;
  • Likewise, when using the sigmoid function, the relationship with the factors is described, and finally, different scenarios are explored to establish the best combination of fuzzy operators;
  • In this study, the proposal of a generalizing system based on a simulation process of multiple runs is made.

3. Methodology

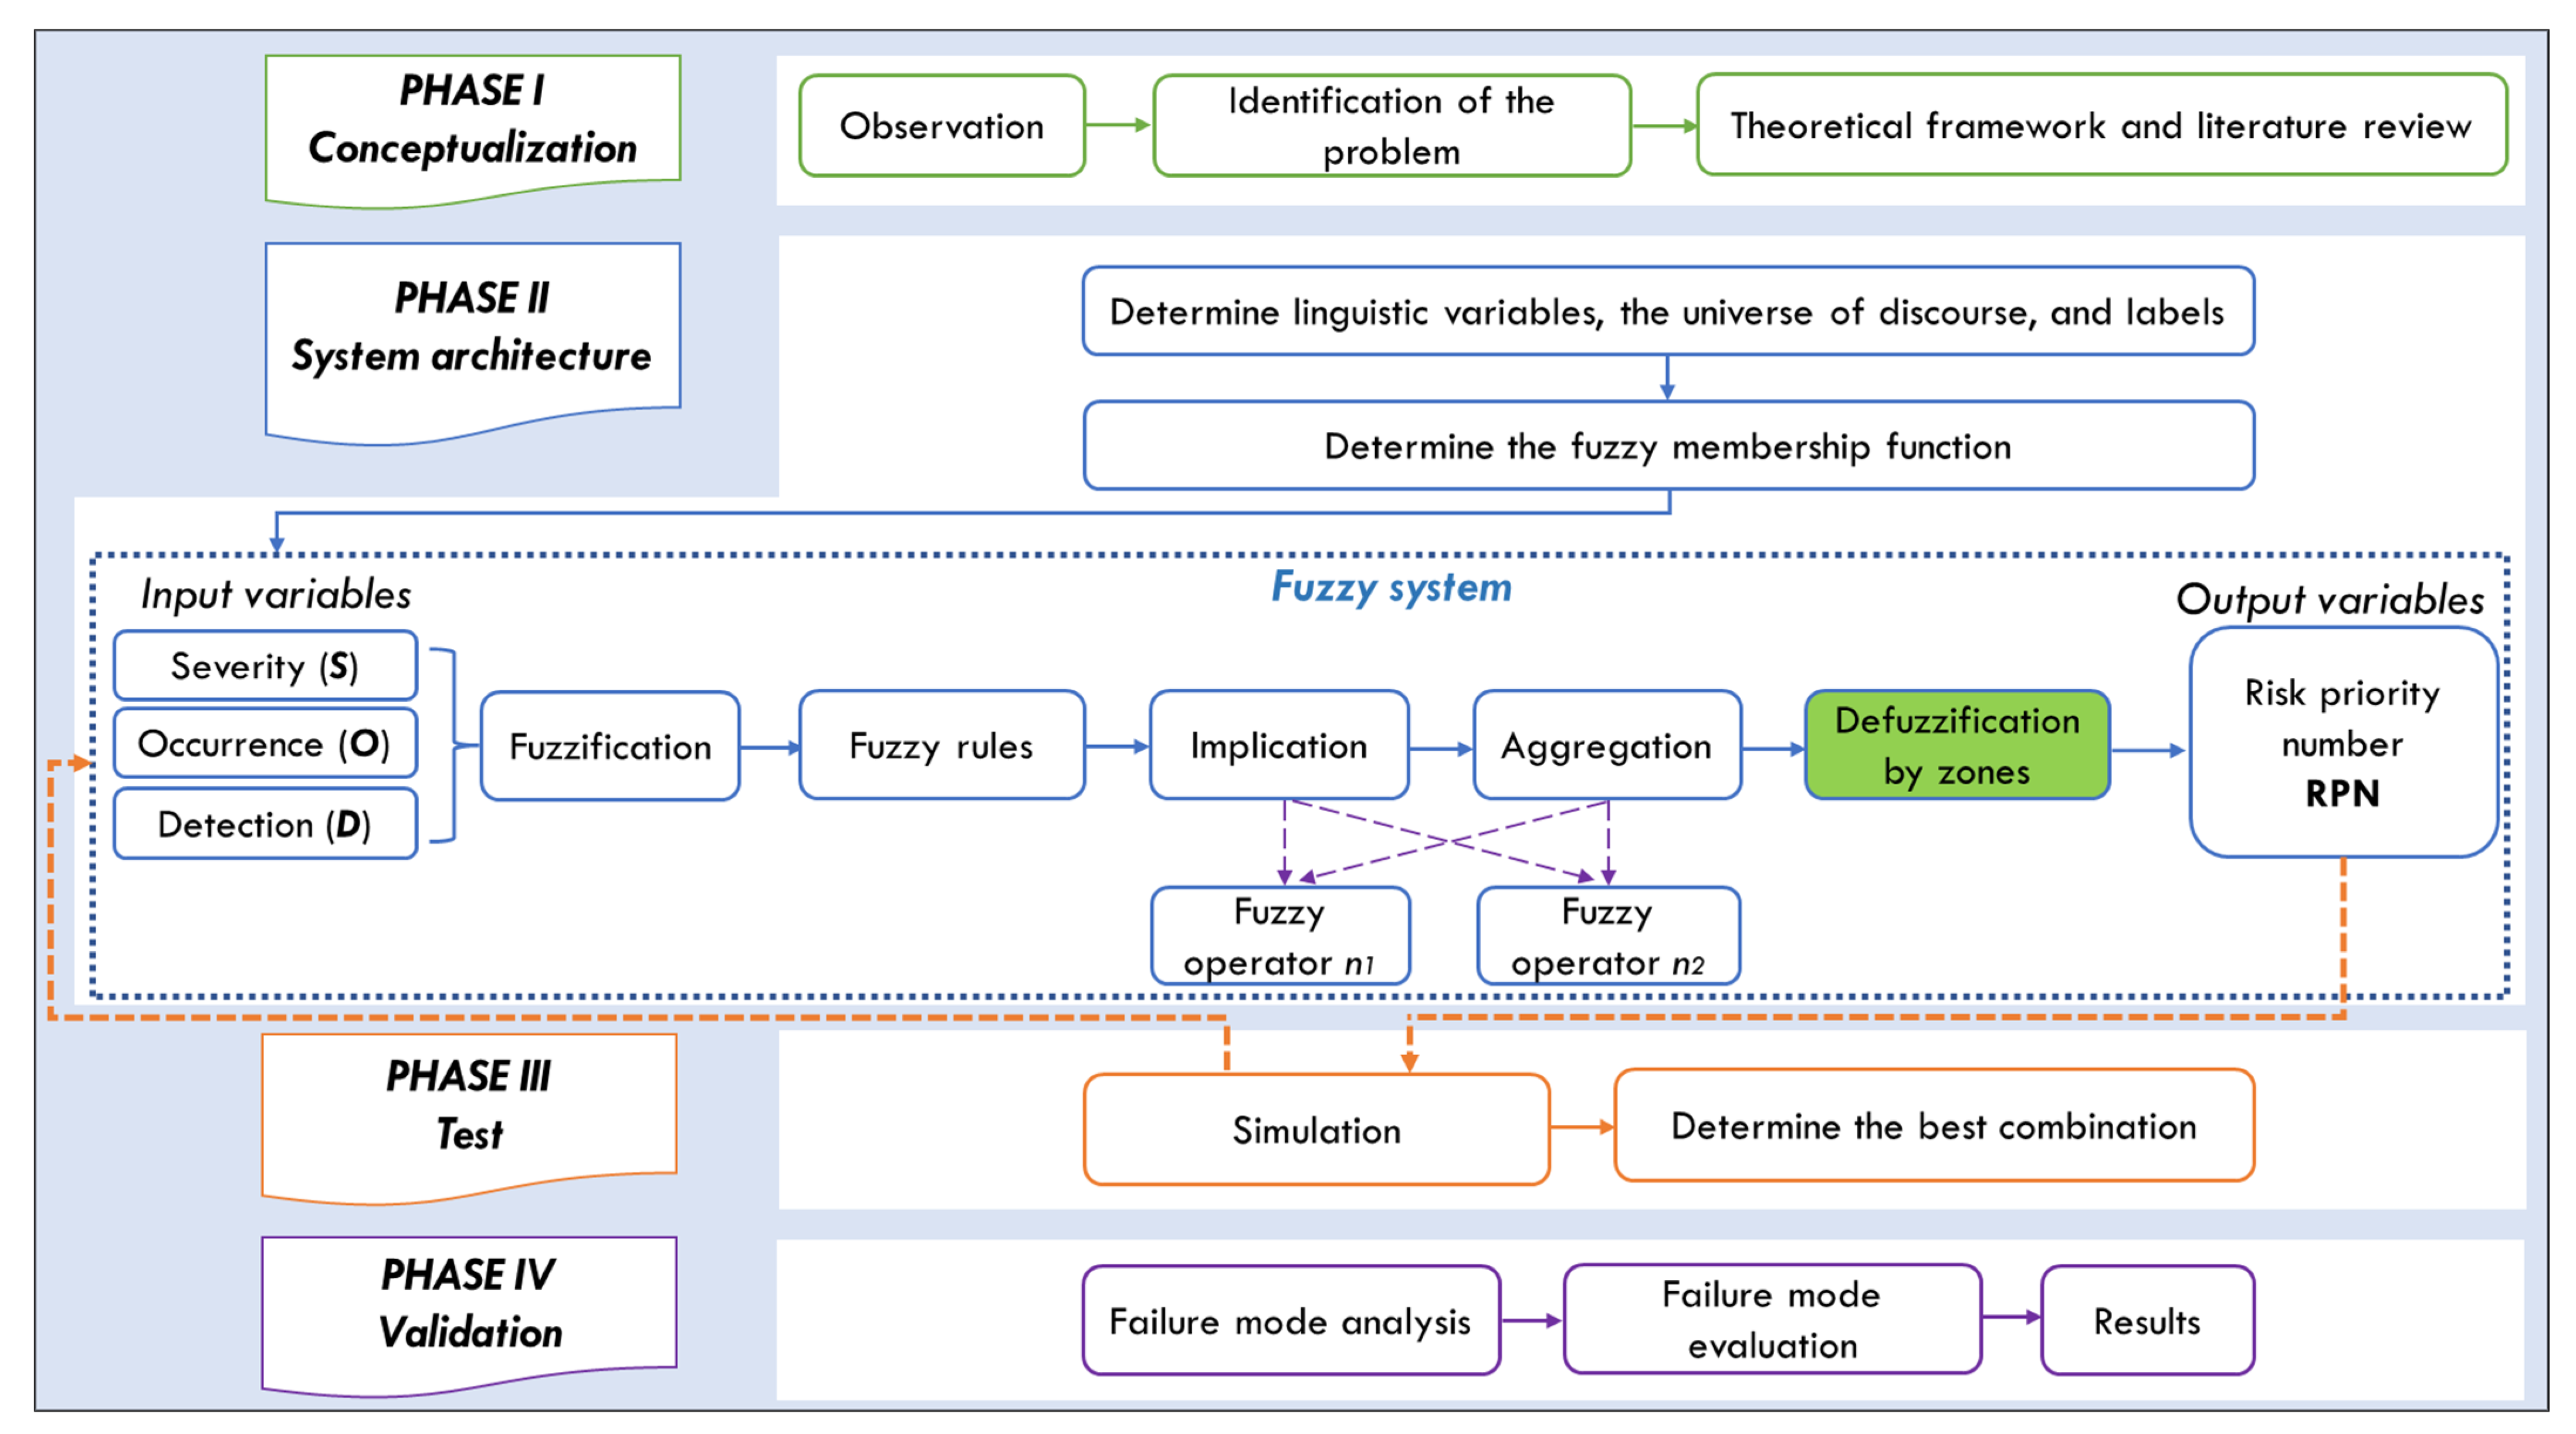
The research methodology is developed in four phases (see Figure 1). The first phase is conceptualization. From the systematic observation, the problem is raised, and the areas of opportunity are identified in the FMEA technique. In addition, the literature review of current research on FMEA and fuzzy logic was carried out. In the second phase, the architecture of the fuzzy evaluation system is carried out. In this phase, we develop the most significant contribution, mainly in the defuzzification stage (highlighted in green). This step will be explained in more detail later.
In the third phase, the fuzzy system is tested with a significant number of simulations to find the combination with the best performance. Finally, in the fourth phase, the validation of the system is developed in a company in the textile sector in the south of Guanajuato.

FMEA

The RPN is the crucial criterion for determining the priorities of the failure modes [25]. The failure mode is how a system or component could fail. The failure effect is a negative consequence. It is essential to determine the RPN accurately. This indicator is the product of three factors: the occurrence estimates the frequency with which possible failures occur. The severity assesses the impact these failures have on the system, and detection is the probability of identifying the failure before it occurs (see Equation (1)).
RPN   =   Severity   S ×   Occurrence   O ×   Detection   D
Conducting an FMEA requires a systematic six-step approach as follows:
  • Determine the scope of the FMEA and form a multidisciplinary team;
  • Analyze potential failure modes;
  • Determine the effects, causes, and controls of each failure;
  • Find the level of each factor;
  • Calculate the RPN of each mode;
  • Generate an analysis report and, where appropriate, take the recommended actions to reduce or eliminate risks;

4. Case Study

4.1. Phase I—Conceptualization

Identification of the Problem

Next, the motivation of this work is explained to offer a robust and reliable tool that integrates conditions of linguistic uncertainty to improve decision making during risk analysis. After the first steps, a critical stage is reached when evaluating the factors with which the RPN is determined. The experts perform a qualitative analysis expressing their point of view on each failure mode. Therefore, they are based on commonly used criteria, such as those presented in Table 1.
Each opinion expressed presents a degree of subjectivity and imprecision and is determined by the experience of the expert. For example, the criteria in natural language (labels) for each factor of a failure mode would be as follows: “Failure mode F n presents Hazardous Severity, has a Very Slight Occurrence, and Detection is Remote”.
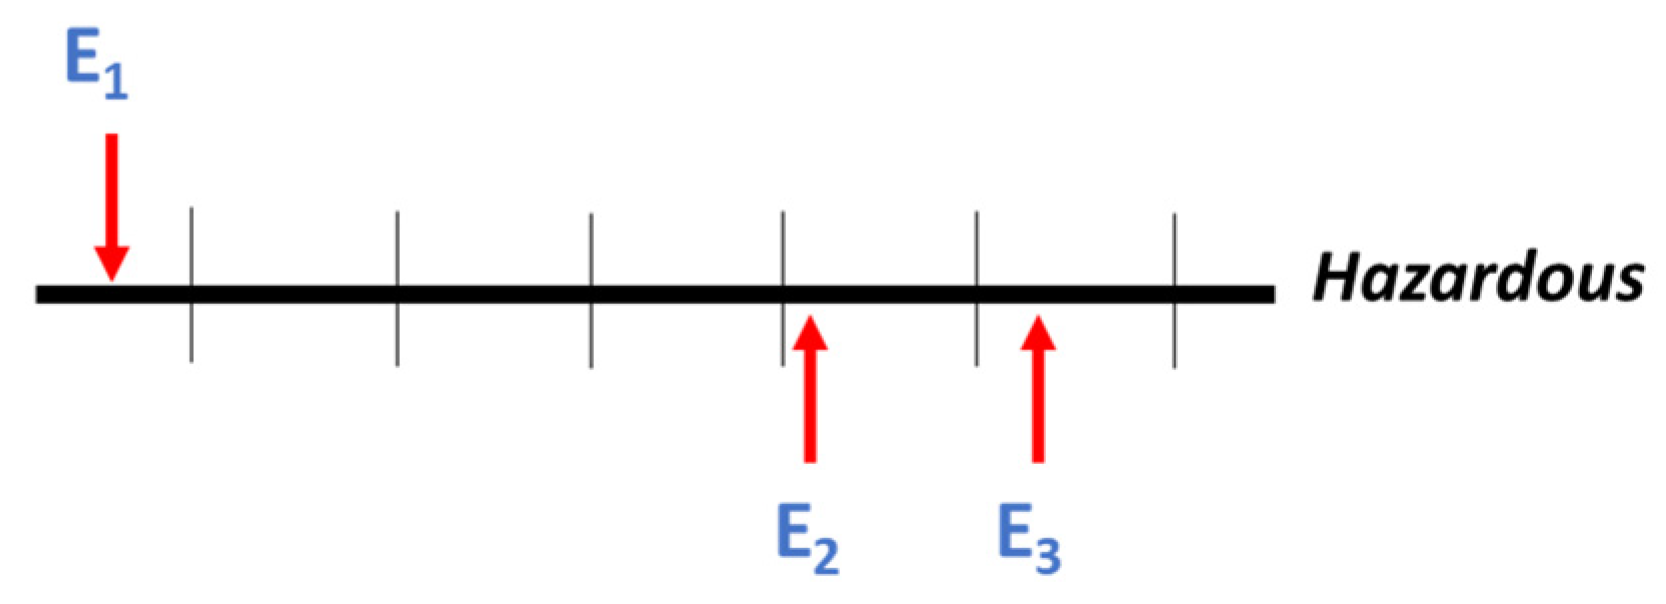
In the failure mode analysis, experts determine the criteria based on their reasoning, knowledge, and experience. The interpretation of these criteria varies from one expert to another. For example, three experts ( E 1 ,   E 2 ,   and   E 3 ) can use the same label (Hazardous). However, there is a difference in the level of meaning because they do not have an established range since it is a qualitative aspect (see Figure 2).
Another area of opportunity is that experts usually analyze many failure modes. By evaluating these failures, multiple possible combinations are formed between the criteria, generating a more complex environment during decision making. Therefore, the need arises to use fuzzy logic to treat subjective and uncertain information, proposing an approach that strengthens decision making and is a robust tool capable of emulating how experts analyze and evaluate the risks that compromise the correct operation.

4.2. Phase II—System Architecture

In this phase, the system architecture was carried out, adopting the approach of a Mamdani model. This approach offers us a tool for logical deductive inference to analyze the results of a model structure in terms of a set of “IF-THEN” rules [26].

4.2.1. Linguistic Variables

The fuzzy set theory is a mathematical tool to translate abstract concepts in natural language into computational language; it offers a way of dealing with imprecise and vague information. Fuzzy logic refers to the concept of partial truth. The μ A x = 0.0 and μ A x = 1.0 values represent, respectively, a null and complete membership of x in A , while all μ A x values between 0 and 1 indicate a partial membership of x in A [27].
Once the conceptualization phase is complete, the system architecture is developed. The first step is to determine the factors O, S, and D as input variables. The universe of discourse for each factor is in the same range commonly used in the literature (between 1 and 10). Likewise, the RPN was considered an output variable because it is the indicator of interest to prioritize failures. The universe of discourse of the RPN is [1, 1000]. This research proposes to classify the factors into three labels, concentrating on the ten criteria of Table 1 to simplify and make it easy for any decision maker without an expert to evaluate. The linguistic variables or labels were established as low (L), medium (M), and high (H).

4.2.2. Membership Function

The sigmoid membership function is used to fuzzy the input variables. This function is characterized by having an inclusion value other than 0 for a range of values above a certain point a , being 0 below a  and 1 for values greater than b . The inflection point (value 0.5) is m = a + b / 2 . Between points a and b , it is quadratic type (smooth) [28].
S x ; a , m , b = 0 x < a 2 x a b a 2 a     x     m 1 2 x b b a 2 m     x     b 1 x > b
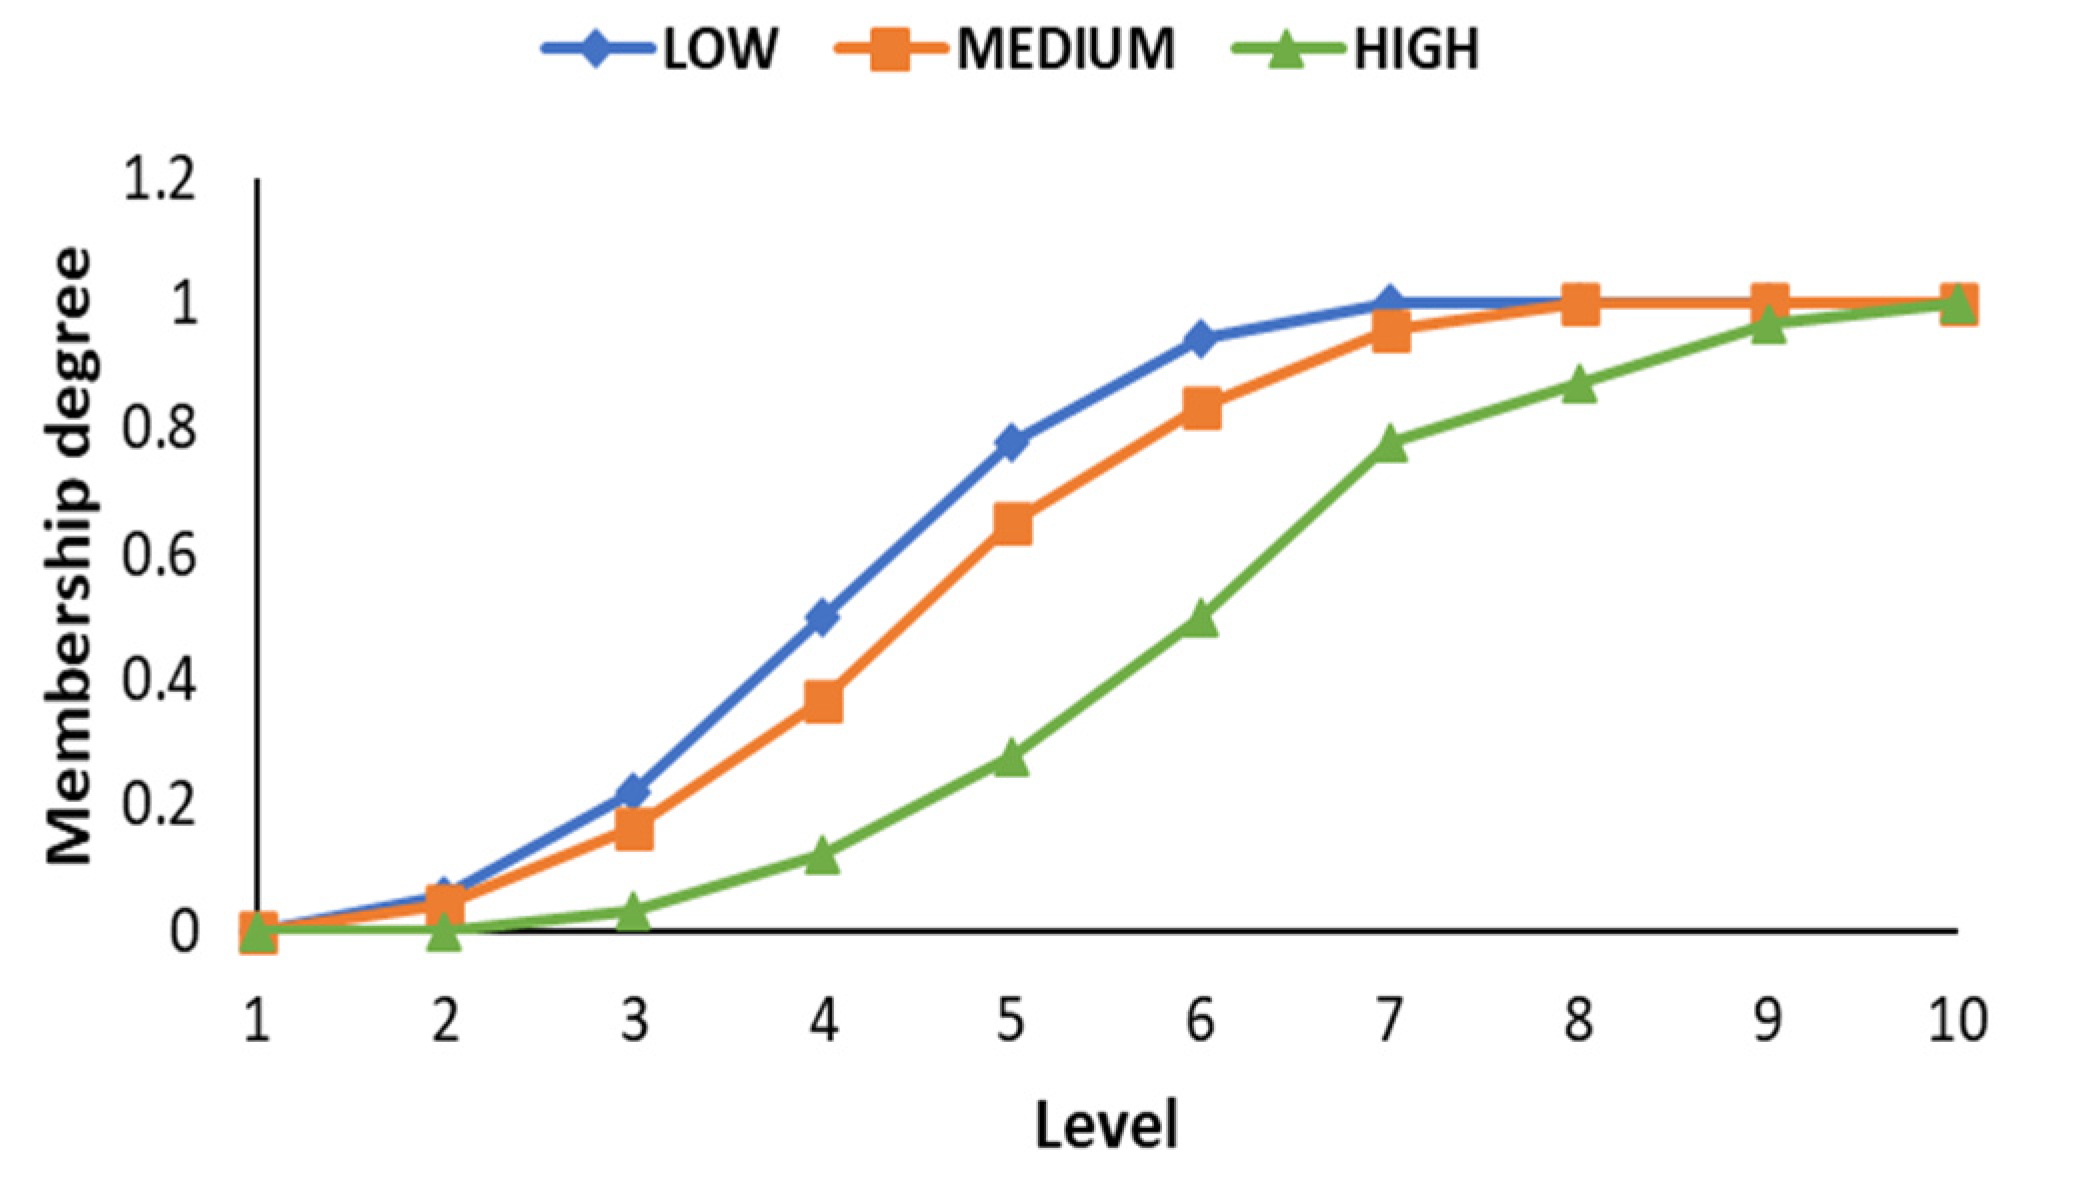
When analyzing the possible functions, it was found that the sigmoid function is the one that reflects a behavior according to the criteria in Table 1. Each factor has a different series of criteria on a qualitative rating scale with gradual growth (from level 1 to 10), where failure modes present a higher risk when the rating increases. In Figure 3, the behavior of this membership function can be observed.

4.2.3. Fuzzy System

Next, the stages that constitute the FMEA fuzzy evaluation system are presented. The fuzzification stage transforms crisp inputs into fuzzy numbers that indicate the degree of membership in the interval [0, 1]; with this, μ A x indicates that both x belong to the linguistic labels {L, M, H}. Table 2 shows the three input linguistic variables and the output variable. Likewise, the parameters a, m, and b used in the transfer function for each system variable are shown.
Next, the behavior of the membership function of each input variable is described. As shown in the graph of Figure 4, the behavior of the occurrence and severity variables agrees with the evaluation that the experts carry out since by qualifying with a higher criterion, the possibility of failure occur is also greater. Also, the higher the score in the criteria, the higher the severity of the failure.
Likewise, the graph in Figure 5a shows the behavior of the detection variable. The higher the criterion level, the lower the possibility of detecting the failure. Finally, Figure 5b shows the behavior of the output variable. The higher the level in the RPN evaluation, the greater the risk and the higher the failure priority will have to be.
After the fuzzification, the knowledge base of the system was developed. In this stage, the fuzzy rules are established that are the result of different combinations between the number of input variables and linguistic labels. Therefore, 27 rules were defined ( 3 3 ). The defined rules are of the IF–THEN type, where “IF” is the antecedent and is related to the input variables, and “THEN” is a consequent and is associated with the output variable. Each rule was operated as follows: R i : IF   x   is   A i   THEN   N i   is   y .
The rules of the fuzzy system represent in the FMEA the knowledge of the experts when evaluating the factors. In Table 3, the rules are listed in three groups [low, medium, high]. Thus, the system’s knowledge base is built.
Table 4 shows the rules grouped in the three language labels, the values of implication and aggregation, and finally, the output value in the defuzzification stage. The implication and aggregation constitute the motor of the diffuse system since they allow the interpretation of the rules that form the knowledge base and convert the values of the inputs into outputs, thus achieving a diffuse inference.
In the implication stage, the quantitative analysis is performed individually. Considering the evaluation of Table 4, the fuzzy operator for each rule (implication) was the product. For the aggregation stage, the maximum operator was used, and the quantitative analysis was carried out jointly for each of the three groups of rules; this way, a single fuzzy set is obtained for each label of the output variable. Since there are three factors of interest to obtain the RPN, only three input values are required for the evaluation. For example, an expert may perform the following assessment: Occurrence   =   8 , Detection   =   9 , and Severity   =   8 . The value of the conventional RPN = 576 . With the diffuse evaluation system, the output value is 517.391. Subsequently, the system was tested and validated with multiple runs of 200 simulations each; this is explained in more detail in Section 4.3. This allows for having a generalizing system in which any expert can reliably evaluate the failure modes.
Once the system’s output is obtained, converting the fuzzy sets into crisp values or natural numbers to facilitate the interpretation of the result and, thus, correctly prioritize the failure modes is necessary to develop the defuzzification stage. Several methods are available for this stage: weighted average, max membership principle, mean-max membership, the center of sums, the first of maxima or last of maxima, and the centroid method. The centroid method is widely used for fuzzy number defuzzification in engineering applications [29].
The centroid method is one of the most used. This method is like the arithmetic mean for frequency distributions of a given variable, with the difference that the weights are the μ A x i values, which indicate the degree of compatibility of the x i value with the concept modeled via the fuzzy set A [30] (see Equation (3)), where k is the number of fuzzy sets, x i represents the center of the fuzzy set, and μ A x i is the output of the aggregation stage of each set:
z = i = 1 k μ A x i x i i = 1 k μ A x i
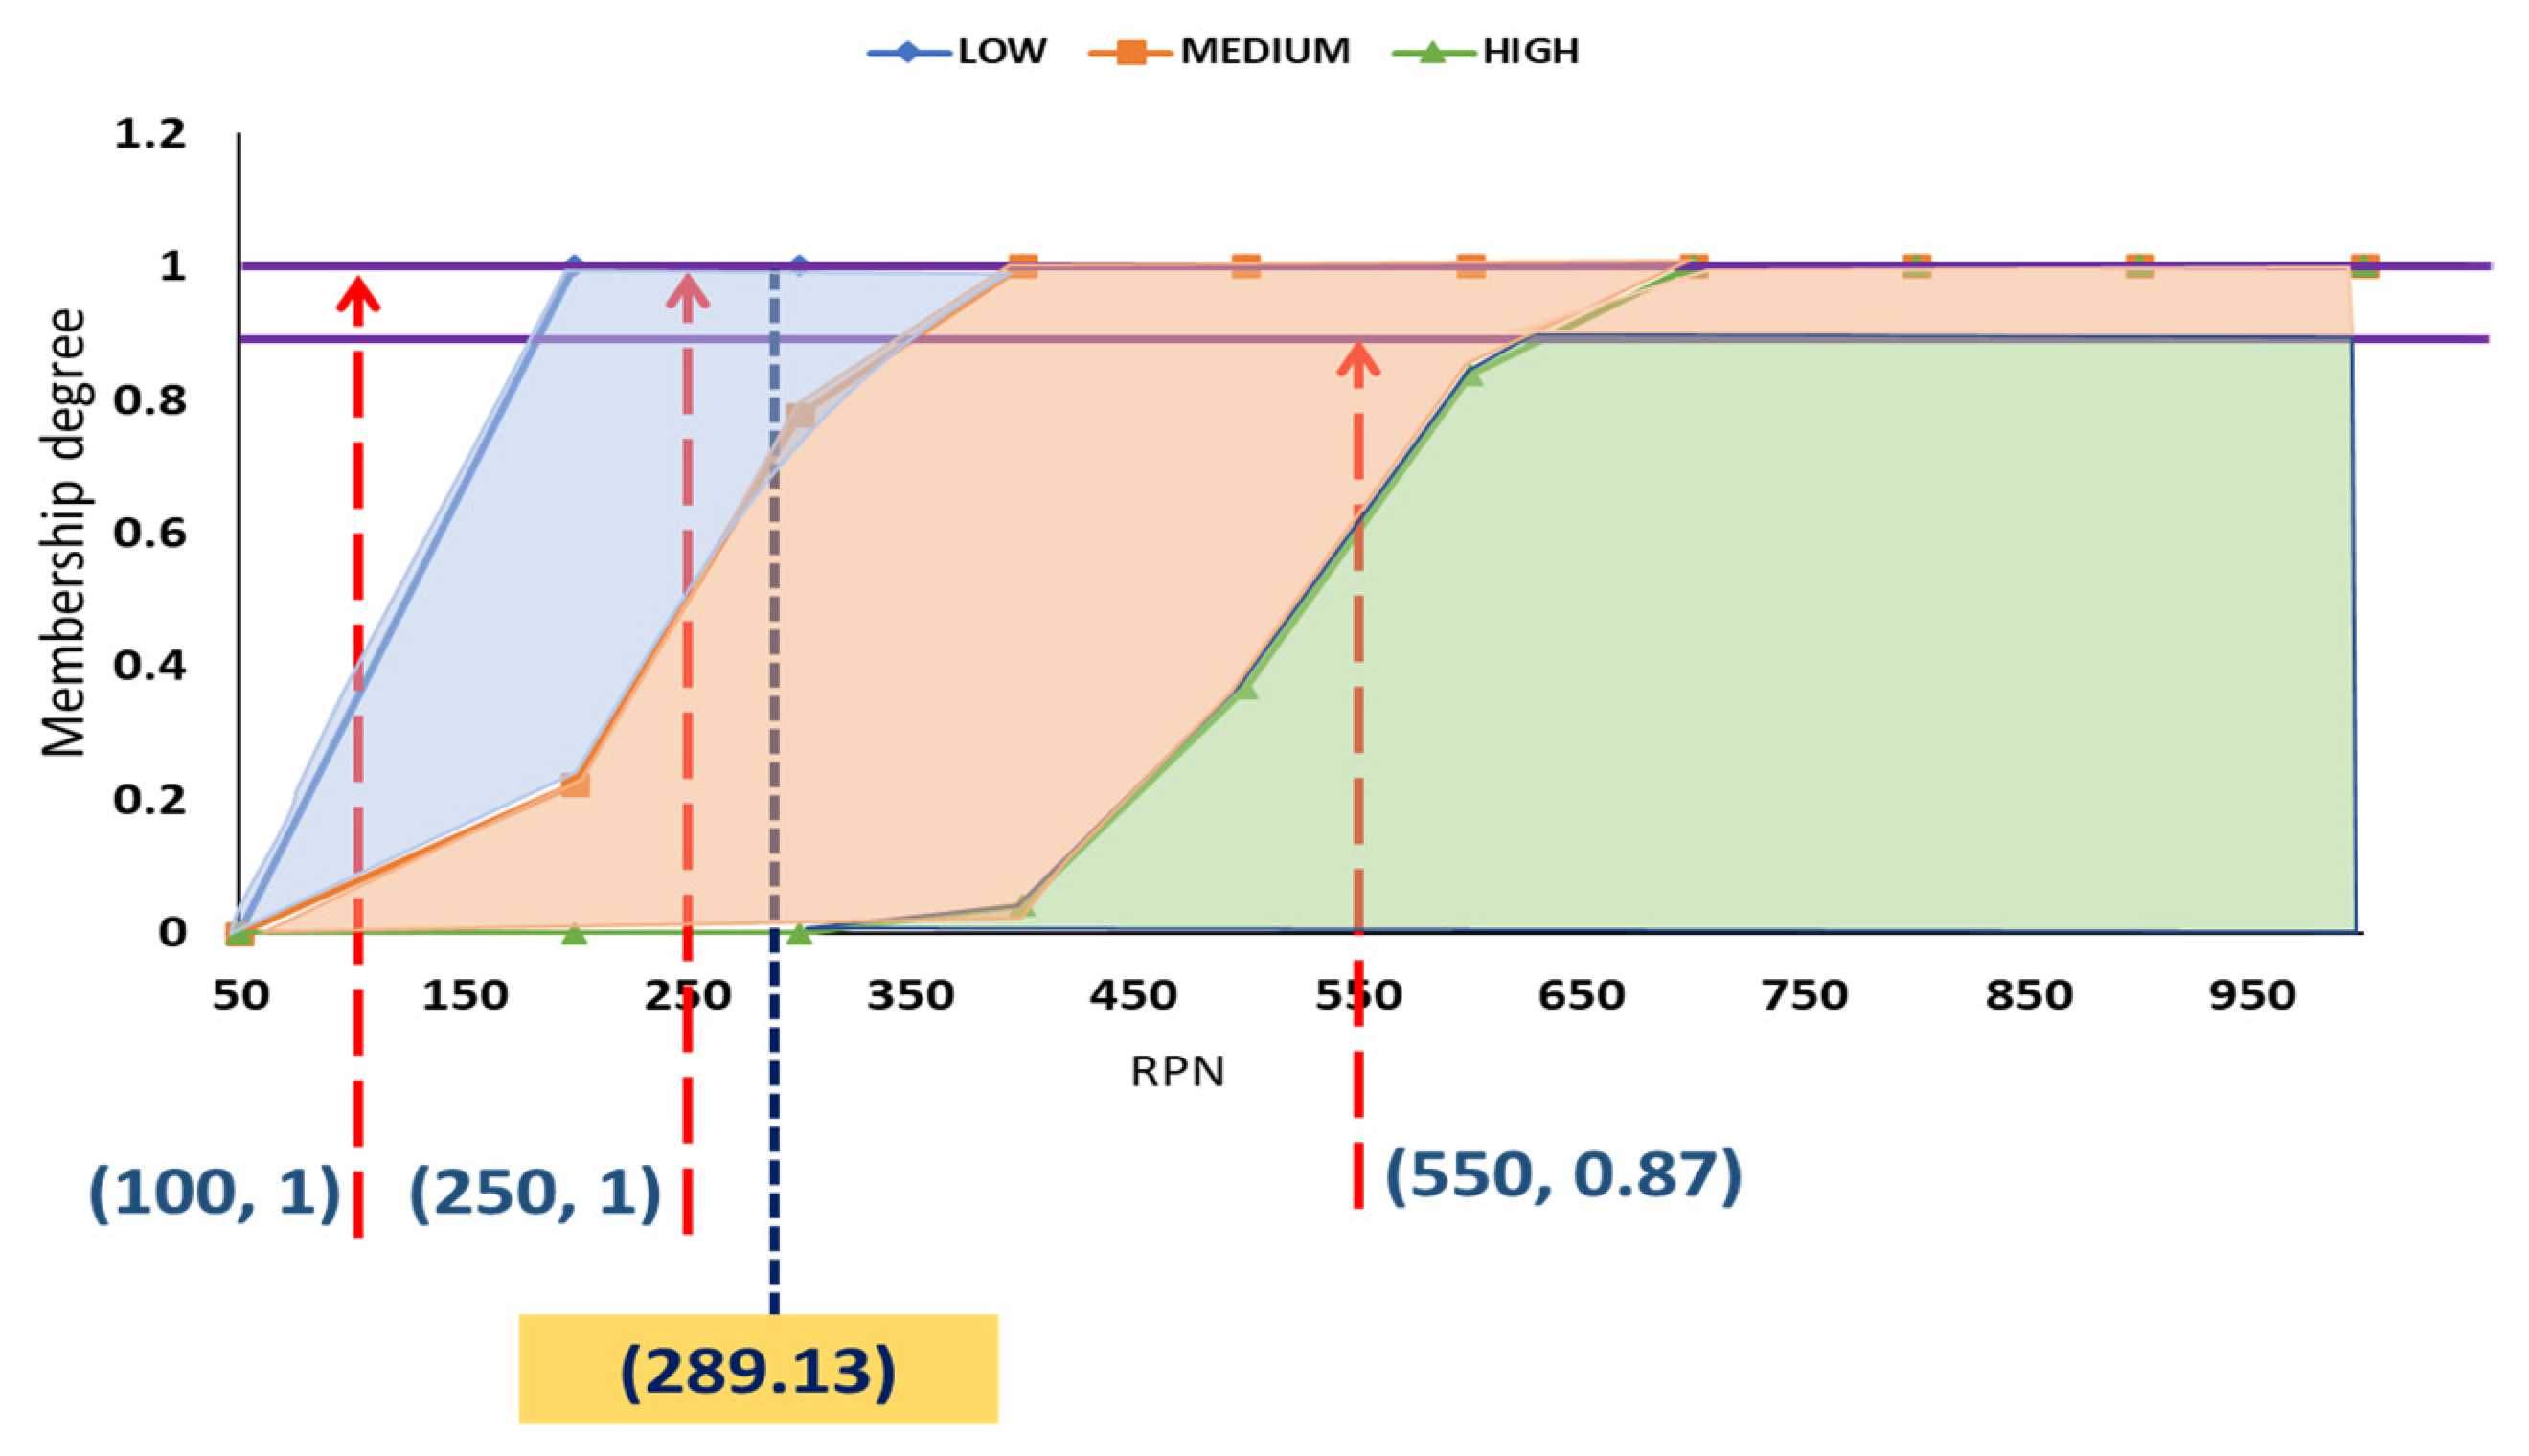
The aggregation outputs of each set are the values that horizontally segment the membership functions into two areas, the lower area being the one used to calculate the centroid. For example, to obtain the system’s output in the evaluation of Table 4, utilizing the centroid method, the product of the aggregation values (membership degree) is obtained via the inflection points of each membership function (see Equation (4)).
Z = 1 × 100 + 1 × 250 + 0.875 × 550 1 + 1 + 0.875 = 100 + 250 + 481.25 2.875 = 289.13
The centroid is located at 289.13. Therefore, the value of the output variable is NPR = 289.13 . The coordinates and position of the centroid are shown in Figure 6.
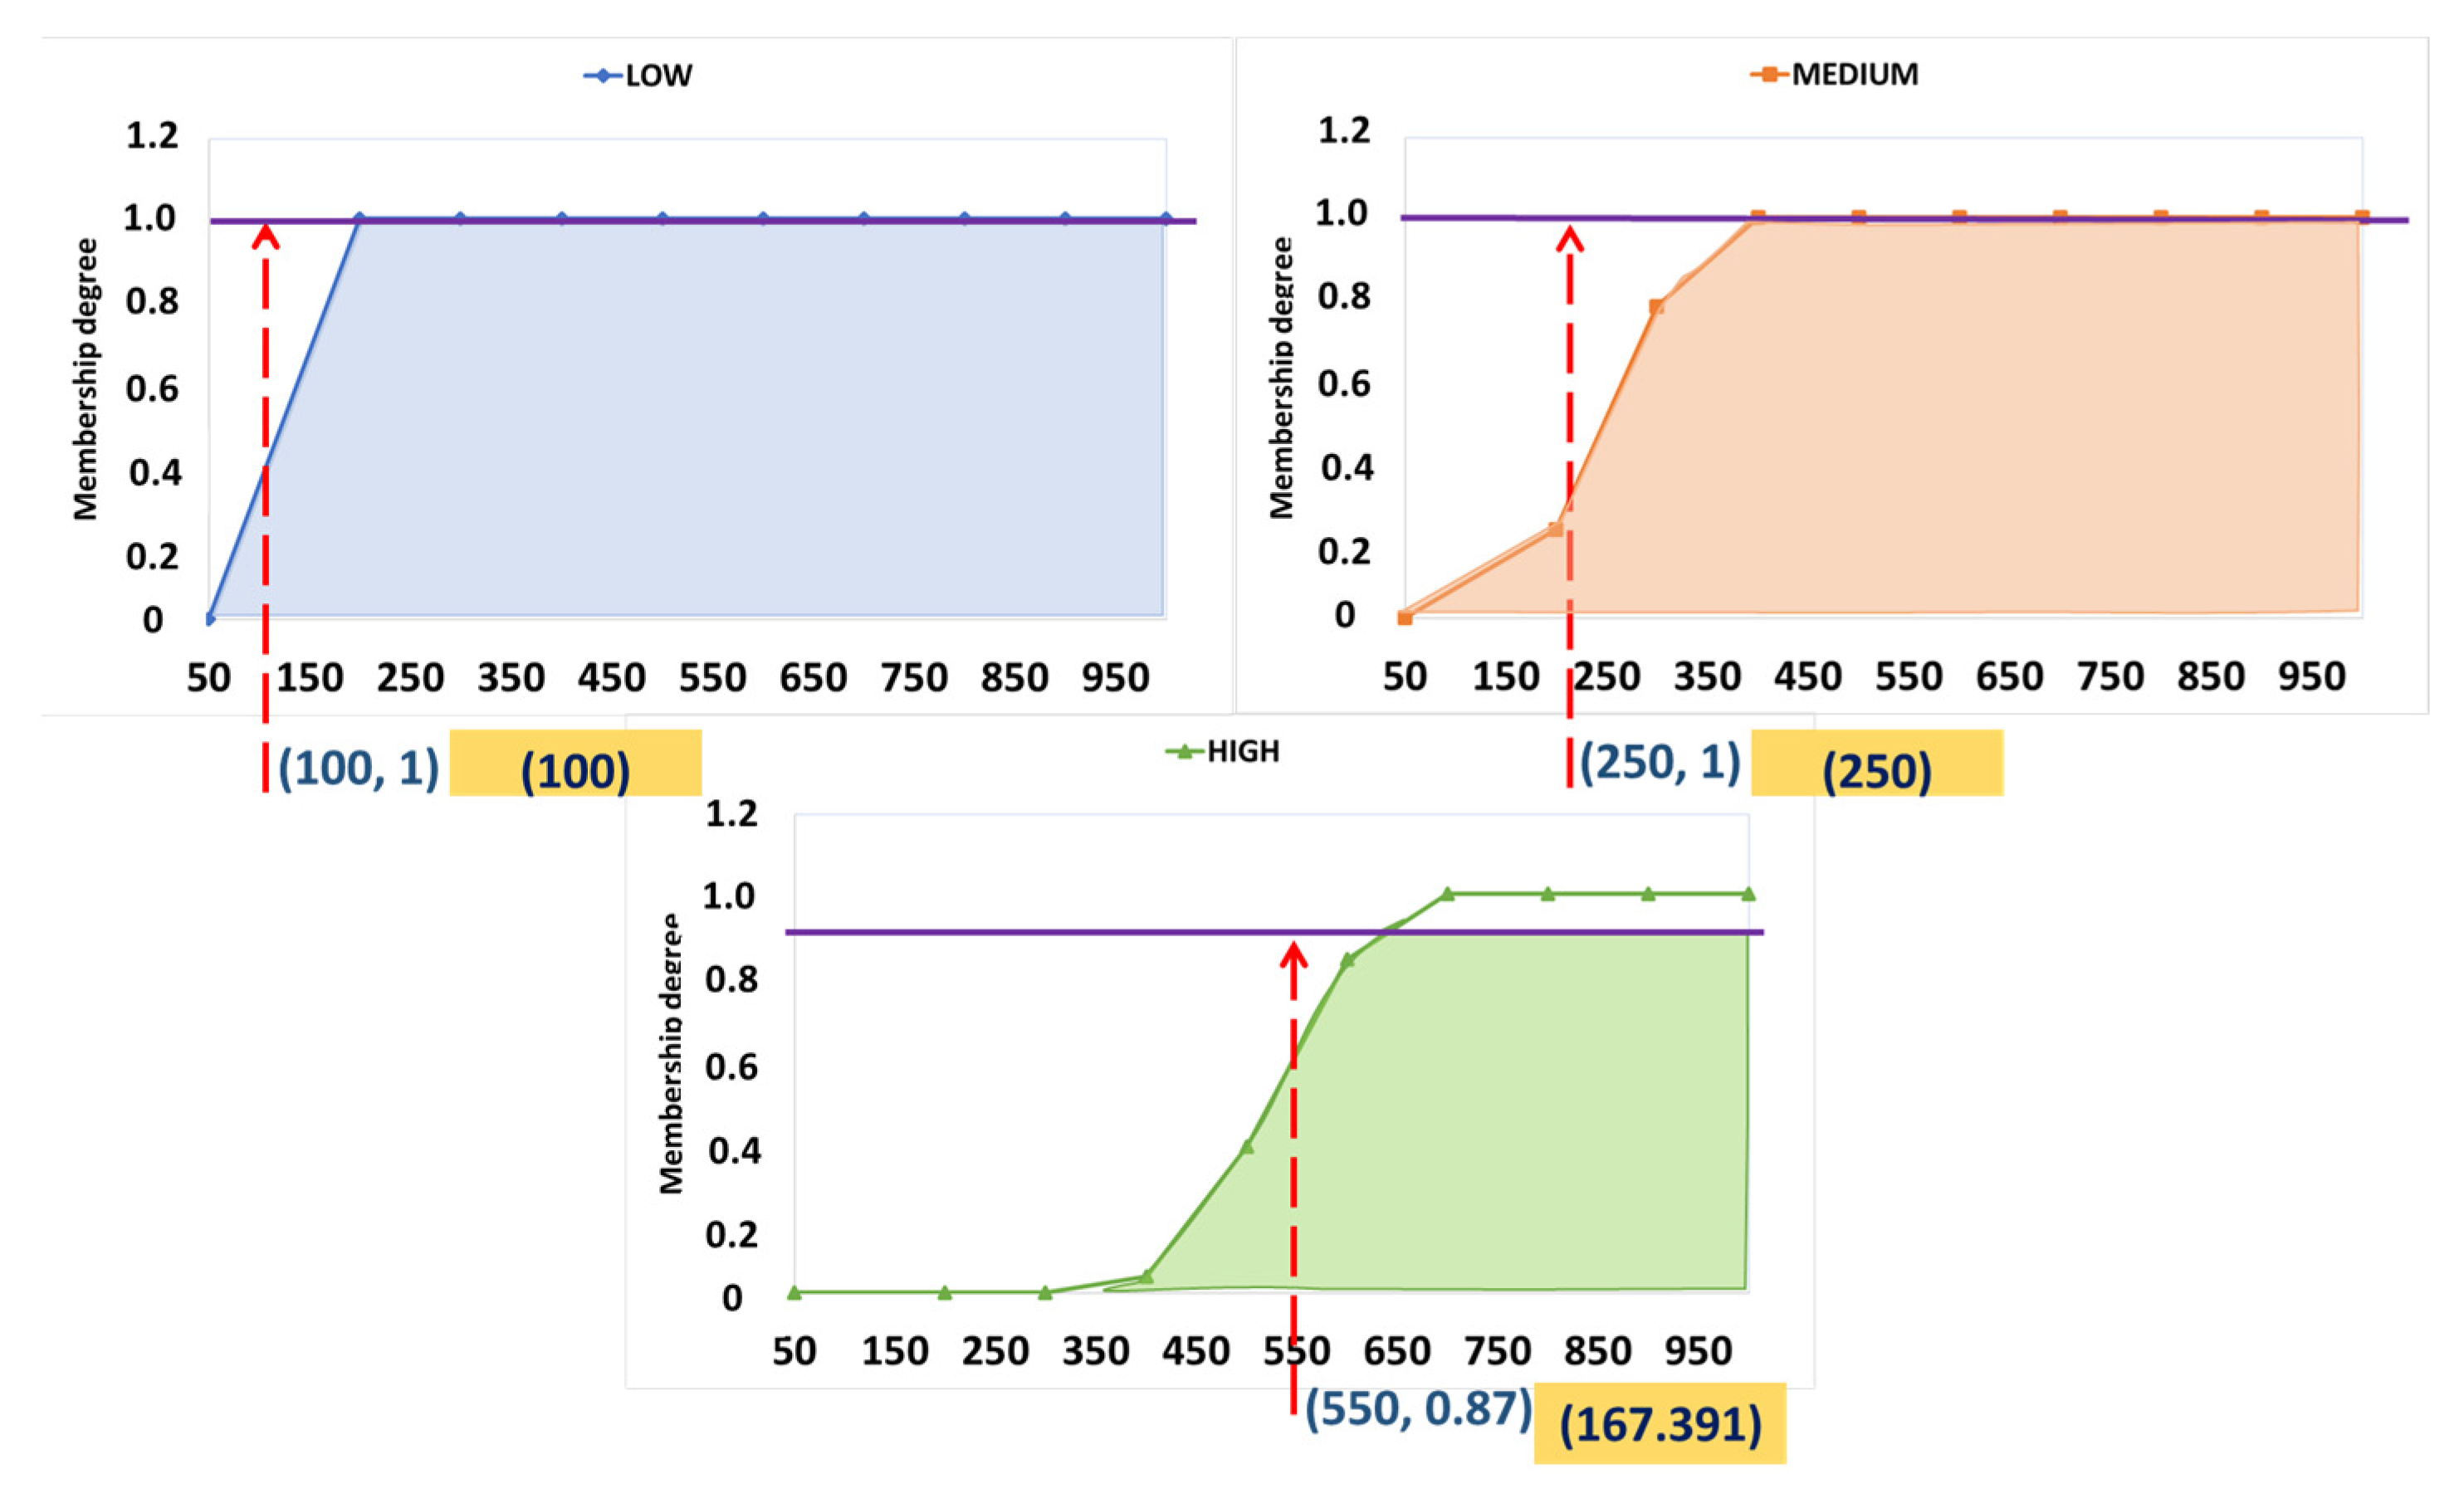
An essential contribution of this research is in the defuzzification stage. When the centroid method is used to obtain the true value of the output, the areas of each set overlap to form a single area. With this, the point where a vertical line will be located that segments the total area into two areas with equal mass is calculated. Our proposal considers each set individually (see Figure 7). In the same way, each function is cut according to its degree of membership. Initially, it was identified that the maximum values mainly come from the output variable of the fuzzy set high (H). In Equation (3), all the sets have the same importance, but the change is that the high set has higher priority since it is the one that marks the difference between the values.
Z = μ L x × x 1 + μ M x × x 2 + μ H x × x 3 μ L x + μ M x + μ H x
Unlike Equation (4), now the sum of the output values of the sets is only included in the high label (H). Thus, this set is weighted more (See Equation (5)). For each area, a point is calculated, and the value corresponding to each label is obtained. These values are added to have a broader value on the work scale. With this proposal, a z-value or NPR = 517.391 is obtained.
Z = 1 × 100 + 1 × 250 + 0.875 × 550 1 + 1 + 0.875 = 100 + 250 + 167.391 = 517.391
Thus, it is possible to contrast the result of Equations (4) and (6) with the conventional RPN   =   576 , achieving for this evaluation a value approaching between the conventional and the diffuse, confirming that with the modification of the original formula, consistent RPN values are obtained.

4.2.4. Combinations

The implication and aggregation stages are crucial. In this research, three scenarios were created using the most common fuzzy operators, as shown in Table 5.

4.3. Phase III—System Testing

4.3.1. Simulation

In the simulation stage, random numbers are generated for each factor, and the output values of the defuzzification stage are recorded. Therefore, the system was validated via this simulation process generating one hundred runs, and each run consisted of 200 iterations for each combination of operators. Figure 8 presents the results of only one run, where it is possible to compare the behavior of the system outputs with the evaluation of the conventional RPN. In the three scenarios, an approximate behavior is observed. However, It Is essential to evaluate the performance of the system.

4.3.2. Determine the Best Combination

The mean square error (MSE) indicates the best-performing combination. This metric is the most widely used evaluation criterion for model testing purposes. It quantifies the difference between the estimated and real models [31]. The objective is to establish the difference between the values of the real RPN and the values thrown via the fuzzy system. The best configuration of the system will give a lower MSE and, therefore, more closely represent how the expert evaluates. Consequently, this allows having a reliable model that supports decision making by prioritizing failure modes.
Table 5 presents the MSE value for each combination; combination three presents the best performance using the fuzzy operator (product) for implication and the operator (max) for aggregation.

4.4. Phase IV—Validation

To validate the proposed approach, an FMEA was conducted in a clothing factory in the southern region of Guanajuato, Mexico. This factory specializes in making children’s sweaters. The process begins with knitting; the canvases are obtained, which are later basted, ironed, and cut using sewing patterns. Afterward, the garment is sewn and detailed. Finally, the sweater is packed for sale to the customer. The knitting department is the most crucial area because, in this area, knitting machines are used to weave canvases that will be transformed into garments throughout the process. Therefore, the FMEA was developed to prioritize potential risks that affect the operation of the machinery and, consequently, the flow of the manufacturing process.

4.4.1. Failure Mode Analysis

A multidisciplinary team of four experts with knowledge and experience in knitting manufacturing was formed (see Table 6). The team participated in the analysis of potential failures; in addition, they identified the effects, causes, and detection controls. Each expert brought their knowledge to the problem. However, in the evaluation stage, only the specialist of each area participates. In this case, the expert E 2 was chosen because they are a specialist in the operational area and have extensive knowledge of knitting machinery.
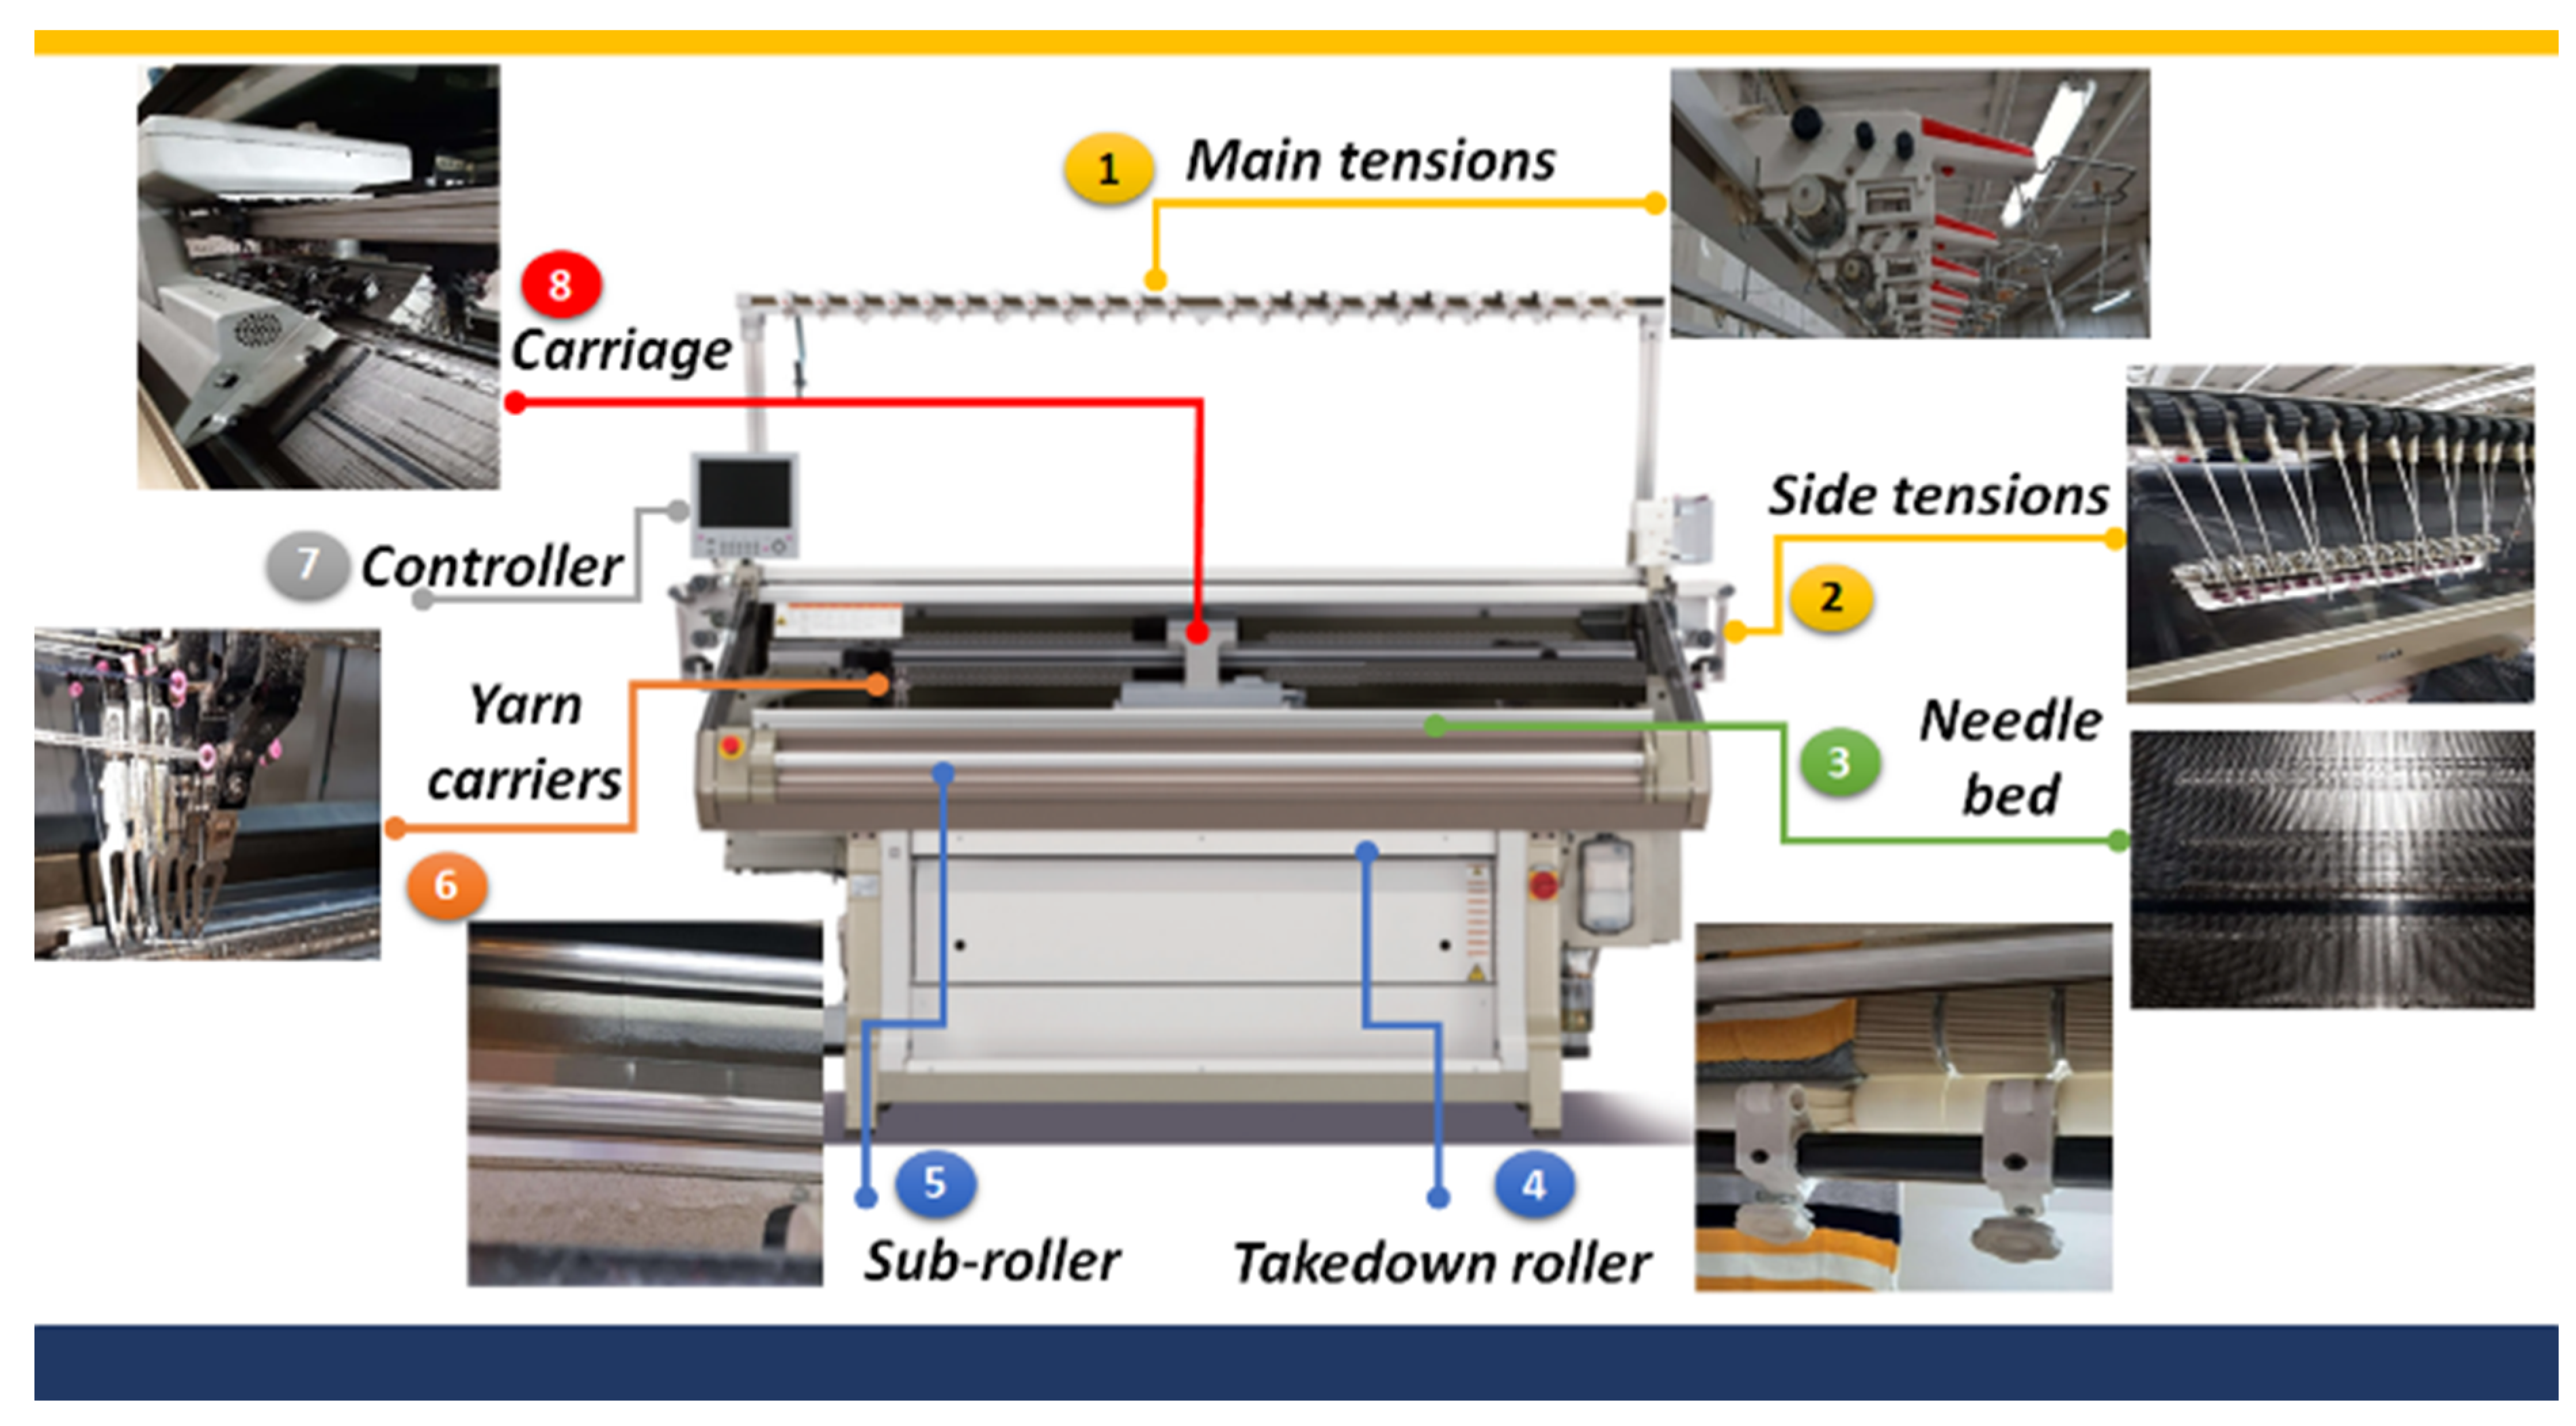
In Figure 9, the location of the subsystems of the knitting machines are shown and named as follows: (1) main tensions, (2) side tensions, (3) needle bed, (4) takedown roller, (5) sub-roller, (6) yarn carriers, (7) controller, and (8) carriage.
Based on the analysis of the components that generate the highest number of failures during the operation of the machinery, they defined eight subsystems. Derived from the analysis of the subsystems, the experts determined 33 failure modes. In addition, the effect that the failure modes cause in the system was determined, and the components were classified. This information is presented in Table 7.

4.4.2. Failure Mode Evaluation

After the development of the system was tested and validated for its operation, the expert E 2 evaluated the level of the factors. Table 8 presents each of the eight subsystems, their corresponding failure modes, as well as the evaluation with the real data that the expert assigned to the occurrence (O), detection (D), and severity (D).
In the sixth column, the product of the factor values is obtained to obtain the conventional risk priority number (RPN). The seventh column shows the diffuse risk priority number (F-RPN) obtained with the proposed evaluation system for each failure mode. Finally, in the last column, the priority of the failure modes is presented.
As can be seen, the values between the conventional and the diffuse are close. A statistical test is presented below to validate that the means of the conventional and diffuse values are close. Table 9 presents the data for the conventional RPN and diffuse F-RPN values. In addition, the parameters of each data group are shown.
Using the Minitab software, the analysis of variance was obtained to test the equality of means. Table 10 and Table 11 present the ANOVA.
A significance level of α = 0.05 is established. Since the p-value = 0.000 is less than the α significance level, there is a significant difference between the means of the RPN and F-RPN risk priority numbers without adjustment to the centroid method (see Table 10).
A significance level of α = 0.05 is established. Since the p-value = 0.946 is greater than the significance level α , no significant difference exists between the means of the RPN and F-RPN risk priority numbers (see Table 11). Therefore, this validates that the proposed approach prioritizes potential failures in most cases as the expert would.
From the results of the F-RPN, the failure modes were prioritized. The prioritization and classification will allow the failure modes to be grouped into five criticality categories (see Table 12) to carry out the necessary actions to mitigate and eliminate the potential risks that compromise the operation of the knitting machinery.
The results of Table 8 show that the priority failure modes with the highest risk include the following: F 2 (small knot) as Category 1 and F 1 (large knot), F 24 (inactive fan), F 28 (wear brush) as Category 2. These four failure modes generate machine stoppages, affecting the regular operation of the machinery. Furthermore, these failures affect the quality of the canvases, generating defects in the loops’ formation and the essential structural parameter (stitch graduation). In addition, overheating the electronic card would affect the entire system. Identifying failure modes belonging to the first and second categories allows the team of experts to focus efforts on establishing actions that reduce the probability of occurrence of critical failures to mitigate and eliminate the associated causes.
Figure 10 compares the RPN and the approach proposed in this research (F-RPN). As can be seen, by prioritizing the failure modes, the result of the evaluation with the fuzzy system presents a behavior like that of the conventional technique.
The proposal’s main objective is to have a method that gives us an approximate value to the conventional method based on a robust mathematical model. In graph (b) of Figure 10, the modification of the centroid method is not used as proposed in this study. Therefore, the values of the system are not approximated to the values of the conventional RPN.

5. Discussion

At present, the prioritization and risk analysis with the FMEA technique have become more relevant, and proof of this is the studies that try to overcome the inherent limitations of the method. Risk assessment systems have been proposed in the literature from various approaches. The fuzzy approach is one of the most used, and even integrating it with other techniques forms novel tools. In this research, a fuzzy system was developed to evaluate failure modes to offer a robust tool capable of emulating how an expert in their area of expertise evaluates the risks that limit the operation of a system or process. The evaluation system is based on the Mamdani-type model, where the inference rules allow us to transfer the knowledge of the experts to a mathematical model and strengthen decision making.
The implications of this present study are in the theoretical and practical aspects. First, a four-phase methodology is offered in the theoretical aspect, in which FMEA steps and the development of a fuzzy system are incorporated. The most relevant contribution of this research that adds value to the literature focuses on the fuzzy system, specifically in the defuzzification stage. One of the most widely used defuzzification methods in fuzzy systems is the centroid method, where the zones of each fuzzy set overlap to form a single zone. Then, the point where a vertical line divides the set into two zones with equal mass is calculated. In this study, a modification of the centroid method is proposed, where the zones that represent the fuzzy sets are treated individually, obtaining a value in each zone; the zone of the highest set is the one of most significant interest because it is the one that marks the difference between the scales of the values and that, when added together, give us the output value. This modification makes it possible to approximate the fuzzy system’s values to the conventional technique’s values. In addition, when statistically validating the results, it is confirmed that the modification allows a good approximation, as shown in the graphs of Figure 10, where it is visualized how the proposed method best approximates the data.
The second relevant aspect is the practical aspect of the proposed approach. Offering a fuzzy evaluation system with an output value that is the F-RPN metric is essential. In a conventional FMEA environment, the RPN metric is obtained directly from the algebraic product of the three factors (O, D, and S). A central feature is the ease of calculation and straightforward interpretation. However, the F-RPN metric is derived from a robust mathematical model that integrates linguistic uncertainty conditions. Trying to approximate the results of the system to the traditional metric allows for preserving a simple interpretation.
Some limitations to consider are the fact that it is necessary to incorporate group decision-making techniques into the proposed system, where a more significant number of specialists in the area participate in evaluating failure modes, incorporate methods of comparison by pairs, consensus, and test the consistency in the opinions of the experts. Future work is contemplated to determine the factors with probability distribution functions to obtain information with a stochastic basis and integrate them into the fuzzy system. In addition, in future work, it is contemplated to develop grouped fuzzy systems and integrate expert consistency tests to reduce subjectivity in evaluating failure modes.

6. Conclusions

FMEA is undoubtedly a simple but helpful technique for people involved in risk analysis. The role of experts was central in this work. The methodology was built to strengthen this technique and offer a tool that emulates how experts evaluate failure modes. In the Type-I fuzzy system, the conditions of imprecision and subjectivity were integrated to give way to a model with a mathematical basis compared to the alternative of solely qualitative analysis.
From the knowledge of the experts, the multidisciplinary team, and how they evaluate the factors, the knowledge base based on 27 fuzzy rules was formed. The sigmoid membership function was used, checking that the relationship and behavior are related to the criteria for each factor. With the defuzzification of each set individually and giving greater importance to the high set, RPN values close to the conventional technique were obtained. This aspect was achieved by modifying the centroid method, the main proposal of this research. Creating scenarios in the implication and aggregation stages and the simulation process made it possible to establish the best structure of the fuzzy system. The validation in a textile sector company allows concluding that the fuzzy evaluation system is consistent and reliable for decision making during the failure mode and effect analysis.
By determining the priorities in the knitting machinery, it is possible to focus material, human, and financial resources on the failures that cause instability in the operations of the knitting area. The most important benefit of the proposed approach is having a system that generalizes adequately, with which any expert can perform the evaluation reliably.
Author Contributions

Conceptualization, R.B.-S.; methodology, J.J.C.-O. and R.B.-S.; validation, J.J.C.-O. and R.B.-S.; formal analysis, R.B.-S.; investigation, J.J.C.-O.; resources, J.J.C.-O.; data curation, J.J.C.-O. and R.B.-S.; writing—original draft preparation, J.J.C.-O. and R.B.-S.; writing—review and editing, J.J.C.-O. and R.B.-S. All authors have read and agreed to the published version of the manuscript.

Funding

This research received no external funding.

Informed Consent Statement

Not applicable.

Data Availability Statement

The data presented in this study are available on request from the corresponding author.

Conflicts of Interest

The authors declare no conflict of interest.

References

  1. Rezaee, M.J.; Yousefi, S.; Valipour, M.; Dehdar, M.M. Risk Analysis of Sequential Processes in Food Industry Integrating Multi-Stage Fuzzy Cognitive Map and Process Failure Mode and Effects Analysis. Comput. Ind. Eng. 2018, 123, 325–337. [Google Scholar] [CrossRef]
  2. Ghoushchi, S.J.; Yousefi, S.; Khazaeili, M. An Extended FMEA Approach Based on the Z-MOORA and Fuzzy BWM for Prioritization of Failures. Appl. Soft Comput. 2019, 81, 105505. [Google Scholar] [CrossRef]
  3. Liu, H.-C.; Chen, X.-Q.; Duan, C.-Y.; Wang, Y.-M. Failure Mode and Effect Analysis Using Multi-Criteria Decision-Making Methods: A Systematic Literature Review. Comput. Ind. Eng. 2019, 135, 881–897. [Google Scholar] [CrossRef]
  4. Huang, J.; You, J.-X.; Liu, H.-C.; Song, M.-S. Failure Mode and Effect Analysis Improvement: A Systematic Literature Review and Future Research Agenda. Reliab. Eng. Syst. Saf. 2020, 199, 106885. [Google Scholar] [CrossRef]
  5. Wan, C.; Yan, X.; Zhang, D.; Qu, Z.; Yang, Z. An Advanced Fuzzy Bayesian-Based FMEA Approach for Assessing Maritime Supply Chain Risks. Transp. Res. Part E Logist. Transp. Rev. 2019, 125, 222–240. [Google Scholar] [CrossRef]
  6. Li, H.; Liang, M.; Zhang, C.; Cao, Y. Risk Evaluation of Water Environmental Treatment PPP Projects Based on the Intuitionistic Fuzzy MULTIMOORA Improved FMEA Method. Systems 2022, 10, 163. [Google Scholar] [CrossRef]
  7. Ivančan, J.; Lisjak, D. New FMEA Risks Ranking Approach Utilizing Four Fuzzy Logic Systems. Machines 2021, 9, 292. [Google Scholar] [CrossRef]
  8. Jin, G.; Meng, Q.; Feng, W. Optimization of Logistics System with Fuzzy FMEA-AHP Methodology. Processes 2022, 10, 1973. [Google Scholar] [CrossRef]
  9. Bognár, F.; Benedek, P. A Novel AHP-PRISM Risk Assessment Method—An Empirical Case Study in a Nuclear Power Plant. Sustainability 2022, 14, 11023. [Google Scholar] [CrossRef]
  10. Dağsuyu, C.; Göçmen, E.; Narlı, M.; Kokangül, A. Classical and Fuzzy FMEA Risk Analysis in a Sterilization Unit. Comput. Ind. Eng. 2016, 101, 286–294. [Google Scholar] [CrossRef]
  11. Ahn, J.; Noh, Y.; Park, S.H.; Choi, B.I.; Chang, D. Fuzzy-Based Failure Mode and Effect Analysis (FMEA) of a Hybrid Molten Carbonate Fuel Cell (MCFC) and Gas Turbine System for Marine Propulsion. J. Power Sources 2017, 364, 226–233. [Google Scholar] [CrossRef]
  12. Khuankrue, I.; Kumeno, F.; Ohashi, Y.; Tsujimura, Y. Improving Fuzzy FMEA Model for Student Projects; IEEE: Otsu, Japan, 2017; pp. 1–6. [Google Scholar]
  13. De Aguiar, J.; Scalice, R.K.; Bond, D. Using Fuzzy Logic to Reduce Risk Uncertainty in Failure Modes and Effects Analysis. J. Braz. Soc. Mech. Sci. Eng. 2018, 40, 516. [Google Scholar] [CrossRef]
  14. Zúñiga, A.A.; Fernandes, J.F.P.; Costa Branco, P.J. A Fuzzy-Based Failure Modes and Effects Analysis (FMEA) in Smart Grids. In Information Technology and Systems; Rocha, Á., Ferrás, C., Paredes, M., Eds.; Advances in Intelligent Systems and Computing; Springer International Publishing: Cham, Switzerland, 2019; Volume 918, pp. 507–516. [Google Scholar] [CrossRef]
  15. Soltanali, H.; Rohani, A.; Abbaspour-Fard, M.H.; Parida, A.; Farinha, J.T. Development of a Risk-Based Maintenance Decision Making Approach for Automotive Production Line. Int. J. Syst. Assur. Eng. Manag. 2020, 11, 236–251. [Google Scholar] [CrossRef]
  16. Balaraju, J.; Govinda Raj, M.; Murthy, C.S. Fuzzy-FMEA Risk Evaluation Approach for LHD Machine-A Case Study. J. Sustain. Min. 2019, 18, 257–268. [Google Scholar] [CrossRef]
  17. Gupta, G.; Mishra, R.P. Comparative Analysis of Traditional and Fuzzy FMECA Approach for Criticality Analysis of Conventional Lathe Machine. Int. J. Syst. Assur. Eng. Manag. 2020, 11, 379–386. [Google Scholar] [CrossRef]
  18. Gupta, G.; Ghasemian, H.; Janvekar, A.A. A Novel Failure Mode Effect and Criticality Analysis (FMECA) Using Fuzzy Rule-Based Method: A Case Study of Industrial Centrifugal Pump. Eng. Fail. Anal. 2021, 123, 105305. [Google Scholar] [CrossRef]
  19. Safari, H.; Faraji, Z.; Majidian, S. Identifying and Evaluating Enterprise Architecture Risks Using FMEA and Fuzzy VIKOR. J. Intell. Manuf. 2016, 27, 475–486. [Google Scholar] [CrossRef]
  20. Xu, K.; Tang, L.C.; Xie, M.; Ho, S.L.; Zhu, M.L. Fuzzy Assessment of FMEA for Engine Systems. Reliab. Eng. Syst. Saf. 2002, 75, 17–29. [Google Scholar] [CrossRef]
  21. Ahmed, S.; Gu, X.-C. Accident-Based FMECA Study of Marine Boiler for Risk Prioritization Using Fuzzy Expert System. Results Eng. 2020, 6, 100123. [Google Scholar] [CrossRef]
  22. Guimarães, A.C.F.; Lapa, C.M.F. Fuzzy FMEA Applied to PWR Chemical and Volume Control System. Prog. Nucl. Energy 2004, 44, 191–213. [Google Scholar] [CrossRef]
  23. Subramanian, R.; Taterh, S.; Singh, D.; Lee, H.-N. Efficient Fine Tuned Trapezoidal Fuzzy-Based Model for Failure Mode Effect Analysis Risk Prioritization. IEEE Access 2022, 10, 50037–50046. [Google Scholar] [CrossRef]
  24. Kulcsár, E.; Csiszér, T.; Abonyi, J. Pairwise Comparison Based Failure Mode and Effects Analysis (FMEA). MethodsX 2020, 7, 101007. [Google Scholar] [CrossRef]
  25. Jiang, W.; Xie, C.; Zhuang, M.; Tang, Y. Failure Mode and Effects Analysis Based on a Novel Fuzzy Evidential Method. Appl. Soft Comput. 2017, 57, 672–683. [Google Scholar] [CrossRef]
  26. Ribas, J.R.; Severo, J.C.R.; Guimarães, L.F.; Perpetuo, K.P.C. A Fuzzy FMEA Assessment of Hydroelectric Earth Dam Failure Modes: A Case Study in Central Brazil. Energy Rep. 2021, 7, 4412–4424. [Google Scholar] [CrossRef]
  27. Caponetti, L.; Castellano, G. Basics of Fuzzy Logic. In Fuzzy Logic for Image Processing; SpringerBriefs in Electrical and Computer Engineering; Springer International Publishing: Cham, Switzerland, 2017; pp. 39–52. [Google Scholar] [CrossRef]
  28. Del Brío, B.M.; Sanz Molina, A. Redes Neuronales y Sistemas Borrosos; Ra-Ma S.A. Editorial y Publicaciones: Madrid, Spain, 2006; Volume 1. [Google Scholar]
  29. Kabir, S.; Papadopoulos, Y. A Review of Applications of Fuzzy Sets to Safety and Reliability Engineering. Int. J. Approx. Reason. 2018, 100, 29–55. [Google Scholar] [CrossRef]
  30. De Barros, L.C.; Bassanezi, R.C.; Lodwick, W.A. A First Course in Fuzzy Logic, Fuzzy Dynamical Systems, and Biomathematics; Studies in Fuzziness and Soft Computing; Springer: Berlin/Heidelberg, Germany, 2017; Volume 347. [Google Scholar] [CrossRef]
  31. Jiménez-López, F.R.; Pardo-Beainy, C.E.; Gutiérrez-Cáceres, E.A. Adaptive Filtering Implemented over TMS320c6713 DSP Platform for System Identification. Iteckne 2014, 11, 157–171. [Google Scholar] [CrossRef] [Green Version]
Figure 1. Research methodology.
Systems 11 00348 g001
Figure 2. Expert criteria.
Systems 11 00348 g002
Figure 3. Sigmoid function.
Systems 11 00348 g003
Figure 4. Occurrence and Severity variables.
Systems 11 00348 g004
Figure 5. (a) Detection variable; (b) RPN variable.
Systems 11 00348 g005
Figure 6. Location of the centroid.
Systems 11 00348 g006
Figure 7. Areas of each fuzzy set.
Systems 11 00348 g007
Figure 8. The behavior of the combinations: (a) min–min; (b) min–max; (c) product–max.
Systems 11 00348 g008
Figure 9. Subsystems.
Systems 11 00348 g009
Figure 10. Comparison of the (a) modification of centroid method and (b) centroid method.
Systems 11 00348 g010
Table 1. Evaluation criteria.
Factors
RatingSeverityOccurrenceDetectionEvaluation Criteria
1NoneVery remoteAlmost certainNo effect for the system.
2MinimumRemoteVery highMinor effects on systems and products.
3MinorVery minorMajorThe system operates with few failures.
4Very lowMinorReasonably highThe system operates with some faults.
5LowLowModerateFailures with quick repair and minor impacts.
6ModerateModerateMediumThe system requires changing parts with significant effects.
7HighModerate highReasonably lowDirect effect on the system, process flow with nonconforming and discarded product.
8Very highHighRemoteThe system is inoperable due to severe failures.
9HazardousExtremeVery remoteFailures affect the safety of operators and the system with a warning.
10Very hazardousVery highAbsolute uncertaintyThe failures affect the safety of operators and the system, causing total stoppage of the process.
Table 2. Fuzzification parameters.
Linguistic VariablesLabels
L M H
ambambamb
Occurrence1371582710
Severity1371582710
Detection1371584710
RPN50100150100250400350550700
Table 3. Fuzzy rules.
RuleStatementRuleStatement
R1IF O is low AND D is low AND S is low THEN RPN is lowR15IF O is medium AND D is medium AND S is high THEN RPN is medium
R2IF O is low AND D is low AND S is medium THEN RPN is lowR16IF O is medium AND D is high AND S is low THEN RPN is medium
R3IF O is low AND D is low AND S is high THEN RPN is lowR17IF O is medium AND D is high AND S is medium THEN RPN is medium
R4IF O is low AND D is medium AND S is low THEN RPN is lowR18IF O is high AND D is medium AND S is medium THEN RPN is medium
R5IF O is low AND D is medium AND S is high THEN RPN is lowR19IF O is low AND D is high AND S is high THEN RPN is high
R6IF O is low AND D is high AND S is low THEN RPN is lowR20IF O is medium AND D is high AND S is high THEN RPN is high
R7IF O is low AND D is high AND S is medium THEN RPN is lowR21IF O is high AND D is low AND S is medium THEN RPN is high
R8IF O is medium AND D is high AND S is low THEN RPN is lowR22IF O is high AND D is low AND S is high THEN RPN is high
R9IF O is high AND D is low AND S is low THEN RPN is lowR23IF O is high AND D is medium AND S is low THEN RPN is high
R10IF O is low AND D is medium AND S is medium THEN RPN is mediumR24IF O is high AND D is medium AND S is high THEN RPN is high
R11IF O is medium AND D is low AND S is medium THEN RPN is mediumR25IF O is high AND D is high AND S is low THEN RPN is high
R12IF O is medium AND D is low AND S is high THEN RPN is mediumR26IF O is high AND D is high AND S is medium THEN RPN is high
R13IF O is medium AND D is medium AND S is low THEN RPN is mediumR27IF O is high AND D is high AND S is high THEN RPN is high
R14IF O is medium AND D is medium AND S is medium THEN RPN is medium
Table 4. Evaluation with the fuzzy system.
Label Group: LowLabel Group: MediumLabel Group: HighOutput:
RPN
RuleImplicationAggregationRuleImplicationAggregationRuleImplicationAggregationDefuzzification
R11.0001.000R101.0001.000R190.8260.875517.391
R21.000R111.000R200.826
R30.875R120.875R210.875
R41.000R131.000R220.765
R50.875R141.000R230.875
R60.944R150.875R240.765
R70.944R160.944R250.826
R81.000R170.944R260.826
R90.875R180.875R270.723
Table 5. Performance.
CombinationImplicationAggregationMSE
1 min min 6865.06
2 min max 6132.66
3 product max 3434.23
Table 6. Team of experts.
ExpertAreaExperience in the Department
E 1 Mechanics40 years
E 2 Operational20 years
E 3 Electronics26 years
E 4 Production10 years
Table 7. Failure modes analysis.
SubsystemIDFailure ModeClassificationEffect
1- Main tensions F 1 Large knotElectronic/Mechanical-Breakup of the fiber and detachment of the canvas
-Deformation of the needle hook
F 2 Small knotElectronic/Mechanical-Deformation of the needle hook
-Defective knit fabric
F 3 Tensioner out of adjustmentMechanical-Modification in fiber tension
-Mark and relief on the canvas
F 4 Damaged lampElectronic-Delay in identifying the faulty device
F 5 Up tension wireMechanical-Change in yarn tension
2- Side tensions F 6 Up tension wireMechanical-Change in yarn tension
3- Needle bed F 7 SinkerMechanical-Sinker break
F 8 JackMechanical-The jack gets stuck
F 9 NeedleMechanical-Breaking the needle hook and transfer plate
F 10 Needle spacer brokenMechanical-The component does not perform its function
F 11 Selector inactiveMechanical-Rupture
F 12 Sele-JackMechanical-Sele-Jack stuck
4- Takedown roller F 13 RubberElectronic/Mechanical-The canvas does not go down correctly
F 14 Pressure rollerMechanical-In the corresponding section, the canvas is raised
F 15 ChainElectronic/Mechanical-The Chainmain roller does not accomplish its function
F 16 Yarn accumulation--Breakage of the fiber
5- Sub-roller F 17 BurrElectronic/Mechanical-Breakage of the fiber
F 18 Yarn accumulationElectronic/Mechanical-Accumulation of fiber in the roller
F 19 Roller beltElectronic/Mechanical-The roller does not rotate properly
6- Yarn carriers F 20 Carrier boxMechanical-Yarn carrier inactive, misalignment in the box, retention of the yarn carrier
F 21 Yarn feederMechanical-Loose loops
F 22 Porcelain ringMechanical-Breakage of the fiber
7- Controller F 23 USB readerElectronic-The USB memory is not recognized
F 24 Inactive fanElectronic-Electronic cards overheating
F 25 ScreenElectronic-Information is not displayed
F 26 CardElectronic-Information is not processed for the regular operation of the machine
F 27 Power supply 30 VElectronic-Low voltage
8- Carriage F 28 Wear brushMechanical-Does not adjust the tabs of the needles
F 29 Stitch PresserElectronic/Mechanical-Loops do not go down properly
F 30 Actuator setElectronic-The loops are not formed according to the programmed instructions
F 31 Stitch motorElectronic-Knit fabric with loose or tight loops depending on the system
F 32 Damaged magnetMechanical-The carriage operates out of time
F 33 Damaged solenoidElectronic-The yarn carriers do not activate
Table 8. Expert evaluation.
SubsystemIDODSRPNF-RPNPriority
1 F 1 559225277.822
F 2 1095450455.551
F 3 394108113.903
F 4 4264871.754
F 5 3332737.165
2 F 6 4297277.164
3 F 7 22280.045
F 8 223120.165
F 9 456120167.013
F 10 3365450.845
F 11 3569083.354
F 12 224160.365
4 F 13 12360.005
F 14 3557572.754
F 15 3467266.164
F 16 224160.365
5 F 17 243241.455
F 18 42108077.164
F 19 2768485.244
6 F 20 35913592.624
F 21 2588031.465
F 22 3433640.385
7 F 23 3231835.225
F 24 937189252.442
F 25 253305.835
F 26 242160.365
F 27 2745645.245
8 F 28 1039270261.112
F 29 2656037.255
F 30 279126127.903
F 31 379189184.533
F 32 3569083.354
F 33 2757063.084
Table 9. Data for comparison of means.
IDRPNF-RPNF-RNP without Change in Centroid
F 1 225277.82231.14
F 2 450455.55300.00
F 3 108113.90209.83
F 4 4871.75205.38
F 5 2737.16177.57
F 6 7277.16212.21
F 7 80.04152.58
F 8 120.16152.58
F 9 120167.01207.49
F 10 5450.84186.57
F 11 9083.35189.72
F 12 160.36152.58
F 13 60.000.00
F 14 7572.75187.15
F 15 7266.16186.57
F 16 160.36152.58
F 17 241.45152.58
F 18 8077.16212.21
F 19 8485.24216.62
F 20 13592.62195.56
F 21 8031.46181.00
F 22 3640.38177.57
F 23 1835.22177.57
F 24 189252.44294.58
F 25 305.83159.65
F 26 160.36152.58
F 27 5645.24188.51
F 28 270261.11300.00
F 29 6037.25181.94
F 30 126127.90248.08
F 31 189184.53248.08
F 32 9083.35189.72
F 33 7063.08201.79
N = 333333
X ¯ = 89.587.8193.39
σ = 91.4100.853.64
Table 10. ANOVA (F-RNP without centroid adjustment).
ANOVA
SourcedfSSMSF-Valuep-Value
Factor1178,258178,25831.750.000
Error64359,3655615
Total65537,623
Table 11. ANOVA (F-RNP with adjustment to the centroid method).
ANOVA
SourcedfSSMSF-Valuep-Value
Factor14342.580.000.946
Error64592,2639254.10
Total65592,305
Table 12. Criticality classification.
PriorityRange F-RPN
Category 1[311–500]
Category 2[201–300]
Category 3[101–200]
Category 4[51–100]
Category 5[0–50]
Disclaimer/Publisher’s Note: The statements, opinions and data contained in all publications are solely those of the individual author(s) and contributor(s) and not of MDPI and/or the editor(s). MDPI and/or the editor(s) disclaim responsibility for any injury to people or property resulting from any ideas, methods, instructions or products referred to in the content.