Abstract
In the digital era, companies have experienced a progressive change in their business models, which has led them to develop greater agility to adapt to changing environments, and the necessity to properly manage the group decision making in these companies is patent. This paper shows how fuzzy models are utilized in group decision making. In this context, one of the most important group decisions to be adopted is how to manage the digital transformation of the company, drawing up the best possible roadmap. To achieve this goal, this paper proposes a new methodology improvement of group decision making based on a fuzzy 2-tuple linguistic model and the analytic hierarchy process (AHP) method. The suggested methodology proposes the calculation of the digital maturity level (DML) of companies based on five of the most cited and agreed upon criteria in the existing literature. The methodology proposed in this paper was tested and validated for the business case of Spanish SMEs through three different clusters to derive global recommendations tailored to each specific cluster and company segments, using a sample of 1428 companies. The main fundings reveal that the digital maturity level directly impacts on the size of the company and its digital mindset in the sense of driving change management processes. As future works, authors recommend extending the model to any industry using the proposed methodology and evaluate disruptive technologies such as artificial intelligence (AI) in supporting the digital transformation of SMEs.
1. Introduction
As constant and rapid changes are taking place in an environment that is more complex, more volatile, and more uncertain than ever, it is vital for companies to develop a great capacity to adapt to the digital era. In this sense, the study [] lists the aspects more important for an organization in this new scenario, such as the use of data or the adoption of agile methods. In the same vein, transformation requires adapting to changes, for example, in the competencies required for workers in a digital economy, and there are professional competency frameworks that include digital competencies as a fundamental part of the definition of the responsibilities of professional profiles [].
To manage a business in this changing environment in an agile and efficient way, it is essential to manage group decisions in the most efficient and consensual way possible. Group decision making (GDM) can be defined “as a task to consolidate and aggregate preferences (or opinions) that a group of decision-makers express regarding a set of alternatives, which aims to find the best collective alternative solution to a decision problem” []. These decisions are of a very diverse nature and highly complex, as they depend on several interlocutors, and a consensus must be reached quickly and optimally. This is where fuzzy logic and the analytic hierarchy process (AHP) can be a good option to help managers in the group decision-making process.
One of the most relevant decisions that all companies are currently making is how to reach their businesses’ needs aligned with current technologies [,]. In this sense, technologies such as social media, cloud computing, business analytics, big data, artificial intelligence, or the Internet of Things have become increasingly relevant both in general and especially in the business environment.
If we look back at the evolution of companies in recent decades, we will see that many companies have had to adapt to this increasingly digital environment, and practically all companies have been, are or will be immersed in the so-called digital transformation of their business. In this sense, G. Vial defines digital transformation as “a process that aims to improve an entity by triggering significant changes to its properties through combinations of information, computing, communication, and connectivity technologies” []. The growing importance of digital transformation is evident in the increased interest among the scientific community [,,] as well as in studies by global organizations such as the World Bank Development Committee (2022) analyzing trends and the impact of digitalization on economic development. In the abundant existing literature on the digital transformation of companies, it can be deduced that digitalization and new technologies are directly impacting business models and are studied as a real phenomenon. These changes caused in companies because of digitization affect all areas and processes, as we will analyze in this paper.
However, it is not only important to carry out a digital transformation of the business, but it is also important that the digital transformation is developed following a strategy and after a thorough analysis of the company’s capabilities. If we do not carry out this preliminary study and do not make the right decisions, it could happen that, despite the efforts and investments made to join the digitalization phenomenon, the expectations that were set about the potential benefits will not be achieved. This is therefore a major challenge facing all companies when it comes to the digital transformation of their businesses: making investments in digitization in an optimal way to try to achieve their goals []. As mentioned above, digitally transforming a company involves making substantial changes in many areas of the company, so the decision-making phase will be critical in making this process successful or unsuccessful. Despite the efforts of many specialized consulting firms and researchers, there is still no consensus on a model for helping in decision making when undertaking the best strategy for each company [].
This paper aims to provide the scientific community with a new model that can become a guide to carrying out the digital transformation of a company. This new model, which will be explained in depth in the following section, is based on previously calculating the digital maturity level of the company. Digital maturity level can be defined as “a related specific and generic practices for a predefined set of maturity dimensions that can improve the organizations” []. Regarding these practices or capabilities, the literature highlights that the development of a specific set of digital capabilities leads to a direct improvement in the level of digital maturity []. A classic definition of digital maturity level could be the proposal provided by the authors of [], who argue that the digital maturity level consists of dimensions and criteria, which describe the areas of action and the different stages of maturity and help companies to improve their digital maturity level. In [], digital maturity is shown as “what a company has already achieved with regard to transformation efforts”. These efforts to increase the level of digital maturity of companies may involve operational changes as well as the development of new capabilities, hence the need for digital maturity models, the importance of which is becoming increasingly relevant among academics and practitioners []. In [], it is noted that this trend of proposing digital maturity models will increase in the coming years.
In this sense, it is critical to identify the dimensions that define the level of digital maturity, and which distinguish one company from another. Only by qualitatively and quantitatively measuring a company’s current digitalization situation can it be known how far it is from achieving the optimal result. Again, considering the current literature in terms of models for measuring the level of digitization of a company, we find multiple studies with different variables, and once again, we note a total lack of consensus among the scientific community []. Therefore, this paper will take into account, on the one hand, the most relevant criteria for defining the degree of digital maturity of companies and, on the other hand, the group multi-criteria decisions that may exist in the company, resulting from the diversity of roles with decision-making capacity (CEO, CFO, CTO, etc.), so we will make use of mathematical models based on fuzzy logic and AHP methods.
Although there is a large amount of literature on digital transformation on the one hand and on fuzzy models for decision making on the other, there is a significant gap in the combination of these two concepts, and there are practically no studies that research possible models that improve the decision-making process of digital transformation. In addition, after a deep analysis of these studies, we found that most of them only provide a qualitative approximation of how the company is doing in terms of digitalization, but do not help to establish a decision-making process based on these results that would help the company to establish an action plan. Another conclusion that has been found regarding the models for measuring the digital maturity of a company is that many of them are designed for a specific sector of companies [] or for a holistic point of view [], but very few propose adaptable models according to the size of the company. On the other hand, after our deep study of the literature, we can conclude that many authors identify as a dimension for measuring digital maturity level aspects as innovation [,], or culture [,], but very few propose a digital mindset as a variable.
With this, as the main contributions of this new model proposed in this article, we can consider the following:
- Suggesting a methodology for the improvement of group decision making based on a fuzzy 2-tuple linguistic model and the AHP method.
- From this proposed methodology for group decision making, proposing a new model for calculating the digital maturity level (DML).
- Selecting the criteria to be used in the new model, based on an exhaustive literature review evaluating which are the most cited criteria for measuring digital maturity.
- Presenting a real use case to validate and test this new methodology in the case of SMEs in Spain and to establish a proposal of recommendations for the improvement of the decision making of each cluster of companies.
- Establishing a series of limitations of our work, as well as future lines of work.
The remaining content of this article is presented as follows: in Section 2, we review the existing literature on the concepts that are part of the proposed model; in Section 3, we develop the methodology we have followed in this work based on AHP and fuzzy linguistic 2-tuples; in Section 4, we propose a new model for calculating digital maturity; in Section 5, we present a practical application of the model for the case of Spanish SMEs; and finally, in Section 6, Section 7 and Section 8, we discuss the results and establish the main conclusions as well as the limitations and future lines of work.
2. Literature Review
2.1. Group Decision Making and Consensus
As we mentioned in the introduction section, to manage a business, it is essential to manage group decisions in the most efficient and consensual way possible. In this sense, the fields of consensus processes and group decision making have been deeply analyzed in the recent literature.
When we researched the publications and citations associated with the search variable TS = (CONSENSUS PROCESS) OR TS = (GROUP DECISION MAKING), we found more than one hundred fifty thousand publications studying these terms. If the search is refined to find only these terms but applied to the business environment, the number is considerably reduced (6241 publications).
Figure 1 presents a comprehensive overview of the publications and citations associated with the search variables (TS = (CONSENSUS PROCESS) OR TS = (MAKING DECISION GROUP)) AND (TS = (BUSINESS) OR TS = (ENTERPRISE)). The objective is to show the scientific publications related to this concept. For these results, we have conducted the research in the Web of Science Core Collection including unique criteria of selecting journal article documents and including the entire period available.
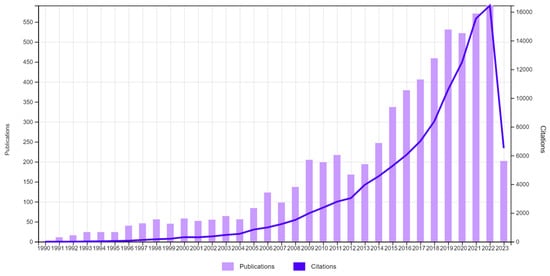
Figure 1.
Studies related to the consensus process/group decision making in the business field.
As can be deduced from the number of publications previously shown, the importance that academics and practitioners give to the field of consensus decision making and group decision making can be highlighted. In the words of [], group decision making is “an important component of decision science” and “can improve the scientific of decision making by aggregating multiple experts’ evaluation information on several alternatives to select the optimal solution”.
In this sense, one of the most relevant group decisions that companies are currently developing is to implement the digital transformation of their business. Again, after searching in the Web of Science Core Collection and including unique criteria of selecting journal article documents and including the entire period available, we can present Figure 2, which reveals the publications and citations associated with the search variables (TS = (CONSENSUS PROCESS) OR TS = (MAKING DECISION GROUP)) AND (TS = (BUSINESS) OR TS = (ENTERPRISE)) AND (TS = (DIGITAL TRANSFORMATION) OR TS = (DIGITAL MATURITY)).
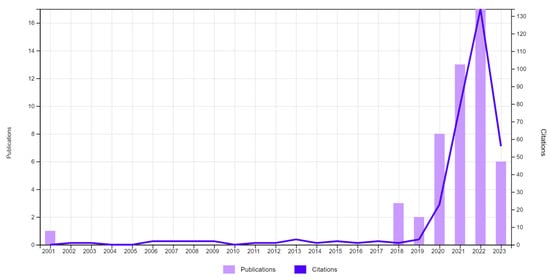
Figure 2.
Studies related to the consensus process/group decision making in the business field and digital maturity/transformation.
With this second filter, we only found 50 articles, representing an interesting gap on which to conduct our research.
In the following section, we will delve deeply into the concept of digital transformation models and digital maturity.
2.2. Digital Transformation
Figure 3 presents a comprehensive overview of the publications and citations associated with the search variable TS = (DIGITAL TRANSFORMATION MODELS). The objective is to show the scientific publications related to this concept. For these results, we have conducted the research in the Web of Science Core Collection including unique criteria of selecting journal article documents and including the entire period available.
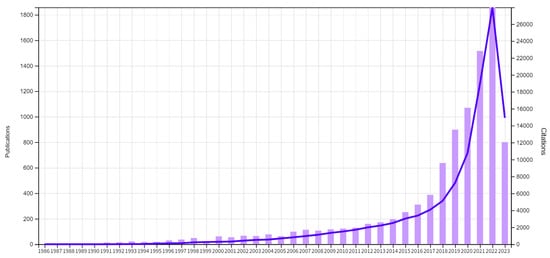
Figure 3.
Studies related to digital transformation models.
As shown in Figure 3, there are many studies and articles on digital transformation in the literature, a major part of them published in the last decade.
Considering the impact that digitalization is having on the business environment, we must place special emphasis on SMEs, as they play a fundamental role in the economy. The main importance of SMEs is the fact that they impact not only their sector but also the rest of the companies in the global economy []. Following [], it has been estimated SMEs represent more than 90 percent of industrial production and over 60 percent of the labor force in many countries.
Another example of the importance that SMEs have in the global economy of the European Union is the Next Generation EU funds, the largest financial support in EU history for its state members. A large part of this funding has been programmed to promote the growth and digital development of SMEs. If we focus on the case of Spain, we will find that SMEs are essential in the Recovery Plan of the Next Generation funds, as can be seen in the fact that this plan is aimed at specific measures for this type of company, with specific initiatives in 17 of the 30 components of the plan. In addition, many of the initiatives to help the business development of SMEs are based on their digitalization, as shown by programs such as the “Digital Kit”, which has benefited more than 1 million SMEs in Spain.
The Spanish National Bureau of Statistics (INE by its Spanish acronym) indicates that SMEs are of vital importance for a sustainable economy; they represent 99% of the total business sector, accumulating 62% of the Spanish GDP. According to the INE, with data from 2022, 85% of Spanish companies have less than 50 employees [].
Figure 4 shows the total number of companies in Spain by number of employees in the last three years.
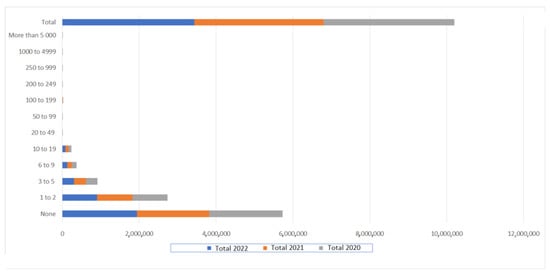
Figure 4.
Number of companies by number of employees (source: Statistical National Institute, Spain, https://ine.es/).
Based on these data, it seems logical to venture that different strategies should be followed depending on the size of the companies; however, after a deep review of the literature, it is observed that in addition to the fact that there are few models helping companies in decision making for digital transformation, practically none of them differentiate according to the number of employees or are focused on SMEs []. This point will be considered in our model, and as will be seen in the following section, we will perform a clustering of companies according to size, and we will suggest a report of specific recommendations for each of these clusters.
2.3. Criteria for Measuring Digital Maturity Level
Figure 5 presents a comprehensive overview of the publications and citations associated with the search variable TS = (DIGITAL MATURITY MODELS). The objective was to discover the scientific publications related to this concept. For these results, we have conducted the research in the Web of Science Core Collection including unique criteria of selecting journal article documents and including the entire period available.
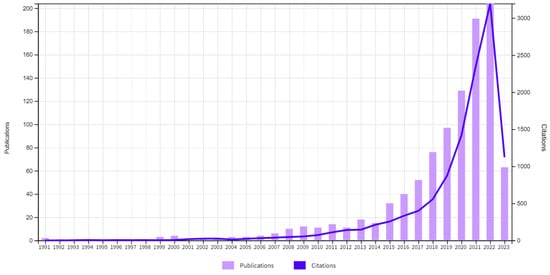
Figure 5.
Studies related to digital maturity models.
Many works base their analysis of digitalization on technological or digital maturity models and identify different criteria for measuring the digital maturity of a company. In [], digital maturity criteria include digital organization and culture, technology, digital skills, operations and processes, digital strategy, and organization and culture. The authors of [] propose measuring digital maturity through criteria such as business models, processes, relationships and products. In [], a review of the existing literature concludes that the most cited criteria are business culture and people, and technology, closely followed by business management, processes, products and strategy. It indicates that digital maturity models are still far from being a consolidated field of study due to the lack of validation using numerical methods. The following are the five digital maturity criteria that have been most used in the literature and will be the basis of our work and our model proposal:
- Products/Services (PS): This criterion refers to whether the organization’s products and/or services are digital or sufficiently digitized, meaning they leverage digitalization to incorporate new features and provide greater value. In this sense, several authors have emphasized the importance of the products/services of companies to evaluate the digital maturity level of a company. In this context [], highlights the importance of the customization of products/services, and [] focuses on the capability to launch new products based on a digital point of view. In other words, it is possible to “bring on the market intelligent new products and services, controlled by digital components” [].
- Customers (CX): This criterion refers to whether the organization has digital channels for optimal communication with customers. Having these digital channels will improve the company in terms of customer experience and a better understanding of customer needs. In [], the impact of the digital maturity of a company on the market is highlighted: “The increasing digitalization of economies has highlighted the importance of digital transformation and how it can help businesses stay competitive in the market”. In the same vein, many authors focus on the importance of operating in a market based on digital standards and the necessity to have a digital approach [,,], as well as the impact of digitalization on customers.
- Processes/Operations (PO): This criterion indicates the degree to which the organization can plan, manage and monitor all its processes/operations through digital elements. Having this digitization of operations will result in improved efficiency, greater control and a reduction in errors. In this criterion, we can find authors who show the importance of digitalization in the supply chain [], in the automation and industrialization of processes [] and in the “transformation of existing processes, activities, and actors, as well as introductions of new types of processes, products, and services emerges” [].
- IT (Technology): This criterion gives us a vision of the technological capacity of the organization. This is defined by aspects such as the IT tools available, the organization’s architecture or infrastructure, and the connectivity of the IT systems used by the organization (whether they are interconnected and coordinated with each other or are isolated). Many authors base digitalization on the proper use of IT products, infrastructure or solutions. The work [] defines digital transformation as the use of digital technologies to radically improve the company’s performance. In the same context [], focuses on the previous IT-enabled business transformations, and [] emphasizes the concept of the alignment between IT and businesses.
- AI (Analytics and AI): This criterion shows whether the organization efficiently handles data by identifying and digitizing the company’s key performance indicators (KPIs) and uses them for decision making. In this area, authors have emphasized the connection between digital maturity and digital technologies such as cloud computing, mobile Internet, social media and big data []. Other technologies such as IoT, big data analytics and artificial intelligence have also impacted the calculation of the digital maturity level of a company []. With the same point of view [], notes that in several industries, digital transformation is being driven by technologies such as IoT, cybersecurity and artificial intelligence (AI).
2.4. Fuzzy Logic
Figure 6 describes the publications and citations associated with the search variable TS = (FUZZY LOGIC) AND (TS = (CONSENSUS PROCESS) OR TS = (MAKING DECISION GROUP)) in the Web of Science Core Collection including unique criteria of selecting journal article documents and including the entire period available. The aim of this research was to identify the scientific publications related to these concepts.
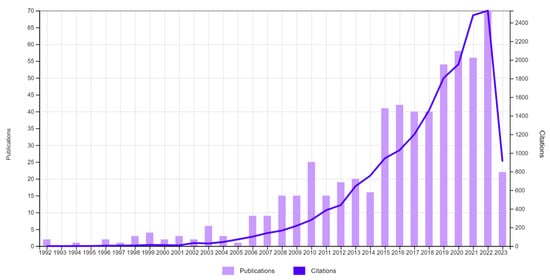
Figure 6.
Studies related to fuzzy logic and consensus processes.
The main conclusion of the research above mentioned is that despite the large number of recently published papers on fuzzy logic models, only less than 600 are focused on consensus processes or group decision making (almost all in the last decade).
That number is further reduced if we search in the same Web of Science database, but specifically for articles on fuzzy logic models applied to consensus processes or group decision making in the business sector, returning only 49 articles (Figure 7). TS = (FUZZY LOGIC) AND (TS = (CONSENSUS PROCESS) OR TS = (MAKING DECISION GROUP)) AND (TS = (BUSINESS) OR TS = (ENTERPRISE)).
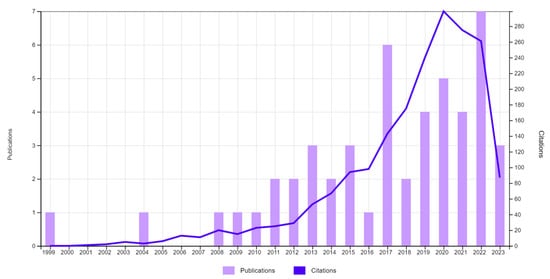
Figure 7.
Studies related to fuzzy logic and consensus processes applied in the business sector.
Finally, Figure 8 presents a comprehensive overview of the publications and citations associated with the search variable TS = (DIGITAL MATURITY MODELS) AND TS = (FUZZY LOGIC); when we added the parameter GROUP DECISION OR CONSENSUS PROCESS, we did not find any related papers. As observed, the total number of publications since 2020 amounts to merely fourteen. For these results, we have conducted the research in the Web of Science Core Collection including unique criteria of selecting journal article documents and including the entire period available.
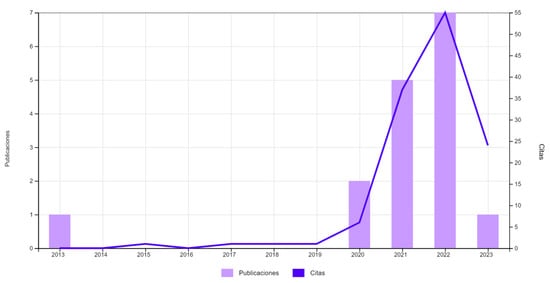
Figure 8.
Studies related to digital maturity models and fuzzy logic.
As we have seen in this section, much has been written about digital transformation and digital maturity models, as well as about models based on digital maturity for decision making. However, a review of the literature on these concepts reveals a clear lack of scientific studies, Table 1 and Table 2.

Table 1.
Studies related to digital maturity models and fuzzy logic from 2020 to 2023.

Table 2.
Studies related to digital maturity models and fuzzy logic group by category.
As can be seen in the literature review, the utilization of AHP and 2-tuples in a decision-making process provides a powerful combination that allows addressing complex problems, capturing subjective preferences, and modeling uncertainty more accurately. This helps enhance the quality of decisions made and provides a more comprehensive and sophisticated approach to decision making in various organizational contexts.
The following section presents the proposed methodology for the creation of a new model that represents an important milestone in the existing literature and will be tested for a real case of Spanish companies.
3. Methodology
This section aims to provide a comprehensive theoretical framework for the research. To achieve this objective, the study will utilize the following models: the fuzzy 2-tuple linguistic model (LD2T), the analytic hierarchy process (AHP) and strategies for effectively managing heterogeneous information in the decision-making process [].
In some cases, the information needed for decision making is found in different domains of expression. In the case under study, the expression domains to be used are numerical and categorical, so it is essential to address the problem using a fuzzy linguistic domain and thus unify the information management process in the model proposed [].
3.1. The 2-Tuple Model (LD2T)
A model known as the 2-tuple linguistic representation, which was proposed by F. Herrera and L. Martinez [], addresses the challenge of mitigating information loss during the computation process with linguistic labels. This model aims to enhance the accuracy of representing information by unifying it into linguistic values. In the following paragraphs, a concise overview of the 2-tuple linguistic representation model and its computation system will be presented. This model aims to improve the accuracy of representing information by consolidating it into linguistic values (, , where and . The membership function selected for the 2-tuple linguistic representation model is typically represented by a triangular function. Figure 9 depicts an illustrative representation of the domain within using this triangular function.
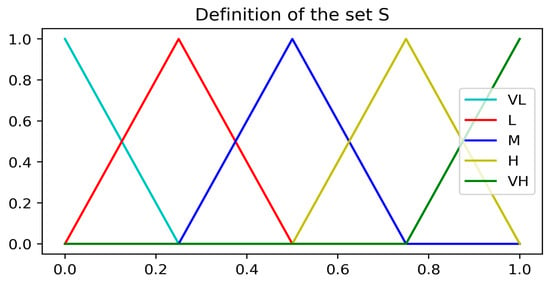
Figure 9.
Definition of the set S.
Definition 1.
Let us consider a set of linguistic terms, , with an odd number of terms, and a value within the granularity range of S. Assuming that the labels are represented using triangular functions, the symbolic representation of a linguistic item, is a number within the interval [−0.5, 0.5). This number signifies the disparity between a set of information, indicated by the value , resulting from a symbolic operation, and its corresponding nearest integer value, .
Definition 2.
Let us consider a set of linguistic terms, , and the set , as well as a value that represents the result of a symbolic operation; the linguistic 2-tuple corresponding to β can be achieved through the utilization of the following function:
where represents the standard rounding operation, denotes the label with the index closest to and represents the value of the symbolic translation. As a result, a value within the interval is linked to a 2-tuple within the set .
Definition 3.
Let be a collection of linguistic terms, and which represents the linguistic value 2-tuple that represents the linguistic value 2-tuple can be obtained by employing the following function:
We can analyze the computational model associated with this, and for that purpose, the following operators are defined:
The 2-tuple linguistic comparison operators: Given two 2-tuple language values and representing amounts of information:
- If , then is less than .
- If , then
- (a)
- If , then and represent the same information.
- (b)
- If , then is less than .
- (c)
- If , then is greater than .
Aggregation operators for 2-tuple linguistic values:
Definition 4.
Let be a set of 2-tuple linguistic values in , and be their correspondingweights, such that ; in this case, the 2-tuple weighted average isdefined by :
3.2. AHP Method
In everyday life, and particularly in the business world, decision making is a critical process. Complex problems arise daily that are challenging to solve due to the involvement of numerous criteria, sub-criteria, and alternatives [].
The decision-making (DM) process involves several crucial factors that need to be taken into consideration. These factors include the number of criteria, the decision environment, and the number of experts []. Figure 10 provides an overview of these factors.
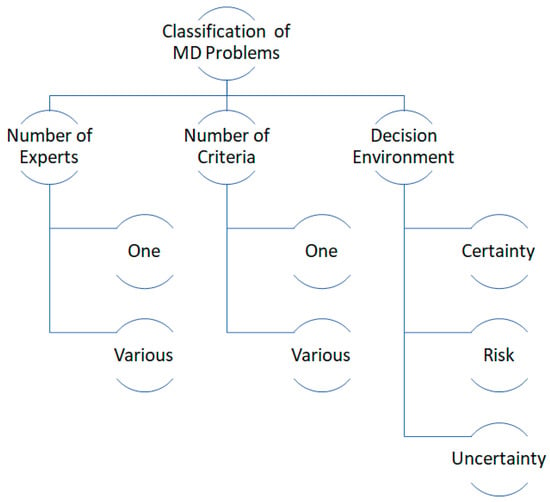
Figure 10.
Classification of DM problems.
- Number of criteria: If there is more than one criterion involved, the problem is a multi-criteria decision-making (MCDM) problem. MCDM problems are more intricate to solve compared to problems with a single criterion because they require the integration of information, which often exhibits heterogeneity.
- Decision environment: The decision environment can be categorized into different types based on the level of knowledge about the factors involved. If all the factors are precisely known, it is an environment of certainty. However, if the available information is imprecise or lacks specificity, it represents a decision problem under uncertainty. Furthermore, if any of the factors involve chance, the environment is considered risky.
- Number of experts: When multiple experts participate in the decision-making process, complexity is added. Aggregating information from all the experts becomes necessary to solve the problem. However, considering different viewpoints can lead to a more satisfactory solution. This type of decision making is referred to as group decision making (GDM).
These factors significantly impact the decision-making process and should be considered for effective and informed decision making.
In enterprise environments, multi-criteria decision-making problems involving multiple criteria and experts (MCDM-ME) are commonly encountered.
One well-known MCDM model is the analytic hierarchy process (AHP) []. Developed based on mathematical and psychological principles, the AHP method is specifically designed to tackle complex multi-criteria problems [].
The distinguishing characteristic of the AHP model is its hierarchical structure for modeling decision problems. The top level represents the objective to be achieved, followed by criteria and sub-criteria at the second level. The weights of each criterion can be determined in relation to the others through pairwise comparisons. Finally, each criterion is compared with the available alternatives. This allows us to determine the relative importance of one alternative precisely and dynamically over another in the decision problem. After evaluating the contributions of each element to the higher-level elements in the hierarchy, the overall contribution of each alternative towards the primary objective is calculated using an additive aggregation approach [].
In the context of the proposed model, the weights of each criterion will be determined, which will ultimately determine the overall maturity status of the SME.
The entire process is elaborated upon in the subsequent subsections.
3.2.1. Organizing the Decision Model in a Hierarchical Process
The AHP method starts by structuring the decision problem into a hierarchy, which aids in organizing and analyzing the problem effectively. This hierarchy breaks down the problem into different levels based on their common characteristics, allowing for a better understanding and evaluation of the decision factors.
At the highest level of the hierarchy is the objective or target that needs to be achieved. This represents the overarching goal of the decision-making process.
The second level of the hierarchy comprises a set of criteria, denoted as . These criteria represent the key factors or dimensions that need to be considered in the decision. Each criterion can be further subdivided into sub-criteria, represented as , , using a recursive approach. This subdivision helps in capturing the finer details and specific aspects related to each criterion.
Finally, the final level of the hierarchy comprises the alternatives, denoted as . These alternatives represent the available options or choices to be considered in the decision-making process.
Figure 11 provides a visual representation of the hierarchical structure of the decision problem, illustrating the relationships and interdependencies between the objective, criteria, sub-criteria, and alternatives.

Figure 11.
Analytic hierarchy process.
By structuring the decision problem in this hierarchical manner, the AHP method provides a systematic framework for understanding, analyzing and evaluating complex decision problems. It enables decision-makers to gain insights into the relationships between different elements and facilitates a more comprehensive decision-making process.
3.2.2. Setting Criteria and Weighting
The AHP method incorporates the opinions of decision-makers to make pairwise comparisons between elements within the same level of the hierarchy. These comparisons entail evaluating the relative importance or preference of one element compared to another with respect to a specific element at a higher level.
The resulting matrix, called the pairwise comparison matrix (), is represented as , where denotes the importance or priority of criterion i relative to criterion j, as evaluated by the decision-makers. The matrix is square with dimensions , where n represents the number of elements or criteria being compared.
To assign values to the matrix entries, a predefined rating scale of numbers is used. These values represent the relative importance or preference of one criterion over another. Table 3 illustrates an example of such a rating scale.

Table 3.
Saaty scale [].
The entries of the matrix, denoted as , follow specific rules:
- Reciprocity: The importance of criterion relative to criterion j is reciprocally related to the importance of criterion relative to criterion i. In other words, if criterion is considered 3 times more important than criterion , then criterion is considered one-third as important as criterion .
- Scale Values: The entries of the matrix are assigned values based on the predefined rating scale, indicating the strength of preference or importance between the elements being compared. These values quantify the subjective judgments of the decision-makers.
By following these rules and collecting the pairwise comparisons from the decision-makers, the pairwise comparison matrix is constructed, providing a foundation for subsequent calculations and analyses within the AHP method.
The vector of criteria weights, denoted as , is constructed using the eigenvector method, which involves the following equation:
where represents the maximum eigenvalue of PW and denotes the normalized eigenvector associated with the principal eigenvalue of PW.
The consistency ratio (CR) is a measure used to assess the consistency of the analytic hierarchy process (AHP) method. It helps evaluate the reliability of the pairwise comparisons made by the decision-maker during the AHP process:
The CR is calculated as the quotient between the consistency index (CI), defined as and the random consistency index (RI) (Table 4).

Table 4.
Random consistency values [].
If the calculated consistency ratio (CR) is less than or equal to the predefined consistency limits provided in Table 5, it indicates that the results of the individual hierarchical comparisons meet the consistency requirements. In this case, the pairwise comparison values are considered acceptable, and consistency is ensured.

Table 5.
Consistency limits [].
3.2.3. Evaluate Each Alternative with Respect to the Established Criteria
Similarly, to how we have recursively obtained the weights of criteria and sub-criteria, we can apply the same approach to the alternatives by relating each alternative to each criterion. This involves constructing a comparison matrix for the alternatives, where each element represents the weight assigned to one alternative in relation to another alternative for a specific criterion. Let us denote this comparison matrix as , with dimensions .
Using the same methodology described earlier, we can calculate the weights of the alternatives by analyzing the pairwise comparisons within each criterion. This process involves obtaining the maximum eigenvalue () and the corresponding eigenvector () for each comparison matrix . The eigenvector represents the relative weights of the alternatives for the given criterion.
By repeating this process for each criterion, we can generate a matrix of weights that involves comparing each alternative with every other alternative, considering all the criteria. This matrix of weights allows us to rank the alternatives based on the established weightings.
The remaining steps of the process are the same as outlined in the previous point. The weights obtained for each alternative are used to calculate their overall contributions towards achieving the primary objective. Finally, a ranking of the alternatives can be derived based on their assigned weights.
By applying this approach, the decision model provides a systematic and comprehensive evaluation of the alternatives, considering the multiple criteria and their respective weightings. This allows decision-makers to prioritize the alternatives based on their relative importance and make well-informed decisions.
3.2.4. Group Decision Making
In the final step of the group decision-making process, we utilize the weights assigned to the alternatives based on the expert’s criteria evaluations to determine their overall ranking. The ranking allows us to identify the most suitable alternative that aligns with the research objective.
3.3. Treatment of Heterogeneous Information
In this study, we aim to unify heterogeneous information using a 2-tuple linguistic information domain []. To initiate the unification process, we need to establish the basic set of linguistic terms (CBTL), which will serve as the foundation for the computation and analysis conducted in this study.
The selection of the CBTL domain, denoted as , involves identifying the set of linguistic terms that exhibit the highest level of granularity within the heterogeneous framework []. By selecting this set, we guarantee that we preserve the maximum amount of information represented within the linguistic domain. Once the CBTL value has been determined, we proceed with transforming the different expression domains to align with the selected CBTL set.
Information can be depicted in multiple domains, such as numerical, interval and linguistic [], as shown in Figure 12.
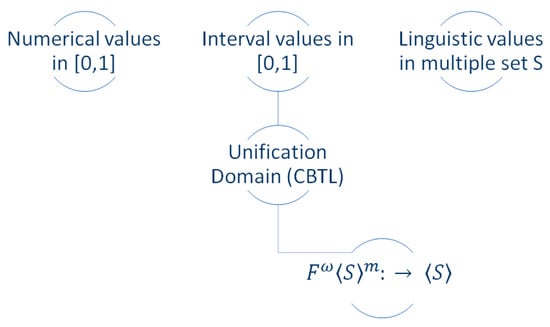
Figure 12.
The 2-tuple linguistic unification model [].
Through this approach, we aim to achieve a comprehensive and unified representation of heterogeneous information, enabling us to effectively analyze and interpret the data within a common linguistic framework. By aligning the different expression domains with the selected CBTL set, we can facilitate the integration and comparison of information from diverse sources, ultimately leading to more accurate and meaningful insights.
3.3.1. Numerical Domain
Definition 5.
Considering a numerical value and a set , belonging to the CBTL domain, we establish the numerical transformation function, :
with
where [0, 1] is the degree of association of n and ∈.
3.3.2. Interval Domain
Definition 6.
Considering a value and a set belonging to the CBTL domain, we establish the interval transformation function :
where ; identify the membership functions corresponding to the interval and the linguistic terms .
3.3.3. Linguistic Domain
Definition 7.
Given and the set that belongs to the CBTL domain where both sets represent linguistic terms, and , the linguistic transformation function is defined as follows:
where ; and identify the membership functions corresponding to each term .
After unifying the heterogeneous information into a 2-tuple linguistic domain, various specific operations can be applied to the LD2T domain. These operations allow for interpretable results that consolidate the diverse evaluations within a single domain, pertaining to a specific criterion.
4. Proposed Model—Determining the Digital Maturity Level (DML)
In this study, based on the related literature, a set of criteria directly related to the level of digital maturity of SMEs has been established. Figure 13 shows the complete process of determining the level of maturity, based on the assessment of the digital status of a set of SMEs, and introducing additional variables such as the number of employees and digital mentality.
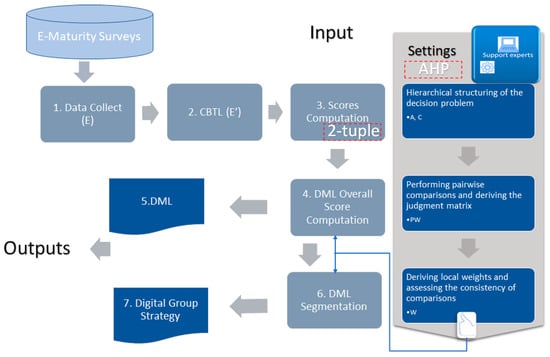
Figure 13.
DML model.
The proposed new digital maturity level (DML) model in this work is based on determining the digital maturity level of a company by considering the following criteria (selected in Section 2):
- PS (Products/Services): Our products and services are digital or digitized, meaning they leverage digitalization to incorporate new features and provide greater value.
- CX (Customers): We have digital channels through which we understand the needs and expectations of our customers, as well as their satisfaction level with our value propositions.
- PO (Processes/Operations): We plan, manage and monitor all key aspects of our operations (both production and support) through digital systems that enhance efficiency and reduce errors.
- IT (Technology): The various systems operating within the organization are interconnected and operate in a coordinated manner, without overlaps or information silos.
- AI (Analytics and AI): Efficient handling of data is carried out, with key performance indicators (KPIs) identified and digitized. Data are analyzed and interpreted, and predictive models are developed to assist in decision making.
These criteria are used to assess the digital maturity level of a company and provide insights for further improvement and strategic decision making.
Therefore, the first of the assessments of the company’s digital performance is represented in terms of the parameters described: digital products and services (PS), customer experience (CX), digitalization of organizational processes (PO), integrated technology (IT) and analytics and artificial intelligence (AI); so that the evaluation (), can be expressed as .
Once this first initial assessment has been obtained, we include two additional criteria in the overall evaluation process:
- DM (Digital Mindset): Digitalization is one of the areas towards which we direct a considerable percentage of our activities and innovation resources.
- NEMP (Number of Employees): Organizations with a higher number of employees tend to have a higher level of digitalization.
The overall evaluation (DML) considers two additional criteria weighted with the overall score obtained through the initial evaluation process. These criteria are the number of employees (NEMP) and the digital mindset of the company (DM), so the overall score evaluates not only the digital processes of the company but also factors such as change orientation and the number of employees; .
All the defined criteria in the model are obtained through the information provided by the business specialists of each company. This process helps evaluate the level of digitalization of the company and dynamically weigh the importance of the criteria that make up the model.
The process is as follows:
- Data collection.
- Determine the CBTL expression domain for each criterion and apply the 2-tuple model to the obtained data.
- Obtain the comprehensive evaluation of each interaction by utilizing the AHP model.
4.1. Data Collection
The information on each company is collected through an evaluation survey, so for each of the companies that participate in the process, the following information is collected in an linguistic domain, obtaining the following data in the first phase:
This represents the detail of each assessment; #E corresponds to the total number of enterprises, and for each enterprise, , we have the following:
- : This criterion represents the evaluation in a 2-tuple domain of the company’s assessment of the digitalization of products and/or services.
- : This criterion represents the evaluation in a 2-tuple domain of the company’s assessment of customer experience processes.
- : This criterion represents the evaluation in a 2-tuple domain of the company’s assessment of the digitalization of its operational processes.
- : This criterion represents the 2-tuple domain evaluation of the company’s assessment of the integration of company information through connected technology tools.
- : This criterion represents the evaluation in a 2-tuple domain of the company’s assessment of the business analytics and artificial intelligence processes.
In this paper, and considering the use case, the scale utilized will comprise five values . Since this scale is linguistic in nature, we will model it using the set .
4.2. CBTL Domain, Score Computation
In this step, we calculate the 2-tuple scores for the set of linguistic terms.
For each company, we need to calculate the variables . These variables are defined within the linguistic domain . Since the variables are already in the desired linguistic domain, no additional transformation is required. However, we will convert this domain into 2-tuple linguistic variables to effectively utilize the computational model for 2-tuple linguistic values.
Therefore, we must calculate the following variables: . For each company , we obtain with .
4.3. DML, Overall Score
In this step, the value of 2-tuple , which characterizes the score of each evaluation , , is calculated for each customer using Equation (3), in such a way that .
We will structure the group decision problem using a hierarchical model (AHP) and then create the pairwise comparison matrix, represented by Equation (4), to obtain the vector of weights for each variable, . This structured approach ensures that the decision reflects the collective preferences and judgments of the experts, leading to more informed and reliable decision outcomes.
Once this first evaluation has been carried out, it is necessary to complete the overall evaluation with the additional criteria, number of employees (NEMP) and digital mindset (DM). The first criterion is in a numerical domain, so it will be necessary to transform it to a 2-tuple linguistic domain in , Equation (6). The second is in an domain, so no transformation will be necessary.
The CBTL domain is defined to incorporate the criteria for the decision-making process. In this case, we have the following criteria:
- : This criterion represents the overall score obtained from the DML model. It is categorized within the fuzzy domain .
- : This criterion represents the number of employees; it is expressed in a numeric domain and transformed to the fuzzy domain using the function , as described in Equation (6).
- : This criterion represents the digital mindset and is categorized within a linguistic domain .
Once the criteria have been identified, we will carry out a process of unification of heterogeneous information and bring it into the defined CBTL domain (). This ensures that all criteria are in a consistent linguistic representation.
After the unification process, the group of experts determines the weights assigned to each criterion, facilitating the consensus in group decision making. This collaborative approach ensures that the final decision reflects the collective expertise and perspectives of the experts involved. By considering the input of multiple stakeholders, the decision-making process becomes more comprehensive and balanced, leading to more robust and informed outcomes. These weights are denoted as .
Finally, recommendations will be made based on the overall score obtained for each company.
5. DML Model, Practical Application
In this section, we will provide an illustrative example of applying the new DML model to two different segments: micro-SMEs (10–49 employees) and medium-sized enterprises (50–249 employees). The dataset consists of 1228 enterprises in the micro-SME segment and 200 records in the medium-sized enterprise segment. We will use this dataset to demonstrate the application and effectiveness of the DML model in evaluating the digital maturity level of companies in these segments.
5.1. Data Collection
The information collected for testing the performance of the proposed model is shown in Figure 14 and Figure 15.
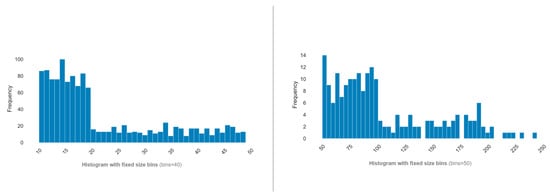
Figure 14.
Number of enterprises by number of employees—10 to 49 employees|50 to 249 employees.
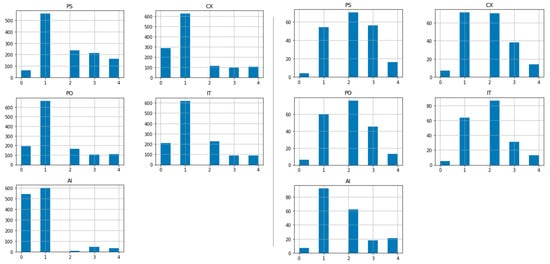
Figure 15.
Histograms for PS, CX, PO, IT and AI—10 to 49 employees|50 to 249 employees.
The exploratory analysis of the initial data reveals that the average evaluation of companies with 10–49 employees indicate left-skewed digitalization values for the variables PS, CX, PO, IT and AI. On the other hand, companies with between 50 and 249 employees exhibit centered digitalization values, with the digitalization process expanding as the number of employees increases. When computing the overall evaluation variables without utilizing weight matrices, the distributions shown in Figure 16 can be observed.
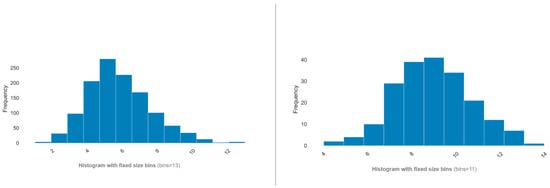
Figure 16.
Histogram for EVAL—10 to 49 employees|50 to 249 employees.
5.2. CBTL Domain, Score Computation
After grouping the variables into a linguistic domain in , we obtained the following results for an initial range of 15 companies in the micro-SME group (10–49 employees), shown in Table 6, and in the SME group (50–249 employees), shown in Table 7.

Table 6.
DML, matrix in the domain (10–49 employees).

Table 7.
DML, matrix in the domain (50–249 employees).
5.3. DML, Overall Score
In this phase, it is necessary to determine the relative significance of each feature in the DML model before calculating the overall interaction score. To achieve this, we will employ the AHP model, as mentioned earlier.
Using the Saaty scale, the expert group consulted for consensus has provided the following matrix (Table 3):
The individual hierarchical results are considered satisfactory, and consistency is ensured only when (as indicated in Equation (5)). In this case, , confirming the validity of the model’s results.
The final calculated weights are as follows: . Therefore, the experts have assigned greater importance to process digitization, followed by enhancing customer experience, analytical capabilities, information integration and product/service digitalization.

Table 8.
DML, overall score (10–49 employees).

Table 9.
DML, overall score (50–249 employees).
Next, we will introduce the variables number of employees (NEMP) and company digital mindset (MD) and perform the following steps:
- First, Table 10 and Table 11 show the overall assessment values obtained in the previous step, and the number of employees and the digital mindset of 15 companies are added.
 Table 10. Extended DML (10–49 employees).
 Table 11. Extended DML (50–249 employees).
 - Second, the AHP matrix is applied to obtain the weights for each of the above variables.
- Third, as shown in Table 12 and Table 13 we obtain the overall score, extended DML, of each company in 2-tuple.
 Table 12. Extended DML, overall score (10–49 employees).
 Table 13. Extended DML, overall score (50–249 employees).
 - Finally, we derive a definition of clusters for each of the business segments and make recommendations per cluster.
In this case, the digital evaluation () and the digital mindset () are in a fuzzy domain , and the number of employees () is in a numerical domain ; thus, we will apply Equation (6).
In this stage, we need to determine the relative importance of each variable in the extended DML model. To achieve this, the AHP model will be utilized.
The consulted experts have provided the following matrix using the Saaty scale (Table 3):
The individual hierarchical results are considered satisfactory, and consistency is ensured only when (as indicated in Equation (5)). In this case, , confirming the validity of the model’s results.
The final weights calculated are .
As a result, the experts have assigned higher importance to digital assessment, followed by digital literacy, and finally the number of employees. We now calculate the overall valuation from the weight matrix.
The described procedure allows for obtaining individual scores based on the selected criteria. However, the objective of this article is to propose a working methodology that can be extended to include a greater number of criteria, sub-criteria, different domains of numerical and linguistic representation, and multiple decision-makers. Consequently, it can be applied to determine the level of digitalization of any company.
The described criteria provide a roadmap for how any company can digitally evolve and, therefore, assist small and medium-sized enterprises in taking the next steps in their digitalization process.
5.4. DML, Clustering
The variables of the extended DML model are expressed in a 2-tuple format, which allows for easy interpretation and aggregation processes without loss of information. Conventional clustering work involves working on a numerical domain, for which we will use the function , described in Equation (2).
The two clusters applied using the k-means algorithm are shown in Table 14 and Table 15, although we have analyzed the correlation between variables before applying k-means, since a high correlation determines the inappropriateness of using Euclidean distance. The correlation matrix is shown in Figure 17, for each of the selected company segments.

Table 14.
Cluster k-means algorithm expressed in 2-tuple model (10–49 employees).

Table 15.
Cluster k-means algorithm expressed in 2-tuple model (50–249 employees).
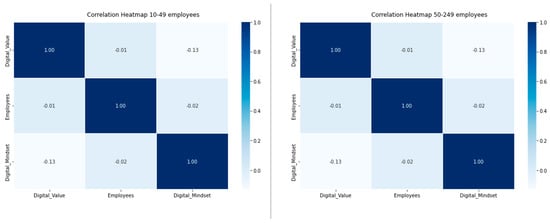
Figure 17.
Correlation matrix—10 to 49 employees|50 to 249 employees.
In companies with 10 to 49 employees, the clusters identified are focused on a low digitalization assessment, although the distinction between clusters is made by the number of employees, and above all, an important role is played by the digital mindset, as generating a culture open to sharing and collaboration is fundamental for the growth of any digitalization process.
The same clusters are also identified in the sample of medium-sized companies (50 to 249 employees), the only significant difference being the level of digital maturity, which is in the middle range. Figure 18 shows a graphical representation of the clusters obtained.
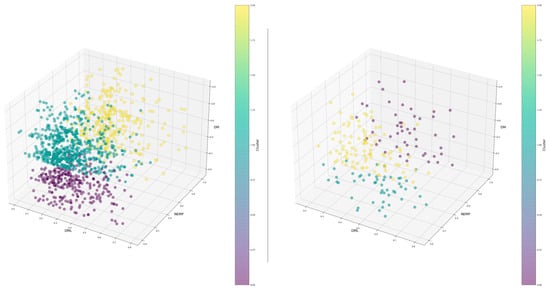
Figure 18.
Cluster—10 to 49 employees|50 to 249 employees.
6. Discussion
The process utilized enables the generation of an individual assessment score for the digital maturity level of each company. The flexibility of the model, which incorporates AHP and fuzzy models, allows for customization of the weight assignment process, the introduction of new criteria, and an enhanced decision-making process involving multiple experts []. This adaptability ensures that the model can be tailored to specific requirements and evolving business contexts.
Furthermore, the obtained score should guide the company towards the next steps of digitalization required to become a digital champion, as well as the technological tools to be implemented. An important milestone in this process is the integration of all company information, both internal, such as enterprise resource planning (ERP) [,] and customer relationship management (CRM) [], and external, through other sources of information beyond the organization, such as social media networks. This enables a 360° evaluation of market knowledge, customers and suppliers.
The clusters defined in Table 14 and Table 15 have been obtained, and they can continue to grow as more information becomes available from companies willing to participate in this study. The clusters will be updated with the evolution of companies undergoing digital adaptation processes.
In Table 16, recommendations are provided for each cluster.

Table 16.
Recommendation strategy for each cluster (10–49 employees).
For the medium-sized enterprise segment, the recommendations are basically the same per cluster, the difference being the higher degree of digitalization; therefore, the digital transformation processes will be based on the integration of tools and equipping the company with real-time analytics systems and predictive models.
As can be seen, the main work in any digitalization process is determined by the implementation of a change management process.
We have attempted to summarize the levels of digitalization and evaluation in Figure 19.
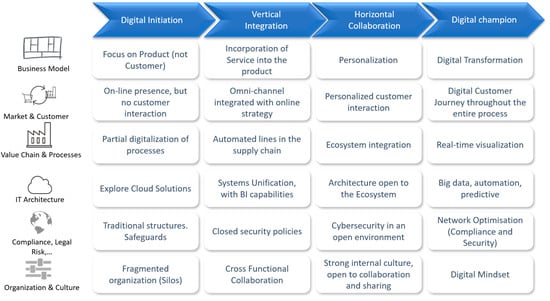
Figure 19.
Levels of digital maturity by knowledge area.
7. Conclusions
This study aimed to evaluate the digital maturity level of SMEs within the Spanish business landscape, utilizing a sample of 1428 companies. In the subsequent phase, a clustering process was employed to derive global recommendations tailored to specific clusters and company segments, namely small and medium-sized businesses.
The findings reveal that the digital maturity level of the studied sample ranges from low to medium, which imposes limitations on the growth potential of these companies. Notably, across both segments, an essential factor observed is the significance of the digital mindset in driving change management processes.
Based on the identified clusters and digitization graphs per criterion, the initial step in the digital transformation journey involves enhancing the digital maturity of the company’s workforce. Once this hurdle is overcome, the focus shifts towards digitizing operational processes, enabling the integration of data to establish a unified information framework. The availability of consolidated data empowers companies to analyze information, gain insights from data and develop predictive models for informed decision making. This provides significant advantages to the organization in terms of strategic decision making.
Regarding the necessary technological tools, every company should consider implementing ERP and CRM systems, integrating them with both offline and online sales solutions. Furthermore, integrating data generated by these internal tools into a centralized data model, supported by analytics and business intelligence tools and explainable artificial intelligence [,], can greatly enhance the decision-making process.
While the developed model can be applied to any business environment, it is advisable to conduct a sector-specific study for more accurate results. Each sector may have specific criteria that are more relevant to its digitalization process, and therefore, the number of criteria considered in the model may vary accordingly. Additionally, the estimated decisions derived from the AHP group decision-making model may differ based on the characteristics and requirements of each sector.
By conducting a sectorial analysis, organizations can tailor the evaluation and decision-making process to their specific industry needs, ensuring a more comprehensive and accurate assessment of their digitalization efforts. This approach allows for a more targeted and effective strategy to address the unique challenges and opportunities within each sector, facilitating the adoption of appropriate digital transformation initiatives.
8. Future Works
The findings from this study, which integrate insights from the current state of the art, industry knowledge and the specific requirements of small and medium enterprises, highlight several areas for improvement and potential avenues for future research. These include the following:
- Extend the model to any industry and use it as a group decision-making procedure in any business decision process.
- Provide a website that allows more companies to be scored, and thereby obtain a tighter data model to refine the clustering of companies and improve the recommendation process.
- Develop an application that can assess the level of digital maturity for any member of the small and medium enterprise (SME) group and provide tailored recommendations for the implementation of technological tools.
- Design a planning process to guide SMEs in effectively adopting and integrating the recommended tools into their operations.
- Conduct further research on the specific technological needs and challenges faced by SMEs in different industries and sectors.
- Explore the potential of emerging technologies, such as artificial intelligence and automation, in supporting the digital transformation of SMEs.
- Investigate the impact of digital maturity on the overall performance and competitiveness of SMEs.
- Collaborate with industry experts and stakeholders to create a comprehensive framework for assessing and enhancing digital maturity in SMEs.
- Evaluate the effectiveness of different strategies and approaches in promoting digitalization among SMEs, considering factors such as cost-effectiveness and scalability.
- Continuously update and refine the digital maturity assessment model to incorporate new trends and advancements in technology.
- Provide training and support programs to help SMEs effectively navigate the digital transformation process and maximize the benefits of digital tools and solutions.
- Investigate the correlation between the level of digital maturity of a company and its revenue, number of clients and employees. Analyze how technological growth influences the development and evolution of the business model.
- Develop explainable AI models to detect employee attrition, which is a direct consequence of the level of digitalization. Address the challenge of retaining highly skilled employees amidst the ongoing digital transformation. Simultaneously focus on change management and growth strategies to mitigate the risk of losing valuable personnel.
- Expand the developed model into a decision-making methodology based on multi-criteria and multi-decision-maker approaches, considering various domains of numerical, interval and linguistic representation. Incorporate fuzzy linguistic models to enhance the decision-making process.
- Explore the integration of machine learning algorithms and data analytics techniques to identify patterns and insights related to digital maturity and business performance. Analyze how specific digitalization strategies impact key performance indicators and overall organizational success.
- Conduct case studies and empirical research to validate the effectiveness and applicability of the developed models and methodologies in real-world scenarios. Gather feedback from SMEs and industry experts to further refine and improve the approaches.
Author Contributions
Conceptualization, G.M.D. and J.L.G.S.; methodology, G.M.D.; software, G.M.D.; validation, G.M.D. and J.L.G.S.; formal analysis, G.M.D. and J.L.G.S.; investigation, G.M.D. and J.L.G.S.; resources, G.M.D. and J.L.G.S.; data curation, G.M.D. and J.L.G.S.; writing—original draft preparation, G.M.D. and J.L.G.S.; writing—review and editing, G.M.D. and J.L.G.S.; visualization, G.M.D. and J.L.G.S.; supervision, G.M.D. and J.L.G.S.; project administration, G.M.D. and J.L.G.S.; funding acquisition. All authors have read and agreed to the published version of the manuscript.
Funding
This research received no external funding.
Data Availability Statement
Not applicable.
Conflicts of Interest
The authors declare no conflict of interest.
References
- Kraus, S.; Jones, P.; Kailer, N.; Weinmann, A.; Chaparro-Banegas, N.; Roig-Tierno, N. Digital Transformation: An Overview of the Current State of the Art of Research. Sage Open 2021, 11, 21582440211047576. [Google Scholar] [CrossRef]
- Grigorescu, A.; Pelinescu, E.; Ion, A.E.; Dutcas, M.F. Human capital in digital economy: An empirical analysis of central and Eastern European countries from the European Union. Sustainability 2021, 13, 2020. [Google Scholar] [CrossRef]
- Zhang, H.; Dong, Y.; Chiclana, F.; Yu, S. Consensus efficiency in group decision making: A comprehensive comparative study and its optimal design. Eur. J. Oper. Res. 2019, 275, 580–598. [Google Scholar] [CrossRef]
- Agrawal, A.; Cockburn, I.; Rosell, C. Not Invented Here? Innovation in company towns. J. Urban Econ. 2010, 67, 78–89. [Google Scholar] [CrossRef]
- Majchrzak, A.; Markus, M.L.; Wareham, J. Special Issue: ICT and Societal Challenges Designing for Digital Transformation: Lessons for Information Systems Research from the Study of ICT and Societal Challenges. MIS Q. 2016, 40, 267–277. [Google Scholar] [CrossRef]
- Vial, G. Understanding digital transformation. In Managing Digital Transformation; Routledge: Oxfordshire, UK, 2021; pp. 13–66. [Google Scholar] [CrossRef]
- Chawla, R.N.; Goyal, P. Emerging trends in digital transformation: A bibliometric analysis. Benchmarking Int. J. 2022, 29, 1069–1112. [Google Scholar] [CrossRef]
- Wessel, L.; Baiyere, A.; Ologeanu-Taddei, R.; Cha, J.; Jensen, T.B. Unpacking the difference between digital transformation and it-enabled organizational transformation. J. Assoc. Inf. Syst. 2021, 22, 102–129. [Google Scholar] [CrossRef]
- D’Almeida, A.L.; Bergiante, N.C.R.; de Souza Ferreira, G.; Leta, F.R.; de Campos Lima, C.B.; Lima, G.B.A. Digital transformation: A review on artificial intelligence techniques in drilling and production applications. Int. J. Adv. Manuf. Technol. 2022, 119, 5553–5582. [Google Scholar] [CrossRef]
- Berghaus, S.; Back, A. Stages in Digital Business Transformation: Results of an Empirical Maturity Study. Completed Research. Association for Information Systems AIS Electronic Library (AISeL). 2016. Available online: http://aisel.aisnet.org/mcis2016/22 (accessed on 1 June 2023).
- Williams, C.; Schallmo, D.; Lang, K.; Boardman, L. Digital Maturity Models for Small and Medium-Sized Enterprises: A Systematic Literature Review. Available online: www.ispim.org (accessed on 1 June 2023).
- Teichert, R. Digital transformation maturity: A systematic review of literature. Acta Univ. Agric. Silvic. Mendel. Brun. 2019, 67, 1673–1687. [Google Scholar] [CrossRef]
- Westerman, G.; Bonnet, D.; McAfee, A. Leading Digital: Turning Technology into Business Transformation; Harvard Business Press: Brighton, MA, USA, 2014. [Google Scholar]
- Chanias, S.; Hess, T. How Digital Are We? Maturity Models for the Assessment of a Company’s Status in the Digital Transformation; Managment Report; Institute for Information Systems and New Media: Munich, Germany, 2016; Volume 2, pp. 1–14. [Google Scholar]
- Thordsen, T.; Murawski, M.; Bick, M. How to Measure Digitalization? A Critical Evaluation of Digital Maturity Models; Lecture Notes in Computer Science (Including Subseries Lecture Notes in Artificial Intelligence and Lecture Notes in Bioinformatics); Springer: Berlin/Heidelberg, Germany, 2020; pp. 358–369. [Google Scholar] [CrossRef]
- Mettler, T. Thinking in Terms of Design Decisions When Developing Maturity Models. Int. J. Strateg. Decis. Sci. 2010, 1, 76–87. [Google Scholar] [CrossRef]
- Aras, A.; Büyüközkan, G. Digital Transformation Journey Guidance: A Holistic Digital Maturity Model Based on a Systematic Literature Review. Systems 2023, 11, 213. [Google Scholar] [CrossRef]
- Valdez-De-Leon, O. A Digital Maturity Model for Telecommunications Service Providers. 2016. Available online: www.timreview.ca (accessed on 1 June 2023).
- Almasbekkyzy, A.; Abdikerim, D.; Nabi, D.; Abdallah, Y.O.; Shehab, E. Digital Maturity and Readiness Model for Multiple-Case of Kazakhstan Large Companies. In Proceedings of the SIST 2021—2021 IEEE International Conference on Smart Information Systems and Technologies, Nur-Sultan, Kazakhstan, 28–30 April 2021. [Google Scholar] [CrossRef]
- Cordes, A.K.; Musies, N. Accelerating the transformation? the impact of COVID-19 on the digital maturity of retail businesses. In Proceedings of the 2021 IEEE 23rd Conference on Business Informatics, CBI 2021, Bolzano, Italy, 1–3 September 2021; pp. 102–110. [Google Scholar] [CrossRef]
- Yang, Y.; Gai, T.; Cao, M.; Zhang, Z.; Zhang, H.; Wu, J. Application of Group Decision Making in Shipping Industry 4.0: Bibliometric Analysis, Trends, and Future Directions. Systems 2023, 11, 69. [Google Scholar] [CrossRef]
- Savlovschi, L.I.; Robu, N.R. The Role of SMEs in Modern Economy. Econ. Ser. Manag. 2011, 14, 277–281. [Google Scholar]
- Veskaisri, K.; Chan, P.; Pollard, D. Relationship between Strategic Planning and SME Success: Empirical Evidence from Thailand; Asia and Pacific DSI; International DSI: Jamaica, NY, USA, 2007; pp. 1–13. [Google Scholar]
- Instituto Nacional de Estadística (INE). Estadística Estructural de Empresas: Sector Industrial, Sector Comercio, Sector Servicios; INE: Madrid, Spain, 2022; Available online: http://www.ine.es (accessed on 31 May 2023).
- Schallmo, D.; Williams, C.A.; Boardman, L. Digital transformation of business models-best practice, enablers, and roadmap. Int. J. Innov. Manag. 2017, 21, 1740014. [Google Scholar] [CrossRef]
- Grönroos, C.; Voima, P. Critical service logic: Making sense of value creation and co-creation. J. Acad. Mark. Sci. 2013, 41, 133–150. [Google Scholar] [CrossRef]
- Zhu, X.; Xiao, Z.; Dong, M.C.; Gu, J. The fit between firms’ open innovation and business model for new product development speed: A contingent perspective. Technovation 2019, 86–87, 75–85. [Google Scholar] [CrossRef]
- Ignat, V. Digitalization and the global technology trends. IOP Conf. Ser. Mater. Sci. Eng. 2017, 227, 012062. [Google Scholar] [CrossRef]
- Setia, P.; Venkatesh, V.; Joglekar, S. Leveraging digital technologies: How information quality leads to localized capabilities and customer service performance. MIS Q. 2013, 37, 565–590. [Google Scholar] [CrossRef]
- Bouncken, R.B.; Kraus, S.; Roig-Tierno, N. Knowledge- and innovation-based business models for future growth: Digitalized business models and portfolio considerations. Rev. Manag. Sci. 2021, 15, 1–14. [Google Scholar] [CrossRef]
- Berman, S.J. Digital transformation: Opportunities to create new business models. Strategy Leadersh. 2012, 40, 16–24. [Google Scholar] [CrossRef]
- Kittipanya-ngam, P.; Tan, K.H. A framework for food supply chain digitalization: Lessons from Thailand. Prod. Plan. Control 2020, 31, 158–172. [Google Scholar] [CrossRef]
- Henriette, E.; Feki, M.; Boughzala, I. Digital Transformation Challenges Recommended Citation. Association for Information Systems AIS Electronic Library (AISeL). 2016. Available online: http://aisel.aisnet.org/mcis2016http://aisel.aisnet.org/mcis2016/33 (accessed on 1 June 2023).
- Hagberg, J.; Sundstrom, M.; Egels-Zandén, N. The digitalization of retailing: An exploratory framework. Int. J. Retail. Distrib. Manag. 2016, 44, 694–712. [Google Scholar] [CrossRef]
- Bekkhus, R. Do KPIs used by CIOs Decelerate Digital Business Transformation? The Case of ITIL. 2016. Available online: http://aisel.aisnet.org/digit2016/16 (accessed on 1 June 2023).
- Hartl, E.; Hess, T. The Role of Cultural Values for Digital Transformation: Insights from a Delphi Study. In Proceedings of the 23rd Americas Conference on Information Systems (AMCIS 2017), Boston, MA, USA, 10–12 August 2017. [Google Scholar]
- Li, L.; Su, F.; Zhang, W.; Mao, J.Y. Digital transformation by SME entrepreneurs: A capability perspective. Inf. Syst. J. 2018, 28, 1129–1157. [Google Scholar] [CrossRef]
- Remane, G.; Hanelt, A.; Nickerson, R.C.; Kolbe, L.M. Discovering digital business models in traditional industries. J. Bus. Strategy 2017, 38, 41–51. [Google Scholar] [CrossRef]
- Weersink, A.; Fraser, E.; Pannell, D.; Duncan, E.; Rotz, S. Opportunities and Challenges for Big Data in Agricultural and Environmental Analysis. Annu. Rev. Resour. Econ. 2018, 10, 19–37. [Google Scholar] [CrossRef]
- Bécue, A.; Praça, I.; Gama, J. Artificial intelligence, cyber-threats and Industry 4.0: Challenges and opportunities. Artif. Intell. Rev. 2021, 54, 3849–3886. [Google Scholar] [CrossRef]
- Rytova, E.; Verevka, T.; Gutman, S.; Kuznetsov, S. Assessing the Maturity Level of Saint Petersburg’s Digital Government. Int. J. Technol. 2020, 11, 1081–1090. [Google Scholar] [CrossRef]
- Caiado, R.G.G.; Scavarda, L.F.; Gavião, L.O.; Ivson, P.; de Mattos Nascimento, D.L.; Garza-Reyes, J.A. A fuzzy rule-based industry 4.0 maturity model for operations and supply chain management. Int. J. Prod. Econ. 2021, 231, 107883. [Google Scholar] [CrossRef]
- Li, J.; Dou, K.; Wen, S.; Li, Q. Monitoring index system for sectors’ digital transformation and its application in China. Electronics 2021, 10, 1301. [Google Scholar] [CrossRef]
- Behera, S.; Panigrahi, M.K. Gold Prospectivity Mapping in the Sonakhan Greenstone Belt, Central India: A Knowledge-Driven Guide for Target Delineation in a Region of Low Exploration Maturity. Nat. Resour. Res. 2021, 30, 4009–4045. [Google Scholar] [CrossRef]
- Sándor, Á.; Gubán, Á. A Measuring Tool for the Digital Maturity of Small and Medium-Sized Enterprises. Manag. Prod. Eng. Rev. 2021, 12, 133–143. [Google Scholar] [CrossRef]
- Rasouli, H.; Valmohammadi, C.; Azad, N.; Esfeden, G.A. Proposing a digital identity management framework: A mixed-method approach. Concurr. Comput. 2021, 33, e6271. [Google Scholar] [CrossRef]
- Telnov, Y.F.; Bryzgalov, A.A.; Kozyrev, P.A.; Koroleva, D.S. Choosing the type of business model to implement the digital transformation strategy of a network enterprise. Bus. Inform. 2022, 16, 50–67. [Google Scholar] [CrossRef]
- Chen, Q.; Zhang, W.; Jin, N.; Wang, X.; Dai, P. Digital Transformation Evaluation for Small- and Medium-Sized Manufacturing Enterprises Using the Fuzzy Synthetic Method DEMATEL-ANP. Sustainability 2022, 14, 13038. [Google Scholar] [CrossRef]
- Vimel, K.E.K.; Nadeem, S.P.; Sunil, S.M.; Suresh, G.; Sanjeev, N.; Kandasamy, J. Modelling the strategies for improving maturity and resilience in medical oxygen supply chain through digital technologies. J. Glob. Oper. Strateg. Sourc. 2022, 15, 566–595. [Google Scholar] [CrossRef]
- Perotti, S.; Bastidas Santacruz, R.F.; Bremer, P.; Beer, J.E. Logistics 4.0 in warehousing: A conceptual framework of influencing factors, benefits and barriers. Int. J. Logist. Manag. 2022, 33, 193–220. [Google Scholar] [CrossRef]
- Thomas, T.; Saleeshya, P.G. CMMI based fuzzy logic approach to assess the digital manufacturing maturity level of manufacturing industries. TQM J. 2023. ahead-of-print. [Google Scholar] [CrossRef]
- Nebati, E.E.; Ayvaz, B.; Kusakci, A.O. Digital transformation in the defense industry: A maturity model combining SF-AHP and SF-TODIM approaches. Appl. Soft Comput. 2023, 132, 109896. [Google Scholar] [CrossRef]
- Díaz, G.M.; Carrasco, R.A.; Gómez, D. RFID: A Fuzzy Linguistic Model to Manage Customers from the Perspective of Their Interactions with the Contact Center. Mathematics 2021, 9, 2362. [Google Scholar] [CrossRef]
- Herrera, F.; Martinez, L. An approach for combining linguistic and numerical information based on the 2-tuple fuzzy linguistic representation model in decision-making. Int. J. Uncertain. Fuzziness Knowl.-Based Syst. 2000, 8, 539–562. [Google Scholar] [CrossRef]
- Herrera, F.; Martínez, L. A 2-tuple fuzzy linguistic representation model for computing with words. IEEE Trans. Fuzzy Syst. 2000, 8, 746–752. [Google Scholar] [CrossRef]
- Khaira, A.; Dwivedi, R.K. A State of the Art Review of Analytical Hierarchy Process. Mater. Today Proc. 2018, 5, 4029–4035. [Google Scholar] [CrossRef]
- Cid-López, A.; Hornos, M.J.; Carrasco, R.A.; Herrera-Viedma, E. Applying a linguistic multi-criteria decision-making model to the analysis of ICT suppliers’ offers. Expert Syst. Appl. 2016, 57, 127–138. [Google Scholar] [CrossRef]
- Saaty, T.L. The Analytic Hierarchy Process: Planning, Priority Setting, Resource Allocation LK; McGraw-Hill International Book Co.: New York, NY, USA, 1980; Volume 13, 287p, Available online: https://ucm.on.worldcat.org/oclc/911278091 (accessed on 1 June 2023).
- Bernasconi, M.; Choirat, C.; Seri, R. The Analytic Hierarchy Process and the Theory of Meausurement; Working Paper No. 24; Department of Economics, Ca’Foscari University of Venice: Venice, Italy, 2009. [Google Scholar]
- Saaty, T.L. Decision making with the analytic hierarchy process. J. Manuf. Technol. Manag. 2008, 26, 791–806. [Google Scholar] [CrossRef]
- Herrera, F.; Martínez, L.; Sánchez, P.J. Managing non-homogeneous information in group decision making. Eur. J. Oper. Res. 2005, 166, 115–132. [Google Scholar] [CrossRef]
- Herrera, F.; Herrera-Viedma, E.; Martínez, L. A fusion approach for managing multi-granularity linguistic term sets in decision making. Fuzzy Sets Syst. 2000, 114, 43–58. [Google Scholar] [CrossRef]
- Díaz, G.M.; González, R.A.C. Fuzzy Logic and Decision Making Applied to Customer Service Optimization. Axioms 2023, 12, 448. [Google Scholar] [CrossRef]
- Lasi, H.; Fettke, P.; Kemper, H.G.; Feld, T.; Hoffmann, M. Industry 4.0. Bus. Inf. Syst. Eng. 2014, 6, 239–242. [Google Scholar] [CrossRef]
- Oztemel, E.; Gursev, S. Literature review of Industry 4.0 and related technologies. J. Intell. Manuf. 2020, 31, 127–182. [Google Scholar] [CrossRef]
- Kumar, V.; Reinartz, W. Strategic Customer Relationship Management Today; Springer: Berlin/Heidelberg, Germany, 2012; pp. 3–20. [Google Scholar] [CrossRef]
- Díaz, G.M.; Galán, J.J.; Carrasco, R.A. XAI for Churn Prediction in B2B Models: A Use Case in an Enterprise Software Company. Mathematics 2022, 10, 3896. [Google Scholar] [CrossRef]
- Molnar, C. Interpretable Machine Learning. A Guide for Making Black Box Models Explainable; Learnpub: Victoria, BC, Canada, 2019; p. 247. [Google Scholar]
Disclaimer/Publisher’s Note: The statements, opinions and data contained in all publications are solely those of the individual author(s) and contributor(s) and not of MDPI and/or the editor(s). MDPI and/or the editor(s) disclaim responsibility for any injury to people or property resulting from any ideas, methods, instructions or products referred to in the content. |
© 2023 by the authors. Licensee MDPI, Basel, Switzerland. This article is an open access article distributed under the terms and conditions of the Creative Commons Attribution (CC BY) license (https://creativecommons.org/licenses/by/4.0/).