Abstract
Climate change is the main cause of frequent extreme weather and natural disasters. Therefore, effective climate adaptation strategies for urban rail transit (URT) should be adopted to cope with extreme precipitation events (EPEs). This study proposes a decision-making model based on climate change for drainage renovation, which consists of an optimal renovation sequence model and an optimal investment timing model. This study analyzes the inundation risk of each station and its node importance in the URT network and then uses a multi-attribute decision analysis (MADA) to determine the optimal renovation sequence. This study also uses a real options pricing approach to calculate the value of an option in order to defer the renovation project and determine the optimal investment timing. Then, the Beijing Urban Rail Transit (BURT) is taken as an example to conduct an empirical analysis of the proposed model. Considering the uncertainty of climate change and the complexity of the URT network, the model can obtain the optimal renovation sequence and the investment timing of each station, which is expected to provide a decision-making tool for urban governments to formulate an optimal plan that strengthens the prevention of flooding disasters.
1. Introduction
As one of the most hazardous natural disasters, flooding is frequently responsible for losses of life and severe damage to infrastructure and the environment, causing significant environmental and economic losses, as well as social interruption [1]. Due to global climate change, it is likely that EPEs will become more intense and frequent in many regions and cause greater losses in the future [2]. Urban areas are more vulnerable to the disruption of public services due to the dense population, so urban flooding caused by EPEs has become increasingly prominent.
This paper uses the scenario analysis method based on Geographic Information System (GIS) to simulate the waterlogging depth of each rail transit station, and uses the characteristic index of complex network theory to evaluate the importance of each rail transit station, comprehensively considers the climate, terrain elements and topological characteristics of each rail transit station, and uses the TOPSIS method based on entropy weight to conduct multi-criteria decision analysis, so as to determine the optimal transformation sequence of each rail transit station. In addition, considering the uncertainty of climate change, the probability prediction model is used to fit the probability of extreme precipitation events, after which the expected loss caused by extreme precipitation events is estimated, and the binary tree option pricing model is used to determine the optimal investment time of each rail transit station.
The main contributions of this study can be summarized as follows: (i) in contents: First, we expand the spatial scale of the infrastructure renovation and take local governments as the decision-making entity responsible for renovating URT stations at an urban scale. Second, we overcome the limitations of previous studies and regard the renovation of URT stations as an independent behavior in sequence rather than as a whole behavior; that is, this study conducts the research from both overall and individual perspectives; (ii) in methods: First, aimed at the specific URT object, we introduce complex network theory (CNT) into urban flooding risk assessment, and comprehensively consider external environment and intrinsic property, which improves the comprehensiveness of decision making. Second, we select indicators to evaluate the node importance in URT networks from three different perspectives, namely, node local attribute, network global attribute and network dynamic failure, which improves the accuracy of the node importance measuring. Finally, in the measurement of investment incomes, besides direct losses caused by EPEs, we also estimate indirect losses through input-output analysis (IOA), which is suitable for the economic loss assessment of disasters at an urban scale.
The remainder of this study is organized as follows. Section 2 explains the optimal renovation sequence model and the optimal investment timing model for drainage renovation of URT stations, respectively. We then use a case study of the Beijing Urban Rail Transit (BURT) in Section 3, and we discuss the problems related to investment timing in Section 4. Finally, Section 5 concludes the entire study and proposes future research directions.
2. Literature Review
Urban rail transit (URT) plays a vital role in the smooth running and long-term development of cities [3,4,5]. Due to the relatively low geographical location of URT stations, the occurrence of EPEs often has a severe impact on URT infrastructures, including water intrusion, subway suspension, and passenger retention [6]. The frequent occurrence of EPEs has brought tremendous pressure to existing URT infrastructures, and the relatively lagging drainage facilities have been unable to meet the increasing demand for discharging, such a large volume of water [7]. Local governments play a major role in preventing urban flooding, so they should formulate climate adaptation strategies based on multiple factors [8,9]. Considering the limited human, material and financial resources of local governments, the drainage capacity of URT needs to be gradually renovated in a planned way. Therefore, it is crucial for local governments to determine the optimal renovation sequence and investment timing for URT stations.
The research objects in the field of infrastructure investment are mostly long-term public projects with enormous sunk costs, such as roads [10], airports [11], and ports [12]. Early studies on infrastructure investment analysis mainly focused on solving static and deterministic problems [13]. However, with the deepening of this field, many articles have begun to consider the uncertainty and risk faced by long-term investment. As a complex system, the renovation of each URT station can be regarded as a relatively independent behavior with a sequence. In the existing studies on infrastructure investment, the research scopes are mainly focused on some small-scale areas, such as communities [14], universities [15], and landmark regions [16], with few studies from urban scales, especially the renovation of URT. Most studies take the URT as a whole to analyze the investment decision-making scheme, without considering the complexity of URT networks constructed by multiple stations [17]. Previous studies have mainly focused on the risk of urban waterlogging disasters, complex network studies, or single issue of economic evaluation of project investment, without considering how urban rail transit drainage facilities should be invested in decision making from the overall perspective of local governments in the context of extreme precipitation.
3. Materials and Methods
In the case of limited human, material and financial resources, in order to gradually improve the drainage capacity of URT stations in a planned way, we established a decision-making model for the drainage renovation of URT considering the risk of disaster-bearing bodies, the importance of disaster-bearing bodies in the URT network and the uncertainty of climate change. As shown in Figure 1, the entire model mainly intends to solve two problems: (i) how to determine the optimal renovation sequence of URT stations and (ii) how to determine the optimal investment timing of URT stations.
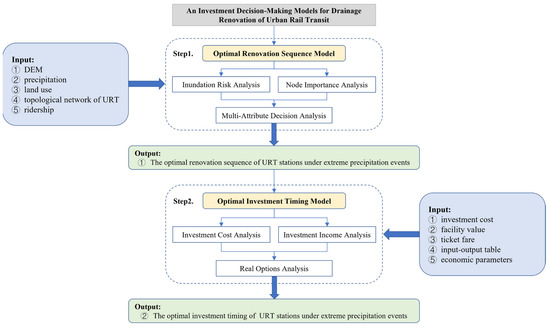
Figure 1.
A decision model for drainage renovation of URT.
3.1. Optimal Renovation Sequence Model
The differences between stations in terms of precipitation, location, soil type, etc., may result in diverse flood risks in each disaster-bearing body. Thus, it is necessary to analyze the inundation risk of each station in the URT network, and vulnerable stations should be given priority for renovation. Furthermore, the complexity of URT may lead to various levels of importance for each station in the entire network. It is thus necessary to analyze the node importance of each station in the URT network, where stations with greater node importance have the right to be preferentially renovated.
3.1.1. Inundation Risk Analysis
By using scenario-based analysis, we combine GIS technology with FloodArea, a two-dimensional (2D) hydrodynamic model developed by Geomer Company of Germany, to produce inundation maps (including the flood extent and depth) under different scenarios. This method fully considers the two dimensions of time and space, which can provide a feasible means for the dynamic simulation of flooding.
Inundation simulation using FloodArea requires four types of data input. First, the digital elevation model (DEM) is the most fundamental form of data in GIS-related research, which is the premise of rainfall analysis, inundation analysis, flood storage calculation, etc.
Second, the spatial distribution of rainfall constitutes the core data for inundation simulation by FloodArea, whose value is determined by surface runoff in different submerged scenarios and represented by the runoff coefficient in raster form. However, it is difficult to predict future precipitation due to the high spatiotemporal variability of rainfall. In order to solve this problem, we apply the P-III distribution, a type of skewness curve with unimodal and continuous characteristics, to fit the extremum of annual and monthly maximum daily precipitation. The P-III distribution can describe the correspondence between precipitation extremum and probability in different return periods, which is suitable for predicting the probability of maximum precipitation at a random time. The probability density function and the distribution function are as follows:
where is the gamma function of , and , , and are the parameters of P-III in terms of shape, scale, and location, respectively, i.e., , , and . and are the variation and skew coefficients of the variable , respectively.
Because the surface has a certain water storage capacity, redundant water may temporarily infiltrate if the rainfall is small. Only when storage reaches its limit will water flow to the lower terrain, thus forming surface runoff. EPEs are bound to produce surface runoff, so we select the SCS-CN empirical model proposed by the U.S. Soil Conservation Service for direct runoff estimation in urban flooding areas. The SCS-CN model is based on the water balance equation, which fully accounts for the effects of soil texture, land use, hydrologic conditions, and initial soil moisture conditions on rainfall runoff. The model is formulated as follows:
where is the total rainfall depth (mm), is the direct surface runoff (mm), is the potential maximum retention after runoff begins (mm), is the runoff coefficient, and is an integrated parameter reflecting the characteristics of the underlying surfaces, which depends on soil antecedent moisture condition, soil type, and land use.
According to the actual situation, part of the rainwater enters the drainage system through the urban drainage pipe network after raining. Therefore, the runoff loss caused by the urban drainage is considered in the calculation of the direct surface runoff. The variable in Equation (5) is replaced by the variable in Equation (6):
where is the direct surface runoff after subtracting urban drainage, and is the total displacement (mm).
Third, the rainfall hydrograph contains the critical data for showing the correlation between precipitation and time, whose value can be obtained by transforming the hourly rainfall data of each meteorological observation station in the study area into hourly rainfall data of the entire study area via the Thiessen polygon approach. The total precipitation is calculated by Equation (7):
where and are measured precipitation and associated area of the Thiessen polygon for station , respectively; is the total area of the entire study area; is the number of Thiessen polygons.
Finally, hydraulic roughness is an optional property in FloodArea, which can measure the surface fluctuation and erosion degree. The roughness of the underlying surface will impact the confluence process of the surface water, resulting in differences in terms of discharge and velocity, so different roughness values are given to different land use types.
The above four types of information are input into the FloodArea for urban flooding simulation, and then maps of the inundation depth in a specific time interval are output. According to the China Meteorological Standard for flooding and waterlogging caused by a rainstorm in small- and medium-sized river basins, the inundation area and flood depth are vital factors affecting flood disaster risk and residential losses [18]. Therefore, we use ArcGIS to extract the inundation depth of each station in the map in order to measure the inundation risk through the inundation depth.
3.1.2. Node Importance Analysis
CNT establishes the complex system as an abstract network model, which is used to describe the relationship between individuals in the system and the overall characteristics of the system. To explore the characteristics of the URT network, we select the L-space method to perform abstract modeling, which reflects the geographical position of all the stations and the order in routes. In the L-space method, the nodes represent stations, and the edges between the two nodes only exist if they are adjacent stations [19].
In real life, the characteristics of the URT network are not merely embodied in topological factors, while passenger flow also has an essential impact on the entire network. An effective prediction method for passenger flow data can not only ensure the safe operation of the URT system, but also improve the evacuation efficiency in the case of traffic disruption [20]. Therefore, we establish an undirected weighted network, taking passenger flow as the edge weight, to describe the URT network, which shows the topological structure of the real network and dynamically expresses the temporal and spatial changes in the passenger flow.
To ensure the comprehensiveness of the evaluation results, we select indicators from three different perspectives, namely, node local attributes, network global attributes, and network dynamic failure, in order to evaluate the node importance in the URT network.
Local attributes of nodes focus on the analysis of the connection status between individual nodes. In this study, two indicators, degree centrality and node strength, are selected to directly measure the ability of a node to be evaluated in order to establish connection relations with its neighboring nodes. The degree centrality of node is defined as:
where is the degree of node , that is, the number of edges directly connected to node .
The node strength is the extension of the node degree in weighted networks, which considers both the topological connection status and the actual connection strength between nodes. The node strength of node is defined as:
where is the edge weight between node and node , and is the set of nodes adjacent to node .
Global attributes of the network focus on analyzing the influence of individual nodes in the entire network. In this study, betweenness centrality and closeness centrality are selected in order to measure the ability of a node to be evaluated and to establish connection relations with any other nodes in the network. The betweenness centrality of node is defined as:
where is the total number of the shortest paths between node and node , and is the number of shortest paths linking node and node through node .
The closeness centrality can reflect the connectivity of the network by using distance. The closeness centrality of node is defined as:
where is the shortest distance between node and node .
Dynamic failures of the network focus on the analysis of the impact of dynamic changes of nodes on the entire network. In this study, we select the index of the network efficiency change, which measures node importance through changes in the network efficiency before and after node deletion. The network efficiency is defined as:
Then, the relative reduction of the network efficiency of node , an index of network dynamic failure, is defined as:
where is the original network efficiency and is the residual network efficiency after node is deleted.
3.1.3. Multi-Attribute Decision Analysis
Comprehensive evaluation of multiple selected indicators is the key step in determining the optimal renovation sequence of drainage facilities in URT. Technique for order preference by similarity to an ideal solution (TOPSIS) is a numerical method for solving multi-attribute decision making (MADM) problems, whose ultimate principle is to ensure that the optimal solution has the shortest Euclidean distance from the positive ideal solution and the furthest distance from the negative ideal solution. TOPSIS technology is a compensation aggregation method that has the advantages of high computational efficiency and the ability to measure the relative performance of each scheme in a simple mathematical form [21,22].
However, with an increasing MADM complexity, the traditional TOPSIS method gradually presents problems, such as an overreliance on subjective weighting and inaccurate attribute weighting. Entropy weight method, as an objective evaluation method, is often applied to determine the weight according to the variation of indicators. Therefore, we introduce the entropy weight method on the basis of the TOPSIS method in order to assign multiple index weights so that the evaluation results are more objective and direct. Specifically, it can be divided into the following two steps: (i) using the entropy weight method to determine the indicator weights; (ii) using the TOPSIS method to give indicator ranking. The relative closeness degree is adopted to measure the comprehensive performance of each alternative:
where and represent the Euclidean distances from the positive and negative ideal solutions, respectively.
3.2. Optimal Investment Timing Model
In the context of EPEs, drainage renovation of URT is often faced with great uncertainties and risks. Whereas risks and benefits coexist, projects with high risks will have great potential benefits [23]. Therefore, it is necessary to evaluate the optimal investment timing of URT stations in the case of limited resources.
3.2.1. Investment Costs Analysis
Investment costs are composed of the construction costs during the construction period as well as the operation and management costs during the operational period.
In general, the decision-making period of infrastructure investment projects is relatively long, so the construction costs frequently change due to material price fluctuation, technological progress, and economic development [15]. We take the volatility of construction costs into account when making long-term estimates, assuming that the price increase of the construction costs due to labor, materials, and equipment is γ. Thus, the construction cost varying with time can be depicted as:
where is the initial construction cost.
We also assume that the operation and management cost is calculated as a certain proportion of the construction cost:
Hence, the investment costs can be denoted as:
3.2.2. Investment Incomes Analysis
Since it is difficult to measure the benefits brought about by the renovation in currency, the economic losses avoided by renovation are defined as the investment incomes of the project. When evaluating the losses of highly uncertain events, we adopt the probability and the actual losses to determine the expected economic losses :
With the continuous change in global climate, the occurrence of EPEs is affected, to some extent, so the probability of precipitation will show an overall upward trend in the future and eventually converge to a maximum by steadily advancing the countermeasures to mitigate global climate change [24]:
where is the current probability of precipitation, is the probability of precipitation when the climate system is stable, and is the growth rate of the precipitation probability.
Currently, the calculation of natural disaster losses in academia generally considers monetizable economic losses, losing sight of the noneconomic losses in politics, society, and the ecological environment. Therefore, we only analyze the economic losses, consisting of direct and indirect economic losses, triggered by EPEs in this study.
Among them, direct economic loss is defined as the sum of the facility loss directly affected by EPEs and the direct income loss due to closing the metro operations. When a city is attacked by EPEs, urban flooding can easily occur. Once the water depth reaches a certain height, it will pour into the underground space along the metro entrance, resulting in damage to facilities, such as the power supply system and the signal system. The facility losses can be represented as:
where is the value of the facilities damaged by urban flooding and is the demolition and installation cost for restoring the normal functions.
Furthermore, the passenger flow of URT is normally reduced when EPEs occur. Once excessive precipitation causes great social security risks, relevant departments may cease operations to ensure passenger safety. The revenue of the metro operation mainly comes from ticket sales, so extreme precipitation will bring great income losses to URT. The ticket losses can be written as:
where is the passenger volume at the initial state, is the passenger volume at the disrupted state, and is the average subway fare.
As previously mentioned, the direct economic losses of station can be described as:
With the progressively close connections between various sectors of society, the indirect losses caused by natural disasters are gradually occupying an important position among economic losses, even more so than direct losses [25]. Indirect economic loss is defined as the section-related loss in connection with the URT industry caused by EPEs. We adopt the input-output (IO) model to evaluate indirect losses, which can reflect the chain reaction and interaction of losses among various sectors. The indirect economic losses of other related sectors caused by the URT industry are calculated as:
where is the indirect economic losses of sector and and are both complete consumption coefficients.
3.2.3. Real Options Analysis (ROA)
To fully consider budget constraints and climate uncertainty, we propose an ROA method to provide managerial flexibility for investors in order to make decisions in a long investment cycle.
Assuming that investors are allowed to execute options in advance at any time during the decision-making period and that the investment timing is calculated in years, we use the binomial tree model to evaluate the value of an American call option. Calculating the value of underlying assets at the initial time takes the time value of money into account and is discounted from the expected losses in future years to the initial year:
where is the investment income at the initial time, is the investors’ expected rate of return, and is the duration of decision making.
In this study, we regard drainage renovation of the URT as holding an option to defer so that investors can compare the value of investing immediately with that of investing later in each time period. If the current value to invest is greater than the value of waiting, then the option should be exercised immediately. Otherwise, investors should continue to wait for a more profitable time to invest. Therefore, the option to defer at each time node can be confirmed as:
where is the risk-neutral probability, ; and are the option values associated with up () and down () movements, respectively, , , , and .
4. Case Study: Beijing Urban Rail Transit
To verify the feasibility of the proposed model, the BURT serves as the research object of this study. We comprehensively evaluate the optimal renovation sequence of each station in the BURT from the two aspects of inundation depth and node importance. Then, on the basis of the optimal renovation sequence, we estimate the income and costs of the drainage renovation and use the ROA method to determine the optimal investment timing of each station.
4.1. Study Area
As the political, economic, and cultural center of China, the permanent resident population in Beijing has increased in recent years. To alleviate traffic pressure, the BURT has been developed with unprecedented velocity since the 21st century, showing significant growth in terms of the number of lines and transfer stations. As of 2020, the BURT has 23 lines in operation with a total mileage of 699 km, making it one of the world’s largest URT systems [26].
However, with the rapid expansion of the BURT, the existing drainage facilities have gradually failed to meet the demand for flood control and discharge, leading to water intrusion into stations when EPEs occur. This may affect the regular operation of URT or even cause temporary paralysis of urban traffic. For instance, in July 2012, Beijing suffered the heaviest rainfall since complete meteorological records began in 1951. Twelve stations on the five lines were temporarily closed due to the heavy rainstorm. Therefore, local governments should take measures, such as drainage facility renovation, for urban flooding prevention. However, due to limited resources, it is necessary for decision makers to determine the sequence and timing of drainage renovation for URT stations.
4.2. Optimal Renovation Sequence of the BURT
4.2.1. Inundation Risk Analysis of the BURT
We use FloodArea, an ArcGIS extension, to simulate the inundation depth of each station by selecting the rainstorm option. The submerged simulation process has four types of input information. The first type of information, DEM data, are obtained by filling in an SRTM DEM with a 30 m spatial resolution for Beijing. The acquisition of the second type of information, the spatial distribution of rainfall, is based on rainfall data. The rainfall data used in this study include the daily precipitation of twenty national-level meteorological observation stations in Beijing, from 1 January 1991, to 13 August 2020, provided by the National Climate Center. Then, we adopt the Thiessen polygon approach to calculate the area weight coefficient of each meteorological station in order to obtain the third type of information, namely, the regional hourly rainfall file. The fourth type of information is hydraulic roughness, whose value is related to land use types. The land use data used in this study are derived from the Finer Resolution Observation and Monitoring of Global Land Cover (FROM-GLC) of Tsinghua University, with a 30 m spatial resolution in 2017.
Taking the 100-year return period as an example, we input the above four types of data into FloodArea to conduct a dynamic simulation of 24 h inundation in Beijing. The selection of CN in the SCS-CN model refers to the report released by the Soil Conservation Service of the United States Department of Agriculture. The drainage parameters are not set separately in FloodArea model; that is, we assume that the drainage capacity is the same everywhere. The 24 h inundation map in the return period of 100 years in Beijing is shown in Figure 2. When EPEs occur in Beijing, most of the submerged areas are located in the southeast of the city, while the northwest is barely flooded by rainstorms due to a high terrain and little rainfall. Finally, ArcGIS is adopted to extract the inundation depth of each station, which can evaluate the priority of the renovation sequence from the perspective of the inundation risk of the disaster-bearing body. Table 1 shows the top ten stations identified via inundation depth.
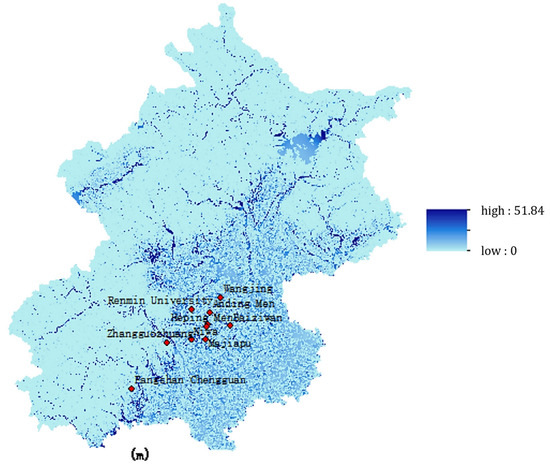
Figure 2.
24 h Inundation Map in the 100-year Return Period of Beijing.

Table 1.
Top 10 Stations Identified by Inundation Depth.
4.2.2. Node Importance Analysis of the BURT
Based on CNT, a typical L-space topological network representing the BURT with 340 nodes and 383 edges is built and plotted in Figure 3. The nodes in Figure 3 represent the metro stations, where the edges linking the nodes are the metro lines.
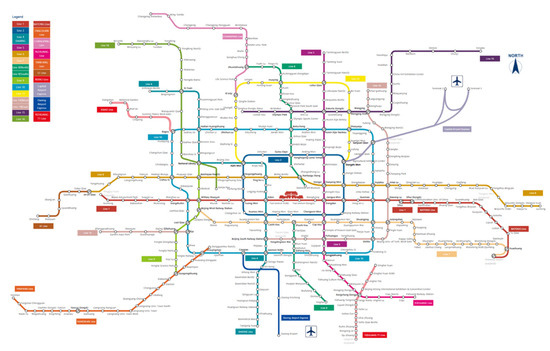
Figure 3.
Map of the Beijing Urban Rail Transit.
Due to the essential influence of passenger flow on the URT network, we take the daily average passenger flow between adjacent stations as the edge weight in order to construct a weighted network of the BURT. By using the daily ridership of operating lines published on the official website of the Beijing Subway and Beijing MTR Corporation, we can estimate the passenger flow of each station according to the population distribution. Assuming that the passenger flow of each station is related to the population density around it, we define the 2 km radius around the station as its served area based on the walking distance [20], and the population in the served area of station can be expressed as:
where is the population density of the served area.
Then, based on the total passenger flow of line , the passenger flow of station can be estimated according to the population weight, i.e., the ratio of the population in the served area of the station to the served area of the entire line:
where is the total passenger flow of line .
In addition, we assume that the passenger flow interaction between each station and its adjacent stations is equally distributed to calculate the edge weight of two neighboring nodes.
After obtaining the topological structure of the BURT, we use the Pajek program to generate a passenger flow weighted matrix. Then, we obtain five indicators, including degree centrality, node strength, betweenness centrality, closeness centrality, and relative reduction in network efficiency, of each station on the basis of the Python 2.7 platform. We apply the entropy-TOPSIS method to sort the node importance of each station. Table 2 displays the top ten stations identified by node importance.
Table 2.
Top 10 Stations Identified by Node Importance.
4.2.3. Optimal Renovation Sequence of the BURT
We integrate the two factors of the inundation risk and the node importance into the evaluation criteria of the optimal renovation sequence and perform a secondary calculation of the entropy-TOPSIS method. Specifically, the weights of the inundation risk and node importance are determined by the entropy method to be 0.64 and 0.36, respectively. Then, the closeness degrees between the feasible solutions to the ideal solutions are computed using the TOPSIS algorithm. Finally, we can obtain the optimal renovation sequence of drainage facilities in the BURT, with the results of the top ten stations shown in Table 3. In reference to Table 3, the top ranked stations are all transfer stations in the center of the BURT that carry a large passenger flow and are easily submerged by extreme precipitation. Consequently, local governments should give priority to drainage renovation at Wangjing Station to avoid the danger of water intrusion, followed by Zhichun Lu Station, etc.
Table 3.
Top 10 Stations in the Optimal Renovation Sequence Model.
5. Results and Discussion
Table A1 in Appendix A selects the top three stations in the optimal renovation model, namely Wangjing Station, Zhichun Road, and Xuanwumen Station, and calculates their construction costs, operation and management costs, and total investment costs. For the initial construction cost K for each station_ C0 a cost of 10 million yuan per kilometer is assumed. The average annual growth rate of construction costs is equal to China’s inflation rate, i.e γ = 3.50%. The operating and management costs are estimated at 3% of the construction cost.
The investment incomes of the drainage renovation of the BURT are measured by the expected economic losses that can be avoided in the future, including direct and indirect economic losses. Direct economic losses are divided into partial damage to the mechanical and electrical facilities inside the station caused by urban floods and ticket losses. Indirect losses are quantified through a new input-output table consisting of 43 departments, separating the input-output table of the urban rail transit industry from the existing 42 departments in Beijing in 2017 to reflect the input-output relationship with other related industries. For direct losses, it is assumed that the losses of communication equipment, signal equipment, power supply equipment, pipeline equipment, and fire protection equipment are calculated at 50% of the facility value, while the losses of HVAC systems, fire alarm systems, electrical and mechanical control systems, escalators, and elevators are calculated at 20% of the facility value, and the automatic toll system is calculated at 20% of the facility value. It is also assumed that the demolition and installation costs account for 10% of the facility value for the current year.
In terms of the other part of the direct economic losses, the ticket losses can be estimated by Equation (21), wherein we assume that there is one-third daily ridership losses of each station, and that the average subway fare of the BURT is deemed to be 4.3 yuan per person. With the continuous expansion of the BURT, the annual passenger flow increased from 468 million in 2001 to 3.96 billion in 2021 [26]. In particular, this trend has been growing annually since 2008. Thus, taking this rising trend of ridership into account, we conduct a linear fitting of the annual passenger flow over the years to predict the annual passenger flow of the BURT from 2021 to 2030, which is shown in Table 4.
Table 4.
Predicted Annual Passenger Flow of the BURT from 2021 to 2030 (Billion people).
According to Equation (18), the probability of precipitation is essential. Table 5 lists the probability of precipitation from 2021 to 2030, and Table A2 summarizes the direct and indirect economic losses of the first three stations in the 100-year return period rainfall.
Table 5.
Probabilities of Extreme Precipitation in the 100-year Return Period from 2021 to 2030.
Determining the model parameters is the premise of using ROA to make decisions on the optimal investment timing of the BURT drainage renovation.
First, we select the capital asset pricing model (CAPM) to reckon the expected return rate of investors , which is formulated as:
where is the risk-free rate whose value is the recent 5-year treasury bond yields issued by the Ministry of Finance, ; is the expected market return rate, whose value is the annual average return rate of the Shanghai Composite Index from 2009 to 2018, where ; and is the risk reward coefficient, whose value is obtained by averaging the ratio of the covariance between the monthly return of ten listed companies related to metro construction and the monthly return of the Shanghai Composite Index to the variance of the monthly return of the Shanghai Composite Index, where . Then, putting the above parameters into Equation (28), we can obtain .
Second, the volatility of underlying assets is also a key parameter in the ROA model. We also pick the ten companies mentioned above and take the closing stock price on the last trading day of each week in 2019 as a sample. Then, the volatility of project income is estimated to be .
Finally, it is essential to plan the exercise time before performing the ROA method. Drainage renovation of the URT is usually programmed for a long period. Combined with actual situations, we assume that investors can exercise the right to execute the option at any year within ten years, namely, , .
The project value is in line with the value evolution path of the binomial tree model. That is, the project value at the former moment will increase in the proportion of and decrease in the proportion of at the later moment, and the risk-neutral probability is calculated to be . Table A3, Table A4 and Table A5 in Appendix A show the project value of the top three stations, with shadows representing higher than ; that is, the current investment income is positive. Table A6, Table A7 and Table A8 in Appendix A show the option premium of the top three stations.
Table A9 summarizes the higher value of the immediate investment and the continuing waiting investment. Taking Wangjing Station as an example, it is economically feasible, but not necessarily optimal, for decision makers to invest in 2021. American options allow investors to exercise options at the expiry date in 2030, or at any time before the expiry date. Therefore, investors should consider whether to delay the exercise of options to obtain higher project incomes. Only when the value of waiting is less than that of investing immediately does the delay of execution become infeasible; otherwise, it is sensible to keep waiting. As shown in Table A3, the incomes of investing immediately from 2025 outweigh the option premium of waiting, which means decision makers can invest in Wangjing Station as early as 2025. Similarly, the value comparison results of Zhichun Lu Station and Xuanwu Men Station are summarized in Table A10 and Table A11 in Appendix A, which indicate that decision makers can invest in Zhichun Lu Station as early as 2026 and Xuanwu Men Station as early as 2028.
In the process of decision making, we find that, with the recursive sequence of station rankings, the drainage renovation of stations has been unable to generate investment incomes within the decision-making period (10 years). In other words, the results of the binomial tree model show that it is not feasible to renovate the drainage facilities at the BURT stations over 10 years. In this case, this article extends the investment decision cycle to 20 years and recalculates the rail transit stations that are not feasible for investment within 10 years, thereby determining the optimal investment time for each rail transit station. This section takes Dongzhimen Station, ranked 4th in the optimal renovation sequence, and Fuxingmen Station, ranked 5th, as examples. The calculation results show that investors can invest in Dongzhimen Station as early as 2032 and Fuxingmen Station as early as 2031.
Through the above calculation, this paper finds that in the investment decision-making model of rail transport infrastructure, the optimal reconstruction order obtained through inundation risk analysis and node importance analysis is staggered with the optimal investment time obtained through real option analysis. For example, when determining the optimal renovation sequence, the investment decision model suggests that priority should be given to investing in Dongzhimen Station before investing in Fuxingmen Station; however, when determining the optimal investment time, the investment decision-making model found that the earliest time for investors to invest in these two rail transit stations was at Fuxingmen Station before Dongzhimen Station. We believe that the reason for this phenomenon is that investment decision-making models have different standards for determining the optimal renovation sequence and optimal investment time. The determination of the optimal renovation sequence only considers objective factors such as climate, terrain, and topological structures, while the determination of the optimal investment time takes into account economic factors on the basis of the optimal renovation sequence; it further explains the importance of economic factors in the investment decision-making model of rail transport infrastructure. In addition, the optimal investment time determined by the binary tree pricing model is the earliest time that investors can invest in the rail transit drainage facility reconstruction project; that is, after this optimal investment time, there will be a node where the project value in the current year is greater than the investment cost, and it is economically feasible to invest every year thereafter. Therefore, decision-makers can adjust the optimal investment time of individual rail transit stations to meet the results of the optimal transformation sequence, while balancing and considering the optimal transformation sequence and optimal investment time.
6. Conclusions
This study starts from the specific research object of urban rail transit and combines CNT with situational inundation analysis, which involves the external environment and internal characteristics. We propose a decision-making model to determine the optimal renovation sequence and investment timing for urban rail transit drainage renovation in response to EPE. In order to consider the climate, terrain, and topology characteristics of each urban rail transit station, we used GIS-based scenario analysis and complex network metrics to obtain inundation depth and node importance, respectively. Then, we used the entropy TOPSIS method for MADM analysis and determined the optimal refurbishment order. In addition, we obtained the probability of EPE through a probability prediction model, and then estimated the expected loss through a combination of direct and indirect economic losses. The binomial tree model is used to determine the best investment opportunity.
In the optimal update sequence model, decision makers need to consider the inundation risk and node importance of urban rail transit stations under extreme precipitation circumstances. In the optimal investment timing model, we use the ROA method to compensate for the shortcomings of neglecting project uncertainty values in traditional economic evaluation methods. When the future investment situation is unclear or project information is insufficient, it is necessary to wait and immediately compare the option value at each time point with the investment value. Therefore, investors can determine the optimal investment timing in the long-term decision-making process to make the project economically feasible.
The model we propose in this study can not only provide practical guidance for climate adaptation infrastructure transformation in the context of EPE, but also provide scientific basis for strengthening the prevention of urban flood disasters. However, there are still some shortcomings in the accuracy of model construction. Firstly, when simulating inundation scenarios, we only evaluated the runoff converted by rainfall using an improved urban rainfall runoff model. In future research, available data from urban drainage pipelines can be used to further evaluate pipeline flow to better reflect the true flow formed by extreme precipitation. Secondly, when measuring the expected losses that drainage renovation can avoid, we only acknowledge economic losses. In future research, non-economic losses, such as their impact on society and the environment, can be further considered to comprehensively assess the impact of the environmental footprint.
Author Contributions
Conceptualization, T.W.; methodology, B.L.; software, S.L.; validation, S.L.; formal analysis, S.L.; investigation, T.W.; resources, T.W.; data curation, K.Z.; writing—original draft, T.W., B.L., S.L., K.Z. and M.M.; writing—review and editing, M.M.; visualization, T.W.; supervision, M.M.; project administration, T.W. and M.M.; funding acquisition, B.L. and T.W. All authors have read and agreed to the published version of the manuscript.
Funding
This research was funded by the National Natural Science Foundation of China, grant number No. 72134002, No. 72074034, No. 71871235; Key Projects of Philosophy and Social Sciences Research, Ministry of Education of China, grant number No.21JZD029; Bayu Scholar Program, grant number No.YS2020001; Chongqing Talents Program, grant number No. CQYC2021059075 and Fundamental Research Funds for the Central Universities of China, grant number No. 2021CDSKXYGG013, No. 2022CDJSKPY17.
Data Availability Statement
Some or all data, models, or code that support the findings of this study are available from the corresponding author upon reasonable request.
Acknowledgments
The authors are grateful to the editors and the anonymous reviewers for their insightful comments and suggestions.
Conflicts of Interest
The authors declare no conflict of interest.
Appendix A
Table A1, Table A2, Table A3, Table A4, Table A5, Table A6, Table A7, Table A8, Table A9, Table A10 and Table A11 are shown in the Appendix A.
Table A1.
Investment Costs of the Top Three Stations (104 RMB).
Table A1.
Investment Costs of the Top Three Stations (104 RMB).
| Year | 2021 | 2022 | 2023 | 2024 | 2025 | 2026 | 2027 | 2028 | 2029 | 2030 |
|---|---|---|---|---|---|---|---|---|---|---|
| Wangjing Station | ||||||||||
| Construction Costs | 1522 | 1575 | 1630 | 1687 | 1746 | 1808 | 1871 | 1936 | 2004 | 2074 |
| Operation and Management Costs | 46 | 47 | 49 | 51 | 52 | 54 | 56 | 58 | 60 | 62 |
| Total | 1568 | 1622 | 1679 | 1738 | 1799 | 1862 | 1927 | 1994 | 2064 | 2137 |
| Zhichun Lu Station | ||||||||||
| Construction Costs | 1323 | 1369 | 1417 | 1467 | 1518 | 1571 | 1626 | 1683 | 1742 | 1803 |
| Operation and Management Costs | 40 | 41 | 43 | 44 | 46 | 47 | 49 | 50 | 52 | 54 |
| Total | 1363 | 1410 | 1460 | 1511 | 1564 | 1618 | 1675 | 1734 | 1794 | 1857 |
| Xuanwu Men Station | ||||||||||
| Construction Costs | 954 | 987 | 1021 | 1057 | 1094 | 1132 | 1172 | 1213 | 1256 | 1300 |
| Operation and Management Costs | 29 | 30 | 31 | 32 | 33 | 34 | 35 | 36 | 38 | 39 |
| Total | 982 | 1016 | 1052 | 1089 | 1127 | 1166 | 1207 | 1250 | 1293 | 1339 |
Table A2.
Economic Losses of the Top Three Stations (104 RMB).
Table A2.
Economic Losses of the Top Three Stations (104 RMB).
| Year | 2021 | 2022 | 2023 | 2024 | 2025 | 2026 | 2027 | 2028 | 2029 | 2030 |
|---|---|---|---|---|---|---|---|---|---|---|
| Wangjing Station | ||||||||||
| Direct Losses | 5799 | 3881 | 1963 | 6792 | 13,566 | 11,649 | 9731 | 8847 | 8260 | 6343 |
| Indirect Losses | 15,264 | 10,216 | 5168 | 17,877 | 35,709 | 30,661 | 25,613 | 23,285 | 21,742 | 16,694 |
| Total | 21,062 | 14,097 | 7131 | 24,669 | 49,275 | 42,309 | 35,344 | 32,132 | 30,003 | 23,037 |
| Zhichun Lu Station | ||||||||||
| Direct Losses | 4688 | 4622 | 3752 | 2882 | 2125 | 1255 | 5634 | 4764 | 4163 | 5051 |
| Indirect Losses | 12,341 | 12,167 | 9877 | 7586 | 5593 | 3303 | 14,829 | 12,539 | 10,957 | 13,295 |
| Total | 17,029 | 16,789 | 13,629 | 10,468 | 7718 | 4558 | 20,463 | 17,303 | 15,120 | 18,346 |
| Xuanwu Men Station | ||||||||||
| Direct Losses | 3075 | 2538 | 2606 | 2127 | 1590 | 1138 | 601 | 4013 | 3476 | 3319 |
| Indirect Losses | 8095 | 6681 | 6860 | 5599 | 4186 | 2996 | 1582 | 10,564 | 9150 | 8736 |
| Total | 11,170 | 9219 | 9466 | 7727 | 5776 | 4134 | 2183 | 14,577 | 12,627 | 12,056 |
Table A3.
Project Value of Wangjing Station (104 RMB).
Table A3.
Project Value of Wangjing Station (104 RMB).
| 2021 | 2022 | 2023 | 2024 | 2025 | 2026 | 2027 | 2028 | 2029 | 2030 |
|---|---|---|---|---|---|---|---|---|---|
| 1852 | 2353 | 2990 | 3799 | 4826 | 6132 | 7790 | 9898 | 12,575 | 15,976 |
| 1458 | 1852 | 2353 | 2990 | 3799 | 4826 | 6132 | 7790 | 9898 | |
| 1148 | 1458 | 1852 | 2353 | 2990 | 3799 | 4826 | 6132 | ||
| 903 | 1148 | 1458 | 1852 | 2353 | 2990 | 3799 | |||
| 711 | 903 | 1148 | 1458 | 1852 | 2353 | ||||
| 560 | 711 | 903 | 1148 | 1458 | |||||
| 440 | 560 | 711 | 903 | ||||||
| 347 | 440 | 560 | |||||||
| 273 | 347 | ||||||||
| 215 |
Table A4.
Project Value of Zhichun Lu Station (104 RMB).
Table A4.
Project Value of Zhichun Lu Station (104 RMB).
| 2021 | 2022 | 2023 | 2024 | 2025 | 2026 | 2027 | 2028 | 2029 | 2030 |
|---|---|---|---|---|---|---|---|---|---|
| 1115 | 1417 | 1800 | 2287 | 2906 | 3692 | 4690 | 5959 | 7570 | 9618 |
| 878 | 1115 | 1417 | 1800 | 2287 | 2906 | 3692 | 4690 | 5959 | |
| 691 | 878 | 1115 | 1417 | 1800 | 2287 | 2906 | 3692 | ||
| 544 | 691 | 878 | 1115 | 1417 | 1800 | 2287 | |||
| 428 | 544 | 691 | 878 | 1115 | 1417 | ||||
| 337 | 428 | 544 | 691 | 878 | |||||
| 265 | 337 | 428 | 544 | ||||||
| 209 | 265 | 337 | |||||||
| 164 | 209 | ||||||||
| 129 |
Table A5.
Project Value of Xuanwu Men Station (104 RMB).
Table A5.
Project Value of Xuanwu Men Station (104 RMB).
| 2021 | 2022 | 2023 | 2024 | 2025 | 2026 | 2027 | 2028 | 2029 | 2030 |
|---|---|---|---|---|---|---|---|---|---|
| 482 | 613 | 778 | 989 | 1257 | 1596 | 2028 | 2577 | 3274 | 4159 |
| 380 | 482 | 613 | 778 | 989 | 1257 | 1596 | 2028 | 2577 | |
| 299 | 380 | 482 | 613 | 778 | 989 | 1257 | 1596 | ||
| 235 | 299 | 380 | 482 | 613 | 778 | 989 | |||
| 185 | 235 | 299 | 380 | 482 | 613 | ||||
| 146 | 185 | 235 | 299 | 380 | |||||
| 115 | 146 | 185 | 235 | ||||||
| 90 | 115 | 146 | |||||||
| 71 | 90 | ||||||||
| 56 |
Table A6.
Option Premium of Wangjing Station (104 RMB).
Table A6.
Option Premium of Wangjing Station (104 RMB).
| 2021 | 2022 | 2023 | 2024 | 2025 | 2026 | 2027 | 2028 | 2029 | 2030 |
|---|---|---|---|---|---|---|---|---|---|
| 634 | 970 | 1453 | 2133 | 3062 | 4297 | 5898 | 7947 | 10,563 | 13,902 |
| 333 | 537 | 852 | 1320 | 1996 | 2934 | 4181 | 5779 | 7823 | |
| 145 | 251 | 427 | 714 | 1166 | 1848 | 2815 | 4058 | ||
| 46 | 87 | 162 | 299 | 545 | 978 | 1725 | |||
| 8 | 16 | 33 | 67 | 137 | 279 | ||||
| 0 | 0 | 0 | 0 | 0 | |||||
| 0 | 0 | 0 | 0 | ||||||
| 0 | 0 | 0 | |||||||
| 0 | 0 | ||||||||
| 0 |
Table A7.
Option Premium of Zhichun Lu Station (104 RMB).
Table A7.
Option Premium of Zhichun Lu Station (104 RMB).
| 2021 | 2022 | 2023 | 2024 | 2025 | 2026 | 2027 | 2028 | 2029 | 2030 |
|---|---|---|---|---|---|---|---|---|---|
| 239 | 386 | 610 | 945 | 1432 | 2117 | 3045 | 4263 | 5822 | 7815 |
| 106 | 181 | 306 | 508 | 825 | 1304 | 1996 | 2941 | 4156 | |
| 35 | 65 | 120 | 218 | 389 | 680 | 1157 | 1889 | ||
| 7 | 14 | 28 | 57 | 116 | 237 | 484 | |||
| 0 | 0 | 0 | 0 | 0 | 0 | ||||
| 0 | 0 | 0 | 0 | 0 | |||||
| 0 | 0 | 0 | 0 | ||||||
| 0 | 0 | 0 | |||||||
| 0 | 0 | ||||||||
| 0 |
Table A8.
Option Premium of Xuanwu Men Station (104 RMB).
Table A8.
Option Premium of Xuanwu Men Station (104 RMB).
| 2021 | 2022 | 2023 | 2024 | 2025 | 2026 | 2027 | 2028 | 2029 | 2030 |
|---|---|---|---|---|---|---|---|---|---|
| 39 | 69 | 119 | 202 | 337 | 551 | 877 | 1354 | 2013 | 2860 |
| 12 | 22 | 42 | 77 | 140 | 252 | 446 | 768 | 1277 | |
| 2 | 4 | 8 | 17 | 35 | 71 | 145 | 297 | ||
| 0 | 0 | 0 | 0 | 0 | 0 | 0 | |||
| 0 | 0 | 0 | 0 | 0 | 0 | ||||
| 0 | 0 | 0 | 0 | 0 | |||||
| 0 | 0 | 0 | 0 | ||||||
| 0 | 0 | 0 | |||||||
| 0 | 0 | ||||||||
| 0 |
Table A9.
Value Comparison of Wangjing Station (104 RMB).
Table A9.
Value Comparison of Wangjing Station (104 RMB).
| 2021 | 2022 | 2023 | 2024 | 2025 | 2026 | 2027 | 2028 | 2029 | 2030 |
|---|---|---|---|---|---|---|---|---|---|
| 634 | 970 | 1453 | 2133 | 3080 | 4324 | 5920 | 7961 | 10,571 | 13,902 |
| 333 | 537 | 852 | 1320 | 1996 | 2956 | 4195 | 5786 | 7823 | |
| 145 | 251 | 427 | 714 | 1166 | 1862 | 2822 | 4058 | ||
| 46 | 87 | 162 | 299 | 545 | 986 | 1725 | |||
| 8 | 16 | 33 | 67 | 137 | 279 | ||||
| 0 | 0 | 0 | 0 | 0 | |||||
| 0 | 0 | 0 | 0 | ||||||
| 0 | 0 | 0 | |||||||
| 0 | 0 | ||||||||
| 0 |
Table A10.
Value Comparison of Zhichun Lu Station (104 RMB).
Table A10.
Value Comparison of Zhichun Lu Station (104 RMB).
| 2021 | 2022 | 2023 | 2024 | 2025 | 2026 | 2027 | 2028 | 2029 | 2030 |
|---|---|---|---|---|---|---|---|---|---|
| 239 | 386 | 610 | 945 | 1432 | 2120 | 3064 | 4276 | 5828 | 7815 |
| 106 | 181 | 306 | 508 | 825 | 1304 | 2008 | 2948 | 4156 | |
| 35 | 65 | 120 | 218 | 389 | 680 | 1164 | 1889 | ||
| 7 | 14 | 28 | 57 | 116 | 237 | 484 | |||
| 0 | 0 | 0 | 0 | 0 | 0 | ||||
| 0 | 0 | 0 | 0 | 0 | |||||
| 0 | 0 | 0 | 0 | ||||||
| 0 | 0 | 0 | |||||||
| 0 | 0 | ||||||||
| 0 |
Table A11.
Value Comparison of Xuanwu Men Station (104 RMB).
Table A11.
Value Comparison of Xuanwu Men Station (104 RMB).
| 2021 | 2022 | 2023 | 2024 | 2025 | 2026 | 2027 | 2028 | 2029 | 2030 |
|---|---|---|---|---|---|---|---|---|---|
| 39 | 69 | 119 | 202 | 337 | 551 | 877 | 1364 | 2018 | 2860 |
| 12 | 22 | 42 | 77 | 140 | 252 | 446 | 773 | 1277 | |
| 2 | 4 | 8 | 17 | 35 | 71 | 145 | 297 | ||
| 0 | 0 | 0 | 0 | 0 | 0 | 0 | |||
| 0 | 0 | 0 | 0 | 0 | 0 | ||||
| 0 | 0 | 0 | 0 | 0 | |||||
| 0 | 0 | 0 | 0 | ||||||
| 0 | 0 | 0 | |||||||
| 0 | 0 | ||||||||
| 0 |
References
- Hapuarachchi, H.A.P.; Wang, Q.J.; Pagano, T.C. A review of advances in flash flood forecasting. Hydrol. Process. 2011, 25, 2771–2784. [Google Scholar] [CrossRef]
- IPCC (Intergovernmental Panel on Climate Change). Climate Change 2014 Synthesis Report; Intergovernmental Panel on Climate Change: Geneva, Switzerland, 2014. [Google Scholar]
- Nian, G.Y.; Chen, F.X.; Li, Z.; Zhu, Y.; Sun, D. Evaluating the alignment of new metro line considering network vulnerability with passenger ridership. Transp. A 2019, 15, 1402–1418. [Google Scholar] [CrossRef]
- Antonino, V. Network design problem for risk reduction in transport system: A models specification. Int. J. Transp. Dev. Integr. 2022, 3, 283–297. [Google Scholar]
- Russo, F.; Corrado, R. Planning In Road Evacuation: Classification of Exogenous Activities. WIT Trans. Built Environ. 2011, 116, 639–651. [Google Scholar]
- Lyu, H.M.; Sun, W.J.; Shen, S.L.; Arulrajah, A. Flood risk assessment in metro systems of mega-cities using a GIS-based modeling approach. Sci. Total. Environ. 2018, 626, 1012–1025. [Google Scholar] [CrossRef]
- Chen, P.; Zhang, J.Q.; Jiang, X.Y.; Liu, X.P.; Bao, Y.L.; Sun, Y.Y. Scenario Simulation-Based Assessment of Trip Difficulty for Urban Residents under Rainstorm Waterlogging. Int. J. Environ. Res. Public Health 2012, 9, 2057–2074. [Google Scholar] [CrossRef]
- Reckien, D.; Petkova, E.P. Who is responsible for climate change adaptation? Environ. Res. Lett. 2019, 14, 13. [Google Scholar] [CrossRef]
- Francesco, R.; Giocanna, C. Risk Reduction in Transport System in Emergency Conditions: A Framework for Demand Analysis. Saf. Secur. Eng. 2021, 206, 255. [Google Scholar]
- Kottayi, N.M.; Mallick, R.B.; Jacobs, J.M.; Daniel, J.S. Economics of Making Roadway Pavements Resilient to Climate Change: Use of Discounted Cash Flow and Real Options Analysis. J. Infrastruct. Syst. 2019, 25, 10. [Google Scholar] [CrossRef]
- Xiao, Y.B.; Fu, X.W.; Oum, T.H.; Yan, J. Modeling airport capacity choice with real options. Transp. Res. Part B-Methodol. 2017, 100, 93–114. [Google Scholar] [CrossRef]
- Balliauw, M.; Meersman, H.; Van de Voorde, E.; Vanelslander, T. Towards improved port capacity investment decisions under uncertainty: A real options approach. Transp. Rev. 2019, 39, 531–552. [Google Scholar] [CrossRef]
- Li, Z.C.; Guo, Q.W.; Lam, W.H.K.; Wong, S.C. Transit technology investment and selection under urban population volatility: A real option perspective. Transp. Res. Part B-Methodol. 2015, 78, 318–340. [Google Scholar] [CrossRef]
- Van den Honert, R.C. Improving Decision Making about Natural Disaster Mitigation Funding in Australia A Framework. Resources 2016, 5, 23. [Google Scholar] [CrossRef]
- Wang, T.; Liu, B.S.; Zhang, J.M.; Li, G.J. A Real Options-Based Decision-Making Model for Infrastructure Investment toPrevent Rainstorm Disasters. Prod. Oper. Manag. 2019, 28, 2699–2715. [Google Scholar] [CrossRef]
- Dawson, D.A.; Hunt, A.; Shaw, J.; Gehrels, W.R. The Economic Value of Climate Information in Adaptation Decisions: Learning in the Sea-level Rise and Coastal Infrastructure Context. Ecol. Econ. 2018, 150, 1–10. [Google Scholar] [CrossRef]
- Gao, Y.L.; Driouchi, T. Incorporating Knightian uncertainty into real options analysis: Using multiple-priors in the case of rail transit investment. Transp. Res. Part B-Methodol. 2013, 55, 23–40. [Google Scholar] [CrossRef]
- Xie, Z.Q.; Du, Y.; Zeng, Y.; Miao, Q. Classification of yearly extreme precipitation events and associated flood risk in the Yangtze-Huaihe River Valley. Sci. China-Earth Sci. 2018, 61, 1341–1356. [Google Scholar] [CrossRef]
- Von Ferber, C.; Holovatch, T.; Holovatch, Y.; Palchykov, V. Public transport networks: Empirical analysis and modeling. Eur. Phys. J. B 2009, 68, 261–275. [Google Scholar] [CrossRef]
- Li, M.; Wang, H.W.; Wang, H.S. Resilience Assessment and Optimization for Urban Rail Transit Networks: A Case Study of Beijing Subway Network. IEEE Access 2019, 7, 71221–71234. [Google Scholar] [CrossRef]
- Oluah, C.; Akinlabi, E.T.; Njoku, H.O. Selection of phase change material for improved performance of Trombe wall systems using the entropy weight and TOPSIS methodology. Energy Build. 2020, 217, 10. [Google Scholar] [CrossRef]
- Guo, S.; Zhao, H. Optimal site selection of electric vehicle charging station by using fuzzy TOPSIS based on sustainability perspective. Appl. Energy 2015, 15, 390–402. [Google Scholar] [CrossRef]
- Yeo, K.T.; Qiu, F. The value of management flexibility—A real option approach to investment evaluation. Int. J. Proj. Manag. 2003, 21, 243–250. [Google Scholar] [CrossRef]
- Truong, C.; Truck, S. It’s not now or never: Implications of investment timing and risk aversion on climate adaptation to extreme events. Eur. J. Oper. Res. 2016, 253, 856–868. [Google Scholar] [CrossRef]
- Dottori, F.; Szewczyk, W.; Ciscar, J.C.; Zhao, F.; Alfieri, L.; Hirabayashi, Y.; Bianchi, A.; Mongelli, I.; Frieler, K.; Betts, R.A.; et al. Increased human and economic losses from river flooding with anthropogenic warming. Nat. Clim. Chang. 2018, 8, 781–786. [Google Scholar] [CrossRef]
- BTI (Beijing Transport Institute). 2021 Beijing Transport Development Annual Report; Beijing Transport Institute: Beijing, China, 2021. [Google Scholar]
Disclaimer/Publisher’s Note: The statements, opinions and data contained in all publications are solely those of the individual author(s) and contributor(s) and not of MDPI and/or the editor(s). MDPI and/or the editor(s) disclaim responsibility for any injury to people or property resulting from any ideas, methods, instructions or products referred to in the content. |
© 2023 by the authors. Licensee MDPI, Basel, Switzerland. This article is an open access article distributed under the terms and conditions of the Creative Commons Attribution (CC BY) license (https://creativecommons.org/licenses/by/4.0/).