Abstract
The adoption and diffusion level of eXtensible Business Reporting Language (XBRL) technology among listed enterprises is an important indicator of the capital market‘s openness and efficiency degree. In this study, we established an evolutionary model between the government, listed enterprises, and institutional investors, analyzed the evolutionary path and evolutionary law of the model, and conducted numerical simulations. In the numerical simulations, we discussed the impact of different parameters change on the strategic choices of the three parties, and the results show that increasing government enforcement and subsidies intensity, reducing the adoption cost for listed enterprises, increasing the incremental benefits of adoption for enterprises, and increasing the participation level of institutional investors all promote the adoption of XBRL technology by listed enterprises. The adoption behavior of listed enterprises is driven by a combination of the government’s policy guidance and institutional investors’ XBRL engagement level. Therefore, this paper is an effective supplement to the innovative technology adoption and diffusion theory and provides policy recommendations and management insights for the government’s efforts in promoting XBRL technology, which is conducive to solving the problem of insufficient motivation for XBRL technology adoption by listed enterprises.
1. Introduction
1.1. Background of the Work
In recent years, eXtensible Business Reporting Language (XBRL) has been an electronic financial reporting data format that has been widely used in many countries and regions around the world and is gradually developing into an “international language” for electronic financial reporting [1]. As an open, cross-platform, and cross-system international standard, it can store, manipulate, reuse, and exchange all kinds of accounting and business information accurately and efficiently in real time, which is expected to solve the long-standing problem of difficulty in sharing accounting information resources due to the lack of uniform standards [2,3].
The authenticity, timeliness, and accuracy of financial reports are important preconditions for the efficient conduct of government supervision and management, enterprise financing and borrowing, investor analysis, and decision-making. XBRL is an effective technology for compiling, submitting, retrieving, and analyzing financial reports, and is also the product of the highly integrated capital market and accounting informatization. Its implementation ability and promotion level are important indicators to measure the degree of capital market openness and market efficiency [4,5]. The adoption of XBRL technology by listed companies is conducive to the healthy and sustainable development of capital markets, while at the same time, governments are faced with new issues and challenges in supervision and management, so the adoption and diffusion of XBRL technology, which has drawn great attention lately, are the main topics of this study.
After more than ten years of development, the technological advantages of XBRL technology in financial management, tax management, financial supervision, enterprise risk management, and internal control have been widely recognized in many nations and regions [6,7,8,9]. Meanwhile, common issues in the adoption and promotion of XBRL technology by governments and related departments are as follows: how to efficiently manage and apply financial transaction data based on XBRL technology to provide high-quality and easily accessible financial information of listed enterprises to regulatory authorities, investors, and other stakeholders, and greatly improve the economic value and social utility of XBRL related applications? To address this, XBRL technology should be widely adopted by listed enterprises.
However, the government still faces the following challenges in promoting the adoption of XBRL technology by listed enterprises. Firstly, listed companies are not particularly motivated to adopt XBRL technology on their own initiative because of factors like technical complexity, implementation costs, and the risk of leaking trade secrets. Secondly, capital market regulation is inflexible, social forces are not sufficiently involved in capital market governance, and institutional investors have a low level of cognition on the advantages of XBRL and cannot resonate with and support the government’s promotion of XBRL technology [10]. Institutional investors refer to financial institutions that can engage in securities investment and fund investment, including banks, securities companies, insurance companies, investment trust companies, fund companies, credit cooperatives, and other investment institutions [11]. Institutional investors are expected to have high expectations for the reform of China’s capital market because they have the advantages of scale, professionalism, and information. They are also more motivated and capable of monitoring listed companies than individual investors, and they have the information and capability to participate in corporate governance [12]. In this context, the goal of this study is to investigate how the government and institutional investors may encourage the listed enterprise to embrace and disseminate XBRL technology more effectively.
1.2. Motivation of the Work
The financial reports of listed enterprises have public attributes, and the adoption of XBRL technology in listed enterprises is affected by multi-stakeholders. Stakeholders’ demands for financial information disclosure are inconsistent because of their limited reasoning and attention to their interests.
Listed firms, in particular, want to reveal information in their financial reports to improve their corporate image and attract investment, but they are hesitant to do so because it would require them to spend excessive amounts of money on its preparation [13].
To increase the likelihood of detecting financial fraud and malpractice as well as the cost of non-compliance, regulators are hoping that listed companies will adopt XBRL technology and produce better financial reports. This will, in turn, increase the efficiency of government regulation and further support the healthy and orderly development of capital markets [14,15].
Institutional investors rely on the information they possess to effectively lower the cost of information search, processing, and monitoring, improve investment efficiency, and increase investment returns; they expect financial reporting information to be more current, relevant, useful, and comparable [16].
It is clear from the respective demands of the three parties that there is always a game relationship between the government, listed companies, and institutional investors. To maximize their earnings, listed enterprises are motivated to develop strategies that do not actively use XBRL technology, and the degree of governmental oversight and external monitoring by institutional investors is likely to have an impact on the strategy choice of listed enterprises. To support regulatory system reform and ongoing development of the information disclosure system, it is crucial to investigate the game interaction between the three parties.
Although many academics have focused more on the adoption and diffusion of XBRL technology in recent years, the research still has several limitations. First, game theory has been used to study the adoption and diffusion of XBRL technology, but much of the existing literature assumes that governments and listed enterprises are completely rational players [17], meaning that their strategic decisions are intended to maximize their interests. Yet, in practice, both governments and listed enterprises have limited information-gathering and processing capacities, and their decisions are finitely rational and influenced by their social context, experiences, and the actions of others in comparable circumstances. Secondly, most scholars only focus on the optimal strategy choice of listed enterprises and the government in a finite game [18,19], while the evolutionary path of the long-term game is rarely considered. In reality, this process is a long-run dynamic process for game players under finite rationality. Thirdly, the existing literature focuses more on the game interactions between governments and enterprises and less on the role and influence of institutional investors in the adoption and diffusion of XBRL technology, and even less on the specific distinction and discussion of different forms of government behavior and institutional investor participation [20].
In actuality, the government has an information disadvantage in the game with listed enterprises, and even if it incurs significant regulatory expenses, it will not be able to close all the flaws and gaps in the regulatory rules. Hence, institutional investors’ level of capital market engagement needs to increase, and their roles in price discovery, rational investment, and external oversight need to be better played. It supports the shift in our capital market oversight from centralized management and strict management to flexible governance [21].
In summary, from the overview of XBRL technology adoption and diffusion issues, although researchers have made significant progress in this area, the following questions and challenges still need to be addressed: (1) How is the evolutionary game model between the government, listed enterprises and institutional investors constructed and formulated? (2) How do the behavioral strategies of governments and institutional investors affect listed enterprises’ cost-benefit measures of XBRL adoption? (3) How can the roles of government and institutional investors in the adoption and diffusion of XBRL be clearly described?
1.3. Contributions of the Work
In order to solve the above-mentioned problems, this paper constructs a three-party asymmetric evolutionary game model with the government, listed enterprises, and institutional investors, and analyzes the dynamic change process of each game party’s strategy choice and the evolutionary stability of the system under different conditions. In addition, this study explores the impact of changes in parameters such as the intensity of government enforcement, the intensity of subsidies, the cost and benefit of adoption by listed enterprises, and the intensity of participation by institutional investors on the evolutionary path of the system through numerical simulation analysis.
Contributions to this paper include the following: (1) We construct a tripartite evolutionary game model, introduce institutional investors into the model, and expand the two-party game model between the government and listed enterprises in the existing literature, which is a supplement to the existing studies on XBRL technology adoption and diffusion. (2) This paper studies the adoption and diffusion of XBRL technology from the perspectives of government law enforcement intensity, subsidy intensity, enterprise adoption costs, incremental benefits of adoption, participation of institutional investors, etc. The results have practical significance and can provide a reference for management practice. The research steps of the paper are shown in Figure 1.
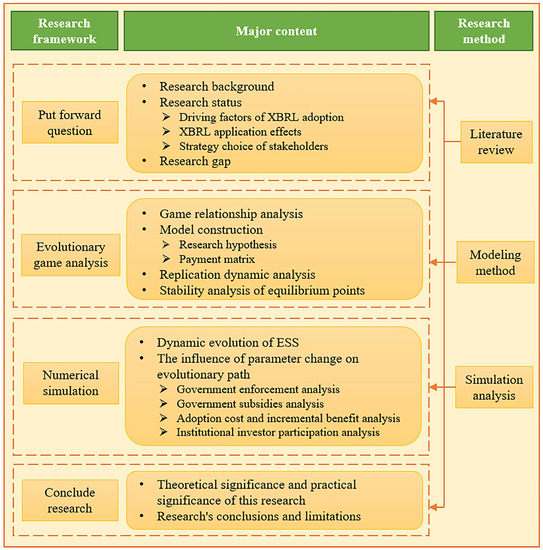
Figure 1.
Research steps.
The remainder of the study is structured as follows: The relevant literature is reviewed in Section 2. The creation of payoff matrices, the introduction of relationships, parameter assumptions, the study of stabilization strategies, and the solution to the equilibrium point are all covered in Section 3. In Section 4, numerical simulations for various equilibrium point scenarios and an exploration of the impact of various parameter adjustments on the evolutionary path are presented. In Section 5, it is discussed how this study relates to earlier research, as well as what contributions have been made to the field, and managerial suggestions are made in line with this. Conclusions, limitations, and possible future research directions are summarized in Section 6.
2. Literature Review
Scholars at home and abroad have discussed and analyzed the adoption and diffusion of XBRL technology based on a variety of different perspectives and theories, which can be grouped into three main categories: drivers, application effects, and strategy choices. The majority of the research focuses on the analysis of drivers and application impacts.
2.1. Driving Factors of XBRL Adoption
In terms of driving factors, previous research papers have mostly combined the following theories: technology organization environment model (TOE) [22]; technology acceptance model (TAM) [23]; institutional theory (INT) [24]. These studies acknowledge that XBRL technology adoption depends on three groups of factors: technology, organization, and environment. Among them, technical factors refer to the characteristics of the technology itself, such as complexity, compatibility, and comparative advantage [25]. Organizational factor refers to the organization’s degree of cognition and ability to learn about and apply technology. Environmental factors emphasize the pressure that external environment may cause on the adoption of organizational technology, including normative pressure and imitative pressure [26]. In addition, some studies have pointed out that expected income and network effects are the driving factors for enterprises to adopt XBRL technology, while the adoption cost is the inhibiting factor. If the cost is too high, enterprises will not adopt this technology [27,28].
2.2. XBRL Application Effects
In terms of application effects, most research has relied on qualitative analysis or empirical testing techniques. The majority of academics have studied how corporations, governments, and investors will be affected by the use of XBRL.
For listed enterprises, the advantages of XBRL adoption include increased transparency of information [29], decreased information asymmetry [30], and increased information about the characteristics of individual stocks, which in turn significantly increases the rate at which firm-specific information is incorporated into stock prices, ultimately leading to a reduction in stock price synchronization [31]. According to the literature [32,33,34], there is a significant inverse relationship between the adoption of XBRL technology and the cost of equity and debt financing. This is because increased information transparency lowers creditors’ and investors’ expectations of uncertainty regarding the future performance of listed enterprises, and voluntary adoption lowers financing costs more than mandatory adoption.
The biggest supporter and beneficiary of XBRL technology is government regulators, as the standardization of financial statement data can significantly reduce the cost of data exchange and comparison and verification between regulators [35]. The adoption of XBRL technology can raise regulatory efficacy and increase the likelihood of discovering financial crime and malpractice in listed enterprises [36].
For institutional investors, XBRL financial information is more relevant, understandable, and comparable than the traditional financial reporting format, reducing the cost of information processing and monitoring for investors [37]. Institutional investors’ risk expectations and subsequent investment decisions are also impacted by the way listed enterprises adopt XBRL. These investors perceive XBRL-using enterprises as being more willing to provide high-quality financial information, and they are more likely to actively evaluate these enterprises and pay more for their shares than those that do not [38,39].
2.3. Strategy Choice of Stakeholders
In terms of strategy choice, as an important tool for studying the interaction and influence mechanism of decision-making among participants, game theory provides a general mathematical analytic method for situations with multiple participants whose decisions influence each other. However, because it assumes the complete rationality of parties, game theory has limitations in solving practical situations. For example, game relationship analysis lacks a dynamic mechanism and cannot adequately explain the selection of multiple equilibria. Evolutionary game theory, a sub-discipline of game theory, has been widely used in economic and social fields because it relaxes the assumption of complete rationality of actors. According to evolutionary game theory, players have limited rationality, with a finite knowledge reserve, reasoning ability, and information collection ability. Participants cannot respond quickly and optimally to changes, and their behavior and decision-making will be influenced by culture, experience, convention, and the choices of others in similar situations. Gamers’ conduct is a constantly dynamic evolution and self-adjustment process. Therefore, evolutionary game theory has been widely used in the study of government system construction and industry regulation, market behavior analysis, and enterprise technology innovation and application. In terms of government system construction and industry supervision, Scholars have focused on the prevention and control of public health emergencies [40,41], environmental pollution control [42,43,44,45,46], urban ecological transformation [47], problem-solving for rural waste classification [48], assurance of construction safety and quality [49], and purification of cyberspace [50].
In terms of market behavior analysis, the researchers use the interaction between the market’s participating agents as their subject of investigation. They then build an evolutionary game model to examine the significant role that the government plays in upholding market order, monitoring business compliance, and defending the interests of consumers. To address the issue of quality management in the food supply chain, Peng et al. [51] demonstrated that better government regulation, a reduction in the cost differential between the production of high- and low-quality raw food materials, and a rise in the motivation for consumers to file complaints can all contribute to more sustainable management of the food supply chain. To encourage the healthy and sustainable development of the marine sector, Gao et al. [52] created a three-way evolutionary game model comprising marine product manufacturers, local governments, and consumers. Jiang et al. [53] built an evolutionary game model of the government, developers, and home buyers to study the growth of the green residential building industry, and the results showed that the government has a dominant role in the incubation stage, but as the industry matures, this dominant role will gradually be replaced by market-driven mechanisms.
In terms of corporate technological innovation and application, scholars have used evolutionary game models to analyze the long-term evolutionary process of corporate technology adoption decisions. To encourage corporate green and low-carbon technological innovation, Chen et al. [54] built a tripartite evolutionary game model with the government, businesses, and the general public. The study’s findings showed that pollution taxes, low-carbon technology innovation subsidies, and environmental protection publicity guidance were three effective methods. An evolutionary game model was created by Yi and Hiroatsu [55] between the government, construction businesses, and academics around the decision of robotically automated construction technology for construction enterprises. The study showed that raising monetary and reputational rewards, as well as raising the percentage of robotically automated construction in academic evaluations, can encourage the use of new technologies in construction businesses.
Scholars have used game theory to study the adoption and diffusion of XBRL technology. Wu and Liu [19] analyzed the adoption motivation and efficiency of XBRL technology by enterprises in a competitive environment and found that whether and when enterprises adopt XBRL technology will be affected by other enterprises’ behaviors, and in this process, the government can play an intervention role to promote the diffusion of XBRL technology. According to Ren and Wu [18], XBRL financial disclosure involves a variety of parties, including businesses, governmental authorities, institutional investors, third-party software vendors, and so on. The adoption of XBRL technology cannot be viewed as a technological application alone but rather as a technology decision made by businesses based on a competitive market environment, which includes the interaction of many players in a game. This process is long-term and dynamic. On this basis, Pan and Xue [20] studied the mechanism of government guidance strategies on the adoption of XBRL technology by building a two-party evolutionary game model and found that reducing the cost of technology, increasing penalties, and increasing subsidies to enterprises are effective ways for governments to promote the adoption of XBRL technology.
2.4. Literature Review Summary
In conclusion, although the current research on the adoption and diffusion of XBRL technology has produced useful findings, there are still some limitations. On the one hand, the analysis of driving factors and application effects frequently employs qualitative analysis and empirical tests to study the decision-making of a single agent, but such research makes it challenging to interpret the interaction between multi-agent behavior from a global perspective. On the other hand, while some researchers have used evolutionary game theory to examine the multi-agent game equilibrium strategy in the adoption and diffusion of XBRL technology, very few studies have discovered that institutional investors, a significant player in the capital market, are included in the evolutionary game model. The improvement of the capital market’s information disclosure and oversight mechanisms is currently a major global concern. The government actively participates in the regulation of the capital market through the use of market forces, such as institutional investors. The process of XBRL adoption and diffusion is a long-term, dynamic process in which multiple stakeholders in a social system interact with each other. The government, listed enterprises, and institutional investors are interrelated participants in the adoption and diffusion system of XBRL, and they all use bounded rationality, so it is completely reasonable and feasible to use evolutionary game theory to study the game interaction mechanism among them. In this paper, institutional investors are innovatively introduced into the interaction model between government and enterprises, and the adoption and diffusion mechanism of XBRL technology is discussed by constructing a tripartite evolutionary game model and providing a new theoretical basis for promoting listed enterprises to actively adopt XBRL technology and realize efficient diffusion of XBRL technology.
3. Model Construction
3.1. Relationship Definition
The process of adoption and diffusion of XBRL technology involves multi-party interaction between the government, listed enterprises, and institutional investors. The system is complex, multi-participant, and multi-faceted in this manner. When XBRL technology spreads among listed enterprises, it is not guaranteed that individuals in the group can pursue the optimal strategy completely and rationally. Therefore, under this background, we establish a tripartite evolutionary game model of government, listed enterprises, and institutional investors to explore the evolutionary path of tripartite strategy selection.
Among them, listed enterprises regularly publish financial reports for information disclosure and can choose whether to adopt XBRL technology and publish financial reports in XBRL format. The government supervises the listed enterprises and influences the technology adoption decisions of listed enterprises through administrative measures such as rewards and punishments.
At the same time, the government is a public trust institution for institutional investors, and the government’s publicity and guidance policies have a great impact on the behavior and decision-making of institutional investors.
Institutional investors use financial reports to make investment decision analyses, form investment value judgments, and then influence the financing activities of listed enterprises. In addition, they can choose whether to participate in the diffusion of XBRL technology in the process of investment decisions and play the role of external supervision. The relationship diagram of game players is shown in Figure 2.
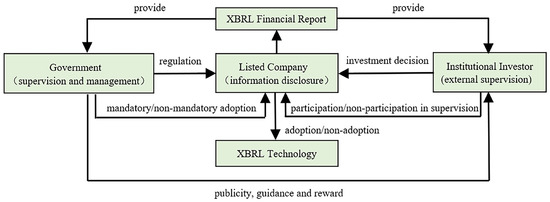
Figure 2.
Relationships between game agents.
3.2. Basic Assumptions
Assumption 1.
The participants in the game process include the government, listed enterprises, and institutional investors, and all three parties in the game use bounded rationality.
Assumption 2.
The governments, listed enterprises, and institutional investors all have two strategies to choose from. The government adopts two behavioral strategies: “mandatory XBRL adoption” (hereinafter referred to as “mandatory”) and “non-mandatory XBRL adoption” (hereinafter referred to as “voluntary”), the set of which is {mandatory, voluntary}. Listed enterprises adopt two behavioral strategies: “adopt XBRL technology” (hereinafter referred to as “adoption”) and “not adopt XBRL technology” (hereinafter referred to as “non-adoption”), and the strategy set is {adoption, non-adoption}. Institutional investors adopt the strategy “participate in XBRL diffusion” (hereinafter referred to as “participation”); and “Do not participate in the proliferation of XBRL technology” (hereinafter referred to as “non-participation”). The set of strategies is {participation, non-participation}.
Assumption 3.
Assume that the probability of the government choosing a “mandatory” strategy is x (0 ≤ x ≤ 1), and the probability of choosing a “voluntary” strategy is 1-x. The probability of listed enterprises choosing an “adoption” is y (0 ≤ y ≤ 1), and the probabiliy of choosing a “non-adoption” strategy is 1-y. The probability of institutional investors choosing a “participation” strategy is z (0 ≤ z ≤ 1), and the probability of choosing a “non-participation” strategy is 1-z.
Assumption 4.

The relevant parameters are set and shown in Table 1.

Table 1.
Table of parameter definitions.
Based on the above assumptions, the payoffs matrix of the tripartite evolutionary game is shown in Table 2.

Table 2.
Tripartite evolutionary game payoffs matrix.
3.3. Model Establishment
and represent the expected benefits when the government chooses a mandatory and voluntary strategy, respectively. and represent the expected return when the listed enterprise chooses adoption and non-adoption, respectively. and represent the expected benefits when institutional investors choose participation and non-participation, respectively. represents the average expected benefits for governments, represents the average expected benefits for listed enterprises, and represents the average expected benefits for institutional investors.
The expected benefit for the governments is:
The average expected benefit for the governments is:
The expected benefit for the listed enterprises is:
The average expected benefit for the listed enterprises is:
The expected benefit for institutional investors is:
The average expected benefit for institutional investors is:
3.4. Dynamic Replication Analysis
A dynamic replication equation is a dynamic differential equation that describes the frequency with which a particular strategy is adopted in a population. The model will evolve to the most beneficial strategy autonomously when game players are facing multiple strategies selection with different benefits levels. The results obtained by the dynamic replication equation can ensure that all the evolutionary stability strategies are evolutionary equilibrium. In the following, the dynamic replication equations are constructed for the government, listed enterprises, and institutional investors, and the evolutionary stability strategies of each party are analyzed in turn.
3.4.1. Dynamic Replication Analysis of Governments
From the above analysis, the dynamic replication equation for the government’s choice of mandatory strategy is as follows:
(1) If , , means that the government’s strategy does not change over time regardless of whether the government chooses to make it mandatory or voluntary and despite the actual ratio of mandatory to voluntary.
(2) If , to make , it follows that , , means the government’s choice of both a mandatory and a voluntary strategy are stable points. That is, if the government chooses the strategy of mandatory (voluntary), the government’s strategy will be stable at mandatory (voluntary) as long as there are no sudden change conditions that make the government change its strategy.
Derivation of leads to: , the evolutionary stabilization strategy requires , , and the following different scenarios are analyzed:
When , so is the evolutionarily stable strategy point.
When , so is the evolutionarily stable strategy point.
Let , draw the evolutionary trend map of the government strategy as shown in Figure 3, the point at the bottom left of the split plane will evolve towards , as shown in Figure 3b, and the point at the top right of the split plane will evolve towards , as shown in Figure 3c.

Figure 3.
Evolution phase diagrams of governments’ decisions.
3.4.2. Replication Dynamic Analysis of Listed Enterprises
Based on the above analysis, the replication dynamics equation for the listed enterprises’ adoption strategy can be obtained in the same way:
(1) If , indicates that all levels are steady state in this condition, which means that the listed enterprises’ strategy does not change over time, regardless of whether they choose to adopt or not adopt and the proportion of XBRL adoption.
(2) If , to make , it can be derived that , means that listed enterprises’ choice of adoption and non-adoption strategies are stable points. That is, if a listed enterprise chooses to adopt (not to adopt) a strategy, the listed enterprise’s strategy will be stable at the point of adoption (non-adoption) as long as there are no sudden change conditions that make the listed enterprise change its strategy.
Derivation of leads to: , the evolutionary stabilization strategy requires , and the following different scenarios are analyzed.
When , , so is the evolutionarily stable strategy point.
When , , so is the evolutionarily stable strategy point.
Let , draw the evolutionary trend map of the listed enterprises’ strategy as shown in Figure 4. The point in front of the split plane will evolve towards , as shown in Figure 4b, and the point behind the split plane will evolve towards , as shown in Figure 4c.

Figure 4.
Evolution phase diagrams of listed enterprises’ decisions.
3.4.3. Replication Dynamic Analysis of Institutional Investors
Based on the above analysis, the dynamic replication equation for institutional investors’ choice of participation strategy can be obtained in the same way:
(1) If , , indicates that all levels are steady state under this condition, which means that institutional investors’ strategies do not change over time, regardless of whether they choose to participate or not and the institutional investors’ participation proportion.
(2) If , to make it follows that means the point at which the institutional investor chooses to participate in the strategy and the strategy of non-participation are both stables. That is, if an institutional investor chooses the strategy of participating in technology diffusion (not participating in technology diffusion), the institutional investor’s strategy will be stable at participating in technology diffusion (not participating in technology diffusion) as long as there are no sudden change conditions that make the institutional investor change its strategy.
Derivation of leads to: the evolutionary stabilization strategy requires and the following different scenarios are analyzed.
When so is the evolutionarily stable strategy point.
When so is the evolutionarily stable strategy point.
Let , draw the evolutionary trend map of the institutional investors’ strategy as shown in Figure 5. The point in front of the split plane will evolve towards , as shown in Figure 5b, and the point behind the split plane will evolve towards , as shown in Figure 5c.
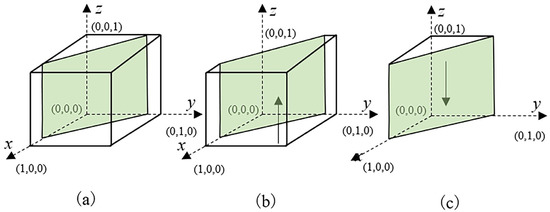
Figure 5.
Evolution phase diagrams of institutional investors’ decisions.
3.5. Stability Analysis of Equilibrium Points
The above analysis of the equilibrium conditions for each subject to reach a stable strategy from the perspective of a single game subject. However, in essence, the achievement of the final stable state of the system requires the joint action of all three parties. Thus, this section will explore the equilibrium conditions for the system to evolve a stable strategy under the synergy of three parties.
Let , then eight pure strategy Nash equilibrium points of the government, listed enterprises, and institutional investors in the game can be obtained, namely , . The equilibrium points obtained from the dynamic replication equations are not necessarily the evolutionary stability of the system, and the stability of the resulting equilibrium points needs to be analyzed by the Jacobian matrix (denoted as ). The Jacobian matrix of the game system is as follows:
From Lyapunov’s stability theory, the equilibrium point is the evolutionary stability point of the system when all the eigenvalues of the Jacobian matrix are less than zero. Taking the equilibrium point as an example, the Jacobian matrix can be obtained as follows:
The eigenvalues of can be obtained as . Similarly, the eigenvalues of the other seven equilibrium points corresponding to the Jacobian matrix can be obtained, as shown in Table 3.

Table 3.
Eigenvalues of the Jacobian matrix corresponding to each equilibrium point.
According to the Jacobian matrix eigenvalues corresponding to each equilibrium point in Table 3, and correspond to and , respectively, so the equilibrium points and are unstable.
The eigenvalues’ sign judgment of the Jacobian matrix corresponding to each equilibrium point is shown in Table 4.

Table 4.
Eigenvalues’ sign judgment of the Jacobian matrix corresponding to each equilibrium point.
4. Numerical Simulation and Results
4.1. The Dynamic Evolution of ESS
This paper uses MatlabR2016b software to simulate and analyze the aforementioned evolutionary game model to examine the evolutionary paths and patterns of the game between the government, publicly traded enterprises, and institutional investors in the adoption and diffusion of XBRL technology. The data adopted in the numerical example are simulated and estimated due to the large and difficult availability of real data sets. These data were manipulated to closely fit certain assumptions of this study before being used. We ranged the level of participation, subsidy, and penalty intensity from 0 to 1. For constant parameters, such as the maximum amount of government subsidy, we set five different sets of values based on five scenarios to satisfy the five scenarios assumed above and validate them.
According to Table 3 and Table 4, there are five possible equilibrium points for this system: ; the five equilibrium points correspond to case 1, case 2, case 3, case 4, and case 5, respectively, and each case corresponds to a set of parameter values, as shown in Table 5.

Table 5.
The parameter values for each case in the evolutionary game model.
Case 1: When , the ESS is , Figure 6 shows the dynamic evolution after 50 simulations.
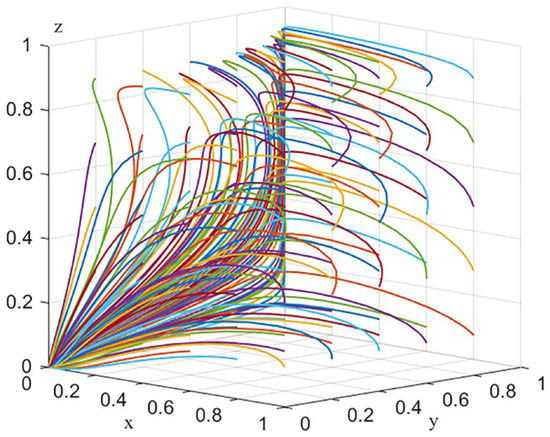
Figure 6.
Evolution of .
As shown in Figure 6, substituting the parameter values of scenario 1 into the model, only the eigenvalues corresponding to the equilibrium point are negative, so is the evolutionary stability point of the system, and its corresponding evolutionary stability strategy is (voluntary, non-adoption, non-participation).
Case 2: When and the ESS is , Figure 7 shows the dynamic evolution after 50 simulations.
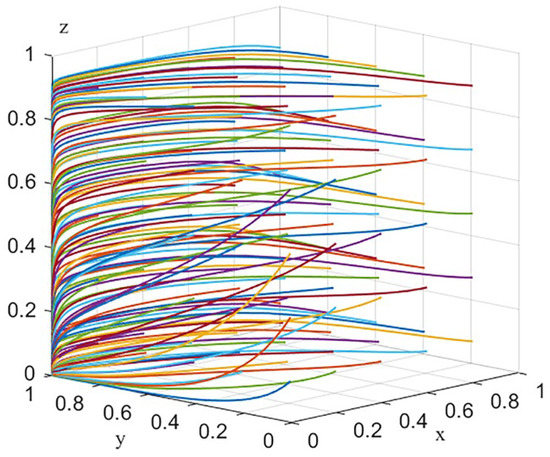
Figure 7.
Evolution of .
As shown in Figure 7, substituting the parameter values of scenario 2 into the model, only the eigenvalues corresponding to the equilibrium point are negative, so is the evolutionary stability point of the system, and its corresponding evolutionary stability strategy is (voluntary, adoption, non-participation).
Case 3: When , , , the ESS is , Figure 8 shows the dynamic evolution after 50 simulations.
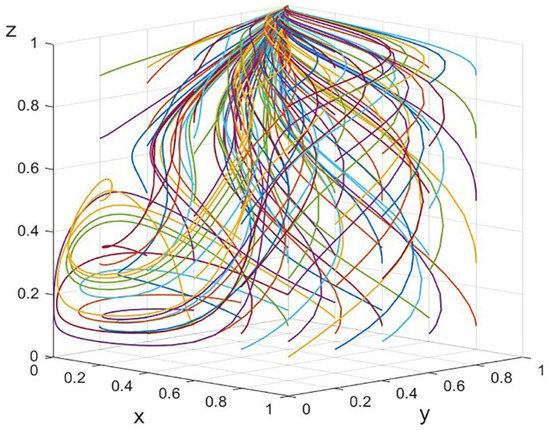
Figure 8.
Evolution of .
As shown in Figure 8, substituting the parameter values of scenario 3 into the model, only the eigenvalues corresponding to the equilibrium point are negative, so is the evolutionary stability point of the system, and its corresponding evolutionary stability strategy is (voluntary, adoption, participation).
Case 4: When , , , the ESS is , Figure 9 shows the dynamic evolution after 50 simulations.
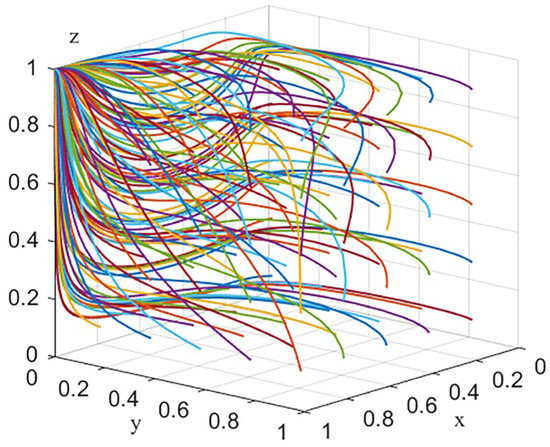
Figure 9.
Evolution of .
As shown in Figure 9, substituting the parameter values of scenario 4 into the model, only the eigenvalues corresponding to the equilibrium point are negative, so is the evolutionary stability point of the system, and its corresponding evolutionary stability strategy is (mandatory, non-adoption, participation).
Case 5: When , the ESS is , Figure 10 shows the dynamic evolution after 50 simulations.
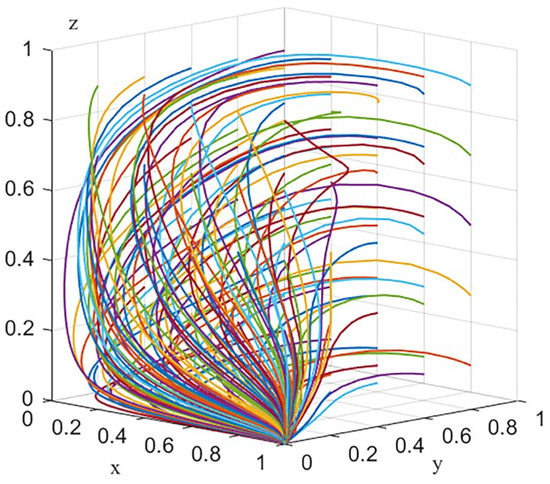
Figure 10.
Evolution of .
As shown in Figure 10, substituting the parameter values of scenario 5 into the model, only the eigenvalues corresponding to the equilibrium point are negative, so is the evolutionary stability point of the system, and its corresponding evolutionary stability strategy is (mandatory, non-adoption, non-participation).
According to the simulation results in Figure 8, the evolution-stable strategy (voluntary, adoption, participation) is an ideal environment for XBRL technology adoption and diffusion. At this point, the government reduces mandatory administrative intervention, institutional investors gradually improve their awareness of supervision and exercise rights, and the market becomes the dominant force affecting the adoption and diffusion of innovative technologies, which enables listed enterprises to transform from passive adoption under mandatory policies to active adoption under voluntary policies, and truly stimulates the internal motivation for listed enterprises to adopt XBRL technologies. Furthermore, promote XBRL technology in the listed enterprises in a comprehensive spread.
Then, in example 3, the ideal scenario, we examine the impact of parameter adjustments on the evolution path of each party. To facilitate the comparison and observation of the evolution of the strategy proportions of each subject, and eliminate the influence of game subjects’ initial strategy probability values on the system evolution, set the initial strategy probability of the government’s choice of mandatory, listed enterprises’ choice of adoption, institutional investors’ choice of participation all to 0.5. On this basis, study the influence of the government’s enforcement intensity (), government’s subsidy intensity (), listed enterprises’ adoption cost (), adoption incremental benefits (), and institutional investors’ participation intensity () on the evolutionary strategies of the above game subjects.
4.2. Government Enforcement Analysis
To analyze the impact of government enforcement intensity on the tripartite evolutionary path, the values of were set to 0.1, 0.4, and 0.7, respectively, and the simulation results were run as shown in Figure 11.
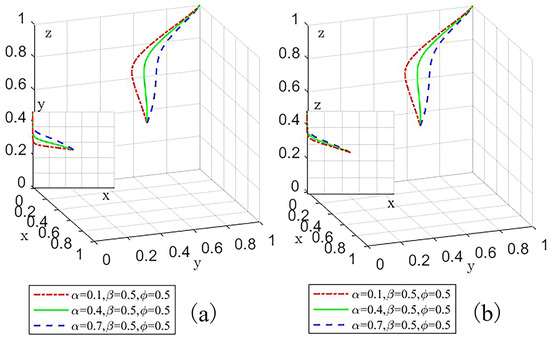
Figure 11.
The influence of change on the system evolution path: (a) X-Y perspective; (b) X-Z perspective.
It can be seen from Figure 11 that with the increase in mandatory enforcement intensity, the faster the proportion of listed enterprises choosing to adopt XBRL increases, the faster the proportion of institutional investors choosing to participate increases, which shows that government fines can effectively mobilize listed enterprises to adopt XBRL technology and can also fully stimulate the willingness of institutional investors’ participation in the technology adoption and diffusion. However, even at great cost to the government, it will not be possible to close all the gaps and loopholes in the regulatory rules. So as more institutional investors become involved in monitoring, the government will gradually abandon the mandatory strategy. The pressure on listed enterprises to adopt will also gradually shift from a punitive measure by the government to an external monitoring by institutional investors.
4.3. Government Subsidies Analysis
To analyze the impact of government subsidies on the evolutionary path of the three parties, the values of were set to 0.1, 0.4, and 0.7, respectively, and the simulation results were run as shown in Figure 12.
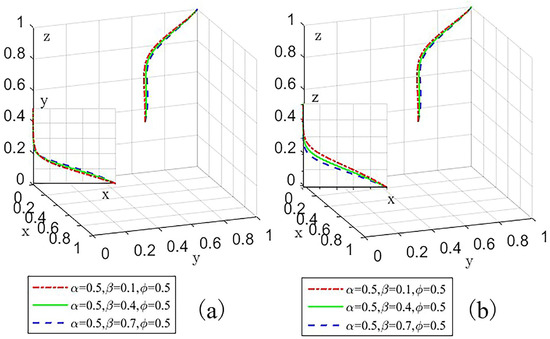
Figure 12.
The influence of change on the system evolution path: (a) X-Y perspective; (b) X-Z perspective.
Figure 12 shows that as government subsidies increase, the proportion of listed enterprises choosing to adopt XBRL technology increases faster, and the proportion of institutional investors choosing to participate in the strategy increases slower. This suggests that government subsidies, as the most direct form of cost compensation, can go a long way to alleviate the cost pressures on listed enterprises and increase their incentive to adopt XBRL. However, as more and more listed enterprises choose to adopt XBRL, it also becomes increasingly difficult for institutional investors to identify non-adopters during monitoring, and the search costs for institutional investors increase at the same time. In the case of constant total benefits, the increase in monitoring costs means that institutional investors’ net benefits will decrease when they choose participation, which will reduce their participation enthusiasm to an extent.
4.4. Adoption Cost and Incremental Benefit Analysis
To analyze the impact of adoption costs and incremental benefits of adoption on the tripartite evolutionary path of listed enterprises, the values of were set to 20, 25, and 30, and the values of were set to 30, 35, and 40, respectively. The simulation results were run as shown in Figure 13.
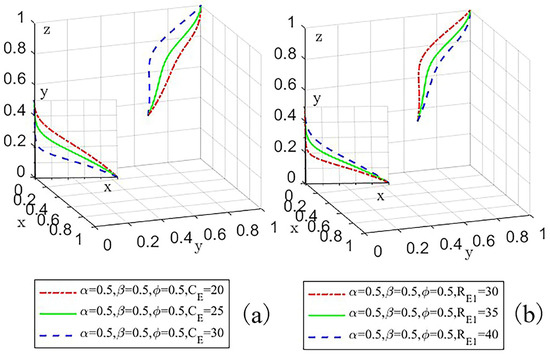
Figure 13.
The influence of and change on the system evolution path: (a) X-Y perspective when change; (b) X-Y perspective when change.
As can be seen from Figure 13, the higher the adoption cost, the slower the listed enterprises evolve towards the adoption strategy and the faster the government evolves towards the voluntary strategy. The higher cost of adoption means a higher risk borne by listed enterprises and a lower incentive to adopt, while at the same time, the government needs to pay more in subsidies and regulatory costs to change the adoption willingness of listed enterprises, and the government is more inclined to choose the voluntary strategy. In addition, with the higher incremental benefits of adoption, the listed enterprises evolve towards an adoption strategy faster, suggesting that the active involvement of institutional investors in the diffusion of XBRL technology provides listed enterprises with greater access to finance from the capital market and potential to benefit from it, giving listed enterprises an intrinsic incentive to adopt XBRL. Therefore, the government can implement flexible incentives to reduce the cost of technology adoption for listed enterprises and increase the expected incremental benefits of XBRL adoption for them through the active involvement of institutional investors.
4.5. Institutional Investor Participation Analysis
To analyze the impact of institutional investors’ participation intensity on the tripartite evolutionary path, the values of were made to be 0.1, 0.4, and 0.7, respectively, and the simulation results were run as shown in Figure 14.
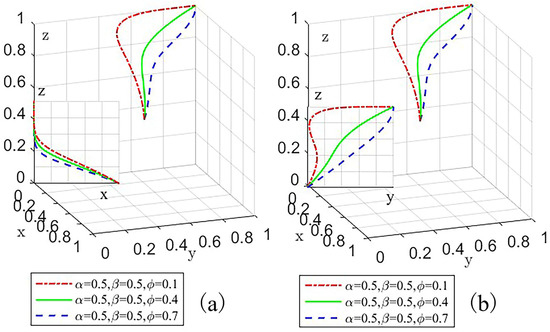
Figure 14.
The influence of change on the system evolution path: (a) X-Z perspective; (b) Y-Z perspective.
From Figure 14, it can be seen that the proportion of institutional investors’ participation is inversely proportional to the participation intensity. This is because the higher the participation intensity, the more participation costs occur, and the fewer net benefits for institutional investors, then the less motivated they are to participate. However, this does not deter institutional investors from ultimately choosing to participate; although there are costs associated with participation, it is still profitable for institutional investors. As participation increases, the proportion of listed enterprises choosing to adopt increases faster, suggesting that the active participation of institutional investors is an important driver for listed enterprises to adopt XBRL technology. Listed enterprises need to send positive trading signals to well-funded institutional investors through the adoption of XBRL, taking into account factors such as corporate image, share price, and stock trading volumes. Therefore, the government can indirectly pressure listed enterprises to move from mandatory passive adoption to voluntary active adoption by rewarding institutional investors for their participation.
In this section, we examine not only the evolution trajectory of various equilibrium points but also the impact of government enforcement intensity, subsidy intensity, enterprise adoption cost and incremental benefit, and institutional investor participation intensity on the system evolution path by varying parameter sizes. Some of our findings are compatible with important conclusions of the evolutionary game model between the government and listed enterprises. For instance, increasing the intensity of government enforcement and subsidies, lowering the adoption costs, and increasing the adoption benefits will accelerate the evolution of listed enterprises toward the adoption strategy; however, increasing the intensity of subsidy and law enforcement will increase the regulatory burden and financial pressure on the government. We discovered that the research [20] did not address the issue of how to balance the interests of the government and listed companies while ensuring the sustainability of the promotion process.
Based on the research background presented above, this study introduces institutional investors to demonstrate the potential promotion force produced by the coordinated actions of the three parties. Compared to the previous study, this paper has the following new findings: first, the government’s policy choices will not only influence listed firms’ readiness to use XBRL technology but will also have a direct impact on institutional investors’ cognition surrounding XBRL technology and their willingness to participate in its diffusion. Second, the willingness of institutional investors to participate will increase as government enforcement intensity increases and will decrease as government subsidies increase. In other words, the government can affect not only the adoption behavior of listed enterprises but also the strategy selection of institutional investors.
Third, with the continuous improvement of institutional investors’ participation and incremental income brought by adoption, listed enterprises evolve to adopt strategies faster, which indicates that the active participation of institutional investors can stimulate the internal adoption motivation of listed enterprises from the capital market. Therefore, this study emphasizes the importance of institutional investors’ participation in the diffusion of XBRL technology and explains the important role of institutional investors in promoting the adoption of listed companies from compulsory passive to voluntary active.
In summary, listed enterprises may be forced to implement XBRL technology due to increased government enforcement, but this will also result in increased government regulatory pressure. More government aid can help listed enterprises with their cost burdens and encourage more listed enterprises to embrace XBRL technology. However, high subsidies will place a significant financial burden on the government, making the substantial administrative interference of the government unsustainable. The simulation findings demonstrate that lowering the adoption cost, raising incremental revenue from adoption, and expanding institutional investor participation can encourage listed firms to embrace XBRL technology. To put it another way, the only effective way to influence listed enterprises’ attitudes and willingness to adopt XBRL technology is to lower the cost of adoption, encourage institutional investors to actively participate, and provide enterprises with measurable incremental economic value. This will allow XBRL technology to be effectively disseminated and applied.
5. Discussion
There are two primary sections in this section. First, the research in this paper builds on previously published literature; to properly summarize the significant contribution made in this work, we compare the findings with those of related studies and highlight the connections between them. Following that, we offer potential recommendations and actions based on the findings of this paper.
5.1. Relation to Earlier Research
It is essential to discuss the connections with comparable works. Prior research mostly used qualitative analysis and empirical tests to examine the motivating factors for businesses to use XBRL technology as well as the effects on enterprises, governments, and investors after doing so. This served as a theoretical foundation for the explanation of the XBRL technology adoption driving drivers and application effects. However, the majority of these studies use qualitative analysis and empirical tests to study the decision-making of a single subject, making it difficult to explain the influencing mechanism of decision-making interaction among multiple subjects in the adoption and diffusion of XBRL technology from a macro and global perspective. Evolutionary game theory has advantages in studying the interaction of multiple boundedly rational players. It can help us evaluate the dynamic changing process of players’ behaviors in the game system since it uses mathematical tools to analyze the cost and benefit factors underlying their strategies.
Game theory has been used to study the adoption and diffusion of XBRL technology; one of the studies [21,22] used game theory to analyze the XBRL technology adoption behavior of enterprises, and their research assumption was based on the “complete rationality” of game players, which was not consistent with the objective reality. The study [24] examined the government’s and the enterprises’ interacting strategies in the XBRL technology adoption regulation process by building an asymmetric evolutionary game model between them. Although the “bounded rationality” of the game’s subject was taken into consideration, it only analyzed the behaviors of the two stakeholders, the government and enterprises, in the process of XBRL technology adoption and diffusion. This study lacks interaction behavior analysis of other stakeholders.
Based on evolutionary game theory, this paper integrates the research results of driving factors and application effects into the process of determining the relationship between game players, innovatively introducing institutional investors, an important stakeholder, into the model, and constructs a three-party evolutionary game model that includes the government, listed enterprises, and institutional investors. The stability of the single-agent strategy selection and the stability of the multi-agent system equilibrium strategies are examined at the micro and macro levels. Additionally, the simulation analysis of different parameter change scenarios in the model is carried out, and the impact of each changed factor on the system’s evolution trajectory is intuitively analyzed to more effectively coordinate the various benefits of administrative intervention from the government and participation from institutional investors in oversight, as well as to promote the adoption of XBRL technology in the group of listed enterprises.
5.2. Contributions and Suggestions
In this paper, we have established the main game mechanisms among the government, listed enterprises, and institutional investors based on the assumption of limited rationality of the participants and analyzed not only the individual evolutionary stabilization strategies under different situations but also the impact of changes in parameters such as enforcement intensity, subsidy intensity, adoption cost, incremental benefits from adoption and participation intensity on the evolutionary path of the three parties. The study’s findings have significant contributions to theoretical research and management practice.
The theoretical contributions of this paper are as follows: first of all, we take into account the “bounded rationality” traits of game players and incorporate evolutionary game theory into the study of XBRL technology adoption and diffusion, which is more accurate and provides a reference for relevant scholars studying the adoption and diffusion of innovative technology. Additionally, it extends the traditional interaction model of government enterprises to a three-party evolutionary game model that includes institutional investors as extra players to solve problems such as a lack of motivation for listed enterprises to adopt XBRL technology and a lack of obvious market feedback, and it provides a reference research method for scholars to introduce more stakeholders in the future and build game models with more than three parties. Third, the findings of this paper not only add to the theory of XBRL technology adoption and diffusion but also provide a theoretical foundation for how the government and institutional investors might encourage the adoption of XBRL technology in listed enterprises.
The managerial contributions of this paper are as follows: firstly, the government’s regulatory measures, as a public trust institution, will not only directly affect listed firms’ adoption decisions on XBRL technology but will also directly affect institutional investors’ involvement attitude and technological cognition surrounding XBRL technology diffusion. Although severe regulatory laws can cause listed firms to swiftly embrace XBRL technology, internal motivation for adoption is weak, and the majority of them are passive adopters. Secondly, regardless of the increase in law enforcement or subsidy intensity, the government is faced with a greater regulatory burden and financial pressure during the compulsory promotion process, indicating that the government cannot carry out its responsibilities healthily and sustainably in this state; therefore the government must rely on social forces to consistently improve the system of information disclosure.
Thirdly, listed enterprises will fully consider the evaluation and judgment of institutional investors on their value to release favorable trading signals to the capital market and enhance their corporate image. The active participation of institutional investors in the diffusion of XBRL technology will have a direct impact on whether listed firms may receive more financing opportunities and benefit opportunities. As a result, the participation of institutional investors in oversight can effectively promote the internal incentive of listed firms to embrace XBRL technology. In summary, to fully guide the benign interaction of capital market participants and the rational allocation of resources, the government should gradually reduce the mandatory administrative intervention in the process of promoting the use of XBRL and place a premium on cultivating institutional investors’ preference for the use of XBRL financial reports and raising awareness of the right to participate in supervision. Only by providing listed companies with a competitive edge in the capital market will the move from forced passive to active adoption be genuinely realized.
Based on the findings of this paper, we make the following recommendations:
Innovative ways to guide and enhance policy synergy. The government needs to take a holistic approach, deeply consider the roles and interests of different stakeholders, and design multi-dimensional incentive policies to make active adoption of XBRL technology the default option for listed enterprises. On the one hand, the government should strengthen publicity and promote the construction of an XBRL data-sharing service platform to facilitate the application of data analysis by listed enterprises and investment decisions by investors through a unified and authoritative information interaction and sharing platform, increasing the probability of gaining benefits. On the other hand, the government can encourage software vendors to develop more compatible and adaptable XBRL software to reduce technical complexity and ensure data security, providing strong technical support to listed enterprises and reducing their adoption costs at the same time.
Apply a stage-by-stage mindset and move towards flexible regulation. While government mandates for listed enterprises to adopt XBRL is effective in the short term, they are not necessarily beneficial to the long-term development of the technology. The government should implement different regulatory policies based on a long-term policy plan and different stages of technology diffusion. In the early stages of diffusion, the government should adopt mandatory guidance measures to mobilize all parties in their respective roles, to avoid listed enterprises’ shortsightedness, and to raise awareness among institutional investors to actively exercise their rights. When market awareness of XBRL’s technological advantages becomes high enough, the government should allow market forces to guide the allocation of resources in the capital market in a reasonable and orderly manner and direct more institutional investors to participate in the diffusion of XBRL technology. These investors will be acting as a deterrent and external monitoring entity for listed enterprises, forming an effective complementary role to the government’s responsibilities fulfilling tasks, and jointly contributing to the improvement of the information disclosure environment in the capital market.
Combine other external forces to act collaboratively and efficiently. The government should mobilize more social forces to participate in exploring the value of XBRL applications and accordingly form a vertical chain mechanism with close cooperation and interlinking between the stock exchanges, listed enterprises, accounting firms, law firms, software suppliers, and consulting service providers. Then, all activities in the process of preparing and using XBRL financial reports can have stronger legitimacy and rationality. Ensuring the authenticity and reliability of accounting information, protecting the interests of investors while reducing the financing costs of listed enterprises, and giving better play to the role of the capital market in promoting overall economic development.
6. Conclusions and Limitations
6.1. Conclusions
We create a tripartite evolutionary game model of the government, listed enterprises, and institutional investors based on the premise of bounded rationality. Then, we conduct numerical simulation using the MATLABR2016B software, which not only analyzes the system equilibrium results under various conditions but also analyzes the effects of the intensity of government enforcement, the intensity of subsidies, the cost of enterprise adoption, and the incremental benefit of adoption, as well as the participation level of institutional investors on the path of the system’s evolution.
We found that taking into account the participation of institutional investors, some of the results of this study are consistent with the findings of the two-party evolutionary game model between the government and listed enterprises [24], i.e., increasing government subsidies and enforcement intensity, reducing the adoption costs of listed enterprises, and increasing the incremental benefits of adoption by listed enterprises will promote the adoption of XBRL by listed enterprises, but increasing enforcement intensity and subsidies will harm government performance. However, increasing the intensity of enforcement and subsidies will put some regulatory and financial pressure on the government to fulfill its responsibilities. On this basis, our study further found that the government’s reward and punishment policies played a leading role in the initial stage of XBRL technology diffusion, but as enterprises and institutional investors gradually complete their cognition of XBRL technology advantages, this dominant role will be replaced by an “institutional investor-led” market mechanism.
In conclusion, the adoption of XBRL technology by listed enterprises is driven by a combination of government policy guidance and institutional investors’ participation and oversight. In the early stages of technology diffusion, although the government’s mandatory regulatory measures exerted regulatory pressure on listed enterprises, due to high adoption costs and insignificant incremental benefits, enterprises were more prone to high-pressure stress adoption and did not take much initiative, making it difficult to fully utilize the advantages of XBRL technology. As XBRL technology becomes more widespread and institutional investors’ participation increases, the government will gradually reduce its mandatory administrative intervention and shift its policy focus to guiding and nurturing institutional investors’ exercise of right consciousness; during this period, the economic value rewards from investors’ recognition will become an internal driver of technology adoption by listed enterprises.
6.2. Limitations
Although the conclusions of this study have certain theoretical and practical significance, due to the complexity of XBRL technology adoption and diffusion, this study still has some shortcomings and requires further exploration. First of all, because the real data set is very large and difficult to obtain, this study can only simulate and set parameters in numerical simulation examples. The simulation results validate the model’s validity to some extent, but the model’s applicability, in reality, must be confirmed further by collecting and bringing in real data sets. In the future, based on this theoretical analysis framework, scholars can further combine realistic data to conduct empirical tests on the model, to obtain more powerful research conclusions. Secondly, XBRL technology adoption and diffusion involve a large number of stakeholders, such as software suppliers, stock exchanges, accounting firms, etc. The tripartite evolutionary game model established in this study only introduces institutional investors into the analysis based on the participation of the government and enterprises, and the role and influence of other subjects on the three parties are not involved in this study. By including additional stakeholders in the XBRL adoption and dissemination system and by thoroughly researching the roles of various stakeholders, scholars can help policymakers understand the processes and patterns of XBRL adoption and diffusion in the future.
Author Contributions
Conceptualization, D.P. Furthermore, Y.J.; methodology, D.P.; software, Y.J.; writing—original draft preparation, D.P. Furthermore, Y.J.; writing—review and editing, D.P. Furthermore, Y.J. All authors have read and agreed to the published version of the manuscript.
Funding
The research was funded by the National Natural Science Foundation of China under grant number 71771104.
Institutional Review Board Statement
Not applicable.
Informed Consent Statement
Not applicable.
Data Availability Statement
Not applicable.
Conflicts of Interest
The authors declare no conflict of interest.
References
- Bartolacci, F.; Caputo, A.; Fradeani, A.; Soverchia, M. Twenty years of XBRL: What we know and where we are going. Meditari Account. Res. 2020, 29, 1113–1145. [Google Scholar] [CrossRef]
- Borgi, H. XBRL technology adoption and consequences: A synthesis of theories and suggestions of future research. J. Account. Manag. Inf. Syst. 2022, 21, 220–235. [Google Scholar] [CrossRef]
- Ping, W. Data mining and XBRL integration in management accounting information based on artificial intelligence. J. Intell. Fuzzy Syst. 2021, 40, 6755–6766. [Google Scholar] [CrossRef]
- Blankespoor, E. The impact of information processing costs on firm disclosure choice: Evidence from the XBRL mandate. J. Account. Res. 2019, 57, 919–967. [Google Scholar] [CrossRef]
- Huang, Y.; Shan, Y.G.; Yang, J.W. Information processing costs and stock price informativeness: Evidence from the XBRL mandate. Aust. J. Manag. 2021, 46, 110–131. [Google Scholar] [CrossRef]
- Aksoy, M.; Yilmaz, M.K.; Topcu, N.; Uysal, Ö. The impact of ownership structure, board attributes and XBRL mandate on timeliness of financial reporting: Evidence from Turkey. J. Appl. Account. Res. 2021, 22, 706–731. [Google Scholar] [CrossRef]
- Li, X.; Zhu, H.; Zuo, L. Reporting technologies and textual readability: Evidence from the XBRL mandate. Inf. Syst. Res. 2021, 32, 1025–1042. [Google Scholar] [CrossRef]
- Licheng, L.; Qin, L. Financial Innovation in the Background of Digital Economy-summary of the main viewpoints of the 18th National Accounting Informatization Academic Annual Conference. Account. Res. J. 2019, 10, 95–97. [Google Scholar] [CrossRef]
- Song, X.; Ding, Z.; Liu, C.; Zhang, Q. The Utilization Ratio and Interoperability of Corporate-Level XBRL Classification Standard Elements in China. Comput. Intell. Neurosci. 2022, 2022, 4897908. [Google Scholar] [CrossRef]
- Zhongsheng, W.; Qin, L. International XBRL Application Experience and Enlightenment to my country’s Promotion of XBRL Cause. Mod. Manag. 2016, 36, 53–55. [Google Scholar] [CrossRef]
- Ming, L.; Haifeng, Q.; Fanghui, J. Task-related top management team faultline, mixed-ownership structure and innovation performance in state-owned companies. Sci. Res. Manag. 2018, 39, 26–33. [Google Scholar] [CrossRef]
- Xingmei, X.; Xinkai, Z. Government Control, Institutional Investors, and Financial Restatement—Empirical evidence based on “patching” of annual reports of listed companies in China. Jianghan Trib. 2016, 6, 60–66. [Google Scholar] [CrossRef]
- Lixia, Z. Listed company annual report disclosure of existing problems and countermeasures. Financ. Account. 2019, 13, 77–78. [Google Scholar] [CrossRef]
- Hong, C.; Wenhua, W.; Yaodan, H.; Lifu, L. Front-line regulation of stock exchanges and corporate debt financing: Evidence based on financial reporting Inquiry Letters. Financ. Regul. Res. 2021, 2, 86–102. [Google Scholar] [CrossRef]
- Longbin, L.; Xiaoping, H.; Bo, Y. Research on the effectiveness of securities market regulation to reduce the re-violation of enterprises. Financ. Regul. Res. 2022, 5, 19–39. [Google Scholar] [CrossRef]
- Yan, H. The Information Demands of Investors and Media Coverage: A Quasi-natural Experiment Based on Margin Trading. J. Shanghai Univ. Financ. Econ. 2022, 24, 94–107. [Google Scholar] [CrossRef]
- Xianming, Z.; Tianxi, Z.; Xiaodong, S. Game Analysis of Financial Information Standard Based on XBRL. Chin. J. Manag. 2011, 8, 273. [Google Scholar] [CrossRef]
- Gang, R.; Zhongsheng, W. Game Study on XBRL Financial Information Disclosure. Gov. Financ. 2019, 22, 12529–12538. [Google Scholar]
- Zhongsheng, W.; Qin, L. Market Competition, Government Behavior and XBRL Technology Diffusion. Account. Res. 2015, 8, 19–23. [Google Scholar] [CrossRef]
- Ding, P.; Yong, X. Supervision Strategy of XBRL Technology Adoption from the Perspective of Evolutionary Game. Oper. Res. Manag. Sci. 2021, 30, 172. [Google Scholar] [CrossRef]
- Yonghao, X.; Xin, X.; Feifei, Z. The “Large-Volume Trading Anomaly” in China’s A-Share Market. J. Manag. World 2022, 38, 120. [Google Scholar] [CrossRef]
- Rostami, M.; Nayeri, M.D. Investigation on XBRL adoption based on TOE model. Br. J. Econ. Manag. Trade 2015, 7, 269–278. [Google Scholar] [CrossRef]
- Baby, A.; Kannammal, A. Network Path Analysis for developing an enhanced TAM model: A user-centric e-learning perspective. Comput. Hum. Behav. 2020, 107, 106081. [Google Scholar] [CrossRef]
- Pinsker, R.E.; Felden, C. Professional role and normative pressure: The case of voluntary XBRL adoption in Germany. J. Emerg. Technol. Account. 2016, 13, 95–118. [Google Scholar] [CrossRef]
- Jinping, G.; Huiqin, Z. Research on the impact of financial presentation Innovation on the cost of corporate equity capital. Hubei Soc. Sci. 2016, 8, 81–87. [Google Scholar] [CrossRef]
- Jinping, G.; Yan, W.; Jing, F. Key Factors of the Innovation Diffusion of XBRL Financial Reporting. Res. Financ. Econ. Issues 2016, 1, 85–92. [Google Scholar] [CrossRef]
- Ansary, M.E.; Oubrich, M.; Orlando, B.; Fiano, F. The determinants of XBRL adoption: A meta-analysis. Int. J. Manag. Financ. Account. 2020, 12, 1–24. [Google Scholar] [CrossRef]
- Borgi, H.; Tawiah, V. Determinants of eXtensible business reporting language adoption: An institutional perspective. Int. J. Account. Inf. Manag. 2022, 30, 352–371. [Google Scholar] [CrossRef]
- Zhou, J. Does one size fit all? Evidence on XBRL adoption and 10-K filing lag. Account. Financ. 2020, 60, 3183–3213. [Google Scholar] [CrossRef]
- Bani-Khalid, T.; El-Dalabeeh, A.; Al-Adamat, A. The effect of XBRL adoption on information symmetry in companies’ financial reports through knowledge management: Perceptions of employees of the Jordan securities commission. Accounting 2021, 7, 629–634. [Google Scholar] [CrossRef]
- Ruan, L.; Liu, H.; Tsai, S.-B. XBRL adoption and capital market information efficiency. J. Glob. Inf. Manag. 2021, 29, 1–18. [Google Scholar] [CrossRef]
- Chen, G.; Kim, J.-B.; Lim, J.-H.; Zhou, J. XBRL adoption and bank loan contracting: Early evidence. J. Inf. Syst. 2018, 32, 47–69. [Google Scholar] [CrossRef]
- Chong, D.; Shi, H.; Fu, L.; Ji, H.; Yan, G. The impact of XBRL on information asymmetry: Evidence from loan contracting. J. Manag. Anal. 2017, 4, 145–158. [Google Scholar] [CrossRef]
- Imhof, M.J.; Seavey, S.E.; Smith, D.B. Comparability and cost of equity capital. Account. Horiz. 2017, 31, 125–138. [Google Scholar] [CrossRef]
- Rahwani, N.R.; Sadewa, M.M.; Qalbiah, N.; Mukhlisah, N.; Nikmah, N. XBRL based corporate tax filing in Indonesia. Procedia Comput. Sci. 2019, 161, 133–141. [Google Scholar] [CrossRef]
- Hsieh, T.-S.; Wang, Z.; Abdolmohammadi, M. Does XBRL disclosure management solution influence earnings release efficiency and earnings management? Int. J. Account. Inf. Manag. 2019, 27, 74–95. [Google Scholar] [CrossRef]
- Birt, J.L.; Muthusamy, K.; Bir, P. XBRL and the qualitative characteristics of useful financial information. Account. Res. J. 2017, 30, 107–126. [Google Scholar] [CrossRef]
- Ra, C.-W.; Lee, H.-Y. XBRL adoption, information asymmetry, cost of capital, and reporting lags. iBusiness 2018, 10, 93. [Google Scholar] [CrossRef]
- Sassi, W.; Othman, H.B.; Hussainey, K. The impact of mandatory adoption of XBRL on firm’s stock liquidity: A cross-country study. J. Financ. Report. Account. 2021, 19, 299–324. [Google Scholar] [CrossRef]
- Xu, Z.; Cheng, Y.; Yao, S. Tripartite evolutionary game model for public health emergencies. Discret. Dyn. Nat. Soc. 2021, 2021, 6693597. [Google Scholar] [CrossRef]
- Zhou, Y.; Rahman, M.M.; Khanam, R.; Taylor, B.R. The impact of penalty and subsidy mechanisms on the decisions of the government, businesses, and consumers during COVID-19—Tripartite evolutionary game theory analysis. Oper. Res. Perspect. 2022, 9, 100255. [Google Scholar] [CrossRef]
- Chu, Z.; Bian, C.; Yang, J. How can public participation improve environmental governance in China? A policy simulation approach with multi-player evolutionary game. Environ. Impact Assess. Rev. 2022, 95, 106782. [Google Scholar] [CrossRef]
- Chu, Z.; Bian, C.; Yang, J. From fabrication to consolidation of China’s political blue-sky: How can environmental regulations shape sustainable air pollution governance? Environ. Policy Gov. 2023, 33, 31–43. [Google Scholar] [CrossRef]
- Wei’an, L.; Yin, M. A tripartite evolutionary game study on green governance in China’s coating industry. Environ. Sci. Pollut. Res. 2022, 29, 61161–61177. [Google Scholar] [CrossRef] [PubMed]
- Zhou, K.; Wang, Q.; Tang, J. Evolutionary game analysis of environmental pollution control under the government regulation. Sci. Rep. 2022, 12, 474. [Google Scholar] [CrossRef]
- Zhu, Y.; Niu, L.; Zhao, Z.; Li, J. The tripartite evolution game of environmental governance under the intervention of central government. Sustainability 2022, 14, 6034. [Google Scholar] [CrossRef]
- Yang, J.; Wang, Y.; Mao, J.; Wang, D. Exploring the dilemma and influencing factors of ecological transformation of resource-based cities in China: Perspective on a tripartite evolutionary game. Environ. Sci. Pollut. Res. 2022, 29, 41386–41408. [Google Scholar] [CrossRef]
- Teng, Y.; Lin, P.-W.; Chen, X.-L.; Wang, J.-L. An analysis of the behavioral decisions of governments, village collectives, and farmers under rural waste sorting. Environ. Impact Assess. Rev. 2022, 95, 106780. [Google Scholar] [CrossRef]
- Jiang, X.; Sun, H.; Lu, K.; Lyu, S.; Skitmore, M. Using evolutionary game theory to study construction safety supervisory mechanism in China. Eng. Constr. Archit. Manag. 2023, 30, 514–537. [Google Scholar] [CrossRef]
- Li, X.; Li, Q.; Du, Y.; Fan, Y.; Chen, X.; Shen, F.; Xu, Y. A Novel Tripartite Evolutionary Game Model for Misinformation Propagation in Social Networks. Secur. Commun. Netw. 2022, 2022, 1136144. [Google Scholar] [CrossRef]
- Peng, X.; Wang, F.; Wang, J.; Qian, C. Research on food safety control based on evolutionary game method from the perspective of the food supply chain. Sustainability 2022, 14, 8122. [Google Scholar] [CrossRef]
- Gao, L.-H.; Cai, D.; Zhao, Y.; Yan, H. A tripartite evolutionary game for marine economy green development with consumer participation. Environ. Dev. Sustain. 2022, 1–32. [Google Scholar] [CrossRef]
- Jiang, S.; Wei, X.; Jia, J.; Ma, G. Toward sustaining the development of green residential buildings in China: A tripartite evolutionary game analysis. Build. Environ. 2022, 223, 109466. [Google Scholar] [CrossRef]
- Chen, L.; Bai, X.; Chen, B.; Wang, J. Incentives for green and low-carbon technological innovation of enterprises under environmental regulation: From the perspective of evolutionary game. Front. Energy Res. 2022, 9, 817. [Google Scholar] [CrossRef]
- Yi, L.; Hiroatsu, F. Incentives for innovation in robotics and automated construction: Based on a tripartite evolutionary game analysis. Sustainability 2022, 14, 2475. [Google Scholar] [CrossRef]
Disclaimer/Publisher’s Note: The statements, opinions and data contained in all publications are solely those of the individual author(s) and contributor(s) and not of MDPI and/or the editor(s). MDPI and/or the editor(s) disclaim responsibility for any injury to people or property resulting from any ideas, methods, instructions or products referred to in the content. |
© 2023 by the authors. Licensee MDPI, Basel, Switzerland. This article is an open access article distributed under the terms and conditions of the Creative Commons Attribution (CC BY) license (https://creativecommons.org/licenses/by/4.0/).