
Evolution Analysis of Green Innovation in Small and Medium-Sized Manufacturing Enterprises


1
School of Economics and Management, Jiangxi University of Science and Technology, Ganzhou 341000, China
2
School of Economics and Management, Harbin Institute of Technology (Weihai), Weihai 264200, China
*
Author to whom correspondence should be addressed.
Systems 2023, 11(2), 95; https://doi.org/10.3390/systems11020095
Submission received: 15 January 2023
/
Revised: 2 February 2023
/
Accepted: 8 February 2023
/
Published: 9 February 2023
Abstract
:In recent years, green innovation has gained substantial attention and popularity from the manufacturing industry around the world. As an essential part of the manufacturing industry, small and medium-sized manufacturing enterprises (SMMEs) are vital participants that promote green innovation to realize sustainable development. However, how green innovation evolves in SMMEs is unclear, which hinders SMMEs from implementing or even adopting green innovation. This study attempted to essentially reveal the evolution of green innovation in SMMEs based on complex systems theory. First, this study divided green innovation into green product innovation and green process innovation, defined the state variables of the two components, and dissected the symbiotic interactions between them. This study then designed a nonlinear dynamic model followed by extensive simulations to theoretically and visually describe how green innovation evolves. This study found that green innovation with non-zero levels in both dimensions is desired and determines the evolutionary paths with corresponding measures that can guide SMMEs to realize green innovation at desired stable states. Besides, symmetric mutualism is discovered to be the optimal symbiotic interaction. Based on these findings, regulatory subjects and SMMEs can duly adjust the inputs on green innovation and the symbiotic interactions within green innovation to better manage green innovation practices.
1. Introduction
Rapidly growing industrialization and urbanization consume natural resources in quantity and generate large amounts of environmentally unfriendly emissions such as greenhouse gas and suspended particulates [1,2], causing mounting problems that plague human existence, such as resource scarcity, natural disasters, detrimental water, rising air temperature, global diseases, and flabby economy, just to name a few [3,4]. Compelled by the deteriorating environment and unsustainable economy, governments, scholars, industry practitioners, and environmentalists highlight the importance of green development [5,6] and call for relevant cooperation, practices, studies, policies, action plans, etc., to propel green development. At the same time, customers and consumers are gradually aware of environmental sustainability and display relevant behaviors such as using green products [7]. In this context, green innovation, a strategy to balance economic growth and environmental protection, enjoys more and more attention and popularity at the micro, meso, and macro levels. Enterprises, industries, and countries are the subjects at the three levels, respectively [8,9,10].
The manufacturing industry is a representative subject at the meso level because it has a broad scope and directly manifests the productivity of a country. Besides, the manufacturing industry is resource-intensive or energy-intensive and can produce massive emissions [11]. Thus, the manufacturing industry is responsible for current environmental and economic states and urgently needs to transform traditional practices into green innovation practices. Small and medium-sized manufacturing enterprises (SMMEs) are vital subjects at the micro-level in the manufacturing industry, as they provide plenty of employment opportunities and boost economic development [12]. Accompanied by positive externalities, SMMEs emit the most carbon emissions and pollutants (up to 60% and 70% of the corresponding total emissions, respectively) [13], which is often ignored due to the scale of SMMEs [14]. Nevertheless, SMMEs still face environmental pressures such as carbon neutrality [15] and sustainable development [16]. Therefore, considering green innovation in SMMEs not only conforms to the situation but also acts as a necessary means to enhance enterprise competitiveness.
Compared with large manufacturing enterprises, SMMEs face many distinct barriers, involving economic and financial barriers, organizational and managerial barriers, legal and regulatory barriers, technological barriers, knowledge and competency-related barriers, and market barriers. Among these barriers, the internal barriers are more manageable than the external barriers and thus should be handled as a matter of priority, especially the evolution of green innovation in SMMEs. However, existing literature places emphasis on the macro and meso evolution of green innovation [17,18,19], and the micro evolution driven by the interactive links between the multiple dimensions of green innovation stays to be fully explained [20]. Therefore, the research objective is to uncover how green innovation evolves at the micro level in order to provide detailed guidance for enterprises and regulatory subjects to advance green innovation. This paper attempted to realize the above objective by answering the following research questions.
- What are the end states of green innovation in SMMEs? Which states are the ones SMMEs expect, and which states are the ones SMMEs want to avoid? Under what conditions can SMMEs encounter green innovation at a given end state?
- How green innovation in SMMEs evolves from an unexpected state to an expected state?
- What SMMEs and regulatory subjects should do to better propel green innovation?
Most current methods handling the barriers of green innovation are proposed based on reductionism and mechanism, do not dispose of green innovation from multiple aspects, and can hardly be applied to analyze the complex, dynamic, nonlinear, and multi-dimensional properties of green innovation as a complex system. Thus, more appropriate methods are needed to tackle the evolution of green innovation in SMMEs. Complex systems theory is eminently suitable to dynamically model the structures and explain the bottom-up behaviors of complex systems. Therefore, this paper analyzed the evolution of green innovation in SMMEs based on complex systems theory. This paper categorized green innovation into green product innovation and green process innovation and dissected the state variables of these two kinds of green innovation as well as the nonlinear interactions between them, which underlies the evolution model of green innovation. The paper dynamically reveals the rich evolutionary processes of green innovation and discovers the conditions and evolutionary paths that enable green innovation to stabilize at ideal states.
The remainder of the paper is organized as follows. Section 2 reviewed related literature. Section 3 established and analyzed the evolution model of green innovation in SMMEs. Section 4 conducted numerical simulations. Section 5 displayed findings and discussion, and Section 6 presented contributions and managerial implications. Finally, Section 7 concluded the paper and proposed future research directions.
2. Literature Review
2.1. Green Innovation
Green innovation, as an advanced version of traditional innovation, combines innovation-driven and green ideas to balance economic growth and environmental protection. Since green innovation is still in its growth stage [21], the concepts of green innovation are constantly supplemented and updated by researchers from their own perspectives [14], and an agreed-upon and standardized definition does not emerge [22]. Besides, green innovation is usually used interchangeably with the other three terms, that is, eco-innovation, environmental innovation, and sustainable innovation [12,23]. Sustainable innovation covers economic, environmental, and social dimensions, while the remaining three terms address a narrower set of content and ignore the social dimension [24,25]. This difference does not affect micro-level (i.e., enterprise-level) studies. Thus, this paper viewed these terms as similar terminologies.
Green innovation can be divided into several types according to separate classification criteria, such as innovative subjects, manners, meanings, manifestations, and fields. This paper classifies green innovation based on innovative manifestations. As the definitions of green innovation are not unified, the classes of green innovation in terms of innovative manifestations are diverse, and the main categories are summarized as follows: (1) green product innovation and green process innovation [5,20,26,27,28]; (2) green product innovation, green process innovation, and green management innovation [29,30,31]; (3) green product innovation, green process innovation, green management innovation and green business innovation [1,28,32]. This paper adopts the first classification considering the following two situations. On the one hand, although green innovation has various manifestations, green product innovation, and green process innovation are the primary and fundamental under each division. These two sorts of green innovation account for the vast majority of all innovation manifestations [33]. On the other hand, SMMEs are constrained by financial resources, knowledge resources, management competency, etc. As a result, SMMEs cannot touch all kinds of innovations and treat them equally, and the dominating activities in SMMEs revolve around products and processes [34]. It should be noted that innovative green technology can trigger green product innovation and green process innovation [35,36]. In other words, green technology innovation permeates green product innovation and green process innovation in this paper.
2.2. SMME-Specific Challenges for Green Innovation
SMMEs often perform worse than large manufacturing enterprises when it comes to green innovation. The reason behind the reality is that SMMEs face disparate barriers in the adopting, implementing, or expanding phases of green innovation. Such barriers can be summarized into six interwoven categories, including economic and financial barriers, organizational and managerial barriers, legal and regulatory barriers, technological barriers, knowledge and competency-related barriers, and market barriers [14,37,38].
Cash crunches usually prevent SMMEs from adopting and conducting green innovations. These cash crunches mainly root from economic and financial barriers, among which less return of high investment and costs involved in green innovation [39], destitute government subsidies and financial support [40], and unavailable bank loads [41] are the major constituents. Favorable organizational and managerial states endow enterprises with a powerful endogenous impetus to experience and maintain green innovation practices. However, SMMEs are continually puzzled on this aspect. The frequently-mentioned barriers under this category cover passive attitudes and unstable belief towards green innovation [42], inadequate training and consultative activities aiming at green practices [43], deficient human resources in green innovation [44], and poor interactions with other stakeholders participating in green innovation [45]. Legal and regulatory conditions are vital factors throughout the development of green innovation, especially in the early stage of green innovation. Current regulations and policies are complex and unsound, making themselves drag on the floor, followed by debased green innovation initiatives and practices [46,47]. The other main legal and regulatory barrier is that non-policy aids (e.g., training and consultancy programs) are provided by governments [48]. Technology is the hard-nucleus power that SMMEs need to rely on to develop green products and processes. Technological barriers mainly include a lack of new or competent technologies/infrastructure to innovate [39,49], complex designing processes to achieve green targets [50], severe technology dependence on external providers (e.g., benchmarking manufacturing enterprises) [51], and technological uncertainty regarding green innovations [52]. Although external support for green innovation exists, SMMEs are still emphasized to possess certain knowledge and competency which require much time and energy to obtain. Thus, the major barriers under this category encountered by enterprises can be a lack of knowledge and information (e.g., legal knowledge and technological information) on green innovation [53,54] and a lack of competency to accomplish innovation practices (e.g., the ability to carry out R&D and seek innovation chances) [48]. Generally, market demands are the basis for enterprises to implement green innovation, and huge demands can drive even small enterprises to actually perform green innovation in their daily operations. For SMMEs, lack of access to the market and weak market responsiveness are the major market barriers [44,55].
The various barriers imply that green innovation is indeed tough for SMMEs. To pursue successful green innovation, SMMEs must conquer these barriers and the derived ones spawned by them, among which the internal barriers are more controllable than the external barriers and should be tackled preferentially, especially the unclear evolution of green innovation. However, most of the studies focusing on the evolution of green innovation stay at the macro and meso levels (e.g., green innovation networks). The micro-level evolution of green innovation remains a research gap. This paper attempted to fill the gap.
2.3. Current Methods to Propel Green Innovation in SMMEs
Multifarious methods of handling the above barriers appear in existing studies, and they are mainly put forward from the perspectives of manufacturing enterprises and governments. Manufacturing enterprises are the practitioners that really execute green innovation at the frontline. Governments, the crucial non-industrial actors, regulate the behaviors of manufacturing enterprises in green innovation.
In terms of manufacturing enterprises, many measures proposed in the literature can be considered in order to get out of the internal dilemmas encountered in green innovation. Such measures include devising eco-innovation maturity models [56], developing strategies and business modes related to green innovation [23,57], improving external interaction patterns directed at green innovation practices [29,58], implementing information systems concerning green innovation [22,59], ranking green innovation solutions [38], cultivating green innovation-oriented enterprise culture [4], and using green procurement [60], just to name a few. From the angle of governments, introducing new or improved regulations and policies, which can be in the forms of notices, guidebooks, plans, opinions, action programs, etc., is the primary approach used to reward, punish or coordinate the behaviors of manufacturing enterprises and their stakeholders [19,61,62].
Existing methods are instructive to propel green innovation in SMMEs, yet three aspects need to be noticed if comprehensiveness, complexity, and dynamics are taken into account. First, green innovation is a multi-dimensional concept. Disposing of green innovation in more dimensions is more all-sided, but most of the works do not intend to explore green innovation on multiple levels. Second, green innovation in SMMEs is complex, while most of the studies ignore the fact and discuss green innovation utilizing reductionism. Third, green innovation is dynamic, but many countermeasures are presented based on mechanism. Hence, more applicable ways of researching green innovation are needed.
2.4. Complex Systems Theory
Complex systems theory, one theory transcending reductionism and mechanism, is able to model the structures of complex systems and dynamically delineate the operating mechanism and bottom-up behaviors of the systems [63]. The core idea of complex systems theory is that complex systems consist of many components linked by nonlinear interactions, making the systems exert global behaviors and phenomena that are different from those of system components and cannot be inferred by using the superposition theorem [64,65].
Complex systems theory has been widely used to explore the evolution driven by the complex interactions within various complex systems, yielding a lot of robust applications and relevant fruits. For example, Niu et al. [66] developed a dynamic model to describe the evolution of information development driven by different actors in manufacturing enterprises. Zhu et al. [67] established a nonlinear evolution model to investigate how manufacturing technology and information technology interacted and together determined the evolutionary trajectories of technology fusion. Pal et al. [68] studied the stability of two ecological systems jointed by migration based on two classical dynamic models. Çalış et al. [69] devised a delayed model to analyze the dynamic response of a financial system dominated by four interacted state variables. Xu et al. [70] discussed the chaos control of a supply chain system made up of customers, distributors, and manufacturers by using a dynamic model with effective control parts. Therefore, through building a nonlinear dynamic model about green product innovation and green process innovation, which are the primary components of green innovation, this paper explored the evolution of green innovation in SMMEs.
3. Evolution Model of Green Innovation in SMMEs
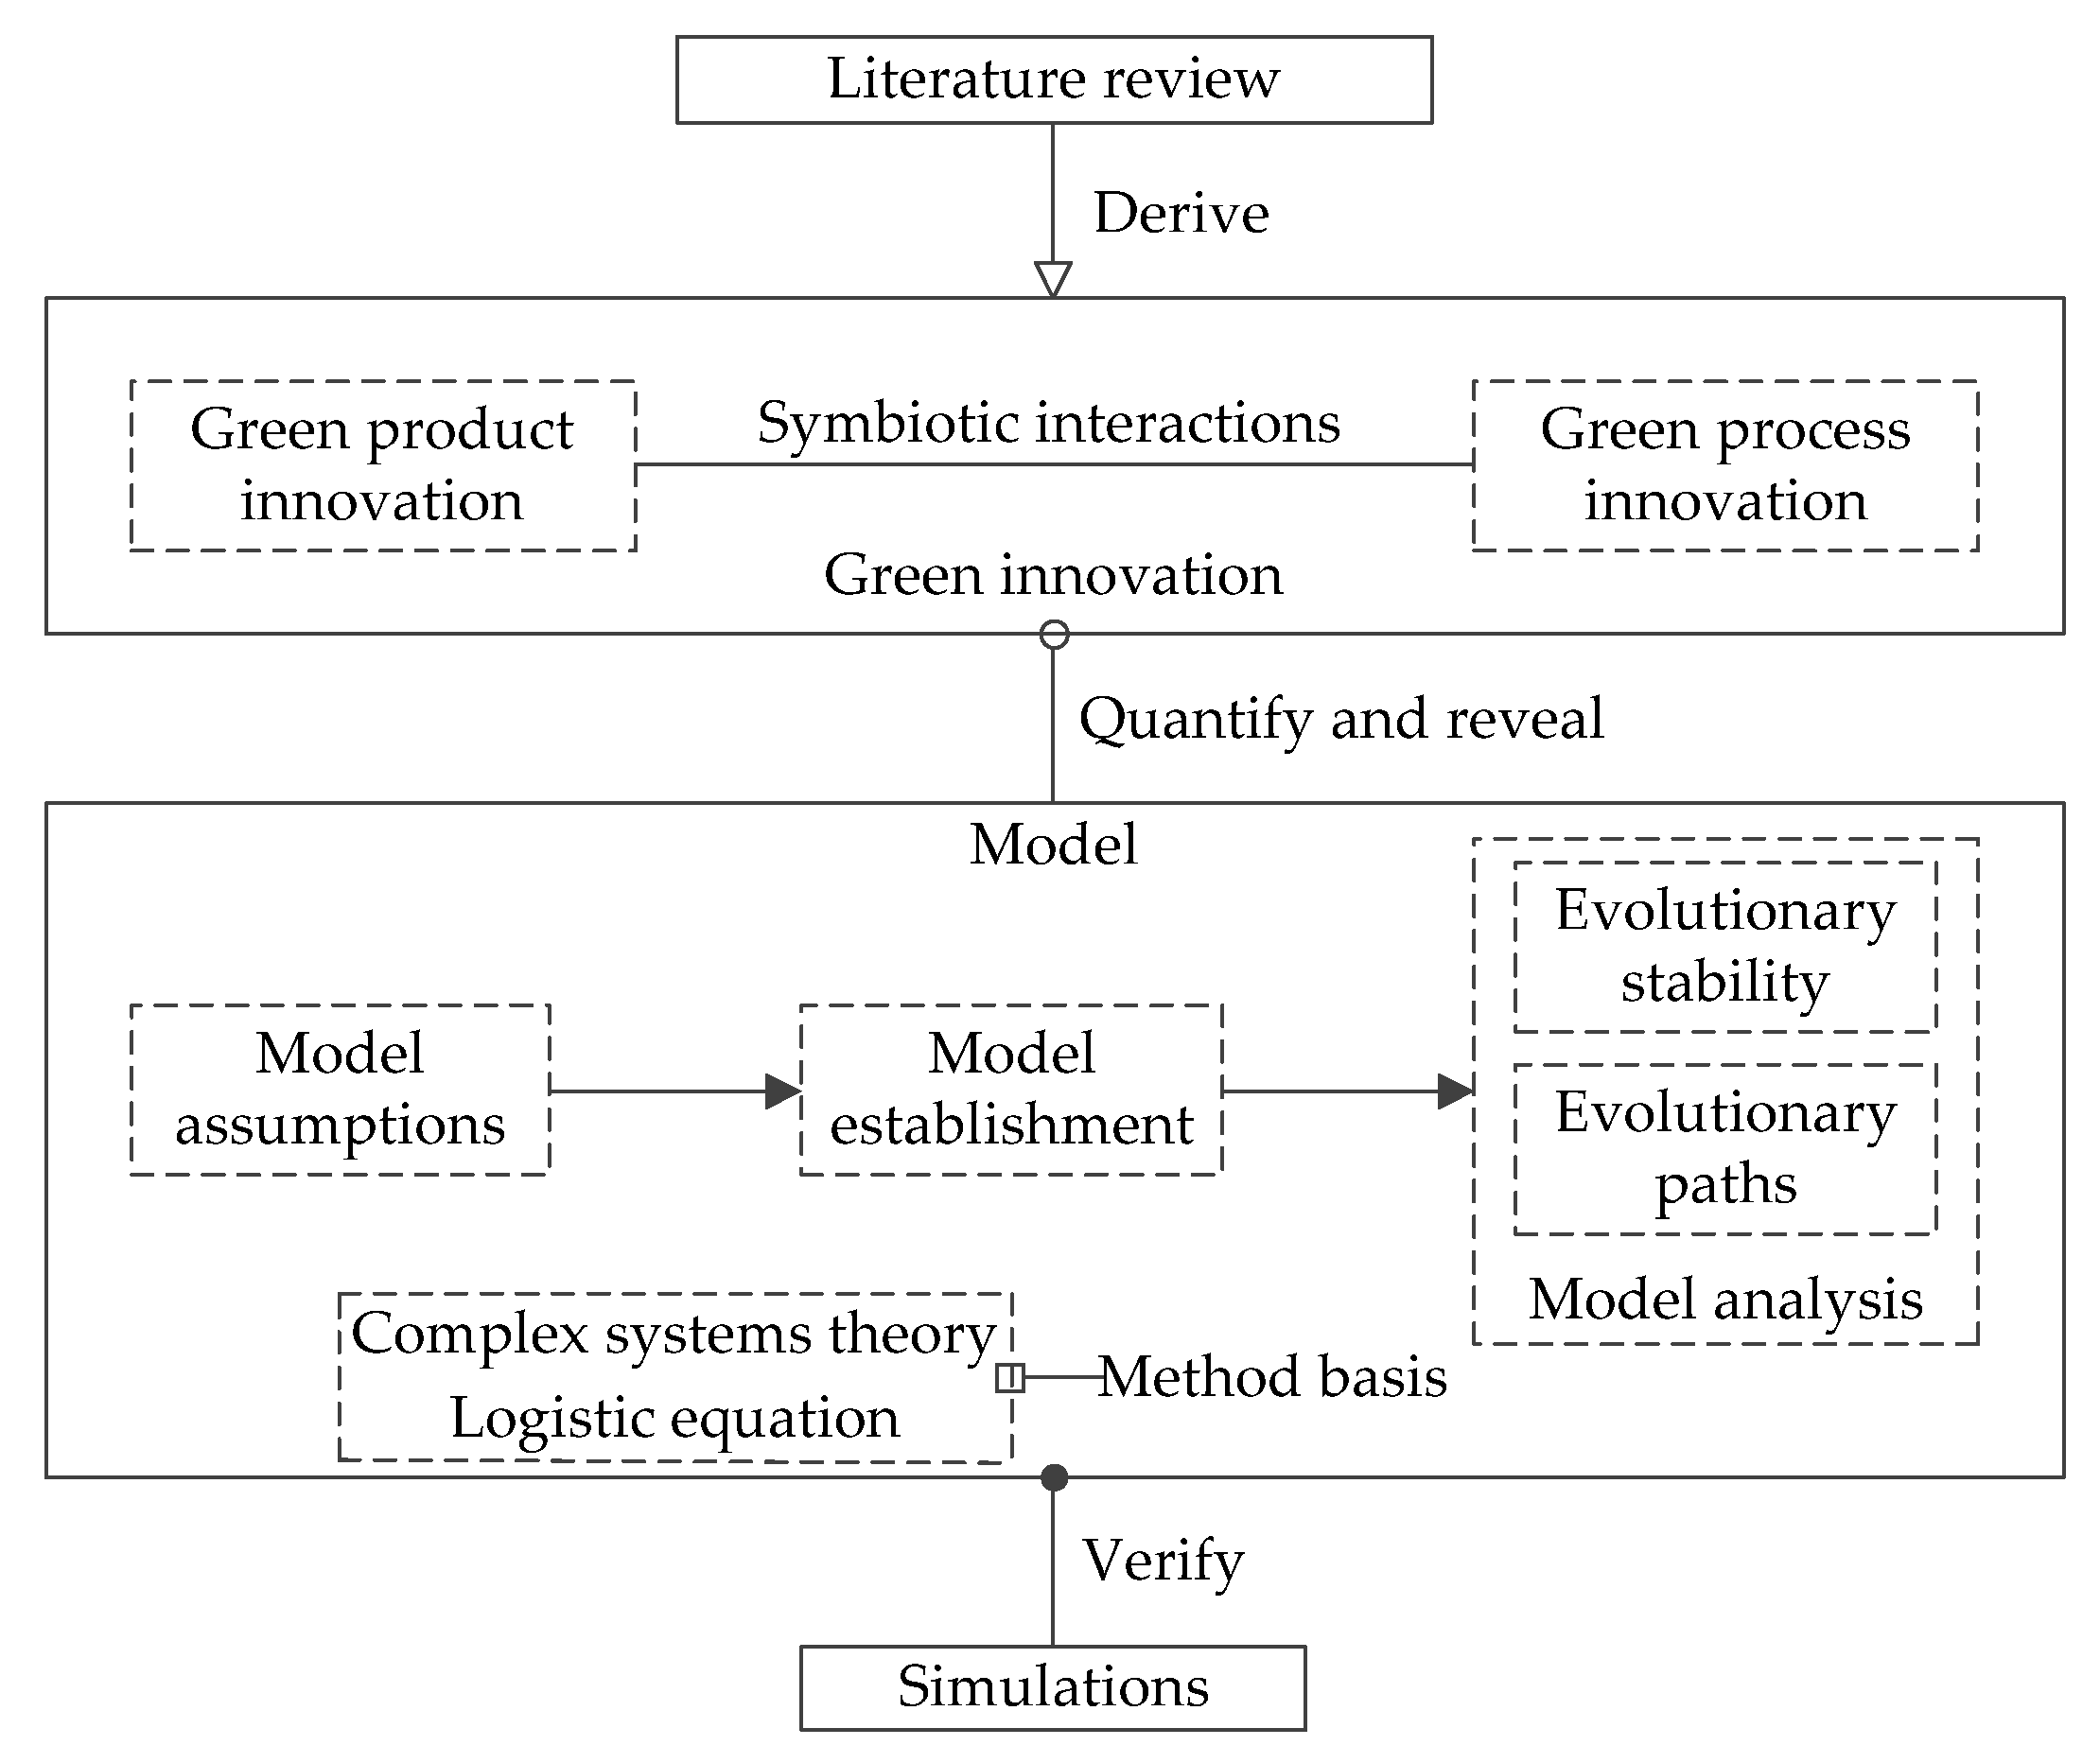
On the grounds of the literature review, green innovation in this paper was viewed as the nonlinear superposition of green product innovation and green process innovation, and we utilized complex systems theory and the Logistic equation to conditionally construct a dynamic model for green innovation with the purpose to quantify the bottom-up evolution of green innovation at the micro level. Through model analysis, we obtained detailed evolutionary stability and paths of green innovation. By setting data, many numerical simulations were performed to verify our model. The methodology proposed in this paper is graphically displayed in Figure 1.
3.1. Model Assumptions
Green innovation mainly consists of green product innovation and green process innovation and is a dynamic process in nature. This paper investigated the evolution process based on the Logistic equation, which is perceived as an excellent tool to depict how objects grow and develop [71]. This paper made the following three assumptions to facilitate the subsequent model establishment and model analysis.
Assumption 1.
Both the development of green product innovation and green process innovation is a function of time denoted as t. t is abstracted into the changes of all the factors affecting the development of green product innovation and green process innovation, respectively. Under all the influencing factors, the states of green product innovation and green process innovation continuously fluctuate, which together portrays the evolutionary process of green innovation.
Assumption 2.
If green product innovation develops independently, its development process obeys the growth law revealed by the Logistic equation. The same is true for green process innovation.
Assumption 3.
During the symbiotic development process of green product innovation and green process innovation, various interactions are possible to emerge between the two categories of green innovation. Such an interaction can restrain or promote the growth of green product innovation and green process innovation.
3.2. Model Establishment
Green innovation in SMMEs can be viewed as a complex system where green product innovation and green process innovation are two main components (i.e., subsystems). Green product innovation means an innovation that introduces new or improved products to reduce negative environmental externalities and create economic benefits [26,72]. Green process innovation refers to an innovation bringing enhanced or new processes, which facilitates the generation of green products [28,45]. In complex systems theory, the states of a system are represented by state variables, which can be the properties or features of the system. The state variables of green product innovation and green process innovation are defined as green product innovation level and green process innovation level, respectively.
When green product innovation and green process innovation all grow in isolation, we utilized the Logistic equation to denote the changes in green product innovation level and green process innovation level over time. Consequently, the evolution of green innovation is denoted as:
Let x1 and x2 represent the green product innovation level and green process innovation level, respectively. The parameter α1 indicates the growth rate of green product innovation level when green product innovation develops independently with constant inputs, and the same is true for the parameter α2. The greater the value of αi (i = 1, 2) is, the more the inputs are. The parameters β1 and β2 denote the self-inhibiting effects of green product innovation level and green process innovation level, respectively. Generally, βi > 0 (i = 1, 2). The reason behind this fact is that green product innovation and green process innovation can consume limited resources bit by bit, eventually leading to self-inhibiting effects if consumption reaches a certain threshold. Green product innovation and green process innovation are connected by nonlinear interactions which are not embodied in Equation (1). Thus, Equation (1) cannot stand for the actual development of green innovation, and the evolution model of green innovation was modified as follows:
where the product x1x2 represents the nonlinear interactions between green product innovation and green process innovation. The parameters γ1 and γ1 are the symbiotic coefficients which measure the influences that the nonlinear interactions exert on the growth of green product innovation level and green process innovation level, respectively. The values of γ1 and γ2 determine which categories the symbiotic interactions between green product innovation and green process innovation belong to. On the basis of community ecology theory [73], symbiotic interactions between green product innovation and green process innovation are divided into six categories, that is, neutralism, competition, amensalism, parasitism, commensalism, and mutualism, as shown in Table 1.
3.3. Model Analysis
3.3.1. Analysis of Evolutionary Stability
Green innovation in SMMEs is a dynamic process and finally evolves towards a steady state which can be one of the equilibrium points of our evolution model. For Equation (2), let and , then we obtained four equilibrium points, denoted as E1(0, 0), E2(), E3() and E4(). The equilibrium point E1 shows that the green product innovation level and green process innovation level become zero when green product innovation and green process innovation synergistically evolve for a period of time, indicating that green innovation disappears in SMMEs. E2 denotes that the green process innovation level turns zero when the two categories of green innovation interact for a period of time, implying that green innovation degrades into green product innovation. The same is true for E3. E4 represents that both green product innovation level and green process innovation level are non-zero when the two categories of green innovation together develop for some time, meaning that green innovation in both dimensions healthily grows.
Driven by different symbiotic interactions, green innovation is likely to stabilize at the above four equilibrium points. It is necessary to conduct a stability analysis on each equilibrium point to determine the stable points in the evolutionary process of green innovation and the corresponding stable conditions. The Jacobian matrix of Equation (2) is:
According to Lyapunov stability theory, when an equilibrium point of Equation (2) satisfies and tr J = α1 − 2β1x1 + γ1x2 + α2 − 2β2x2 + γ2x1 < 0, the equilibrium point is a stable point. The stability analyses of all the equilibrium points of Equation (2) are shown in Table 2.
As shown in Table 2, the stability of each equilibrium point was analyzed as follows. If α1 < 0 and α2 < 0, the growth rates of green product innovation level and green process innovation level are negative, and the green innovation could only stabilize at E1; under this condition, the green innovation is destined to vanish in SMMEs no matter what the internal symbiotic interactions between green product innovation and green process innovation are. If α1 > 0 and , the equilibrium point E2 is stable; the result represents the fact that the green product innovation level and green process innovation level severally stabilize at and 0, which is immune to the categories of the internal symbiotic interactions. If α2 > 0 and , the stable point is E3; under this condition, the green product innovation level and green process innovation level severally stabilize at 0 and , regardless of the internal interactions. Remarkably, when E2 and E3 are satisfied at the same time, the stable points can be E2 or E3, and which one is the final stable point depends on the initial states, such as the initial green innovation level. If γ1γ2 < β1β2, α1 > 0, α2 < 0, and , or if γ1γ2 < β1β2, α1 < 0, α2 > 0, , , E4 is the unique stable point; under these conditions, the green product innovation level and green process innovation level stabilize at and , respectively, and the symbiotic interactions between the green product innovation and green process innovation can only be mutualism, commensalism, and parasitism. If γ1γ2 < β1β2, α1 > 0, α2 > 0, and , E4 is also the only stable point, but the symbiotic interactions are unlimited. The above analysis proves that the growth rates of green product innovation level and green process innovation level and the categories of the internal interactions within green innovation can influence the evolutionary homeostasis of green innovation.
3.3.2. Analysis of Evolutionary Paths
Green innovation is a whole, and green product innovation and green process innovation are two major parts of the whole. In terms of complex systems theory, only when all parts of a system keep harmonious and balanced development can the system realize whole good emergence. The stable states represented by E1, E2, and E3 mean that at least one dimension of green innovation finally disappears in SMMEs, while the stable state represented by E4 denotes that both dimensions of green innovation develop to non-zero levels in the end. Therefore, the states represented by E1, E2, and E3 are non-ideal and not expected to occur during the evolutionary process of green innovation, and the state represented by E4 is the ideal stable state.
Green innovation is in the growing stage, and non-ideal stable states may appear. SMMEs can take relevant measures to create routes guiding them to better states or ideal stable states before encountering undesired states. This section analyzes the evolutionary paths and the corresponding measures from non-ideal stable states to the ideal stable state.
If green innovation stabilizes at E1, three paths evolving towards E4 are available: the direct path from E1 to E4 and the indirect paths from E1 to E4 over E2 or E3. SMMEs need to take relevant measures to follow each upgrading path, as shown in Figure 2. Specially, to follow the direct path from E1 to E4, SMMEs can take one of the three kinds of measures below: increase the inputs on green product innovation (i.e., increase α1) and keep the influences that the internal symbiotic interactions of green innovation exert on the growth of green product innovation level and green process innovation level below and above and , respectively (i.e., keep , ); increase the inputs on green process innovation (i.e., increase α2) and keep and ; increase α1 and α2 and keep and . To follow the indirect path from E1 to E4 over E2, SMMEs need to take measures to realize two transformations in turn: the transformation from E1 to E2 and the transformation from E2 to E4. For the first transformation, SMMEs can increase α1 and keep . For the second transformation, SMMEs can select one of the below measures: increase γ2, and keep α2 < 0 and ; decrease α1, and keep α2 > 0 and ; increase γ2, and keep α2 > 0 and . It is worth nothing that the measures under the second transformation are just what SMMEs should do when their green innovation stagnates at E2. Thus, this paper did not specify the path and the corresponding measures if green innovation in SMMEs stabilizes at E2. Similarly, to follow the indirect path from E1 to E4 over E3, SMMEs can take related measures, as shown in Figure 2. If green innovation in SMMEs is stuck at E3, there exists one evolutionary path to E4, as Figure 2 shows. To follow the path from E3 to E4, SMMEs can implement one of the below measures: decrease α2 and keep α1 > 0 and ; increase γ1 and keep α1 < 0 and ; increase γ1 and keep α1 > 0 and .
4. Simulations
In order to further support our theoretical results, this section conducted a series of numerical simulations to visually show the evolutionary features of green innovation represented by the proposed evolution model.
4.1. Evolutionary Stability of Green Innovation
Based on the proposed evolution model, this section used MATLAB (version 7.0; MathWorks: Nedick, MA, USA, 2004)to perform numerical simulations to analyze the evolutionary stability of green innovation. The iteration length t is set as 1000, and the simulation results are shown in the following figures.
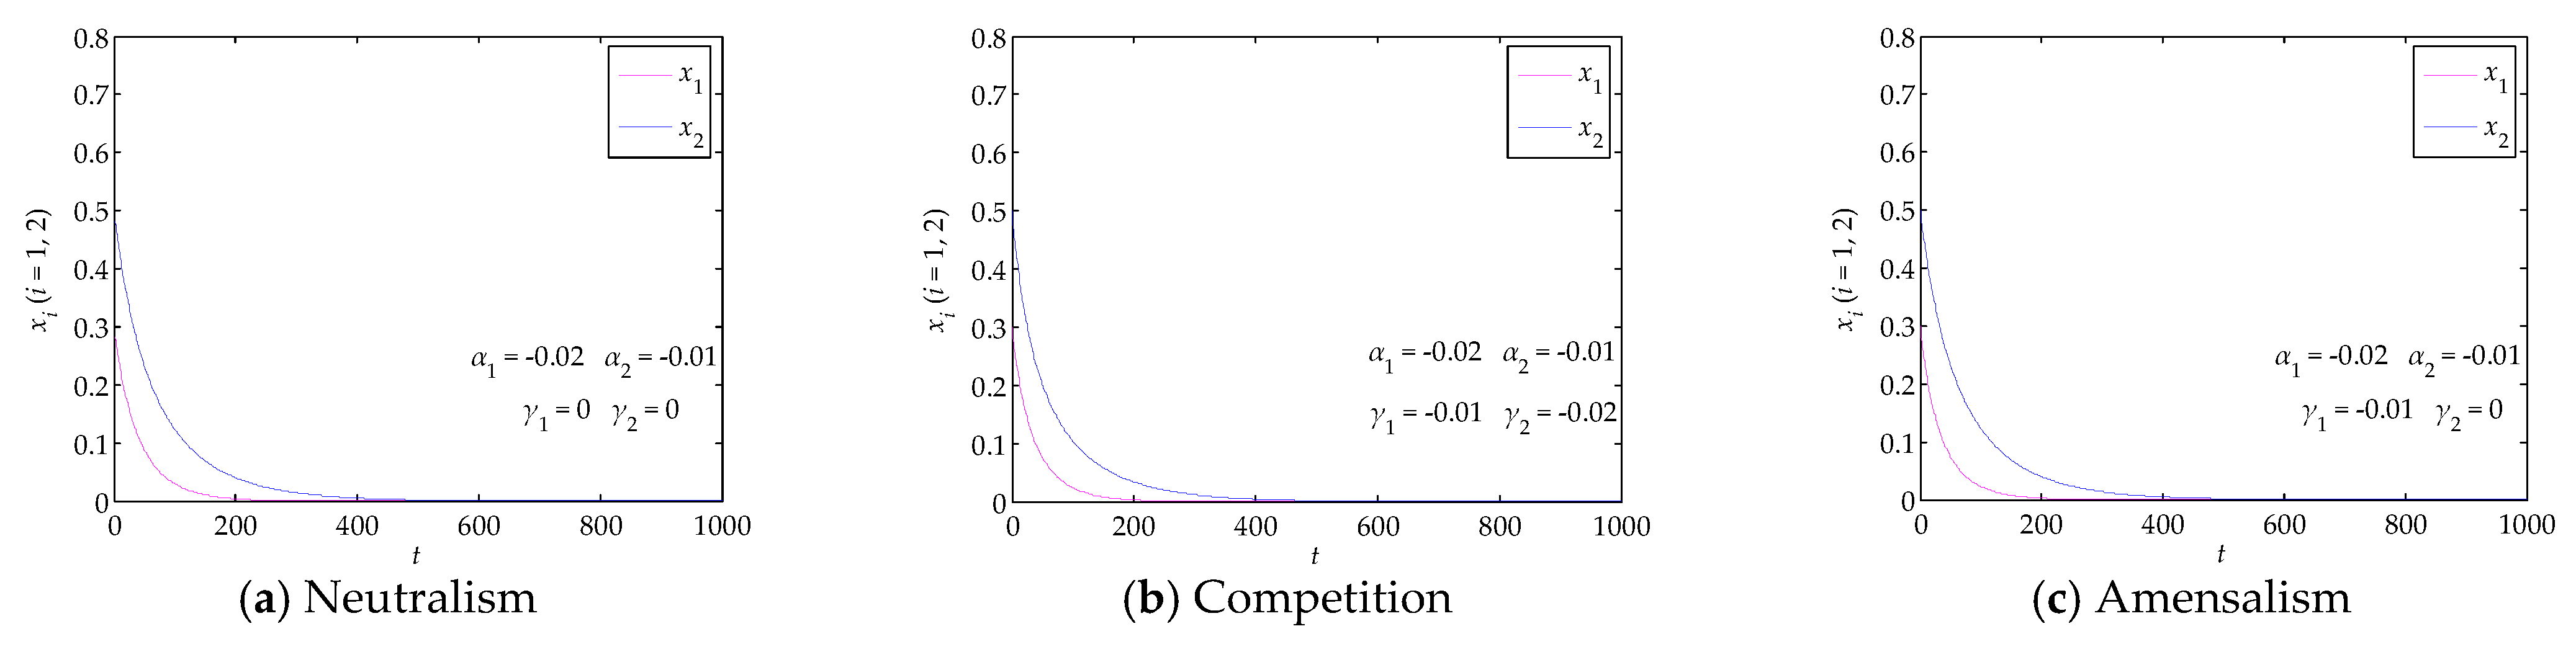
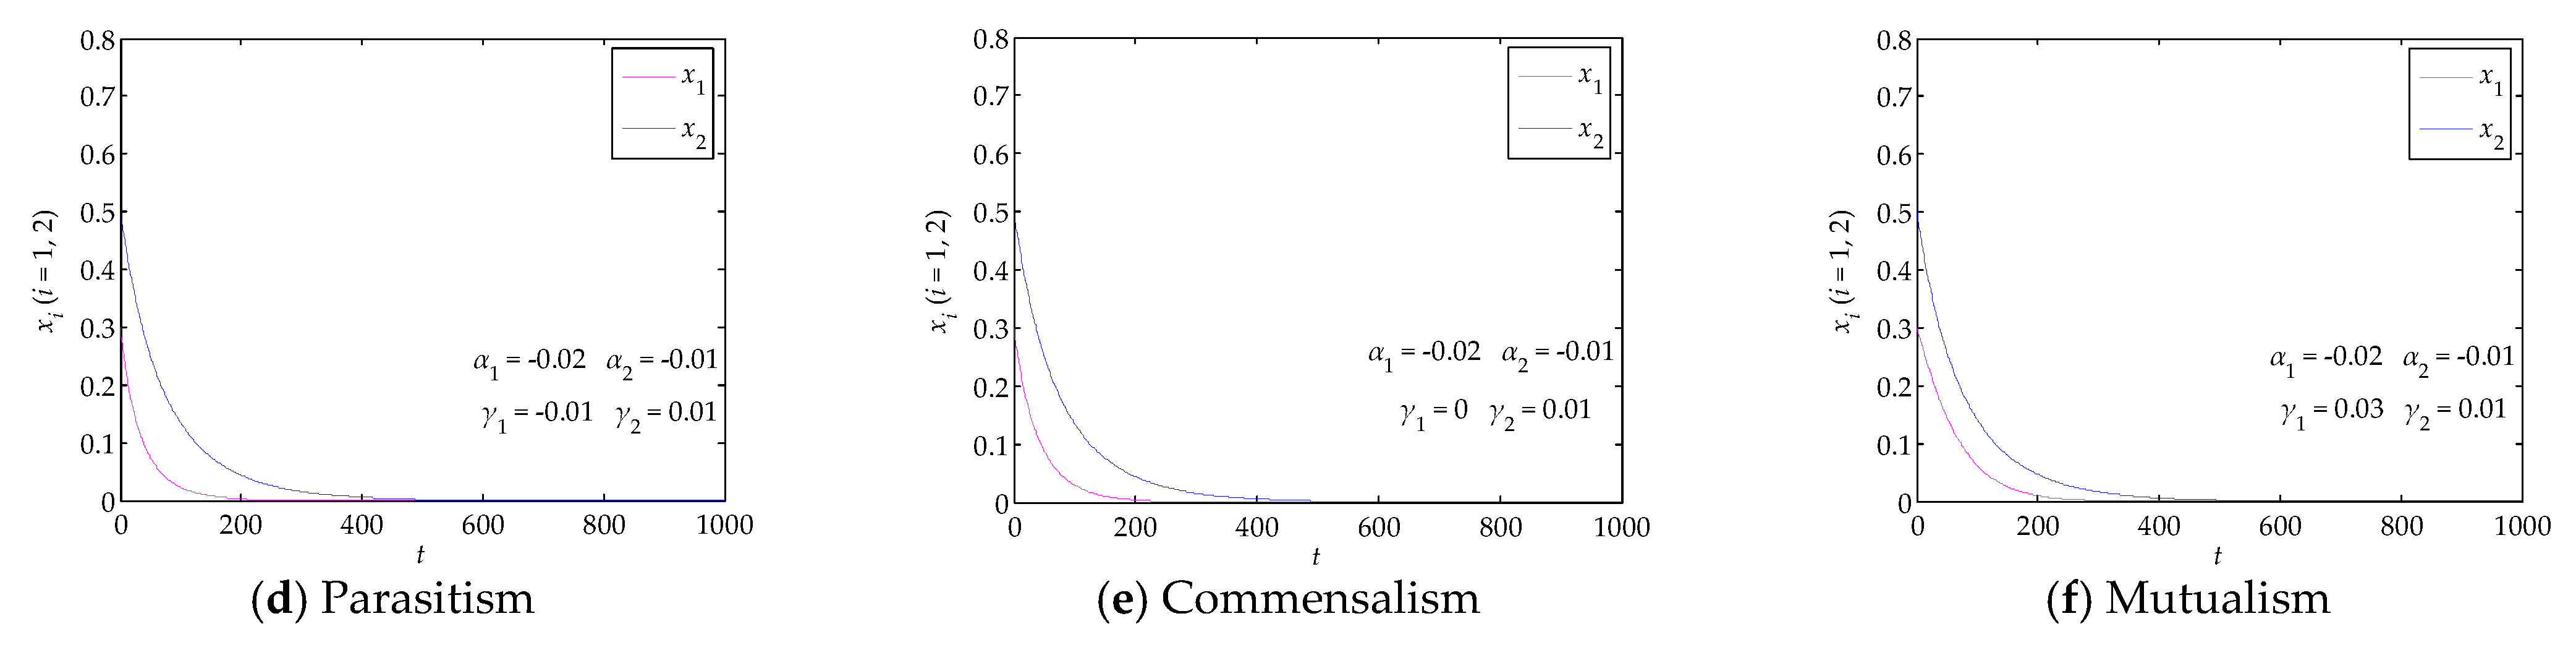
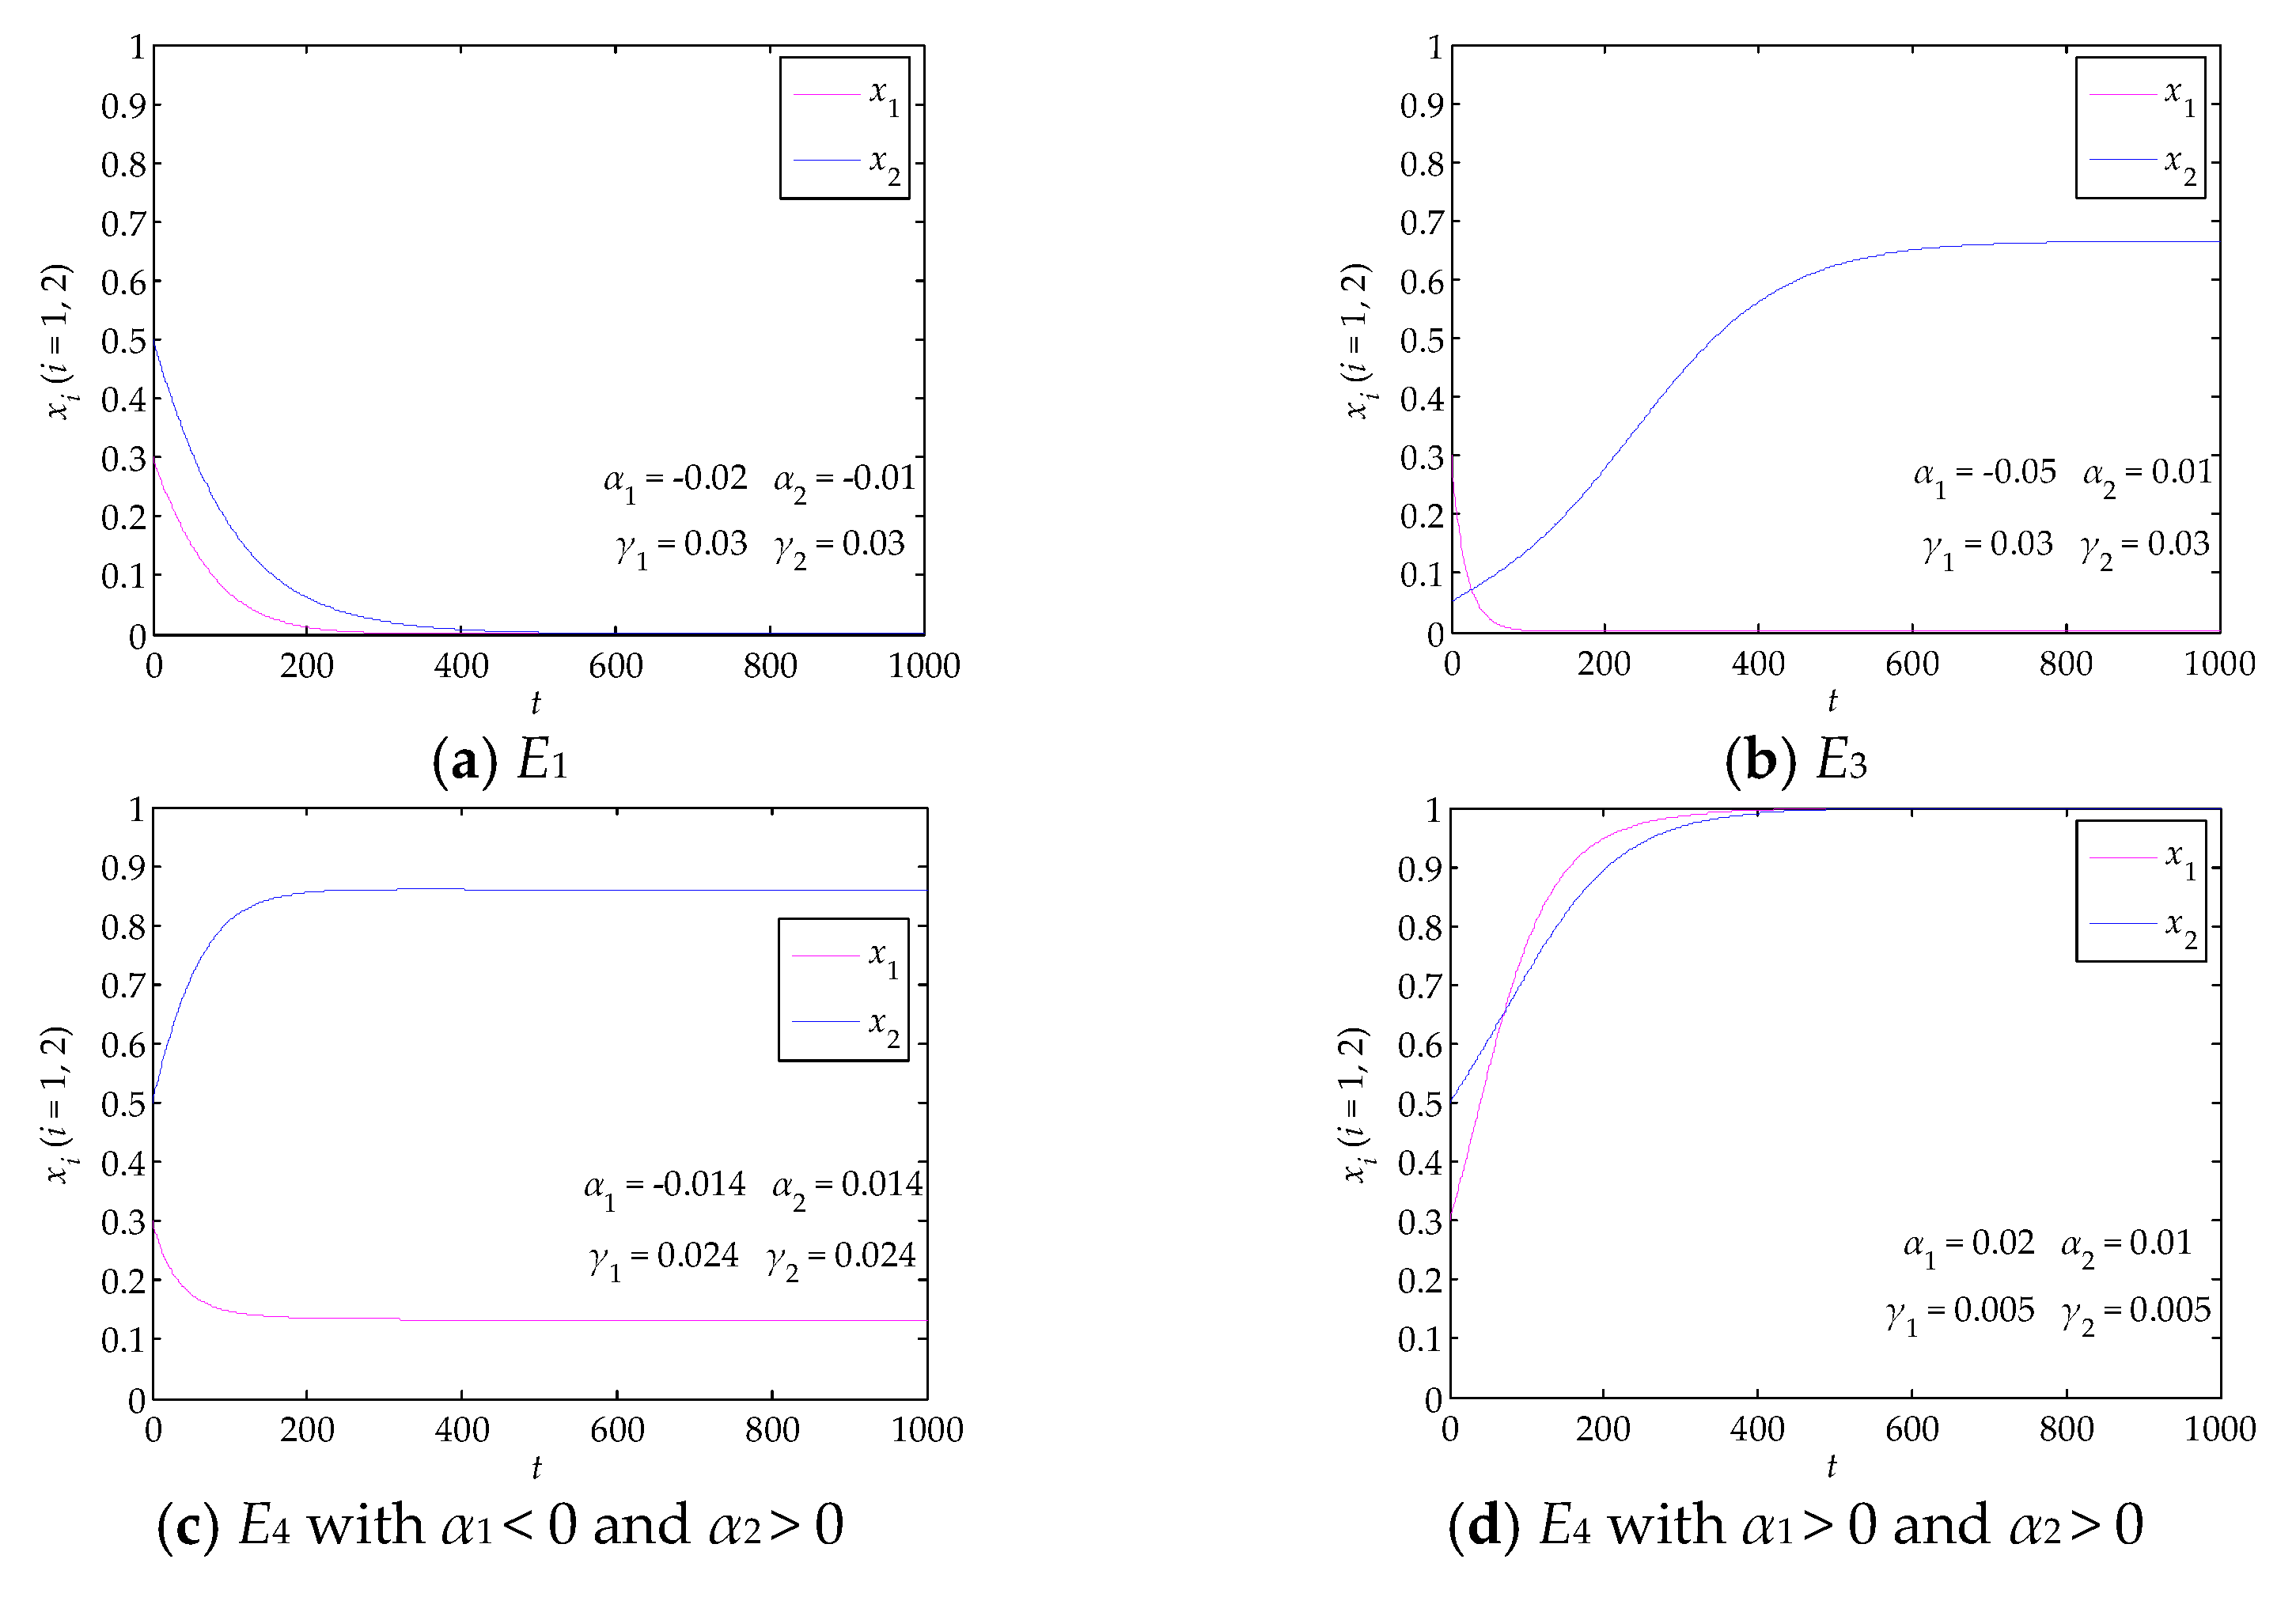
First, we analyzed the stability of green innovation represented by Equation (2) with α1 = −0.02 and α2 = −0.01. Under this condition, the unique evolutionary stable point of green innovation is E1 no matter what kind of symbiotic interactions exist between green product innovation and green process innovation, as shown in Figure 3. In other words, green innovation with α1 and α2 satisfying the given condition is hard to implement for a long time and eventually disappears in SMMEs.
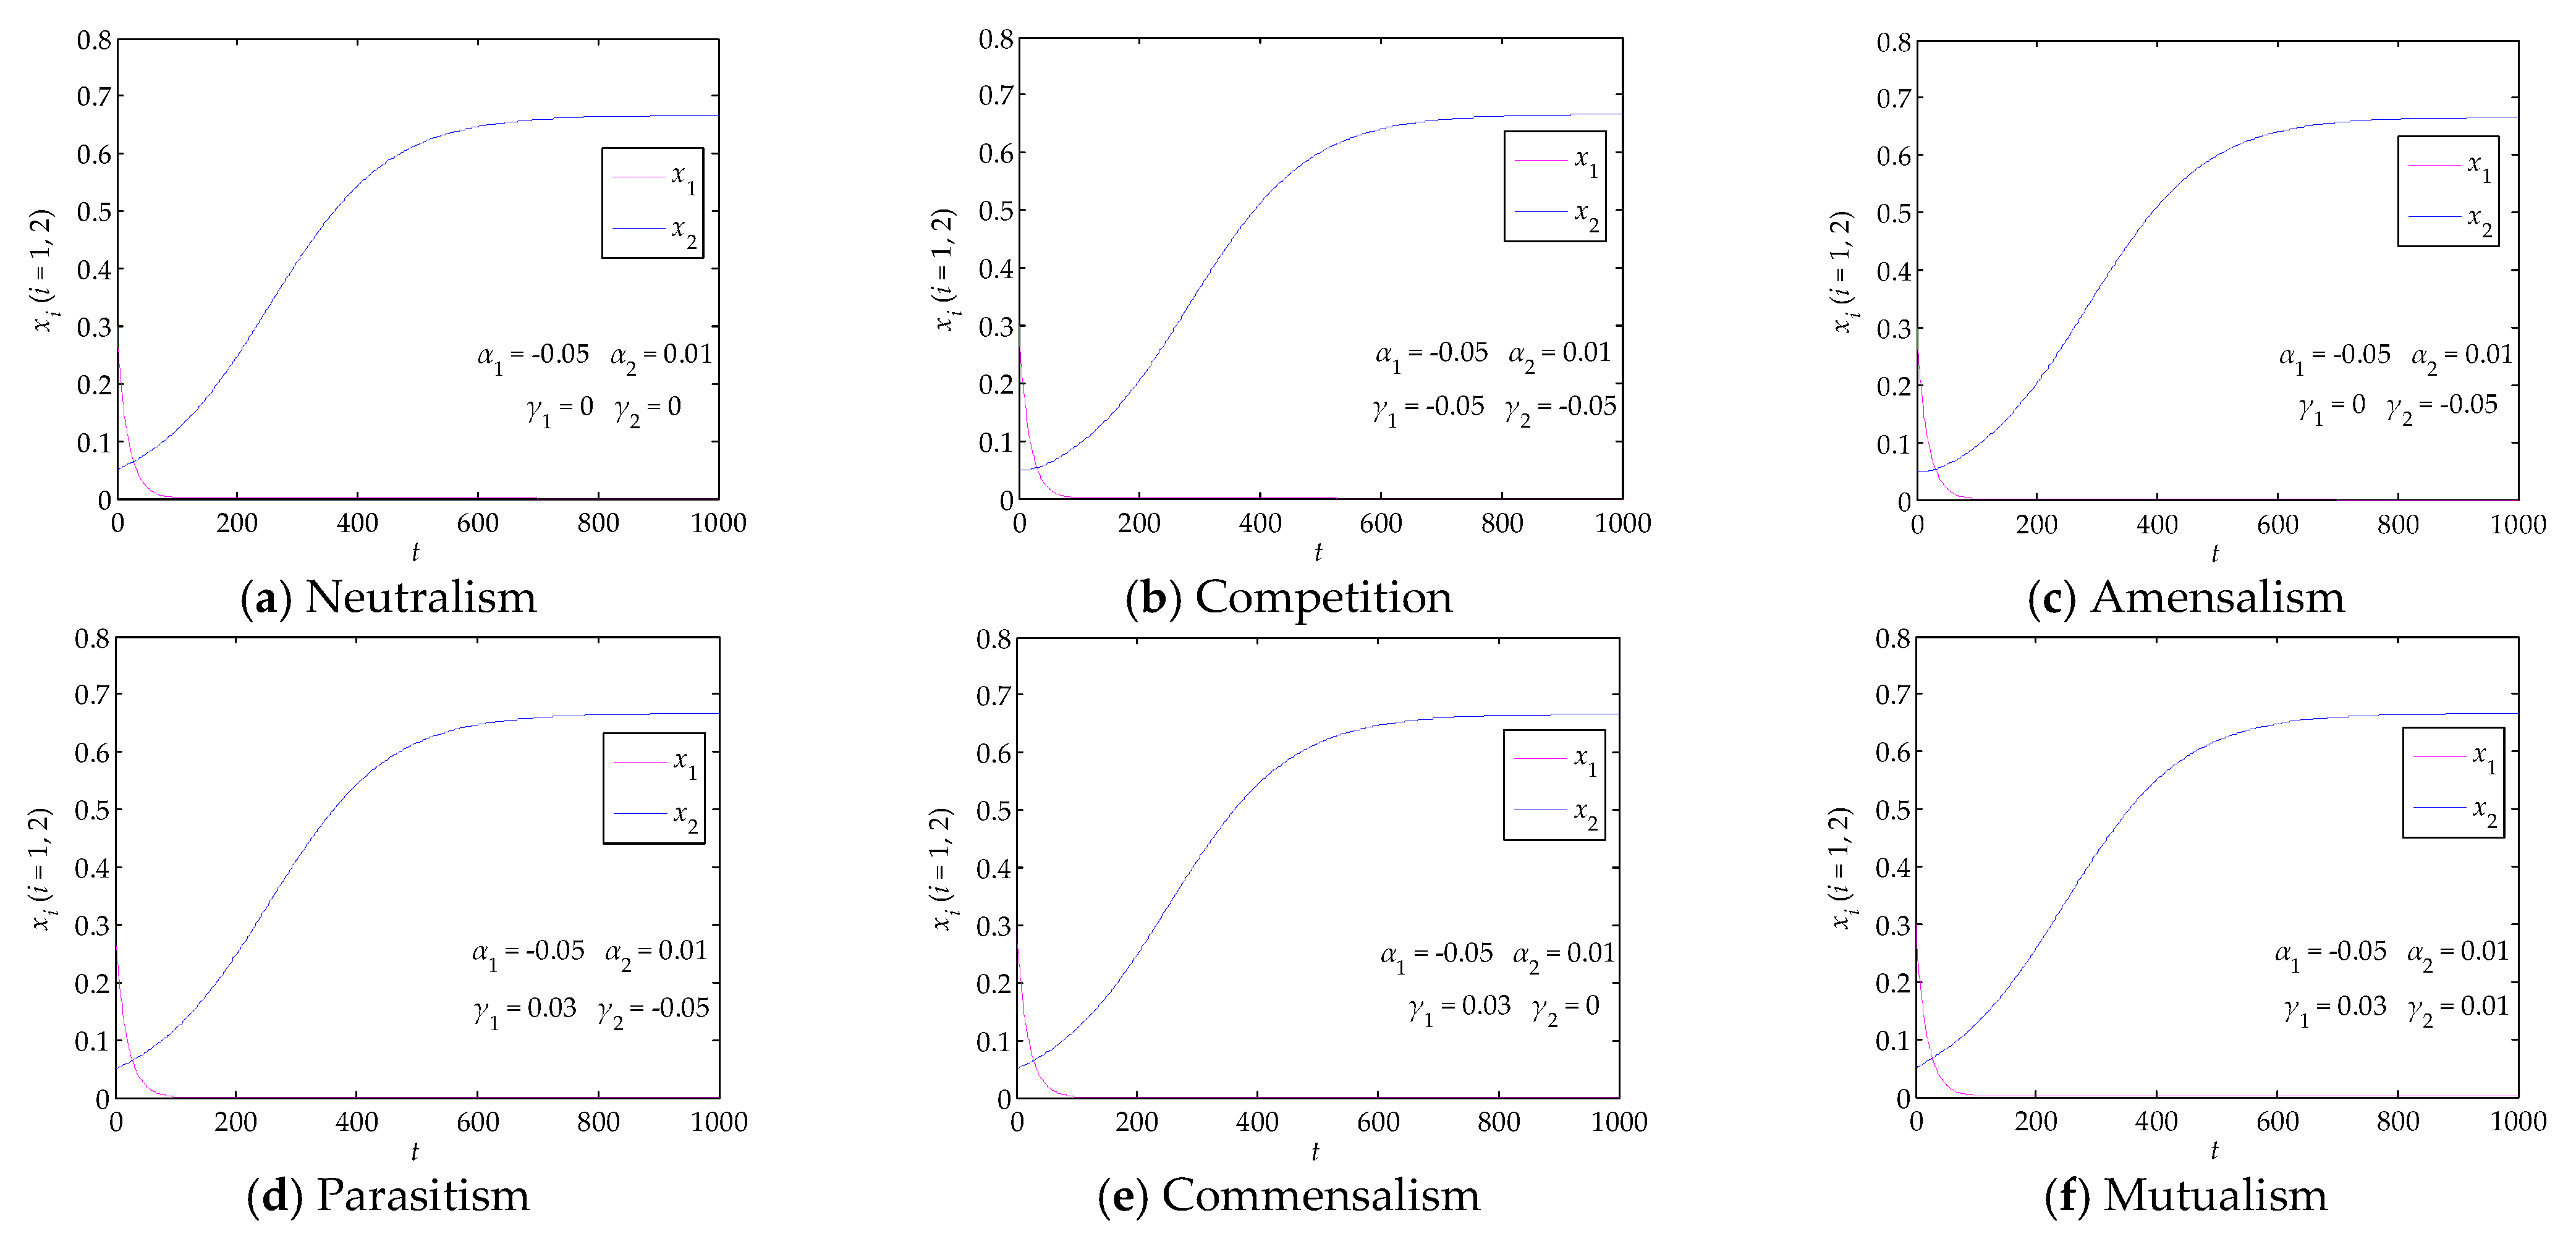
When Equation (2) is set with α1 = −0.05, α2 = 0.01, β2 = 0.015, and γ1 < 0.075, the condition that E3 is the unique stable point is satisfied, and green innovation finally stabilizes at E3 (0, 0.67) under arbitrary symbiotic interactions, as shown in Figure 4. Under this condition, the green product innovation level and green process innovation level eventually converge to 0 and 0.67, respectively, indicating that SMMEs do not conduct any green product innovation activities and only maintain green process innovation at a certain level. When the condition that E2 is stable holds, green innovation in SMMEs would exhibit similar evolutionary processes. Therefore, numerical simulations about green innovation evolving towards the equilibrium point E2 are omitted.
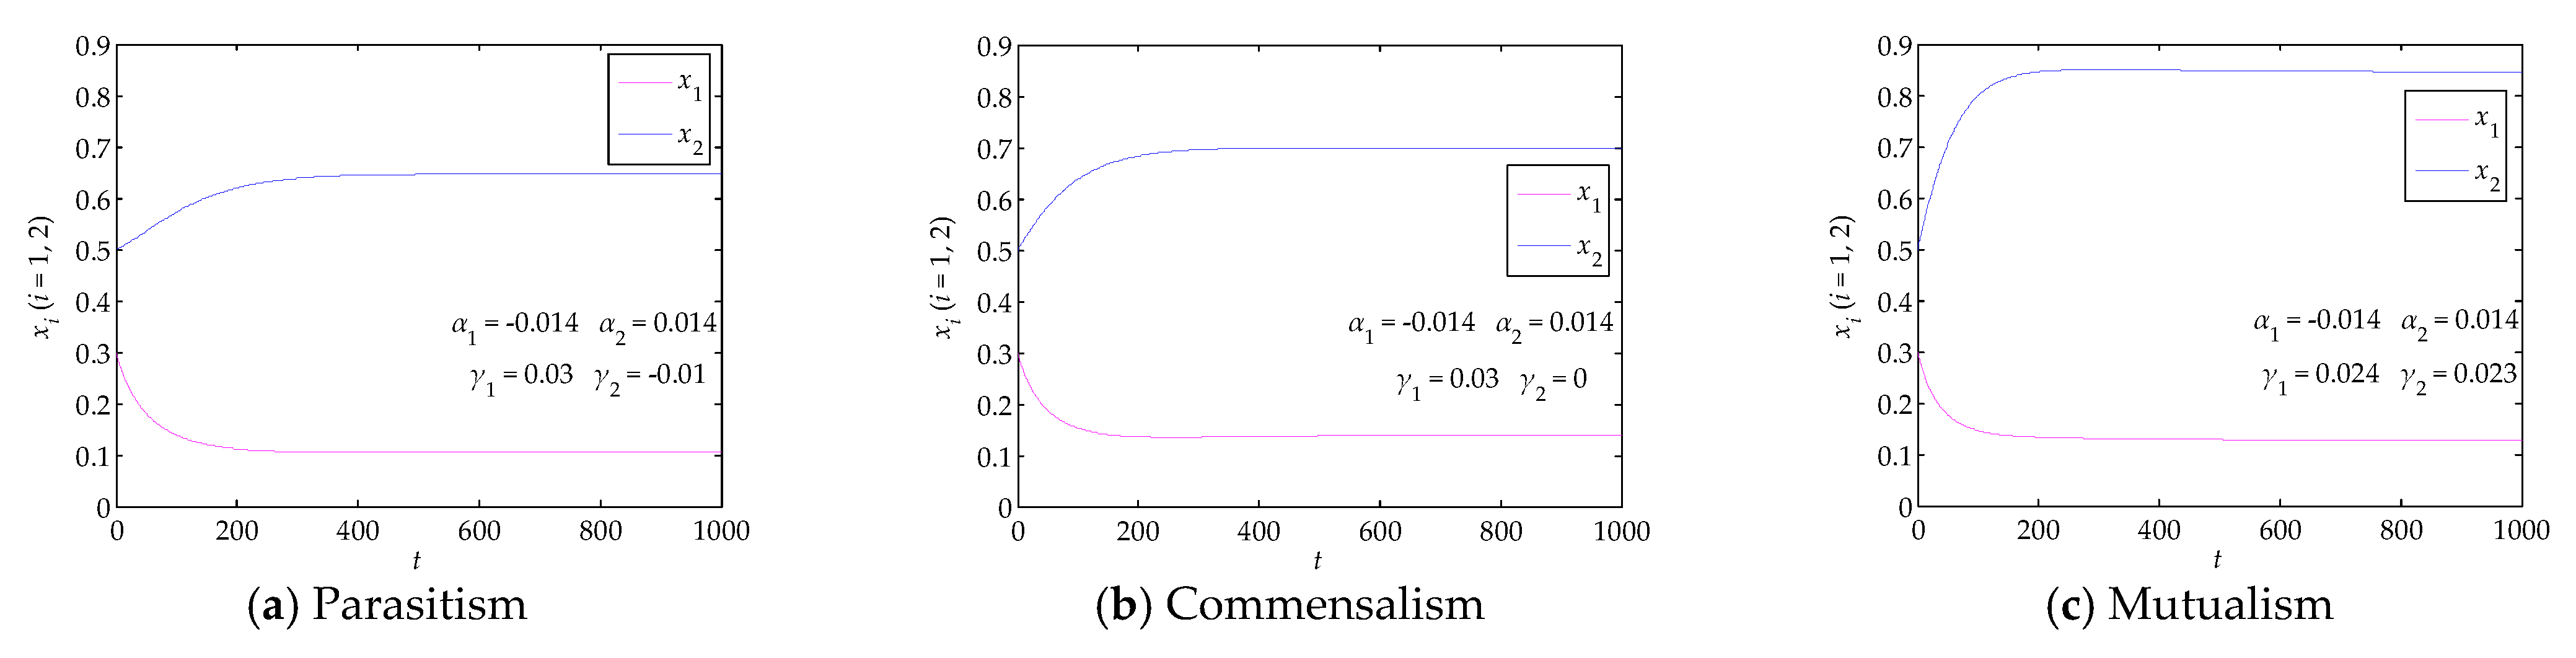
When Equation (2) satisfies α1 = −0.014, α2 = 0.014, β1 = 0.05, β2 = 0.02, γ1 > 0.02, γ2 < 0.05, and γ1γ2 < 0.001, the condition that E4 is the only stable point holds, and the green innovation stabilizes at under the symbiotic interactions of parasitism, commensalism, and mutualism, as shown in Figure 5. Under such conditions, the two dimensions of green innovation grow reversely and always hold a certain level, implying that SMMEs carry out green product innovation and green process innovation simultaneously with obvious differences. When the green innovation stabilizes at E4 with α1 > 0 and α2 < 0, similar evolutions are presented under the three kinds of symbiotic interactions. As a result, this paper did not present the corresponding numerical simulations. In terms of integrality and comprehensiveness, green innovation stabilizing at E4 is superior to green innovation stabilizing at other equilibrium points (i.e., E1, E2, and E3).
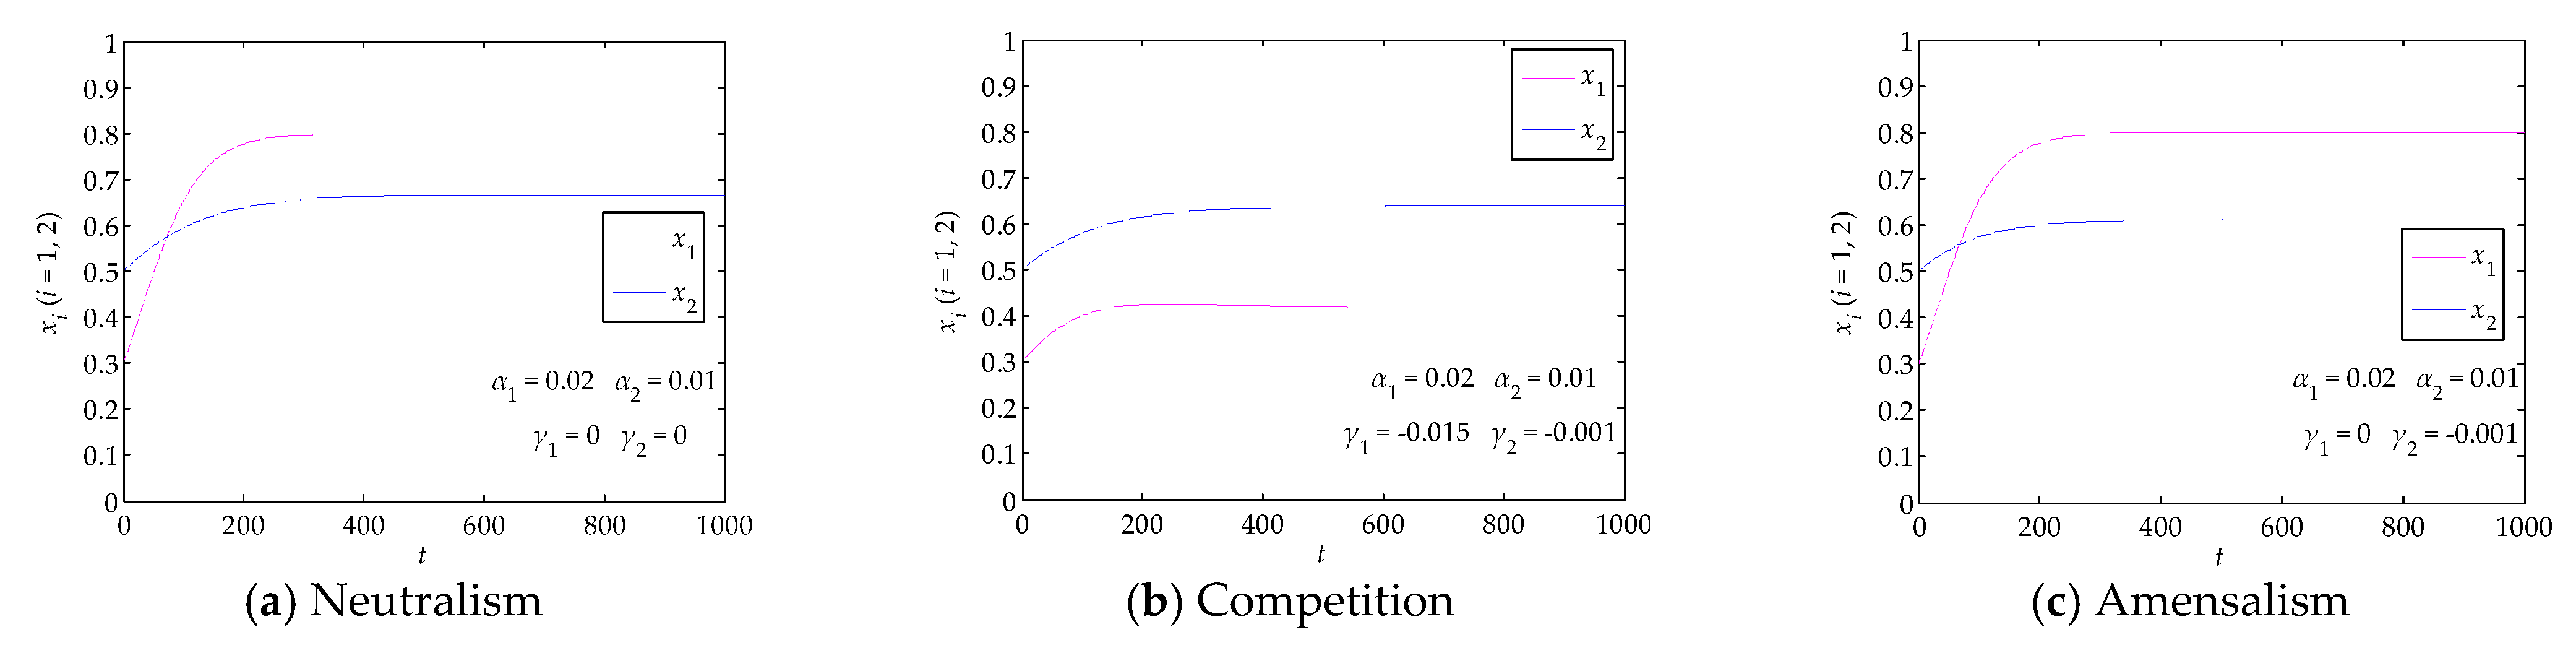
When Equation (2) is set with α1 = 0.02, α2 = 0.01, β1 = 0.025, β2 = 0.015, γ1 > −0.03, γ2 > −0.0125, and γ1γ2 < 0.000375, the condition that E4 is the only stable point satisfies, and the green innovation would converge to under all symbiotic interactions. Under such a condition, SMMEs conduct green innovation practices in both dimensions, and the green product innovation level and green process innovation level continually rise until their upper limits are reached. Compared with the case that green innovation stabilizes at E4 with α1α2 <0, green innovation stabilizing at E4 with α1 > 0 and α2 > 0 enables healthier and superior innovation levels and thus gains more popularity and expectation.
When green innovation stabilizes at E4, six symbiotic interactions play different roles, and mutualism is the optimal symbiotic interaction. Specifically, compared to other symbiotic interactions, mutualism enables SMMEs to realize stable green innovation at higher levels when inputs in green innovation are fixed, as shown in Figure 5 and Figure 6. It should be pointed out that symmetric mutualism (i.e., γ1 = γ2 > 0) outperforms asymmetric mutualism (i.e., γ1 ≠ γ2, γ1 > 0 and γ2 > 0) in green innovation. As shown in Figure 7c,d, green innovation in both dimensions under symmetric mutualism stabilizes at (0.132, 0.858) and (1, 1), respectively; however, as shown in Figure 5f and Figure 6f, green innovation in both dimensions under asymmetric mutualism can only stabilize at (0.125, 0.844) and (0.946, 0.730), respectively; obviously, the former green innovation levels are higher than the latter green innovation levels, for example, (0.132, 0.858) exceeds (0.125, 0.844). We observed similar phenomena and drew consistent conclusions when green innovation stabilizes at other equilibrium points, as shown in Figure 3, Figure 4 and Figure 7a,b.
4.2. Evolutionary Paths of Green Innovation
This section also used MATLAB to conduct numerical simulations to anatomize how green innovation evolves from a non-ideal stable point to the ideal point E4. The iteration length t is set as 1500, and the parameter values under different transitions are shown in Table 3. Then, we obtained the evolutionary paths from E1, E2, and E3 to E4.
Based on the parameter values in Table 3, we observed how green innovation evolves towards E4 without transitional stable points before it stabilizes at E1. Specifically, to make green innovation convert from E1 to E4 with α1 > 0 and α2 < 0, SMMEs can keep and , and increase α1 from −0.02 to 0.01, and these measures can be taken at the right time; as shown in Figure 8a, green innovation evolves towards E1 before taking these measures at t = 200, but it gradually deviates from the path to E1 (i.e., the path denoted by the dotted lines in Figure 8a) and follows the path to E4 (i.e., the path denoted by the solid lines in Figure 8a) instead of taking these measures at t = 200. To make green innovation convert from E1 to E4 with α1 < 0 and α2 > 0, SMMEs can increase α2 from −0.014 to 0.014 and keep and ; these measures can be taken at t = 100, as shown in Figure 8b. To make green innovation convert from E1 to E4 with α1 > 0 and α2 > 0, SMMEs can maintain and and raise α1 and α2 from −0.02 and −0.01 to 0.02 and 0.01, respectively; these measures can be taken at t = 150, as shown in Figure 8c. The dotted lines in Figure 8 represent the virtual evolutionary paths of green innovation after taking measures, and the solid lines stand for the actual evolutionary paths of green innovation. Such expressions of evolutionary paths also exist in the following figures. The results presented in Figure 8 verify the theoretical analysis of the direct evolutionary paths from E1 to E4.
Similarly, using the parameter values in Table 3, we obtained the evolutionary paths of green innovation from E1 to E4 via E2, as shown in Figure 9. To be specific, to drive green innovation from E1 to E2 and E2 to E4 with α1 > 0 and α2 < 0, SMMEs can first increase α1 from −0.01 to 0.01 and make γ2 < 0.01 by decreasing γ2 from 0.04 to −0.05 at t = 200, which can enable green innovation to switch from E1 to E2; then, SMMEs can raise γ2 from −0.05 to 0.04, and keep α2 < 0 and γ1 < 0.03 at t = 300, and these measures are able to drive green innovation from E2 to E4, as shown in Figure 9a. To drive green innovation from E1 to E2 and E2 to E4 with α1 < 0 and α2 > 0, increasing α1 from −0.014 to 0.014 and maintaining γ2 < 0.05 at t = 100 are the primary measures that SMMEs can select to realize the transformation from E1 to E2; based on existing actions, decreasing α1 from 0.014 to −0.014, and making α2 > 0 and γ1 > 0.02 at t = 200 are the following actions that SMMEs can take to realize the transition from E2 to E4, as shown in Figure 9b. To drive green innovation from E1 to E2 and E2 to E4 with α1 > 0 and α2 > 0, SMMEs should first make green innovation convert from E1 to E2 and raise α1 from −0.02 to 0.02 and keep γ2 < 0.0125 at t = 100 are feasible measures; then, SMMEs can take actions to realize the evolution from E2 to E4, and increasing γ2 from −0.01 to 0, making α2 > 0 by increasing it from −0.01 to 0.01 and keeping γ1 > −0.03 at t = 200 are doable, as shown in Figure 9c. The corresponding evolutionary paths under the three cases in that green innovation evolves from E1 to E4 via E2 are depicted in the three subfigures of Figure 9, respectively. When green innovation converges towards E2, SMMEs can refer to what they do in the second phase of the evolution from E1 to E4 via E2 and make relevant parameters satisfy specified conditions, and then green innovation could present desired evolutionary paths to E4. Similarly, by taking the right measures (i.e., making related parameters meet stated conditions) at the right time, we observed the evolutionary paths that green innovation follows to evolve from E1 to E4 over E3. Thus, this section omits the numerical simulations about green innovation evolving from E1 to E4 over E3 and evolving from E2 to E4.
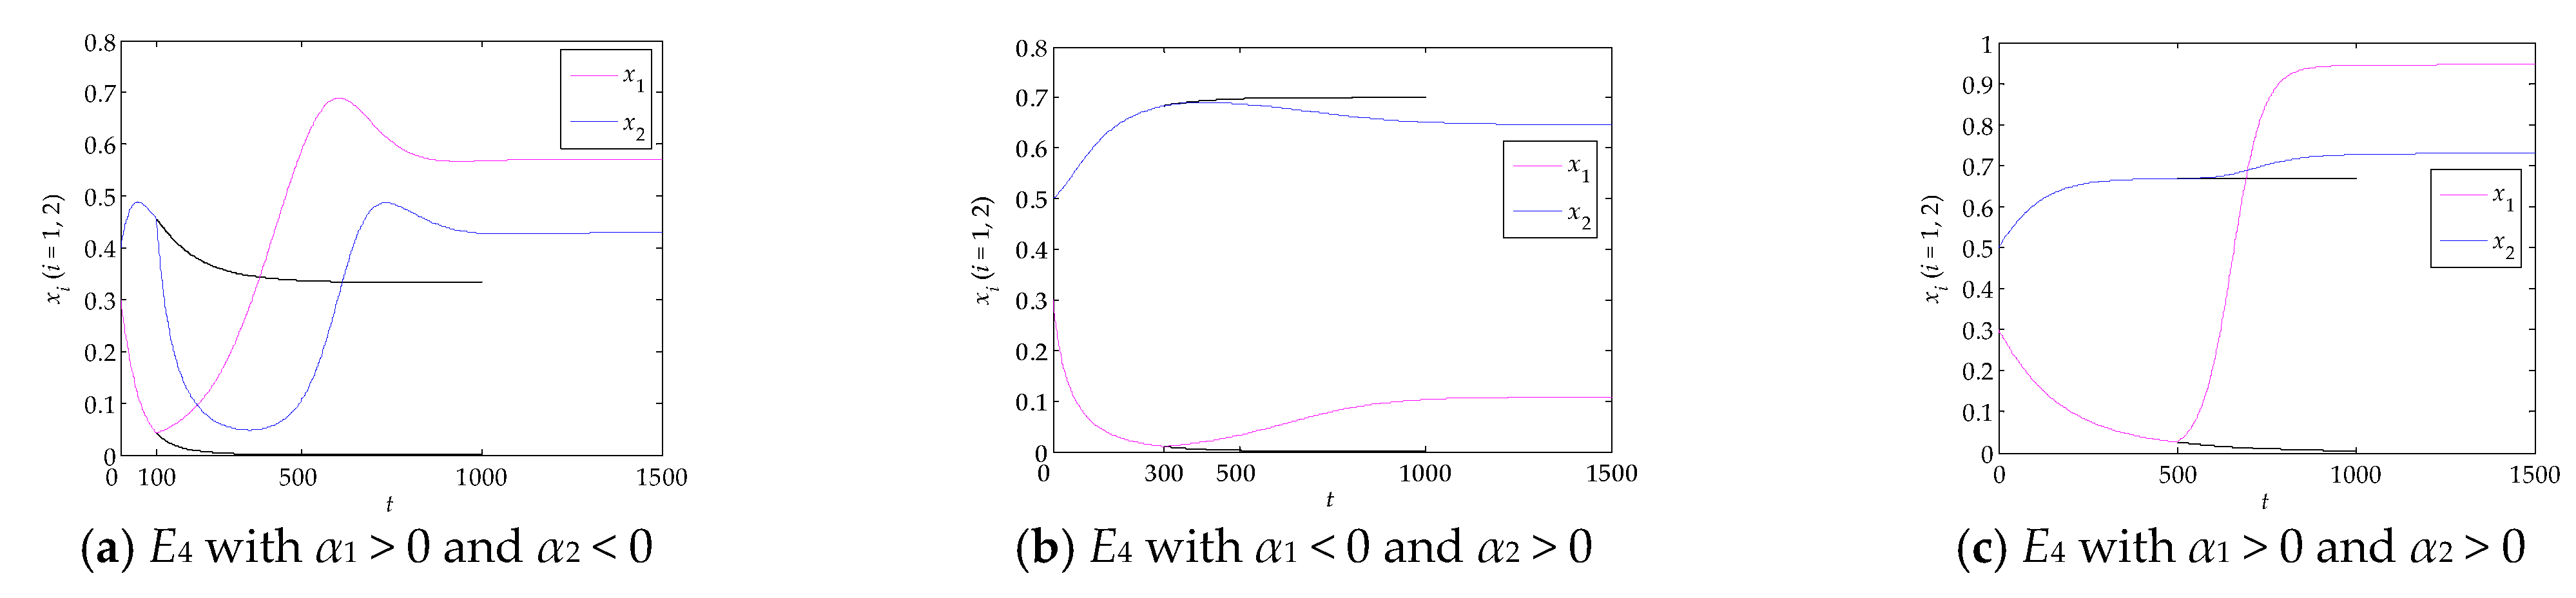
Finally, based on the parameter values in Table 3, we surveyed how green innovation converges to E4 without stable middle points before it is caught in the state represented by E3. Concretely, to enable green innovation to switch from E3 to E4 with α1 > 0 and α2 < 0, SMMEs can decrease α2 from 0.01 to −0.01, and keep α1 > 0 and γ2 > 0.01 at t = 100, then the desired transition is possible, at shown in Figure 10a. To enable green innovation to switch from E3 to E4 with α1 < 0 and α2 > 0, SMMEs can increase γ1 from 0.01 to 0.03 and maintain α1 < 0 and γ2 < 0.05 at t = 300; by doing so, green innovation following a satisfactory evolutionary path is available, as shown in Figure 10b. To enable green innovation to switch from E3 to E4 with α1 > 0 and α2 > 0, increasing γ1 from −0.035 to 0.005 and keeping α1 > 0 and γ2 > −0.0125 at t = 500 are viable measures for SMMEs to create a path that guides their green innovation to E4, as shown in Figure 10c.
5. Findings and Discussion
5.1. Findings
The research objective is to explore how green innovation evolves in SMMEs. Theoretical analysis and numerical simulations revealed evolutionary stability and paths, and the following findings are extracted. First, green innovation in SMMEs has four end-states represented by Ei (i = 1, 2, 3, 4) during its evolutionary processes; E1, E2, and E3 are unexpected end-states for SMMEs, and E4 is the unique end state that SMMEs expect. Second, when green innovation in SMMEs stabilizes at E1, there exists one direct evolutionary path and two indirect paths leading to E4; when green innovation in SMMEs stabilizes at E2 or E3, one upgrading path evolving towards E4 is available. Third, the inputs on green product innovation and green process innovation (i.e., α1 or α2) and the types or strength of the symbiotic interactions between green product innovation and green process innovation (i.e., γ1 and γ2) are key factors that determine the end states and the evolutionary paths of green innovation. Besides, symmetric mutualism is the optimum for symbiotic interactions. The above findings can yield beneficial management implications for SMMEs and regulatory subjects to drive green innovation.
5.2. Discussion
Green innovation becomes increasingly important for enterprises to relieve environmental pressures and enhance competitiveness. Currently, more and more SMMEs carry out green innovation in their products and production processes. However, SMMEs often get discouraged and want to give up when they develop green innovation practices. The issue behind this phenomenon is that how green innovation evolves in SMMEs remains unclear. Identifying all the end states of green innovation and determining the trajectories evolving towards the desired end states and the corresponding conditions will facilitate SMMEs to conduct green innovation.
In this study, we explored the evolution of green innovation in SMMEs based on complex systems theory and the Logistic equation. Differing from earlier studies that highlighted one dimension of green innovation [25,52,58], this study found that green innovation with non-zero levels in each dimension was expected. In terms of complex systems thinking, an explanation for this difference might be that green innovation missing any one dimension is crippled and cannot reach whole good emergence due to lacking nonlinear interactions between green product innovation and green process innovation. In addition, many previous studies demonstrated that exogenous measures (e.g., environmental policies and gross domestic product) [29,74,75] and improving external interactions [29,58] could promote green innovation. The results are different from our finding that changing internal interactions of green innovation was quantitatively proved to be an effective endogenous measure for SMMEs to steer green innovation towards expected states. It is surprising that mutualism could lead green innovation in arbitrary states to a stable state. The account for result assumes that mutualism benefits green innovation in all dimensions. Besides, symmetric mutualism is the most conducive to green innovation, for symmetric mutualism is a kind of equilibrium relationship formed by the game between green product innovation and green process innovation. Previous studies usually qualitatively showed that increasing inputs could benefit green innovation [44,49], while this study quantitatively revealed that both increasing inputs and decreasing inputs could play a positive role in green innovation. It is intuitive that increasing inputs can improve green innovation if inputs in green innovation are indeed deficient. However, if inputs in green innovation reach or exceed the upper limit, adding inputs unceasingly might bring diminishing marginal returns or even huge losses [39]; under this condition, decreasing inputs is helpful. The reason for this phenomenon is that excessive inputs can induce chaotic green innovation by unbearable complexity, and decreasing inputs at this time can pull green innovation from chaos to healthy evolutionary paths by reducing complexity. Several previous studies provided guidance to advance green innovation beyond the micro level [1,17,18,19,61], while our findings could guide regulatory subjects and SMMEs to take measures to drive green innovation during its evolutionary process at the micro level. This research enriches the evolutionary theories related to green innovation and expands the application fields of complex systems theory.
This research mainly has two limitations. First, green innovation is a complex system with many components, and the proposed model cannot be directly applied if the division of green innovation changes. Second, the nonlinear interactions between green product innovation and green process innovation are quantized as x1x2 in this paper, but there remain other quantified expressions such as x12x2. Hence, the quantification of the nonlinear interactions within green innovation in this study is not all-sided.
6. Contributions and Managerial Implications
This research mainly has two contributions. First, unlike previous literature that concentrated on the macro and meso evolution of green innovation, this paper explored the evolutionary stability and paths of green innovation from a micro angle because enterprises are the real subjects that implement green innovation. The research results not only facilitate SMMEs to judge whether their green innovation could be stable but also provides the evolutionary paths and as well as supporting measures for SMMEs to convert green innovation into desired stable states if their green innovation cannot reach targeted states within a period of time. Besides, our research results are instructive to large manufacturing enterprises to manage and control their green innovation and also help regulatory organizations enact relevant policies. Second, given the complexity and dynamics of green innovation in SMMEs, this paper utilized complex systems theory to construct nonlinear dynamic models to essentially depict the evolution of green innovation in a quantitative manner, which avoids the defects originating from the mechanism and reductionism of existing methods. The proposed modeling approach provides a brand-new idea for us to discuss other complex issues fundamentally.
To make green innovation in SMMEs turn to or stay at desired states, this paper puts forward some managerial implications. On the one hand, regulatory subjects should establish regulatory mechanisms and introduce relevant policies and measures for SMMEs with green innovation in different evolutionary stages. In the infancy stage of green innovation, regulatory subjects could inject initial impetus to promote green innovation from top to bottom by giving administrative orders, directly inputting resources, issuing subsidy coupons, etc., for the inputs on green innovation in the infancy stage are deficient and adding the inputs on green innovation facilitates green innovation in SMMEs when the inputs on green innovation are insufficient. In the growing stage of green innovation, regulatory subjects could set up leading groups and expert groups to normalize the orders for SMMEs to conduct green innovation and to guide SMMEs to optimize resource allocation in green innovation, for only reasonable inputs allocated on green innovation can yield healthy green innovation in SMMEs. In the maturation stage of green innovation, regulatory subjects could establish evaluation systems and governance systems to assess and monitor the real states of green innovation in SMMEs, respectively, in order to help SMMEs correct deviations in time when they are short of relevant technology systems and human resources. On the other hand, SMMEs should get rid of old ideas and actively enhance their own innovation levels to form the endogenous power of green innovation. Besides, SMMEs need to follow the evolutionary rules of green innovation and encourage internal components related to green innovation to collaborate zealously in order to yield healthy symbiotic interactions. Once SMMEs begin green innovation practices, they need to pay dynamic attention to the inputs of green product innovation and green process innovation as well as the symbiotic interactions between them, for our research results reveal that the inputs on green innovation and the symbiotic interactions within green innovation are key factors affecting the end states and the evolutionary paths of green innovation; by recording the changes of relevant parameters, SMMEs can evaluate the current states of their own green innovation and forecast future movements of green innovation; if current states or future movements of green innovation are not satisfactory, SMMEs can take the right measures at the right time to create desired evolutionary paths that green innovation can follow to reach ideal states. When SMMEs and regulatory subjects adopt the above actions, both enterprise competitiveness and environmental sustainability have the potential to improve.
7. Conclusions and Future Research
This research developed a nonlinear dynamic model to study the evolution of green innovation in SMMEs. Viewing green innovation as a complex system and defining its components and state variables enable the quantitative formulation of the model by providing the necessary elements. Based on the proposed model, we obtained the evolutionary stability, evolutionary paths, and corresponding conditions of green innovation in SMMEs. This research discovered a non-zero stable state of green innovation which is an ideal evolutionary end that SMMEs should take measures to reach. Among the internal measures available, controlling inputs on green innovation and the interactions between green product innovation and green process innovation are encouraged to be effective measures in this paper. By taking the proposed measures at the right time in SMMEs, green innovation is able to stabilize at the ideal state or turn to the ideal state by following the designed, evolutionary paths that avoid unexpected stable states. This paper demonstrated the validity of the proposed model and the theoretical results through a series of numerical simulations. Simulation results also show that symmetric mutualism is the optimal symbiotic interaction for SMMEs to advance green innovation because keeping the symbiotic interactions within green innovation as symmetric mutualism could enable green innovation to realize the greatest growth in each dimension without influencing the realization of the ideal stable state. This research can enrich the evolutionary theories of green innovation and provide practical guidance for SMMEs and regulatory subjects to judge current healthy states of green innovation, forecast the future trends of green innovation, and formulate controlling measures.
Future work mainly involves two aspects. On the one hand, green innovation has other categories in theory and in practice, and thus discussing the evolution of green innovation under new divisions is a research direction for the future. On the other hand, nonlinear interactions within green innovation can manifest in other forms. Therefore, future work can study the evolution of green innovation with different quantified interactions.
Author Contributions
Conceptualization, Z.S., J.Z. and J.S.; methodology, Z.S. and J.Z.; formal analysis, J.Z. and J.S.; writing—original draft preparation, Z.S. and J.Z.; writing—review and editing, Z.S., J.Z. and J.S. All authors have read and agreed to the published version of the manuscript.
Funding
This research was funded by the PhD Initiation Fund Project of School of Economics and Management in Jiangxi University of Science and Technology (Grant No. JGBS202102), the PhD Initiation Fund Project of Jiangxi University of Science and Technology, and the Scientific Planning Project of Culture and Art in Jiangxi Province (Grant No. YG2021170).
Data Availability Statement
Data sharing not applicable—no new data generated data sharing does not apply to this article as no new data were created or analyzed in this study.
Conflicts of Interest
The authors declare no conflict of interest.
References
- Melander, L.; Arvidsson, A. Green innovation networks: A research agenda. J. Clean. Prod. 2022, 357, 131926. [Google Scholar] [CrossRef]
- Li, S.; Lin, Z.; Liang, D. Threshold effect of two-way FDI synergy on regional green technology innovation under heterogeneous environmental regulation: Evidence from China’s provincial panel data. Systems 2022, 10, 230. [Google Scholar] [CrossRef]
- He, F.; Miao, X.; Wong, C.W.Y.; Lee, S. Contemporary corporate eco-innovation research: A systematic review. J. Clean. Prod. 2018, 174, 502–526. [Google Scholar] [CrossRef]
- Yuan, B.; Cao, X. Do corporate social responsibility practices contribute to green innovation? The mediating role of green dynamic capability. Technol. Soc. 2022, 68, 101868. [Google Scholar] [CrossRef]
- Gupta, H.; Barua, M.K. A grey DEMATEL-based approach for modeling enablers of green innovation in manufacturing organizations. Environ. Sci. Pollut. Res. 2018, 25, 9556–9578. [Google Scholar] [CrossRef]
- Cuc, S.; Gîrneață, A.; Iordănescu, M.; Irinel, M. Environmental and socioeconomic sustainability through textile recycling. Ind. Text. 2015, 66, 156–163. [Google Scholar]
- Lavuri, R. Organic green purchasing: Moderation of environmental protection emotion and price sensitivity. J. Clean. Prod. 2022, 368, 133113. [Google Scholar] [CrossRef]
- Li, M.; Tian, Z.; Liu, Q.; Lu, Y. Literature review and research prospect on the drivers and effects of green innovation. Sustainability 2022, 14, 9858. [Google Scholar] [CrossRef]
- Dong, Y.; Shi, L. Eco-innovation: Conception, hierarchy and research progress. Acta Ecol. Sin. 2010, 30, 2465–2474. [Google Scholar]
- Dima, A. The Importance of innovation in entrepreneurship for economic growth and development. A bibliometric analysis. Rev. Int. Comp. Manag. 2021, 22, 120–131. [Google Scholar] [CrossRef]
- Liu, X.; Zhang, X.; Sun, W. Does the agglomeration of urban producer services promote carbon efficiency of manufacturing industry? Land Use Policy 2022, 120, 106264. [Google Scholar] [CrossRef]
- Yan, Y.; Chen, Y.; Miao, J. Eco-innovation in SMEs: A scientometric review. Environ. Sci. Pollut. Res. 2022, 29, 48105–48125. [Google Scholar] [CrossRef] [PubMed]
- Parker, C.M.; Redmond, J.; Simpson, M. A review of interventions to encourage SMEs to make environmental improvements. Environ. Plan. C Politics Space 2009, 27, 279–301. [Google Scholar] [CrossRef]
- Chien, F.; Kamran, H.W.; Nawaz, M.A.; Thach, N.N.; Long, P.D.; Baloch, Z.A. Assessing the prioritization of barriers toward green innovation: Small and medium enterprises Nexus. Environ. Dev. Sustain. 2022, 24, 1897–1927. [Google Scholar] [CrossRef]
- Zhu, J.; Dou, Z.; Yan, X.; Yu, L.; Lu, Y. Exploring the influencing factors of carbon neutralization in Chinese manufacturing enterprises. Environ. Sci. Pollut. Res. 2022, 30, 2918–2944. [Google Scholar] [CrossRef] [PubMed]
- Pylaeva, I.S.; Podshivalova, M.V.; Alola, A.A.; Podshivalov, D.V.; Demin, A.A. A new approach to identifying high-tech manufacturing SMEs with sustainable technological development: Empirical evidence. J. Clean. Prod. 2022, 363, 132322. [Google Scholar] [CrossRef]
- Liu, Y.; Shao, X.; Tang, M.; Lan, H. Spatio-temporal evolution of green innovation network and its multidimensional proximity analysis: Empirical evidence from China. J. Clean. Prod. 2021, 283, 124649. [Google Scholar] [CrossRef]
- Wang, M.; Li, Y.; Cheng, Z.; Zhong, C.; Ma, W. Evolution and equilibrium of a green technological innovation system: Simulation of a tripartite game model. J. Clean. Prod. 2021, 278, 123944. [Google Scholar] [CrossRef]
- Wu, W.; Sheng, L.; Tang, F.; Zhang, A.; Liu, J. A system dynamics model of green innovation and policy simulation with an application in Chinese manufacturing industry. Sustain. Prod. Consum. 2021, 28, 987–1005. [Google Scholar] [CrossRef]
- El Baz, J.; Evangelista, P.; Iddik, S.; Jebli, F.; Derrouiche, R.; Akenroye, T. Assessing green innovation in supply chains: A systematic review based on causal mechanisms framework. Int. J. Logist. Manag. 2022, 22, 1114–1145. [Google Scholar] [CrossRef]
- Hermundsdottir, F.; Aspelund, A. Sustainability innovations and firm competitiveness: A review. J. Clean. Prod. 2021, 280, 124715. [Google Scholar] [CrossRef]
- Hojnik, J.; Ruzzier, M. What drives eco-innovation? A review of an emerging literature. Environ. Innov. Soc. Transit. 2016, 19, 31–41. [Google Scholar] [CrossRef]
- Díaz-García, C.; González-Moreno, Á.; Sáez-Martínez, F.J. Eco-innovation: Insights from a literature review. Innovation 2015, 17, 6–23. [Google Scholar] [CrossRef]
- Afeltra, G.; Alerasoul, S.A.; Strozzi, F. The evolution of sustainable innovation: From the past to the future. Eur. J. Innov. Manag. 2021. ahead-of-print. [Google Scholar] [CrossRef]
- Schiederig, T.; Tietze, F.; Herstatt, C. Green innovation in technology and innovation management—An exploratory literature review. RD Manag. 2012, 42, 180–192. [Google Scholar] [CrossRef]
- Chen, Y.S.; Lai, S.B.; Wen, C.T. The influence of green innovation performance on corporate advantage in Taiwan. J. Bus. Ethics 2006, 67, 331–339. [Google Scholar] [CrossRef]
- Padilla-Lozano, C.P.; Collazzo, P. Corporate social responsibility, green innovation and competitiveness—Causality in manufacturing. Compet. Rev. 2022, 32, 21–39. [Google Scholar] [CrossRef]
- Oduro, S.; Maccario, G.; De Nisco, A. Green innovation: A multidomain systematic review. Eur. J. Innov. Manag. 2022, 25, 567–591. [Google Scholar] [CrossRef]
- Pereira, R.M.; MacLennan, M.L.F.; Tiago, E.F. Interorganizational cooperation and eco-innovation: A literature review. Int. J. Innov. Sci. 2020, 12, 477–493. [Google Scholar] [CrossRef]
- Chen, Y.S. The driver of green innovation and green image—Green core competence. J. Bus. Ethics 2008, 81, 531–543. [Google Scholar] [CrossRef]
- Wang, Y.; Yang, Y. Analyzing the green innovation practices based on sustainability performance indicators: A Chinese manufacturing industry case. Environ. Sci. Pollut. Res. 2021, 28, 1181–1203. [Google Scholar] [CrossRef]
- Naruetharadhol, P.; Srisathan, W.A.; Gebsombut, N.; Ketkaew, C. Towards the open eco-innovation mode: A model of open innovation and green management practices. Cogent Bus. Manag. 2021, 8, 1945425. [Google Scholar] [CrossRef]
- Hellström, T. Dimensions of environmentally sustainable innovation: The structure of eco-innovation concepts. Sustain. Dev. 2007, 15, 148–159. [Google Scholar] [CrossRef]
- Ebrahimi, P.; Mirbargkar, S.M. Green entrepreneurship and green innovation for SME development in market turbulence. Eurasian Bus. Rev. 2017, 7, 203–228. [Google Scholar] [CrossRef]
- Rathi, R.; Kaswan, M.S.; Antony, J.; Cross, J.; Garza-Reyes, J.A.; Furterer, S.L. Success factors for the adoption of green lean six sigma in healthcare facility: An ISM-MICMAC study. Int. J. Lean Six Sigma 2022. ahead-of-print. [Google Scholar] [CrossRef]
- Kaswan, M.S.; Rathi, R.; Cross, J.; Garza-Reyes, J.A.; Antony, J.; Yadav, V. Integrating green lean six sigma and industry 4.0: A conceptual framework. J. Manuf. Technol. Manag. 2023, 34, 87–121. [Google Scholar] [CrossRef]
- Huang, Y.F.; Chen, A.P.S.; Do, M.H.; Chung, J.C. Assessing the barriers of green innovation implementation: Evidence from the Vietnamese manufacturing sector. Sustainability 2022, 14, 4662. [Google Scholar] [CrossRef]
- Fahad, S.; Alnori, F.; Su, F.; Deng, J. Adoption of green innovation practices in SMEs sector: Evidence from an emerging economy. Econ. Res. Ekon. Istraživanja 2022, 35, 5486–5501. [Google Scholar] [CrossRef]
- Gupta, H.; Barua, M.K. A framework to overcome barriers to green innovation in SMEs using BWM and Fuzzy TOPSIS. Sci. Total Environ. 2018, 633, 122–139. [Google Scholar] [CrossRef] [PubMed]
- Dugonski, F.C.V.; Tumelero, C. Barriers and facilitators of technological eco-innovations: A multilevel analysis in a Brazilian cosmetics company. Innov. Manag. Rev. 2022, 19, 237–251. [Google Scholar] [CrossRef]
- Cecere, G.; Corrocher, N.; Mancusi, M.L. Financial constraints and public funding of eco-innovation: Empirical evidence from European SMEs. Small Bus. Econ. 2020, 54, 285–302. [Google Scholar] [CrossRef]
- Gohoungodji, P.; N’Dri, A.B.; Latulippe, J.M.; Matos, A.L.B. What is stopping the automotive industry from going green? A systematic review of barriers to green innovation in the automotive industry. J. Clean. Prod. 2020, 277, 123524. [Google Scholar] [CrossRef]
- Wang, D.; Si, R.; Fahad, S. Evaluating the small and medium sized enterprises motivating factors and influencing barriers about adoption of green practices. Environ. Dev. Sustain. 2022, 1–13. [Google Scholar] [CrossRef]
- Jun, W.; Ali, W.; Bhutto, M.Y.; Hussain, H.; Khan, N.A. Examining the determinants of green innovation adoption in SMEs: A PLS-SEM approach. Eur. J. Innov. Manag. 2021, 24, 67–87. [Google Scholar] [CrossRef]
- Abdullah, M.; Zailani, S.; Iranmanesh, M.; Jayaraman, K. Barriers to green innovation initiatives among manufacturers: The Malaysian case. Rev. Manag. Sci. 2016, 10, 683–709. [Google Scholar] [CrossRef]
- Zhu, Y.; Wittmann, X.; Peng, M.W. Institution-based barriers to innovation in SMEs in China. Asia Pac. J. Manag. 2012, 29, 1131–1142. [Google Scholar] [CrossRef]
- Ansari, Z.N.; Kant, R. A plithogenic based neutrosophic analytic hierarchy process framework to analyse the barriers hindering adoption of eco-innovation practices in supply chain. Int. J. Sustain. Eng. 2021, 14, 1509–1524. [Google Scholar] [CrossRef]
- Musaad O, A.S.; Zhuo, Z.; Musaad O, A.O.; Ali Siyal, Z.; Hashmi, H.; Shah, S.A.A. A fuzzy multi-criteria analysis of barriers and policy strategies for small and medium enterprises to adopt green innovation. Symmetry 2020, 12, 116. [Google Scholar] [CrossRef]
- De Jesus, A.; Mendonça, S. Lost in transition? Drivers and barriers in the eco-innovation road to the circular economy. Ecol. Econ. 2018, 145, 75–89. [Google Scholar] [CrossRef]
- Govindan, K.; Kaliyan, M.; Kannan, D.; Haq, A.N. Barriers analysis for green supply chain management implementation in Indian industries using analytic hierarchy process. Int. J. Prod. Econ. 2014, 147, 555–568. [Google Scholar] [CrossRef]
- Horváth, D.; Szabó, R.Z. Driving forces and barriers of Industry 4.0: Do multinational and small and medium-sized companies have equal opportunities? Technol. Forecast. Soc. Change 2019, 146, 119–132. [Google Scholar] [CrossRef]
- Jinzhou, W. Discussion on the relationship between green technological innovation and system innovation. Energy Procedia 2011, 5, 2352–2357. [Google Scholar] [CrossRef] [Green Version]
- Mangla, S.K.; Govindan, K.; Luthra, S. Prioritizing the barriers to achieve sustainable consumption and production trends in supply chains using fuzzy Analytical Hierarchy Process. J. Clean. Prod. 2017, 151, 509–525. [Google Scholar] [CrossRef]
- Naor, M.; Bernardes, E.S.; Druehl, C.T.; Shiftan, Y. Overcoming barriers to adoption of environmentally-friendly innovations through design and strategy: Learning from the failure of an electric vehicle infrastructure firm. Int. J. Oper. Prod. Manag. 2015, 35, 26–59. [Google Scholar] [CrossRef]
- Gupta, H.; Kusi-Sarpong, S.; Rezaei, J. Barriers and overcoming strategies to supply chain sustainability innovation. Resour. Conserv. Recycl. 2020, 161, 104819. [Google Scholar] [CrossRef]
- Xavier, A.; Reyes, T.; Aoussat, A.; Luiz, L.; Souza, L. Eco-innovation maturity model: A framework to support the evolution of eco-innovation integration in companies. Sustainability 2020, 12, 3773. [Google Scholar] [CrossRef]
- Janahi, N.A.; Durugbo, C.M.; Al-Jayyousi, O.R. Eco-innovation strategy in manufacturing: A systematic review. Clean. Eng. Technol. 2021, 5, 100343. [Google Scholar] [CrossRef]
- Melander, L. Customer and supplier collaboration in green product innovation: External and internal capabilities. Bus. Strategy Environ. 2018, 27, 677–693. [Google Scholar] [CrossRef]
- Qu, K.; Liu, Z. Green innovations, supply chain integration and green information system: A model of moderation. J. Clean. Prod. 2022, 339, 130557. [Google Scholar] [CrossRef]
- Yu, C.; Morotomi, T. Impacts of green public procurement on eco-innovation: Evidence from EU countries. Glob. Public Policy Gov. 2022, 2, 154–174. [Google Scholar] [CrossRef]
- Fan, R.; Wang, Y.; Chen, F.; Du, K.; Wang, Y. How do government policies affect the diffusion of green innovation among peer enterprises?—An evolutionary-game model in complex networks. J. Clean. Prod. 2022, 364, 132711. [Google Scholar] [CrossRef]
- Roh, T.; Lee, K.; Yang, J.Y. How do intellectual property rights and government support drive a firm’s green innovation? The mediating role of open innovation. J. Clean. Prod. 2021, 317, 128422. [Google Scholar] [CrossRef]
- Benbya, H.; McKelvey, B. Using coevolutionary and complexity theories to improve IS alignment: A multi-level approach. J. Inf. Technol. 2006, 21, 284–298. [Google Scholar] [CrossRef]
- Canessa, E.; Riolo, R.L. An agent-based model of the impact of computer–mediated communication on organizational culture and performance: An example of the application of complex systems analysis tools to the study of CIS. J. Inf. Technol. 2006, 2, 272–283. [Google Scholar] [CrossRef]
- McCarthy, I.P.; Rakotobe-Joel, T.; Frizelle, G. Complex systems theory: Implications and promises for manufacturing organisations. Int. J. Manuf. Technol. Manag. 2000, 2, 559–579. [Google Scholar] [CrossRef]
- Niu, P.; Zhu, J.; Sun, Y. Dynamic modeling and chaos control of informatization development in manufacturing enterprises. Entropy 2021, 23, 681. [Google Scholar] [CrossRef]
- Zhu, J.; Liu, W.; Li, Y.; Sun, Y. Exploring robustness management for dynamic technology fusion. Nonlinear Dyn. 2020, 102, 2969–3011. [Google Scholar] [CrossRef]
- Pal, N.; Samanta, S.; Chattopadhyay, J. The impact of diffusive migration on ecosystem stability. Chaos Solitons Fractals 2015, 78, 317–328. [Google Scholar] [CrossRef]
- Çalış, Y.; Demirci, A.; Özemir, C. Hopf bifurcation of a financial dynamical system with delay. Math. Comput. Simul. 2022, 201, 343–361. [Google Scholar] [CrossRef]
- Xu, X.; Lee, S.D.; Kim, H.S.; You, S.S. Management and optimisation of chaotic supply chain system using adaptive sliding mode control algorithm. Int. J. Prod. Res. 2021, 59, 2571–2587. [Google Scholar] [CrossRef]
- Bertsimas, D.; King, A. Logistic regression: From art to science. Stat. Sci. 2017, 32, 367–384. [Google Scholar] [CrossRef]
- Tariq, A.; Badir, Y.F.; Tariq, W.; Bhutta, U.S. Drivers and consequences of green product and process innovation: A systematic review, conceptual framework, and future outlook. Technol. Soc. 2017, 51, 8–23. [Google Scholar] [CrossRef]
- Sandén, B.A.; Hillman, K.M. A framework for analysis of multi-mode interaction among technologies with examples from the history of alternative transport fuels in Sweden. Res. Policy 2011, 40, 403–414. [Google Scholar] [CrossRef]
- Mazzanti, M.; Zoboli, R. Embedding environmental innovation in local production systems: SME strategies, networking and industrial relations: Evidence on innovation drivers in industrial districts. Int. Rev. Appl. Econ. 2009, 23, 169–195. [Google Scholar] [CrossRef]
- Loučanová, E.; Olšiaková, M. Supporting ecological innovation as a factor for economic development. Stud. Univ. Vasile Goldiş Arad Ser. Ştiinţe Econ. 2019, 29, 80–91. [Google Scholar] [CrossRef] [Green Version]
Figure 1.
The schematic diagram of our methodology.

Figure 2.
Evolutionary paths and the corresponding conditions of green innovation from non-ideal stable states to the ideal stable state.
Figure 2.
Evolutionary paths and the corresponding conditions of green innovation from non-ideal stable states to the ideal stable state.
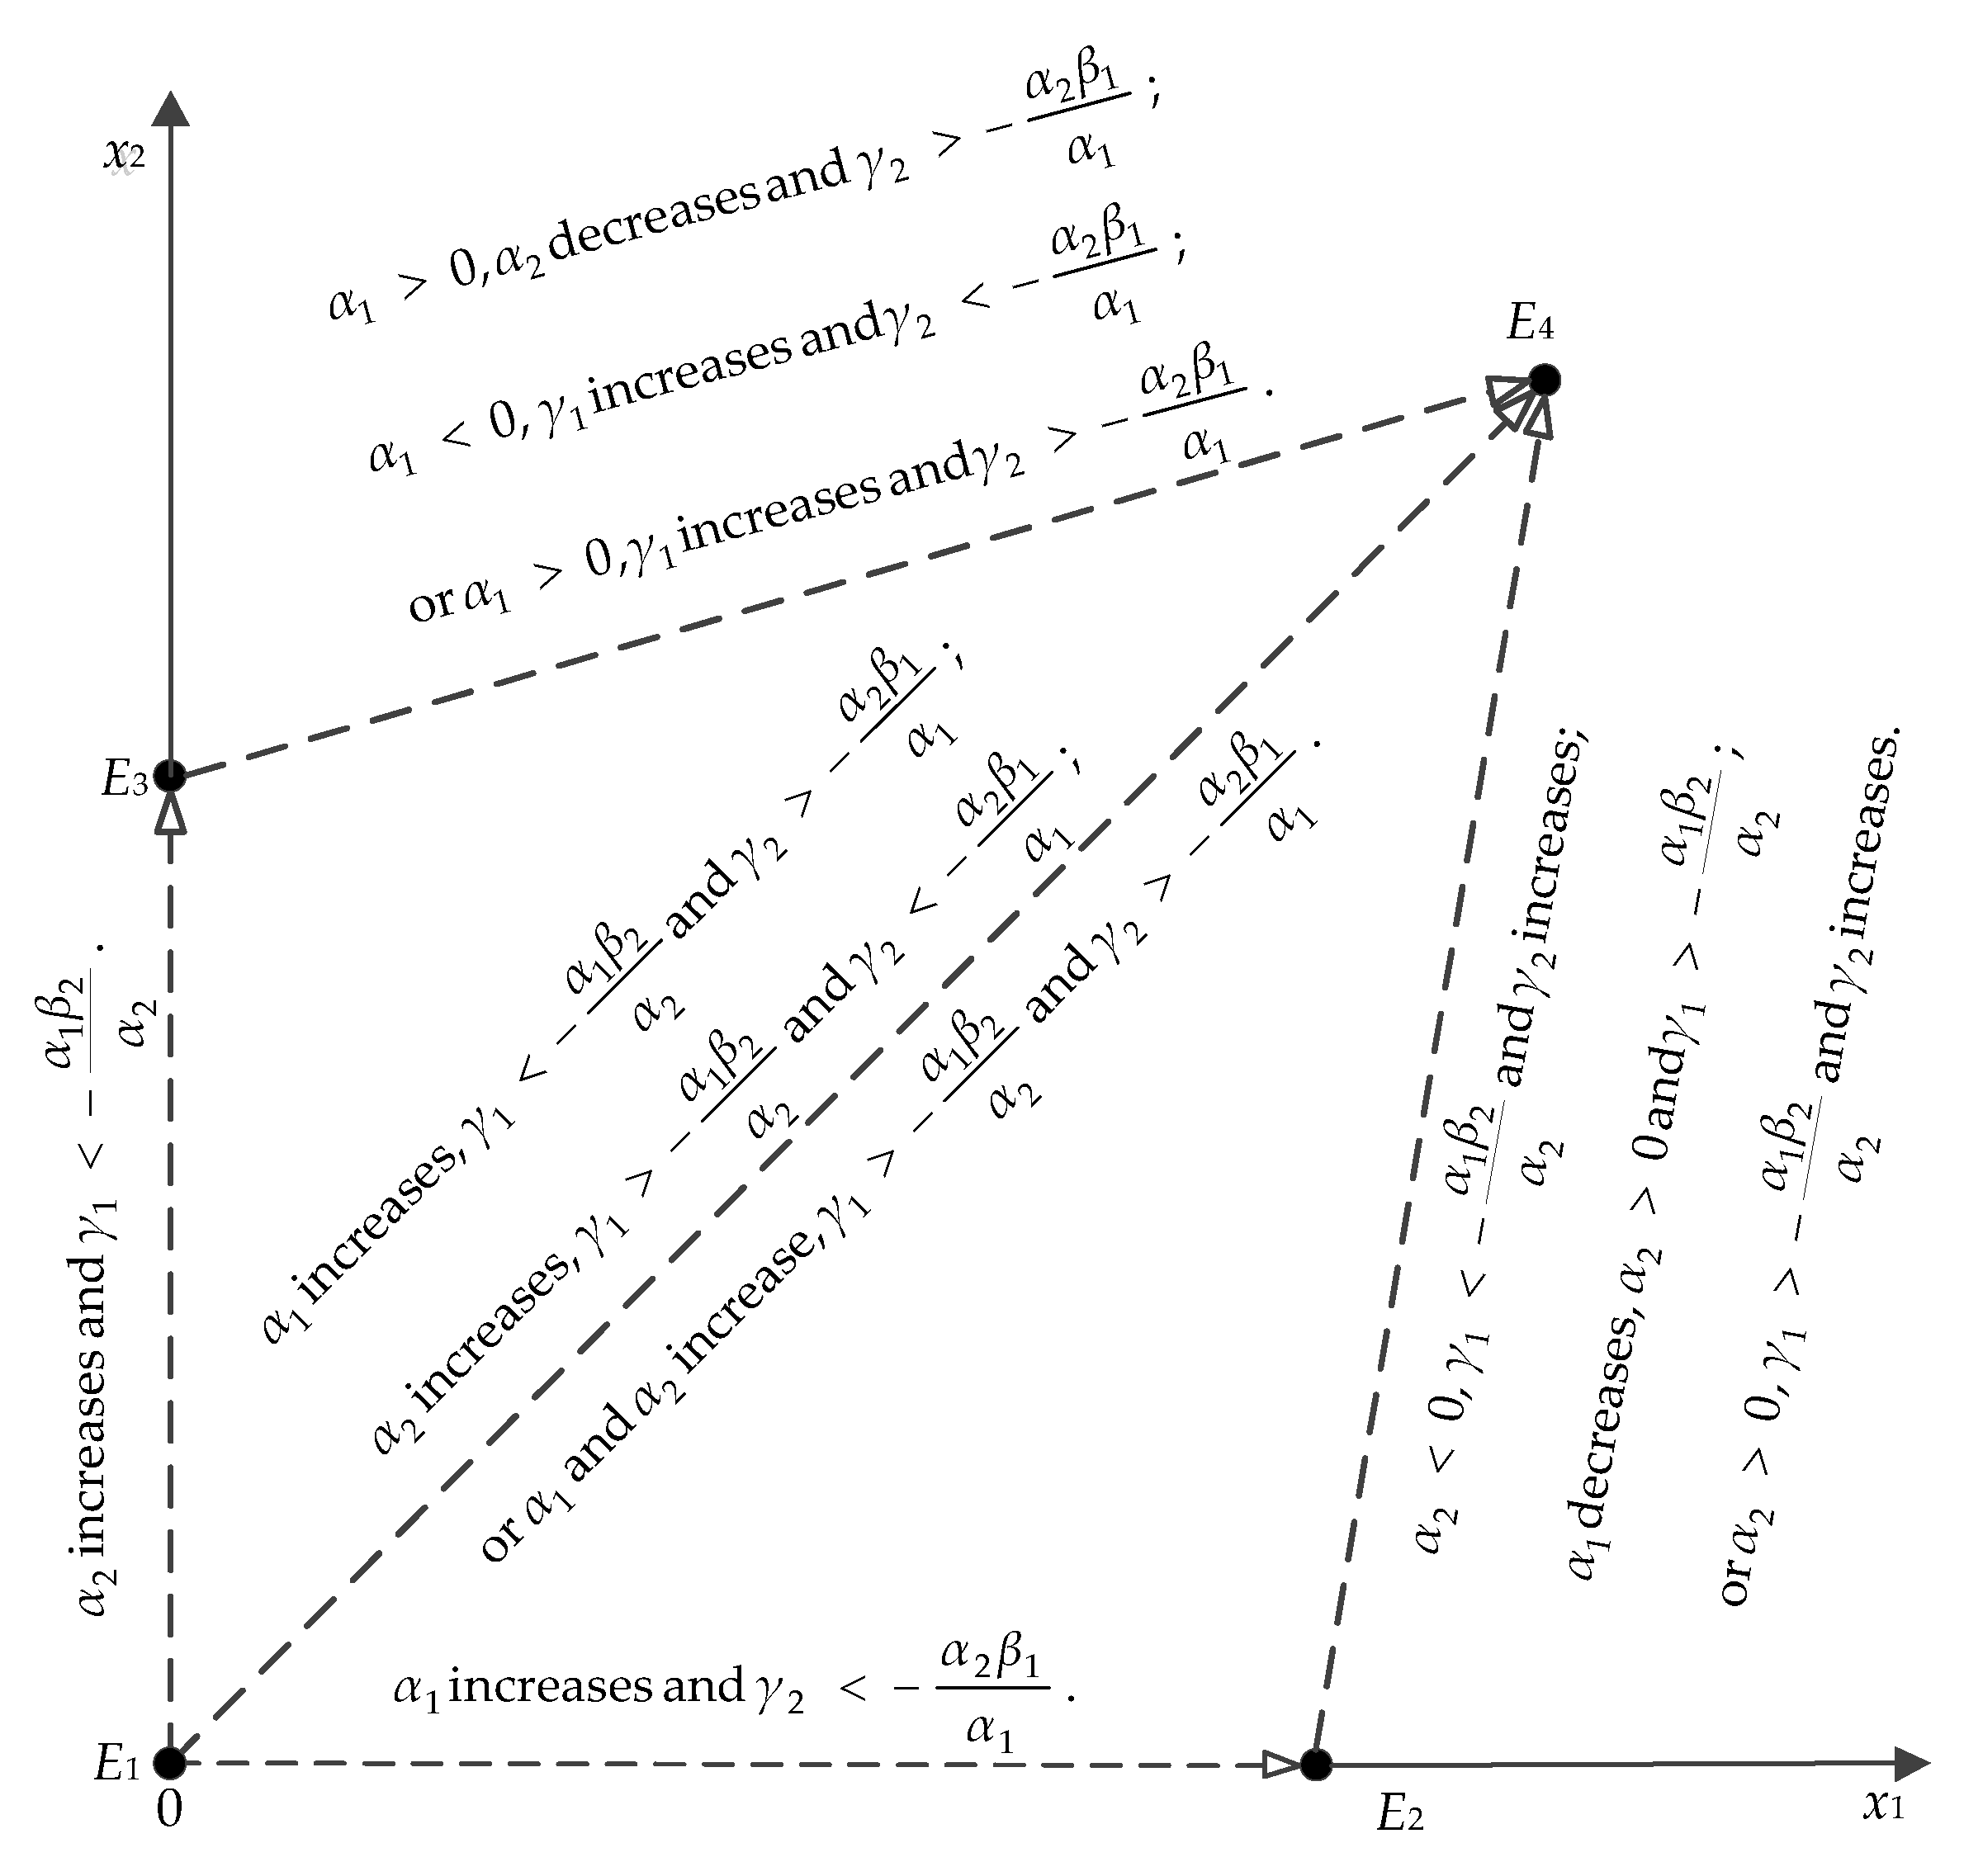
Figure 3.
Evolutionary stability of green innovation at E1.


Figure 4.
Evolutionary stability of green innovation at E3.

Figure 5.
Evolutionary stability of green innovation at E4 with α1 < 0 and α2 > 0.

Figure 6.
Evolutionary stability of green innovation at E4 with α1 > 0 and α2 > 0.

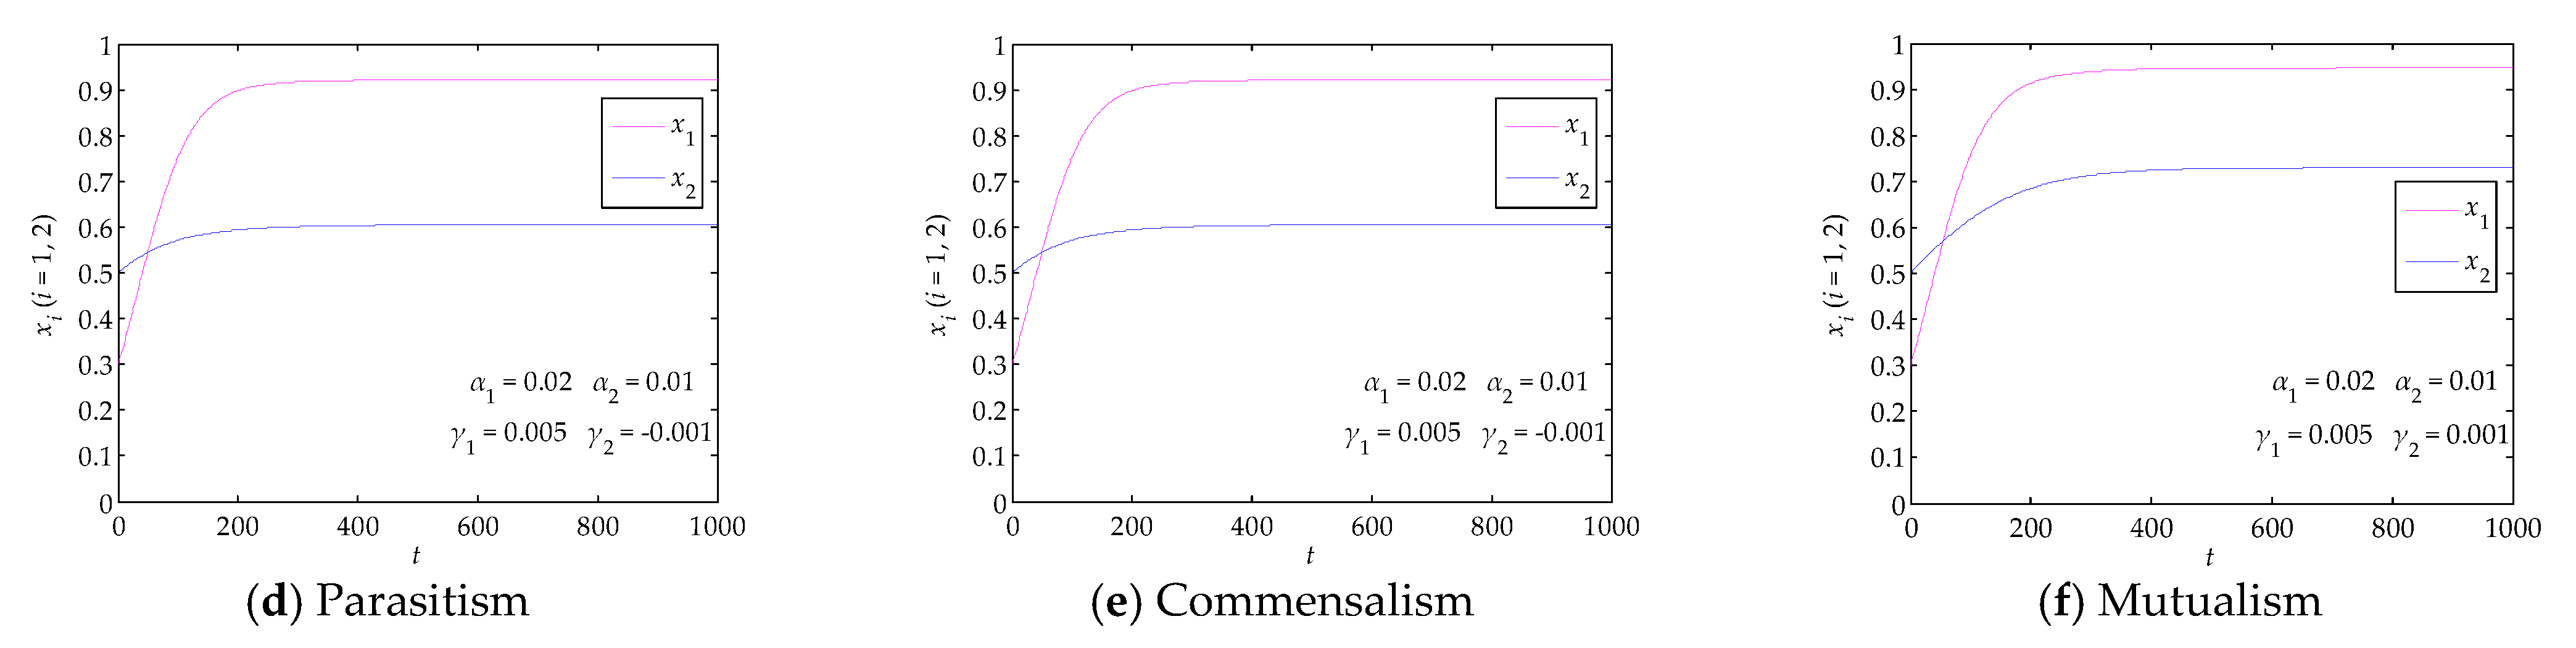
Figure 7.
Evolutionary stability of green innovation at equilibrium point when γ1 = γ2 > 0.

Figure 8.
Evolutionary paths from E1 to E4: (a) α1 increases, and , (b) α2 increases, and , and (c) α1 and α2 increase, and ; the corresponding measures are taken at (a) t = 200, (b) t = 100 and (c) t = 150.
Figure 8.
Evolutionary paths from E1 to E4: (a) α1 increases, and , (b) α2 increases, and , and (c) α1 and α2 increase, and ; the corresponding measures are taken at (a) t = 200, (b) t = 100 and (c) t = 150.
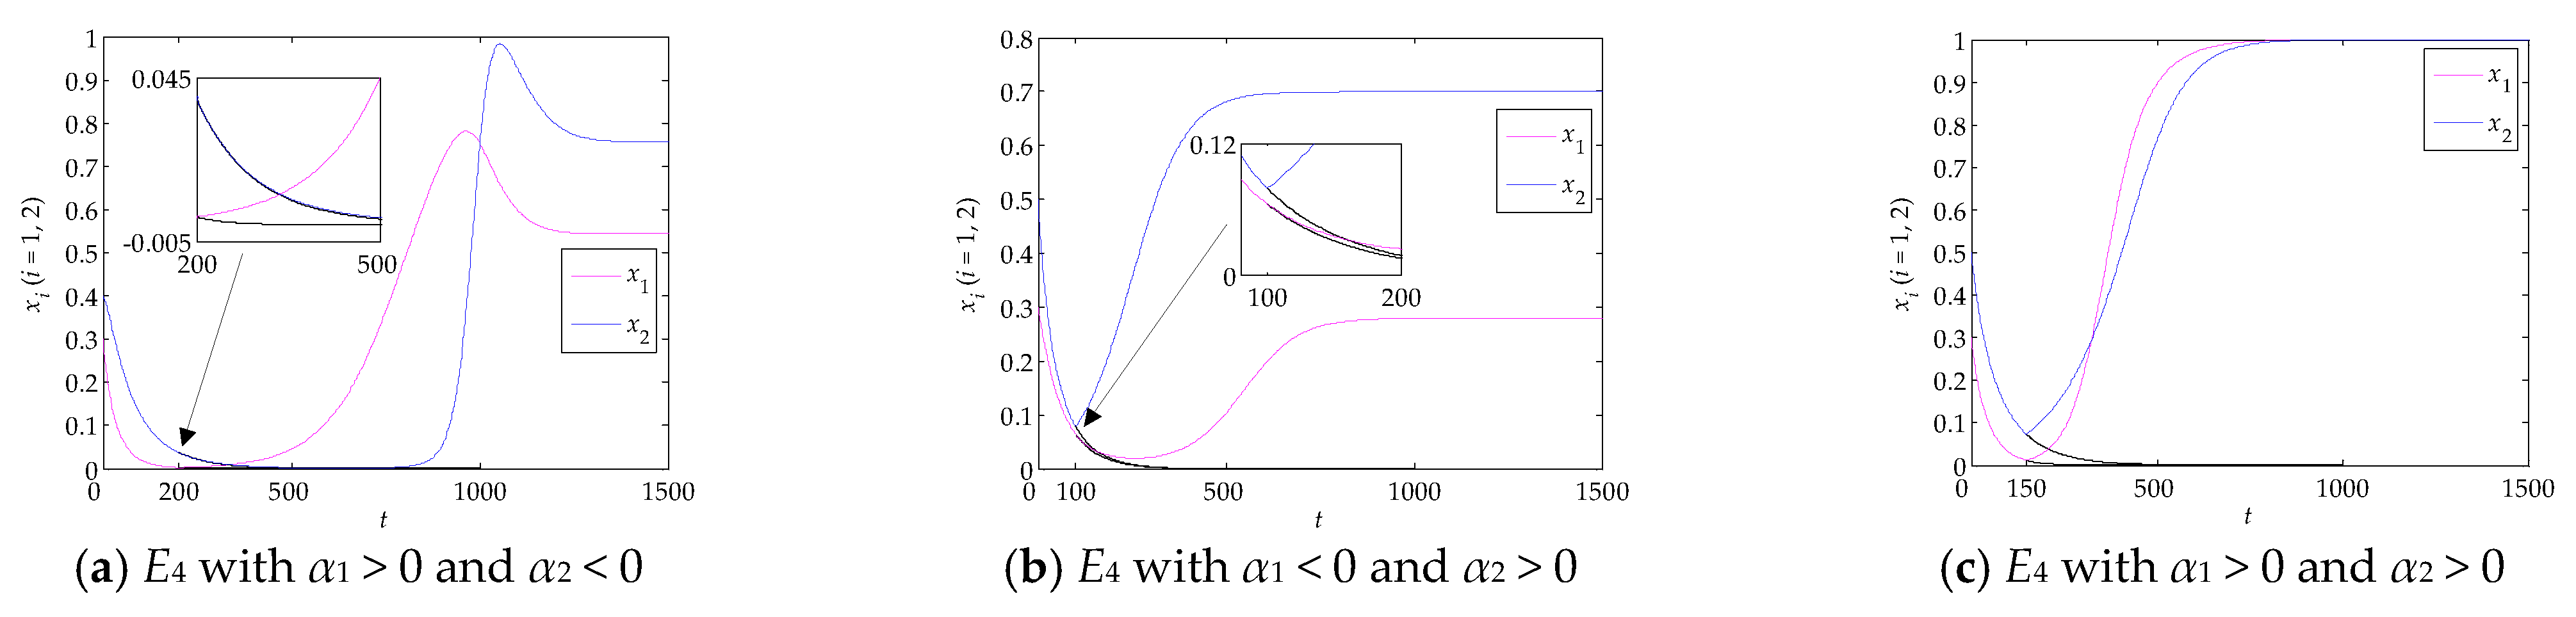
Figure 9.
Evolutionary paths from E1 to E4 over E2: α1 increases, and then (a) γ2 increases, α2 < 0 and , (b) α1 decreases, α2 > 0, and , and (c) γ2 increases, α2 > 0 and ; the corresponding measures are successively taken at (a) t = 200 and t = 300, (b) t = 100 and t = 200, and (c) t = 100 and t = 200.
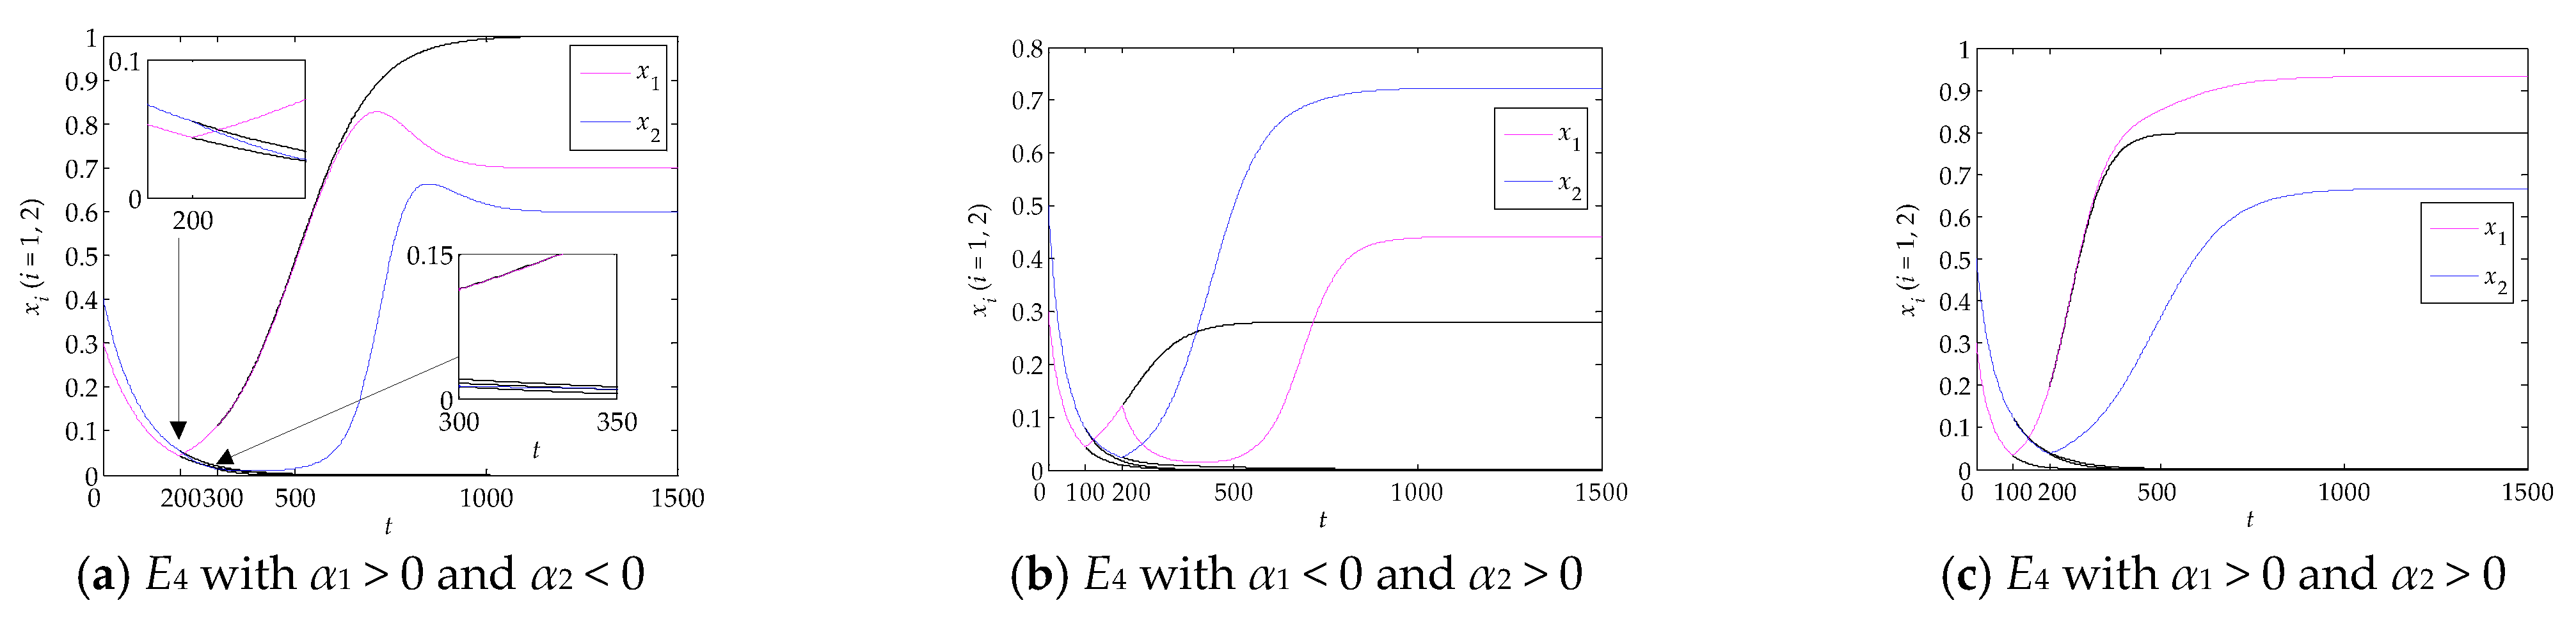
Figure 10.
Evolutionary paths from E3 to E4: (a) α2 decreases, α1 > 0 and , (b) γ1 increases, α1 < 0, and , and (c) γ1 increases, α1 > 0, and ; the corresponding measures are taken at (a) t = 100, (b) t = 300, and (c) t = 500.
Figure 10.
Evolutionary paths from E3 to E4: (a) α2 decreases, α1 > 0 and , (b) γ1 increases, α1 < 0, and , and (c) γ1 increases, α1 > 0, and ; the corresponding measures are taken at (a) t = 100, (b) t = 300, and (c) t = 500.


Table 1.
The relationships of symbiotic coefficients and symbiotic interactions.
| Interactions | γi (i = 1, 2) | Description |
|---|---|---|
| Neutralism | γ1 = 0, γ2 = 0 | Green product innovation and green process innovation do not affect each other |
| Competition | γ1 < 0, γ2 < 0 | Green product innovation and green process innovation inhibit each other |
| Amensalism | γ1 < 0, γ2 = 0 | Green product innovation is inhibited, and green process innovation is unaffected |
| γ1 = 0, γ2 < 0 | Green product innovation is unaffected, and green process innovation is inhibited | |
| Parasitism | γ1 > 0, γ2 < 0 | Green product innovation is benefited, and green process innovation is inhibited |
| γ1 < 0, γ2 > 0 | Green product innovation is inhibited, and green process innovation is benefited | |
| Commensalism | γ1 > 0, γ2 = 0 | Green product innovation is benefited, and green process innovation is unaffected |
| γ1 = 0, γ2 > 0 | Green product innovation is unaffected, and green process innovation is benefited | |
| Mutualism | γ1 > 0, γ2 > 0 | γ1 ≠ γ2, Green product innovation and green process innovation are not equally benefited |
| γ1 = γ2, Green product innovation and green process innovation are equally benefited |
Table 2.
Stability analysis of each equilibrium point.
| Ei (i = 1, 2, 3, 4) | det J/tr J | Stable Conditions | Symbiotic Interactions | |
|---|---|---|---|---|
| E1 | α1α2/α1 + α2 | α1 < 0, α2 < 0 | All | |
| E2 | α1 | All | ||
| E3 | α2 | All | ||
| E4 | γ1γ2 < β1β2 | α1 > 0, α2 < 0, , | Mutualism Commensalism Parasitism | |
| α1 < 0, α2 > 0, , | ||||
| α1 > 0, α2 > 0, , | All | |||
Table 3.
Parameter values before and after the transitions between two stable nodes.
| Original Points | Middle Points | Final Points | Parameters Values before and after Transitions (10−2) | |||||
|---|---|---|---|---|---|---|---|---|
| α1 | α2 | β1 | β2 | γ1 | γ2 | |||
| E1 | None | E4 with α1 > 0 and α2 < 0 | −2/1 | −1 | 1 | 3 | −2/−0.6 | 6 |
| E4 with α1 < 0 and α2 > 0 | −1.4 | −1.4/1.4 | 5 | 2 | 3/4 | 0 | ||
| E4 with α1 > 0 and α2 > 0 | −2/2 | −1/1 | 2.5 | 1.5 | 0.5 | 0.5 | ||
| E1 | E2 | E4 with α1 > 0 and α2 < 0 | −1/1/1 | −1 | 1 | 3 | 1/1/−0.5 | 4/−5/4 |
| E4 with α1 < 0 and α2 > 0 | −1.4/1.4/−1.4 | −1.4/−1.4/1.4 | 5 | 2 | 0.5/0.5/5 | 0/4/0.1 | ||
| E4 with α1 > 0 and α2 > 0 | −2/2/2 | −1/−1/1 | 2.5 | 1.5 | 0.5 | 0/−1/0 | ||
| E3 | None | E4 with α1 > 0 and α2 < 0 | 1 | 1/−1 | 1 | 3 | −6/−1 | 4 |
| E4 with α1 < 0 and α2 > 0 | −1.4 | 1.4 | 5 | 2 | 1/3 | −1 | ||
| E4 with α1 > 0 and α2 > 0 | 2 | 1 | 2.5 | 1.5 | −3.5/0.5 | 0.1 | ||
Disclaimer/Publisher’s Note: The statements, opinions and data contained in all publications are solely those of the individual author(s) and contributor(s) and not of MDPI and/or the editor(s). MDPI and/or the editor(s) disclaim responsibility for any injury to people or property resulting from any ideas, methods, instructions or products referred to in the content. |
© 2023 by the authors. Licensee MDPI, Basel, Switzerland. This article is an open access article distributed under the terms and conditions of the Creative Commons Attribution (CC BY) license (https://creativecommons.org/licenses/by/4.0/).
Share and Cite
MDPI and ACS Style
Song, Z.; Zhu, J.; Shi, J. Evolution Analysis of Green Innovation in Small and Medium-Sized Manufacturing Enterprises. Systems 2023, 11, 95. https://doi.org/10.3390/systems11020095
AMA Style
Song Z, Zhu J, Shi J. Evolution Analysis of Green Innovation in Small and Medium-Sized Manufacturing Enterprises. Systems. 2023; 11(2):95. https://doi.org/10.3390/systems11020095
Chicago/Turabian StyleSong, Zhiting, Jianhua Zhu, and Jianfeng Shi. 2023. "Evolution Analysis of Green Innovation in Small and Medium-Sized Manufacturing Enterprises" Systems 11, no. 2: 95. https://doi.org/10.3390/systems11020095
Note that from the first issue of 2016, this journal uses article numbers instead of page numbers. See further details here.