
The Meaning of “Structure” in Systems Thinking


Abstract
:1. Introduction and Background
- The arrangement of and relations between the parts or elements of something complex [2].
- The arrangement of particles or parts in a substance or body; arrangement or interrelation of the parts as dominated by the general character of the whole [3].
- The way in which the parts of a system or object are arranged or organized, or a system arranged in this way [4].
- The mode of building, construction, or organization; arrangement of the parts, elements, or constituents [5].
- The structure of something is the way in which it is made, built, or organized [6].
2. Literature Review
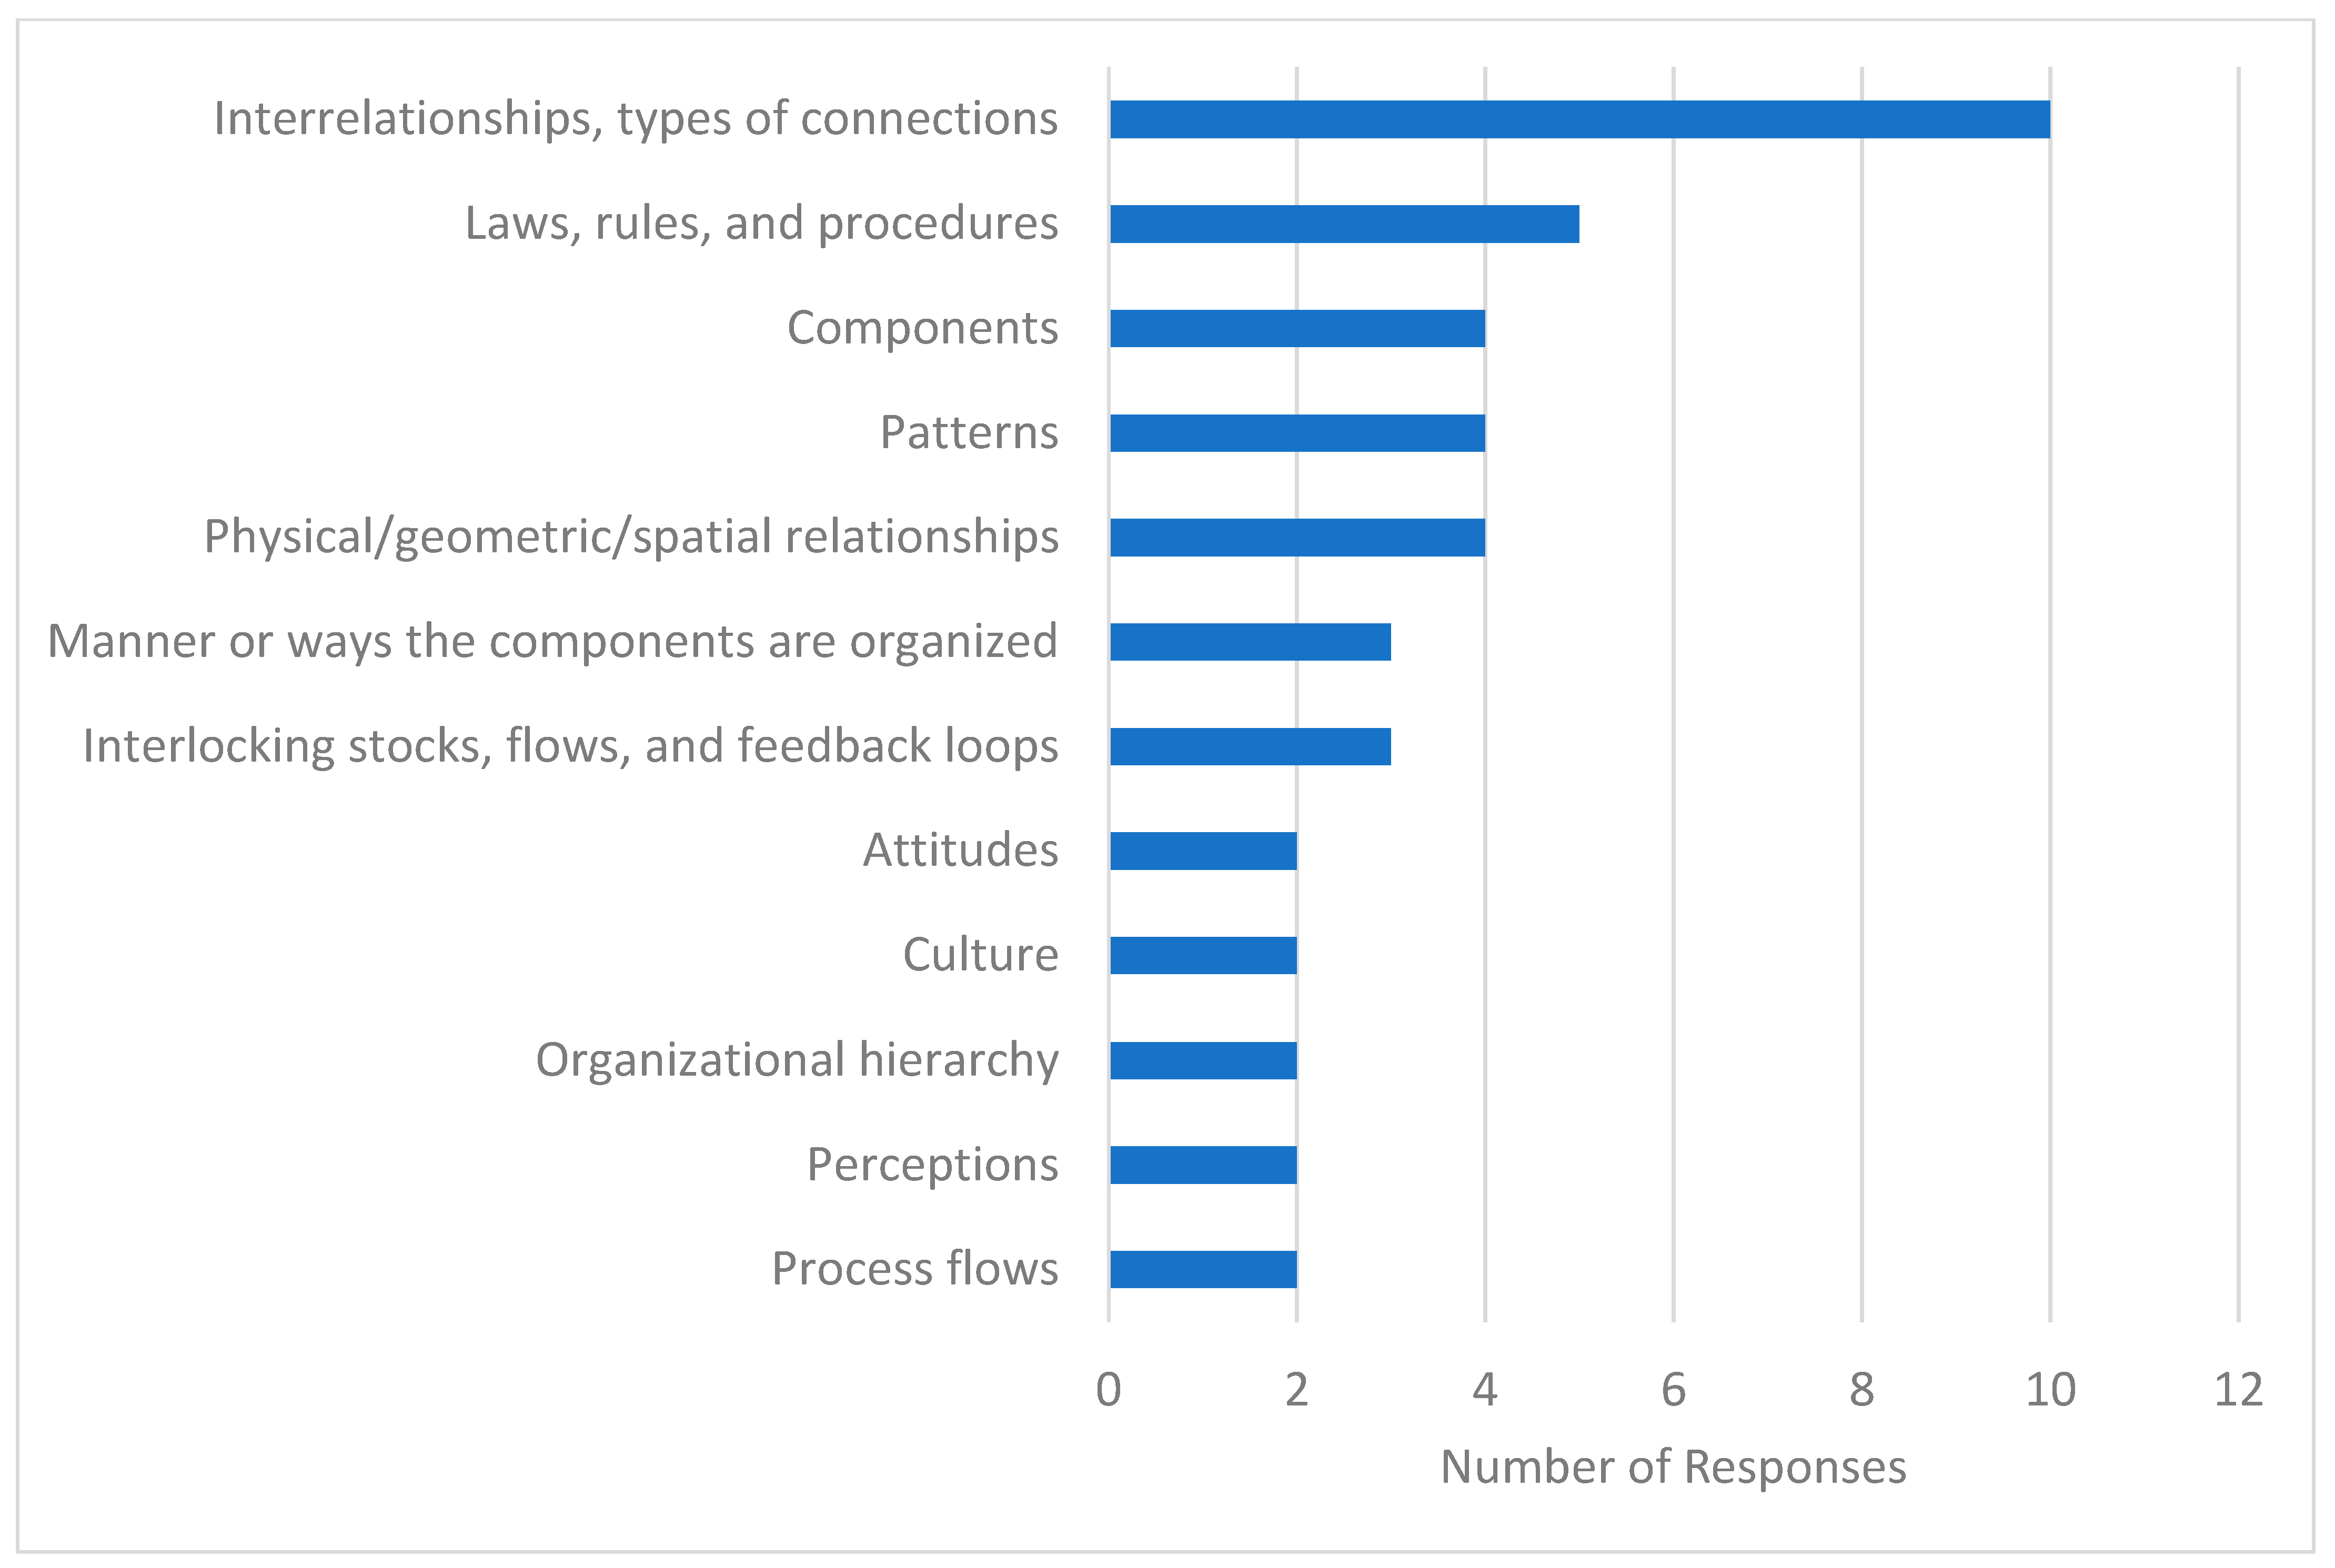
- organizational hierarchy
- process flows
- attitudes
- perceptions
- product quality
- the ways decisions are made”
- Components. Components are the operating parts of a system consisting of input, process, and output. Each system component may assume a variety of values to describe a system state.
- Attributes. Attributes are the properties of the components in the system.
- Relationships. Relationships are the links between the components and attributes.”
- “Structure: A set in which the elements are qualified as components recognized as having the capacity to contribute to perform specific functions (necessary to carrying out specific roles in the context of an emerging system). The components can be put in relation respecting specific constraints (rules).
- Actual structure: Set of physical, concrete components, with a known function provided with a connecting mechanism or linker device predisposed for linking up other components.”
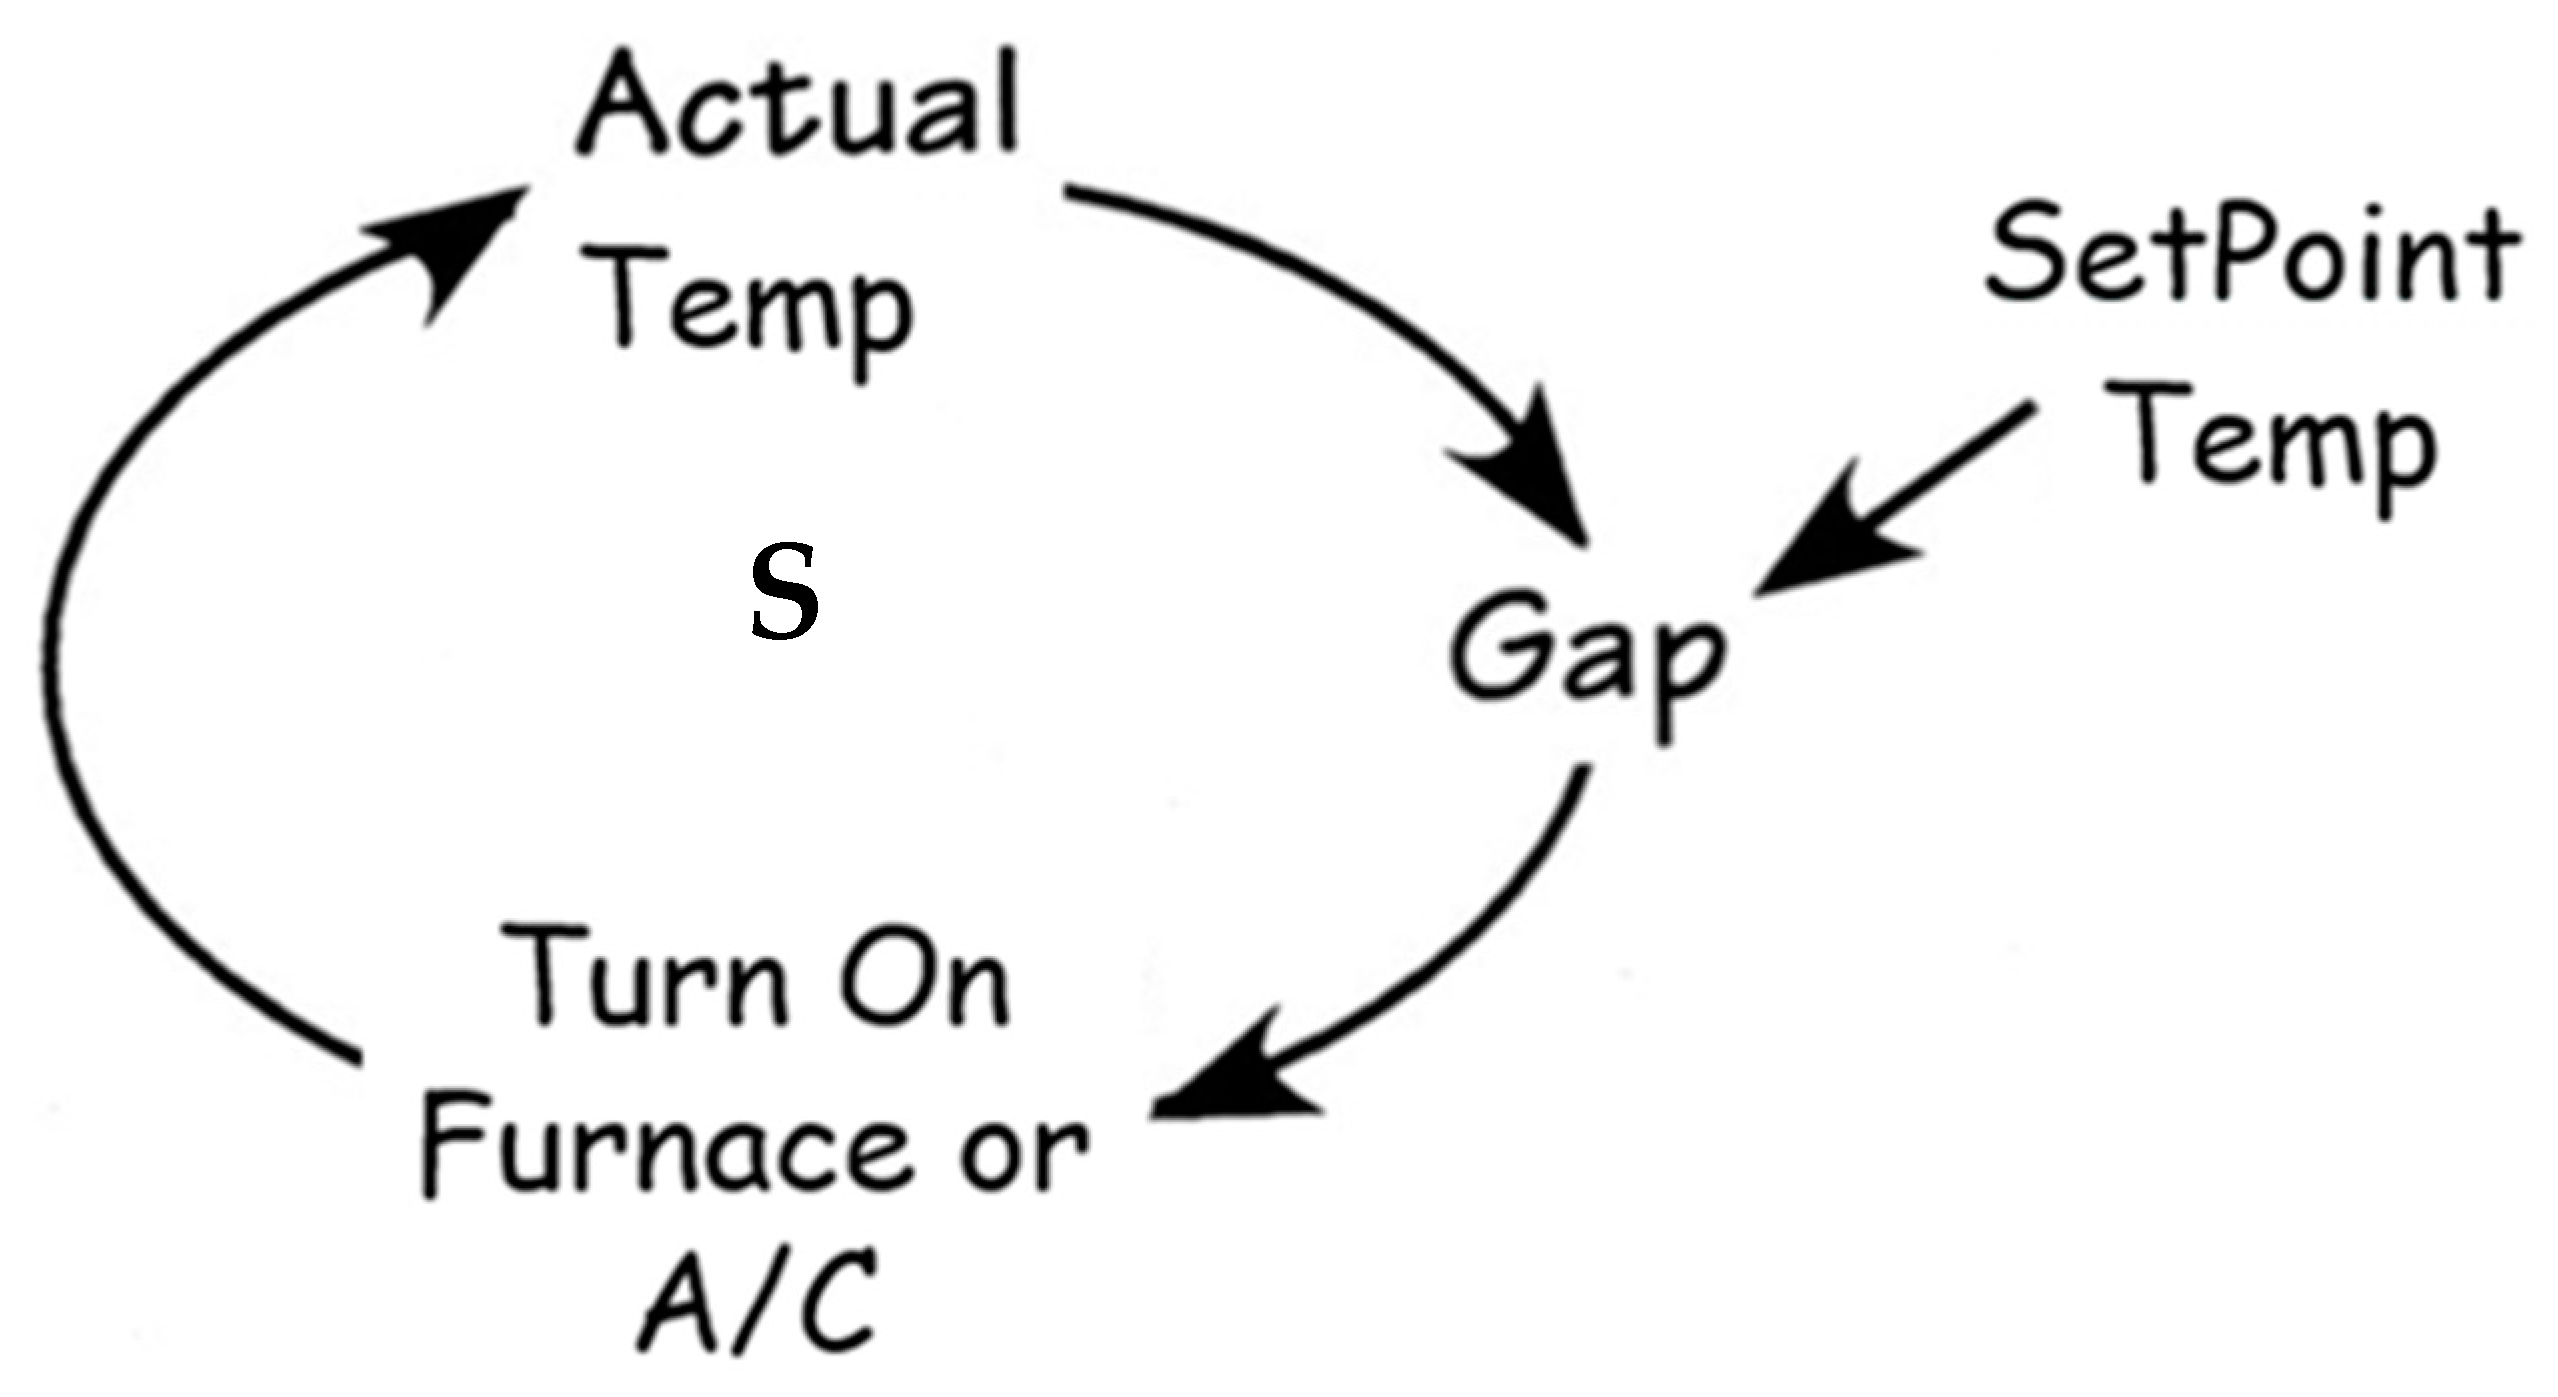
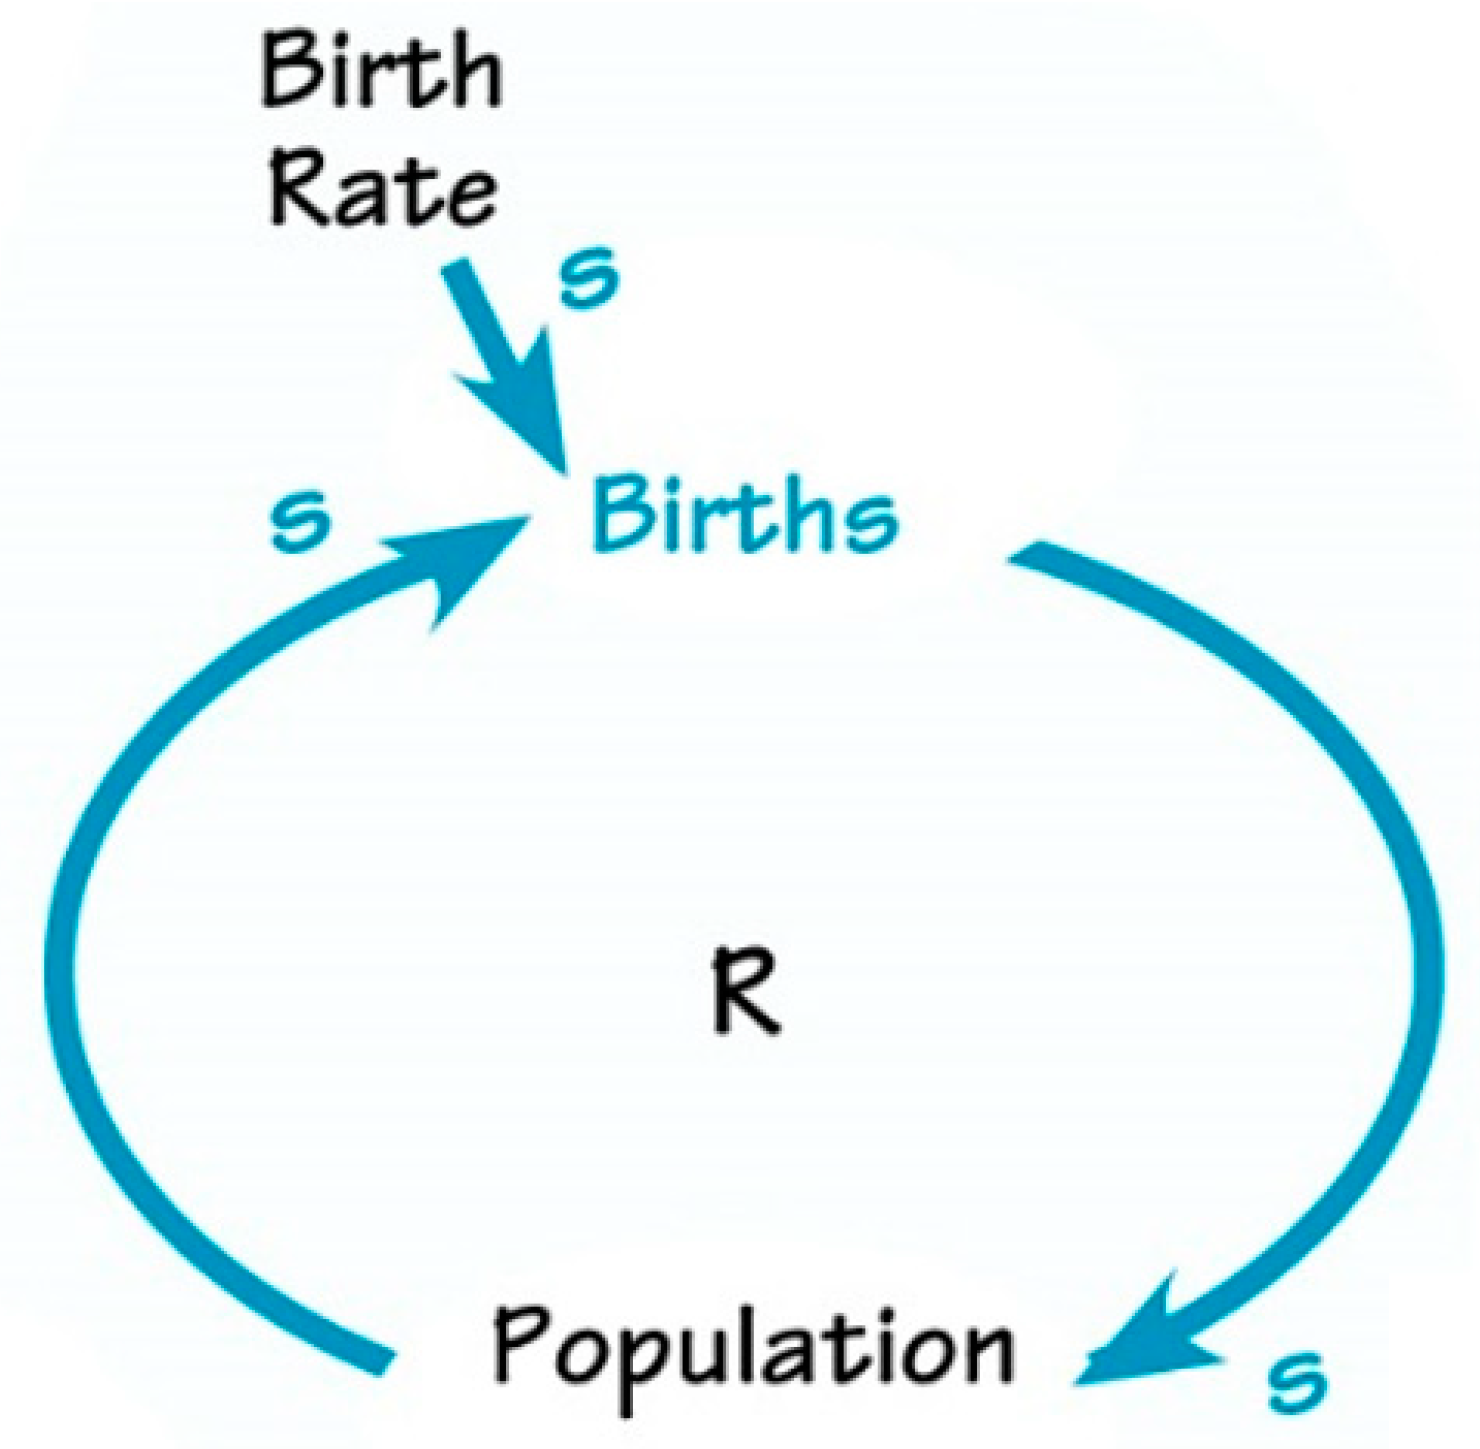
- Action-reaction relationships,
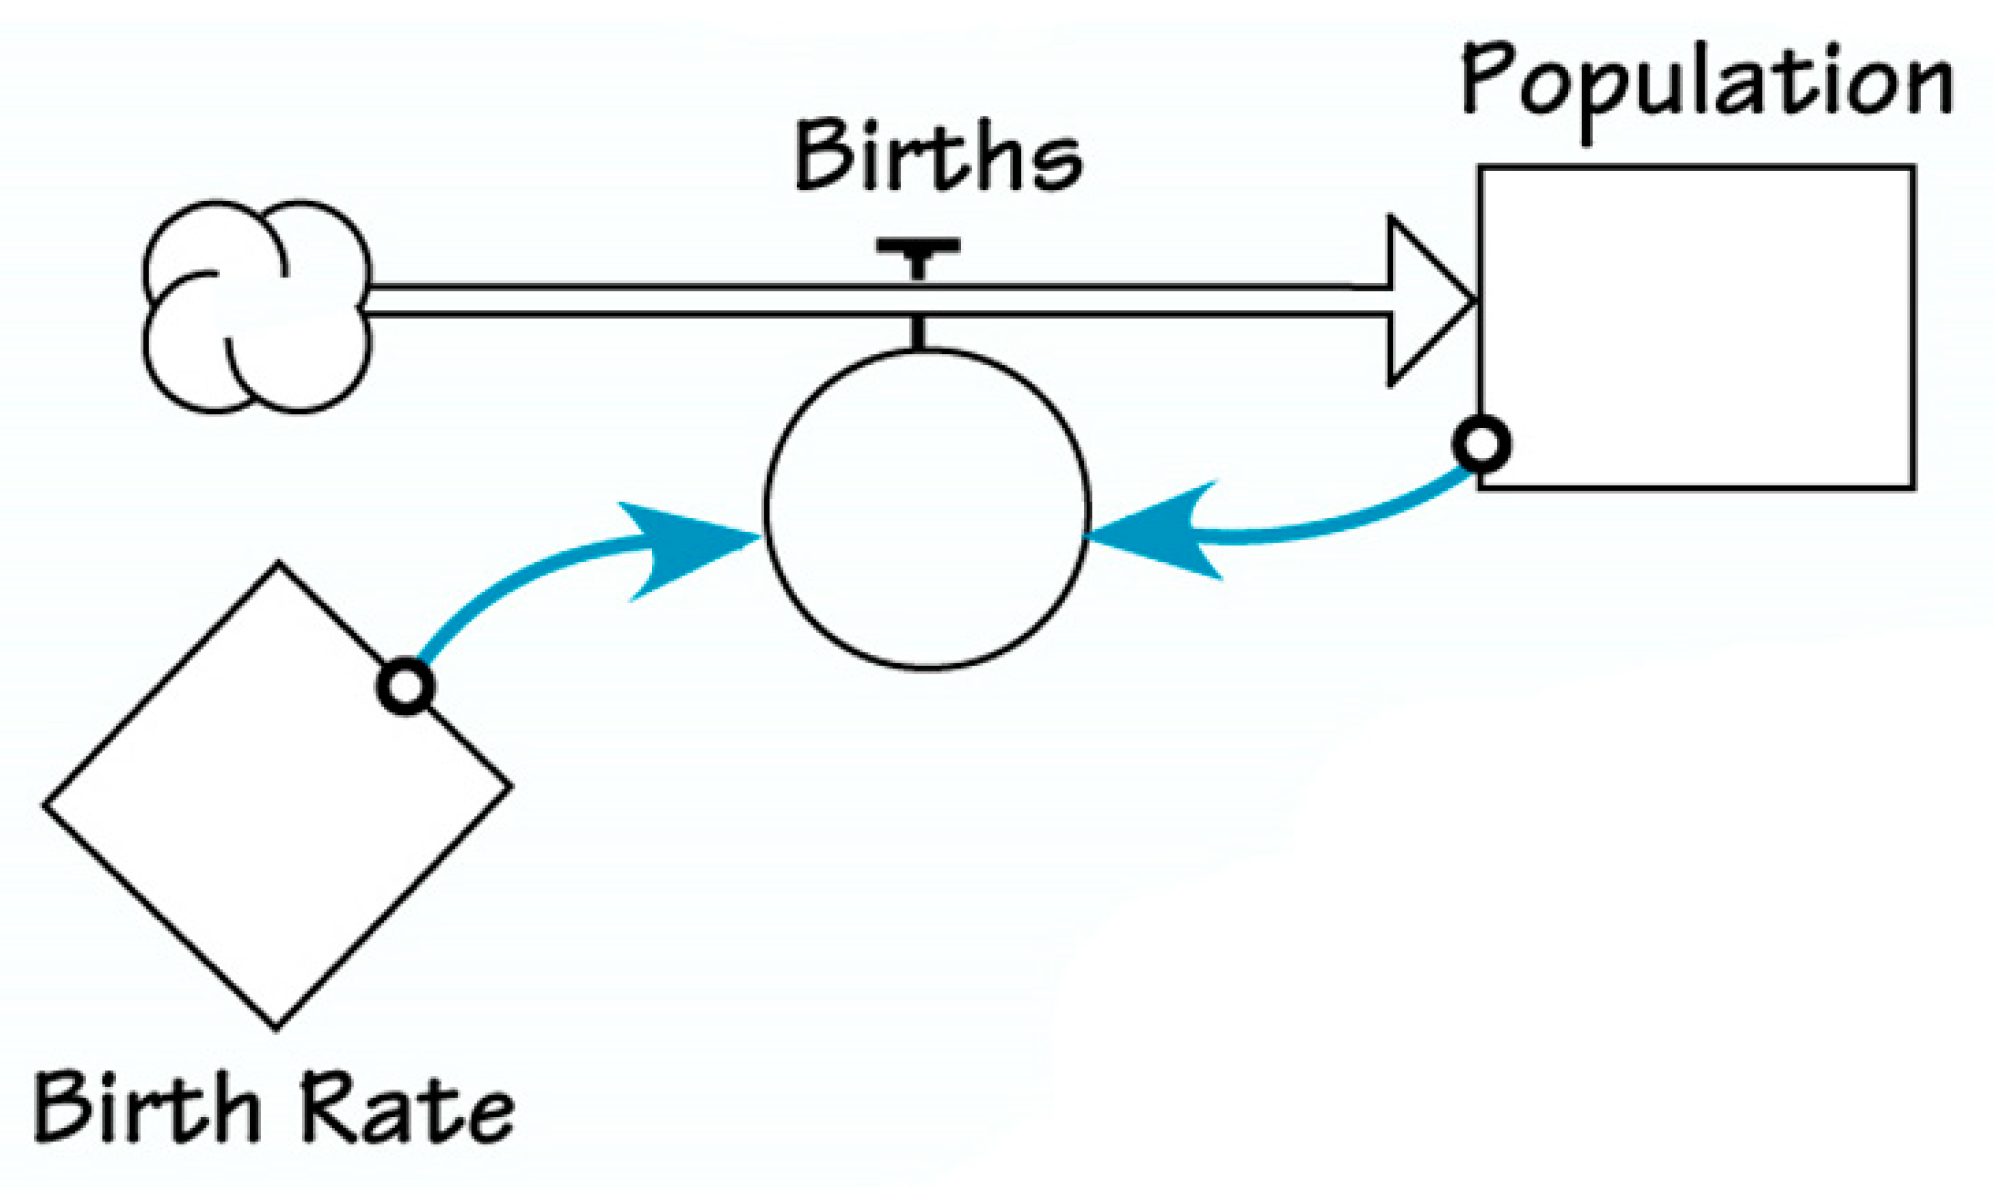
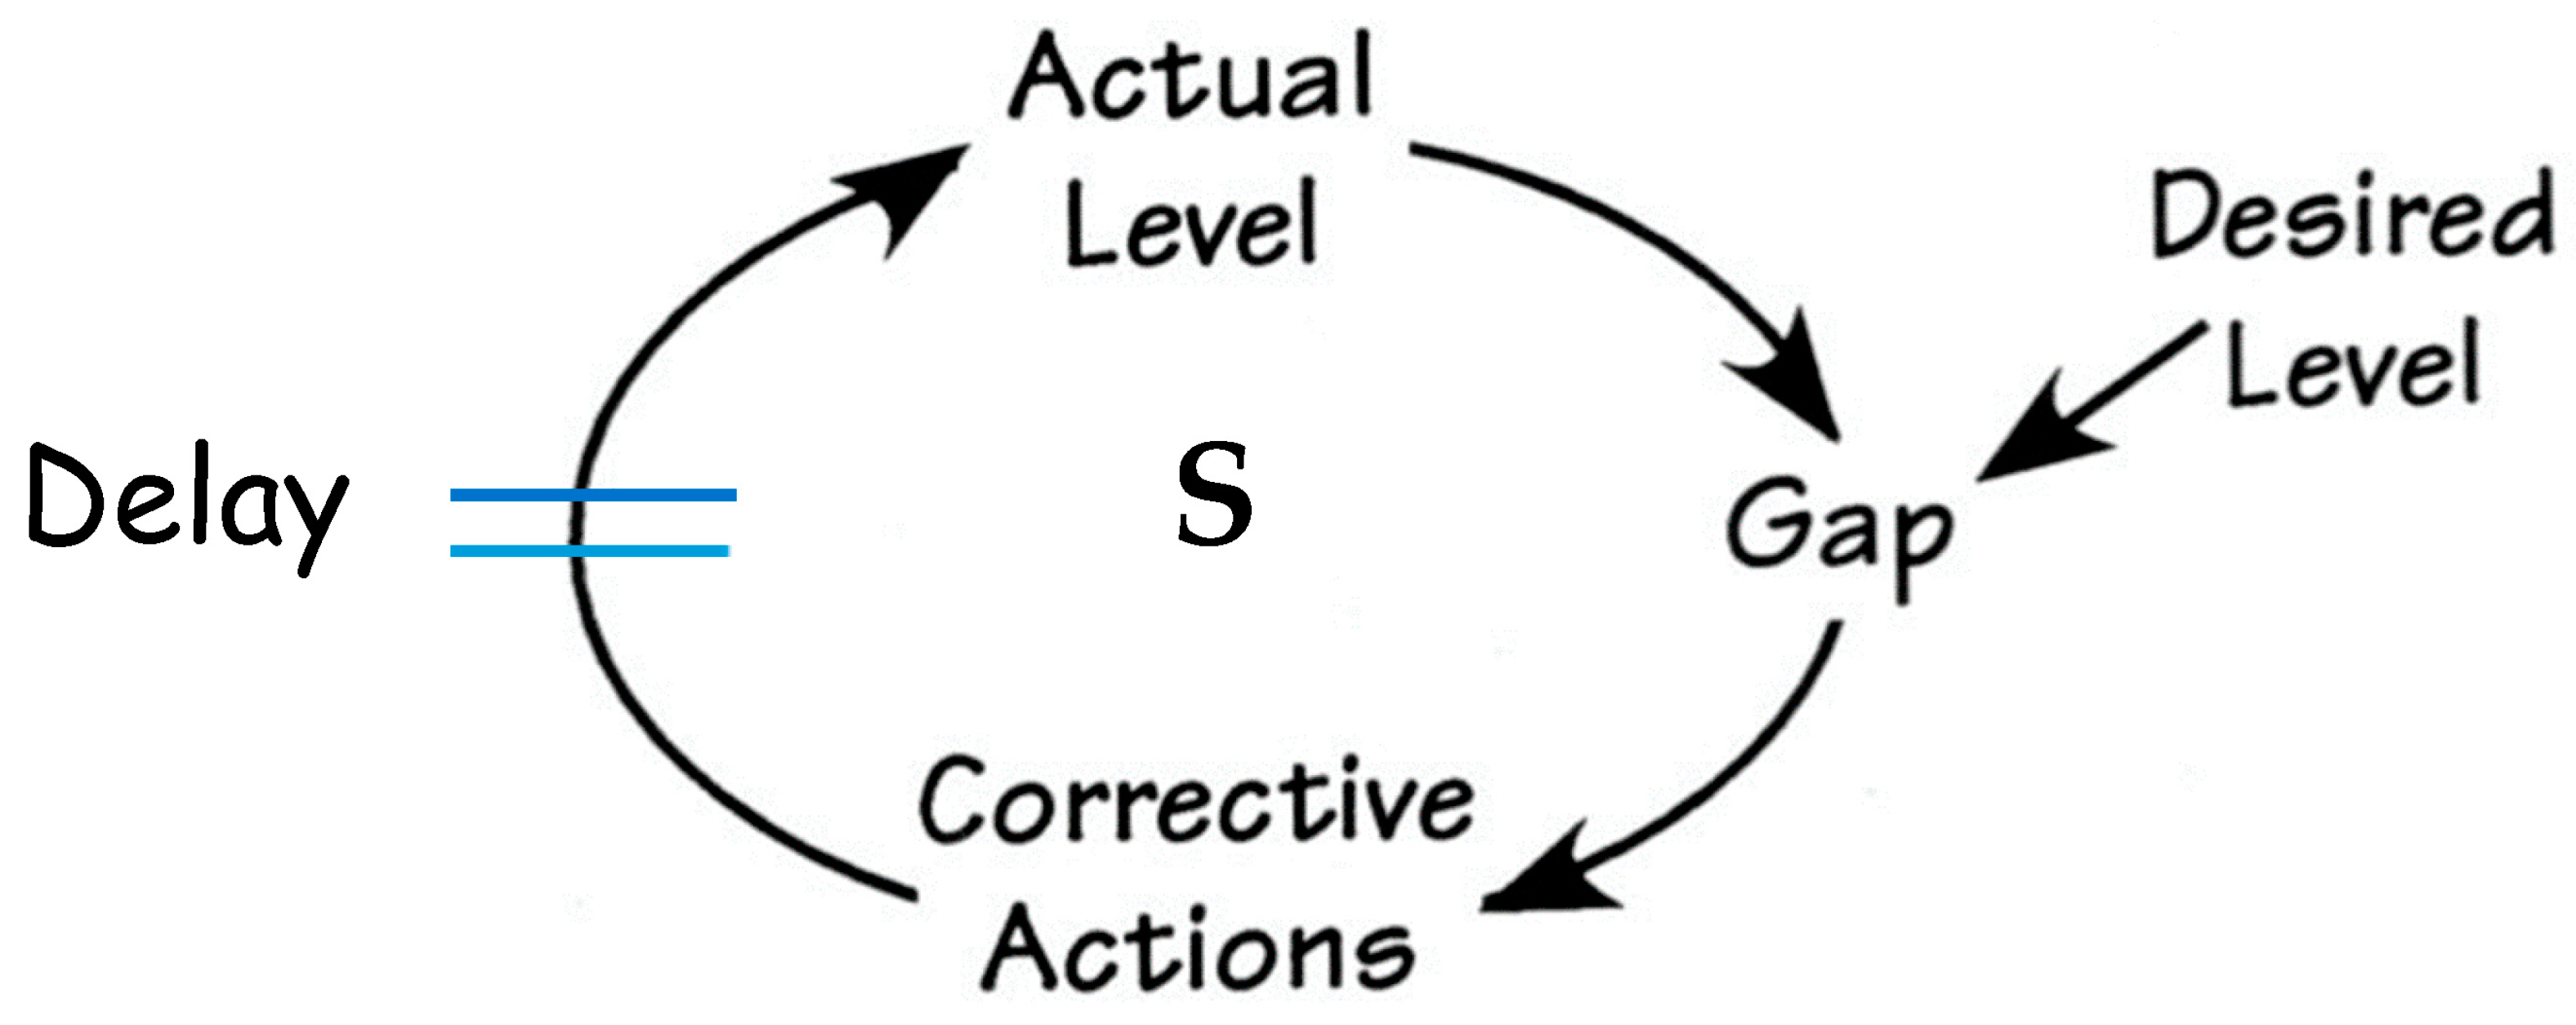
- Feedback loops,
- Identity-other distinctions,
- Part-whole systems,
- Point-view perspectives,
3. Discussion
3.1. Theoretical Underpinnings
3.2. How to Identify Systemic Structures
3.3. Examples
4. Conclusions and Future Work
Author Contributions
Funding
Data Availability Statement
Conflicts of Interest
References
- Monat, J.P.; Gannon, T.F. What Is Systems Thinking? A Review of Selected Literature Plus Recommendations. Am. J. Syst. Sci. 2015, 4, 11–26. [Google Scholar]
- Encyclopedia.com, Oxford University Press. Available online: https://www.encyclopedia.com/science-and-technology/computers-and-electrical-engineering/computers-and-computing/structure (accessed on 14 December 2022).
- Webster’s New Collegiate Dictionary; G & C Merriam Co.: Springfield, MA, USA, 1981.
- Cambridge English Dictionary; Cambridge University Press: Cambridge, UK, 2022; Available online: https://dictionary.cambridge.org/us/dictionary/english/structure (accessed on 14 December 2022).
- Dictionary.com. 2022. Available online: https://www.dictionary.com/browse/structure#:~:text=Definition%20of%20structure,building%2C%20bridge%2C%20or%20dam (accessed on 14 December 2022).
- Collins Dictionary, CollinsDictionary.com, HarperCollins Publishers, Westerhill Road, Bishopbriggs, Glasgow, Scotland, G64 2QT. Available online: https://www.collinsdictionary.com/us/dictionary/english/structure (accessed on 14 December 2022).
- Kim, D.H. Introduction to Systems Thinking; Pegasus Communications: Waltham, MA, USA, 1999; ISBN 1-883823-34-X. [Google Scholar]
- Senge, P.; Kleiner, A.; Roberts, C.; Ross, R.; Smith, B. The Fifth Discipline Fieldbook; Doubleday: New York, NY, USA, 1994. [Google Scholar]
- Meadows, D.H. Thinking in Systems: A Primer; Chelsea Green Publishing: Chelsea, VT, USA, 2008. [Google Scholar]
- Stillwell, D. Trust as a Systemic Structure in Our Organizations; The Systems Thinker; 2018. Available online: https://thesystemsthinker.com/trust-as-a-systemic-structure-in-our-organizations/ (accessed on 25 October 2022).
- Spirkin, A. System and Structure. In Dialectical Materialism; Chapter 2: The System of Categories in Philosophical Thought; Progress Publishers: Moscow, Russia, 1983; Available online: https://www.marxists.org/reference/archive/spirkin/works/dialectical-materialism/ch02-s07.html (accessed on 15 October 2022).
- Karash, R. How to See Structure. Syst. Think. 2018, 8. Available online: https://thesystemsthinker.com/how-to-see-structure/#:~:text=The%20essence%20of%20structure%20is,as%20structure%20is%20often%20hidden (accessed on 2 December 2022).
- Gharajedaghi, J. Systems Thinking—Managing Chaos and Complexity: A Platform for Designing Business Architecture, 2nd ed.; Elsevier: Burlington, MA, USA, 2006; Volume 110. [Google Scholar]
- Mcnaughton, B. System Structure (Pattern of Organization), Enterprise as a System of Systems, Customer Driven Solutions Limited©2022. Available online: https://eaasos.info/Content/EntSoS/Structure.htm (accessed on 28 November 2022).
- Austin, M. Modeling System Structure and System Behavior. In ENES 489P Hands-On Systems Engineering Projects; Institute for Systems Research, University of Maryland: College Park, MD, USA, 2012; Available online: https://user.eng.umd.edu/~austin/enes489p/lecture-slides/2012-MA-Behavior-and-Structure.pdf (accessed on 15 December 2022).
- Barile, S.; Saviano, M. Foundations of Systems Thinking: The Structure-System Paradigm. In Various Authors, Contributions to Theoretical and Practical Advances in Management. A Viable Systems Approach (VSA); ASVSA, Associazione per la Ricerca sui Sistemi Vitali. International Printing: Salerno, Italy, 2011; pp. 1–24. Available online: https://ssrn.com/abstract=2044579 (accessed on 6 April 2022).
- Anderson, V.; Johnson, L. Systems Thinking Basics From Concepts to Causal Loops; Pegasus Communications, Inc.: Cambridge, UK, 1997. [Google Scholar]
- Senge, P. The Fifth Discipline; Doubleday: New York, NY, USA, 1990; revised 2006, 52–53, 286. [Google Scholar]
- Stroh, D.P. Systems Thinking for Social Change; Chelsea Green Publishing: Chelsea, VT, USA, 2015; ISBN 978-1-60358-580-4. [Google Scholar]
- Cabrera, D.; Cabrera, L. Systems Thinking Made Simple, 2nd ed.; Plectica Publishing: Ithaca, NY, USA, 2015; ISBN 978-1-948486-02-6. [Google Scholar]
- Cabrera, D.; Cabrera, L.; Cabrera, E. Relationships Organize Information in Mind and Nature: Empirical Findings of Action-Reaction Relationships (R) in Cognitive and Material Complexity. Systems 2022, 10, 71. [Google Scholar] [CrossRef]
- Stacey, R.D. Strategic Management and Organisational Dynamics: The Challenge of Complexity, 3rd ed.; Prentice Hall: Harlow, UK, 2002. [Google Scholar]
- Stacey, R.D. The Science of Complexity: An Alternative Perspective for Strategic Change Processes. Strateg. Manag. J. 1995, 16, 477–495. [Google Scholar] [CrossRef]
- Kurtz, C.F.; Snowden, D.J. The new dynamics of strategy: Sense-making in a complex and complicated world. IBM Syst. J. 2003, 42, 462–483. [Google Scholar] [CrossRef]
- Lansing, J.S. Complex Adaptive Systems. Annu. Rev. Anthropol. 2003, 32, 183–204. [Google Scholar] [CrossRef]
- Holland, J.H. Complex Adaptive Systems. Daedalus 1992, 121, 17–30. [Google Scholar]
- Monat, J.P.; Gannon, T.F. Using Systems Thinking to Solve Real-World Problems; College Publications: London, UK, 2017. [Google Scholar]
- Lawson, H. A Journey Through the Systems Landscape; College Publications: London, UK, 2010. [Google Scholar]
- Maani, K.E.; Cavana, R.Y. Systems Thinking, System Dynamic: Managing Change and Complexity, 2nd ed.; Pearson Education Canada: Toronto, ON, Canada, 2007. [Google Scholar]
- Bellinger, G. Systems Thinking—A Disciplined Approach. Available online: http://www.systems-thinking.org/stada/stada.htm (accessed on 2 December 2022).
- Bellinger, G. Translating Systems Thinking Diagrams to Stock & Flow Diagrams. 2004. Available online: http://www.systems-thinking.org/stsf/stsf.htm (accessed on 2 December 2022).
- Calancie, L.; Anderson, S.; Branscomb, J.; Apostolico, A.A.; Lich, K.H. Using Behavior Over Time Graphs to Spur Systems Thinking Among Public Health Practitioners. Prev. Chronic Dis. 2018, 15, 170254. [Google Scholar] [CrossRef] [PubMed]
- Hoehner, C.M.; Sabounchi, N.S.; Brennan, L.K.; Hovmand, P.; Allison, K. Behavior-Over-Time Graphs: Assessing Perceived Trends in Healthy Eating and Active Living Environments and Behaviors across 49 Communities. J. Public Health Manag. Pract. 2015, 21, S45–S54. [Google Scholar] [CrossRef] [PubMed]
- Lannon, C. Structure-Behavior Pairs: A Starting Point for Problem Diagnosis. Syst. Think. 2018. Available online: https://thesystemsthinker.com/structure-behavior-pairs-a-starting-point-for-problem-diagnosis/ (accessed on 7 December 2022).
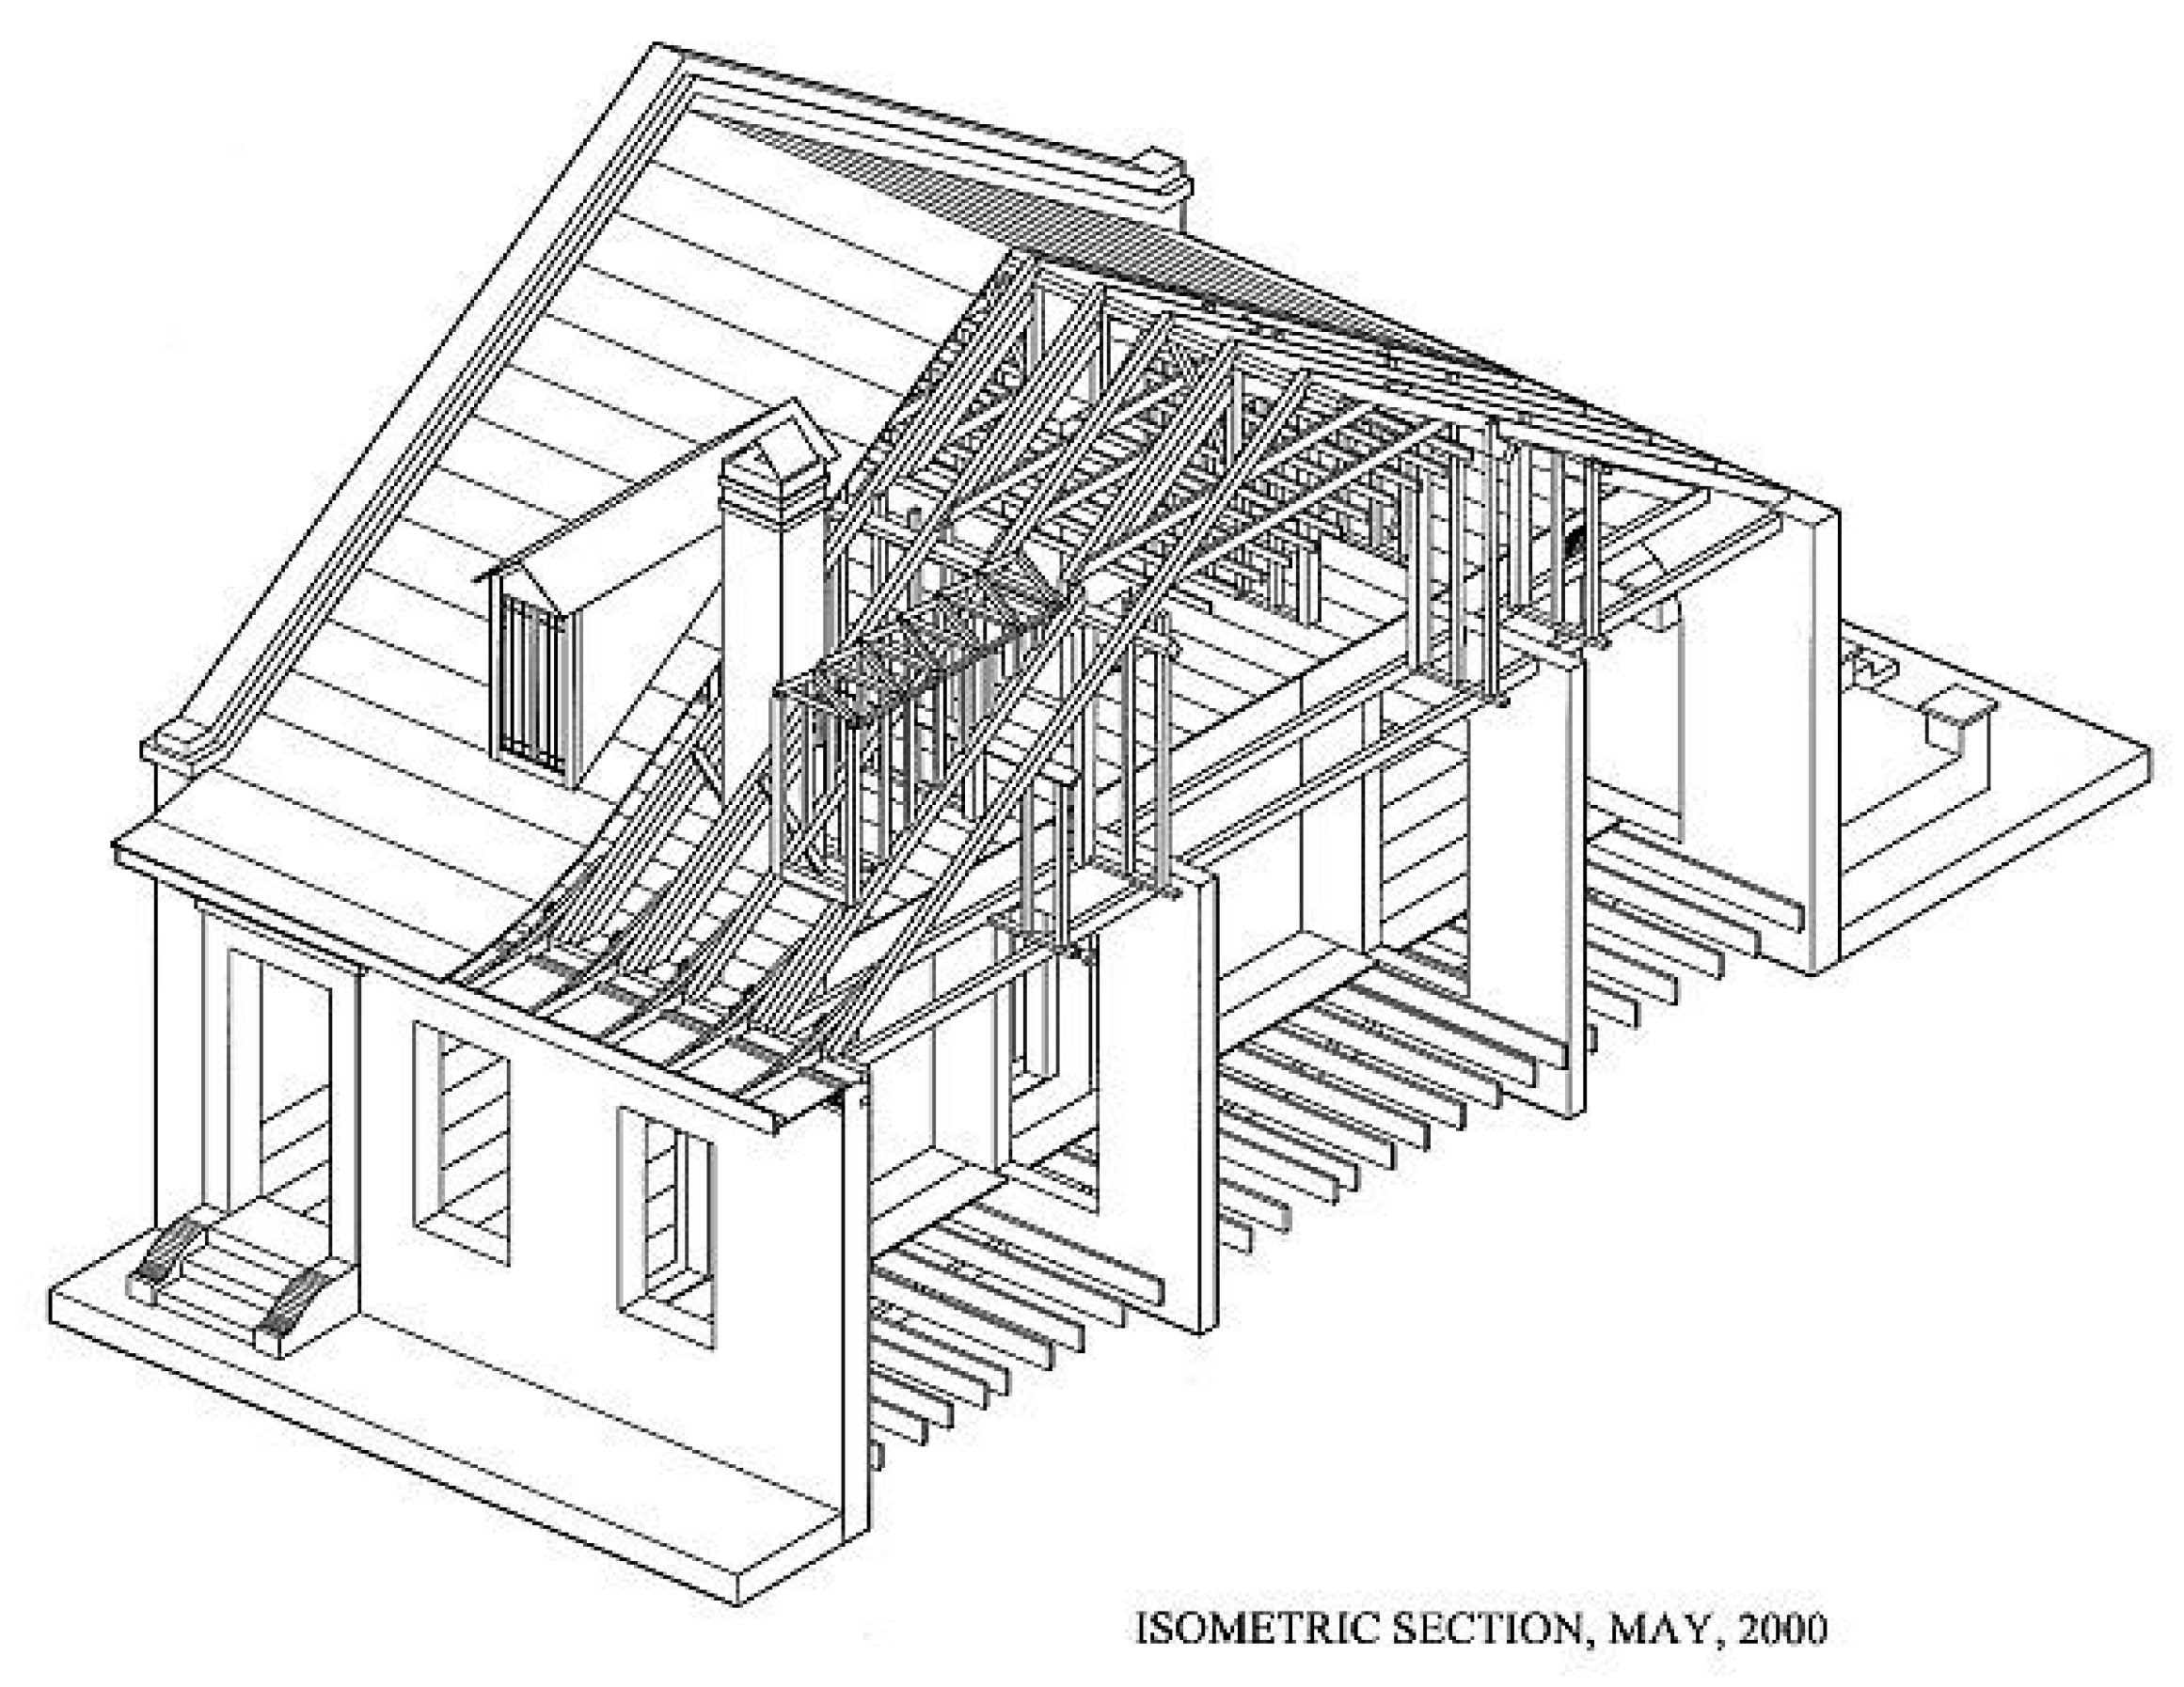
- LOC’s Public Domain Archive, Cousin Cottage, Public Domain, Library of Congress. Available online: http://www.loc.gov/rr/print/res/114_habs.html (accessed on 2 December 2022).
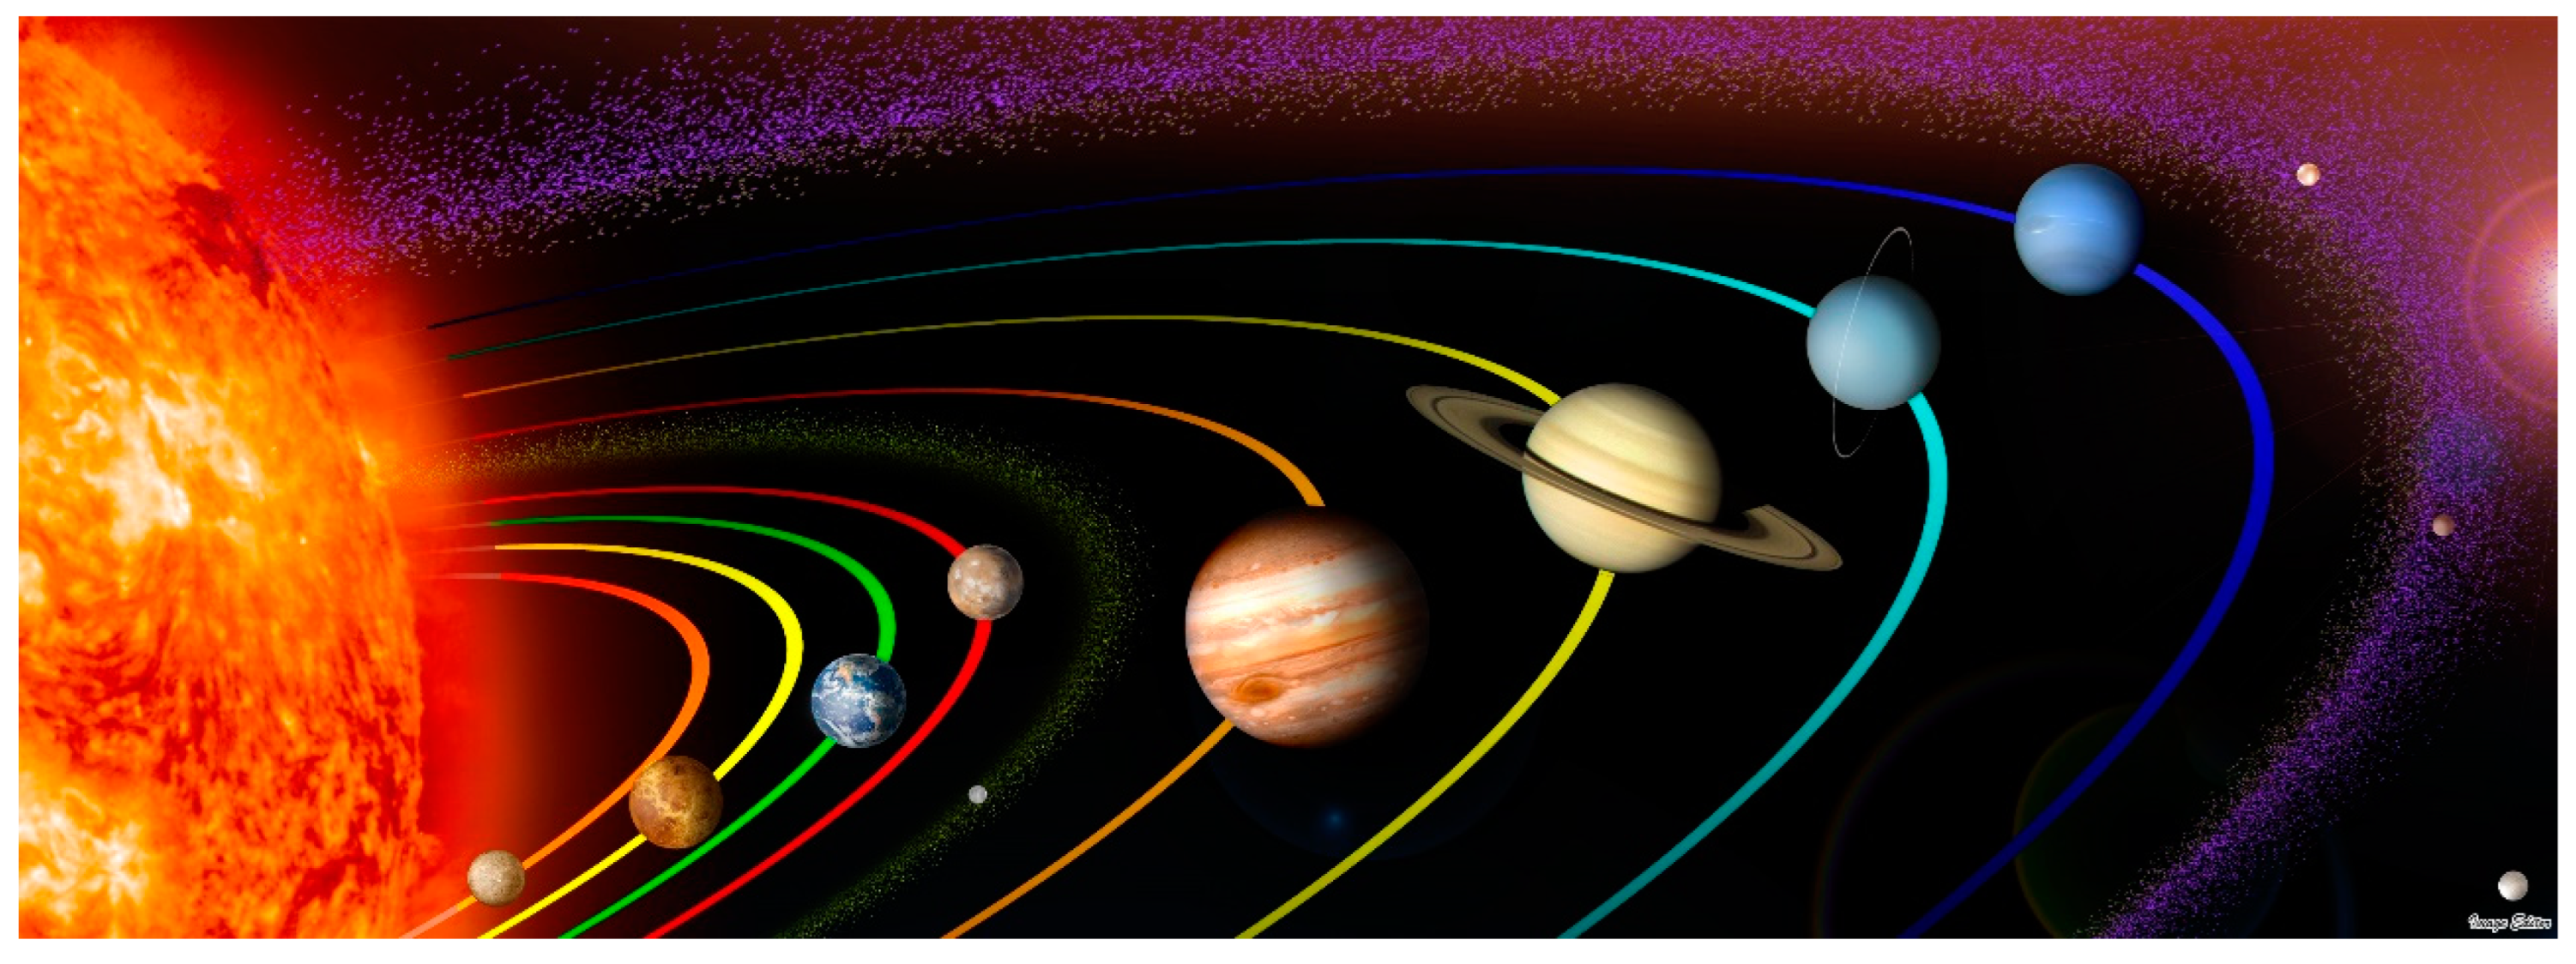
- The Solar System PIA10231, mod02, Licensed Under Creative Commons Attribution 4.0 International CC by 4.0, Flickr. This Image Is Modified from NASA’s Photojournal Home Page Graphic Released in October 2007, catalog ID: PIA10231 (NASA/JPL). Available online: https://www.flickr.com/photos/11304375@N07/2818891443 (accessed on 17 October 2022).


| Depiction Method | Type of Structure Described |
|---|---|
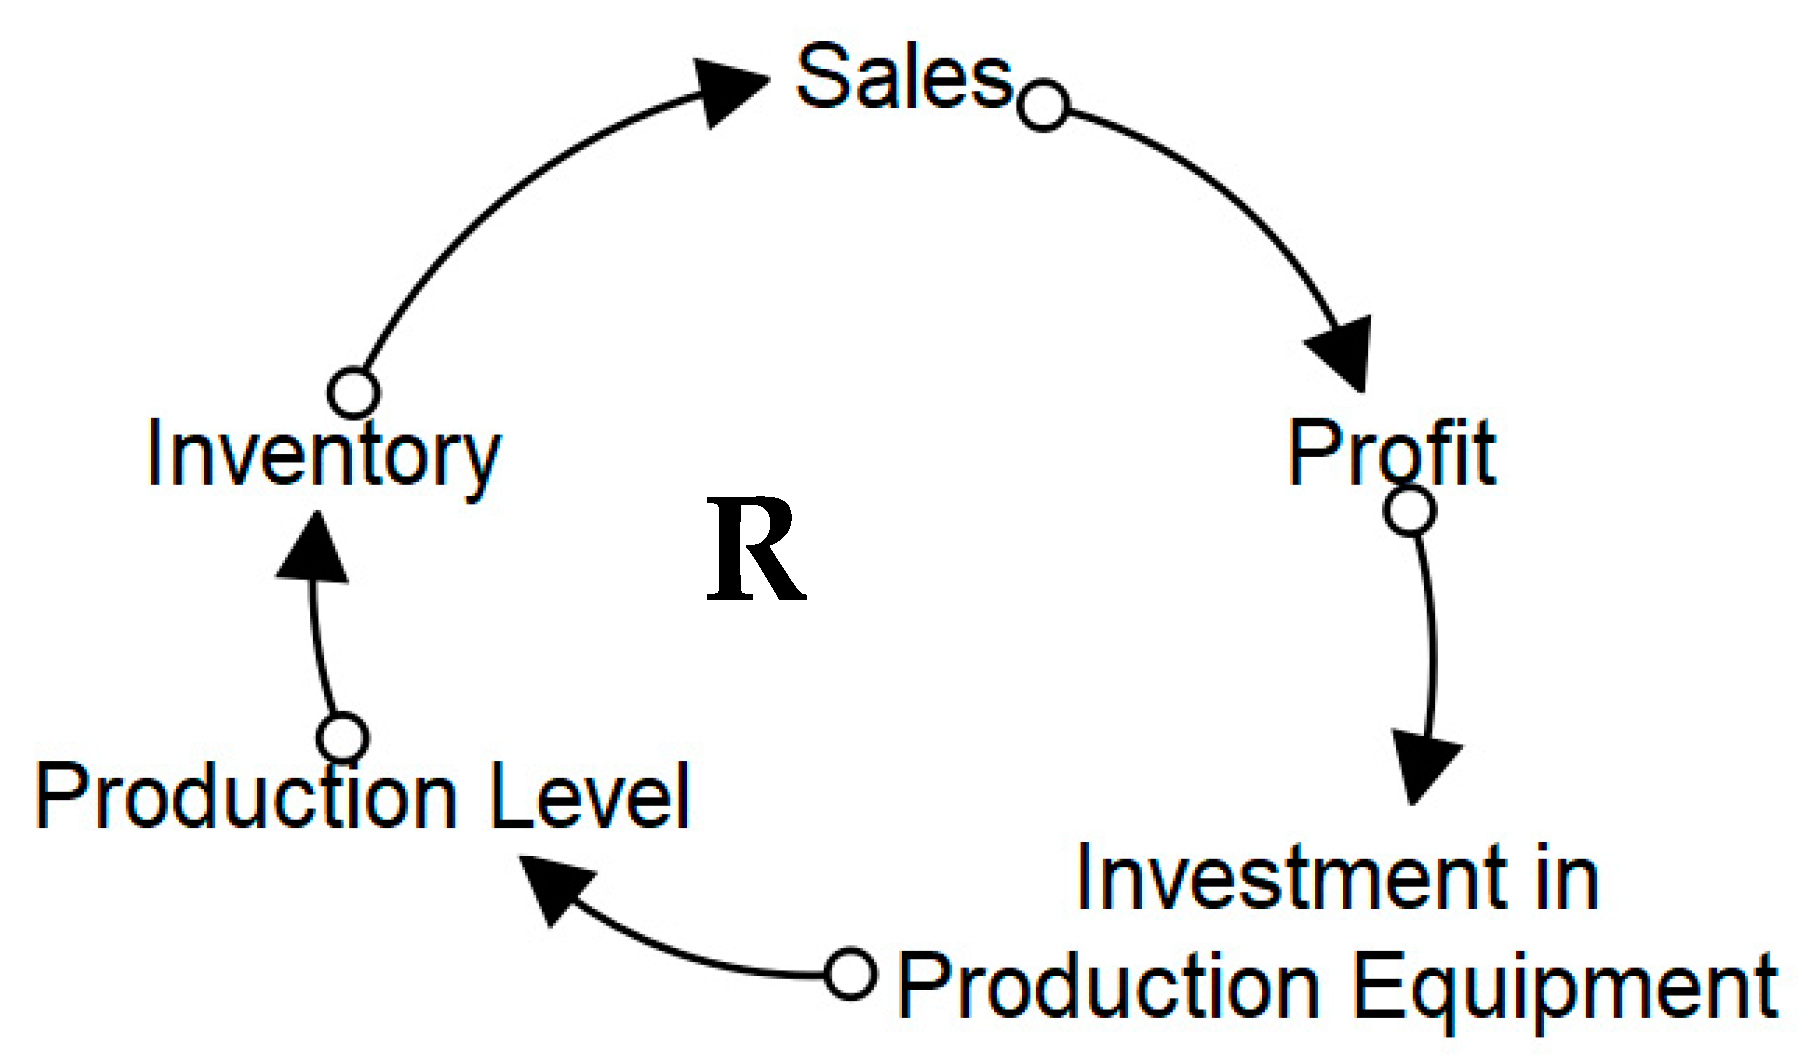
| Causal Loop Diagram | Cause-and-Effect |
| Stock-and-Flow Diagram | Cause-and-Effect |
| Matrix (Incidence Matrix, N2 Diagram, SV-3 System–System Matrix, System Interrelationship Matrix) | Varies: Physical, sequential, cause-and-effect |
| Process Flow Diagram | Process Flows |
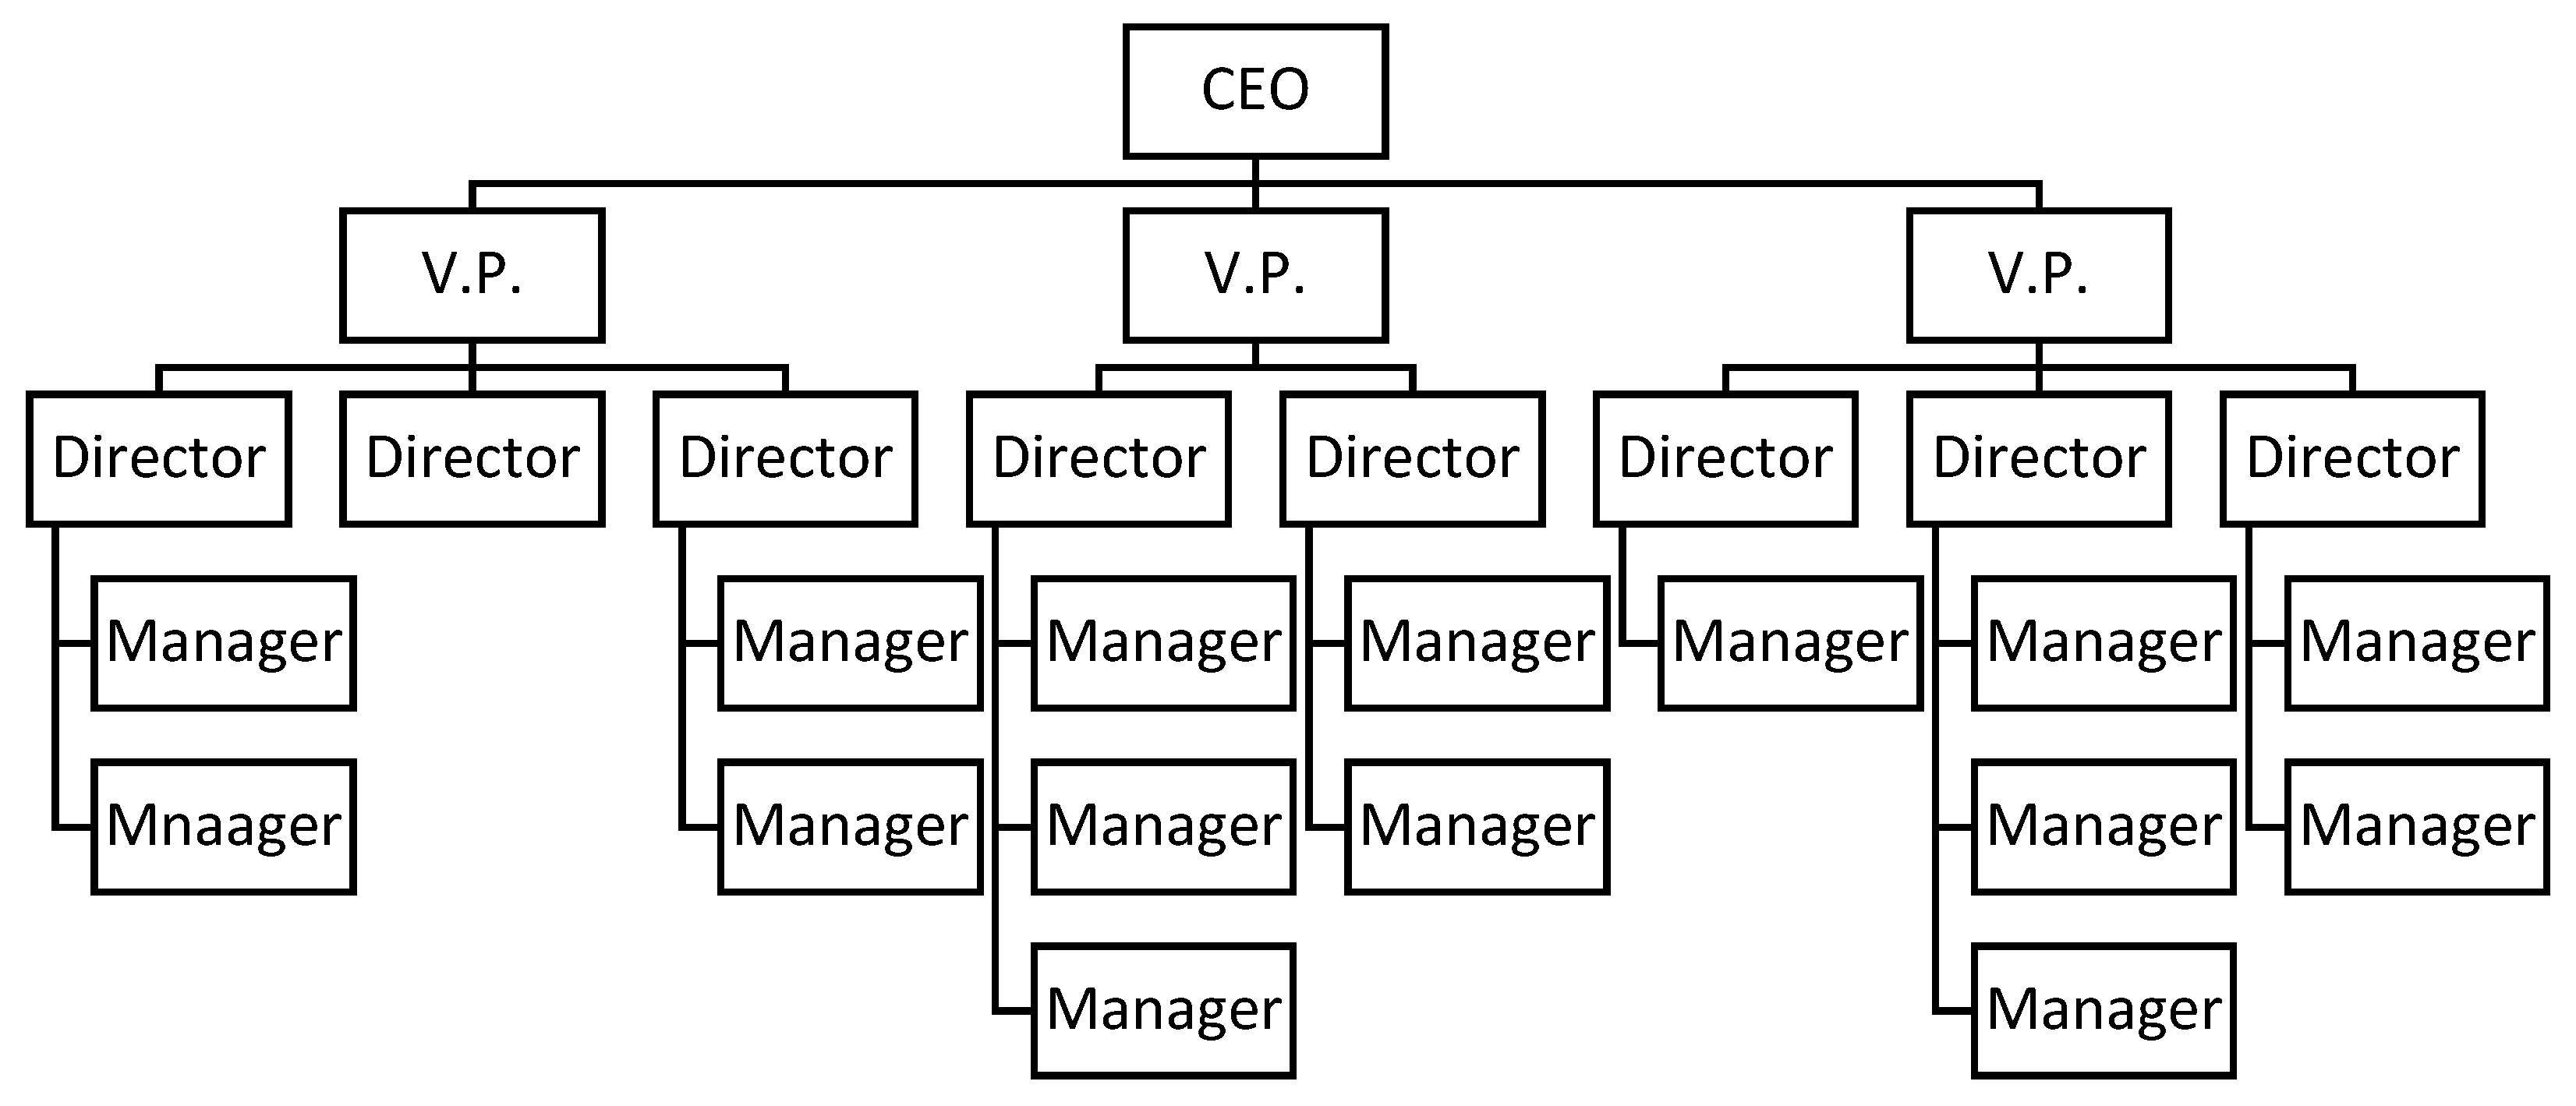
| Hierarchy Diagram | Reporting, authority, control |
| Sequence Diagram | Sequential |
| Sketches of Physical Arrangement | Geometric |
| System Complexity | Explanation |
|---|---|
| Simple | Clear relationship between cause and effect |
| Complicated | Several well-defined relationships between cause and effect |
| Complex, Complex Adaptive | Exact cause-and-effect relationships are unknown and possibly unknowable; or may be perceived only retrospectively |
| Chaotic | No cause-and-effect relationships or relationships are unclear |
Disclaimer/Publisher’s Note: The statements, opinions and data contained in all publications are solely those of the individual author(s) and contributor(s) and not of MDPI and/or the editor(s). MDPI and/or the editor(s) disclaim responsibility for any injury to people or property resulting from any ideas, methods, instructions or products referred to in the content. |
© 2023 by the authors. Licensee MDPI, Basel, Switzerland. This article is an open access article distributed under the terms and conditions of the Creative Commons Attribution (CC BY) license (https://creativecommons.org/licenses/by/4.0/).
Share and Cite
Monat, J.P.; Gannon, T.F. The Meaning of “Structure” in Systems Thinking. Systems 2023, 11, 92. https://doi.org/10.3390/systems11020092
Monat JP, Gannon TF. The Meaning of “Structure” in Systems Thinking. Systems. 2023; 11(2):92. https://doi.org/10.3390/systems11020092
Chicago/Turabian StyleMonat, Jamie P., and Thomas F. Gannon. 2023. "The Meaning of “Structure” in Systems Thinking" Systems 11, no. 2: 92. https://doi.org/10.3390/systems11020092
APA StyleMonat, J. P., & Gannon, T. F. (2023). The Meaning of “Structure” in Systems Thinking. Systems, 11(2), 92. https://doi.org/10.3390/systems11020092