

The Dynamics of China’s Collaborative Innovation Network in Agricultural Biotechnology: A Spatial-Topological Perspective
1
School of Economics, Shandong Normal University, Jinan 250358, China
2
Academy for County Economy Research, Shandong Normal University, Jinan 250358, China
3
Institute of Agricultural Economics and development, Chinese Academy of Agricultural Science, Beijing 100081, China
Systems 2023, 11(2), 73; https://doi.org/10.3390/systems11020073
Submission received: 3 December 2022
/
Revised: 24 January 2023
/
Accepted: 25 January 2023
/
Published: 1 February 2023
(This article belongs to the Special Issue Research Trends on the Development of Integrated and Robust Social Development Management Systems)
Abstract
:This paper explores the dynamics of the collaborative innovation network of China’s agricultural biotechnology, from a spatial-topological perspective. The data pertain to a collection of patent applications jointly filed by universities, research institutes and enterprises on the mainland of China during 1985–2017. Using the logistic model, we first identify the developing phases of China’s agricultural biotechnology. By dismantling the collaborative innovation network into spatial and topological networks, the dynamics are analyzed from these two dimensions at the three levels of nodes, edges and whole network. The results indicate that with the technology developing from the introduction to the growth-to-maturity phase, the collaborative innovation network exhibits dynamics as follows: as the scale expands, collaborations in the network are concentrated core cities, while dispersing to more innovators; enterprises replace universities and become the main innovation forces; the network attributes of small-world, scale-free and core-edge structures are apparent. Multi proximity factors including geographical, cognitive and organizational, play key roles in driving the dynamics, and the main factor evolves from geographical proximity to cognitive as well as organizational proximity.
1. Introduction
Since the 1990s, with the development of the knowledge economy and the deepening of global innovation, networking innovation has gradually replaced hierarchical innovation [1,2], which has led to the change of innovation mode. Since then, the collaboration innovation network has attracted more and more attention as an important carrier and an effective way to promote the sharing of innovation elements and the collaboration of innovators [3]. Both new regionalism and the school of global production networks emphasize the key role of the collaboration innovation network in knowledge flow and innovation cooperation [4,5,6].
In view of the changes in innovators and their cooperative relationships, dynamic evolution has become one of the basic features of the collaboration innovation network [7,8]. The research on the dynamics of the collaboration innovation network has become an important topic for innovation economists and a great deal of in-depth research has been conducted. Existing studies can be roughly divided into three phases. In the first phase, research on the collaboration network was mainly conducted by regional economists, who studied industrial clusters to carry out research on innovation clusters. Due to the lack of a quantitative method, scholars can only use qualitative methods to analyze the formation and dynamics of the collaboration network among industrial clusters. For example, Pyke analyzed both the supply-demand network and the informal network of Third Italy [9]; Saxenian conducted a comparative analysis on the pattern of the regional collaboration networks in Silicon Valley and Highway 128 in the United States [9]; Liyanage examined the processes by which innovation clusters are formed in research collaborations by analyzing the work programs of 51 Australian cooperative research centers [10]. As social network analysis (SNA) was introduced into regional economics and innovation economics, the research of the collaborative innovation network entered the second phase. With the help of software such as Ucinet and Gephi, researchers can quantitatively analyze the interactive relationship between innovators, thus making up for the low standardization and lack of in-depth analysis on the evolution process of the network and the internal collaborative relationships in the former phase [11]. Moreover, in this phase, a large number of scholars conducted research on the collaborative innovation network through the data of jointly-applied-for patents and published papers. By measuring centrality, structural holes and other indicators, some scholars identified core notes and their dynamics [12,13,14,15], while some other scholars analyzed and characterized the network’s organizational form and evolution trajectory from the level of overall network through the measurement of the average path length, cluster coefficient and other indicators [16,17,18]. In recent years, with the rise of research on the evolution of multi-cluster networks, research into the collaborative innovation network entered the third phase. Studying collaborative innovation networks on a larger scale, such as cross-clusters, became a symbol of this phase [19,20]. Based on the panel data of 52 aerospace-industry clusters, Turkina et al. employed community detection to analyze the structure and dynamics of the collaborative innovation network among companies within and among clusters [21]. Using the method of dominant path, Heinisch et al. explored the spatial pattern of patent citations within and among 35 clusters in 1986–2006 in the United States, and evaluated the role of geographic factors in the evolution of technology, indicating that the collaborative innovation network was evolving from within to between clusters [22]. Although there have been many studies on the dynamics of the collaboration innovation network, most of them have focused on the networks formed by innovators in certain geographic areas from a geographic perspective; only a few have paid attention to the collaboration innovation network formed in a certain technical field.
To fill the knowledge gap, this paper focuses on agricultural biotechnology in China, and explores the dynamics of China’s agricultural-biotechnology collaborative innovation network from a spatial and topological perspective. Agricultural biotechnology refers to the biotechnology applied to agricultural production, including the use of gene modification, fermentation, enzyme engineering, molecular breeding and other technical means to improve the characteristics of animals, plants and microbes, cultivate new varieties, and produce biological pesticides, veterinary drugs and vaccines [23,24]. The enhancement of agricultural biotechnology innovation has become the fundamental way to ensure food security within a background of increasingly severe resource-constraints [25,26]. In order to promote agricultural-biotechnology innovation, China attaches great importance to strengthening collaborative innovation, especially in the form of the collaborative innovation network, since the function of which is to further improve innovation rather than common forms of collaborative innovation, and has been widely recognized [27,28,29]. In the “11th five-year plan”, the National Development and Reform Commission within the Ministry of Science and Technology specially formulated the biotechnology-development plan, emphasizing collaborative innovation at the national level. In 2008, China launched the implementation of a major special project for GM to provide key support for cross-unit and cross-regional collaborative innovation. In 2022, the Ministry of Agriculture issued the General Plan for National Breeding to encourage universities, institutes and enterprises to carry out joint R&D in the form of a network. Due to the continuous policy guidance, China’s agricultural-biotechnology innovations carried out using networking collaboration have become increasingly active, which is reflected in the output of relevant patents. In April 1985, when China began to implement the Patent Law, there were only 82 agricultural-biotechnology patents jointly applied for by more than two innovators, but in 2017 more than 8000 patents were jointly applied for via networking collaboration.
To achieve the aim of this paper to explore the dynamics of China’s agricultural-biotechnology collaborative innovation network from a spatial and topological perspective, we employ the data from a collection of patent applications jointly filed by universities, research institutes and enterprises on mainland China during 1985–2017. Using the logistic model, the history of China’s agricultural biotechnology innovation is divided into the three phases of introduction (1985–2007), growth (2008–2015) and maturity (2016–2017). By dismantling the collaborative innovation network into spatial and topological networks, using Ucinet and Arcgis, the dynamics are analyzed from these two dimensions at the three levels of nodes, edges and the whole network, separately. From the perspective of a spatial network, its scale has expanded, while collaborations among cities are concentrated. Meantime, the expansion of the topological network is accompanied by the dispersing of collaboration among innovators. With the evolution above, the leadership of enterprises in the network is being strengthened, while universities’ leadership is being weakened; moreover, the network attributes of small-world, scale-free and core-edge structure are increasingly significant. Lastly, geographic proximity and cognitive proximity, as well as organizational proximity are important factors driving the dynamics of collaborative innovation, and organizational proximity is gradually replacing geographic proximity as the main driving factor.
We make three main contributions to the existing literature. Firstly, by retrieving the applicants’ addresses, we dismantle the collaborative innovation network into two networks; one is the spatial network composed of the cities where the inventors are located, and the other is the topological network composed of the inventors themselves, which is rare in the existing literature and can help us to explore the dynamics of the network from spatial and topological dimensions. Secondly, unlike previous studies that mainly focus on nodes and overall network while neglecting the edges connecting nodes in the network, we recognize the importance of edges, which represent the collaborative relationships among innovators, and we conduct this research from the three levels of nodes, edges and overall network. Lastly, as a data contribution, we creatively realize the effective identification of agricultural-biotechnology-patent IPCs by mapping biotechnology-related IPCs onto more detailed agricultural areas, which overcomes the difficulties of verifying agricultural-biotechnology patents due to blurred borders, and provides inspiration for other scholars.
2. Methods
2.1. Data Collection
The unique data used in this paper pertain to patent applications obtained through Patsnap, a database that covers 140 million patents from 116 countries and regions in the world and is updated weekly. Since “agricultural biotechnology” is a general term for a large class of technologies, with no clear definition, it is difficult to construct the search with specific words in titles, abstracts and keywords of patents, as in other literature. In this paper, we retrieve patents related to agricultural biotechnology with the International Patent Classification Number (IPC), which is assigned to a patent based on the detailed field it belongs to, at the stage of application. Since agricultural biotechnology is the area of biotechnology involving applications for agriculture [30], we take three steps to identify the IPCs which cover all the detailed fields of agricultural biotechnology. First, we draw on the methods used by OECD and EU to identify biotechnology-related IPCs [31]. Second, Xu’s method is employed to define the subdivisions of agriculture with the help of Web of Science (WOS) and Essential Science Indicators (ESI) [32]. Third, we map each IPC related to biotechnology to each subdivision of agriculture; after consulting the opinions of experts in the field of agricultural biotechnology, the IPCs related to agricultural biotechnology are finally identified (Figure 1, step 1).
The time for patent search is from 1985 to 2017. The reason for setting 1985 as the starting point is that China implemented the Patent Law of the People’s Republic of China on 1 April 1985 and that is the beginning of patent application in China; since it takes 18–48 months to disclose a patent after its application, 2017 is set as the deadline. Hence, the query sentence is as follows: IPC = (A01H or A01N or A61K38/00 or A61K39/00 or A61K48/00 or A23K or C05F11/08 or C05F15/00 or C07K14/415 or C07K14/195 or C07K14/37 or C12M or C12N or C12Q or C12S or C12P) AND TIME = (1985–2007) AND PN = CN. The types of patent in this study includes invention patents and utility models. After searching, 325,500 agricultural-biotechnology patents applied for in China are retrieved (Figure 1, step 2).
2.2. Identification of the Phases in Life Cycle
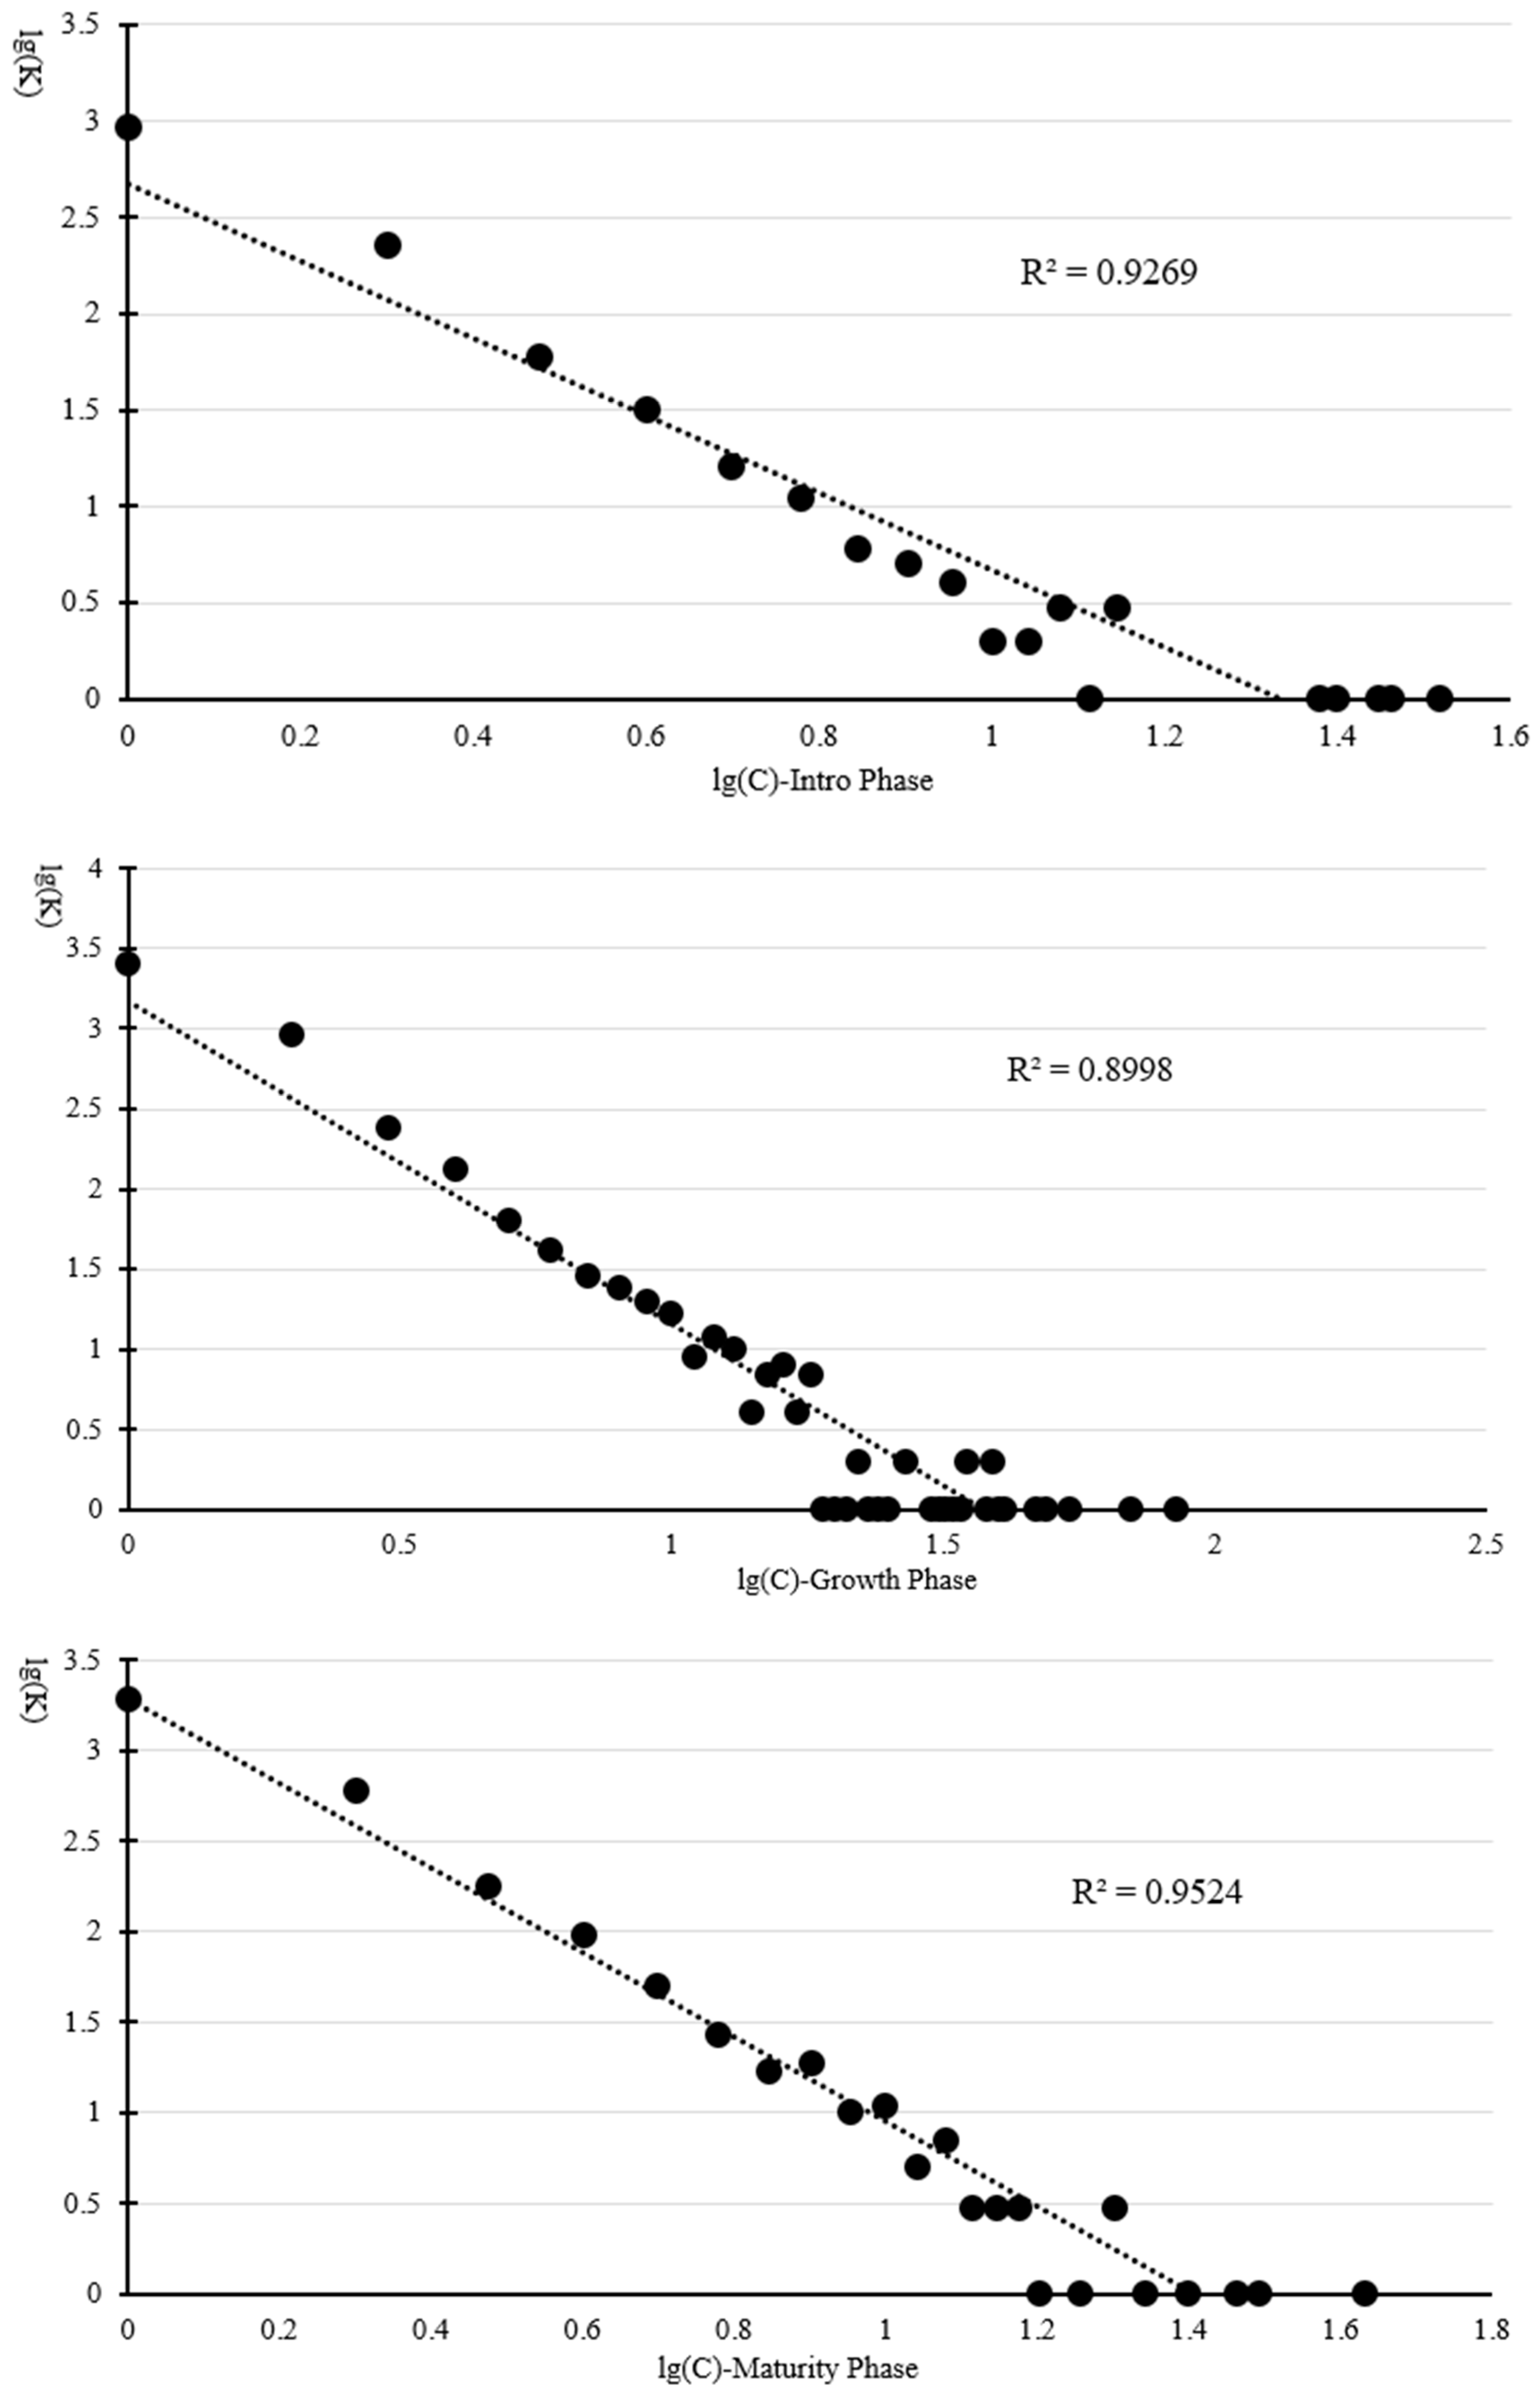
The technology life-cycle is a model of technology based on growth theory and generally contains four phases: introduction, growth, maturity and decline [33]. Since the life cycle is for all patents rather than patents jointly applied for, we use the retrieved 325,500 patents to analyze and identify the life cycle (Figure 1, step 3). With the help of the logistic model and software Loglet Lab 4.0, the growth-curve fitting and related parameter-calculation are conducted. The logistic model is defined as follows:
where is the cumulative number of patents; is the slope of the growth curve during a specific year; represents the time at the inflection point with the highest slope of the growth curve; corresponds to the limit of the cumulative number of patents. The introduction phase is recognized with < 10%* while the decline phase is > 90%* and the phases between them are growth and maturity.
2.3. Data Processing and Network Construction
The first step in data processing is the screening of patents. Patents filed by one applicant are eliminated and then patents with more than one applicant are excluded successively, to facilitate the obtaining of applicants’ geographical information. Only those where the applicants are located on mainland China are retained, to avoid the difficulties of obtaining information from Hong Kong, Macao and Taiwan. After screening, 13,758 patents are retained (Figure 1, step 4).
The second step is to form undirected collaborations. We treat each collaboration as undirected collaboration between two innovators. Permutations and combinations are used to treat collaborations established by three or more innovators. After processing, 17,220 undirected collaborative-relationships are formed (Figure 1, step 5).
The third step is the acquisition of geographical information for each innovator and collaboration. According to their geographical locations acquired through Python from Baidu Maps, the innovators are classified into various local cities. Based on the cities and corresponding provinces, the scale of collaborations among innovators are divided into local, regional and inter-provincial collaborations, which refer to innovators in the same city, in one province but different cities, and two provinces, respectively. Then, ArcGIS is used to calculate the spatial distance of each collaboration (Figure 1, step 6).
The fourth step is the construction of a collaborative innovation network from two dimensions. On the basis of the geographical information of the innovators and collaborations, a spatial collaborative-innovation-network is constructed through ArcGIS. Then the topological network is obtained using social network analysis and Ucinet, after the collaboration data has been transformed into a matrix (Figure 1, step 7).
2.4. Topological-Network Analysis
Both the spatial network and the topological network are analyzed from the perspective of nodes, edges and overall network (Figure 1, step 8). Topological-network analysis involves the following indicators:
2.4.1. Analysis of the Nodes
The nodes represent the innovators in the collaborative network. Degree centrality (DC) is the core indicator for measuring the centrality of nodes in the network. The formula for calculating degree centrality is as follows:
where, in the weighted network, is the number of connections between nodes and , while in the binarized network it is the number of nodes connected to node .
Next, we take a horizontal comparison of degree centrality in different phases, to analyze the dynamics of nodes. In order to facilitate horizontal comparison, degree centrality needs to be absolute, as follows:
where and are the absolute degree centrality (Ab-DC) and degree centrality, respectively, and is the total number of nodes or connections in the network.
2.4.2. Analysis of the Edges
The edges in the collaborative network represent the collaborations established among the nodes. In this paper, edges are analyzed in terms of type, strength, scale, and spatial distance.
2.4.3. Analysis of Overall Network
In the first step, we analyze the cohesiveness of the network by measuring two indicators of average degree and density. Average degree refers to the average number of connections of all nodes in the network. In the weighted network, the greater the average degree, the more the collaborations established between nodes on average, further indicating the higher collaboration-intensity of the network, while with a binarized network, greater average degree means that the average number of nodes that establish collaboration with one node is higher, and the network is denser. The calculation formula for average degree is as follows:
where is the number of collaborations between nodes and , and is the number of nodes in the network. In a binarized network, is 0 or 1, while in a weighted network is the actual number of collaborations between nodes and .
Density is measured by the ratio of the actual total collaborations existing in the network to the theoretical maximum. The greater the density, the closer the number of actual collaborations between network nodes is to the maximum theoretical value, indicating the network is more cohesive. The calculation formula of density is as follows:
where is the number of collaborations between nodes and in the network, and is the number of nodes in the network. Since density is limited to computing binarized-networks, the value of is either 0 or 1.
In the second step, centralization is measured to analyze the degree of concentration of the network to one or several core-nodes and then to analyze whether there is a trend where a few nodes control most or all resources in the network. Generally speaking, the smaller the centralization, the more dispersed the entire network; on the other hand, the higher the centralization, the more concentrated the network is. The calculation formula of centralization is as follows:
where is the maximum value of degree centrality among all nodes in the network and is the degree centrality of node .
In the third step, the attributes of the network as a complex is explored. First, the average path length and clustering coefficient are measured, to determine whether the network has a small-world attribute. Afterwards, the distribution statistics of all nodes are processed on the basis of previous calculation of the nodes’ degree centrality, to explore the scale-free attribute of the network. The formula for calculating the average path length is as follows:
where is the shortest path length between nodes and , and is the number of nodes in the network.
The formula for calculating the clustering coefficient of a single node is as follows:
where is the actual number of edges connected among the nodes that have direct connection to the node , and is the maximum value of the edges in the local network containing node . In a network composed of nodes, the overall clustering coefficient is the average value of the clustering coefficients of all nodes.
3. Results
3.1. Identification of the Phases in Life Cycle
Figure 2 shows the fitted S-curve of China’s agricultural biotechnology. The determination coefficient R2 is 0.9866, which demonstrates that the degree of fitting simulation is relatively high and the curve is basically close to the actual development of China’s agricultural biotechnology. According to the calculation of LogletLab4.0, the total number of agricultural-biotechnology patents applied for in China accounted for approximately 10% of the saturation value from 1985 to 2007, which demonstrates that China’s agricultural biotechnology is in the introductory phase. The inflection point appeared in 2016, indicating the growth-phase located at 2008–2015. The period 2016–2017 is the first two years of the maturity phase, since the predicted growth-time is 24 years.
The life-cycle phases identified above basically coincide with several landmarks in the development of China’s agricultural biotechnology. On 1 April, 1984, the Patent Law of the People’s Republic of China was implemented. Over the next 22 years, China continued to increase its support for agricultural biotechnology R&D, and precisely calculated, the support basically doubled every five years [34]. During this period, the average annual-growth-rate of patent applications for agricultural biotechnology amounted to 15%. China launched a major project in support of genetically modified crops to enhance the role of biotechnology in boosting food security in 2008. In that year, the funding for agricultural biotechnology doubled compared to that of 2005 and was accompanied by another increase of 66% in 2010, compared to 2008 [34]. It can be concluded that the unprecedented strengthening of R&D promoted the rapid development of agricultural biotechnology.
3.2. Dynamics of the Spatial Network
3.2.1. Dynamics of the Cities
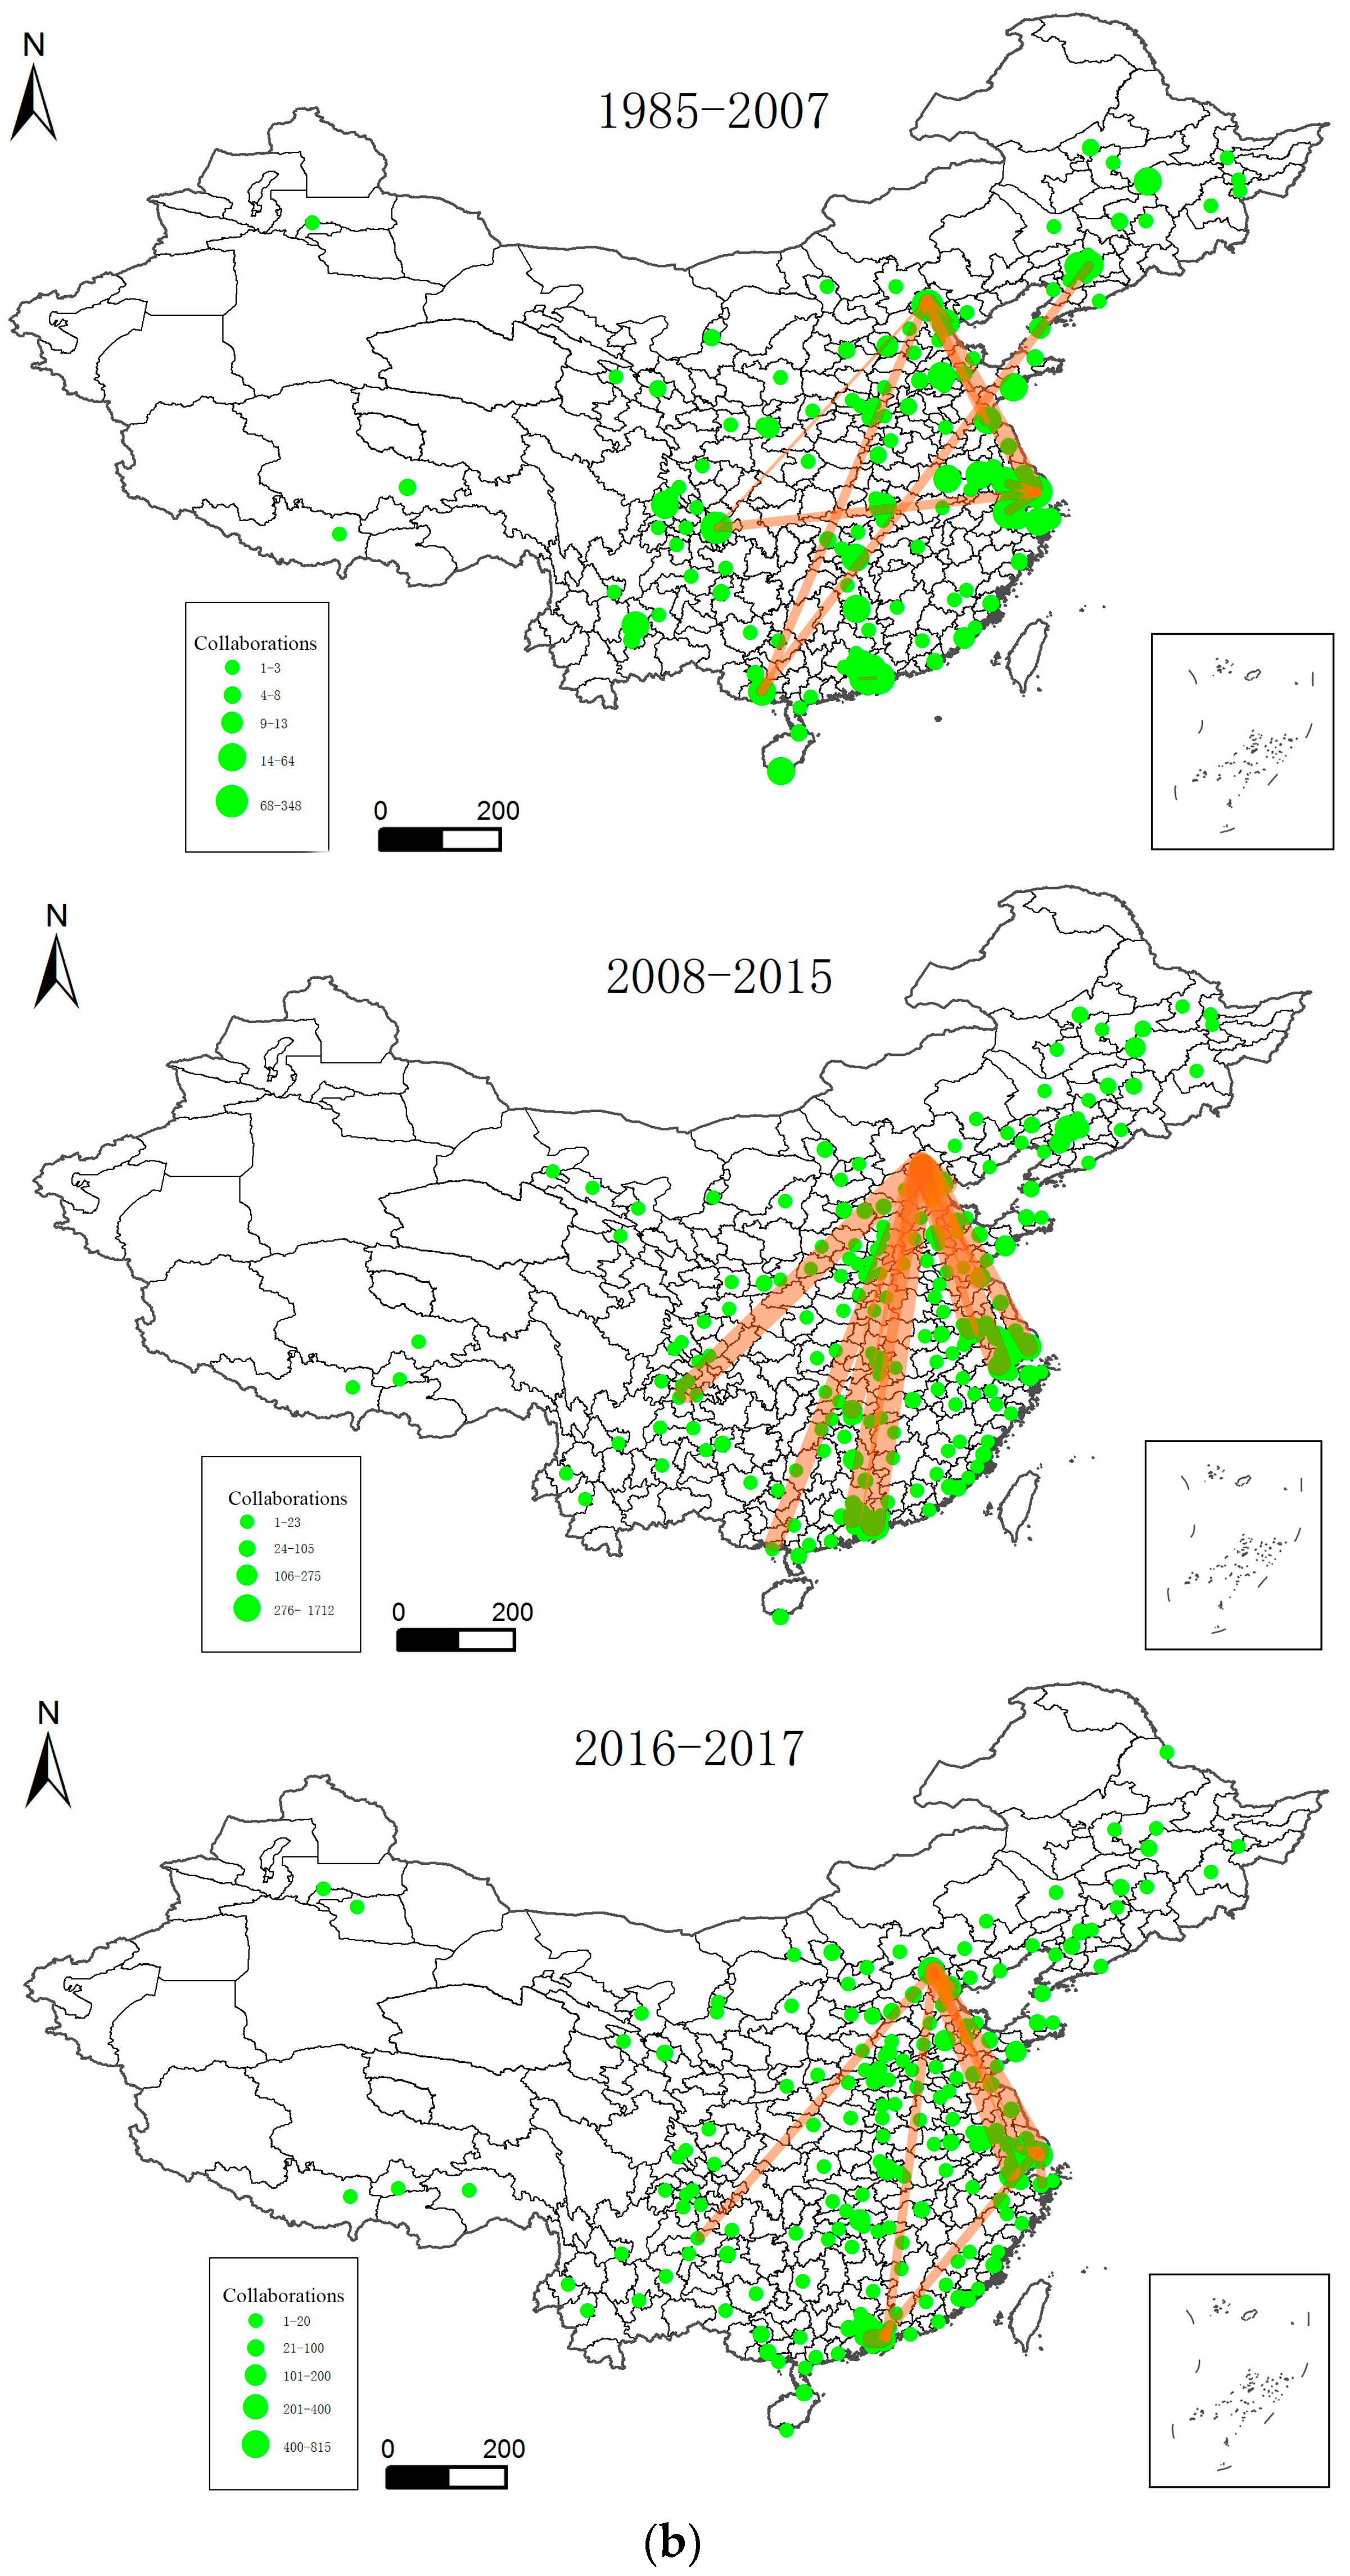
Table 1 exhibits the fact that 1308 innovators carrying out collaborative innovation are distributed in 153 cities in the introduction phase. In the growth phase, the number of collaborative innovators climbs to 4154, and the spatial distribution expands to 256 cities, simultaneously. For 2016–2017, the first two years only of maturity, the number of cities of the 3005 collaborative innovators even reaches 238. However, although the distribution of innovators is expanding, the importance of cities in the collaborative spatial network varies significantly, and this is directly reflected in cities with different number of collaborations. Among the cities, Beijing, Shanghai, Shenzhen and Guangzhou are star cities, while innovators in other cities tend more to carry out collaborations with these cities. Driven by these influential centers, three key areas for agricultural-biotechnology innovation are forming in China, with characteristics of regional innovation clusters: the Beijing-Tianjin region, the Yangtze River Delta region, and the Pearl River Delta region; the core cities of these are Beijing, Shanghai, Shenzhen and Guangzhou, respectively.
When horizontally comparing core cities in different phases, a clear upward trend can be found of the absolute degrees centrality of several core cities such as Beijing, Shanghai, Guangzhou, and Shenzhen. Taking Beijing as an example, the absolute degrees centrality is 0.04 from 1985 to 2007, while it rises to 0.045 in the first two years of the maturity phase. The gradual increase in absolute degrees centrality of star cities indicates that innovators in these cities are becoming more attractive to innovators in other regions for carrying out collaborations, which further implies that innovation resources are being concentrated in them.
3.2.2. Dynamics of the Collaborations among Cities
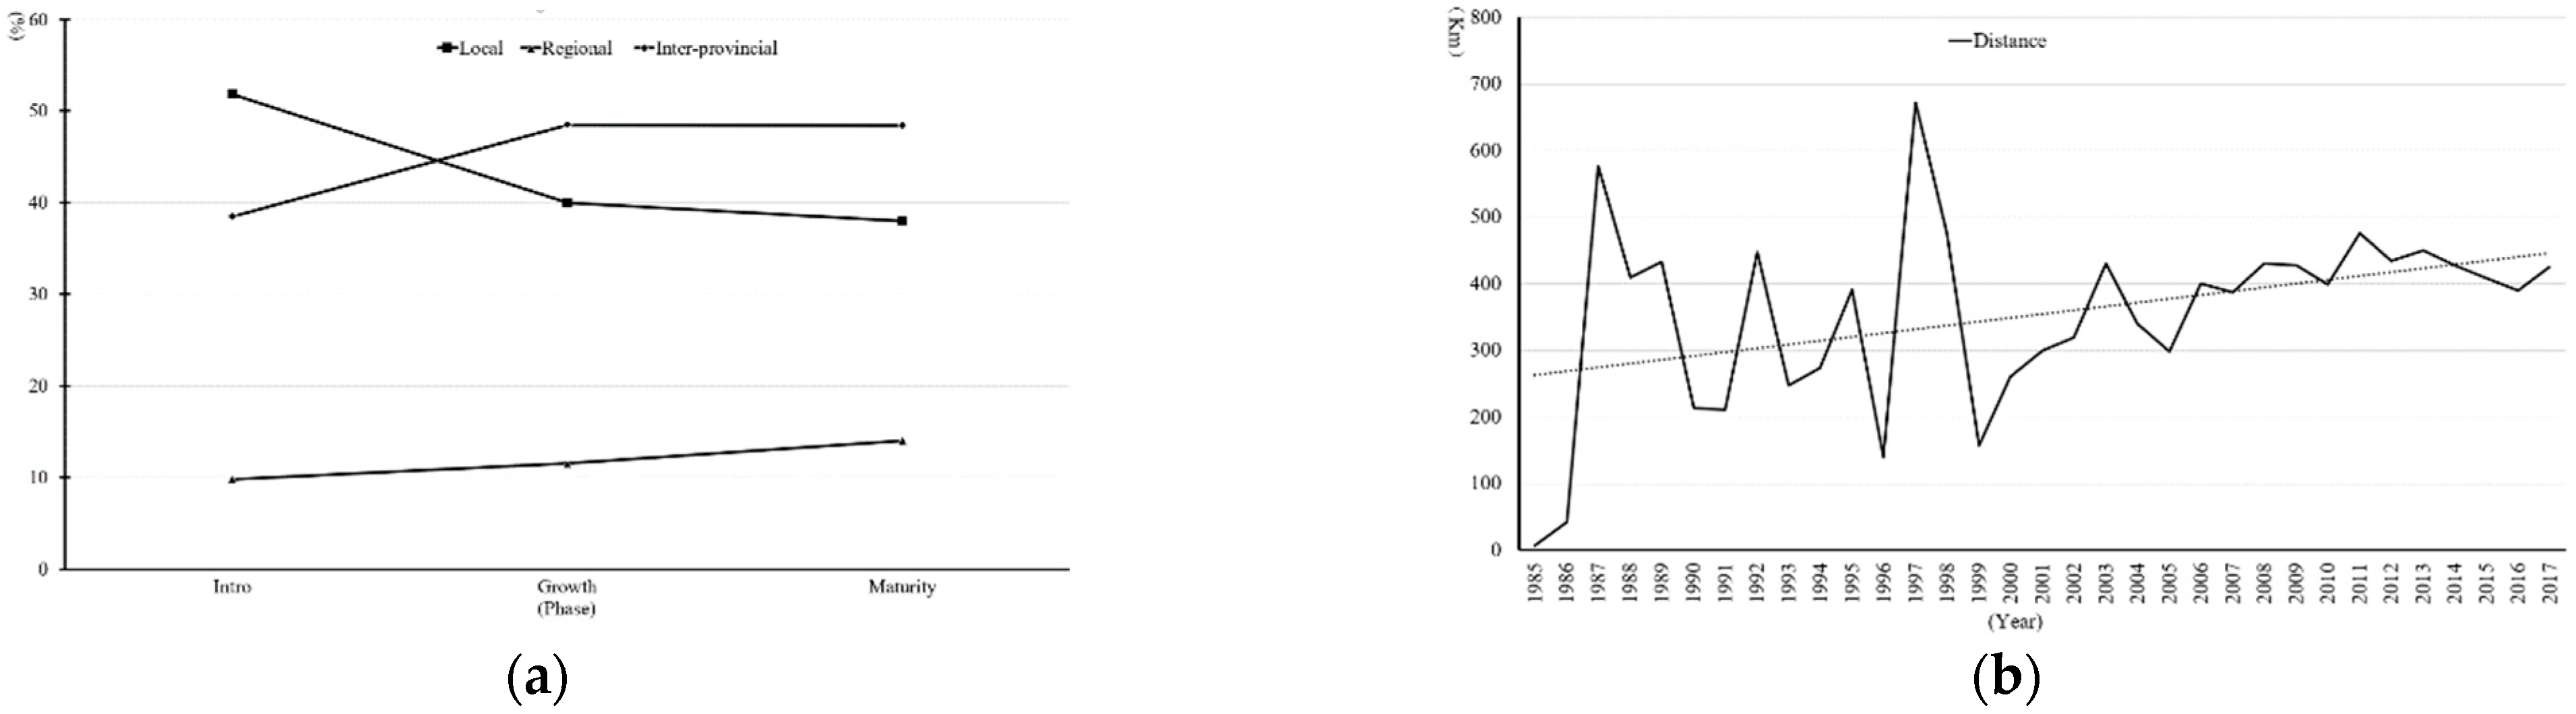
From the perspective of spatial scale, innovators are more inclined to establish cross-city collaborations, with 90% in total, as depicted in Figure 3a. In the two types of cross-city collaborations, innovators are evolving from the tendency to establish regional collaborations to inter-provincial, on a larger scale. In 1985–2007, more than 50% of the collaborations are established on the regional scale; while in 2016–2017, this proportion drops to less than 40%. In contrast, the proportion of inter-provincial collaboration rises to nearly 50%. This dynamic can be mutually confirmed with Figure 3b, which was obtained by calculating the spatial distance of each collaboration through ArcGIS; the overall spatial distance of collaborations displays a clear upward-trend from 1985 to 2017. Cui et al. (2019) arrived at a similar conclusion in their research into the long-distance collaboration tendency and believed this to be due to the reduction in travel costs brought about by the increasingly convenient transportation.
The strength of collaborations between cities reveals two more obvious dynamics (Table 2). Similar to findings in Section 3.3.1, the strong connections in the spatial network are mainly established by cities in three regions: Beijing-Tianjin, the Yangtze River Delta and the Pearl River Delta, and this dynamic has become more apparent over time. In the maturity phase, among the cities related to the top ten strong-connections, only Chongqing does not belong to the above three regions. Furthermore, Beijing and Shanghai are the top two stars for collaborative innovation. In both the introduction and growth phases, among the top ten strong-connections, there are eight involving Beijing and Shanghai, while in the maturity phase there are nine established with Beijing or Shanghai.
3.2.3. Dynamics of the Overall Spatial Network
Dynamics of local collaborations (Figure A1a) and crossing city collaborations (Figure A1b) are mapped.
- (1)
- Over time, the distribution of collaborations, no matter whether local or crossing the city, displays an east–middle–west diffusion trend, and the overall strength of collaborations increases synchronously.
- (2)
- Regional innovation cluster with star cities as the cores are taking shape. With Beijing as the core, the Beijing–Tianjin innovation cluster is being formed; Suzhou, Hangzhou, Nanjing, and Yangzhou are forming the Yangtze-River-Delta innovation cluster around Shanghai; the Pearl-River-Delta innovation cluster containing Dongguan and Zhongshan is forming, with Guangzhou and Shenzhen as the cores. Meanwhile, the collaborations both in and among the clusters are strengthened simultaneously.
- (3)
- There is a clear regional imbalance in agricultural-biotechnology innovation, and the imbalance is increasing. On the whole, innovation-related resources are obviously inclined towards eastern China, and this region has obvious advantages in terms of the quantity and strength of collaborations. Furthermore, star cities such as Beijing, Shanghai, and Guangzhou, as well as Shenzhen and the corresponding surrounding regions, Beijing-Tianjin, the Yangtze River Delta and the Pearl River Delta have obvious advantages in innovation collaborations.
3.3. Dynamics of the Topological Network
3.3.1. Dynamics of the Innovators
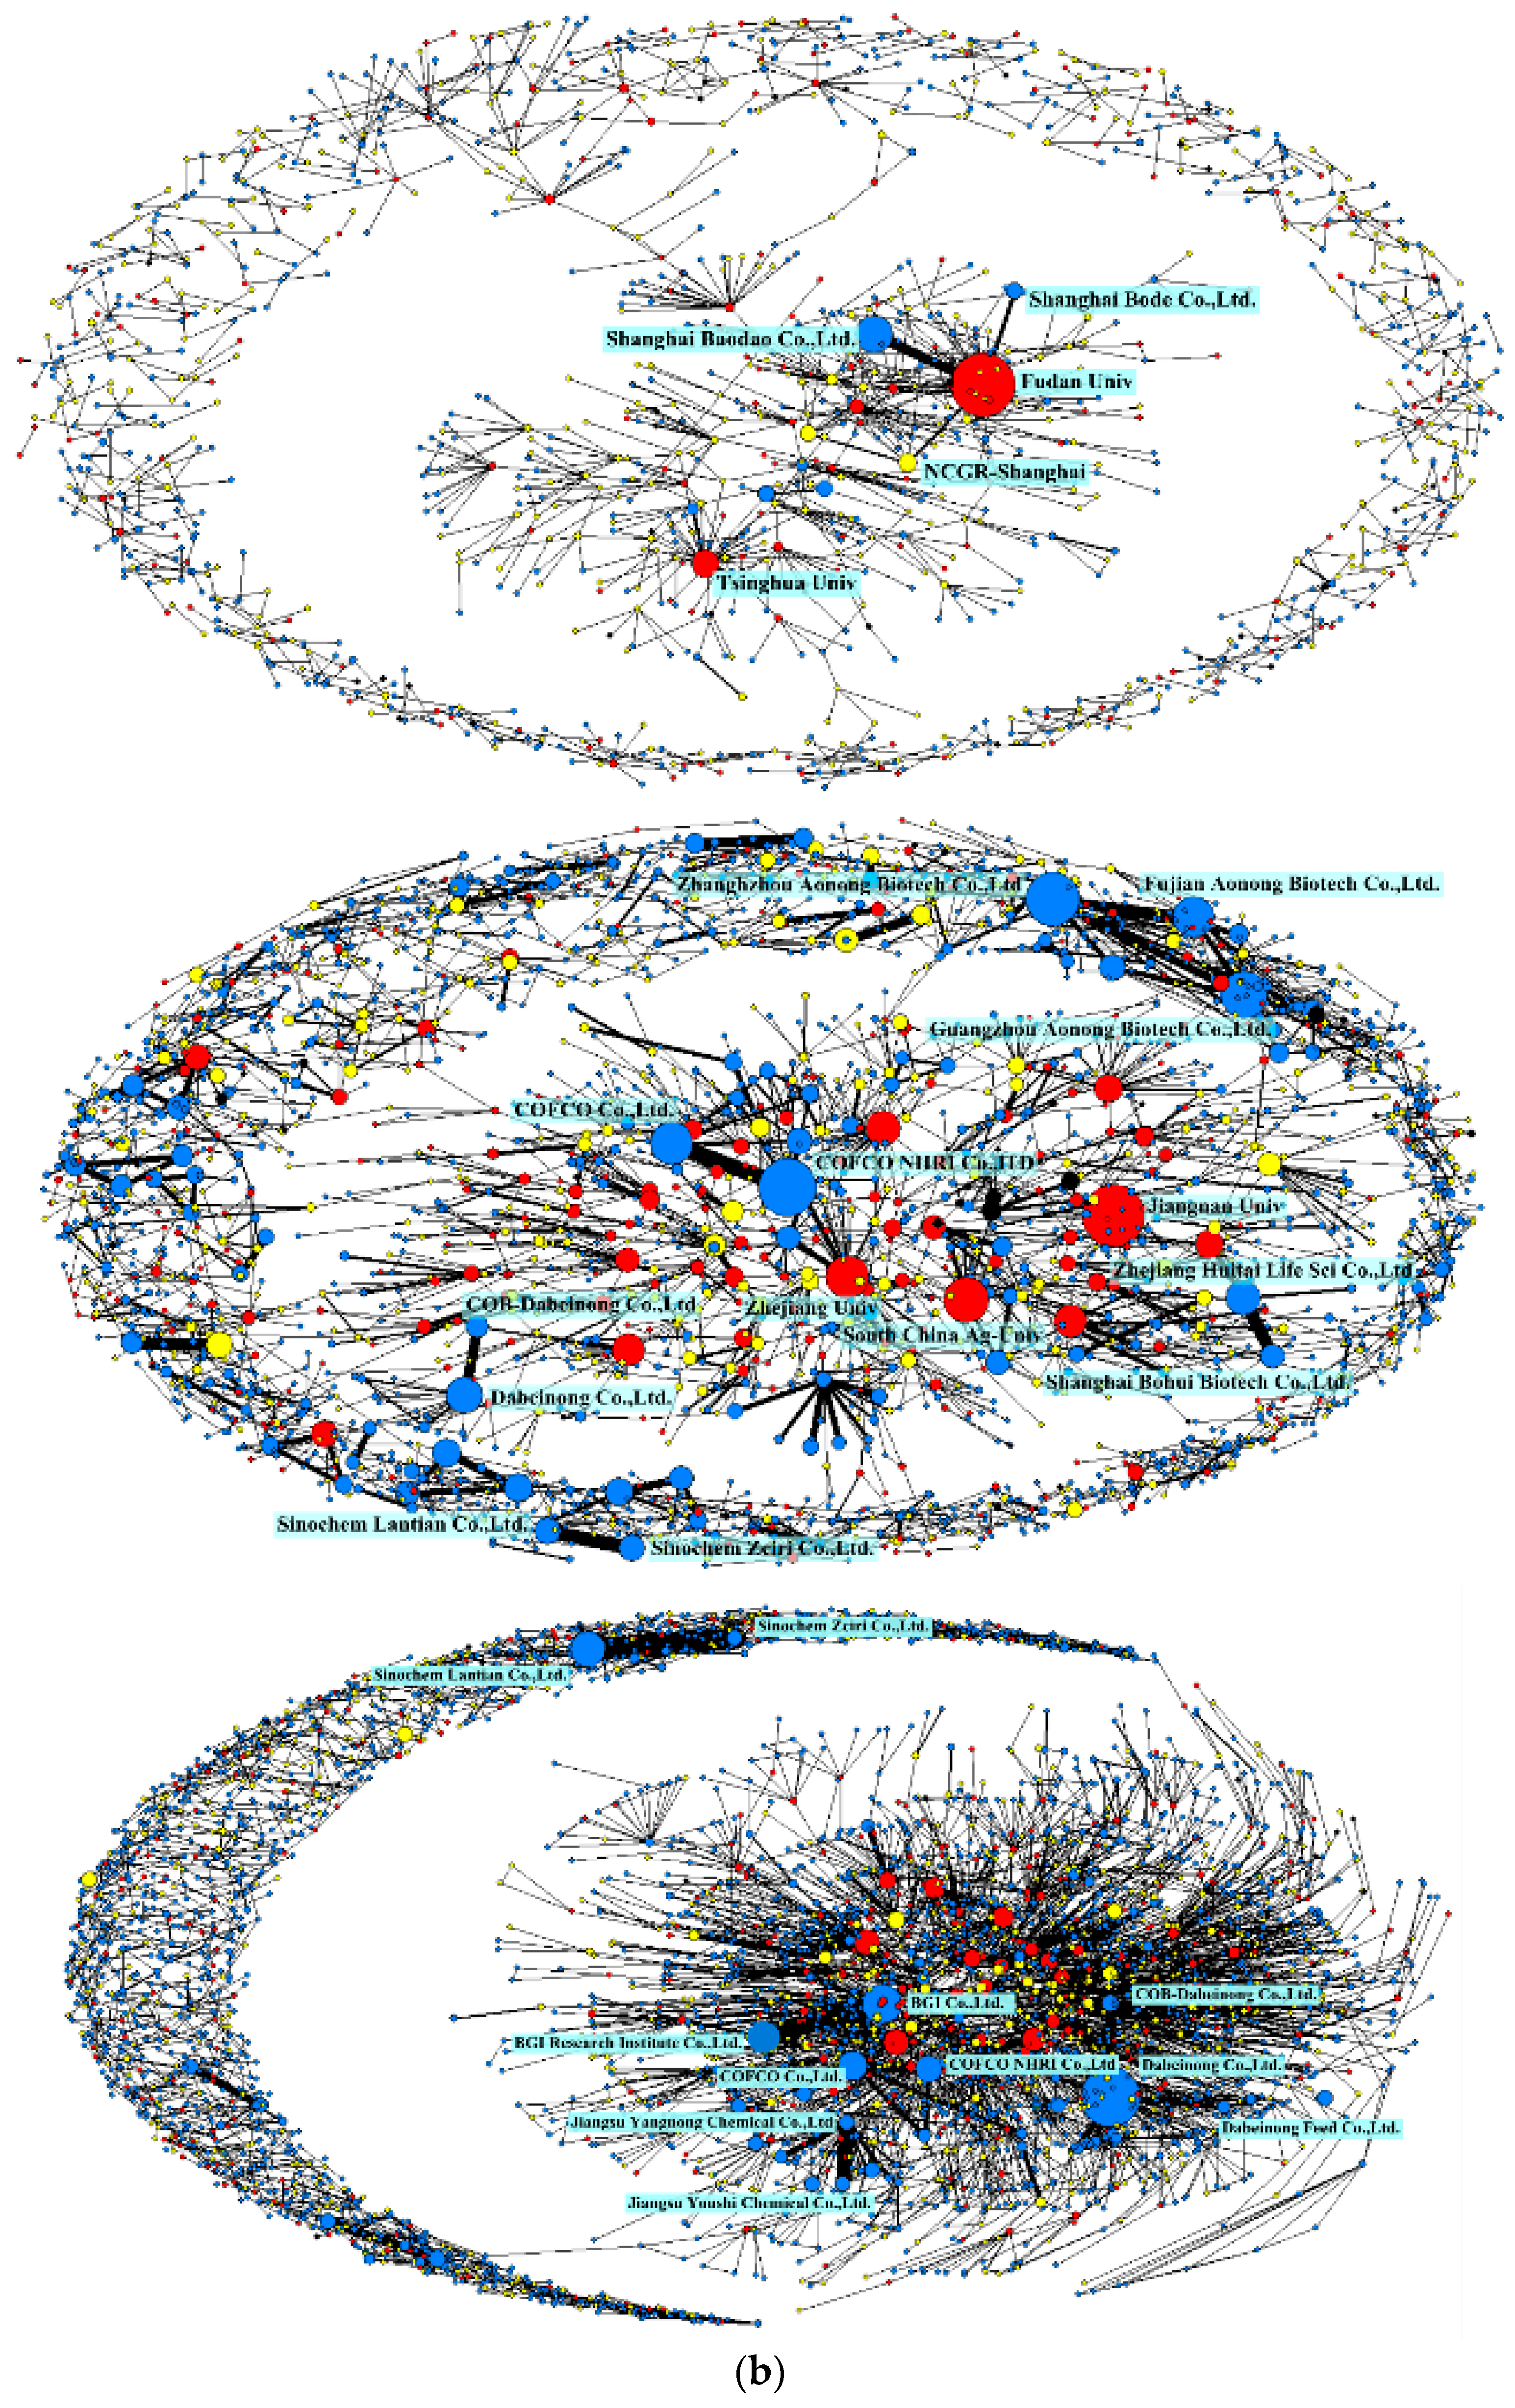
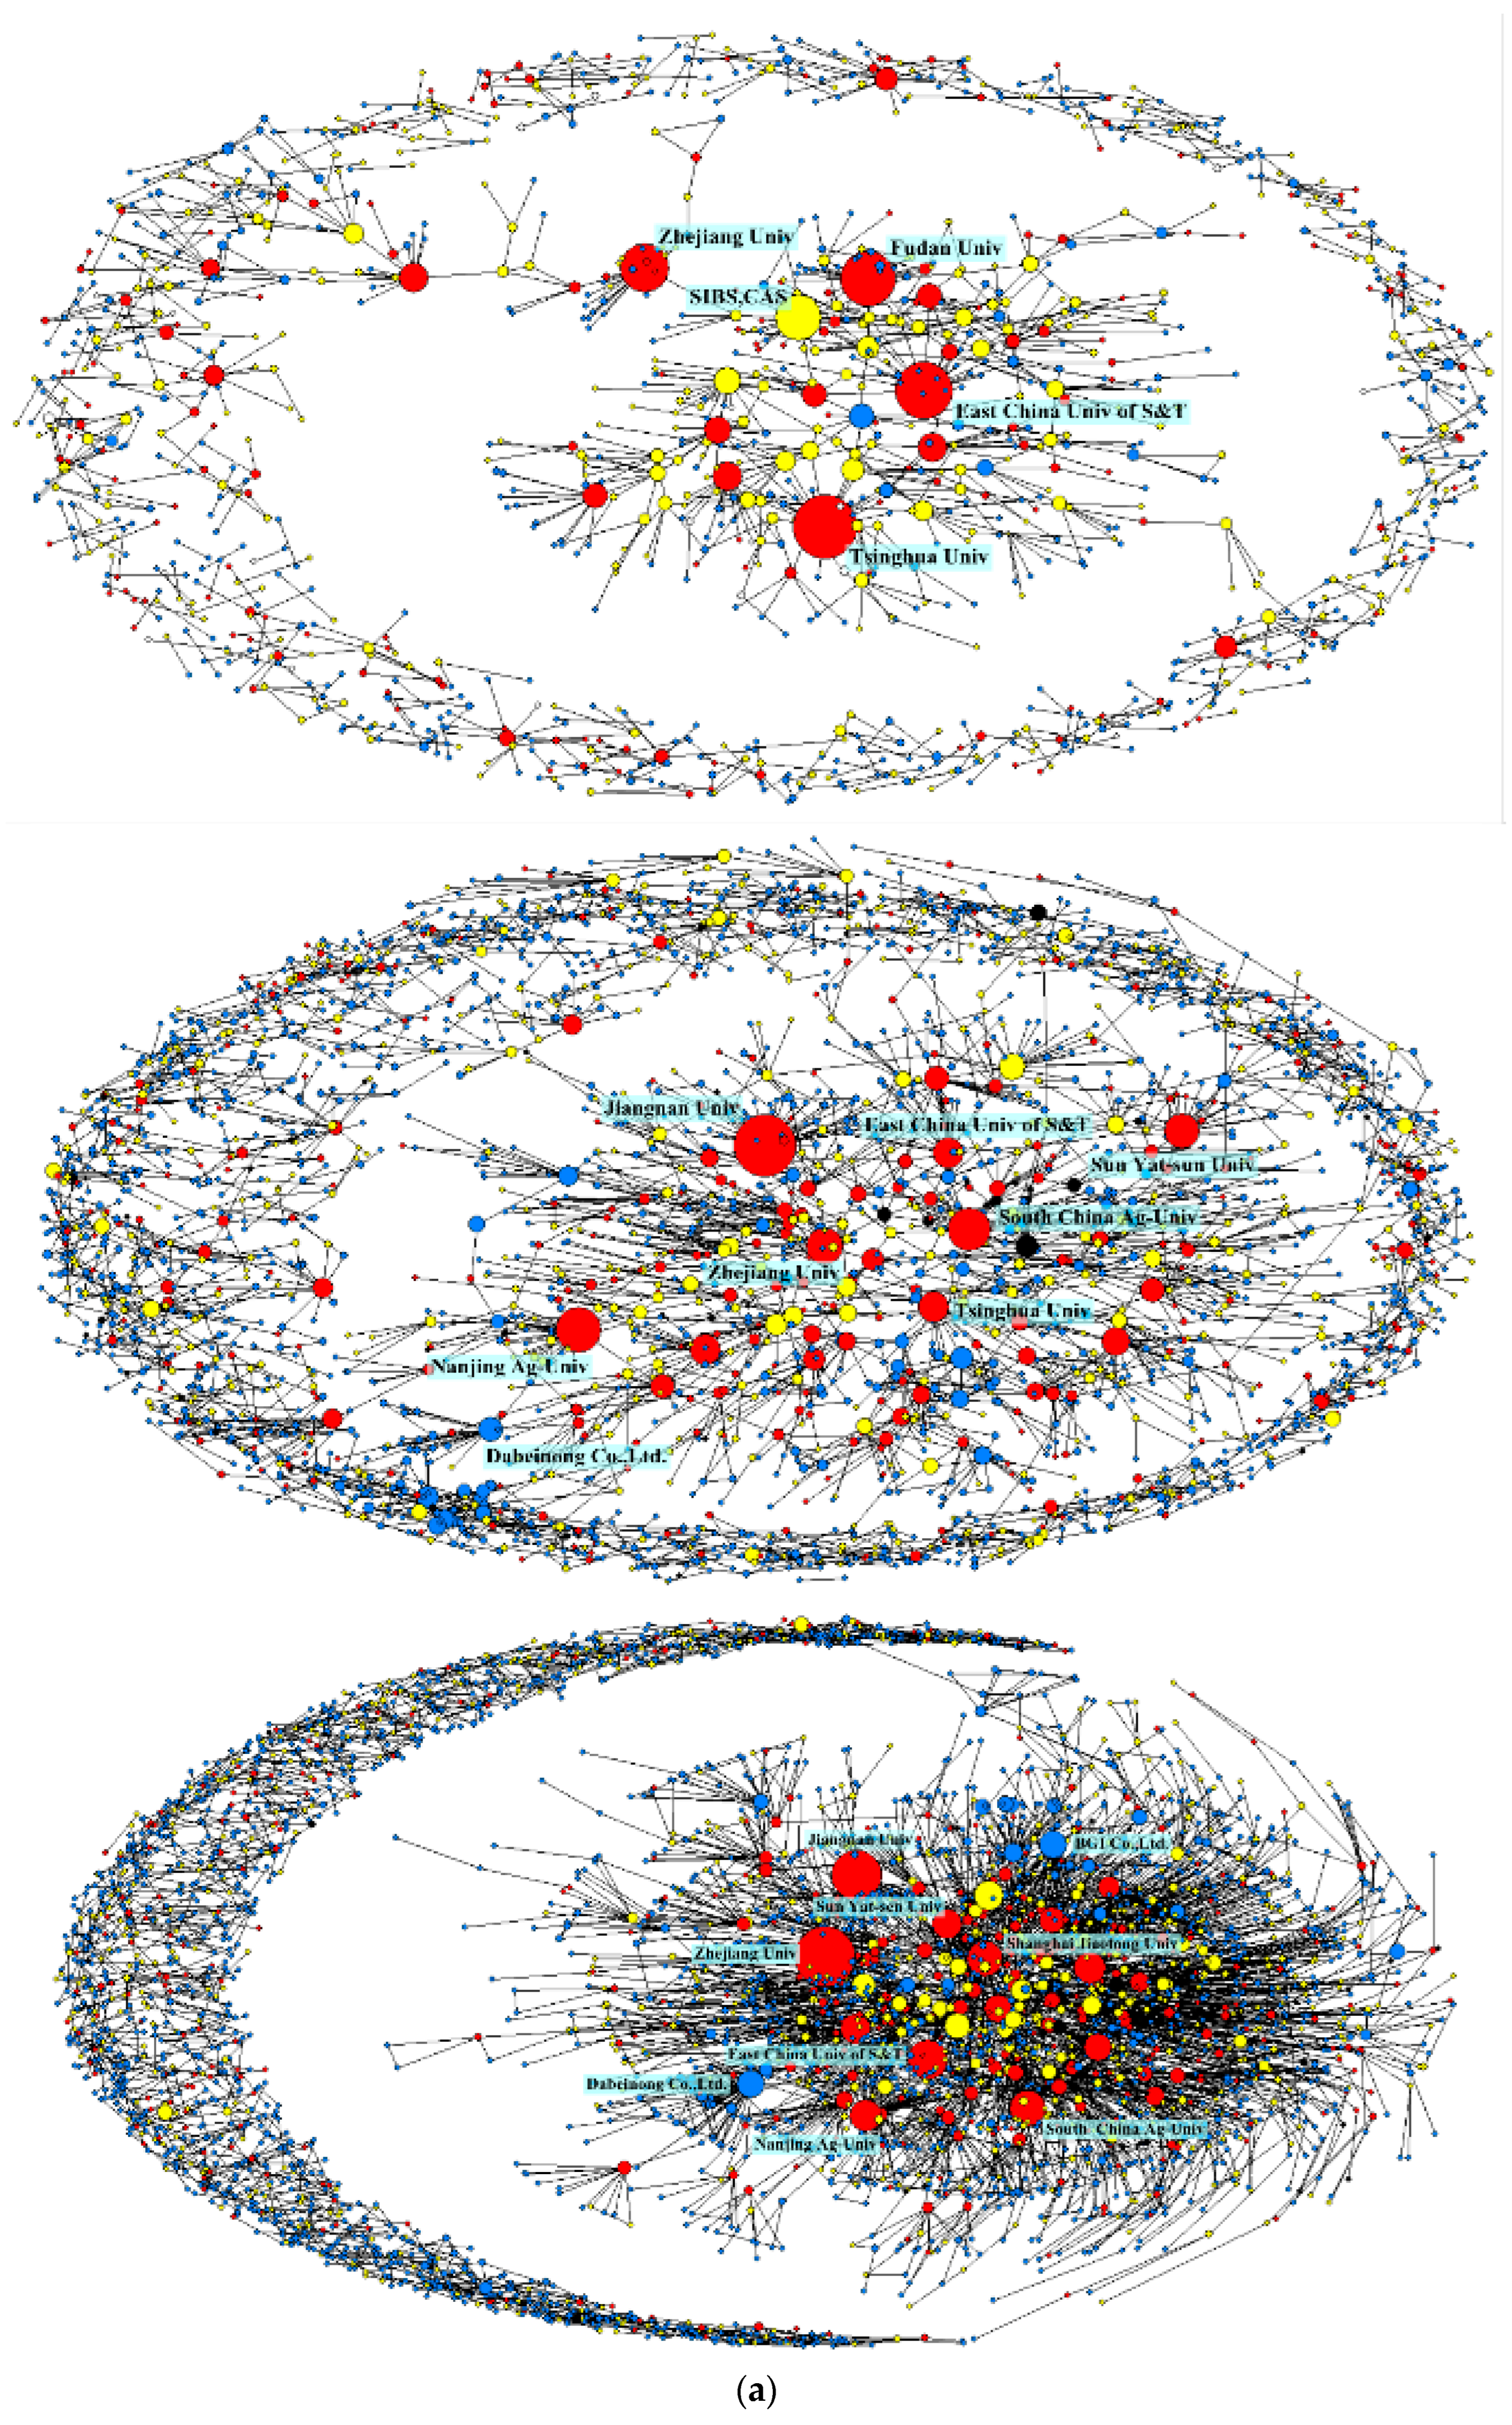
In terms of quantity, enterprises are always advantageous. As technology enters the growth-and-maturity phase from the introduction, the proportion of enterprises rises from 50 to 60%. However, from a microscopic perspective, various innovators such as universities, research institutes, and enterprises show more complex dynamics. Table A1 shows that in the binarized collaborative-network, from 1985 to 2017 universities always dominate. In each phase, among the top 20 nodes with the highest degree centrality, universities account for 14, and rank top. Since degree centrality is obtained after binarizing the collaboration, that is, 1 and 0 represent whether there is a collaboration between two innovators respectively, so the higher degree-centrality of universities displays not only a larger number of established collaborations among them, but also a wider scope of local collaborative networks around them.
By horizontal comparison, the overall downward trend of innovators’ absolute degree centrality can be found in Table A1. Taking the maximum value of each phase as examples, during 1985 to 2007, the absolute degree centrality of Tsinghua University is 0.025; that is, the collaborations established with Tsinghua University account for 2.5% of the total; in 2008–2015, Zhejiang University has an index of 2%; in 2016–2017, Jiangnan University further decreases, to 1.4%. This demonstrates that unlike the spatial network where innovation resources are being concentrated in certain core cities, in the topological network the relative importance of core nodes is showing a downward trend.
For the weighted collaborative-network, unlike universities, which occupy the absolute core positions in the binarized network, enterprises are gradually replacing universities as well as research institutes, and becoming the main force of collaborative innovation with higher collaboration-strength. From 1985 to 2007, among the 20 innovators with the highest weighted-degree-centrality, there are only six enterprises, and the rankings are generally low. From 2008 to 2015, eight enterprises enter the top 20. Among them, Beijing Dabeinong Group Co., Ltd., BGI Group Co., Ltd. and its affiliated BGI Research Institute Co., Ltd., COFCO Co., Ltd. and its subsidiary COFCO NHRI Co., Ltd. occupy the top five; during 2016–2017, the overall advantages of enterprises are more obvious, with 11 ranking in the top 20. In addition to COFCO and Dabeinong Group, Zhangzhou Aonong Co., Ltd., Guangzhou Aonong Co., Ltd. and several other agricultural companies also rise as important nodes in the network.
Comparing the binarized network and the weighted network, it can be clearly found that in the binarized network universities occupy the core positions, while in the weighted network the core positions of enterprises are more obvious. In the binarized network, the degree centrality represents the number of innovators with whom the collaborations are established, while in the weighted network the weighted degree-centrality of one node represents the number of collaborations established. Therefore, the difference between the above indicators of universities and enterprises can be interpreted as the fact that universities can attract a greater number of innovators to collaborate, while enterprises attract other innovators to establish a greater intensity of collaborations with them. The possible reason for this difference is that universities are the source of knowledge production; they are experts in basic research, which is fundamental for technology transfer and related industrialization; as enterprises have more advantages in capital and human resource, it is easier for them to carry out industrialization-oriented collaborative innovations of a larger number and higher intensity.
3.3.2. Dynamics of the Collaborations among Innovators
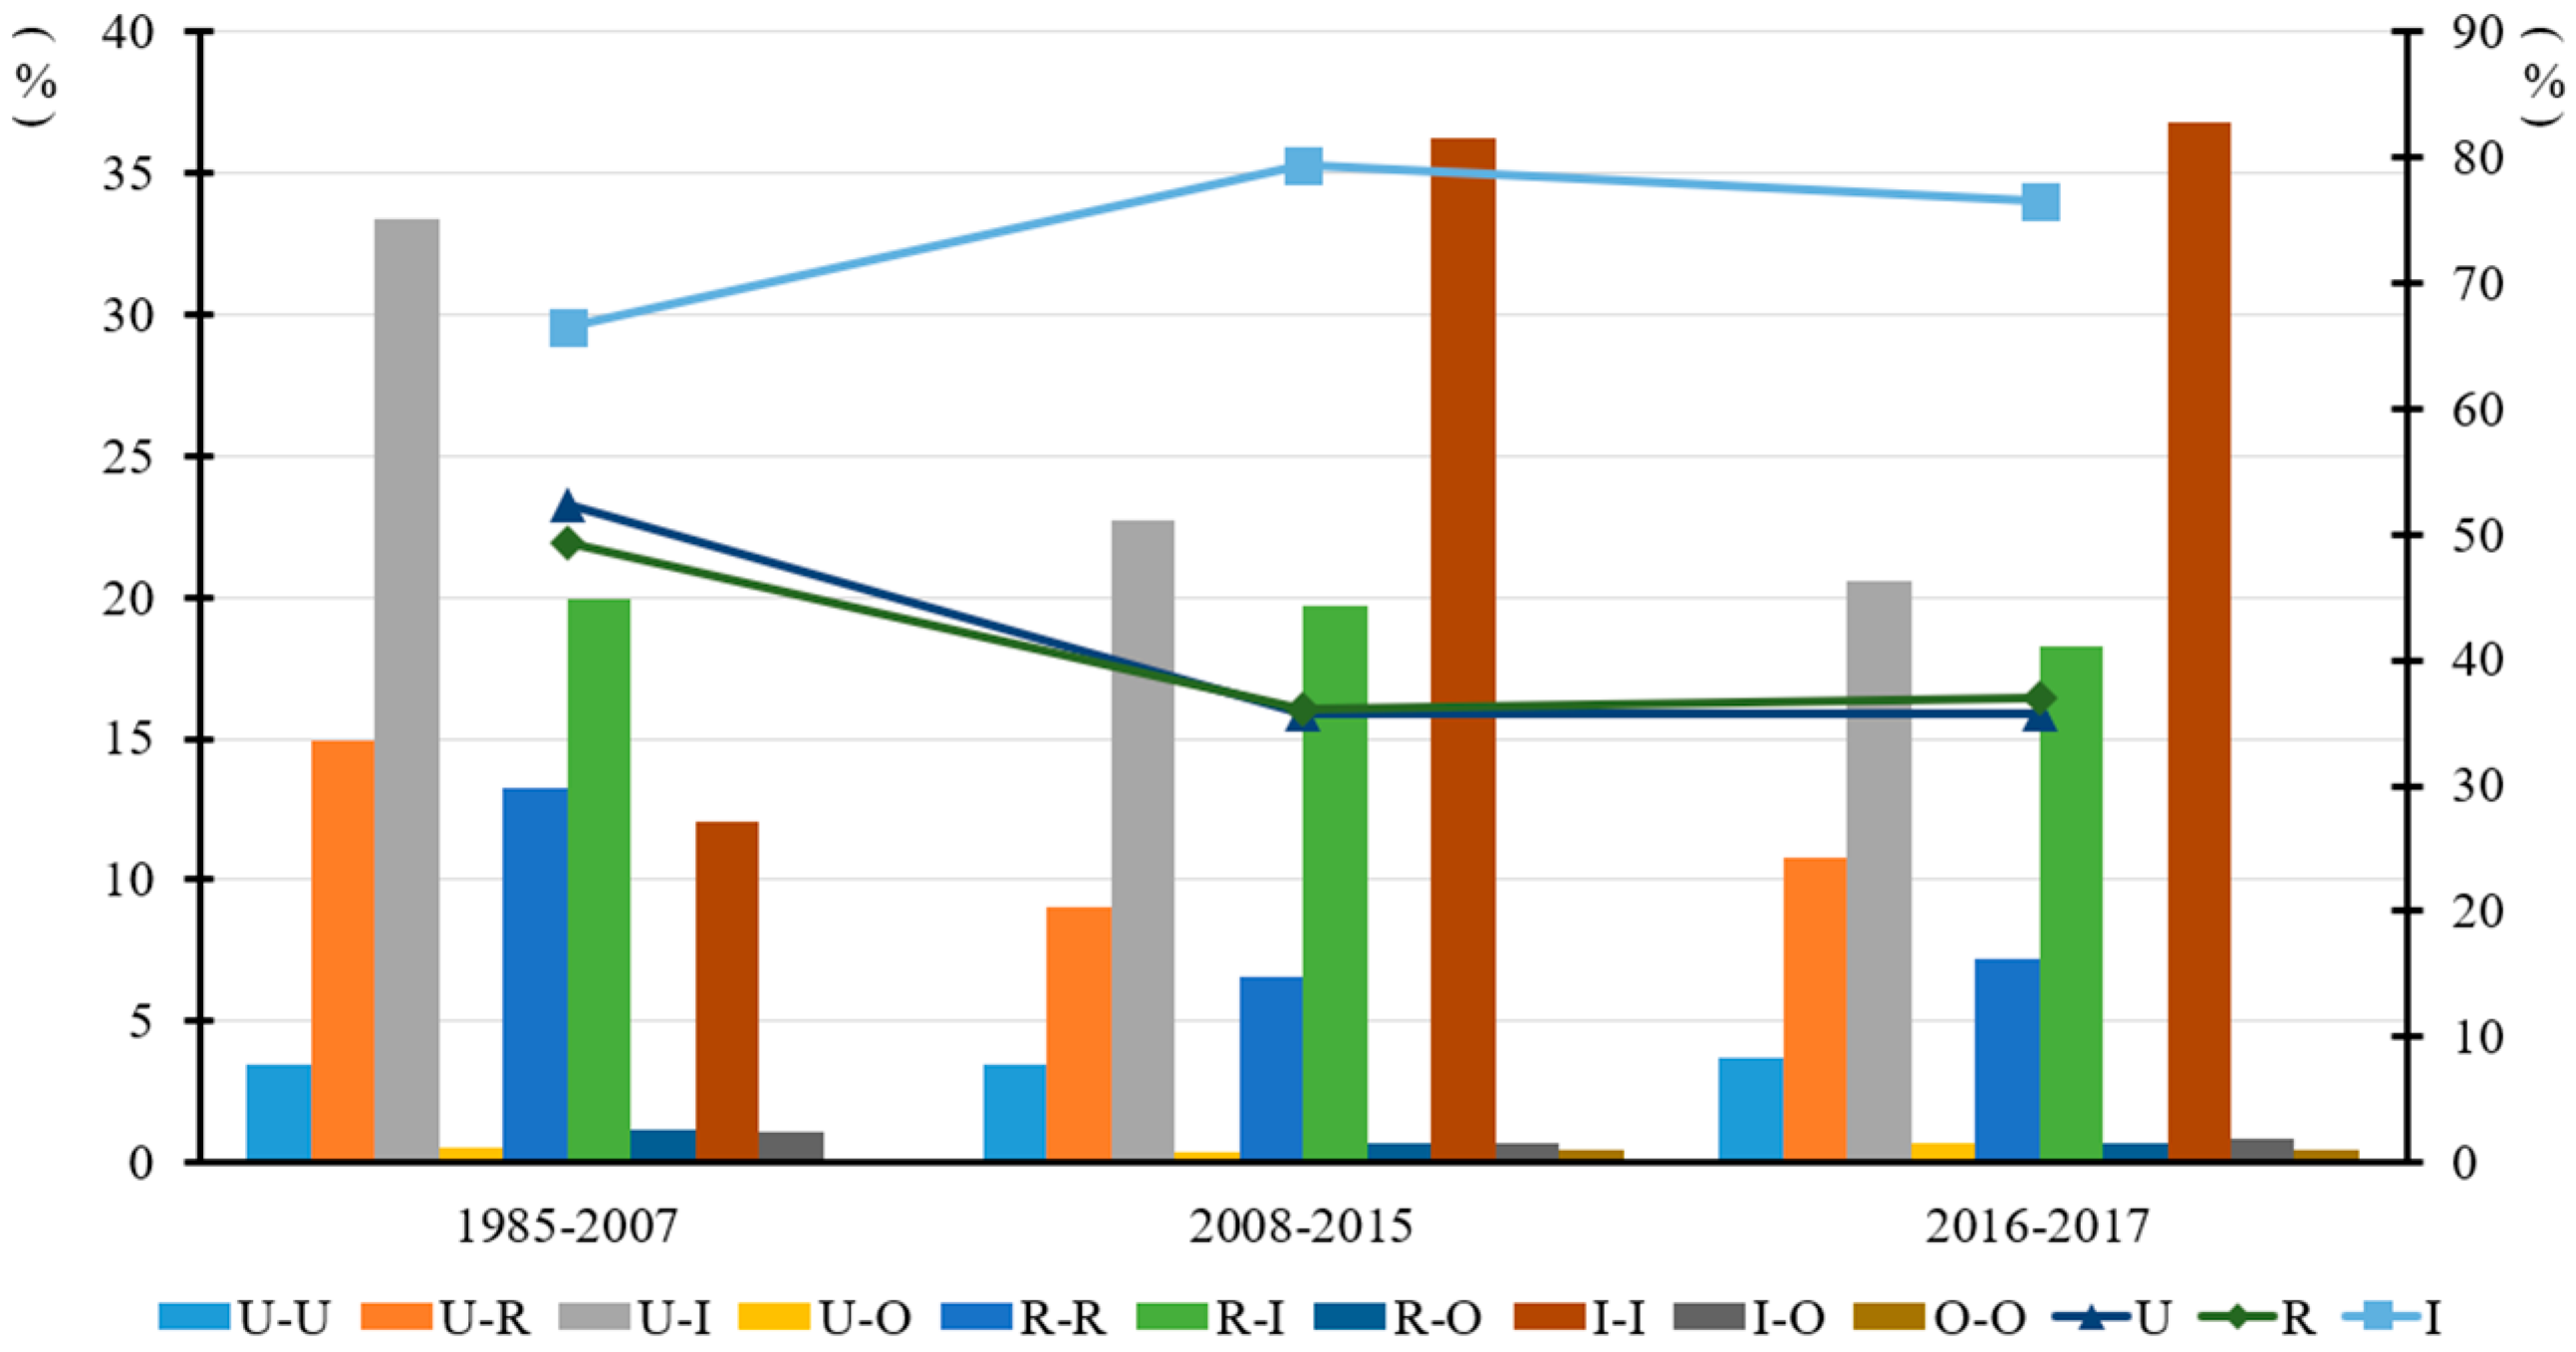
Figure 4 exhibits the various dynamics of different types of collaborations as China’s agricultural biotechnology enters the maturity phase from the introduction. The proportion of total collaborations related to universities or research institutes gradually decreases from 50% to 35%, while enterprises-related collaborations increase by 10%, to 76.46%. These findings are corroborated by the increase in weighted degree-centrality of enterprises in Section 3.3.1, indicating that from a quantitative perspective, the importance of universities and research institutes in the collaboration network is declining, while enterprises are rising in sync. Further analysis of the collaborations established with enterprises reveals that among the three types of collaborations, enterprises–universities, enterprises–research-institutes and enterprises themselves, the collaborations between enterprises are gradually increasing. In 1985–2007, the collaborations between enterprises account for only 12%, while in the two phases of 2008–2015 and 2016–2017, the proportion exceeds 36% in both cases, which is three times that in the introduction phase. This further shows that enterprises are becoming important forces for China’s agricultural biotechnology.
By analyzing the top collaborations with the highest strengths in Table A2, it can be found that the driving forces for strong connections in collaborations are mainly multi-proximity including geographical, cognitive and organizational proximity. The collaborations driven by geographical proximity are established between famous universities and local enterprises, such as the collaborations between Fudan University and Shanghai Bodao Gene Technology Co., Ltd., Tsinghua University and Beijing Capitalbio Co., Ltd., as well as Guangdong Institute of Microbiology and Guangdong Huankai Microbiology Technology Co., Ltd. The main manifestation of cognitive proximity-driven collaborations are between two types of innovators based on common or overlapping research-fields, such as the close collaboration established by Sinochem and Shenyang SYRICI Co., Ltd., due to their common research field of biological pesticides. The organizational proximity-driven collaborations are mainly manifested as collaborations between parent subsidiaries or sister companies, such as the collaborations between COFCO and its subsidiary COFCO NHRI, as well as Beijing Dabeinong Technology Group Co., Ltd. and Beijing Dabeinong Biotechnology Co., Ltd. Furthermore, the dynamics of strong connections shows the evolution of a main driving-force from geographical proximity to organizational proximity. In 1985–2007, the strong connections are mainly established between famous universities and local enterprises, based on geographic proximity, which we have discussed above, while in 2016–2017, strong connections between companies are established more based on organizational proximity, especially between parent subsidiaries or sister companies.
3.3.3. Dynamics of the Overall Topological Network
The results of the quantitative analysis of the overall topological network are reported in Table A3. Firstly, an obvious networked trend of collaborative innovation among innovators is illustrated by the indicators of innovators, collaborations and collaborations (weighted). Since 1985, the number of innovators and collaborations has increased significantly. Although it is just the first two years of the maturity phase, the number of innovators and collaborations in 2016–2017 is still more than twice of that in the introduction. Secondly, the collaborations among innovators are strengthening, which is directly reflected in the rise in the average degree and weighted average-degree of the overall network, implying that although there is no obvious change in the density, both the average number of partners and established collaborations of the innovators in the network are increasing, further indicating that the consensus to carry out agricultural-biotechnology innovation through collaboration is being formed among innovators. Thirdly, the ability of a few core nodes in the network to control most of the resources of the network is declining, which is illustrated by centralization in Table A3 and co-evidenced by the continuous decrease in the degree centrality of the core nodes in Table A1. This dynamic demonstrates that the collaborative network is tending to be decentralized.
At the same time, the network has shown the dual attributes of both small-world and scale-free. To explore the small-world attribute, both the average path-length and the cluster coefficient are calculated, and the results suggest that in each phase, the average path-length of the network is between 6 and 8.5 and the cluster coefficient is 0.06–0.155 (Table A3). According to the threshold index of judging the small-world attribute as an average path-length < 10 and a cluster coefficient > 0.01 [35,36], China’s agricultural-biotechnology collaborative-innovation network is typically small-world, although as overall size increases, its small-world attribute decreases slightly. The attribute of the small-world network determines the convenience of information-transfer and node-connections within the network, which is obviously conducive to promoting the overall improvement in innovation level through collaborations among innovators [37,38,39].
Figure A2 presents the fitted power-law-distribution curve of all nodes with different degrees in the network. The determination coefficients, R2, of the three curves are all around 0.9, suggesting the power law distribution of the nodes is obvious and the network is typically scale-free. The scale-free attribute of the collaborative network has a significant positive impact on the network’s ability regarding resource integration, innovation and technology diffusion, which greatly improves the function of the collaborative innovation network in promoting innovation [40,41]. Meantime, in the scale-free network, there are not only nodes with a higher degree to play the role of integrating innovation resources, but also a large number of nodes with a lower degree which are interwoven with higher ones, which is more conducive to improving the robustness of the network [42,43].
The visualization of the network dynamics is exhibited in Figure A3. In addition to scale expansion and increasing strength, more dynamics are presented.
- (1)
- The core-edge structure of the network is prominent. This is highlighted by the fact that the network as a whole is increasingly divided into core and edge areas. As with the nodes located in the core area, the number of nodes connected to them and related collaborations established are significantly more than those in the edge, indicating that the collaborative connections between innovators in the core area are complex, and the attribute of the small-world is particularly obvious. However, the collaborative connections between innovators in the edge have relatively important limitations; they are often limited to the same or a few innovators for carrying out collaborations.
- (2)
- The positions of universities, research institutes and enterprises are changing obviously. Whether it is binarized (Figure A3a) or weighted (Figure A3b), in the maps of the introduction phase universities occupy core positions, especially for the binarized network, and famous universities such as Tsinghua University and Fudan University are always dazzling stars. In the maps of the growth phase, universities in the binarized network are still irreplaceable, but in the weighted network Beijing Dabeinong Group Co., Ltd., BGI Co., Ltd. and COFCO Group Co., Ltd., as well as their subsidiaries, are beginning to appear in the core area and occupy dominant positions. This dynamic is more obvious in the maps of the maturity phase. Although in the binarized network of 2016–2017 universities still firmly occupy the core position, in the weighted network Beijing Dabeinong Group Co., Ltd., COFCO Group Co., Ltd., and Aonong Group Co., Ltd., as well as other enterprises, have become the main forces in agricultural-biotechnology innovation.
- (3)
- It is the combination of geographical, cognitive and organizational proximity that drives the dynamics of innovation networks, but the main driving factor is evolving from geographical proximity to organizational proximity. Figure A3b illustrates that, from 1985 to 2007, the strong collaborative connections are mainly enterprise-university collaborations based on geographical proximity, while in the maturity phase of 2016–2017, collaborations are more strongly established between enterprises based on organizational proximity, especially between parent subsidiaries or sister companies.
4. Discussion and Conclusions
In this study, based on the data of patent applications jointly filed from 1985 to 2017, we analyze the dynamics of the collaborative innovation network in two dimensions of spatial and topological. We first identify the three phases of China’s agricultural biotechnology as the introduction phase (1985–2007), the growth phase (2008–2015) and the maturity phase (2016–2017). After three phases, the spatial network expands in scale, while collaborations tend to be concentrated in several cities. Meanwhile, the topological network expands, and collaborations tend to be scattered. Specifically, the geographic locating area of innovators is expanding and the spatial scale as well as spatial distance of collaborations among innovators is tending to increase. Although the overall scale is expanding, a few core cities such as Beijing, Shanghai, Shenzhen and Guangzhou are becoming more attractive to innovators in other cities to establish collaborations, reflecting how innovation resources are being concentrated in these very few regions. In terms of topological network, the total number of nodes and collaborations among these, as well as the average number of collaborations held by each node, show an upward trend, indicating the network is expanding in topology. Meantime, indicators such as absolute degree centrality of the core nodes and centralization of the network exhibit a downward trend, suggesting that with the overall innovation improvement of various innovators, the ability of core nodes to control innovation resources and attract innovation collaborations is declining. In the early phase of China’s agricultural biotechnology, universities, as the main forces of knowledge production, are more attractive to other innovators for carrying out collaborative innovation. With the improvement of the innovation level of enterprises, their dominance obviously increased. From the perspective of the network as a whole, the collaboration network exhibits attributes of small-world, scale-free and core-edge structure. Lastly, geographical proximity and cognitive proximity, as well as organizational proximity, are important factors driving the dynamics of collaborative innovation, and organizational proximity is gradually replacing geographical proximity as the main driving factor.
The research conclusion of this paper is basically consistent with the development of agricultural biotechnology in China. On 1 April, 1984, China promulgated and implemented the Patent Law, to strengthen the protection of intellectual property rights. On the same day, the Wuhan Institute of Virology of the Chinese Academy of Sciences submitted a patent application for the tung-tree inchworm-virus insecticide, which became the first invention-patent application in the field of agricultural biotechnology in China. Over the following 22 years, China continued to increase its support for agricultural-biotechnology R&D, and the investment in R&D doubled every five years (Hu Ruifa, 2016). During this period, the annual growth rate of patent applications for agricultural biotechnology was approximately 15%. In 2008, in order to enhance the role of biotechnology innovation in ensuring national food-security, China’s central government launched a major special project for GM. In that year, China’s investment in agricultural-biotechnology innovation doubled compared with 2005, and in 2010 it increased by 66%, compared with 2008 (Hu Ruifa, 2016). The unprecedented strengthening of R&D investment has led to the rapid development of agricultural-biotechnology innovation, and pushed China’s agricultural-biotechnology innovation into a mature stage. As China’s agricultural-biotechnology R&D-investment continues to increase, the innovation capacity of universities, institutes, especially enterprise-type innovators, has been significantly improved. The collaborative-innovation intensity among these innovation entities has increased synchronously, and the trend in networking collaboration is increasingly obvious. From the perspective of different types of innovators, the status of enterprise-type innovators in the network has been significantly improved, which is reflected in the amount and intensity of cooperation.
The implications of the conclusion above is that the investment in agricultural-biotechnology R&D, including government investment and social investment, should be improved continuously, which is the basis for improving the level of innovation and promoting innovation cooperation. At the same time, since China’s universities are an important source of knowledge, faculties in universities should be encouraged to carry out technology transfer and carry out more joint R&D with research institutes and enterprises. Meanwhile, despite the rising status of enterprise-type innovators in the network, in order to further improve the level of agricultural-biotechnology innovation, enterprises should be encouraged more to carry out independent innovation through various means such as tax reduction and fee reduction.
Although in-depth research has been carried out, there are still limitations in this paper. First of all, social network analysis and the related software Ucinet are used many times to quantitatively measure and visualize the network, while they cannot quantitatively analyze the dynamics between networks, which needs to be summarized more subjectively. In addition, this paper mainly analyzes the dynamics of networks, while the factors driving the dynamics are not explored by quantitative research adequately. In the future, other analytical methods will be used to quantitatively measure the dynamics of the network, and more models will also be used to empirically explore the driving force of networks.
Funding
This research was funded by Research on the Frontier Theory, Method and Model of Agricultural Information Management, grant number 123/04701.
Data Availability Statement
Not applicable.
Acknowledgments
We would like to thank Shiping Mao of the Chinese Academy of Agricultural Sciences and Wendong Zhang of Iowa State University for their guidance on this paper.
Conflicts of Interest
The authors declare no conflict of interest.
Appendix A
Figure A1.
Dynamics of the overall spatial network: (a) shows the dynamics of local collaborations in the spatial network; different colors mean different numbers of collaborations established by innovators in the same city; (b) shows the dynamics of collaborations crossing cities; the size of the green dots in different cities indicates the number of collaborations established between innovators in each city and their partners in other cities or provinces. The width of the lines means the strength of connections between cities. For clarity of display, only the top ten strongest are shown.
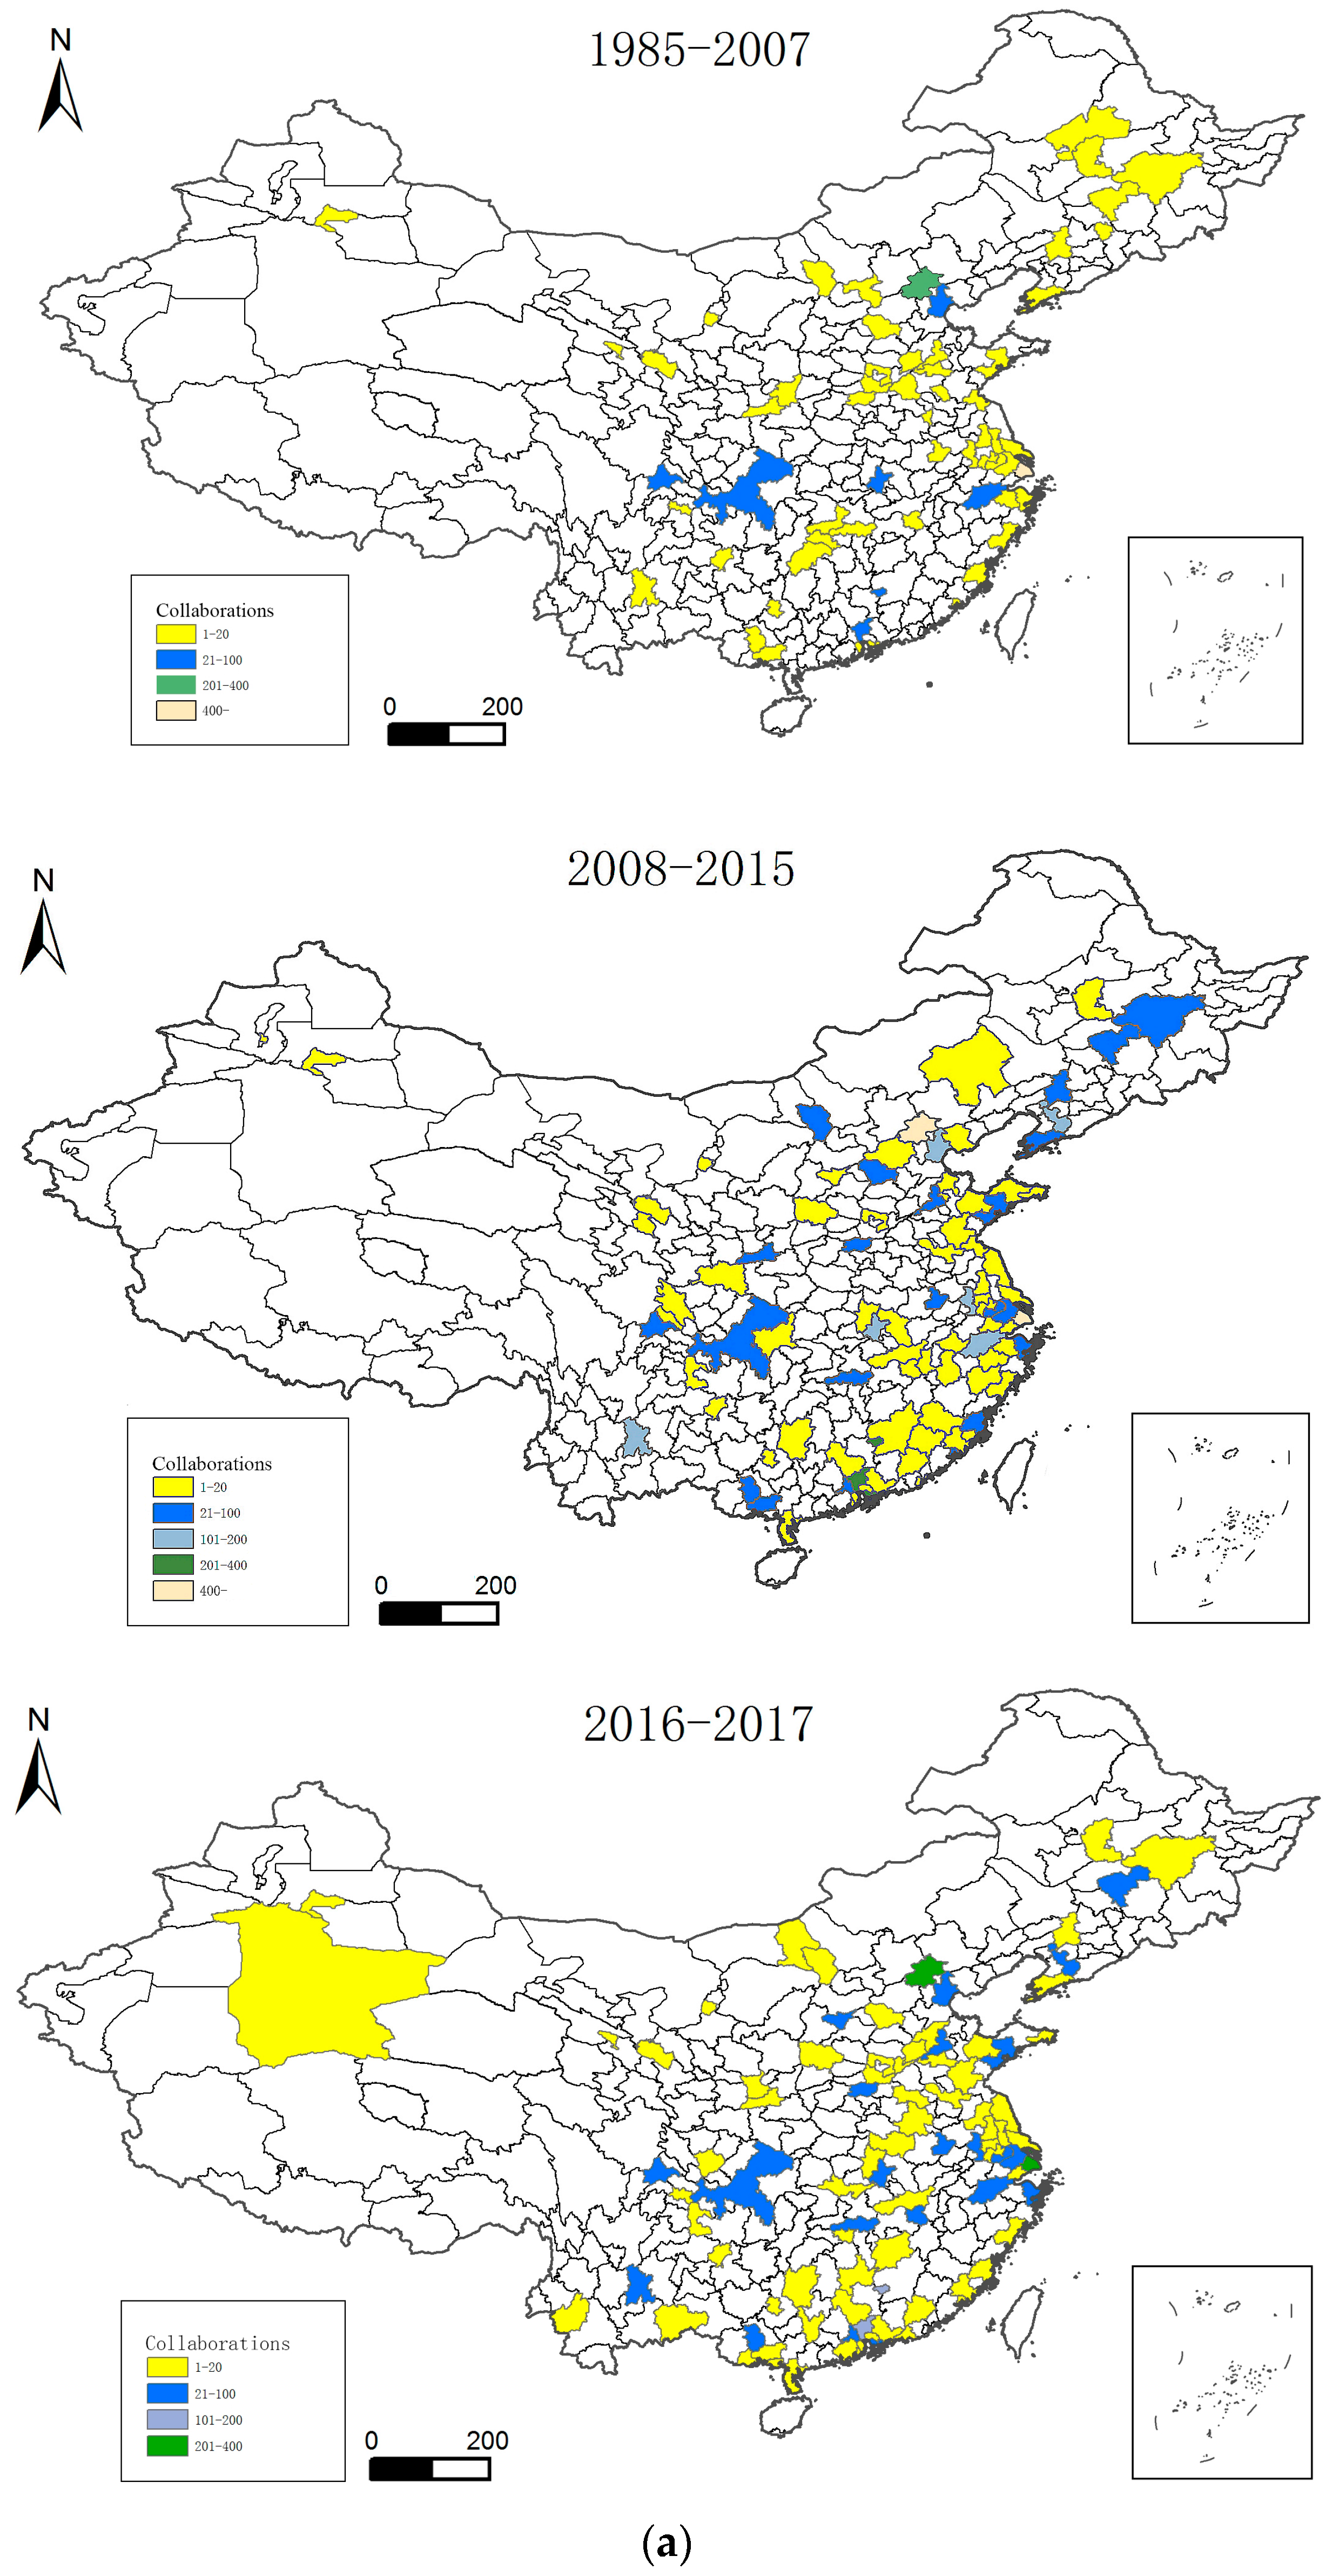

Figure A2.
The power-law-distribution curve of all nodes, with different degrees.

Figure A3.
The visualization of topological-network dynamics: (a,b) exhibit the dynamics of overall binarized and weighted topological-networks, respectively. Universities, research institutes, enterprises and other innovators are distinguished by dots of red, yellow, blue and black, respectively. The size of the dots in (a,b) represents their related degree-centrality and weighted degree-centrality, while the width of lines in (b) indicates the strength of connections between innovators.


Table A1.
Dynamics of the top 20 nodes (innovators) with the highest Degree Centrality and Absolute Degree Centrality.
Table A1.
Dynamics of the top 20 nodes (innovators) with the highest Degree Centrality and Absolute Degree Centrality.
| 1985–2007 | 2008–2015 | 2016–2017 | |||
|---|---|---|---|---|---|
| Innovator/DC/Ab-DC (Binarized) | Innovator/DC/Ab-DC (Weighted) | Innovator/DC/Ab-DC (Binarized) | Innovator/DC/Ab-DC (Weighted) | Innovator/DC/Ab-DC (Binarized) | Innovator/DC/Ab-DC (Weighted) |
| Tsinghua Univ /33/0.025 | Fudan Univ /357/0.001 | Zhejiang Univ /85/0.02 | Beijing Dabeinong Group Co., Ltd./367/0 | Jiangnan Univ /43/0.014 | Jiangnan Univ /89/0.001 |
| East China Univ of S&T/29/0.022 | Shanghai Bodao Gene Tech Co., Ltd./195/0.001 | Jiangnan Univ /70/0.017 | BGI Co., Ltd. /229/0 | Nanjing Agriculture Univ/31/0.01 | COFCO NHRI Co., Ltd./81/0.001 |
| Fudan Univ /28/0.021 | Tsinghua Univ /100/0 | East China Univ of S&T/54/0.013 | BGI Research Institute Co., Ltd./181/0 | South China Agricultural Univ/29/0.01 | Zhangzhou Aonong Biotech Co., Ltd./77/0.001 |
| Zhejiang Univ /25/0.019 | NCGR-Shanghai, CAS /80/0 | Shanghai Jiao tong Univ/49/0.012 | COFCO Co., Ltd. /164/0 | Zhejiang Univ /25/0.008 | Guangzhou Aonong Biotech Co., Ltd./66/0.001 |
| SIBS, CAS /24/0.018 | Shanghai Bode Gene Tech Co., Ltd./62/0 | South China Agricultural Univ/47/0.011 | COFCO NHRI Co., Ltd. /149/0 | Sun Yat-sen Univ/22/0.007 | South China Agricultural Univ/64/0.001 |
| Nankai Univ /14/0.011 | East China Univ of S&T /52/0 | Tsinghua Univ /41/0.01 | Zhejiang Univ /139/0 | East China Univ of S&T/20/0.007 | COFCO Co., Ltd. /61/0.001 |
| Shandong Univ /14/0.011 | SIBS, CAS /41/0 | Nanjing Agriculture Univ/40/0.01 | Jiangnan Univ /131/0 | Huazhong Agricultural Univ/20/0.007 | Zhejiang Univ /59/0.001 |
| Sun Yat-sen Univ /14/0.01 | Sino Geno Max Co., Ltd. /38/0 | Hunan Agriculture Univ/39/0.009 | Tsinghua Univ /125/0 | Tsinghua Univ /20/0.007 | Fujian Aonong Biotech Co., Ltd./58/0.001 |
| IOZ, CAS /13/0.01 | Beijing Capitalbio Co., Ltd. /34/0 | Sun Yat-sen Univ /39/0.009 | East China Univ of S&T /114/0 | Yunnan Agricultural Univ/18/0.006 | Beijing Dabeinong Group Co., Ltd./50/0 |
| China Agriculture Univ /13/0.01 | Zhejiang Univ /32/0 | IOM, CAAS /38/0.009 | Shanghai Jiao tong Univ /105/0 | Shang Academy of Agriculture/16/0.005 | Tsinghua Univ /48/0 |
| Peking Univ /12/0.009 | NCGR, CAS /31/0 | Fudan Univ /35/0.008 | Shang Academy of Agriculture/88/0 | Beijing Dabeinong Group Co., Ltd./15/0.005 | Zhejiang Huitide Life Tech Co., Ltd./47/0 |
| Sino Geno Max Co., Ltd./12/0.009 | Nankai Univ /27/0 | BGI Co., Ltd. /35/0.008 | COB, Beijing Dabeinong Group Co., Ltd./85/0 | Hunan Agricultural Univ/15/0.005 | East China Univ of S&T /44/0 |
| Jiangnan Univ /12/0.009 | Sun Yat-sen Univ /26/0 | China Agriculture Univ /35/0.008 | Sun Yat-sen Univ /82/0 | South China Univ of Technology /15/0.005 | Nanjing Agriculture Univ /44/0 |
| Shanghai Jiao tong Univ/12/0.009 | South China Agricultural Univ/24/0 | Beijing Dabeinong Group Co., Ltd./34/0.008 | Xiamen Univ /81/0 | Shanghai Jiao tong Univ/15/0.005 | Sun Yat-sen Univ/ 38/0 |
| NCGR, CAS /11/0.008 | Shanghai Jiao tong Univ /24/0 | Huazhong Agricultural Univ/32/0.008 | Zhenjiang Univ of Technology /78/0 | Peking Univ /14/0.005 | Shanghai Jiao tong Univ /37/0 |
| Sichuan Univ /11/0.008 | SIOC, CAAS /21/0 | SIBS, CAAS /31/0.007 | Jiangsu Yangnong Chemical Co., Ltd./75/0 | CAIQ /14/0.005 | Beijing Annoroad Biotech Co., Ltd./36/0 |
| Nanjing Agriculture Univ/10/0.008 | Shenzhen Piki Biotech Co., Ltd./20/0 | Shang Academy of Agriculture/30/0.007 | Fudan Univ /72/0 | COFCO NHRI Co., Ltd. /14/0.005 | Wuhan Sunhy Biology Co.,Ltd/36/0 |
| SBM, CAMS /10/0.008 | Chongqing Univ /20/0 | Peking Univ /27/0.007 | Jiangsu Youshi Chemical Co., Ltd./72/0 | Fujian Aonong Biotech Co., Ltd./13/0.004 | Zhejiang Annoroad Biotech Co., Ltd./36/0 |
| South China Agricultural Univ/9/0.007 | CAIQ /19/0 | Nankai Univ /27/0.007 | South China Agricultural Univ/68/0 | Henan Univ of S&T /13/0.004 | Jinan Univ/35/0 |
| IOM, CAAS /9/0.007 | Chongqing Chongda Biotech Co., Ltd./19/0 | Genetics, CAAS /25/0.006 | Huazhong Agricultural Univ /67/0 | ISA, CAAS /13/0.004 | Jinhua Aonong Biotech Co., Ltd./34/0 |
Table A2.
Top 10 collaborations between innovators with the highest strength *.
| 1985–2007 | 2008–2015 | 2016–2017 |
|---|---|---|
| Collaboration/Strength | Collaboration/Strength | Collaboration/Strength |
| Fudan Univ- Shanghai Bodao Gene Tech Co., Ltd./195 | BGI Co., Ltd.-BGI Research Institute Co., Ltd./189 | COFCO Co., Ltd.-COFCO NHRI Co., Ltd./37 |
| Fudan Univ-Shanghai Bode Gene Tech Co., Ltd./159 | COFCO Co., Ltd.-COFCO NHRI Co., Ltd./133 | Sinochem Lantian Co., Ltd.—Sinochem Zciri Co., Ltd./37 |
| Fudan Univ- NCGR-Shanghai, CAS/62 | Sinochem Lantian Co., Ltd.—Sinochem Zciri Co., Ltd./87 | Zhenjiang Huitai Life Sci Co., Ltd.-Shanghai Bohui Biotech Co., Ltd./33 |
| Tsinghua Univ- Beijing Capitalbio Co., Ltd./52 | COB, Beijing Dabeinong Group Co., Ltd-Beijing Dabeinong Group Co., Ltd./83 | Shanghai Want Food Co., Ltd. -Shanghai Industrial Tech Institute/30 |
| Shenzhen Piki Biotech Co., Ltd.-CAIQ/21 | Jiangsu Yangnong Chemical Co., Ltd.-Jiangsu Youshi Chemical Co., Ltd./83 | COB, Beijing Dabeinong Group Co., Ltd-Beijing Dabeinong Group Co., Ltd./28 |
| Chongqing Univ- Chongqing Chongda Biotech Co., Ltd./19 | Jiangsu Yangnong Chemical Co., Ltd.- Sinopec RIPP/70 | Shanghai Institute of Pharmaceutical Industry-China Institute of Pharmaceutical Industry/24 |
| SINOCHEM Co., Ltd.-Shenyang SYRICI Co., Ltd./13 | Hangzhou EastChinapharm Co., Ltd.- Zhejiang Univ of Technology/60 | Shanghai Cathaybiotech Research Institute Co., Ltd.- Cathaybiotech Co., Ltd./24 |
| Guangdong Institute of Microbiology-Guangdong Huankai Microbiology Technology Co., Ltd./12 | Guangdong Dahuanong Animal Health Products Co., Ltd. -Zhaoqing Dahuanong BioPharm Co., Ltd./42 | Fujian Aonong Biotech Co., Ltd.-Zhangzhou Aonong Biotech Co., Ltd./22 |
| South China Agricultural Univ-Foshan Biochemical Tech Co., Ltd./7 | Tsinghua Univ- Beijing Capitalbio Co., Ltd./36 | Guangzhou Aonong Biotech Co., Ltd.-Zhangzhou Aonong Animal Husbandry S&T Co., Ltd./19 |
| Huazhong Univ of S&T- Guangzhou Tebsun Biotec Co., Ltd./7 | Beijing Dabeinong Feed Co., Ltd.-Beijing Dabeinong Group Co., Ltd./83 | Hubei Huayang Group Co., Ltd.-Wuhan Sunhy Biology Co.,Ltd./19 |
* Strength means the number of connections (collaborations) established between two innovators and is shown on the right of each collaboration in the table.
Table A3.
Indicators of the topological network.
| Innovators | Collaborations | Collaborations (Weighted) | Average Degree | Average Degree (Weighted) | Density | Centralization | Average Path-Length | Cluster Coefficient | |
|---|---|---|---|---|---|---|---|---|---|
| 1985–2007 | 1308 | 2258 | 4154 | 1.726 | 1.59 | 0.001 | 0.024 | 6.716 | 0.085 |
| 2008–2015 | 4154 | 8786 | 18,736 | 2.115 | 2.26 | 0.001 | 0.02 | 6.208 | 0.067 |
| 2016–2017 | 3005 | 5502 | 10,651 | 1.831 | 1.77 | 0.001 | 0.0137 | 8.36 | 0.054 |
References
- Castells, M. The space of flows. Rise Netw. Soc. 1996, 1, 376–482. [Google Scholar]
- Wiley, S. Rethinking nationality in the context of globalization. Commun. Theory 2004, 14, 78–96. [Google Scholar] [CrossRef]
- Bergman, E. Embedding network analysis in spatial studies of innovation. Ann. Reg. Sci. 2009, 43, 559–565. [Google Scholar] [CrossRef]
- Bunnell, T.; Coe, N. Spaces and scales of innovation. Prog. Hum. Geogr. 2001, 25, 569–589. [Google Scholar] [CrossRef]
- Culot, G.; Orzes, G.; Sartor, M. The future of manufacturing: A Delphi-based scenario analysis on Industry 4.0. Technol. Forecast. Soc. Change 2020, 157, 1292. [Google Scholar] [CrossRef]
- Broekel, T.; Hartog, M. Explaining the structure of inter organizational networks using exponential random graph models. Ind. Innov. 2013, 20, 277–295. [Google Scholar] [CrossRef]
- Broekel, T.; Mueller, W. Critical links in knowledge networks: What about proximities and gatekeeper organizations? Ind. Innov. 2018, 25, 919–939. [Google Scholar] [CrossRef]
- Broekel, T. The co- evolution of proximities: A network level study. Reg. Stud. 2015, 49, 921–935. [Google Scholar] [CrossRef]
- Pyke, F.; Giacomo, B.; Werner, S. Industrial Districts and Inter-Firm Co-Operation in Italy; International Institute for Labour Studies: Rome, Italy, 1990; pp. 154–156. [Google Scholar]
- Saxenian, A. Regional networks and the resurgence of Silicon Valley. Calif. Manag. Rev. 1990, 33, 89–112. [Google Scholar] [CrossRef]
- Liyanage, S. Breeding innovation clusters through collaborative research networks. Technovation 1995, 15, 553–567. [Google Scholar] [CrossRef]
- Zhou, C.; Zeng, G.; Xin, X.; Bi, Z. The Dynamics of China’s Electronic Information Industry Innovation Networks: An Empirical Research Based on SAO Model. Econ. Geogr. 2018, 38, 116–122. [Google Scholar]
- Liu, C. The effects of innovation alliance on network structure and density of cluster. Expert Syst. Appl. 2011, 38, 299–305. [Google Scholar] [CrossRef]
- Lee, J.; Soonhee, K. Exploring the role of social networks in affective organizational commitment: Network centrality, strength of ties, and structural holes. Am. Rev. Public Adm. 2011, 41, 205–223. [Google Scholar] [CrossRef]
- Buskens, V.; Arnout, V. Dynamics of networks if everyone strives for structural holes. Am. J. Sociol. 2008, 114, 371–407. [Google Scholar] [CrossRef]
- Yan, E.; Ying, D. Applying centrality measures to impact analysis: A coauthorship network analysis. J. Am. Soc. Inf. Sci. Technol. 2009, 60, 2107–2118. [Google Scholar] [CrossRef]
- Wang, J.; Mo, H.; Wang, F.; Jin, F. Exploring the network structure and nodal centrality of China’s air transport network: A complex network approach. J. Transp. Geogr. 2011, 19, 712–721. [Google Scholar] [CrossRef]
- Olesen, J.M.; Bascompte, J.; Dupont, Y.L. The smallest of all worlds: Pollination networks. J. Theor. Biol. 2006, 240, 270–276. [Google Scholar] [CrossRef]
- Chen, W.; Hua, X.; Qi, G. Dynamic analysis on the topological properties of the complex network of international oil prices. Acta Phys. Sin. 2010, 59, 4514–4523. [Google Scholar] [CrossRef]
- Breznik, K. Using social network analysis to identify innovation clusters. Int. J. Innov. Learn. 2016, 19, 272–285. [Google Scholar] [CrossRef]
- Turkina, E.; Assche, A.V.; Kali, R. Structure and evolution of global cluster networks: Evidence from the aerospace industry. J. Econ. Geogr. 2016, 16, 1211–1234. [Google Scholar] [CrossRef]
- Heinisch, D.; Nomaler, Ö.; Buenstorf, G.; Frenken, K.; Lintsen, H. Same place, same knowledge–same people? The geography of non-patent citations in Dutch polymer patents. Econ. Innov. New Technol. 2016, 25, 553–572. [Google Scholar] [CrossRef]
- Martin, D.; Vicente, O.; Beccari, T.; Kellermayer, M.; Dundar, M. A brief overview of global biotechnology. Biotechnol. Biotechnol. Equip. 2021, 35, 354–363. [Google Scholar] [CrossRef]
- Goel, S.; Grewal, S.; Singh, K.; Dwivedi, N. Impact of biotechnology and nanotechnology on future bread improvement: An overview. Indian J. Agric. Sci. 2019, 89, 39–41. [Google Scholar] [CrossRef]
- Rosegrant, M.; Claudia, R. World food markets into the 21st century: Environmental and resource constraints and policies. Aust. J. Agric. Resour. Econ. 1997, 43, 401–428. [Google Scholar] [CrossRef]
- Spielman, D. Pro-poor agricultural biotechnology: Can the international research system deliver the goods? Food Policy 2007, 32, 189–204. [Google Scholar] [CrossRef]
- Mansfield, E. Academic research and industrial innovation. Res. Policy 1991, 20, 1–12. [Google Scholar] [CrossRef]
- Rosenberg, N.; Richard, R. American universities and technical advance in industry. Res. Policy 1994, 23, 323–348. [Google Scholar] [CrossRef]
- Bougrain, F.; Bernard, H. Innovation, collaboration and SMEs internal research capacities. Res. Policy 2002, 31, 735–747. [Google Scholar] [CrossRef]
- Alyssa, P.; Zilberman, D.; Parker, D. The advent of biotechnology and technology transfer in agriculture. Technol. Forecast. Soc. Change 1993, 43, 3–4. [Google Scholar]
- Beuzekom, B.; Anthony, A. OECD Biotechnology Statistics-2006; OECD: Paris, France, 2006; pp. 154–155. [Google Scholar]
- Qian, X.U.; Xiao-Man, L.I.; Hao, X.N.; Sun, W. Research on the Patent Retrieval Strategy for Agricultural Biotechnology. Biotechnol. Bull. 2018, 34, 215–220. [Google Scholar]
- Taylor, M.; Andrew, T. The technology life cycle: Conceptualization and managerial implications. Int. J. Prod. Econ. 2012, 140, 541–553. [Google Scholar] [CrossRef]
- Scott, J. Social network analysis. Sociology 1988, 22, 109–127. [Google Scholar] [CrossRef]
- Hu, R.; Wang, Y.; Cai, J.; Huang, J.; Wang, X. Agricultural research investment in China. China Soft-Sci. 2016, 7, 27–32. [Google Scholar]
- Cui, J.; Li, T.; Wang, Z. High-Speed Railway and Collaborative Innovation: Evidence from University Patents in China. In Proceedings of the 2019 Asia Pacific Innovation Conference: Innovation in an Era of Population Aging, Beijing, China, 10 October 2019. [Google Scholar]
- Uzzi, B.; Jarrett, S. Collaboration and creativity: The small world problem. Am. J. Sociol. 2005, 111, 447–504. [Google Scholar] [CrossRef]
- Chen, Z.; Guan, J. The impact of small world on innovation: An empirical study of 16 countries. J. Informetr. 2010, 4, 97–106. [Google Scholar] [CrossRef]
- Fleming, L.; King, C.; Juda, A.I. Small worlds and regional innovation. Organ. Sci. 2007, 18, 938–954. [Google Scholar] [CrossRef]
- Lin, M.; Li, N. Scale-free network provides an optimal pattern for knowledge transfer. Phys. A Stat. Mech. Its Appl. 2010, 389, 473–480. [Google Scholar] [CrossRef]
- Zhang, D.; Zu-Guang, H.U. Scale-free Characteristic of Technological Innovation Network Based on the Matlab Simulation. Syst. Eng. 2011, 29, 63–68. [Google Scholar]
- Zhao, J.; Xu, K. Enhancing the robustness of scale-free networks. J. Phys. A Math. Theor. 2009, 42, 195003. [Google Scholar] [CrossRef]
- Ribeiro, L.C.; Rapini, M.S.; Silva, L.A.; Albuquerque, E.M. Growth patterns of the network of international collaboration in science. Scientometrics 2018, 114, 159–179. [Google Scholar] [CrossRef]
Figure 1.
Methodology synthesis. ① to ⑧ represents every step from data collection to topological-network analysis and is indicated as step 1 to step 8 in the following text.
Figure 1.
Methodology synthesis. ① to ⑧ represents every step from data collection to topological-network analysis and is indicated as step 1 to step 8 in the following text.
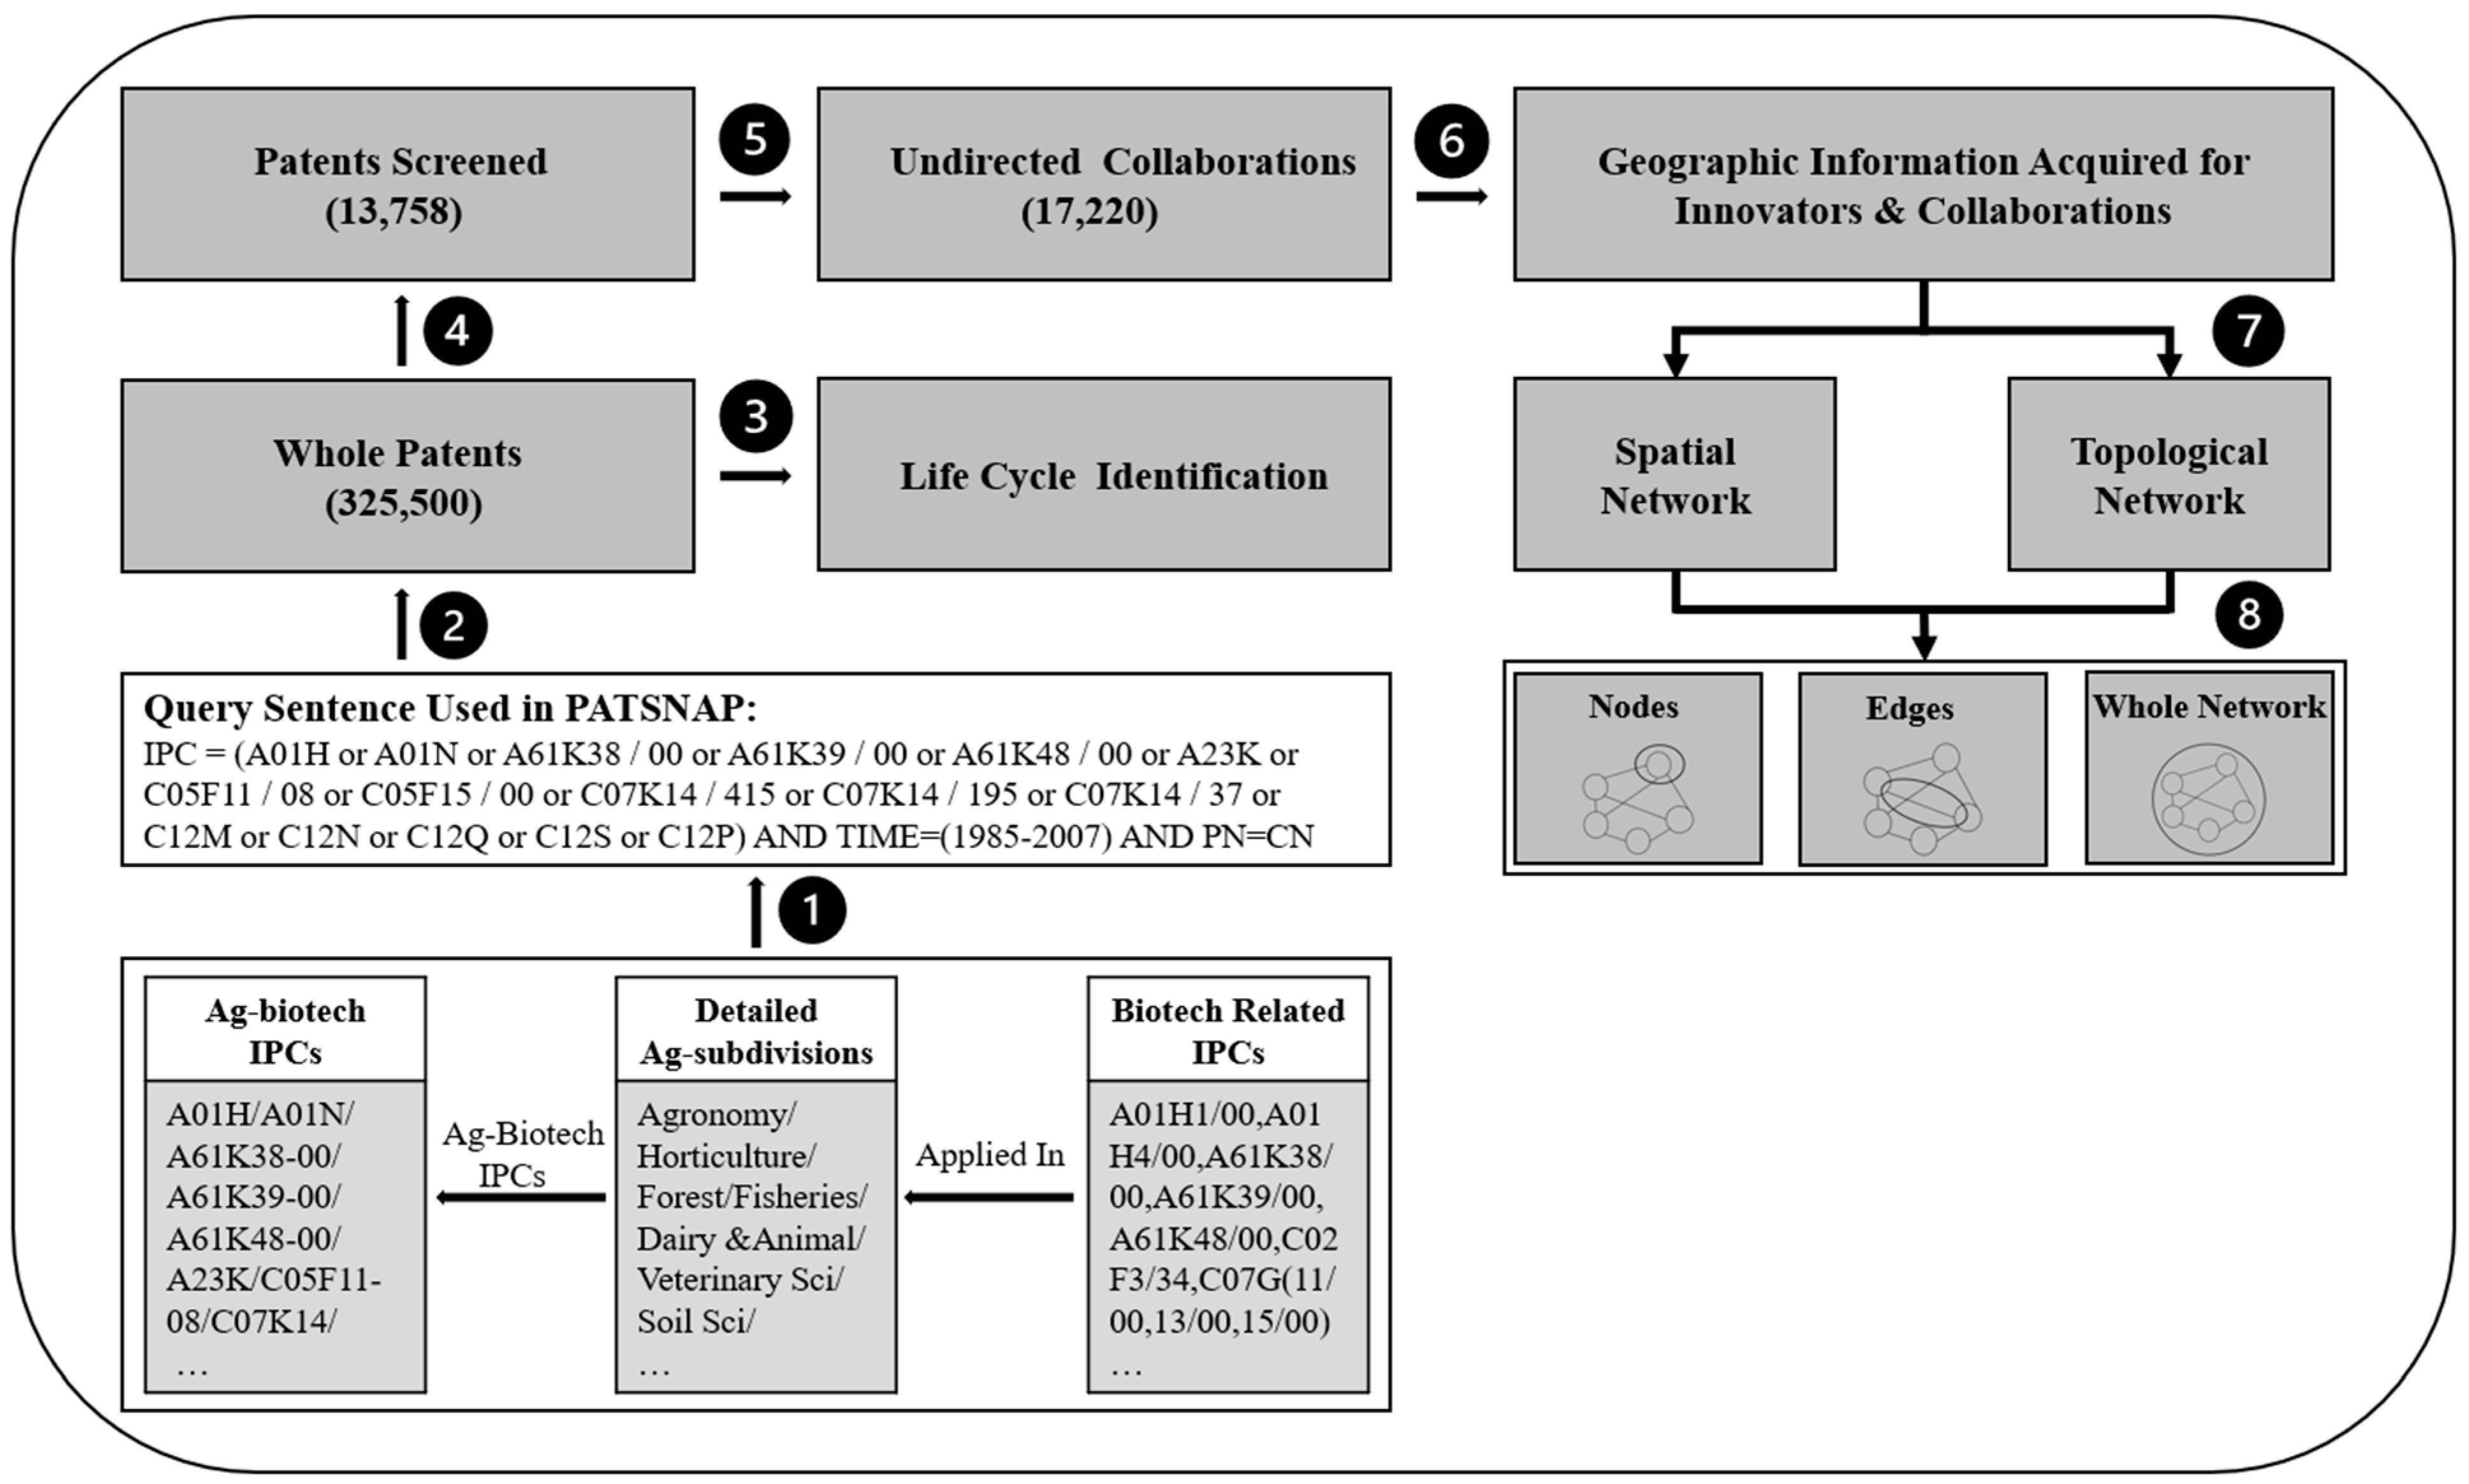
Figure 2.
S-curve of China’s agricultural biotechnology. The black nodes and dotted line are the actual number of patents and the fitted curve, respectively.
Figure 2.
S-curve of China’s agricultural biotechnology. The black nodes and dotted line are the actual number of patents and the fitted curve, respectively.
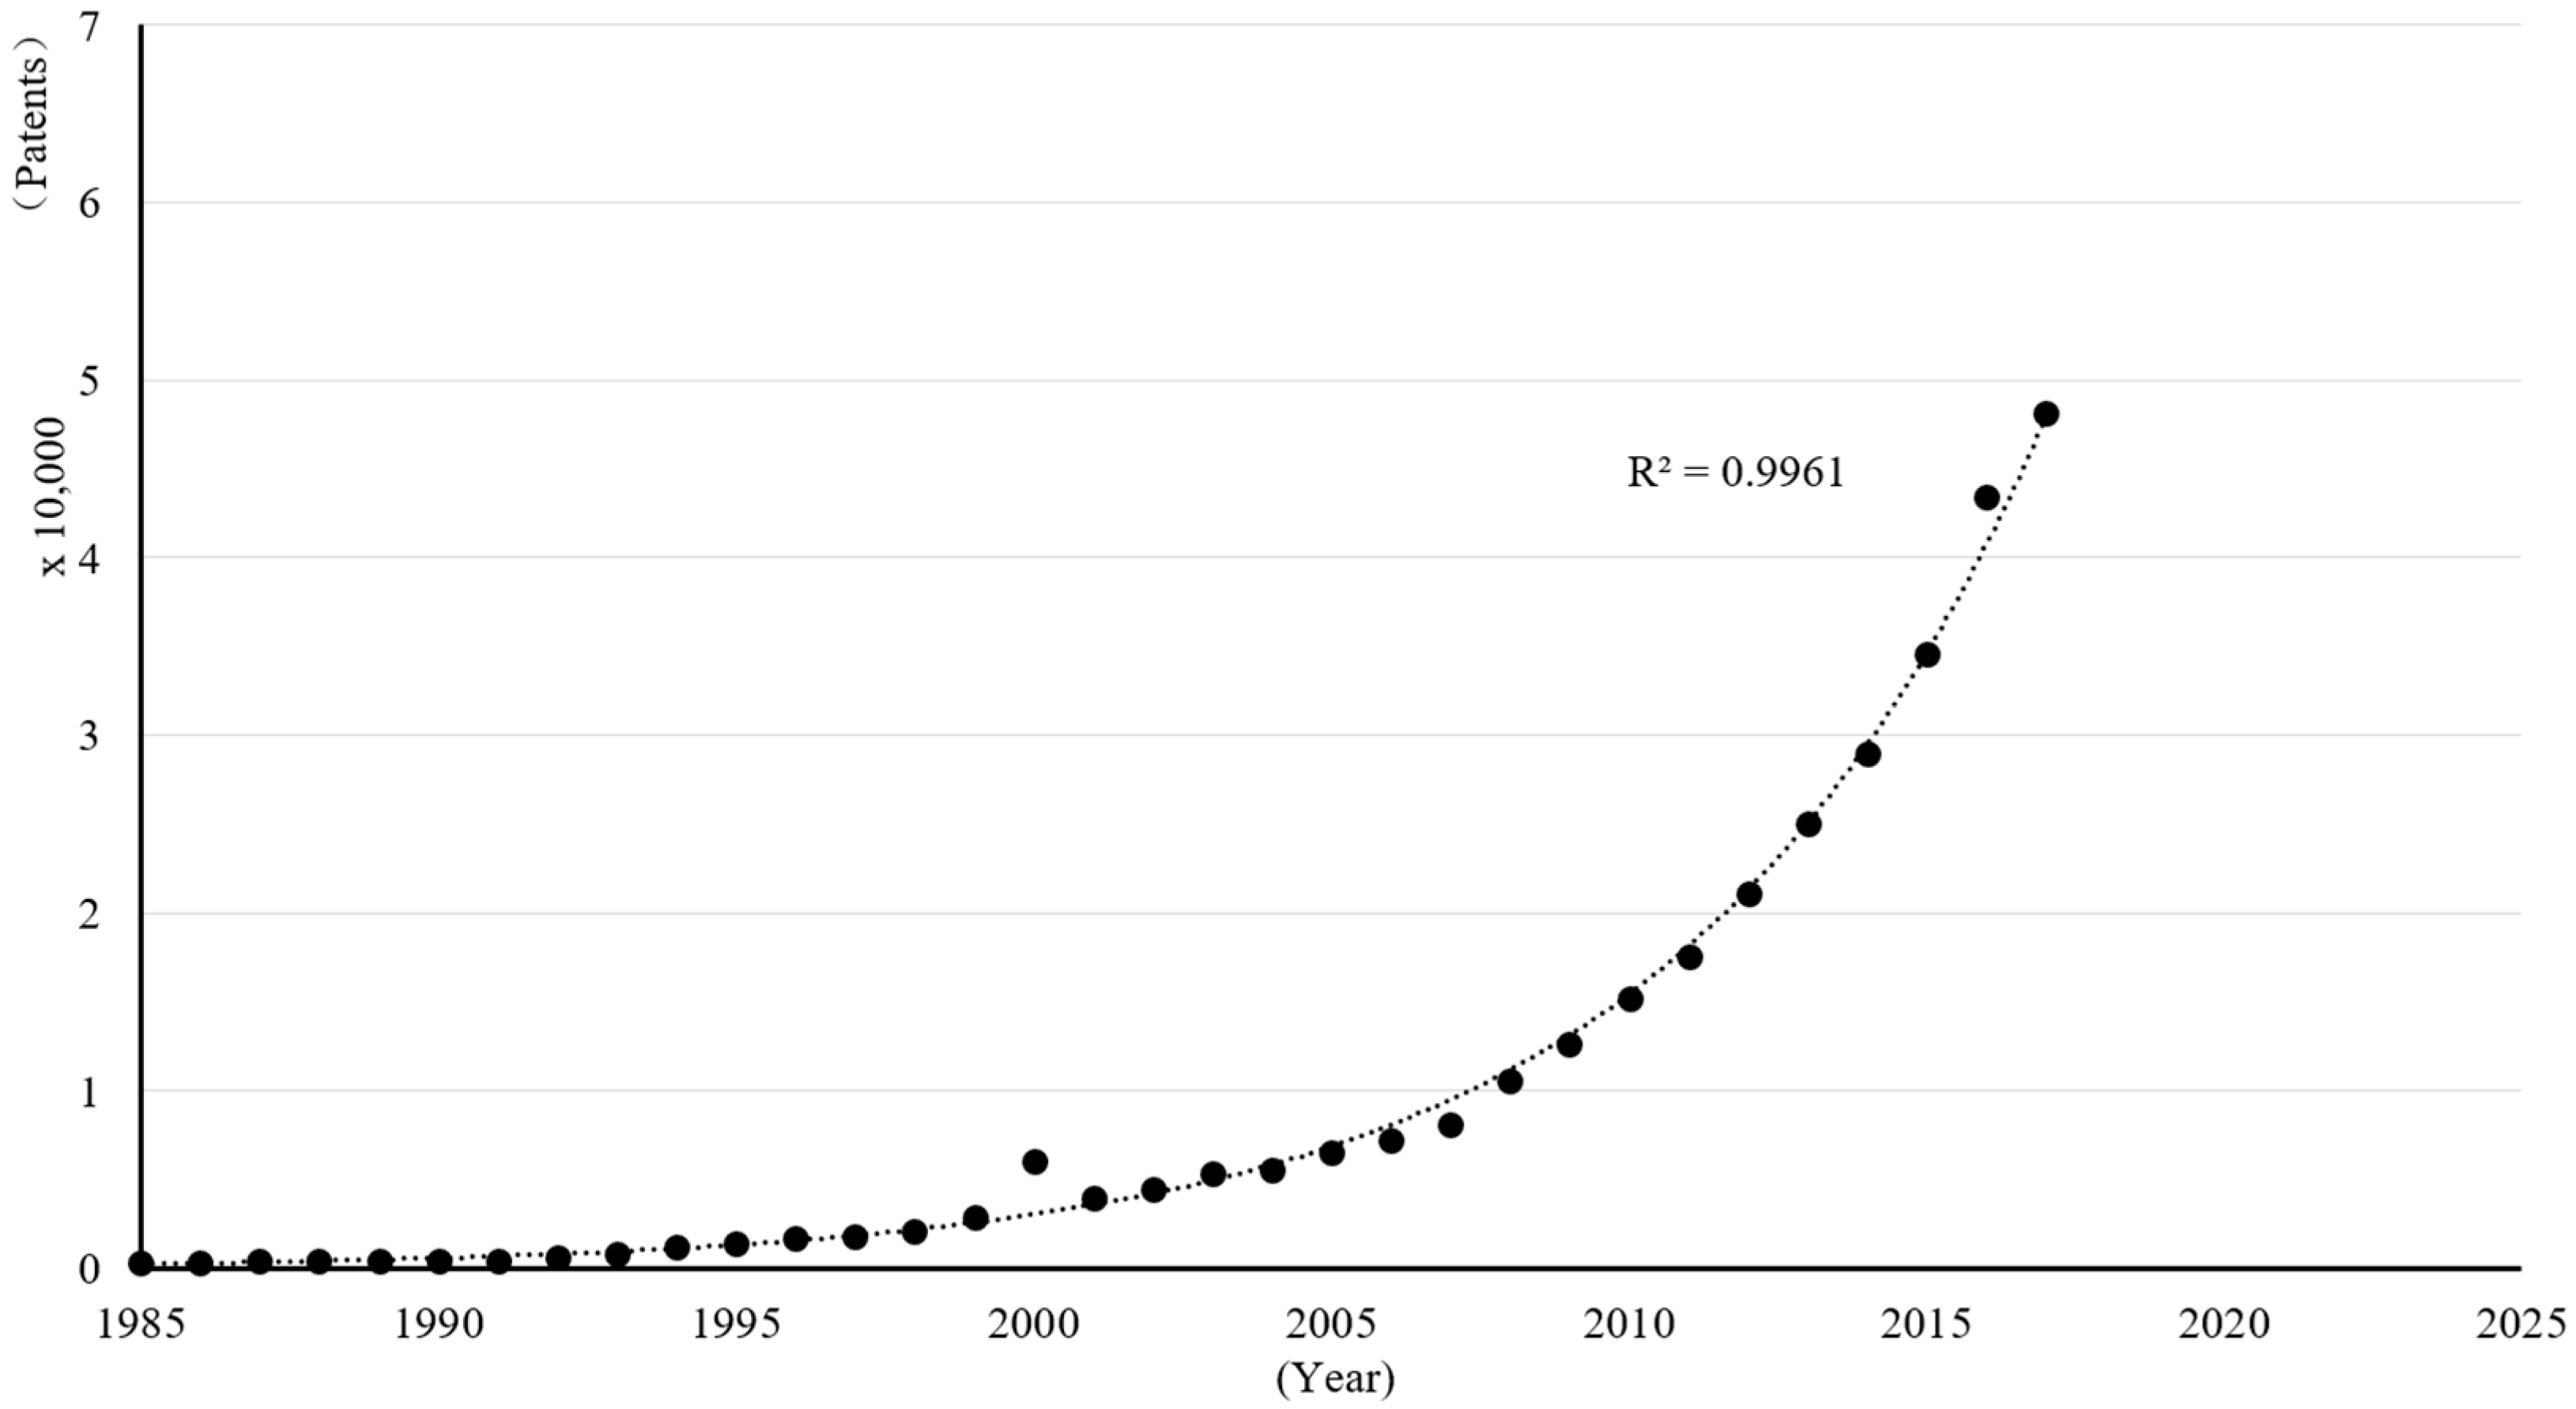
Figure 3.
The spatial scale (a) and spatial distance (b) of collaborations. Spatial scale in this study includes local, regional and inter-provincial, referring to cooperation established in the same city, in the same province but different cities, and in different provinces, respectively. Spatial distance indicates the average geographical distance of all cooperations established in the same year.

Figure 4.
Dynamics of the collaboration styles. Notes: U, R, I and O represent universities, research institutes, innovators from industry (enterprises) and other innovators, respectively.
Figure 4.
Dynamics of the collaboration styles. Notes: U, R, I and O represent universities, research institutes, innovators from industry (enterprises) and other innovators, respectively.

Table 1.
Top 10 Cities with the highest Degrees-Centrality and Absolute-Degree- Centrality in each phase.
Table 1.
Top 10 Cities with the highest Degrees-Centrality and Absolute-Degree- Centrality in each phase.
| 1985–2007 | 2008–2015 | 2016–2017 |
|---|---|---|
| City/DC/Ab-DC | City/DC/Ab-DC | City/DC/Ab-DC |
| Beijing/348/0.04 # | Beijing/1712/0.032 # | Beijing/815/0.045 # |
| Shanghai/225/0.026 * | Shanghai/706/0.013 * | Guangzhou/483/0.027 § |
| Shenzhen/90/0.01 § | Shenzhen/619/0.012 § | Shanghai/471/0.026 * |
| Guangzhou/88/0.01 § | Guangzhou/540/0.01 § | Shenzhen/309/0.017 § |
| Suzhou/74/0.009 * | Suzhou/397/0.007 * | Nanjing/228/0.013 * |
| Hangzhou/73/0.008 * | Hangzhou/374/0.007 * | Hangzhou/218/0.012 * |
| Chongqing/68/0.008 | Nanjing/366/0.007 * | Tianjin/213/0.012 # |
| Nanjing/64/0.007 * | Tianjin/351/0.007 # | Suzhou/195/0.011 * |
| Qinzhou/56/0.006 | Qinzhou/331/0.006 | Wuhan/146/0.008 |
| Wuhan/48/0.006 | Shenyang/285/0.005 | Chengdu/136/0.008 |
Notes: Label #, * and § represent cities in the Beijing-Tianjin region, the Yangtze River Delta region and the Pearl River Delta region, respectively.
Table 2.
Top 10 collaborations among cities with the highest strength.
| 1985–2007 | 2008–2015 | 2016–2017 |
|---|---|---|
| Collaboration/Strength | Collaboration/Strength | Collaboration/Strength |
| Beijing #–Shanghai */57 | Beijing #–Hangzhou */120 | Guangzhou §–Shenzhen §/76 |
| Shanghai *–Suzhou */40 | Beijing #-Shenzhen §/108 | Beijing #–Shanghai */53 |
| Beijing #–Qinzhou/28 | Beijing #–Chongqing/104 | Beijing #–Hangzhou */53 |
| Qinzhou–Fushun/26 | Beijing #–Qinzhou/91 | Beijing #–Tianjin #/44 |
| Shanghai *–Hangzhou */24 | Beijing #–Tianjin #/82 | Beijing #–Shenzhen §/42 |
| Beijing #–Lianyungang/23 | Shenzhen §–Yangzhou */71 | Shanghai *–Suzhou */42 |
| Shanghai *–Chongqing/20 | Beijing #–Shanghai */69 | Shanghai *–Ningbo */40 |
| Beijing #–Chongqing/19 | Zhongshan §–Guangzhou §/67 | Beijing #–Nanjing */36 |
| Shenzhen §–Dongguan §/19 | Beijing #–Changsha/58 | Beijing #–Chongqing/36 |
| Beijing #–Tianjin #/18 | Beijing #–Lianyungang/52 | Shanghai *–Shenzhen §/36 |
Notes: # refers to cities in the Beijing-Tianjin region; * indicates cities in the Yangtze River Delta region; § means cities in the Pearl River Delta region. The strength means the number of connections (collaborations) established between two cities and is showed on the right of each collaboration in the table.
Disclaimer/Publisher’s Note: The statements, opinions and data contained in all publications are solely those of the individual author(s) and contributor(s) and not of MDPI and/or the editor(s). MDPI and/or the editor(s) disclaim responsibility for any injury to people or property resulting from any ideas, methods, instructions or products referred to in the content. |
© 2023 by the author. Licensee MDPI, Basel, Switzerland. This article is an open access article distributed under the terms and conditions of the Creative Commons Attribution (CC BY) license (https://creativecommons.org/licenses/by/4.0/).
Share and Cite
MDPI and ACS Style
Ma, H. The Dynamics of China’s Collaborative Innovation Network in Agricultural Biotechnology: A Spatial-Topological Perspective. Systems 2023, 11, 73. https://doi.org/10.3390/systems11020073
AMA Style
Ma H. The Dynamics of China’s Collaborative Innovation Network in Agricultural Biotechnology: A Spatial-Topological Perspective. Systems. 2023; 11(2):73. https://doi.org/10.3390/systems11020073
Chicago/Turabian StyleMa, Hongkun. 2023. "The Dynamics of China’s Collaborative Innovation Network in Agricultural Biotechnology: A Spatial-Topological Perspective" Systems 11, no. 2: 73. https://doi.org/10.3390/systems11020073
Note that from the first issue of 2016, this journal uses article numbers instead of page numbers. See further details here.