
Spatial-Temporal Evolution and Driving Factors of Regional Green Development: An Empirical Study in Yellow River Basin


1
Industry & Innovation Research Center, and Business Logistics Research Center of Yellow River Basin, College of Economics and Management, Zhengzhou University of Light Industry, Zhengzhou 450001, China
2
College of Computer and Communication Engineering, Zhengzhou University of Light Industry, Zhengzhou 450001, China
3
Department of Mechanical Engineering, Indian Institute of Technology (IIT BHU), Varanasi 221005, India
*
Author to whom correspondence should be addressed.
Systems 2023, 11(2), 109; https://doi.org/10.3390/systems11020109
Submission received: 10 January 2023
/
Revised: 16 February 2023
/
Accepted: 17 February 2023
/
Published: 20 February 2023
(This article belongs to the Special Issue Recent Advances and Applications of Forecasting and Evaluation Techniques in Energy, Environment and Economy Management)
Abstract
:The sustainable development of the Yellow River Basin (YRB) is regarded as a national strategy for China. Previous literature has focused on the green efficiency measurement of YRB, ignoring its evolution process and influential mechanism. This paper tries to disclose the spatial-temporal evolution of green efficiency and its influential mechanism of the YRB region by proposing a novel integrated DEA-Tobit model to fill the gap. Based on the development path of the YRB region, the multi-period two-stage DEA model is adopted to evaluate the green development efficiency (GDE) from provincial and urban dimensions. In addition, the panel Tobit model is developed to investigate the influential factors of the GDE for the YRB region. The GDE in the YRB region shows an unbalanced state where the downstream is best, followed by the middle and upstream. The unbalanced development also exists within the province. Both Henan and Shandong Province achieved the optimal value, while cities in these two provinces show lower green efficiency. The results also show that economic development, technological innovation and foreign capital utilization obviously affect the GDE of the YRB region positively, while industrial structure, urbanization levels and environmental regulation have negative effects.
1. Introduction
Driven by industrial achievement, technical improvement and global trade, China has witnessed rapid economic and social development. From the initial stage of reform and opening up to 2021, the GDP has increased by about 309 times. At the same time, the extensive production mode has caused indelible damage to the environment over the years, and the total energy consumption is as high as 5.24 billion tons of standard coal in 2021 [1]. In order to protect the environment, as early as 2007, the report of the 17th National Congress of the Communist Party of China (CPC) included the basic state policy of conserving resources and protecting the environment. The report of the 18th National Congress of the CPC in 2012 called for building a resource-conserving and environment-friendly society, and emphasized fully implementing the overall plan for promoting economic, political, cultural, social and ecological progress, laying a solid foundation for green development. As an important ecological barrier and economic zone in China, the YRB accounts for more than 25% of China’s GDP, and the population accounts for more than 30% of the country [1]. With continuous economic growth, however, the process of industrialization and urbanization is facilitated; excessive exploitation of resources and the discharge of industrial waste water have caused many environmental problems in the YRB. The green transformation and upgrading of high pollution industries in the Yellow River basin are vital [2,3,4].
The YRB has been the mainstay of economic, social and cultural development in the long history of China. However, the early YRB sought economic development at the expense of the environment. For decades, the extensive production mode has resulted in expensive resource costs and environmental costs, and the pursuit of GDP increase has led to serious ecological problems such as water and sediment imbalance [5,6,7], industrial pollution [7], river siltation [8], etc. Years of poverty and weakness have hindered the sustainable development of the Yellow River basin [9,10]. Different from the superior geographical position of the Yangtze River basin, which has seven top ten cities in GDP, the geographical position of the Yellow River basin is far less than that of the Yangtze River basin, and there are only two national central cities, Xi’an and Zhengzhou. In addition, the upper, middle and lower reaches of the Yellow River have a huge span. The western part of the Yellow River is vast and sparsely populated, far away from the coast, and its development is limited due to geographical location and a lack of leadership from big cities, resulting in uneven development [11,12].
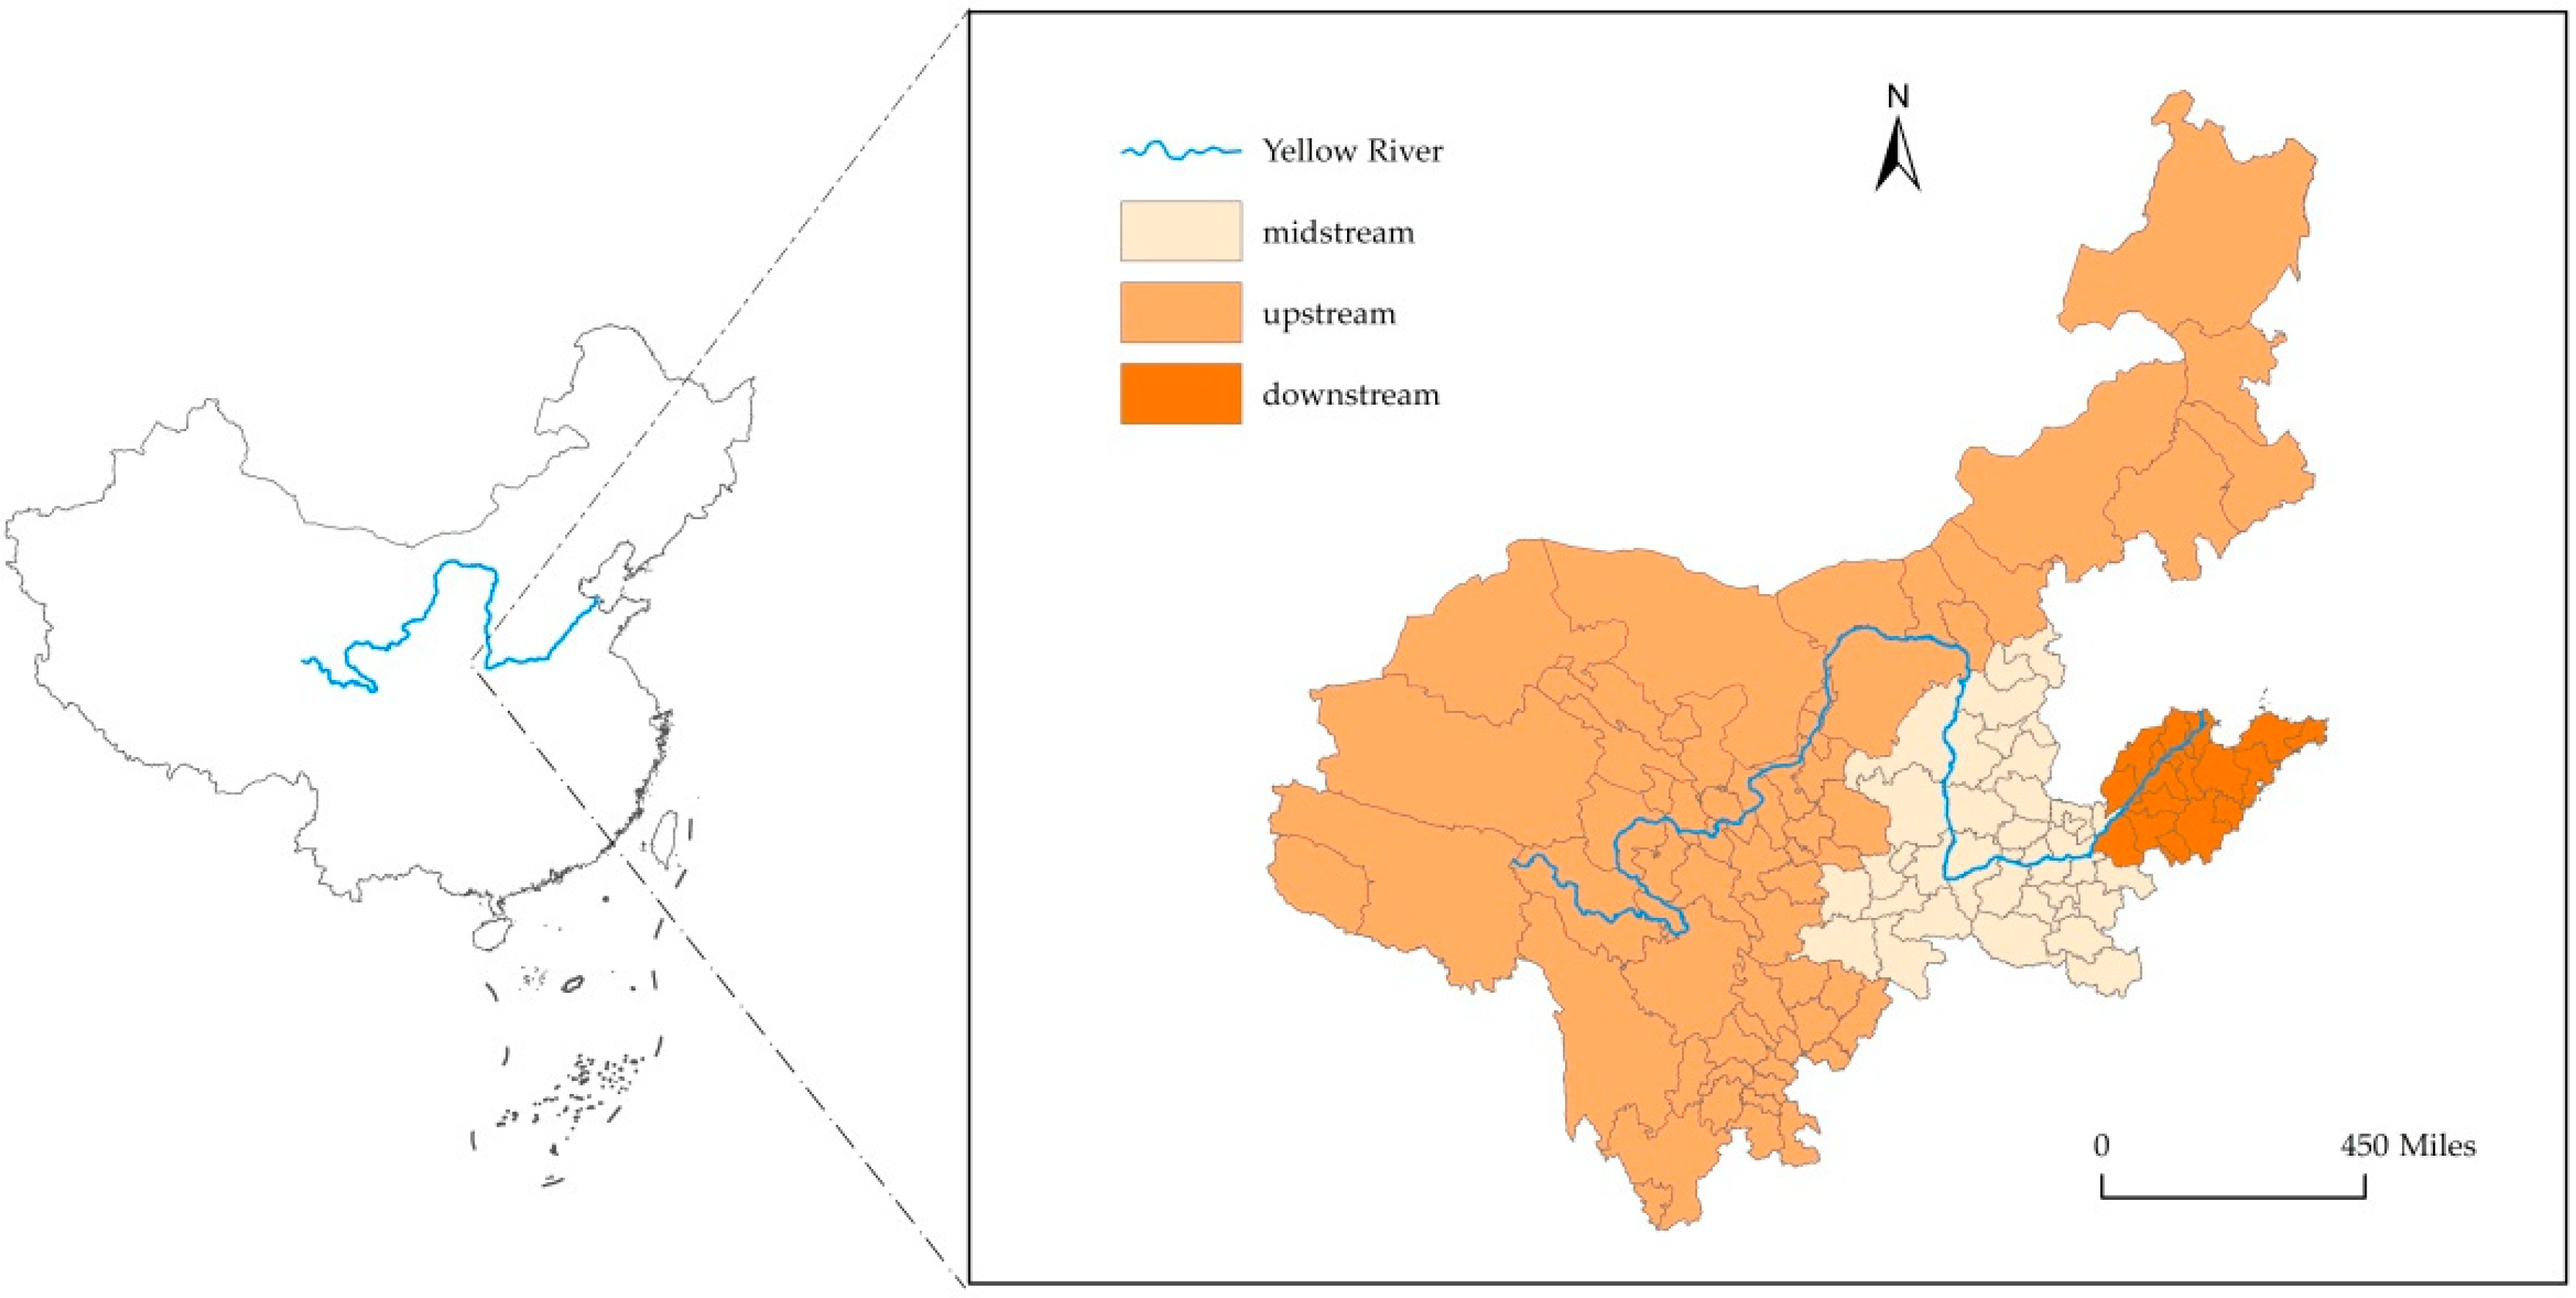
Compared with the Yangtze River basin [4,13,14,15], there is little research on the YRB, especially on the green development measurement from the different dimensions of provinces and cities [1,8]. As a crucial strategic area that is related to the overall development of the nation, the YRB economic belt has a prominent ecological status, and plays an important role in the process of the green transformation of China [1,2,5,6]. With the development strategy and planning of the national government, the development of the YRB is progressively being paid attention. For example, in 2015, the fifth plenary session of the 18th Central Committee of the CPC raised green development to a new level as one of the five development concepts. In 2021, the 14th Five-Year Plan adheres to the concept that lucid waters and lush mountains are invaluable assets, emphasizing once again to promote ecological protection and the high-quality development of the YRB [16,17]. Recently, academic researchers have gradually paid attention to study of the YRB, but have mainly focused on the qualitative analysis and the theoretical basis [1,2]. This paper tries to analyze the green efficiency of the YRB region and its driving factors considering the heterogeneity of YRB development, providing policy suggestions for its future development. Nine provinces and 16 key cities along the YRB are selected as the research objects of this paper, as shown in Figure 1.
Driven by the requirements of sustainable development achievements, the YRB has aroused great attention from industrial practitioners and academic researchers. There are litter studies focusing on sustainable development issues of the YRB, comparing with the Yangtze River Basin and the Beijing–Tianjin–Hebei Region. Several studies have investigated the current status of the YRB [1], and some have used DEA models to measure the eco-efficiency of the YRB. DEA is a technique to analyze the efficiency of multiple decision-making units with multiple inputs and multiple outputs by a linear programming method. Its basic formula assumes that there is a monotonous linear proportional relationship between inputs and outputs, and the efficiency score from 0 to 1 is obtained. The closer the score is to 1, the higher the efficiency of DMU, and the closer it is to 0, the lower the efficiency of DMU [18]. Wang et al. formulated a super SBM model to study the ecological efficiency of YRB cities, measured by the Moran’s I value of ecological efficiency [6]. Hao et al. extended the DPSIR-SBM model to measure the tourism ecological efficiency in the Yellow River Basin, analyzing the convergence characteristics and driving factors of tourism ecological efficiency [5]. The above-mentioned literature focuses more on qualitative analyses of the YRB, and the proposed countermeasures are based on the experiences of the reference areas (such as the YRB). All these studies focus on the YRB cities, ignoring the heterogeneity of different regions from a provincial dimension. In addition, these studies fail to help investigate the evolution of green development of the YRB.
To address these gaps, this study aims at developing a multi-period two-stage DEA model to help discover the green efficiency of the YRB. The two-stage DEA decision making framework is based on the development path experience of the YRB region. In addition, spatial-temporal evolution and the influential mechanism green development efficiency for the YRB is studied to help promote sustainability achievement from a theoretical viewpoint. The theoretical contributions of this study are threefold. Firstly, a novel multi-period two-stage DEA model is formulated to describe the green efficiency of the YRB, considering the development path experience of the YRB (economic development first and environmental governance later). Secondly, the green development efficiency of nine provinces and key cities in the YRB is investigated, and the heterogeneity and imbalance between regions are studied. Furthermore, the spatial-temporal evolution of green development efficiency along the Yellow River Basin is portrayed and addressed. Thirdly, the panel Tobit model is constructed to disclose the influence mechanism of green development in the YRB, facilitating policy making on the green development promotion of the YRB. In this study, the research objects and the formulated model are homogeneous and homomorphic with practical developments of the YRB, and the formulated model accords with the development law of economic development–environmental governance in the Yellow River Basin.
2. Literature Review
2.1. Efficiency Measurement Method and Research
In existing studies, the statistical and operational research methods are widely developed to the efficiency measurement, such as principal component analysis (GPCA) [13], entropy method [13] and the DEA model [19,20,21,22,23,24], etc. Data envelopment analysis (DEA) [19] has advantages over other methods because its measurement results are not affected by human subjective factors, and it has gradually been officially applied to efficiency measurements in academic fields. For example, Iram et al. employed the DEA model to measure the energy use efficiency of OECD countries [25]. Neykov et al. proposed a DEA–Malmquist productivity index to evaluate the economic efficiency of forestry enterprises and the main factors that affect the differences of efficiency scores [26]. However, the traditional DEA model based on radial efficiency does not take into account the slackness of input and output variables, and has the disadvantage of overestimating efficiency. Tone proposed a non-radial, non-angular SBM model, which includes not only proportional improvements between input and output variables, but also relaxation improvements between variables [27]. The SBM model [5,28,29,30,31] can break through the radial limitation of traditional models and overcome the efficiency problem of decision units on the production frontier. Some scholars began to use the improved SBM model to measure efficiency, such as environmental efficiency [14,28,29], energy efficiency [24,30,32] and carbon emission efficiency [29,33]. However, the improved SBM model ultimately measures the overall efficiency, and does not go deep into the internal structure of the decision-making unit, so it is difficult to explore the real reasons for the inefficiency and limits the effectiveness of internal subsystems. Kao et al. proposed different connection methods and efficiency decomposition methods for a two-stage DEA, and found that the overall efficiency under sequence structure is the product of different stages, and the relaxation improvement of the overall system under the parallel structure is the sum of the relaxation improvement of each sub-stage, which makes up for the deviation of the efficiency measurement caused by the traditional DEA’s emphasis on the whole while ignoring the local [34]. Liang et al. combined game theory ideas with the two-stage DEA model to evaluate the performance of supply chains and their members in cooperative and non-cooperative game situations, which realized the methodological innovation of the DEA model [35]. The two-stage DEA model is widely used in scenarios such as eco-efficiency [36,37], port operational efficiency [38] and technological innovation efficiency [39]. Therefore, this paper uses an improved multi-period two-stage DEA model based on the two-stage green development law of economic input–environmental governance in the YRB, which is able to perform dynamic analysis of the efficiency measures and spatial-temporal evolution characteristics of each stage in the YRB.
Regional studies on efficiency measurements mainly focus on national perspective [25,40], a river basin perspective (Yangtze River [14,15,33], Pearl River predominates [41]), a provincial perspective [42,43,44], etc. For example, Shuai and Fan measured the green economic efficiency of all provinces in China [21]. Chen and Jia measured the industrial environmental efficiency in different regions of China [28]. Wang et al. empirically quantified the CO2 emission efficiency in the Pearl River Delta [41]. Zhang et al. used an SBM model to analyze the formation mechanism and spatial correlation complexity of the carbon emission efficiency network in the Yangtze River Economic Belt [33]. In the choice of measurement, Liu et al. used labor, water and energy as input indicators [14]. Chen et al. and Wilson et al. incorporated innovation into the input indicators [45,46]. Datta et al. and Zhang et al. thought that a low-carbon economy can also be included in the input indicators [47,48]. In addition, Shua et al. and Chen et al. took economic development and environmental pollution as expected output and unexpected output indicators, respectively [21,28]. Previous publications mostly focused on the spatial-temporal heterogeneity of development efficiency at the spatial scale of provinces and urban agglomerations. However, due to the significant differences among cities, it is difficult to scientifically carry out research on the performance evaluation of green development only at the scale of cities. Therefore, this paper not only measures the green development efficiency of provinces in the YRB, but also measures the efficiency of important cities along the Yellow River. The development of the YRB is studied from both horizontal and vertical dimensions.
2.2. The Influencing Mechanism of Regional Development
Under the interaction and coupling of the system of economy–society–environment, the imbalance of natural resource conditions and human and social development factors interlace and influence each other, which leads to the spatial-temporal differentiation of regional development efficiency. The international research on the factors affecting the efficiency of regional development mainly focuses on geographical factors [41,42,49,50], economic factors [15,51,52] and so on. In terms of traditional geographical factors, the research focuses on urban form [41], policy heterogeneity [21,49,50], spatial influence [42] and other factors [45] that affect the region. For example, Wang et al. included the urban form into the influencing factors of CO2 emission efficiency of the Pearl River Delta [41]. Liu, Li and Zhong measured the innovation efficiency of 30 Provinces in China, and analyzed the impact intensity of innovation efficiency on energy consumption based on the spatial Dubin model [42]. With the development of the economy and society, the government has gradually attached importance to ecological protection, and has issued a series of environmental regulation policies, and related research has gradually increased. For example, Ren et al. classified environmental regulations into command-and-control regulation, market-oriented regulation, and voluntary regulation [49], and applied a STIRPAT model to test the impact of three kinds of environmental regulations on eco-efficiency in eastern, central and western China. Fan et al. computed the green innovation efficiency of 235 cities in Mainland China considering the heterogeneity of environmental regulations, and constructed a spatial measurement model based on a geographical weight matrix to verify the influence mechanism of environmental regulations on regional green innovation efficiency [50].
In terms of economic factors, the research focuses on industrial agglomeration [51], technological innovation [52], economic structure [15] and other factors affecting regional development efficiency. Guo, Tong and Mei measured the green development efficiency of Northeast China and used the Tobit Regression model to discuss the impact of industrial agglomeration on it [51]. Chen studied the impact of technological innovation, shadow economy and economic structural transformation on energy efficiency [52]. Yang et al. found that the per capita GDP and consumption level are the main driving factors of the ecological footprint of the Yangtze River Economic Belt [15]. Hou et al. found that the level of economic development in the Yangtze River Delta region has a positive impact on economic output, industrial structure and the level of foreign capital utilization have a negative impact on environmental governance performance, while the positive impact of R&D investment intensity is not obvious [13]. Thus, the formation of regional green development pattern differentiation is essentially economic development, technological innovation, industrial structure, urbanization level, environmental regulation, foreign capital utilization level and the interaction of other factors, so this paper selected the above factors to study the green development influence mechanism of the Yellow River basin.
3. Research Method
3.1. Data Sources and Index Selection
3.1.1. Index Selection for Green Efficiency Measurement
In this study, the novel multi-period two-stage DEA model is developed to measure the GDE of the YRB. Firstly, the related indexes should be established to describe the regional green efficiency. Three dimensions including resources, labor force and environmental pollution are usually to be taken into account in previous publications. For example, Iram et al. took primary energy consumption (PEC) and population as two basic inputs, and gross domestic product (GDP) and carbon dioxide emissions (CI) as expected output and unexpected output, to construct the evaluation index system of energy use efficiency for some countries’ Organization for Economic Co-operation and Development (OECD) economies [25]. Shuai and Fan selected economic, resource, social, industrial pollution and other related indicators, and used the super-efficient DEA model to measure the efficiency of China’s regional green economy [21]. Zameer et al. considered the status quo of natural and socio-economic development, constructed a coordinated development index system of natural resources, financial development and ecological efficiency, and discussed the coupling degree of eastern, central and western China [53]. Referring to the above literature, this paper chose the resources, labor, economic development and environmental pollution in the efficiency of the green development index evaluation along the Yellow River basin, and according to China’s national conditions and current situation of the development of the basin to increase the scientific and technological innovation and low-carbon economy into index evaluation. Table 1 shows the variables (inputs and outputs), their interpretation and descriptive statistics.
Based on the existing studies and considering the availability of data, nine provinces and sixteen crucial cities along the YRB were selected as samples in this paper (Upstream cities: Xining, Yinchuan, Shizuishan, Lanzhou, Baiyin, Hohhot, Baotou, Aba; Mid-stream cities: Xi’an, Yan’an, Yuncheng, Luliang, Zhengzhou, Luoyang; Downstream cities: Jinan, Liaocheng). The panel data from 2012 to 2020 are used to measure the green economic efficiency, green innovation efficiency and total efficiency. The data are from “China Statistical Yearbook”, “China Urban Statistical Yearbook”, “China Energy Statistical Yearbook”, “Environmental Statistical Bulletin”, “Water Resources Bulletin”, “National Economic and Social Development Statistical Bulletin”, etc.
3.1.2. Variable Description Influencing Green Development of YRB
This paper studies the factors that hinder green development of the YRB by the Tobit model. On the basis of studying the availability of existing literature and data, six indicators including economic development level, technological innovation, industrial structure, urbanization level, environmental regulation intensity and foreign capital utilization level were selected as explaining variables. GDE of provinces in the YRB from 2012 to 2020 was taken as the explained variable. The specific description of variables is as Table 2.
- (1)
- Explained variable
Green development efficiency (GFE): the explained variable of Tobit model is used to the GDE of provinces in the YRB from 2012 to 2020 measured by multi-period two-stage DEA model.
- (2)
- Explaining variables
- ①
- Economic development level (lnEDL): Regions with strong economic strength can provide substantial financial support for environmental governance. Due to the great financial capability, these regions could support energy conservation and pollutant emission reduction by adopting clean energy and innovative technologies. In order to promote the sustainable development of the economy and green transformation of industry while developing the economy, environmental governance should be taken into account. In this paper, log of per capita GDP is taken as the specific index of economic development level, the unit is yuan.
- ②
- Technological innovation (lnTI): The progress of science and technology can innovate enterprises’ green production and emission reduction technology, and improve the utilization rate of resources. Improve pollutant conversion and reduce environmental stress. In this paper, the log of proportion of internal R&D expenditure in GDP of provinces in the Yellow River Basin is used to reflect the level of technological innovation, the unit is %.
- ③
- Industrial structure (lnIS): Industrial structure is not only an important factor affecting the ecological environment, but also reflects the relationship between various industries in a region, and plays a significant role in economic development. As the main source of pollution emissions, the increase of the secondary industry proportion will aggravate pollution emissions and affect green development. This paper takes the log of proportion of the secondary industry in GDP as the specific index of the industrial structure, the unit is %.
- ④
- Urbanization level (lnUL): The improvement of urbanization construction can promote the spatial agglomeration of labor and resources, and the resource dependence of cities gradually increases, while increasing the pressure borne of local environment. The impact of urbanization on regional green development may be positive, only the improvement of environmental awareness brought by urbanization is greater than the environmental pressure. This paper takes the log of proportion of urban population in total population as the specific index of urbanization level, the unit is %.
- ⑤
- Environmental regulation (lnER): Promoting environmental regulation policies can speed up the elimination of high-polluting and energy-intensive industries, and encourage enterprises to develop and innovate to reduce energy consumption. This paper takes the log of proportion of regional industrial pollution control investment in regional GDP as a specific index of environmental regulation intensity, the unit is %.
- ⑥
- Foreign capital utilization level (lnFCU): The introduction of foreign enterprises may lead to the formation of “pollution paradise”, the relevant environmental protection supervision mechanism is not soundness, environmental awareness and industry standards are relatively weak. Therefore, improving the level of opening up may hinder the green development of provinces. This paper takes the log of proportion of actually utilized FDI in regional GDP as the specific index of foreign investment utilization level, the unit is %.
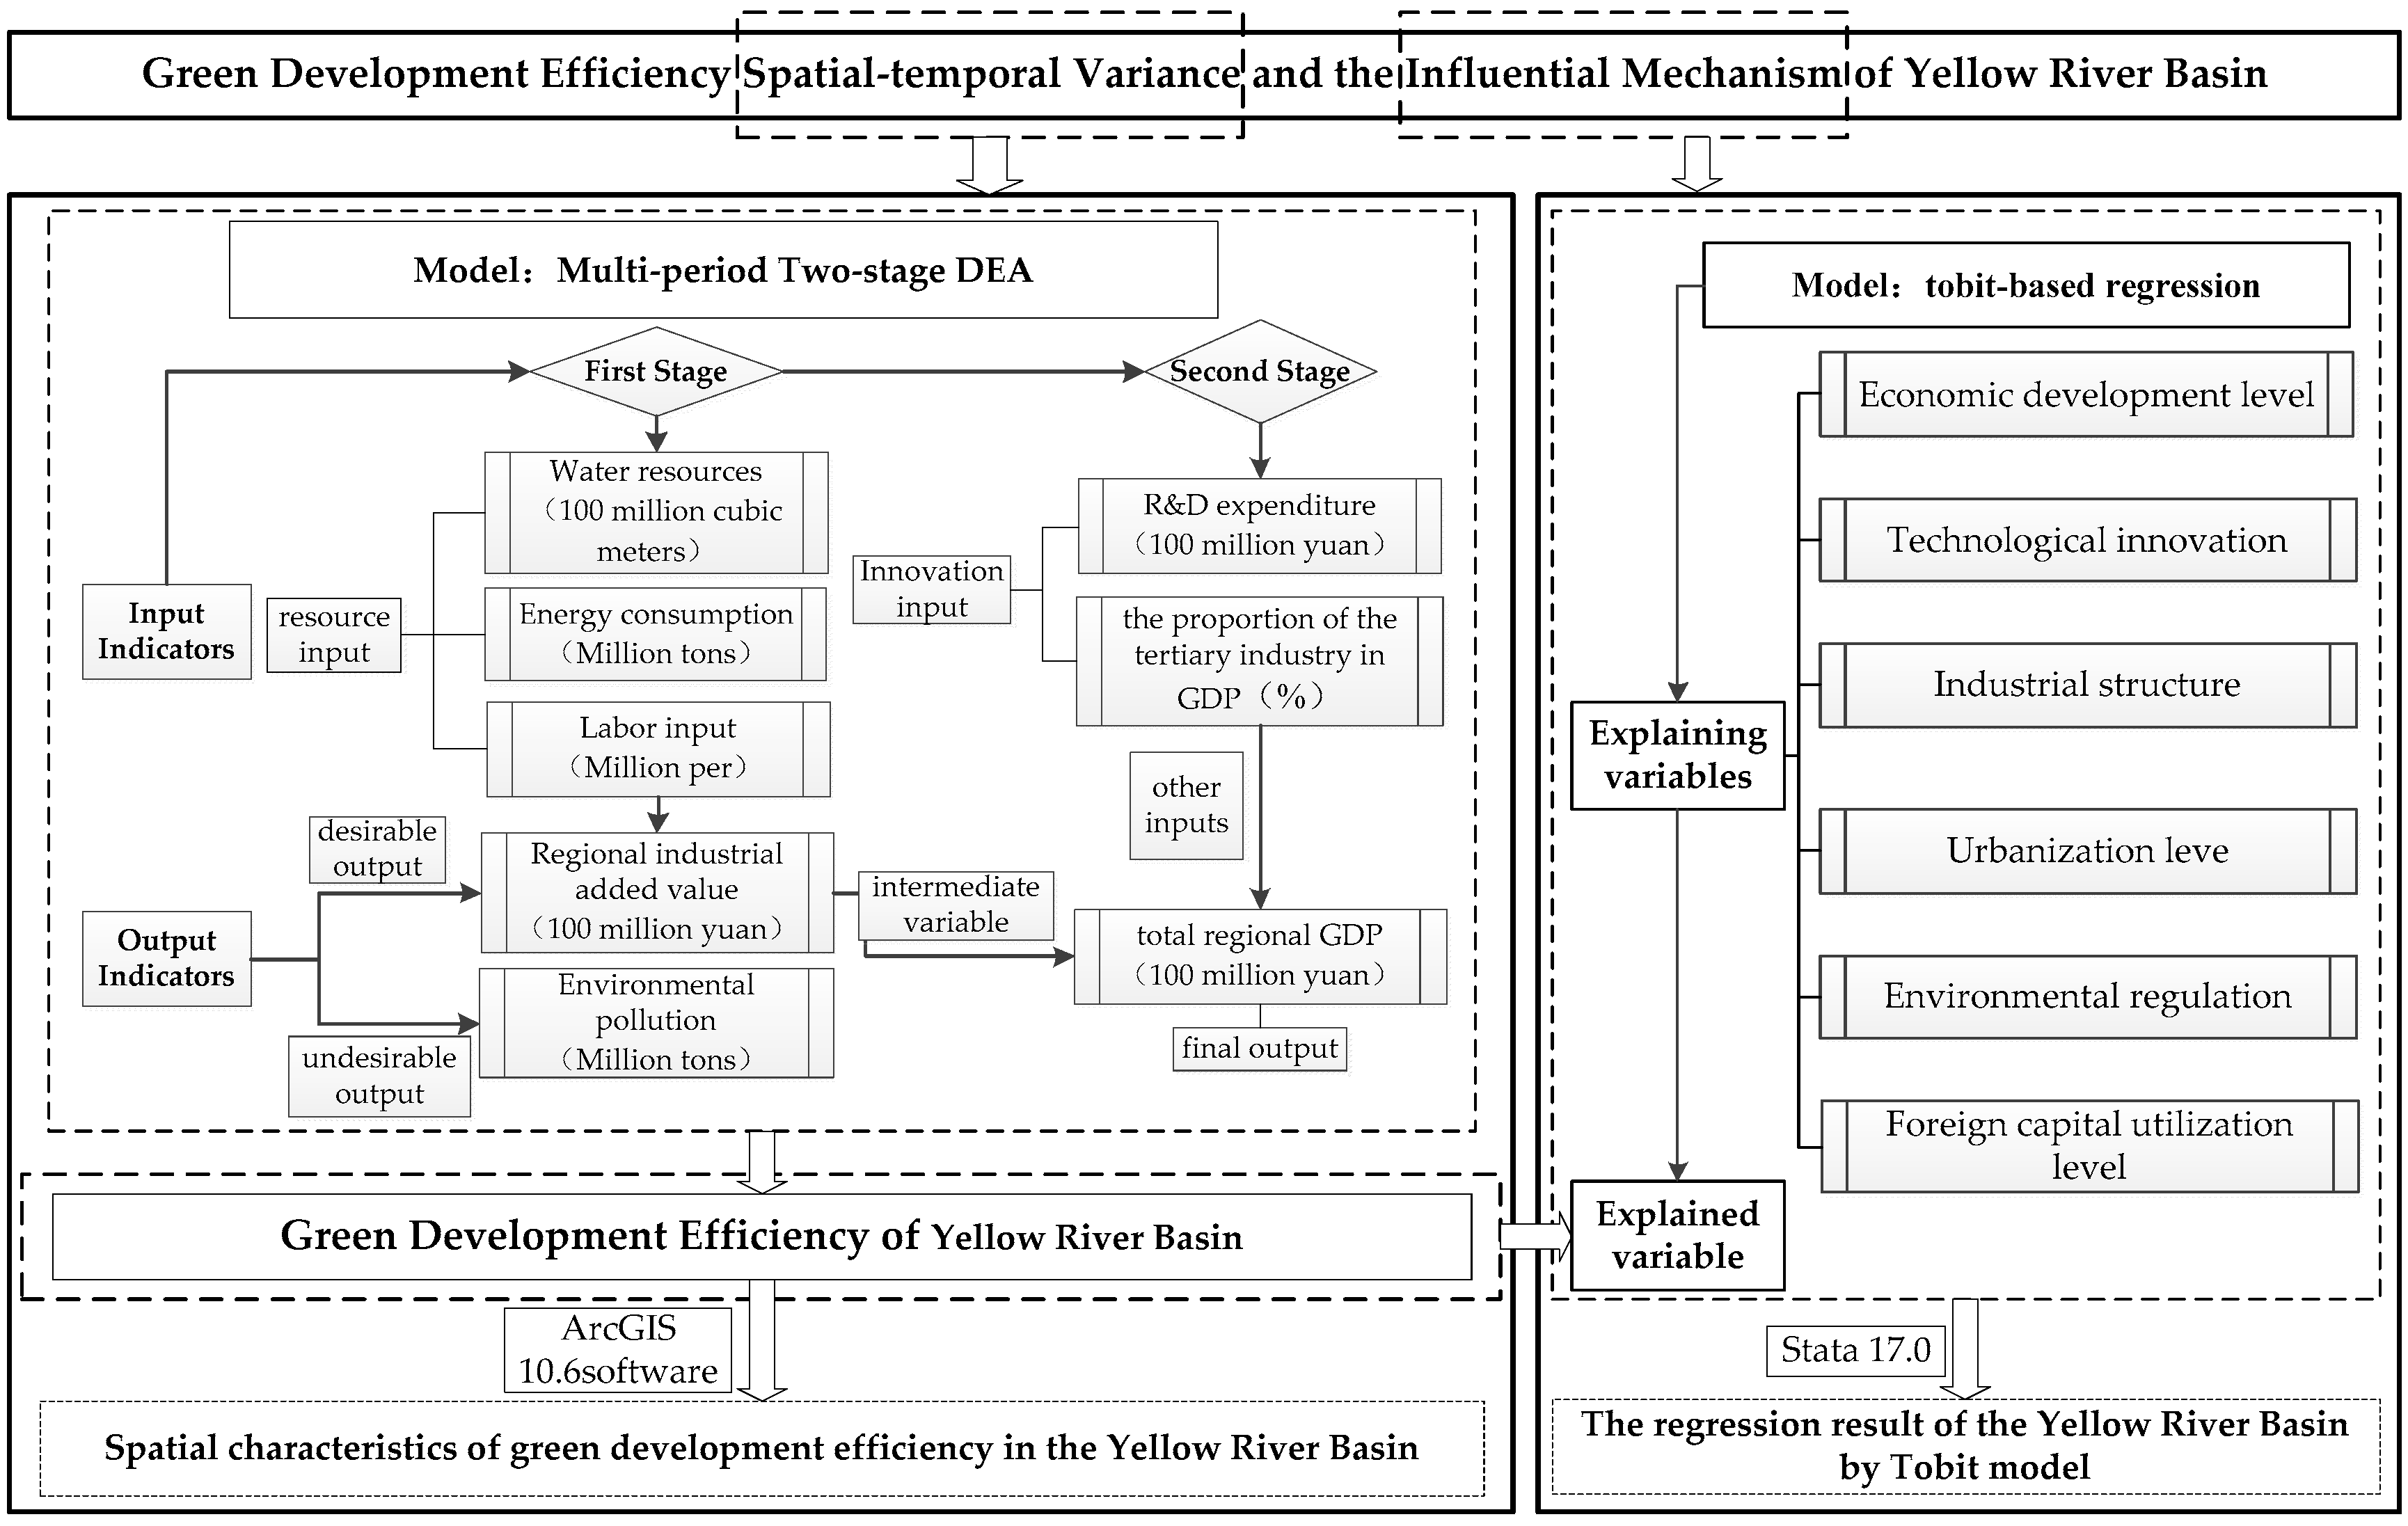
3.2. The Integrated Research Framework
This study is based on the current unbalanced situation in the development process of the YRB. Firstly, the multi-period two-stage DEA model is used to measure the green economic efficiency and green innovation efficiency of the YRB, and the development efficiency at different stages and comprehensive efficiency are obtained. The division of the two stages is consistent with the regional development law of “economic development and environmental governance” of the YRB, so as to grasp the evolution trend of the development of the YRB more accurately and look forward to future development. Secondly, after the analysis of efficiency measurement and empirical results, this paper also analyzes the factors affecting the development of the YRB through the Tobit model. Finally, scientific and reasonable policy suggestions are put forward after systematic research on the GDE and influence mechanism of the YRB. The research framework is as Figure 2.
3.3. Implementation Steps
3.3.1. Green Development Efficiency Measurement Based on Two-Stage DEA
In this section, we built a multi-period two-stage DEA model to measure the GDE of the YRB. The model includes green economic efficiency (first stage), green innovation efficiency (second stage) and comprehensive efficiency (total efficiency). There are DMUs and periods in the model, and each input is transformed into desirable output and undesirable output in the first stage. Then, in the second stage, the final output is produced based on the the desirable output of the first stage and additional inputs of the second stage. Indicators and variables in the formulated model are shown in the following Table 3.
By modifying the traditional data envelopment analysis model, a multi-period two-stage DEA model is established as shown in Model (1). The optimal overall efficiency of the DMU is ,the and is the efficiency of the first and second stages, respectively. The maximum value of model (1) is that the efficiency in each stage and cycle cannot exceed 1. We define , , , , and , which indicate data aggregation over different periods.
The input of the second stage makes model (1) become a nonlinear model. In order to obtain the optimal solution of the nonlinear model, two sets of constraint conditions in model (2) are added to measure the first-stage efficiency. The maximum overall efficiency of DMU in the first stage is .
The optimal efficiency of the first stage would be . Use to estimates it, where refers to the step size and is the iteration index. is set to be the maximum integer which should be less than the value of the first stage efficiency divided by step size. Therefore, value of increases from 0 to the maximum possible value in order to achieve the optimal overall efficiency. Let represent the optimal solution obtained from model (2), and represents the efficiency of DMU in the first stage of period , as shown in Equation (3).
Due to the error of and , formula (4) is introduced to assign the same weight to the first efficiency value of each period in order to maintain consistency.
To solve the problem that (4) has multiple solutions, Equation (5) allocates the same weight to the first stage efficiency of each period and decomposes the first stage efficiency into single efficiencies.
In order to measure the total efficiency and second stage efficiency, and are added to model (1) in Equation (3) as constraint conditions of model (6). First, the efficiency of the first stage is regarded as a constant and the total efficiency of all period is estimated. The focus of the first stage is to measure the efficiency of the green economy and multiplying it by the objective function. As the first stage efficiency, we measure the period efficiency by taking the first stage efficiency of cycle as a constant.
The optimal solution obtained from model (6), and defined under the optimal weight. The efficiency of the second stage is measured by Equation (7).
Finally, the overall efficiency of individual periods () is determined by . After is updated, the optimal efficiency is chosen by .
3.3.2. Tobit-Based Regression Model
In this paper, the efficiency measured by the multi-period two-stage DEA model ranges from 0 to 1, which is a restricted dependent variable. If ordinary least square method is used for regression, parameter estimation may be biased and inconsistent. The issue of a restricted dependent variable can be perfectly addressed by the Tobit regression model. Therefore, this paper adopts the panel Tobit model to analyze the strength and direction of the factors influencing GDE in the Yellow River Basin. The basic model is as follows:
In Formula (8), where denotes city, denotes year, is latent variable, is restricted dependent variable (GDE of the ith province in the p year measured by the multi-cycle two-stage DEA model), is the main influencing factor of GDE, is constant term, is regression coefficient vector, and is stochastic disturbance.
When , the following Tobit regression model is constructed based on the influencing factors:
where represents the GDE of the Yellow River Basin; lnEDI, lnTI, lnIS, lnUL, lnER and lnFCU, respectively, represent the economic development level, technological innovation, industrial structure, urbanization level, environmental regulation intensity and foreign capital utilization level; is constant value constant; is stochastic disturbance.
4. Results and Analysis
4.1. Spatial-Temporal Evolution Characteristics of GDE in YRB
Firstly, the time series characteristics of green development efficiency in the YRB are analyzed from the dynamic and static aspects. As shown in Table 4, the dynamic efficiency value of the YRB was calculated by MaxDEA Pro 7.16.0 software. When the efficiency value is equal to 1, it indicates that DMU is efficient.
From the overall perspective, the YRB showed a fluctuating upward trend of the GDE from 2012 to 2020. It increased from 2012 to 2016 gradually, declined from 2016 to 2017, and rose again from 2017 to 2019. In 2020, due to the impact of the global COVID-19 epidemic, it decreased by 1.89%, presenting an “M” shaped dynamic evolution. From the perspective of regional differences, the spatial distribution is “poor in the upper reaches, average in the middle reaches and excellent in the lower reaches”. In the upper reaches of the Yellow River, only Sichuan province has a higher efficiency over the years, with an average of 0.9701. It is lower in other provinces, with Qinghai, Gansu and Ningxia being 0.2354, 0.2773 and 0.2068, respectively. This paper holds that the economic development capacity of the upstream region is limited, but it carries a large number of enterprises with high pollution and high energy consumption. Government’s planning and control are also inadequate, which leads to excessive emissions and the difficult treatment of industrial pollutants. Therefore, these provinces should promote transformation and upgrading of industries and the rational regulation of resources.. In the middle reaches of the YRB, only Henan province has achieved DEA effectiveness, while the average value of Shanxi province is relatively low, which is 0.4402. Shanxi province is a resource-based city with abundant coal resources. Its economic development is at the cost of the ecological environment, so the level of green development continues to be low.
The lower reaches of the Yellow River are economically developed, and economic transformation and ecological protection are emphasized. For example, Shandong province’s eight development strategies, innovation-driven development strategy, and the transformation strategy of old and new driving forces, leading the GDE has reached DEA effectiveness over the years. It is worth noting that, although the overall efficiency of Henan and Shandong has reached the optimal value, the urban efficiency value has shown the contrary trend. The average efficiency of Jinan and Zhengzhou is relatively high, while that of Luoyang and Liaocheng is only 0.2624 and 0.3922, respectively. Therefore, the environmental problem in the development of medium-sized cities cannot be underestimated. While leading the development of cities, all provinces should also pay attention to their own ecological problems and industrial structure adjustments. The results show that improving the level of green development in the middle and upper reaches plays a key role in promoting the sustainable development of the whole region. Therefore, while maintaining economic development, the government should strengthen environmental protection for the middle and upper reaches of the Yellow River, implement the green development promoting plans, improve the quality and stability of the ecosystem, continuously improve environmental quality and accelerate the green transformation of the development mode.
Taking the provinces and cities’ GDE of the YRB in 2020 as an example, to evaluate the static evolution, according to Ma’s study [54], the level of green development is divided into four grades: excellent, good, average and poor, and the corresponding efficiency values are 1, 0.8–1, 0.6–0.8 and 0–0.6, respectively, as shown in Table 5.
Taken as a whole, the GDE of the YRB is in a general state in 2020, with the spatial layout of “poor in upstream, average in middle, and excellent in downstream” among the provinces. Most medium-sized cities have space for improvement, among which seven cities have achieved excellent green development, namely Sichuan, Henan and Shandong, as well as Baiyin, Aba prefecture, Yan’an and Luliang. As a demonstration province of green development in the upper reaches of the Yellow River, Sichuan is an important source of water protection and supply. In 2020, the Political Consultative Conference of Sichuan, Gansu and Qinghai provinces and Aba, Gannan, Guoluo and Huangnan (the border areas of the three provinces) held the “Seminar on the Development of the Upper Reaches of the Yellow River”, emphasizing the need to continuously boost the high-quality development of ecological protection and the conservation of water. In 2019, Aba Prefecture proposed to build a new development pattern of “building a solid ecological barrier, taking the green development demonstration belt as the leader and promoting the whole ecology”. These require scientific control and management of the ecological environment in order to achieve the construction of a national ecological demonstration area.
Yinchuan and Xi’an’s green development level is not bad; Xining, Shizuishan, Hohhot, and Zhengzhou are at a general level. They are all provincial capitals except Shizuishan, the provincial capital city of the province’s economic, political and cultural center. Environmental governance is often taken into account while developing the economy. With the high pollution enterprise gradually moving out, its GDE is also higher. Since 2016, Shizuishan has focused on drainage into the Yellow River. While focusing on the treatment of industrial wastewater and urban and rural sewage, the whole region and the whole process of agricultural water pollution control have been promoted, striving to improve the water quality and protect the ecological environment. Several ecological protection projects and documents have been continuously promoted, such as “Comprehensive Regulation Plan for Diannong River Watershed in Shizuishan” and “Rectification Plan for Implementing the Feedback opinions of Ecological environmental protection Supervision in Shizuishan Municipality”, and have achieved considerable results. Xining, Hohhot, Baotou, Xi’an, Yuncheng and Jinan urgently need to improve their green development level while developing their economies, and there are also many environmental problems. The model of “pollution first, treatment later” is not desirable. In order to pursue all-round, sustainable and stable development, it is necessary to take into account environmental protection and treatment while developing the economy, and adhere to the path of green low-carbon development.
After a detailed analysis of the green comprehensive development efficiency in various provinces and cities in 2020, it is found that there are three different situations in which the efficiency does not reach 1.0000, as shown in Table 6.
In the provinces and cities of type I, when the efficiency of Shizuishan, Xi’an and Zhengzhou are less than one in both stages, the levels of green development are not low, reaching 0.7419, 0.8022 and 0.6175, respectively. It is self-evident that the provincial capital cities attach great importance to environmental governance, and Shizuishan’s governance and planning for the ecological environment and water resources improvement are also very constructive. Type II and III cities are located in the upper reaches of the Yellow River, and their green development level is low. In the process of economic development, the upper reaches received many enterprises with high energy consumption and high pollution, which have a great impact on the environment. In type II cities, the second-stage efficiency of Xining and Yinchuan is 0.6639 and 0.7202, respectively, and the total efficiency is 0.7728 and 0.8308. Therefore, the second stage efficiency value will affect the green development level of the city. On the basis of achieving DEA effectiveness in economic efficiency in the first stage, the city should focus on increasing input in green innovation efficiency of the second stage, and promoting the transformation of scientific and technological achievements. Similarly, on the premise that the efficiency of type III cities reaches DEA effectiveness in the second stage, they should strengthen the economic input and the disposal of pollutant emissions in the first stage.
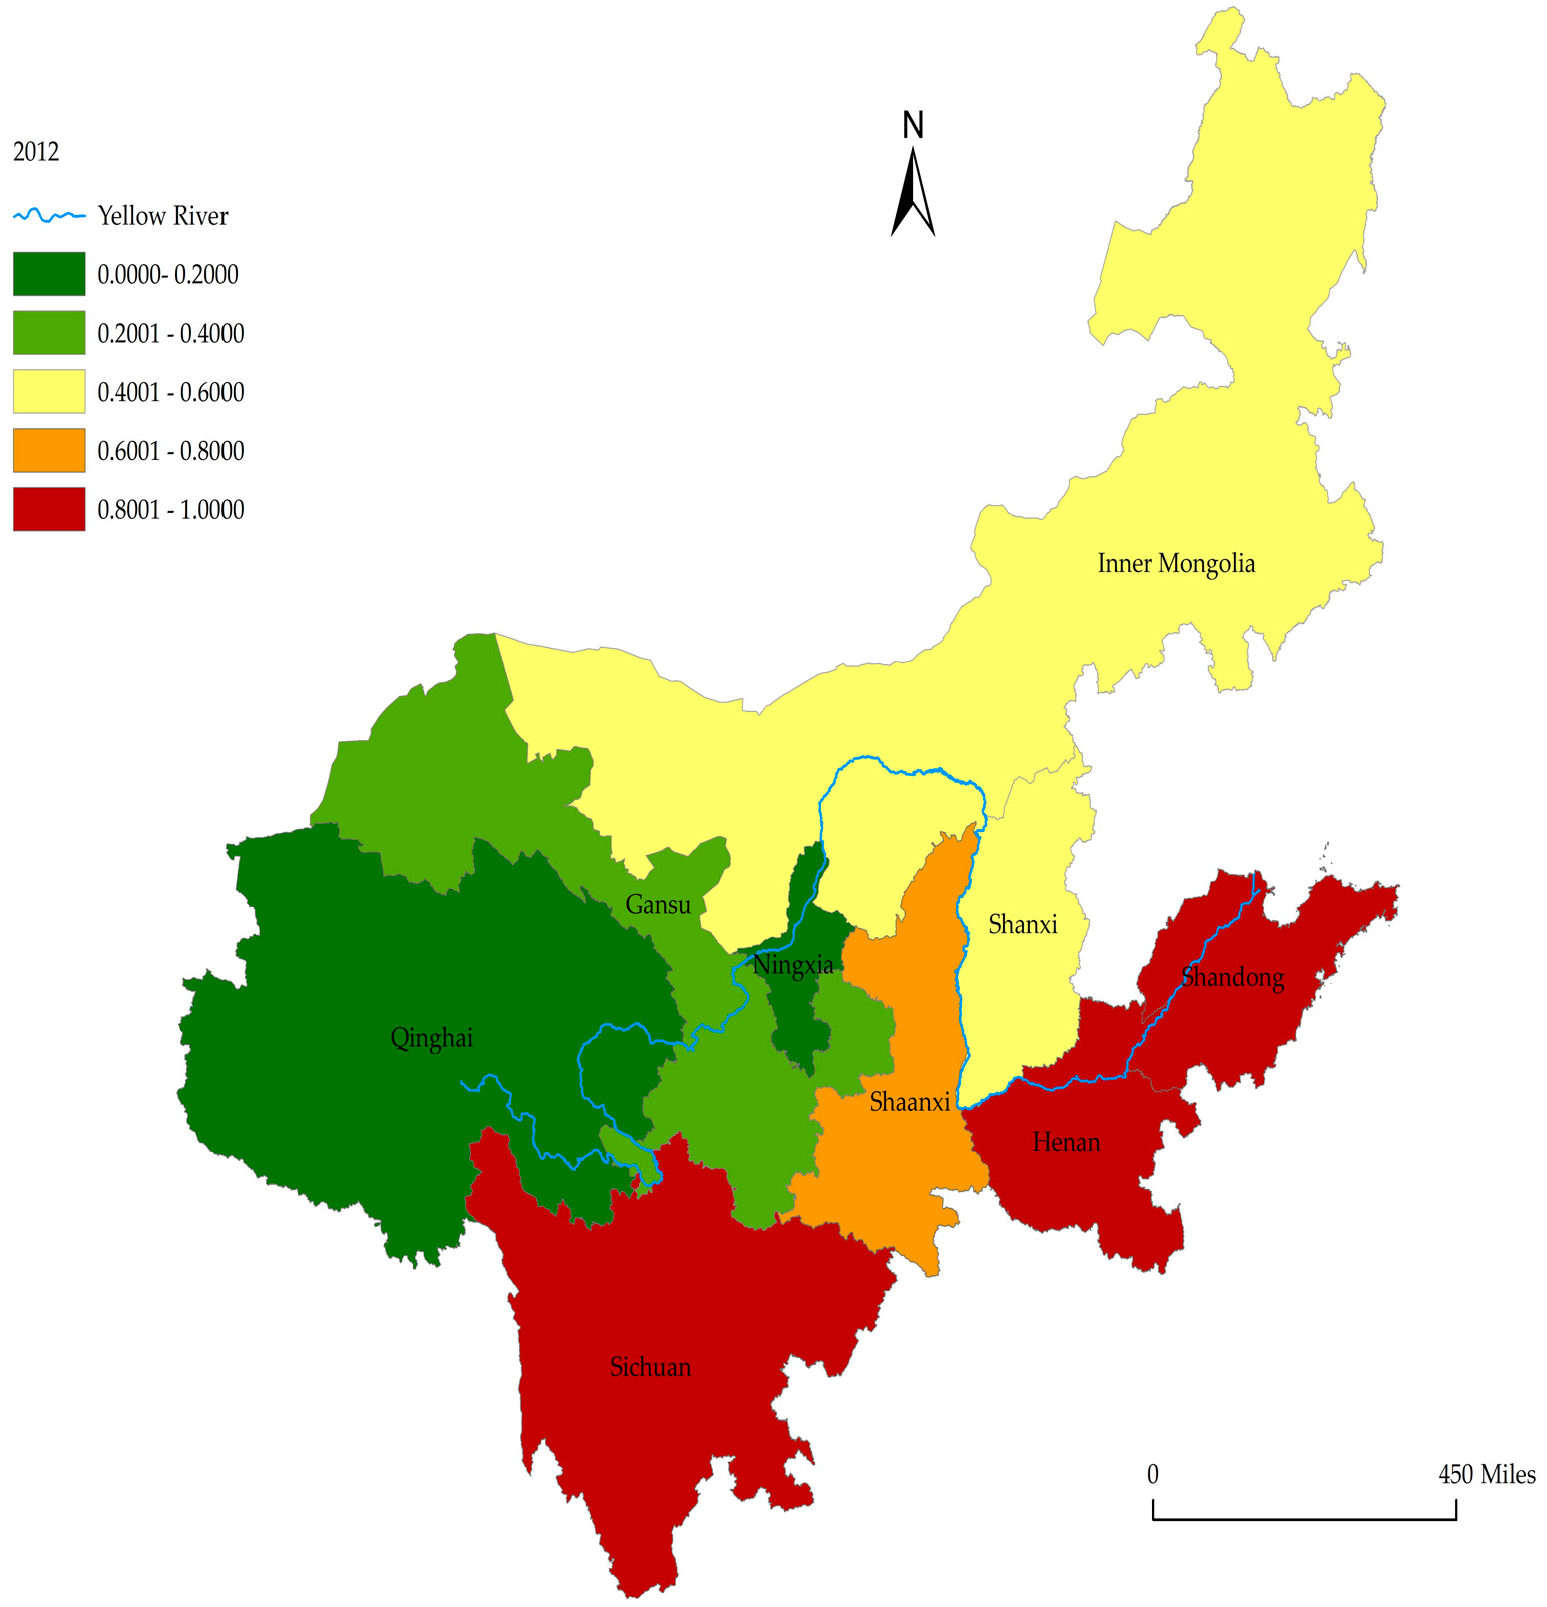
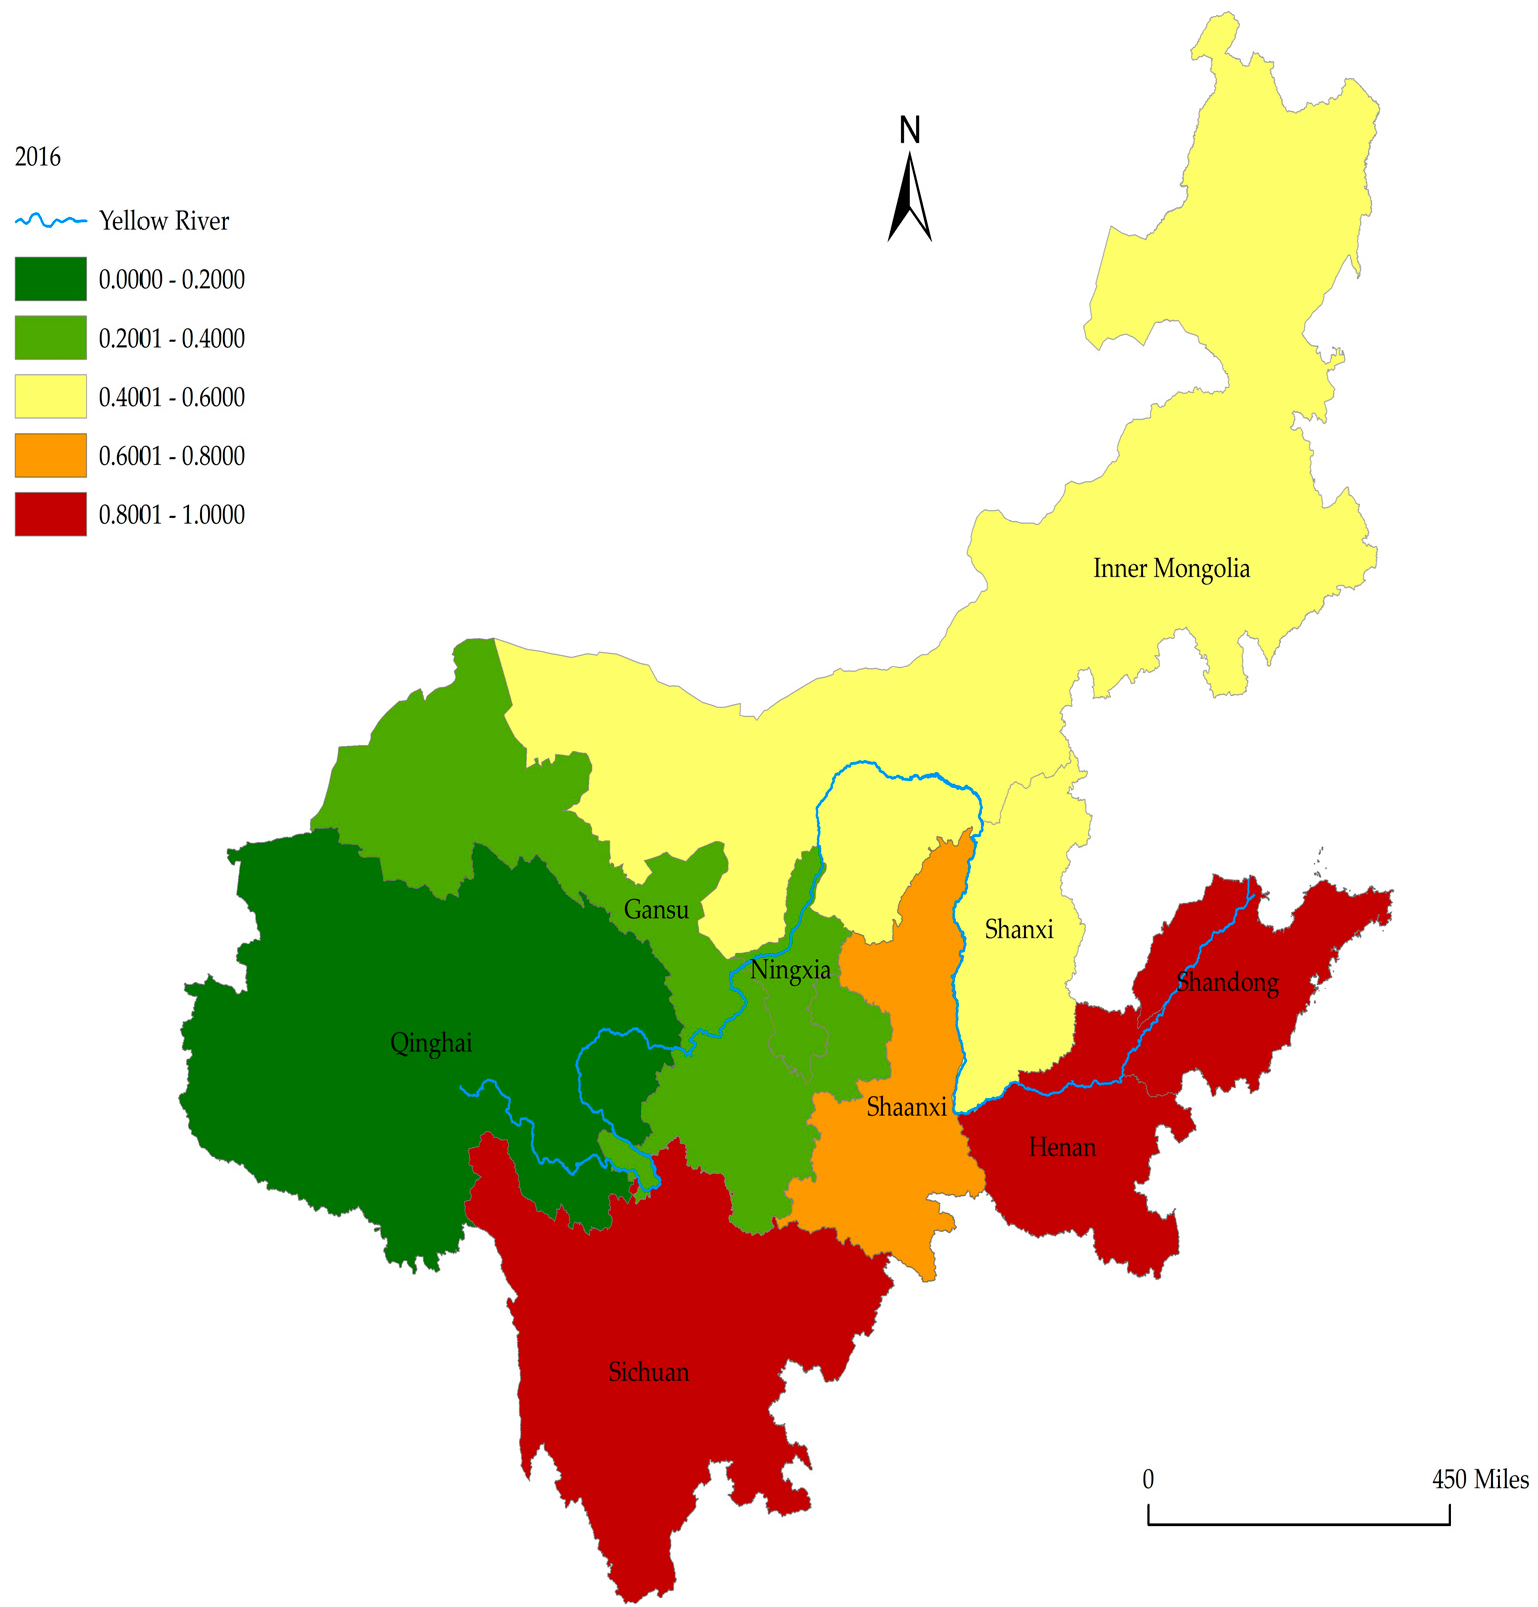
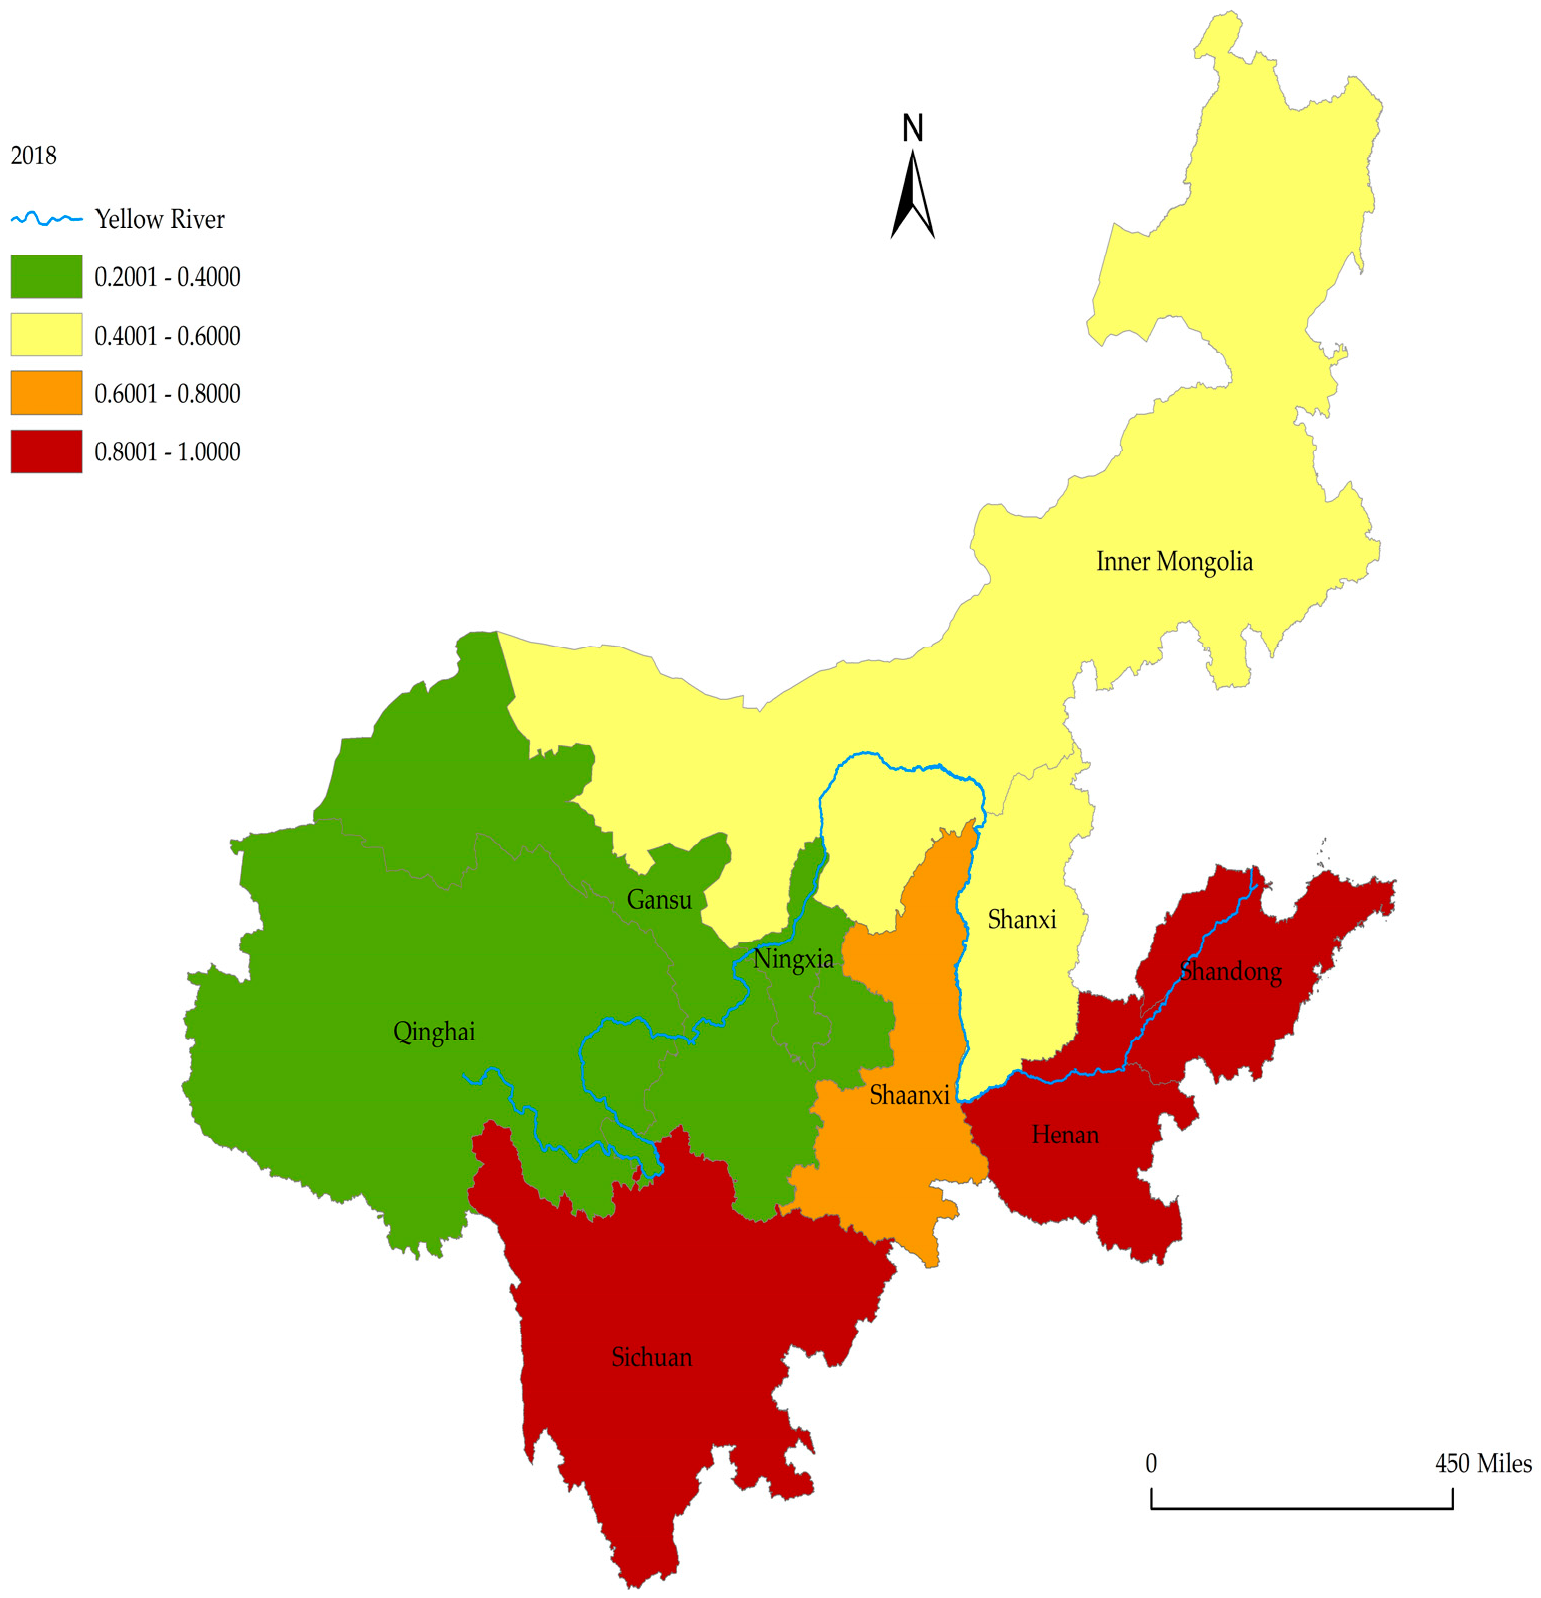
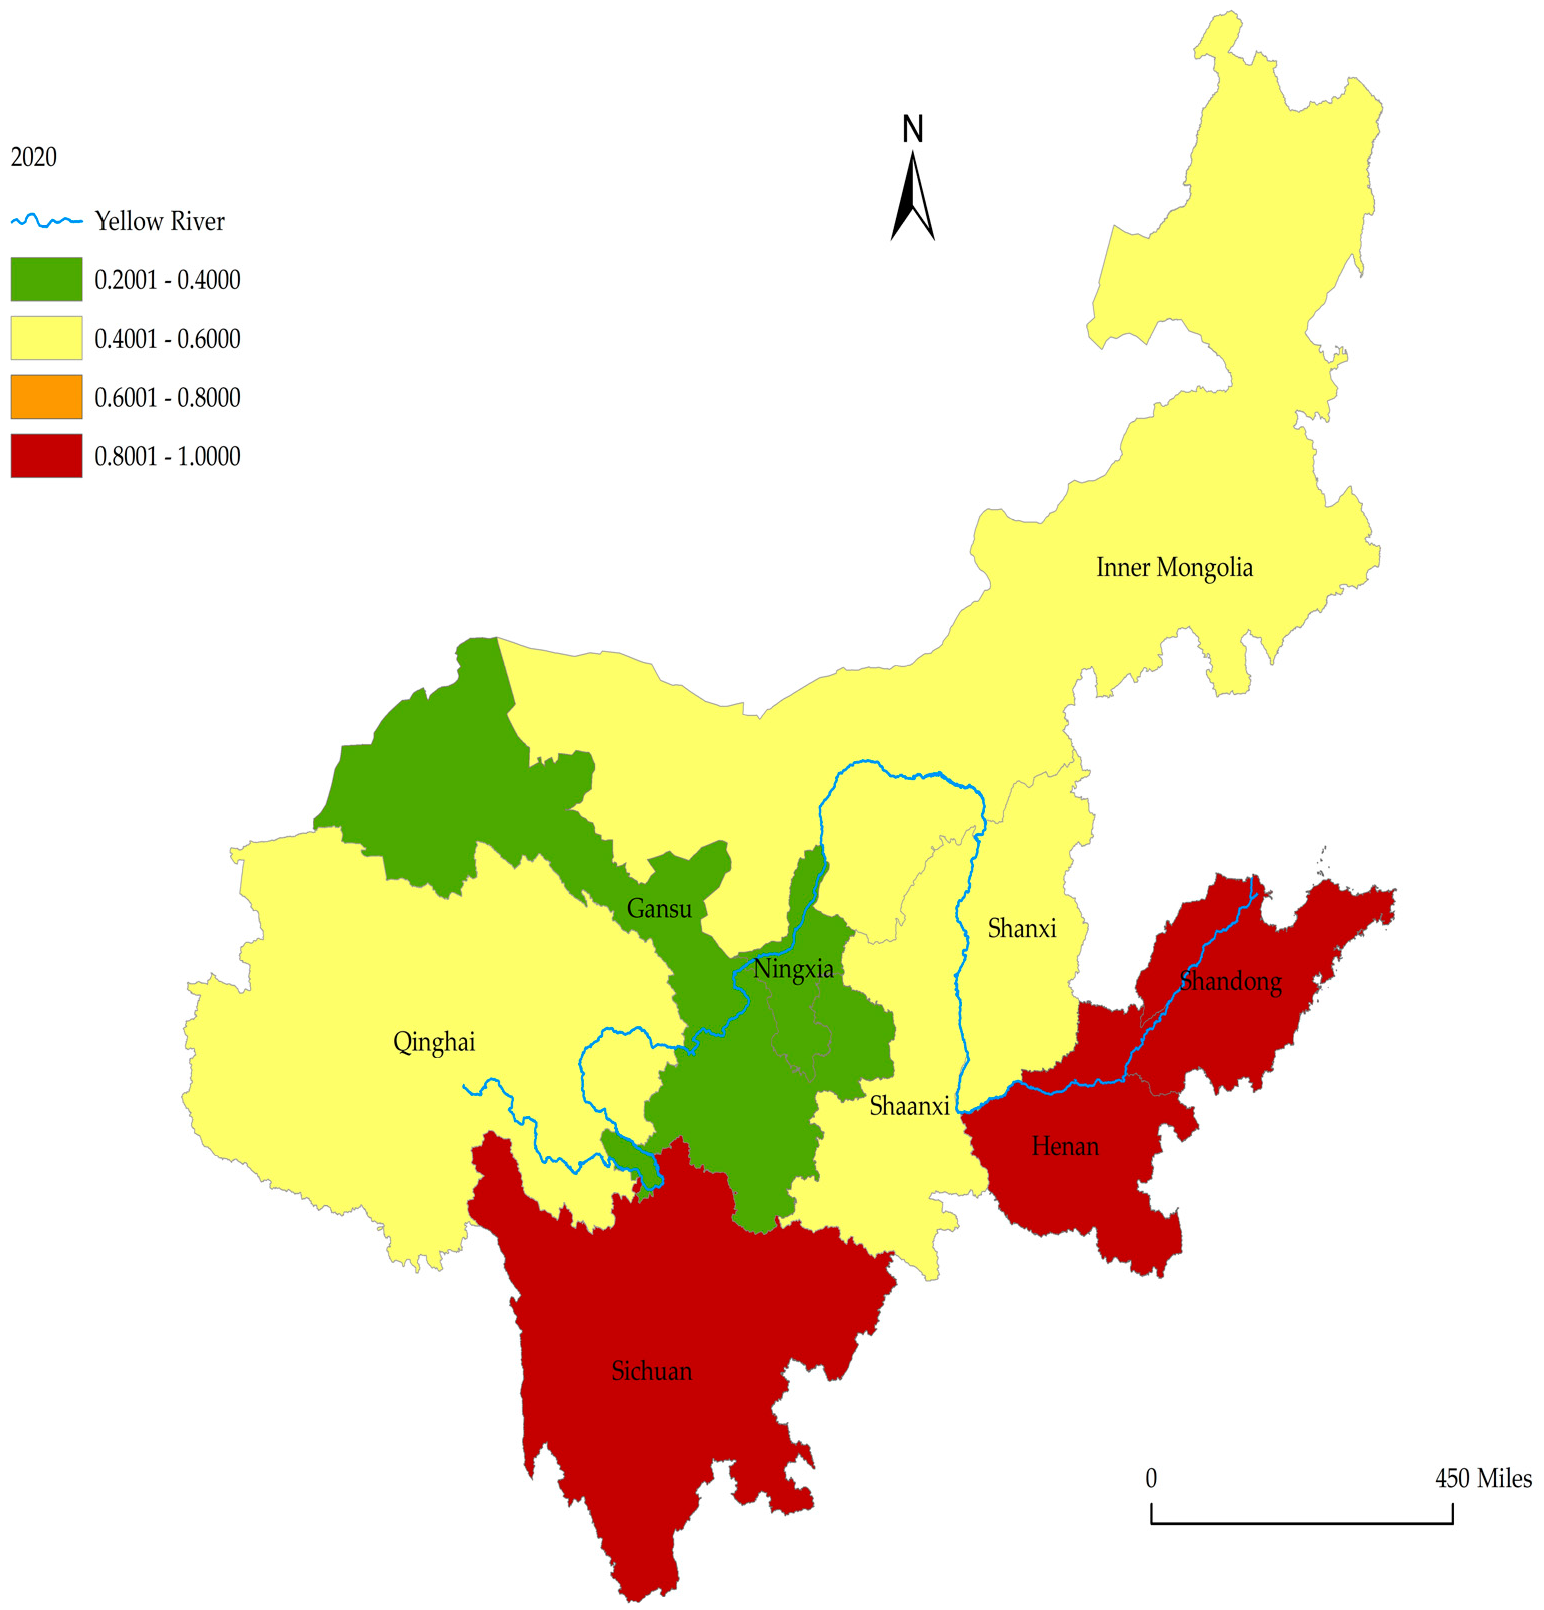
Secondly, the temporal and spatial characteristics of green development efficiency in the Yellow River Basin are analyzed. The GDE of nine provinces in the YRB in 2012, 2014, 2016, 2018 and 2020 are visualized by ArcGIS10.6 software, as shown in Figure 3, Figure 4, Figure 5, Figure 6 and Figure 7. Its GDE can be divided into five categories: 0.0000–0.2000, 0.2001–0.4000, 0.4001–0.6000, 0.6001–0.8000 and 0.8001–1.0000. Different colors represent different levels of green development, and the higher in the saturation, the higher the GDE is.
After the release of several Opinions of the CPC Central Committee and The State Council on Promoting the Rise of the Central Region on 31 August 2012, a large amount of capital and labor poured into the lower reaches of the Yellow River. However, the rapid economic growth has also brought some environmental problems, so the 18th CPC National Congress in 2012 proposed to strengthen the construction of ecological civilization. This has promoted ecological and environmental governance in the YRB, and is also the reason for the increasing efficiency in Qinghai and Ningxia provinces. From Figure 3, Figure 4, Figure 5, Figure 6 and Figure 7, the most obvious change among provinces is that from 2012 to 2020, the efficiency of Qinghai and Ningxia increased, while the efficiency of Shaanxi decreased. The decline in the level of green development in Shaanxi is not only related to the decline of green technology development and progress, the insufficient control of ecological issues and the insufficient intensity of environmental regulation from 2018 to 2020. In contrast to neighboring provinces such as Sichuan and Henan, which attach great importance to environmental governance, Shaanxi province blindly pursues the increase in GDP and neglects the protection of the ecological environment. It is necessary to strengthen government guidance, industrial layout, resource allocation and enterprise transformation and upgrading from the development model of other provinces. As is known to all, cities with strong economic strength and sound technological development have the ability and consciousness to actively improve the efficiency of green development. Therefore, some regions with low GDE are mostly due to the pursuit of economic development and the vigorous development of industry and energy consumption, resulting in poor green development level.
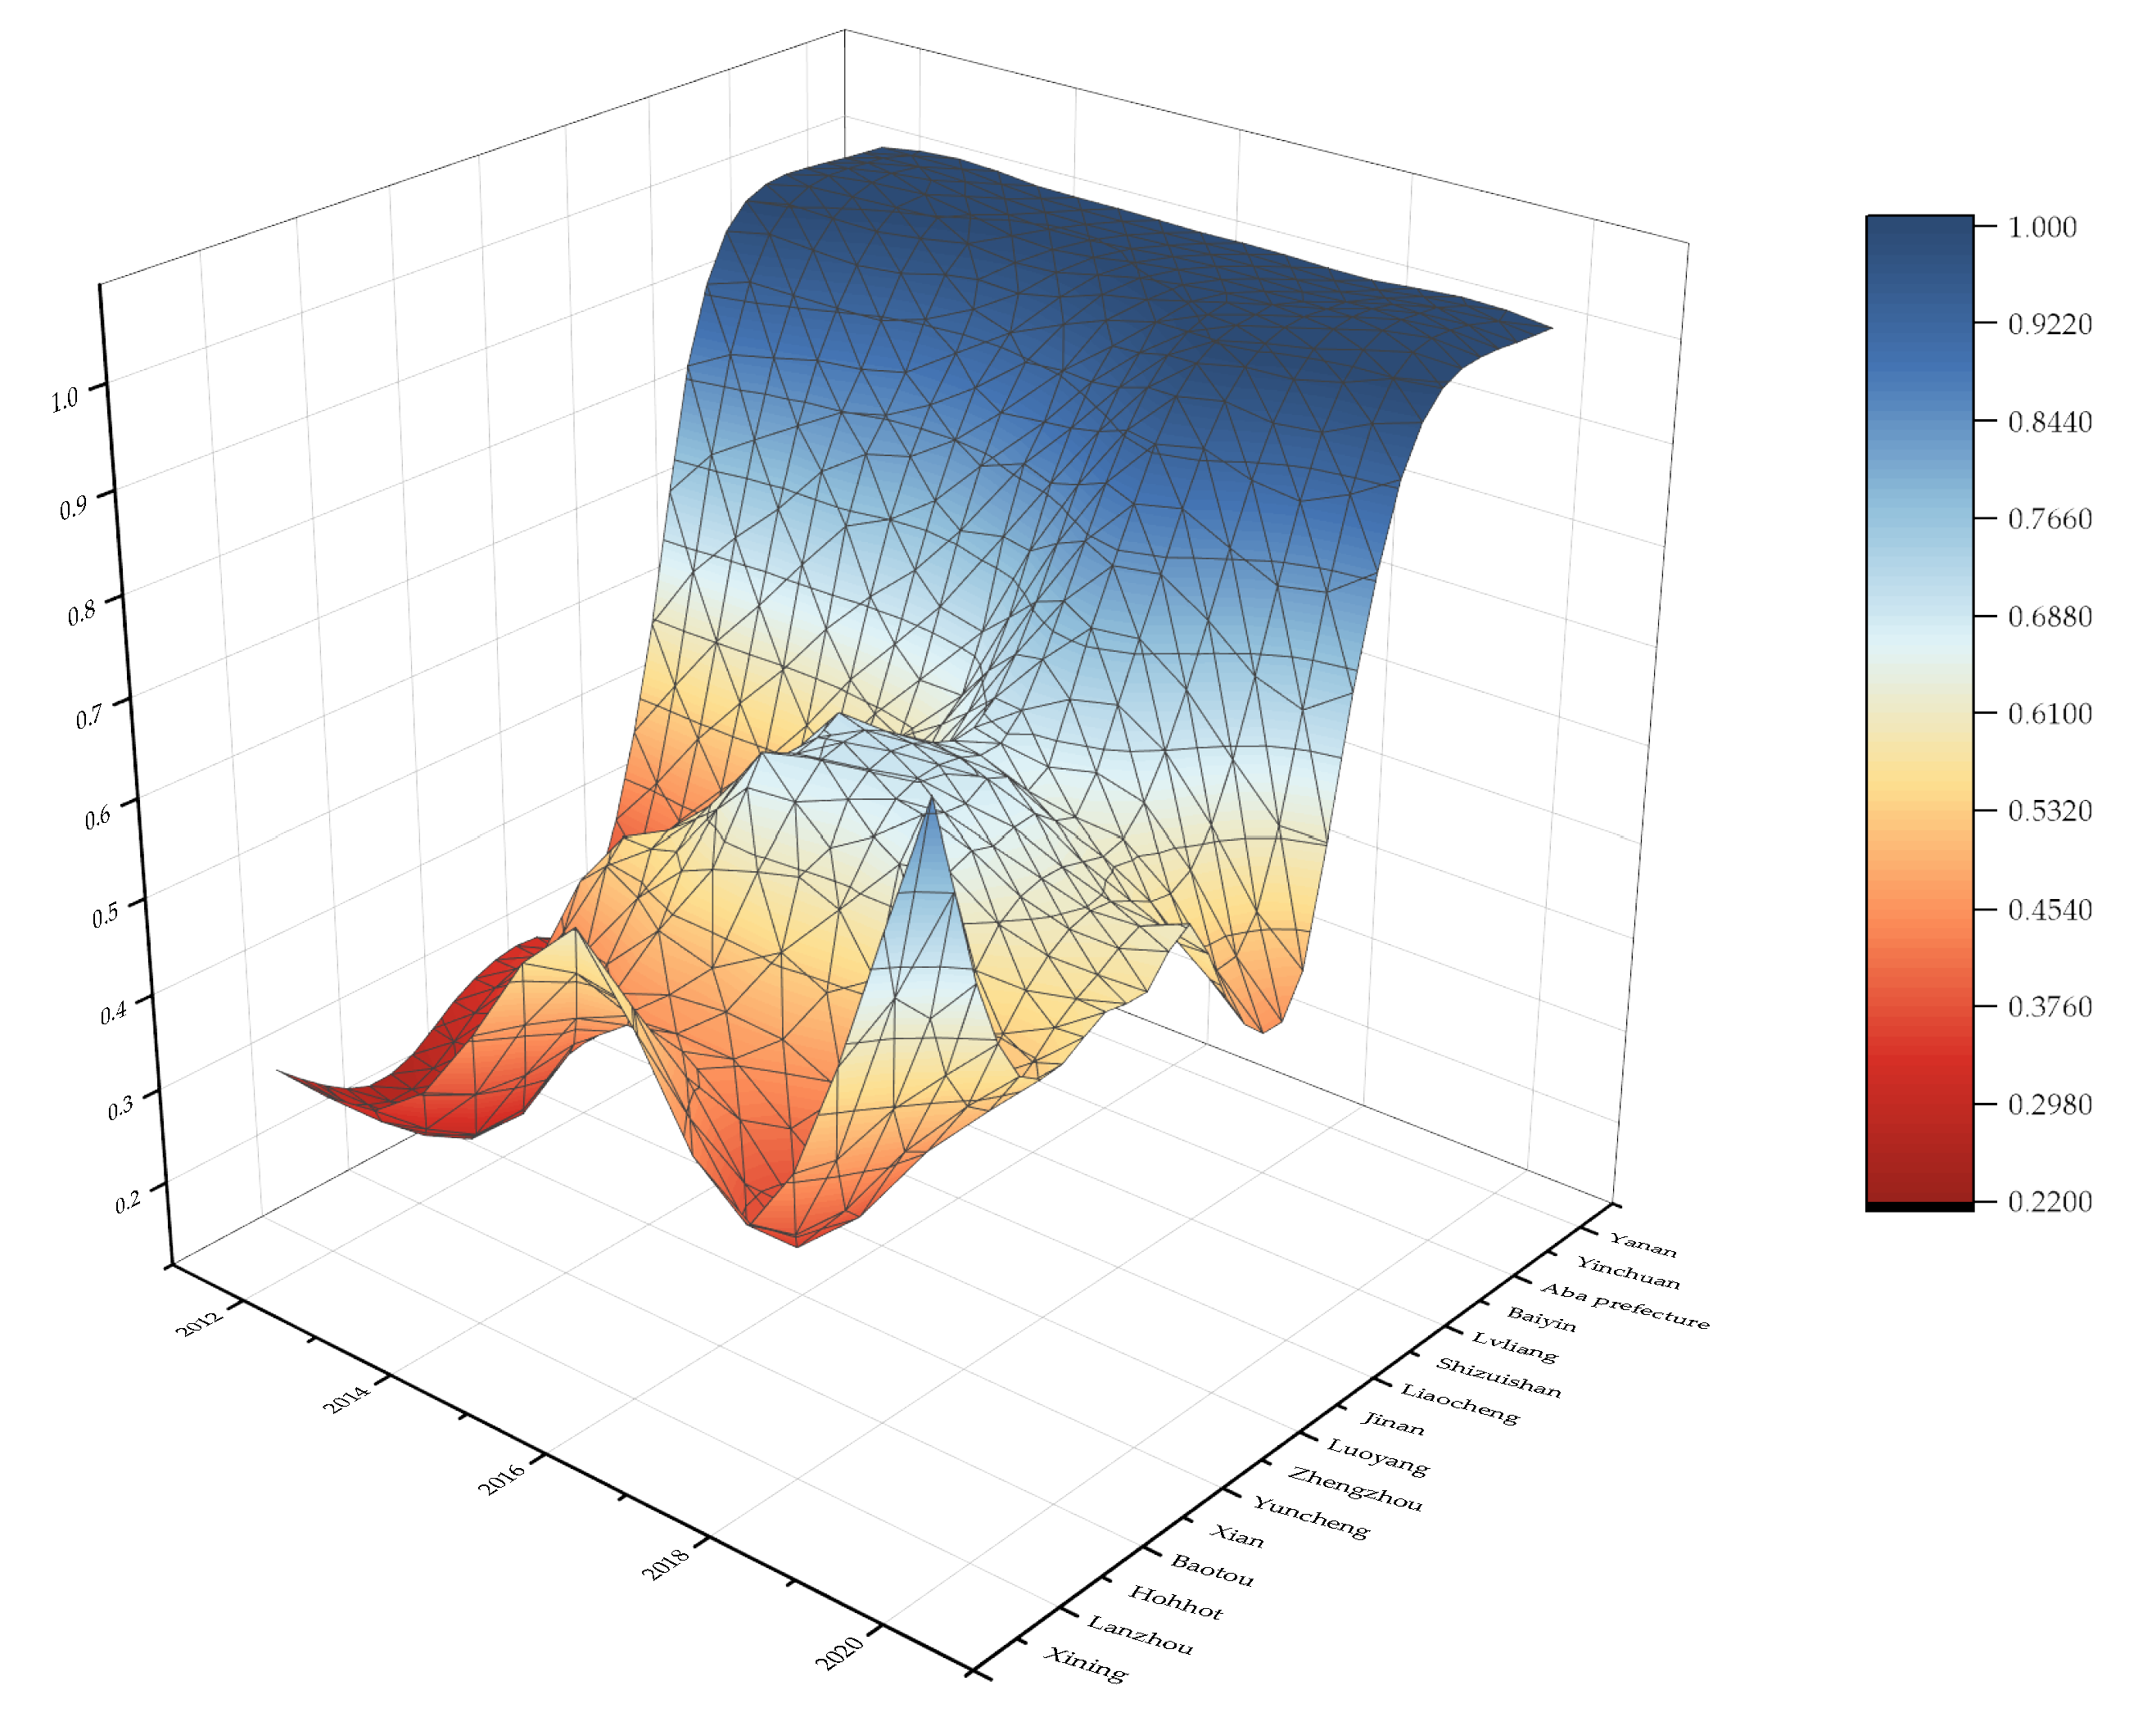
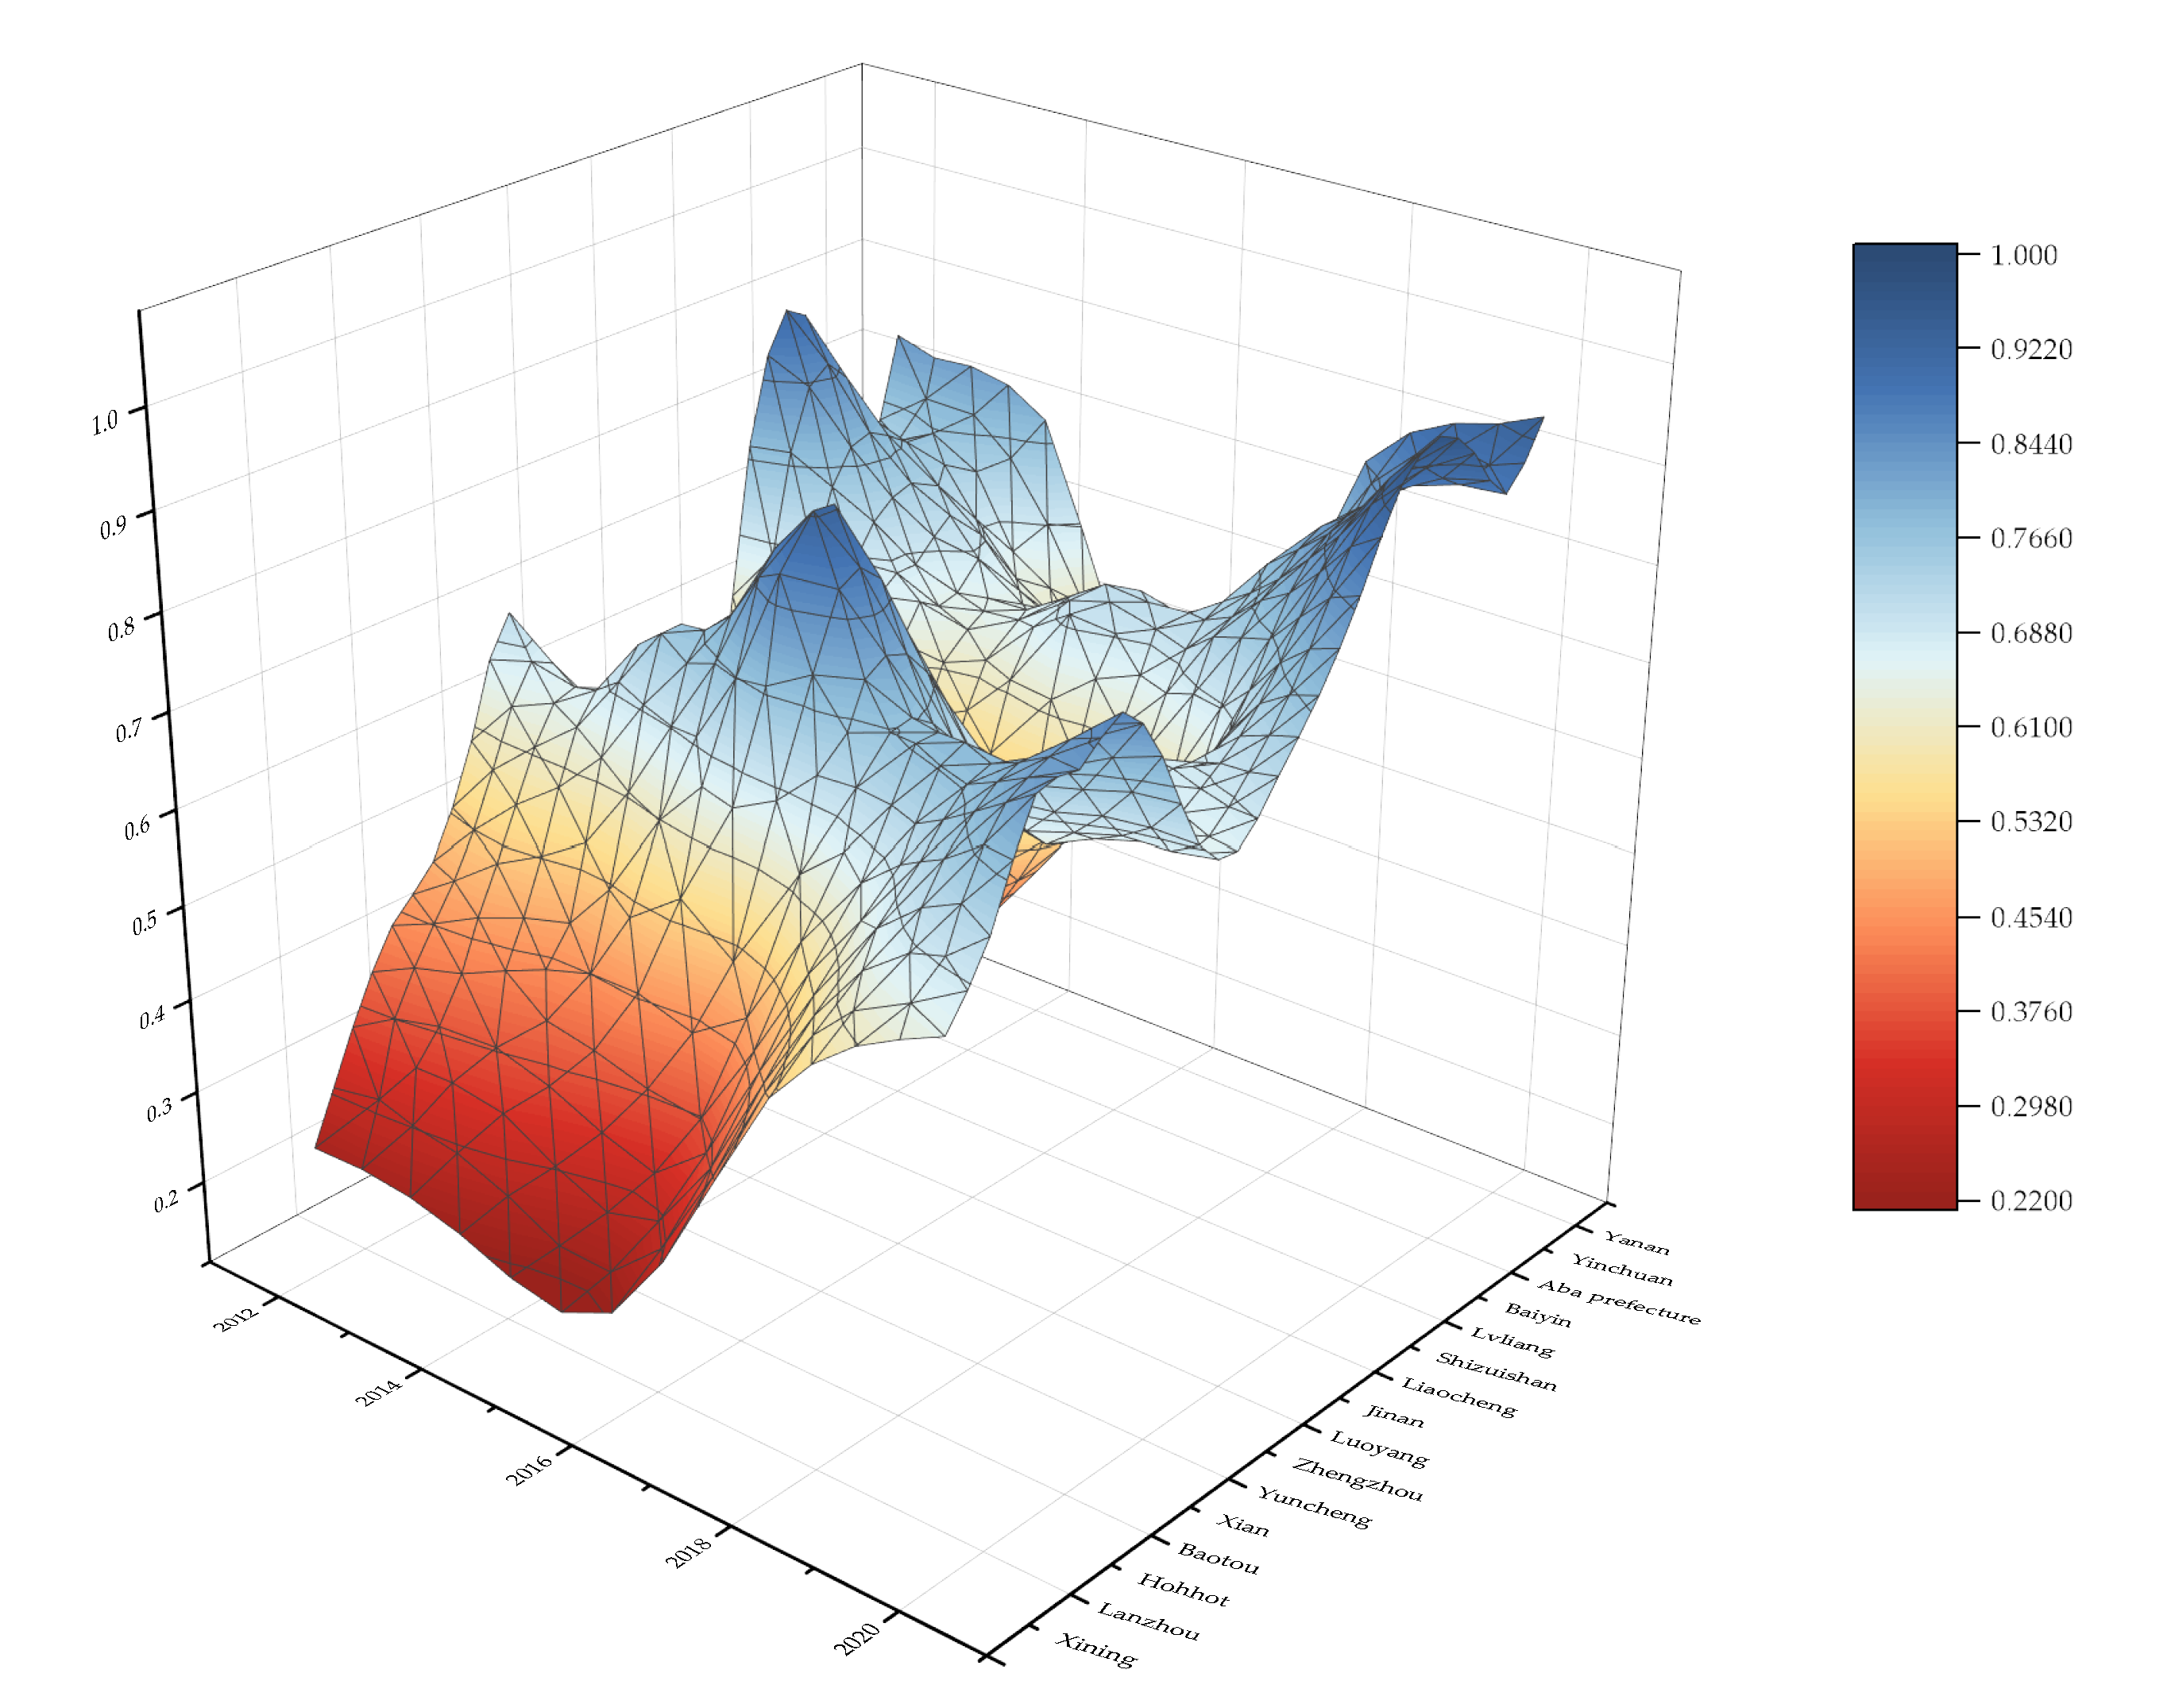
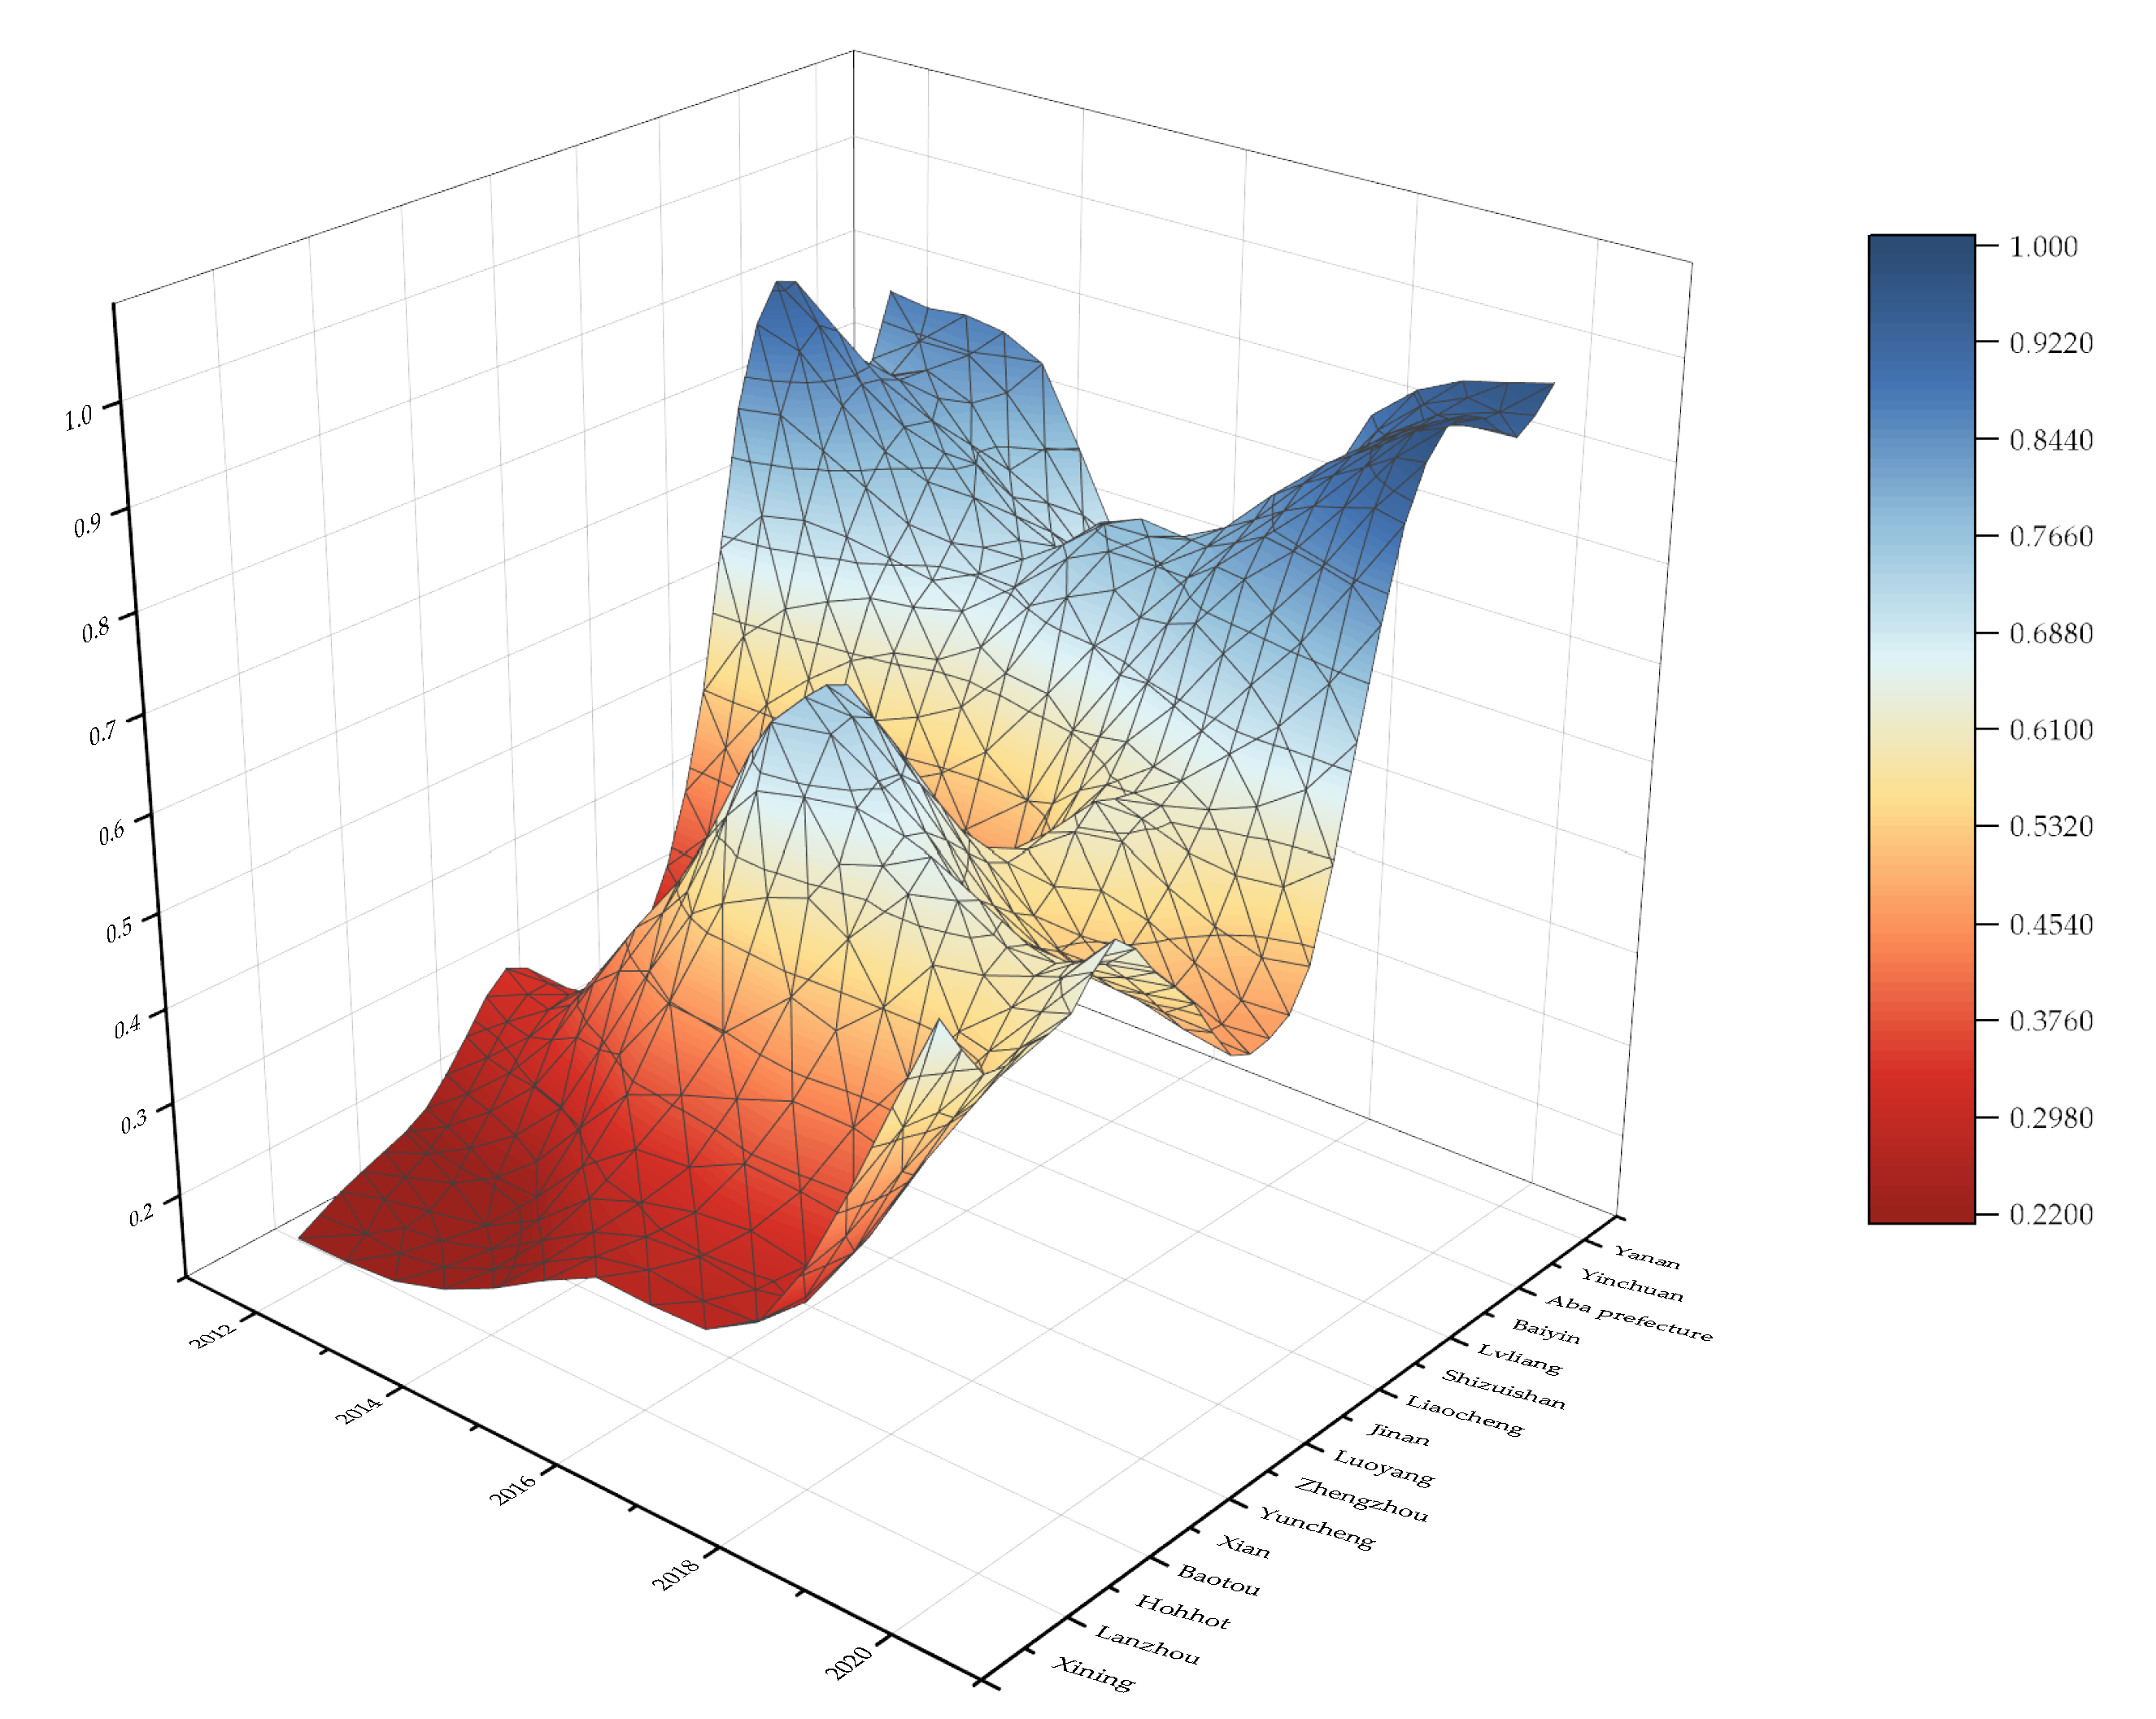
The spatial and temporal pattern of GDE among provinces has changed inconspicuously, but the pattern of urban efficiency has changed obviously. As shown in Figure 8, Figure 9 and Figure 10, the green development level in most cities was improved in 2020, showing a stepwise upward trend, which is the same as that in the whole basin, showing an unbalanced distribution. From 2012 to 2020, GDE in Qinghai and Ningxia provinces increased significantly, while Xining, Yinchuan and Shizuishan, in the lower reaches of the Yellow River in Qinghai Province, also saw a rapid increase. On the contrary, the efficiency of Xi’an, Zhengzhou, Jinan and Liaocheng fell, especially in Liaocheng, where the GDE fell the most, even less than that in 2014. If the development of cities and provinces along the Yellow River is consistent, it is necessary to lead the development of other cities; if the development is inconsistent, it is necessary to focus on improving the development efficiency of cities along the Yellow River. Thus, the ecological and economic development of the Yellow River basin will be coordinated and the development level of the whole basin will be improved.
4.2. Regression Analysis of Tobit Model
Through measuring and evaluating the GDE of the YRB, we find that the green development between provinces is not balanced. In order to further explore the influencing mechanism of green development in the YRB, we used Stata17.0 software to conduct Tobit regression on the influencing factors. The specific measurement results are as Table 7:
According to the regression results in Table 7, the influencing mechanism of each factor is analyzed as follows:
- ①
- Economic development level (lnEDL): Consistent with the expected conjecture of this paper, the improvement of economic development level can effectively promote the improvement of the GDE of the Yellow River Basin, which coincides with the conclusion of Yang et al. [15]. Although the regression result did not pass the significance test of 5%, its regression coefficient was the highest among the influencing factors. If other conditions remain unchanged and per capita GDP increases by 1%, the GDE of the Yellow River Basin will increase by 0.2707 units. Economic progress is the core driving force of green development. The higher the level of economic development, the more sufficiently the government will invest in environmental protection. Therefore, capital, talent and technology will be available at the same time, boosting the GDE of the Yellow River basin.
- ②
- Technological innovation (lnTI): Similar to the conclusion of Wang et al. [6] and Chen et al. [52], technological innovation has a positive effect on GDE. The results are consistent with what were expected, and are significant at a 5% level with strong influence. A 1% increase in technological innovation can increase the GDE of the Yellow River basin by 0.0657 units. High-end scientific personnel, solid scientific research foundation and sound supporting policies can provide a good environment and conditions for the promotion of technological innovation in the Yellow River Basin. Promoting scientific and technological innovation is conducive to industrial optimization and upgrading, eliminating enterprises with high energy consumption and high pollution, and promoting the green development of the Yellow River basin.
- ③
- Industrial structure (lnIS): As expected, because the upper and middle reaches of the Yellow River basin are located in the central and western regions, it is dominated by the secondary industry and has a single industrial structure. The industry’s energy-consumption and pollution will hinder the green development of the Yellow River basin. It is consistent with the research of Guo, Tong and Mei [51] and Chen and Jia [28]. The larger the proportion of secondary industry, the more difficult it is to improve the level of green development. This further indicates that it is necessary not only to speed up the green transformation of enterprises in the YRB, but also to promote the development and optimization of the service industry and high-tech industry, and to increase the proportion of tertiary industry in the total economic.
- ④
- Urbanization level (lnUL): Consistent with the conclusion of Deng and Gibson [44], the study found that the urbanization level in the YRB had a negative impact on GDE, which is inconsistent with expectations. The process of urbanization is the various factors to urban agglomeration and the evolution of land use structure. In the process of agglomeration, various factors obtain external benefits, leading to the agglomeration and development of cities on a larger scale. In this process, land, energy, water and other resources are consumed in large quantities, and a large number of “Three Wastes” are discharged, resulting in many environmental problems. It puts pressure on local development, exceeding the upper limit of environmental carrying capacity, thus hindering the green development of the YRB.
- ⑤
- Environmental regulation (lnER): The “Porter Hypothesis” holds that the “Compensation-effectiveness” of reasonable environmental regulation is enough make up for the “Cost-effectiveness”. Consistent with the conclusions of Zhang et al. [48], this study found that the environmental regulations are in the stage of hindering GDE in the YRB. On the one hand, it may be that the environmental regulation policy is not soundness, the governance mechanism is not perfect, and the regulation intensity is not strict enough. Therefore, strengthening environmental regulation has not promoted green development in the YRB. On the other hand, it may be that the proportion of provincial investment in industrial pollution control in regional GDP was selected as the proxy variable of environmental regulation. In general, the lower the level of green development, the greater the investment in pollution control so that the GDE and environmental regulation intensity have a reverse change relationship.
- ⑥
- Foreign capital utilization level (lnFCU): Contrary to expectations, higher levels of foreign investment will boost the GDE of the YRB and passing the 1% level significantly, the impact is fortissimo. The utilization of foreign investment increased by 1% and the efficiency of green development increased by 0.1124 units. This is consistent with the conclusion of Shuai and Fan [21], and denies the existence of the hypothesis of “pollution havens”. While using foreign investment, it can also introduce advanced technology, accelerate the integration of innovation resources and strengthen the competition of technological innovation by stimulating innovation and promoting local economic development and technological innovation.
5. Conclusions
In this study, a multi-period two-stage DEA model is developed to measure the green development efficiency of the YRB. In addition, the spatial-temporal evolution of GDE on the YRB was portrayed to help better understand the green development evolution of this region. According to the empirical result, the spatial layout presents an unbalanced state where the downstream is excellent, and then follows the middle and upstream. From the dynamic analysis, results show that the GDE of the YRB is generally in a state of progress, while the green development level is not high. From the provincial perspective, the GDE of the central provinces of the YRB is in a state of regression. From the municipal perspective, the green development efficiency in most cities has improved. Based on the analysis of GDE and influencing drivers of the YRB during 2012–2020, the improvement measures are proposed as follows.
- ①
- Under the guidance of the central green development strategy, provincial and municipal governments coordinate in governance. For the situation that the GDE at the provincial level is high but at the municipal level is poor, it is necessary to play the guiding role of provincial governments to strengthen coordinate green development. GDE is low at provincial level but excellent at a municipal level, therefore it is necessary to learn from the development experience of these cities to act as the guide for development, and promote the green sustainable development of the whole basin.
- ②
- For regions with high economic efficiency, relatively low green development efficiency and bottlenecks in environmental governance, the innovation system should be improved based on the current development situation. Financial support should be given to enterprises to encourage scientific and technological innovation to promote the transformation of scientific and technological achievements and drive the green development of the YRB. The government should construct a new tax policy to control the discharge and treatment of enterprise pollutants, to guide high energy consumption and high pollution enterprises to transform into green enterprises, and to pay attention to green technology innovation, encouraging science to enable low-carbon development.
- ③
- All levels of governments in the YRB should rationally lay out the industrial structure, actively guide emerging strategic industries, and speed up the introduction of high-quality foreign-funded enterprises. The level of urbanization in the YRB is constantly improving, and the industrial structure among provinces and cities is extremely similar. It will not only fail to give full play to regional advantages, but also increase the pressure on regional resources. In the future, economic development will enhance the allocation of resources and the effective combination of resources, appropriately adjust the city scale, break through regional restrictions, open up multi-channel green development mode, and improve the efficiency of urban green development.
The YRB ecological protection and green development is the national strategic plan. From “Symposium on Ecological protection and High-quality development in the Yellow River Basin” to “Symposium on In-depth promotion Ecological Protection and High-quality development in the Yellow River Basin”, the Yellow River basin has made great progress with the promotion of national policies and the implementation of regional support. This study also has some limitations due to the limited sample data and specific index system. How to deeply excavate the primary industry receipts of the YRB, and continuously promote the environmental protection with high-quality development is the direction of further research. At the same time, how to achieve the balance of regional economic development, social consumption, industrial production and environmental load is a further problem to be considered. In the future, we will continue to pay attention to the bottlenecks of regional green development, promoting the green and high-quality development of Yellow River Basin.
Author Contributions
Conceptualization, methodology, review, editing and supervision F.Z.; methodology, data curation, and writing D.S.; methodology, original draft preparation, data curation and writing P.H.; validation, formal analysis and review P.M.; conceptualization, review, editing and supervision S.P. All authors have read and agreed to the published version of the manuscript.
Funding
This study is financially supported by the following programs: the Key Technologies R&D Programme of Henan Province from Henan Science and Technology Department (grant no. 222102210005); the Humanities and Social Sciences Project from the Ministry of Education in PRC (grant no. 22YJC630220); and the Fundamental Research Funds for Provincial Universities from ZZULI (grant no. 20KYYWF0107, 21KYYWF0103).
Data Availability Statement
The data used to support the findings of this study are available from the corresponding author upon request.
Conflicts of Interest
The authors declare no conflict of interest.
References
- He, Z.; Gong, K.; Zhang, Z.; Dong, W.; Feng, H.; Yu, Q.; He, J. What is the past, present, and future of scientific research on the Yellow River Basin?—A bibliometric analysis. Agric. Water Manag. 2022, 262, 107404. [Google Scholar] [CrossRef]
- Li, J.; Gong, Y.; Jiang, C. Spatio-temporal differentiation and policy optimization of ecological well-being in the Yellow River Delta high-efficiency eco-economic zone. J. Clean. Prod. 2022, 339, 130717. [Google Scholar] [CrossRef]
- Pan, Z.; Gao, G.; Fu, B. Spatiotemporal changes and driving forces of ecosystem vulnerability in the Yangtze River Basin, China: Quantification using habitat-structure-function framework. Sci. Total Environ. 2022, 835, 155494. [Google Scholar] [CrossRef] [PubMed]
- Yang, X.; Meng, F.; Fu, P.; Zhang, Y.; Liu, Y. Spatiotemporal change and driving factors of the Eco-Environment quality in the Yangtze River Basin from 2001 to 2019. Ecol. Indic. 2021, 131, 108214. [Google Scholar] [CrossRef]
- Hao, Z.; Ye, D.; Hui, W.; Zenglin, H.; Hongye, W. An empirical analysis of tourism eco-efficiency in ecological protection priority areas based on the DPSIR-SBM model: A case study of the Yellow River Basin, China. Ecol. Inform. 2022, 70, 101720. [Google Scholar] [CrossRef]
- Wang, Z.; Liu, B.; Wang, L.; Shao, Q. Measurement and temporal & spatial variation of urban eco-efficiency in the Yellow River Basin. Phys. Chem. Earth Parts A/B/C 2021, 122, 102981. [Google Scholar] [CrossRef]
- Wang, X.; Zhang, Q.; Chang, W.-Y. Does economic agglomeration affect haze pollution? Evidence from Chin’s Yellow River basin. J. Clean. Prod. 2022, 335, 130271. [Google Scholar] [CrossRef]
- Ni, Y.; Yu, Z.; Lv, X.; Qin, T.; Yan, D.; Zhang, Q.; Ma, L. Spatial difference analysis of the runoff evolution attribution in the Yellow River Basin. J. Hydrol. 2022, 612, 128149. [Google Scholar] [CrossRef]
- Du, J.H.; Wang, X.; Wu, X.; Zhou, F.L.; Zhou, L. Multi-objective optimization for two-echelon joint delivery location routing problem considering carbon emission under online shopping. Transp. Lett. Int. J. Transp. Res. 2022, 1–19. [Google Scholar] [CrossRef]
- Dwivedi, A.; Pratap, S.; Zhou, F.L. Antecedents of freight transportation for sustainable supply chain in the post-COVID era: An emerging market study. Int. J. Emerg. Mark. 2022. [Google Scholar] [CrossRef]
- Zhou, F.L.; Lim, M.K.; He, Y.D.; Lin, Y.; Chen, S. End-of-life vehicle (ELV) recycling management: Improving performance using an ISM approach. J. Clean. Prod. 2019, 228, 231–243. [Google Scholar] [CrossRef]
- Zhou, F.L.; Wang, X.; Lim, M.K.; He, Y.D.; Li, L.X. Sustainable recycling partner selection using fuzzy DEMATEL-AEW-FVIKOR: A case study in small-and-medium enterprises (SMEs). J. Clean. Prod. 2018, 196, 489–504. [Google Scholar] [CrossRef]
- Hou, Y.; Zhang, K.; Zhu, Y.; Liu, W. Spatial and temporal differentiation and influencing factors of environmental governance performance in the Yangtze River Delta, China. Sci. Total Environ. 2021, 801, 149699. [Google Scholar] [CrossRef] [PubMed]
- Liu, Y.; Yuan, L. Evolution of water-use efficiency in the Yangtze River Economic Belt based on national strategies and water environment treatment. Ecol. Inform. 2022, 69, 101642. [Google Scholar] [CrossRef]
- Yang, Y.; Lu, H.; Liang, D.; Chen, Y.; Tian, P.; Xia, J.; Wang, H.; Lei, X. Ecological sustainability and its driving factor of urban agglomerations in the Yangtze River Economic Belt based on three-dimensional ecological footprint analysis. J. Clean. Prod. 2022, 330, 129802. [Google Scholar] [CrossRef]
- Prajapati, D.; Chelladurai, H.; Zhou, F.L.; Ip, A.W.H.; Pratap, S. Sustainable multi-products delivery routing network design for two-echelon supplier selection problem in B2B e-commerce platform. Rairo-Oper. Res. 2022, 56, 2115–2137. [Google Scholar] [CrossRef]
- Zhou, F.L.; He, Y.D.; Ma, P.P.; Lim, M.K.; Pratap, S. Capacitated disassembly scheduling with random demand and operation time. J. Oper. Res. Soc. 2022, 73, 1362–1378. [Google Scholar] [CrossRef]
- Charnes, A.; Cooper, W.W.; Lewin, A.Y.; Seiford, L.M. Data Envelopment Analysis: Theory, Methodology, and Application. J. Oper. Res. Soc. 1997, 48, 332–333. [Google Scholar] [CrossRef]
- Mardani, A.; Zavadskas, E.K.; Streimikiene, D.; Jusoh, A.; Khoshnoudi, M. A comprehensive review of data envelopment analysis (DEA) approach in energy efficiency. Renew. Sustain. Energy Rev. 2017, 70, 1298–1322. [Google Scholar] [CrossRef]
- Moon, H.; Min, D. A DEA approach for evaluating the relationship between energy efficiency and financial performance for energy-intensive firms in Korea. J. Clean. Prod. 2020, 255, 120283. [Google Scholar] [CrossRef]
- Shuai, S.; Fan, Z. Modeling the role of environmental regulations in regional green economy efficiency of China: Empirical evidence from super efficiency DEA-Tobit model. J. Environ. Manag. 2020, 261, 110227. [Google Scholar] [CrossRef] [PubMed]
- Otero, L.D.; Centeno, G.; Otero, C.E.; Reeves, K. A DEA–Tobit Analysis to Understand the Role of Experience and Task Factors in the Efficiency of Software Engineers. IEEE Trans. Eng. Manag. 2012, 59, 391–400. [Google Scholar] [CrossRef]
- Wang, Z.; Wang, X. Research on the impact of green finance on energy efficiency in different regions of China based on the DEA-Tobit model. Resour. Policy 2022, 77, 102695. [Google Scholar] [CrossRef]
- Zhou, S.; Xu, Z. Energy efficiency assessment of RCEP member states: A three-stage slack based measurement DEA with undesirable outputs. Energy 2022, 253, 124170. [Google Scholar] [CrossRef]
- Iram, R.; Zhang, J.; Erdogan, S.; Abbas, Q.; Mohsin, M. Economics of energy and environmental efficiency: Evidence from OECD countries. Environ. Sci. Pollut. Res. Int. 2020, 27, 3858–3870. [Google Scholar] [CrossRef]
- Neykov, N.; Krišťáková, S.; Hajdúchová, I.; Sedliačiková, M.; Antov, P.; Giertliová, B. Economic Efficiency of Forest Enterprises—Empirical Study Based on Data Envelopment Analysis. Forests 2021, 12, 462. [Google Scholar] [CrossRef]
- Tone, K. A slacks-based measure of efficiency in data envelopment analysis. Eur. J. Oper. Res. 2001, 130, 498–509. [Google Scholar] [CrossRef] [Green Version]
- Chen, L.; Jia, G. Environmental efficiency analysis of China’s regional industry: A data envelopment analysis (DEA) based approach. J. Clean. Prod. 2017, 142, 846–853. [Google Scholar] [CrossRef]
- Cecchini, L.; Venanzi, S.; Pierri, A.; Chiorri, M. Environmental efficiency analysis and estimation of CO2 abatement costs in dairy cattle farms in Umbria (Italy): A SBM-DEA model with undesirable output. J. Clean. Prod. 2018, 197, 895–907. [Google Scholar] [CrossRef]
- Shang, Y.; Liu, H.; Lv, Y. Total factor energy efficiency in regions of China: An empirical analysis on SBM-DEA model with undesired generation. J. King Saud Univ.-Sci. 2020, 32, 1925–1931. [Google Scholar] [CrossRef]
- Li, H.; Shi, J.-F. Energy efficiency analysis on Chinese industrial sectors: An improved Super-SBM model with undesirable outputs. J. Clean. Prod. 2014, 65, 97–107. [Google Scholar] [CrossRef]
- Zhang, Y.-J.; Sun, Y.-F.; Huang, J. Energy efficiency, carbon emission performance, and technology gaps: Evidence from CDM project investment. Energy Policy 2018, 115, 119–130. [Google Scholar] [CrossRef]
- Zhang, R.; Tai, H.; Cheng, K.; Zhu, Y.; Hou, J. Carbon emission efficiency network formation mechanism and spatial correlation complexity analysis: Taking the Yangtze River Economic Belt as an example. Sci. Total Environ. 2022, 841, 156719. [Google Scholar] [CrossRef] [PubMed]
- Kao, C.; Hwang, S.-N. Multi-period efficiency and Malmquist productivity index in two-stage production systems. Eur. J. Oper. Res. 2014, 232, 512–521. [Google Scholar] [CrossRef]
- Liang, L.; Yang, F.; Cook, W.D.; Zhu, J. DEA models for supply chain efficiency evaluation. Ann. Oper. Res. 2006, 145, 35–49. [Google Scholar] [CrossRef]
- Kiani Mavi, R.; Saen, R.F.; Goh, M. Joint analysis of eco-efficiency and eco-innovation with common weights in two-stage network DEA: A big data approach. Technol. Forecast. Soc. Chang. 2019, 144, 553–562. [Google Scholar] [CrossRef]
- Shao, L.; Yu, X.; Feng, C. Evaluating the eco-efficiency of China’s industrial sectors: A two-stage network data envelopment analysis. J. Environ. Manag. 2019, 247, 551–560. [Google Scholar] [CrossRef]
- Wang, C.-N.; Nguyen, P.-H.; Nguyen, T.-L.; Nguyen, T.-G.; Nguyen, D.-T.; Tran, T.-H.; Le, H.-C.; Phung, H.-T. A Two-Stage DEA Approach to Measure Operational Efficiency in Vietnam’s Port Industry. Mathematics 2022, 10, 1385. [Google Scholar] [CrossRef]
- Zuo, Z.; Guo, H.; Li, Y.; Cheng, J. A two-stage DEA evaluation of Chinese mining industry technological innovation efficiency and eco-efficiency. Environ. Impact Assess. Rev. 2022, 94, 106762. [Google Scholar] [CrossRef]
- Shah, W.U.H.; Hao, G.; Yan, H.; Yasmeen, R.; Padda, I.U.H.; Ullah, A. The impact of trade, financial development and government integrity on energy efficiency: An analysis from G7-Countries. Energy 2022, 255, 124507. [Google Scholar] [CrossRef]
- Wang, S.; Wang, J.; Fang, C.; Li, S. Estimating the impacts of urban form on CO2 emission efficiency in the Pearl River Delta, China. Cities 2019, 85, 117–129. [Google Scholar] [CrossRef]
- Liu, J.; Li, X.; Zhong, S. Does innovation efficiency promote energy consumption intensity? New evidence from China. Energy Rep. 2022, 8, 426–436. [Google Scholar] [CrossRef]
- Cheng, Z.; Liu, J.; Li, L.; Gu, X. Research on meta-frontier total-factor energy efficiency and its spatial convergence in Chinese provinces. Energy Econ. 2020, 86, 124507. [Google Scholar] [CrossRef]
- Deng, X.; Gibson, J. Improving eco-efficiency for the sustainable agricultural production: A case study in Shandong, China. Technol. Forecast. Soc. Chang. 2019, 144, 394–400. [Google Scholar] [CrossRef]
- Chen, F.; Ahmad, S.; Arshad, S.; Ali, S.; Rizwan, M.; Hamzah Saleem, M.; Driha, O.M.; Balsalobre-Lorente, D. Towards achieving eco-efficiency in top 10 polluted countries: The role of green technology and natural resource rents. Gondwana Res. 2022, 110, 114–127. [Google Scholar] [CrossRef]
- Wilson, K.; Vellinga, N. Natural resource dependence and innovation efficiency reconsidered. Resour. Policy 2022, 77, 102684. [Google Scholar] [CrossRef]
- Datta, T.K.; Lin, Y.-K. A New Green Efficiency-Based Carbon Taxing Policy and Its Effects on a Production-Inventory System with Random Carbon Emissions and Green Investment. Adv. Oper. Res. 2020, 2020, 3451981. [Google Scholar] [CrossRef]
- Zhang, J.; Patwary, A.K.; Sun, H.; Raza, M.; Taghizadeh-Hesary, F.; Iram, R. Measuring energy and environmental efficiency interactions towards CO2 emissions reduction without slowing economic growth in central and western Europe. J. Environ. Manag. 2021, 279, 111704. [Google Scholar] [CrossRef]
- Ren, S.; Li, X.; Yuan, B.; Li, D.; Chen, X. The effects of three types of environmental regulation on eco-efficiency: A cross-region analysis in China. J. Clean. Prod. 2018, 173, 245–255. [Google Scholar] [CrossRef]
- Fan, F.; Lian, H.; Liu, X.; Wang, X. Can environmental regulation promote urban green innovation Efficiency? An empirical study based on Chinese cities. J. Clean. Prod. 2021, 287, 125060. [Google Scholar] [CrossRef]
- Guo, Y.; Tong, L.; Mei, L. The effect of industrial agglomeration on green development efficiency in Northeast China since the revitalization. J. Clean. Prod. 2020, 258, 120584. [Google Scholar] [CrossRef]
- Chen, M.; Sinba, A.; Hu, K.; Shah, M.I. Impact of Technological Innovation on Energy Efficiency in Industry 4.0 Era: Moderation of Shadow Economy in Sustainable Development. Technol. Forecast. Soc. Chang. 2020, 164, 120521. [Google Scholar] [CrossRef]
- Zameer, H.; Yasmeen, H.; Wang, R.; Tao, J.; Malik, M.N. An empirical investigation of the coordinated development of natural resources, financial development and ecological efficiency in China. Resour. Policy 2020, 65, 101580. [Google Scholar] [CrossRef]
- Ma, Z. The Models and Methods on Data Envelopment Analysis; Beijing Science Press: Beijing, China, 2010. [Google Scholar]
Figure 1.
The location map of the Yellow River Basin in China.

Figure 2.
Research framework.

Figure 3.
Spatial pattern of green development in the Yellow River Basin in 2012.

Figure 4.
Spatial pattern of green development in the Yellow River Basin in 2014.

Figure 5.
Spatial pattern of green development in the Yellow River Basin in 2016.

Figure 6.
Spatial pattern of green development in the Yellow River Basin in 2018.

Figure 7.
Spatial pattern of green development in the Yellow River Basin in 2020.

Figure 8.
Dynamic change of city first stage efficiency in Yellow River Reach from 2012 to 2020.

Figure 9.
Dynamic change of city second stage efficiency in Yellow River Reach from 2012 to 2020.

Figure 10.
Dynamic change of city total efficiency in Yellow River Reach from 2012 to 2020.


Table 1.
Descriptive statistical characteristics of input–output index system of GDE.
| Indicators | Variable | Variable Explain | Unit | Min | Max | Mean | Std. dev |
|---|---|---|---|---|---|---|---|
| Input indicators | Resource input | Water resources include agriculture, industry, residential life and ecological environment water | 100 million cubic meters | 0.97 | 276.50 | 57.54 | 79.57 |
| Energy consumption is measured by the energy consumption of the whole society over the years | Million tons | 532.03 | 41,390.00 | 7460.20 | 9858.36 | ||
| Labor input | The labor input is the number of people employed in labor, which is expressed by the number of people employed in the whole society in past years | Million per | 13.40 | 6767.00 | 1138.42 | 1861.99 | |
| Innovation input | The innovation input is R&D expenditure, which is calculated from the R&D internal expenditure of the whole society in past years | 100 million yuan | 0.35 | 1949.72 | 171.73 | 320.22 | |
| Low carbon economic | The low-carbon economy is dominated by the proportion of the tertiary industry in GDP of the whole region | % | 17.63 | 76.30 | 47.78 | 11.28 | |
| Expected outputindicators | Economic development | Regional industrial added value | 100 million yuan | 80.31 | 23,111.00 | 3412.93 | 5288.94 |
| Economic development for the total regional GDP | 100 million yuan | 188.93 | 73,128.99 | 9684.79 | 14,864.20 | ||
| Unexpected output indicators | Environmental pollution | Environmental pollution is industrial pollution such as industrial waste water, SO2, smoke, solid and other emissions | Million tons | 373.99 | 205,551.00 | 25,894.95 | 44,174.65 |
Table 2.
Specific description of each variable.
| Variable | Variable Description | Variable Representation | |
|---|---|---|---|
| Explained variable | GDE | Green development efficiency | Obtained by multi-period two-stage DEA model |
| Explaining variables | lnEDL | Economic development level | Log of GDP Per Capita |
| lnTI | Technological innovation | Log of R&D investment/GDP | |
| lnIS | Industrial structure | Log of secondary industry GDP/GDP | |
| lnUL | Urbanization level | Log of urban population/total regional population | |
| lnER | Environmental regulation | Log of investment in industrial pollution control/GDP | |
| lnFCU | Foreign capital utilization level | Log of actual utilized foreign direct investment/GDP |
Table 3.
Index collection and interpretation.
| Indicators, Sets and Variables | Interpretation |
|---|---|
| Efficiency value of decision-making unit | |
| decision-making unit, refers to provinces or cities | |
| index of DMUs, denote the number of DMUs | |
| index of inputs in the stage 1, denote the number of input indicator | |
| index of desirable output in the stage 1, denote the number of desirable output | |
| index of undesirable output in the stage 1, denote the number of undesirable output | |
| index of inputs in the stage 2, denote the number of input indicator | |
| index of outputs in the stage 2, denote the number of output indicator | |
| index of periods, denote the number of period | |
| the amount of input consumed by DMU in the period in the stage 1 | |
| the amount of desirable output produced by DMU in the period in the stage 1 | |
| the amount of undesirable output produced by DMU in the period in the stage 1 | |
| the amount of input consumed by DMU in the period in the stage 2 | |
| the amount of final output produced by DMU in the period in the stage 2 | |
| weights for input | |
| weights for desirable output | |
| weights for undesirable output in the stage 1 | |
| weights for input in the stage 2 | |
| weights for final output in the stage 2 |
Table 4.
Green development efficiency of Yellow River Basin.
| Region | 2012 | 2013 | 2014 | 2015 | 2016 | 2017 | 2018 | 2019 | 2020 | Mean | Rank | |
|---|---|---|---|---|---|---|---|---|---|---|---|---|
| Upper | Qinghai | 0.1377 | 0.1419 | 0.1774 | 0.2253 | 0.1881 | 0.1810 | 0.2357 | 0.3645 | 0.4670 | 0.2354 | 8 |
| Gansu | 0.2231 | 0.2255 | 0.2346 | 0.2568 | 0.3999 | 0.2021 | 0.2144 | 0.3610 | 0.3781 | 0.2773 | 7 | |
| Sichuan | 1.0000 | 1.0000 | 1.0000 | 1.0000 | 0.9181 | 0.8128 | 1.0000 | 1.0000 | 1.0000 | 0.9701 | 3 | |
| Ningxia | 0.1337 | 0.1320 | 0.1591 | 0.2096 | 0.2256 | 0.1571 | 0.2261 | 0.2781 | 0.3401 | 0.2068 | 9 | |
| Neimenggu | 0.5761 | 0.5681 | 0.5526 | 0.6119 | 0.5219 | 0.6084 | 0.5936 | 0.6791 | 0.5589 | 0.5856 | 5 | |
| Middle | Shaanxi | 0.6977 | 0.7105 | 0.7083 | 0.7458 | 0.7177 | 0.6670 | 0.7142 | 0.7872 | 0.5699 | 0.7020 | 4 |
| Shanxi | 0.5418 | 0.4674 | 0.4042 | 0.3641 | 0.4509 | 0.4004 | 0.4022 | 0.4504 | 0.4967 | 0.4420 | 6 | |
| Henan | 1.0000 | 0.8340 | 1.0000 | 1.0000 | 1.0000 | 1.0000 | 1.0000 | 1.0000 | 1.0000 | 0.9816 | 2 | |
| Lower | Shandong | 1.0000 | 1.0000 | 1.0000 | 1.0000 | 1.0000 | 1.0000 | 1.0000 | 1.0000 | 1.0000 | 1.0000 | 1 |
| Mean | 0.5900 | 0.5644 | 0.5818 | 0.6015 | 0.6025 | 0.5588 | 0.5985 | 0.6578 | 0.6456 | 0.6001 | -- | |
| Upper | Xining | 0.1593 | 0.1518 | 0.1899 | 0.3005 | 0.3049 | 0.2827 | 0.3131 | 0.4675 | 0.7728 | 0.3269 | 13 |
| Lanzhou | 0.2062 | 0.1996 | 0.2138 | 0.2747 | 0.3054 | 0.2775 | 0.2848 | 0.4228 | 0.4901 | 0.2972 | 14 | |
| Baiyin | 1.0000 | 1.0000 | 0.5107 | 0.5448 | 0.6588 | 1.0000 | 0.7010 | 1.0000 | 1.0000 | 0.8239 | 4 | |
| Aba prefecture | 1.0000 | 1.0000 | 1.0000 | 1.0000 | 1.0000 | 1.0000 | 1.0000 | 1.0000 | 1.0000 | 1.0000 | 1 | |
| Yinchuan | 0.4581 | 0.4332 | 0.4823 | 0.4963 | 0.4848 | 0.4523 | 0.6650 | 0.7383 | 0.8308 | 0.5601 | 7 | |
| Shizuishan | 0.3500 | 0.3277 | 0.5187 | 0.4689 | 0.3073 | 0.3929 | 0.4893 | 0.7794 | 0.7419 | 0.4862 | 9 | |
| Hohhot | 0.2182 | 0.2106 | 0.1992 | 0.2864 | 0.3128 | 0.2961 | 0.3156 | 0.4503 | 0.6710 | 0.3289 | 12 | |
| Baotou | 0.1936 | 0.1861 | 0.1983 | 0.2324 | 0.2315 | 0.2456 | 0.3108 | 0.4014 | 0.5065 | 0.2785 | 15 | |
| Middle | Xian | 0.2589 | 0.3209 | 0.5667 | 1.0000 | 1.0000 | 1.0000 | 1.0000 | 1.0000 | 0.8022 | 0.7721 | 5 |
| Yanan | 1.0000 | 1.0000 | 1.0000 | 1.0000 | 0.4745 | 0.4667 | 1.0000 | 1.0000 | 1.0000 | 0.8824 | 3 | |
| Yuncheng | 0.4271 | 0.4261 | 0.4247 | 0.5060 | 0.6096 | 0.3824 | 0.4180 | 0.4955 | 0.5327 | 0.4691 | 10 | |
| Lvliang | 1.0000 | 1.0000 | 0.7749 | 1.0000 | 0.8609 | 1.0000 | 1.0000 | 1.0000 | 1.0000 | 0.9595 | 2 | |
| Zhengzhou | 0.3275 | 0.2963 | 0.4635 | 0.5898 | 1.0000 | 1.0000 | 0.6181 | 0.9428 | 0.6175 | 0.6506 | 6 | |
| Luoyang | 0.1462 | 0.1440 | 0.1659 | 0.1977 | 0.2464 | 0.2258 | 0.3537 | 0.4804 | 0.4013 | 0.2624 | 16 | |
| Lower | Jinan | 0.3111 | 0.2593 | 0.3736 | 0.5065 | 0.6055 | 0.6588 | 0.8549 | 0.8210 | 0.5075 | 0.5442 | 8 |
| Liaocheng | 0.3383 | 0.3316 | 0.3650 | 0.4249 | 0.3485 | 0.5149 | 0.5868 | 0.2650 | 0.3550 | 0.3922 | 11 | |
| Mean | 0.4622 | 0.4554 | 0.4655 | 0.5518 | 0.5469 | 0.5747 | 0.6194 | 0.7040 | 0.7018 | 0.5646 | -- |
Table 5.
Green development efficiency of provinces and cities in 2020.
| Spatial Distribution | Upper Region | ||||||||
|---|---|---|---|---|---|---|---|---|---|
| Provinces | Qinghai | Gansu | Sichuan | Ningxia | Neimenggu | ||||
| First stage | 0.2248 | 0.1240 | 1.0000 | 0.1474 | 0.2809 | ||||
| Second stage | 1.0000 | 0.9139 | 1.0000 | 0.7715 | 1.0000 | ||||
| Overall | 0.4670 | 0.3781 | 1.0000 | 0.3401 | 0.5589 | ||||
| Level | Poor | Poor | Excellent | Poor | Poor | ||||
| Cities | Xining | Lanzhou | Baiyin | Aba prefecture | Yinchuan | Shizuishan | Hohhot | Baotou | |
| First stage | 1.0000 | 0.5964 | 1.0000 | 1.0000 | 1.0000 | 0.8705 | 0.5166 | 0.5316 | |
| Second stage | 0.6639 | 0.6190 | 1.0000 | 1.0000 | 0.7202 | 0.8265 | 1.0000 | 0.6848 | |
| Overall | 0.7728 | 0.4901 | 1.0000 | 1.0000 | 0.8308 | 0.7419 | 0.6710 | 0.5065 | |
| Level | Average | Poor | Excellent | Excellent | Good | Average | Average | Poor | |
| Spatial distribution | Middle region | Lower region | Whole region | ||||||
| Provinces | Shaanxi | Shanxi | Henan | Shandong | Mean | ||||
| First stage | 0.5014 | 0.3087 | 1.0000 | 1.0000 | 0.5097 | ||||
| Second stage | 0.8505 | 0.8603 | 1.0000 | 1.0000 | 0.9329 | ||||
| Overall | 0.5699 | 0.4967 | 1.0000 | 1.0000 | 0.6456 | ||||
| Level | Poor | Poor | Excellent | Excellent | Average | ||||
| Cities | Xian | Yanan | Yuncheng | Lvliang | Zhengzhou | Luoyang | Jinan | Liaocheng | Mean |
| First stage | 0.6541 | 1.0000 | 0.4223 | 1.0000 | 0.7235 | 0.4439 | 0.4661 | 0.2471 | 0.7235 |
| Second stage | 0.9732 | 1.0000 | 0.8438 | 1.0000 | 0.8183 | 0.6152 | 0.7563 | 0.7675 | 0.8183 |
| Overall | 0.8022 | 1.0000 | 0.5327 | 1.0000 | 0.7018 | 0.4013 | 0.5075 | 0.3550 | 0.7018 |
| Level | Good | Excellent | Poor | Excellent | Average | Poor | Poor | Poor | Average |
Table 6.
Evaluation types of provinces and cities in Yellow River Basin in 2020.
| Types | Provinces | Cities | Standard |
|---|---|---|---|
| Type I | Gansu, Ningxia, Shaanxi, Shanxi | Lanzhou, Shizuishan, Baotou, Xian, Yuncheng, Zhengzhou, Luoyang, Jinan, Liaocheng | < 1, < 1 |
| Type II | -- | Xining, Yinchuan | = 1, < 1 |
| Type III | Qinghai, Neimenggu | Hohhot | < 1, = 1 |
Table 7.
The regression result of Tobit model.
| GDE | Coefficient | Robust Std. Err. | t | p > |t| |
|---|---|---|---|---|
| EDI | 0.2707 | 0.2050 | 1.32 | 0.191 |
| TI | 0.0657 ** | 0.0278 | 2.36 | 0.021 |
| IS | −0.0296 | 0.1592 | −0.19 | 0.853 |
| UL | −0.4582 | 0.3722 | −1.23 | 0.222 |
| ER | −0.0449 | 0.0343 | −1.31 | 0.194 |
| FCU | 0.1124 *** | 0.0235 | 4.78 | 0.000 |
| C | −2.0484 | 1.9190 | −1.07 | 0.289 |
| Number of obs | 81 | |||
| Pseudo R2 | 1.1796 | |||
| Log pseudolikelihood | 10.1422 | |||
| F | 54.48 |
Notes: *** and ** represent the significance level of 1% and 5%, respectively.
Disclaimer/Publisher’s Note: The statements, opinions and data contained in all publications are solely those of the individual author(s) and contributor(s) and not of MDPI and/or the editor(s). MDPI and/or the editor(s) disclaim responsibility for any injury to people or property resulting from any ideas, methods, instructions or products referred to in the content. |
© 2023 by the authors. Licensee MDPI, Basel, Switzerland. This article is an open access article distributed under the terms and conditions of the Creative Commons Attribution (CC BY) license (https://creativecommons.org/licenses/by/4.0/).
Share and Cite
MDPI and ACS Style
Zhou, F.; Si, D.; Hai, P.; Ma, P.; Pratap, S. Spatial-Temporal Evolution and Driving Factors of Regional Green Development: An Empirical Study in Yellow River Basin. Systems 2023, 11, 109. https://doi.org/10.3390/systems11020109
AMA Style
Zhou F, Si D, Hai P, Ma P, Pratap S. Spatial-Temporal Evolution and Driving Factors of Regional Green Development: An Empirical Study in Yellow River Basin. Systems. 2023; 11(2):109. https://doi.org/10.3390/systems11020109
Chicago/Turabian StyleZhou, Fuli, Dongge Si, Panpan Hai, Panpan Ma, and Saurabh Pratap. 2023. "Spatial-Temporal Evolution and Driving Factors of Regional Green Development: An Empirical Study in Yellow River Basin" Systems 11, no. 2: 109. https://doi.org/10.3390/systems11020109
Note that from the first issue of 2016, this journal uses article numbers instead of page numbers. See further details here.