Article

Increasing Passenger Efficiency and Minimizing Infection Transmission in Chinese Metro Stations during COVID-19: A Simulation-Based Strategy Analysis

1
School of Modern Posts, Xi’an University of Posts and Telecommunications, Xi’an 710061, China
2
School of Engineering, Royal Melbourne Institute of Technology University, Carlton, VIC 3053, Australia
*
Author to whom correspondence should be addressed.
Systems 2023, 11(12), 555; https://doi.org/10.3390/systems11120555
Submission received: 19 October 2023 / Revised: 17 November 2023 / Accepted: 21 November 2023 / Published: 23 November 2023

Abstract

:
This study addresses the challenging problem of increasing passengers’ travel efficiency while lowering the infection transmission risk at metro stations during COVID-19 pandemic. To achieve this objective, we deploy Anylogic software and formulate an infection risk model. As a case study, this study focuses on a transfer metro station in Xi’an, China. Firstly, by utilizing Anylogic software, three distinct strategies are simulated: flow-control fences, travel reservation, and the collaborative use of travel reservations and flow-control fences. Secondly, the passenger density and average dwell time under these strategies are assessed while constructing an infection risk model to quantify the risk faced by passengers. Thirdly, when compared to the absence of any strategy, the results are as follows: (1) The flow-control fences strategy: implementing flow-control fences can effectively reduce the risk of passenger infection when the length of the flow-control fences is fixed at 47.5 m, but comes at the cost of a 20.15% decrease in passenger travel efficiency; however, excessively long flow-control fences will neither alleviate congestion nor reduce the infection risk. (2) The travel reservation strategy: the adoption of travel reservations, along with a fast track for reserved users, when the reservation proportion is 40%, leads to a remarkable 29.05% improvement in travel efficiency and reduces the risk of passenger infection by 67.12%. (3) The combined strategy: the combined utilization of travel reservations and flow-control fences enhances travel efficiency by 15.80% and reduces the risk of passenger infection by 56.77% when the reservation proportion is set at 30%. When the reservation proportion is between 10 and 30%, its infection risk reduction effect is better than that of the travel reservation strategy, but this is not necessarily true for their effects on travel efficiency. Finally, this study was compared to an existing study that proposed a new strategy by combining travel reservations with departure intervals, analyzing the effect of the implementation of the strategy with different departure intervals. The findings from this study have implications for developing appropriate strategies to optimize passenger flow without significantly compromising the transmission of infection risk during the pandemic.

1. Introduction

During the COVID-19 pandemic, China implemented a series of mobility restriction measures to prevent and control the epidemic, including, but not limited to, shutting down public transportation in the cities at the center of the outbreak, blocking all modes of transportation in the infected areas of cities, centralized quarantine and home quarantine, thus leading to a decline in human mobility [1,2,3]. Currently, China has eased its severe COVID-19 control policies; public transport passenger traffic is gradually recovering [4], but with the continuous mutation of COVID-19, the timing and scale of outbreaks are still highly random and unpredictable. As an important part of public services, rail transit needs effective counter strategies to control the spread of COVID-19, not only to ensure a level of service for passengers entering the station, but also as the management of the station concourse should not be neglected [5].
Urban rail transit stations function as pivotal hubs, facilitating the interchange and transition of people between various rail lines. They manage the influx of passengers arriving from multifarious directions, each with distinct travel objectives. These circumstances are marked by their intrinsic unpredictability, substantial and concentrated volumes, and disparate vectors. Addressing the challenge of managing high passenger volumes within metro stations to ensure public hygiene is a subject of significant scholarly interest [6]. In congested scenarios, such as peak hours at metro stations, fences to direct crowd movement have emerged as a widely adopted strategy for alleviating congestion [7]. The task of strategically designing the layout of these fences presents a complex black-box optimization problem. Zhong et al. [8] have introduced an evolutionary framework for the automated optimization of barrier layouts within metro stations. Additionally, they have proposed a novel fitness evaluation function to effectively gauge the efficacy of a given barrier layout design strategy, subsequently validating its effectiveness.
Staircases and escalators are typically identified as the most common bottleneck locations on metro platforms. Zhuang et al. [9] have discerned that specific barrier lengths possess the potential to optimize the flow patterns of stairway and escalator systems, thereby enhancing stairway utilization. The study conducted by Chen et al. [10] has illustrated that implementing flow-control fences at stairwell entrances leads to a significant decrease in the peak pedestrian density at crucial intersections, thereby enhancing service levels. Notably, the role of flow-control fences extends beyond the mere alleviation of traffic congestion; they also assume a pivotal function in expediting evacuation procedures. Li et al. [11] have indicated that an excessive number of fences does not enhance evacuation performance. In contrast, Minegishi et al. [12] posit that the deployment of temporary fences can, to some extent, ease the demands of emergency evacuation.
Moreover, some scholars advocate for implementing a demand response strategy in urban rail transit for epidemic prevention [13]. Drawing inspiration from the reservation systems used for medical appointments, dining establishments, parking facilities, and the like, the concept of travel reservation aims to harmonize supply and demand, effectively addressing the challenges arising from the excessive concentration of demand [14]. Notably, in response to the initial wave of the COVID-19 outbreak, a smartphone-based reservation system was already implemented in March 2020 at two bustling Beijing metro stations. Following successful reservations, passengers accessed the stations through dedicated fast tracks [15].
Travel reservation serves as an effective mechanism for operators to ensure the orderly transit of passengers through bottlenecks in high-density areas or during periods of passenger oversaturation [16]. This approach has found applications in various domains, including hospital outpatient departments, highways, buses, metros, the management of visitor flow at tourist destinations, and intelligent parking systems [17,18,19,20,21,22,23,24]. The scope of research on travel reservations encompasses aspects such as travel route reservations, intersection reservations, dedicated lanes, and the construction of comprehensive travel reservation systems [25].
Koolstra [26] has proposed a freeway slot-reservation system capable of reducing queuing costs by 50%. Liu et al. [27] have introduced a roadway reservation system and designed an online scheduling algorithm that preserves transportation efficiency by selectively accepting reservation requests. Sadreddini et al. [28] have advocated for a smart reservation system, demonstrating its effectiveness through a decision-based multicriteria reservation system, with a focus on Electric Vehicle (EV) user acceptance ratios across diverse case studies. Zhou [29] has advanced a novel public transport dispatching approach grounded in passenger reservation data. This method encompasses the creation of a customized dynamic dispatching model for multiple vehicles, accompanied by a computational example illustrating its superior performance compared to traditional single-vehicle solutions. Sun and Song [30] have introduced a centralized mobility service reservation system, which leverages the actual arrival and departure times of agents (i.e., users or vehicles) as preferred time windows at both origin and destination points, ultimately enhancing user travel experiences. Furthermore, the integration of travel reservations with other transportation modes can proficiently mitigate traffic congestion [31].
In the context of the COVID-19 pandemic, China’s stringent control strategies proved challenging for high-priority occupations requiring travel, notably medical personnel. Takemura et al. [32] have proposed a novel e-ticket reservation system, designed to maximize the distribution of tickets to high-priority users while minimizing congestion levels. Concurrently, metro passenger reservation and registration systems have been instrumental in the timely tracking of the movements of suspected patients and bolstering the traceability of pandemic control within public transportation [33]. Despite Beijing’s successful implementation of metro station travel reservations, the refinement of these reservation schemes remains ongoing. Shi et al. [34] have explored a train operation strategy capable of dynamically allocating carriage capacity by reserving carriages at different stations in response to time-varying passenger demand. This strategy has been validated using real data from the Beijing Metro’s Batong Line, yielding a high-quality carriage reservation plan within a short computational timeframe. Furthermore, when the reservation proportion falls within an appropriate range, it reduces travel time [35]. When Mei et al. studied reserved parking spaces, they found that when the proportion of reserved vehicles is not high, congestion in popular parking lots may intensify [36]. Qin et al. [37] found that 56% of travelers chose to make parking reservations during the travel process.
In summary, from the perspective of metro passenger flow control strategies, current research mainly includes flow-control fences and travel reservations. However, from the perspective of our research objectives, most of them focus on alleviating traffic congestion, with only a small portion considering reducing the passenger infection risk, and without quantification [13,33]. Therefore, this study addresses the challenging problem of increasing passengers’ travel efficiency while lowering the COVID-19 transmission risk at the metro station. In light of the upcoming analysis, this study selects Xiaozhai metro station as a case study. This study conducts simulations of the Xiaozhai metro station operations under three distinct flow restriction strategies: flow-control fences, travel reservations, and the combined strategy. Additionally, this study develops an infection risk assessment model for passengers under these three flow restriction strategies. The simulation model is developed in the Anylogic software platform, which is widely used for such agent-based simulations [38,39,40]. Ultimately, a comparative analysis is undertaken, contrasting the outcomes with scenarios devoid of any flow restriction strategies to elucidate the risk reduction efficacy associated with flow restrictions in the context of travel reservations.

2. Methodology

2.1. Research Methodology

Anylogic is a widely adopted modeling software for diverse systems, which includes discrete and continuous elements, and even hybrid systems, adeptly encapsulating the intricacies of agents involved. Moreover, its open architecture permits customization for module development, leveraging programming languages such as Java and others. In this research, passenger flow simulation is conducted using Anylogic, as delineated in the accompanying flowchart presented in Figure 1. The basic work in the early stage is as follows:
  • Simulation model. Build a model using Anylogic software, including security machines, gates, escalators, walls, self-service ticket machines, etc., and set up passenger travel logic.
  • Parameter settings. Set parameters through research and the relevant literature, including passenger flow, security inspection time, ticket purchase time, ticket checking time, pedestrian speed, etc. Use software recommendations or defaults for other parameter settings.
The methodology begins with establishing a control group and collecting pertinent metrics from the research site. Subsequently, relevant evaluation indicators for different passenger flow control strategies were obtained. These strategies are, respectively:
  • The flow-control fences strategy. This is a common passenger flow control strategy in railway stations that controls the passenger flow by regulating the entry and exit routes of the passenger flow.
  • The travel reservations strategy, which means that users make appointments through the client and then enter the station through the fast track.
  • The combined strategy. In addition, this paper also considers the combination of travel reservations with flow-control fences.
Finally, these strategies are subjected to comparative analysis vis à vis the control group.

2.2. Evaluating Indicators

2.2.1. Dwell Time

Dwell time alludes to the time span required for passengers to traverse a designated area. It is imperative to acknowledge that an elongated dwell time yields a commensurate reduction in travel efficiency.

2.2.2. Infection Risk Value

It is postulated that the infection risk value exhibits a linear correlation with both passenger density within the study area and passengers’ dwell time in said area [41]. Succinctly, an increase in passenger density corresponds to heightened congestion within the study area, incurring in a higher number of contacts, thereby elevating the infection risk. Furthermore, an elongation of passengers’ dwell time in the study area reflects an extended period of interaction with others, consequently amplifying the infection risk. Accordingly, the infection risk value model is formulated as follows:
λ ξ = C ξ ( t Δ t , t ] ρ ξ Δ t ξ ( t Δ t , t ] T ξ ξ ( t Δ t , t ] N ξ
The relevant parameters are defined as shown in Table 1. In this study, we consider C = 1 and Δ t = 60 s.

2.3. Research Data

Situated in Xi’an, China, the Xiaozhai metro station serves as a nexus for line 2 and line 3 [42], and its use has exhibited a pronounced rise amidst the prevailing COVID-19 pandemic containment policies in China. During peak periods, an inundation of passengers descends upon the station in a brief span, surpassing the station’s nominal capacity and creating recurrent gridlock. Passengers frequently find themselves forced to endure extended waits outside the station, thereby engendering diminished travel efficiency and an elevated susceptibility to infection. Therefore, this study selects Xiaozhai metro station as its research object. The spatial arrangement of Xiaozhai station’s concourse level is visually depicted in Figure 2. Here, A, B, C, D, E, and F represent the entrances/exits of the subway station. passengers pass security checks and buy tickets to enter the station through the gate, while 2-0, 2-1, 2-2, 3-0, 3-1, and 3-2 indicate the locations of escalators, as shown in Figure 2a; passengers may access and leave line 2 by means of the escalators denoted as 2-0, 2-1, and 2-2. Likewise, line 3 can be accessed via escalators 3-1 and 3-2. It is worth noting that escalator 3-0 exclusively functions as an egress point for passengers departing from line 3. Additionally, it is possible to effectuate transfers between line 2 and line 3. Red, yellow, blue, and green agents, respectively, represent passengers entering, leaving, transferring, and making reservations to enter the station, as shown in Figure 2b.
During the height of the pandemic in February 2020, the passenger volumes for public buses, trams, and rail transit plummeted to a mere 12.0% and 14.7% of the levels recorded during the same period in the previous year [43]. Consequently, utilizing data from this pandemic period does not offer a suitable reflection of present passenger travel patterns. Therefore, we have turned to data gleaned from the pertinent literature [44], as delineated in Table 2 and Table 3.

3. Simulation Analysis

3.1. Simulation Model

Due to the scope of this study, the modeling process exclusively encompasses the station concourse level, with no consideration given to other structures. Various elements are present within the metro station’s concourse level, including station control rooms, customer service centers, ticket vending machines, security apparatus, entry gates, pillars, and fences, among others. To facilitate the simulation process, only the areas designated for pedestrian transit are incorporated into the simulation. Areas where pedestrian access is restricted are treated as impassable obstacles and are symbolically represented as walls. Within the modeling of the station’s concourse-level environment, features such as gates, ticket vending machines, and security apparatus are delineated, while all obstructions are represented as rectangular walls. The escalators and staircases connecting to the station concourse level are constructed using the software’s “Rectangular Node” functionality. The related parameters of the environmental settings of the studied subway station are listed in Table 4, in accordance with the literature [44].
Pedestrian movement simulation is based on the social force model built into Anylogic, which was proposed by Helbing et al. [45]:
m i ( d v i / d t ) = f i 0 + j i f i j + w f i w + ε
where f i 0 is a self-driving force determined by factors such as destination and pedestrian psychological characteristics; f i j represents the repulsion of pedestrian i by other pedestrians; f i w is the combined force of the wall and path obstacles on pedestrian i; and ε is a small random force.
f i 0 = m i [ v i 0 ( t ) e i 0 ( t ) v i ( t ) / τ i ]
f i j = A i exp [ ( r i j d i j ) / B i ] n i j + k g ( r i j d i j ) n i j + k g ( r i j d i j ) Δ v j i t t i j
f i j = A i exp [ ( r i j d i j ) / B i ] n i j + k g ( r i j d i w ) n i w + k g ( r i j d i w ) ( v i t i w ) t i w
where m i is the mass of pedestrian i; v i 0 ( t ) e i 0 ( t ) is the desired speed of pedestrian i at time t; v i ( t ) is the current speed of pedestrian i at time t; and τ i is the relaxation time for pedestrian i to adjust from their current speed to their desired speed. A i exp [ ( r i j d i j ) / B i ] n i j indicates that pedestrian i is subjected to the “magnetic field force” of pedestrian j at time t. k g ( r i j d i j ) n i j + k g ( r i j d i j ) Δ v j i t t i j is the physical force exerted on pedestrian i by pedestrian j at time t.  A i is the strength of the repulsive force between pedestrians; r i j is the sum of the radii of pedestrian i and j; d i j is the distance between pedestrian i and j; B i is the range of action of the repulsive force; n i j is the direction of the “magnetic field force”; d i w is the center of the distance between pedestrian i and obstacle w;  t i j is the tangent direction;  n i w represents the vertical direction from the passenger i to the surface of the obstacle w; and t i w represents the direction tangential to it. The related pedestrian settings (desired speed, initial speed, diameter) involved in the social force model are listed in Table 4.

3.2. Flow-Control Strategies

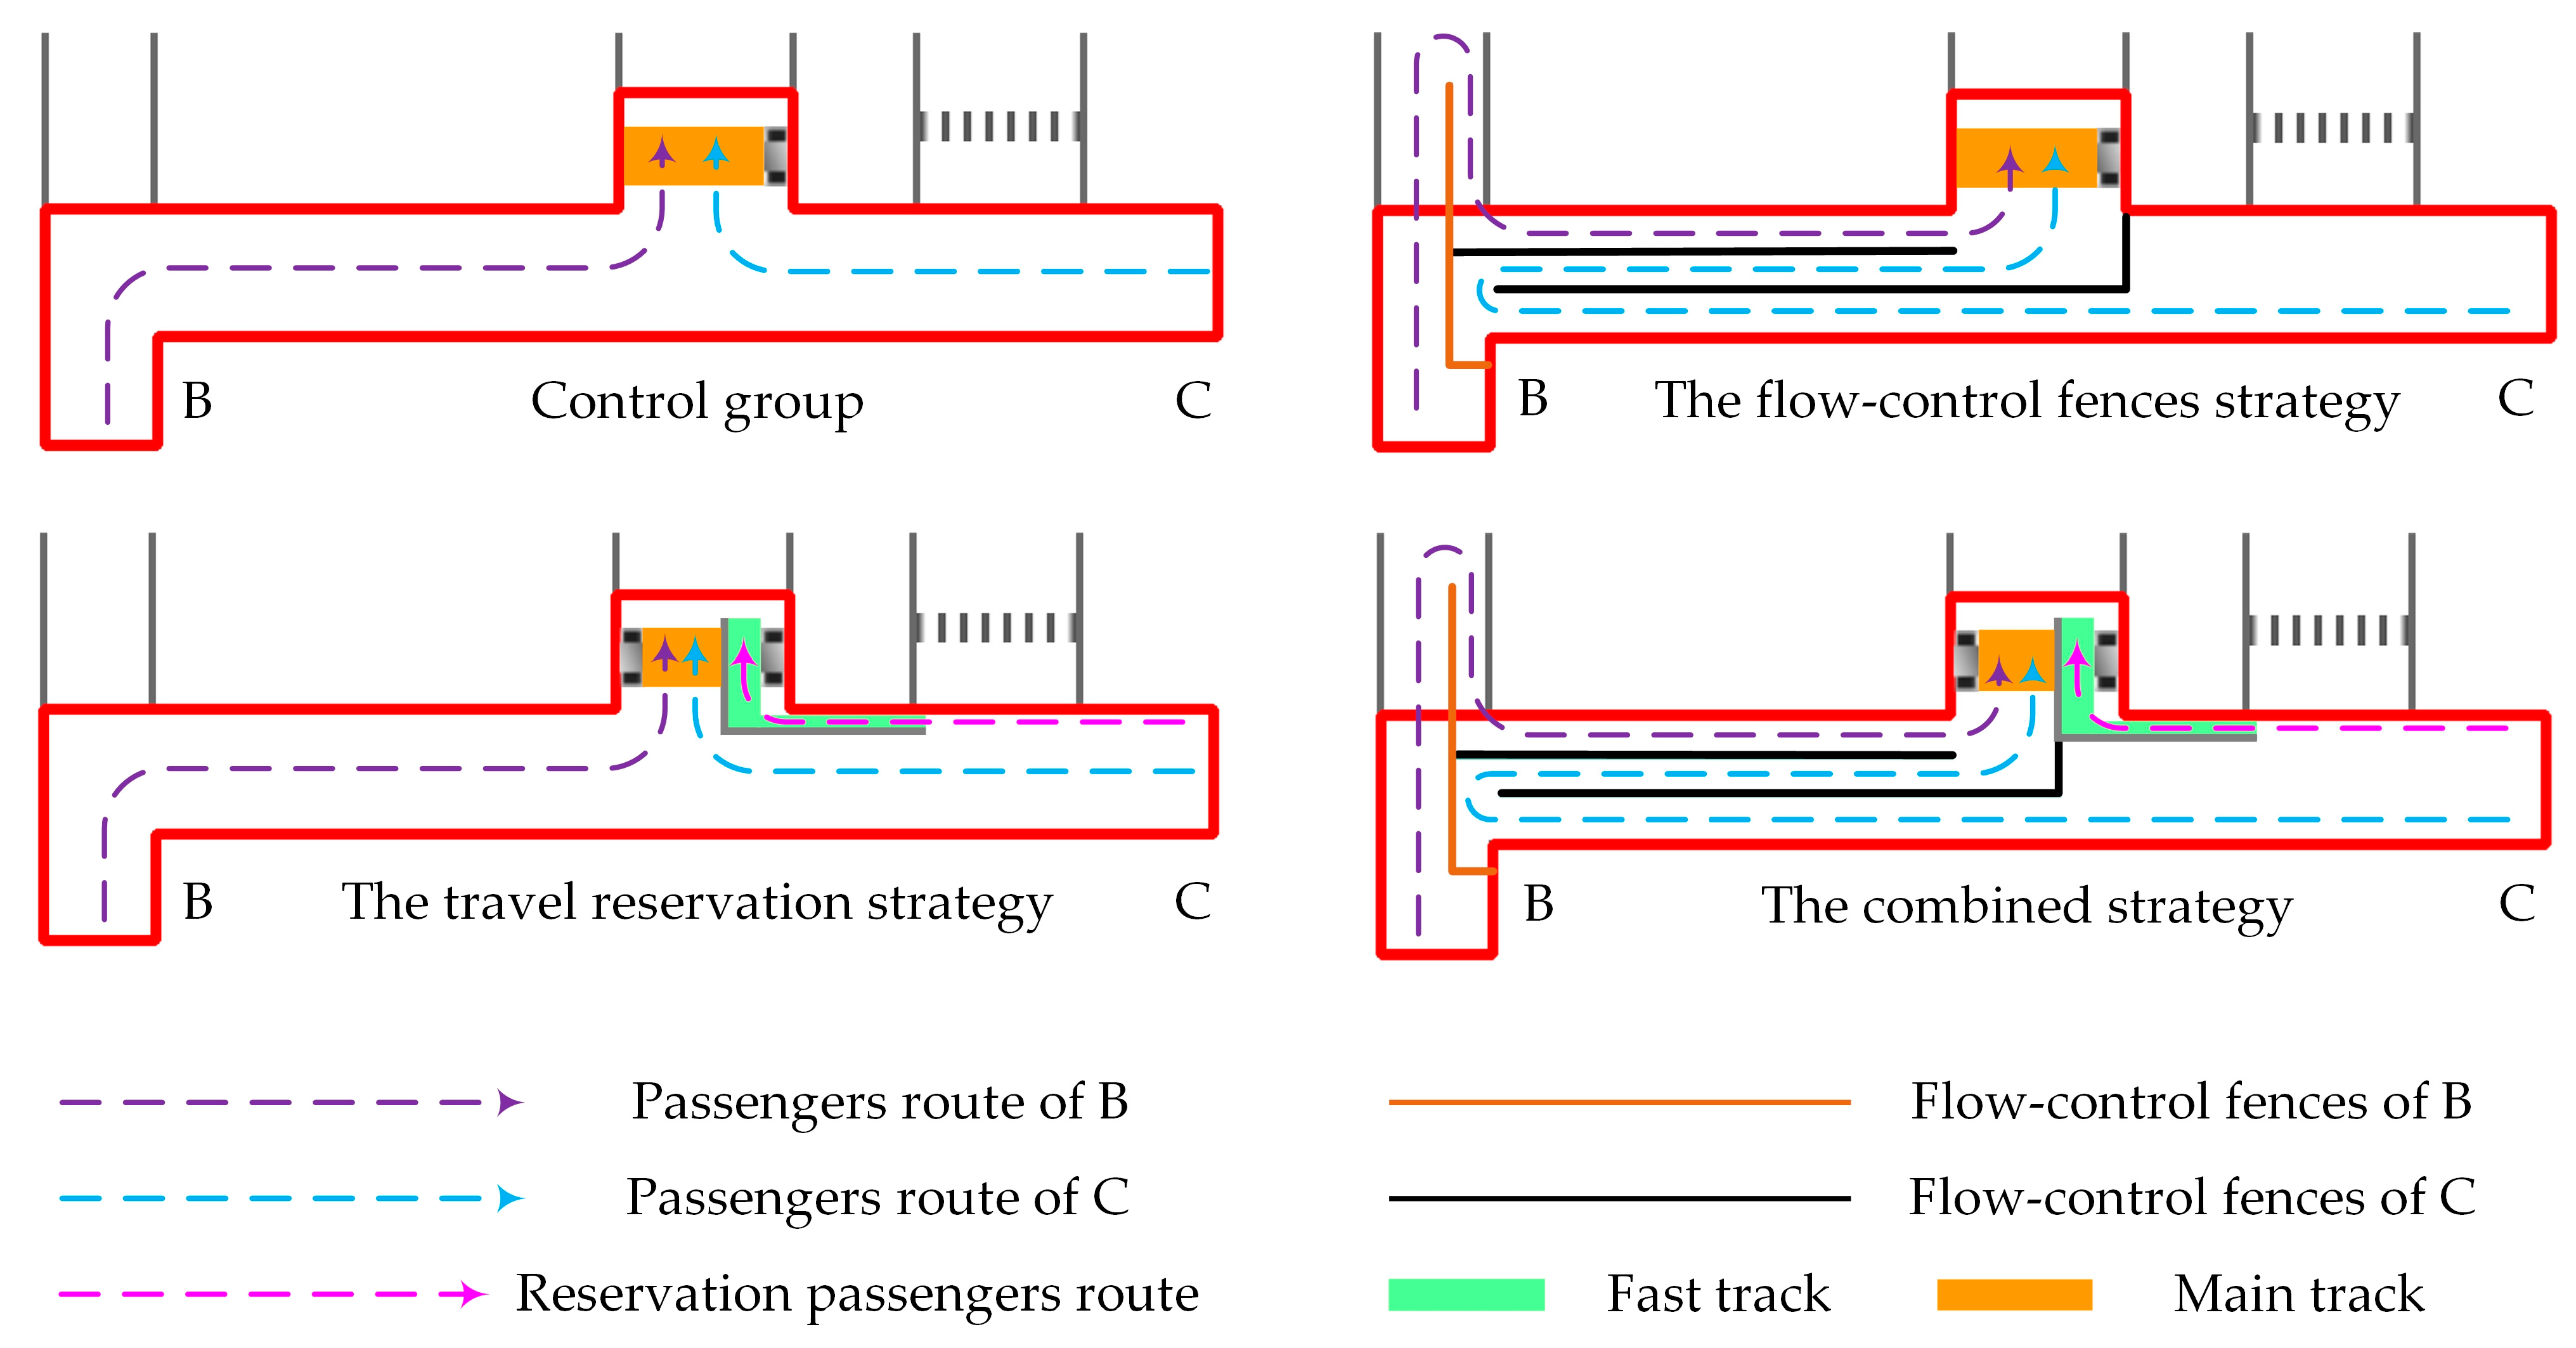
Drawing upon the modeling principles and pertinent data outlined earlier, we conducted a simulation of passenger flow organization at Xiaozhai metro station using Anylogic software. The simulation replicated the station’s operations over a period of 600 s. As shown in Figure 2b, congestion occurs at the BC entrance of Xiaozhai metro station, and no abnormalities are seen in other areas. Therefore, we selected the BC inlet area for the study, as shown in the Figure 2a study area. Furthermore, we have also gathered pertinent metrics pertaining to the internal area in order to investigate the potential occurrence of internal congestion resulting from varying passenger flow control strategies. Different flow-control strategies are proposed for the congestion in the study area, as shown in Figure 3:
  • The flow-control fences strategy: the passengers at the BC entrance must bypass the flow-control fences and pass through the main track.
  • The travel reservation strategy: in accordance with Wang’s methodology [25], passengers with reservations take the fast track, and those without reservations take the main track. It is assumed that a certain proportion (denoted by p R ) of passengers at entrance C will use travel reservations and enter the station through the fast track after making a reservation in advance; different reservation proportions have different effects.
  • The combined strategy: this paper also considers the collaborative use of travel reservation and flow-control fences to explore whether both would be more effective; similarly, different reservation proportions (denoted by p R ) also have different effects.

3.3. Simulation Results

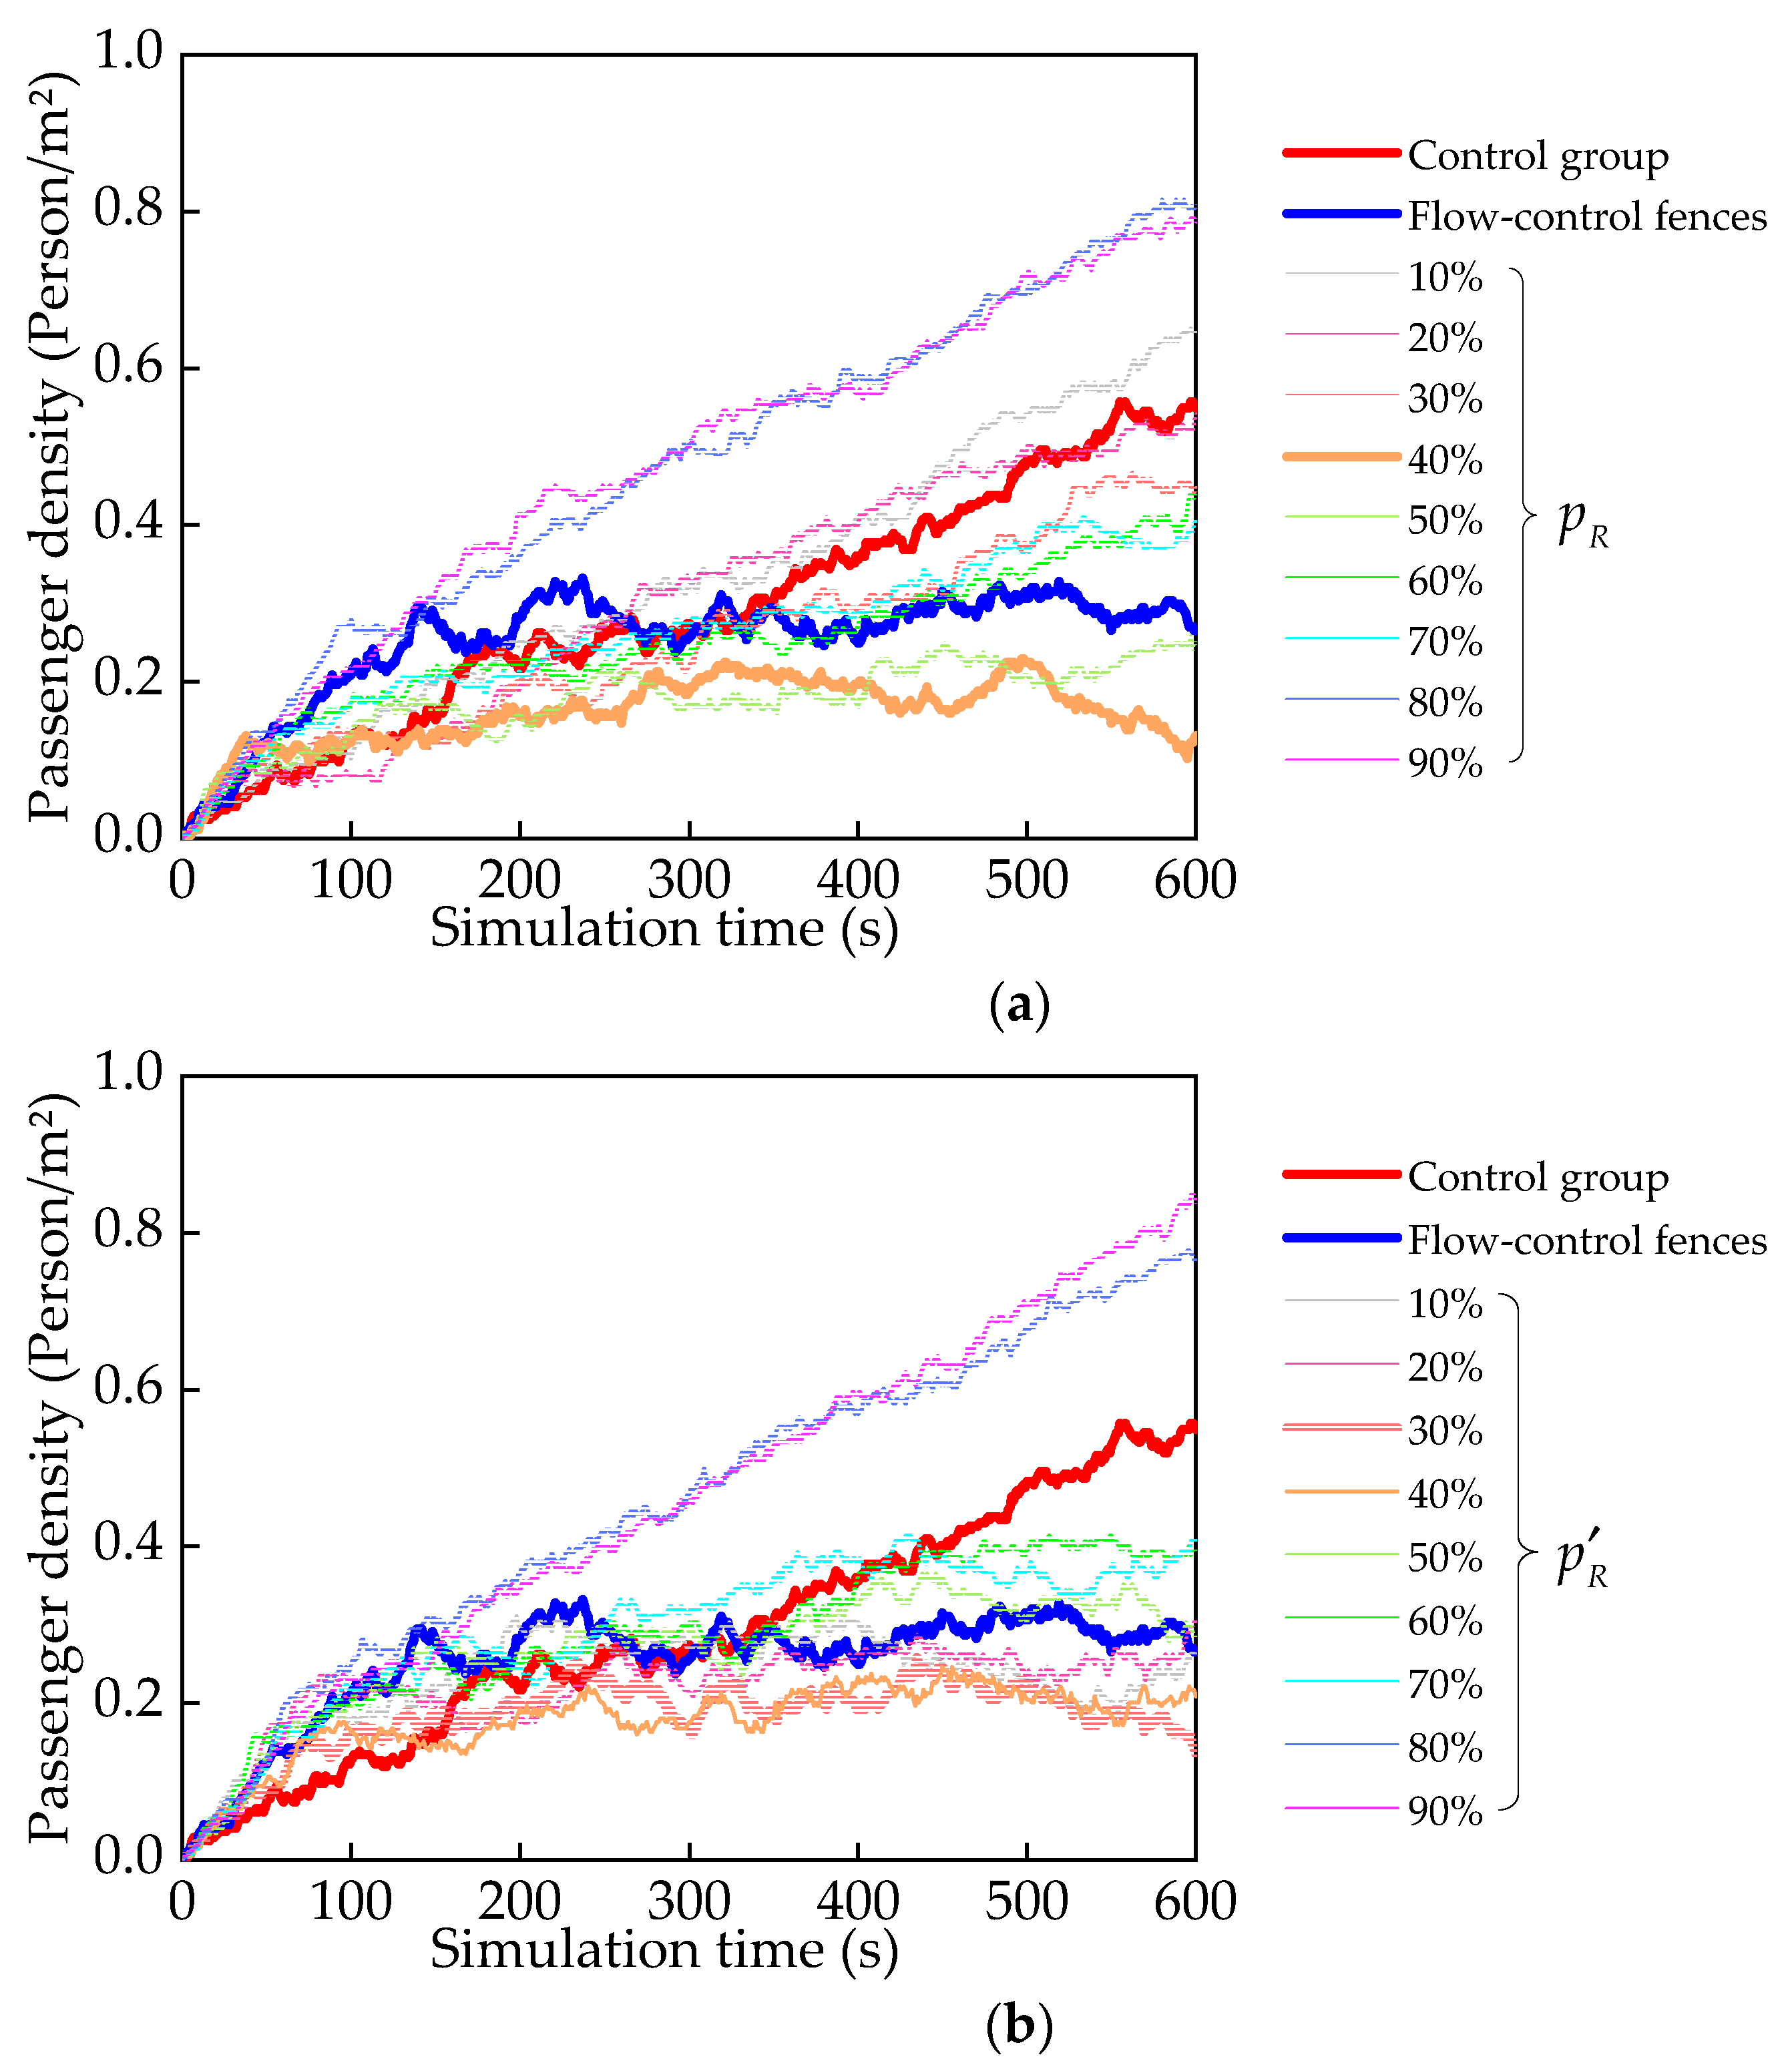
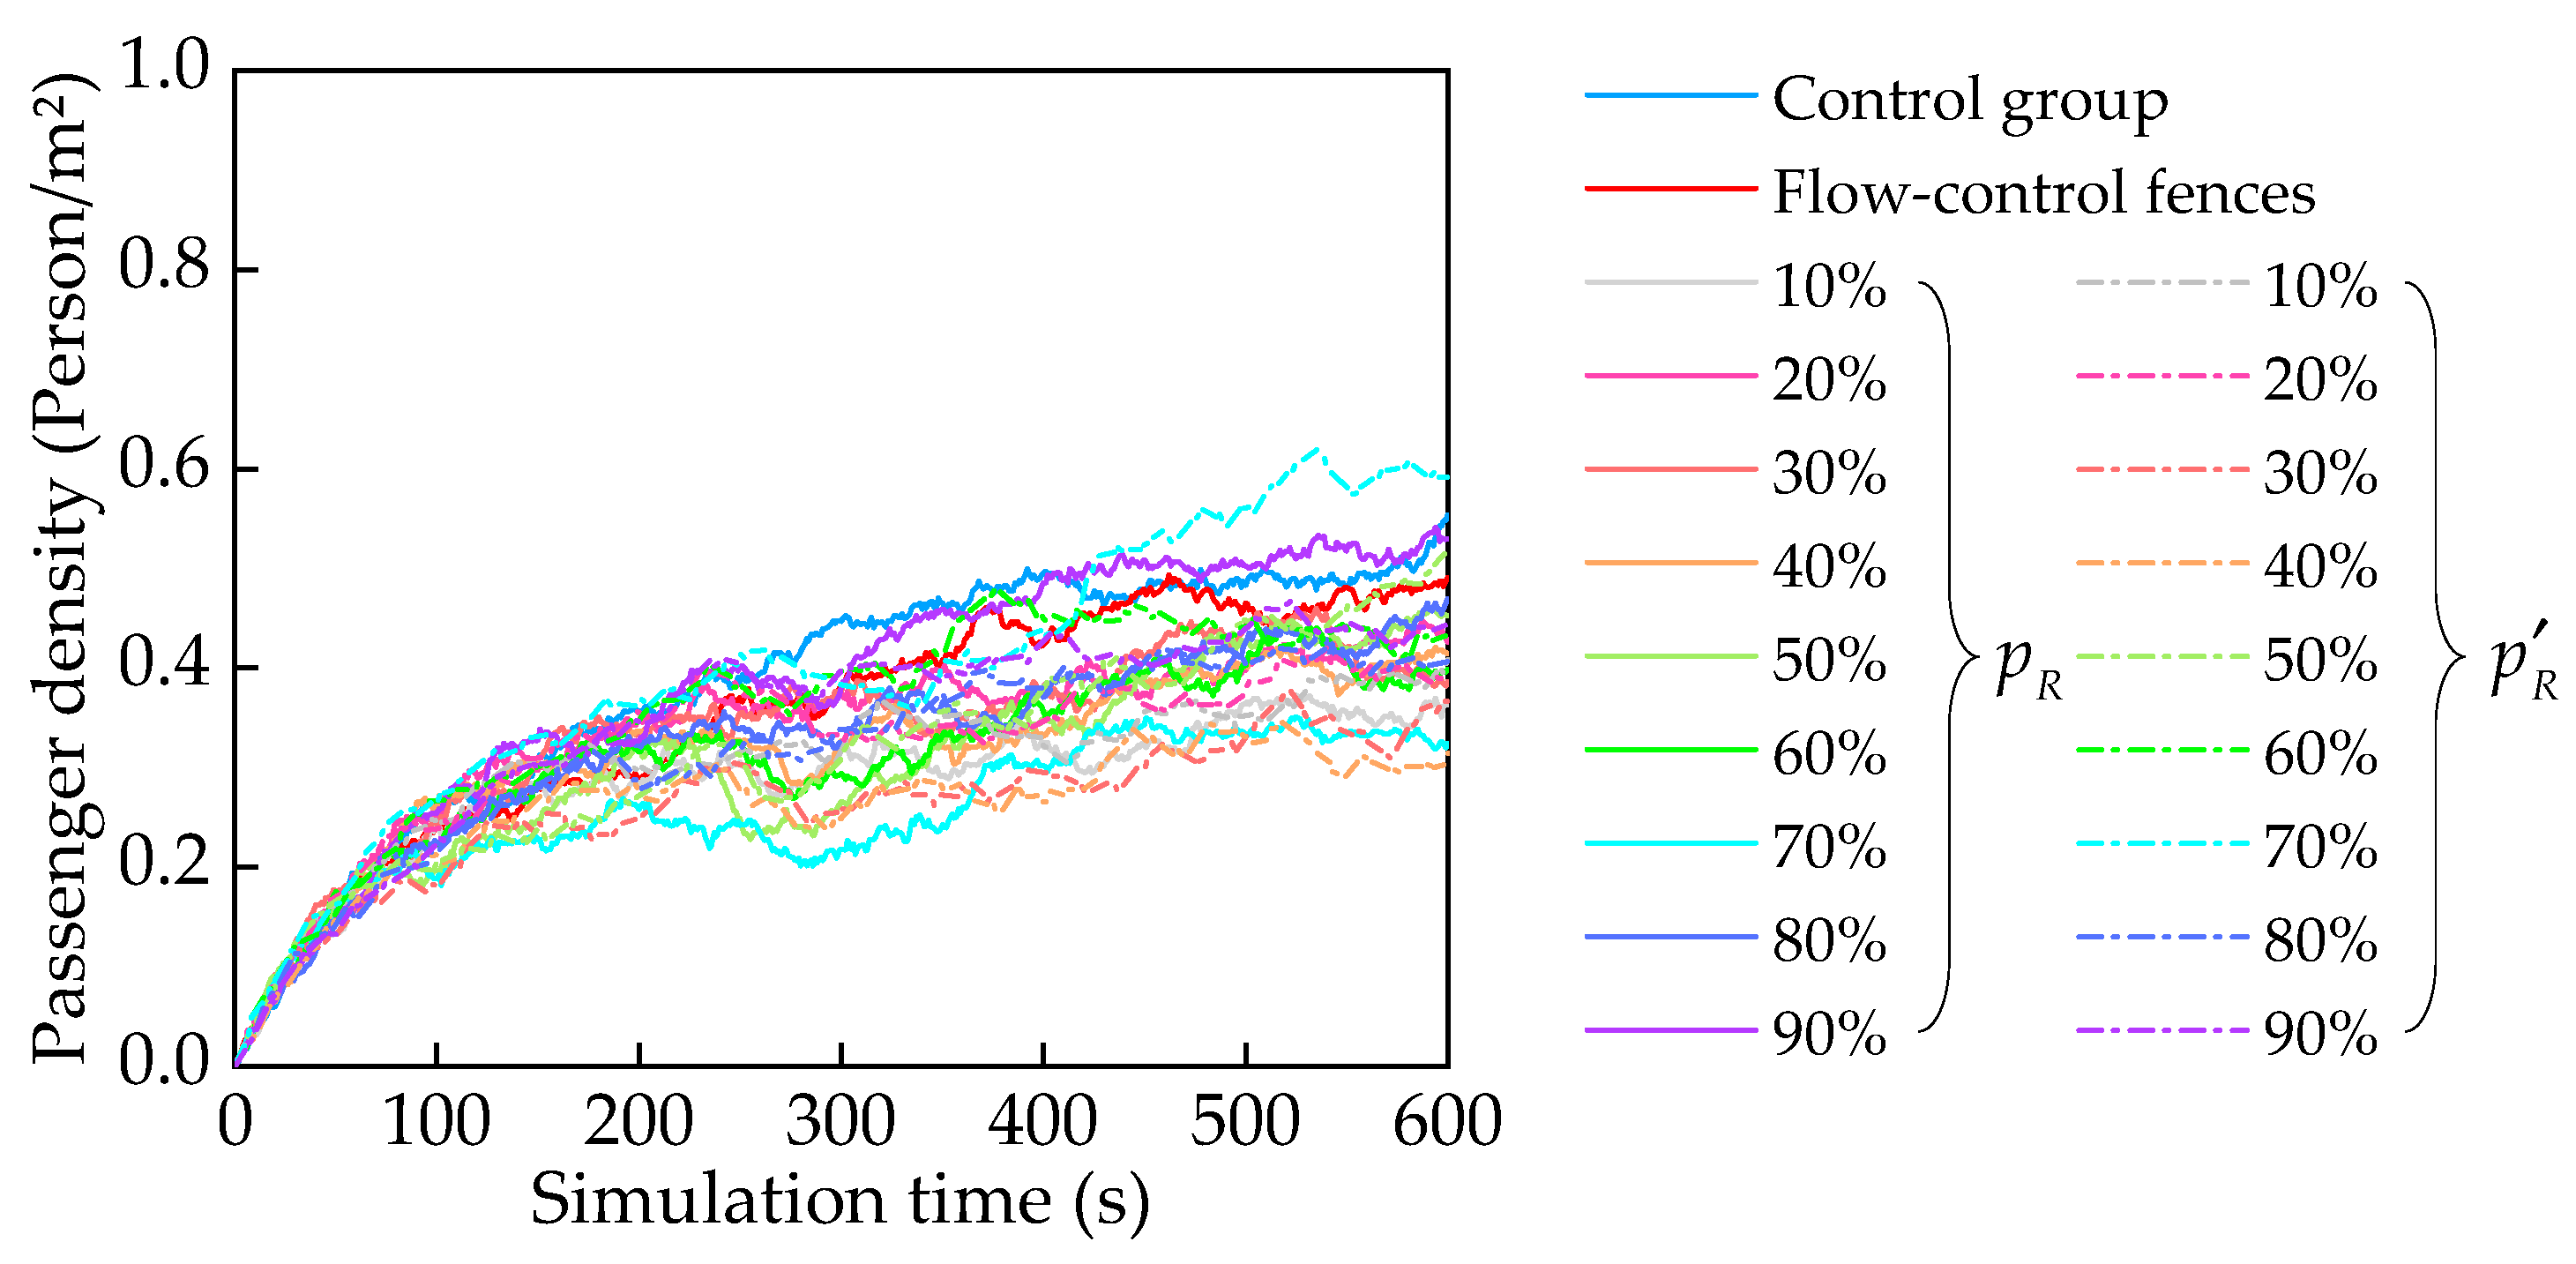
The figure denoted as Figure 4 illustrates the passenger density pertaining to the different strategies implemented for controlling passenger flow. The conducted investigation reveals that within the control group, the initial occurrence of congestion transpired approximately 140 s into the simulation and lasted for a duration of 50 s. Subsequently, the second congestion episode emerged around the 300 s mark and persisted until the conclusion of the simulation. On the other hand, when employing flow-control fences as a means to regulate passenger flow, a reduction in passenger density was not observed until 300 s had elapsed. This divergence can be attributed to the fact that, during the initial 300 s, there was no significant concentration of passenger flow, and the utilization of directional fences led to an increase in the walking distance for passengers. Such an arrangement was not conducive to diminishing the density of the passenger flow. When using reservation travel methods for traffic restriction, when the reservation proportion is between 30~70%, the passenger density is lower than that of the control group. But this does not necessarily mean that it effectively controls the passenger flow. Based on Figure 4b, it is evident that when the proportion of reservations is between 10~30%, the addition of flow-control fences impedes the gradual rise in passenger density in the main track, compensating for the low utilization of the fast track and, consequently, mitigating congestion in the main track.
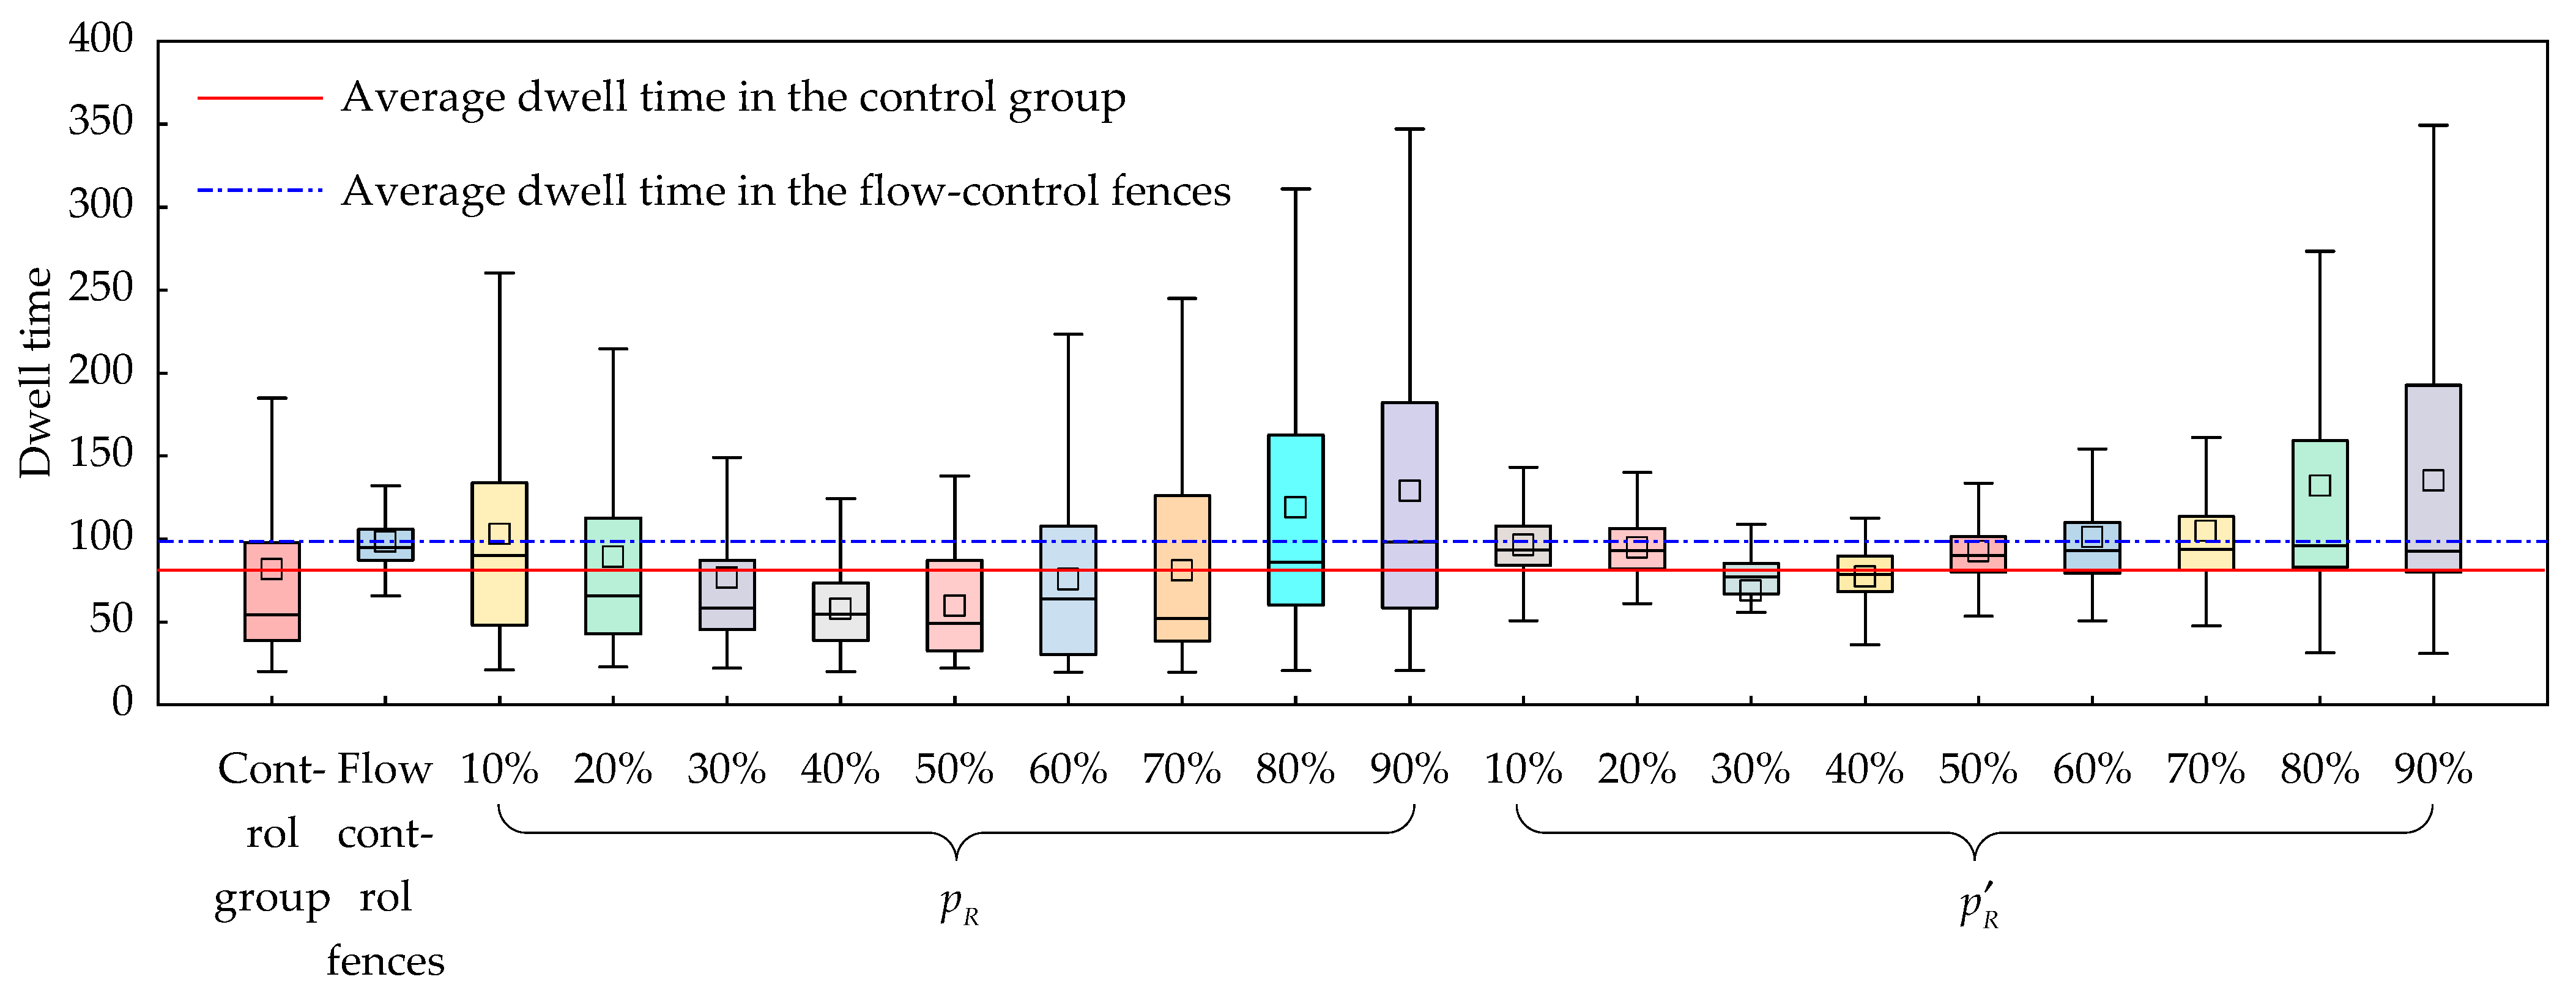
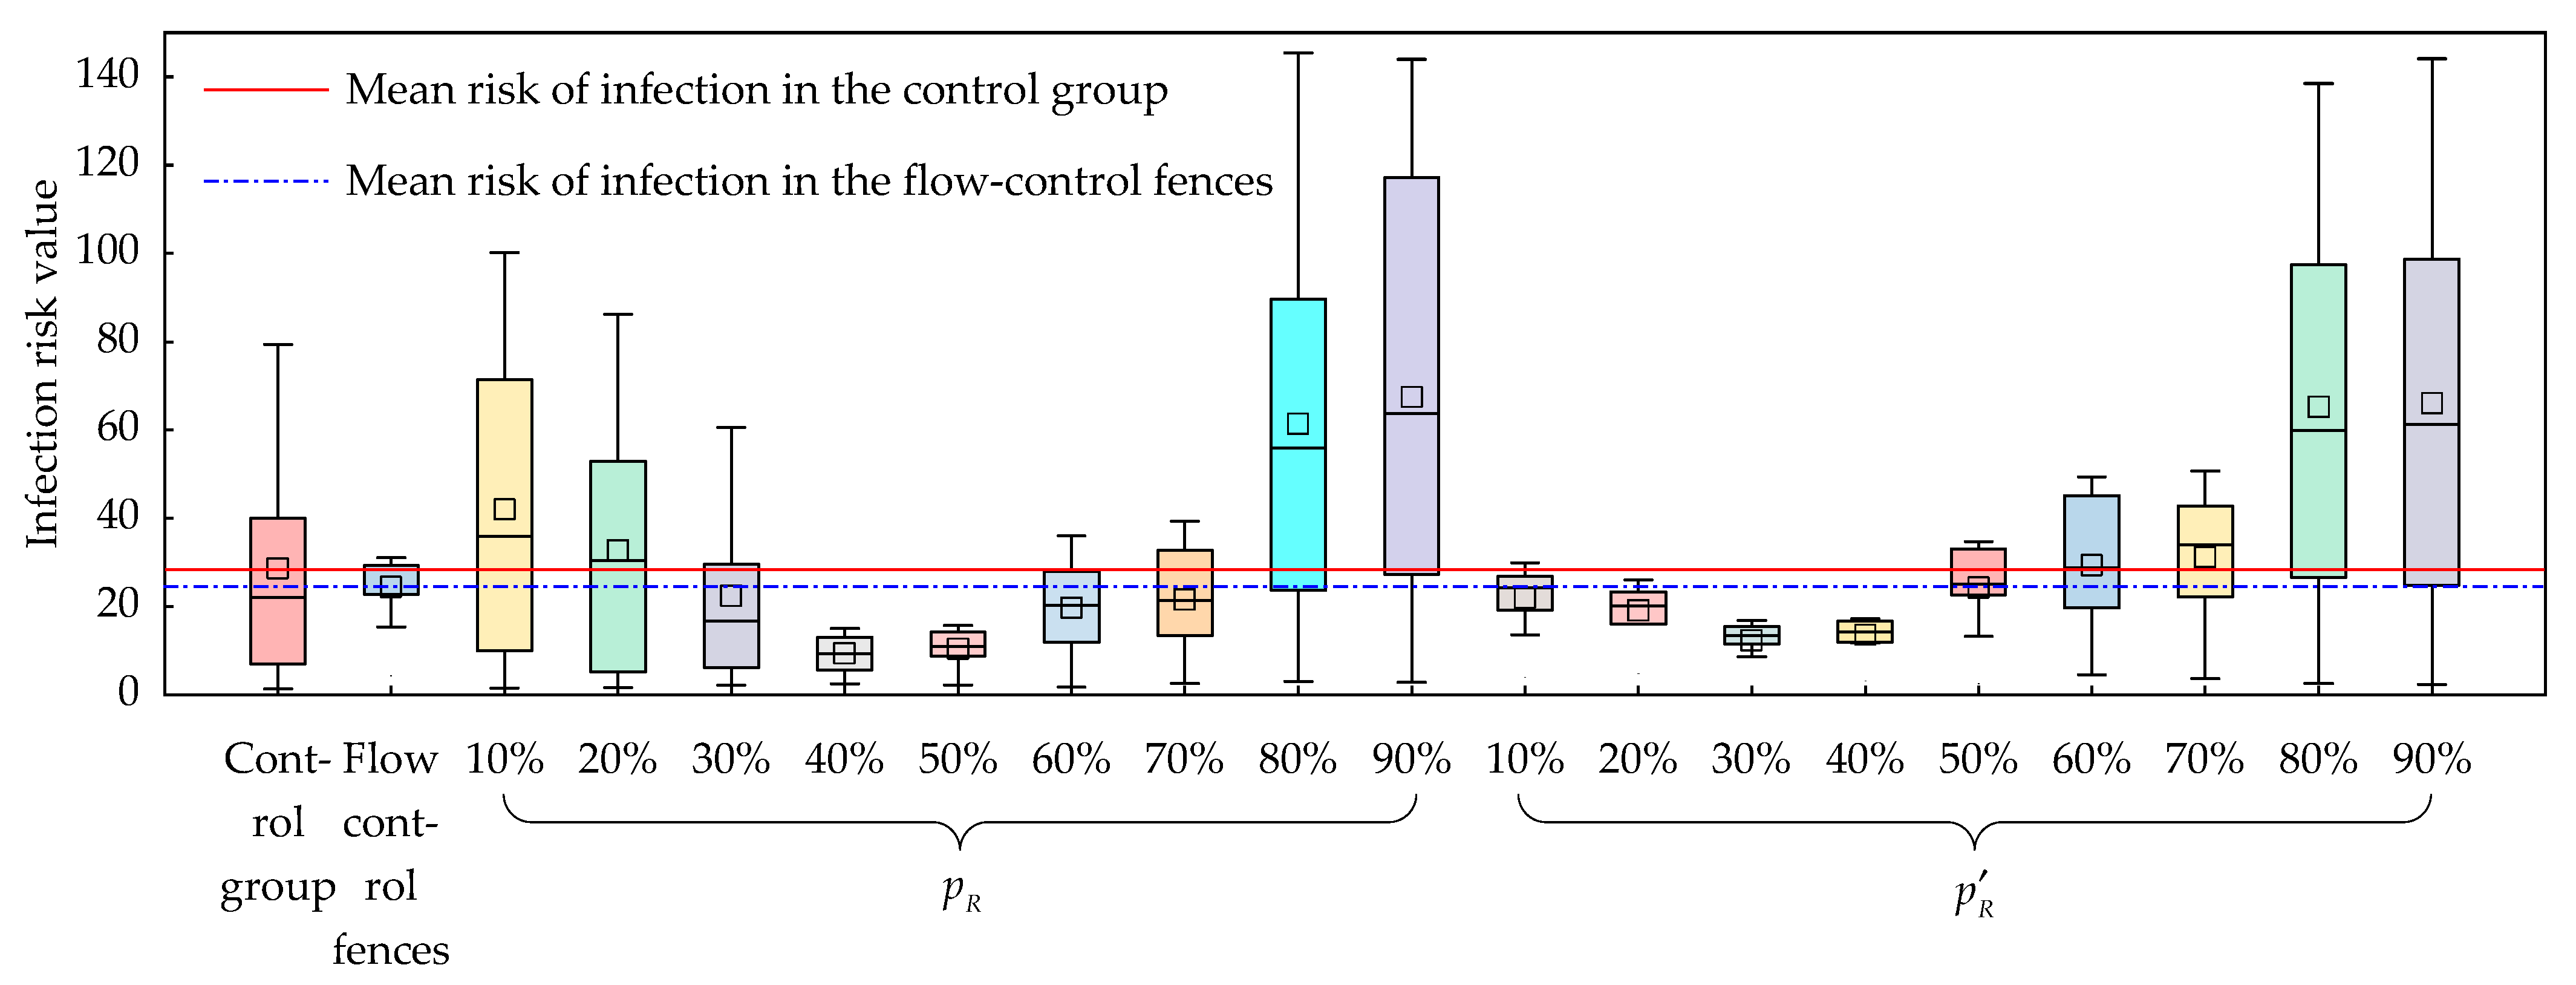
The installation of flow-control fences at the station entrance, as depicted in Figure 5 and Figure 6 and Table 5, necessitates an extension of the detour distance for passengers entering while effectively deliniating the walking distance for those passengers. This configuration enables incoming passengers, particularly during periods of high passenger flow, to enter the station in an orderly queue. This, in turn, enhances the station’s resilience to the impact of large passenger volumes and, to some degree, mitigates the risk of passenger infection. However, it is essential to acknowledge that the use of guide fences increases the distance passengers must traverse, thereby reducing the efficiency of passenger travel and overall customer satisfaction.
When implementing travel reservations to manage traffic flow, optimal results are achieved when the reservation proportion falls within the range of 40~50%. This phenomenon arises due to the adverse effects of both excessively low and excessively high rates of reservation. In the former scenario, the fast track remains underutilized, resulting in congestion on the main track and exacerbating congestion issues. Conversely, in the latter scenario, the main track remains underutilized while the fast track becomes congested. These findings align with the research conducted by Mei and Qin, with the exception that their vehicle reservations were substituted with passenger reservations [36,37].
When travel reservations are employed in conjunction with flow-control fences, they effectively alleviate the obstruction of the original passage. This observation aligns harmoniously with the findings presented by Patel in the literature [31]. However, in this study, it is imperative to exercise judicious control over the proportion of reservations, maintaining them within the range of 30~40%. This not only reduces the risk of infection but also enhances travel efficiency. However, when the reservation proportion surpasses 50%, the main track is no longer obstructed. Employing flow-control fences in this scenario would counterproductively prolong the duration of passenger dwell times and increase the risk of infection for passengers.
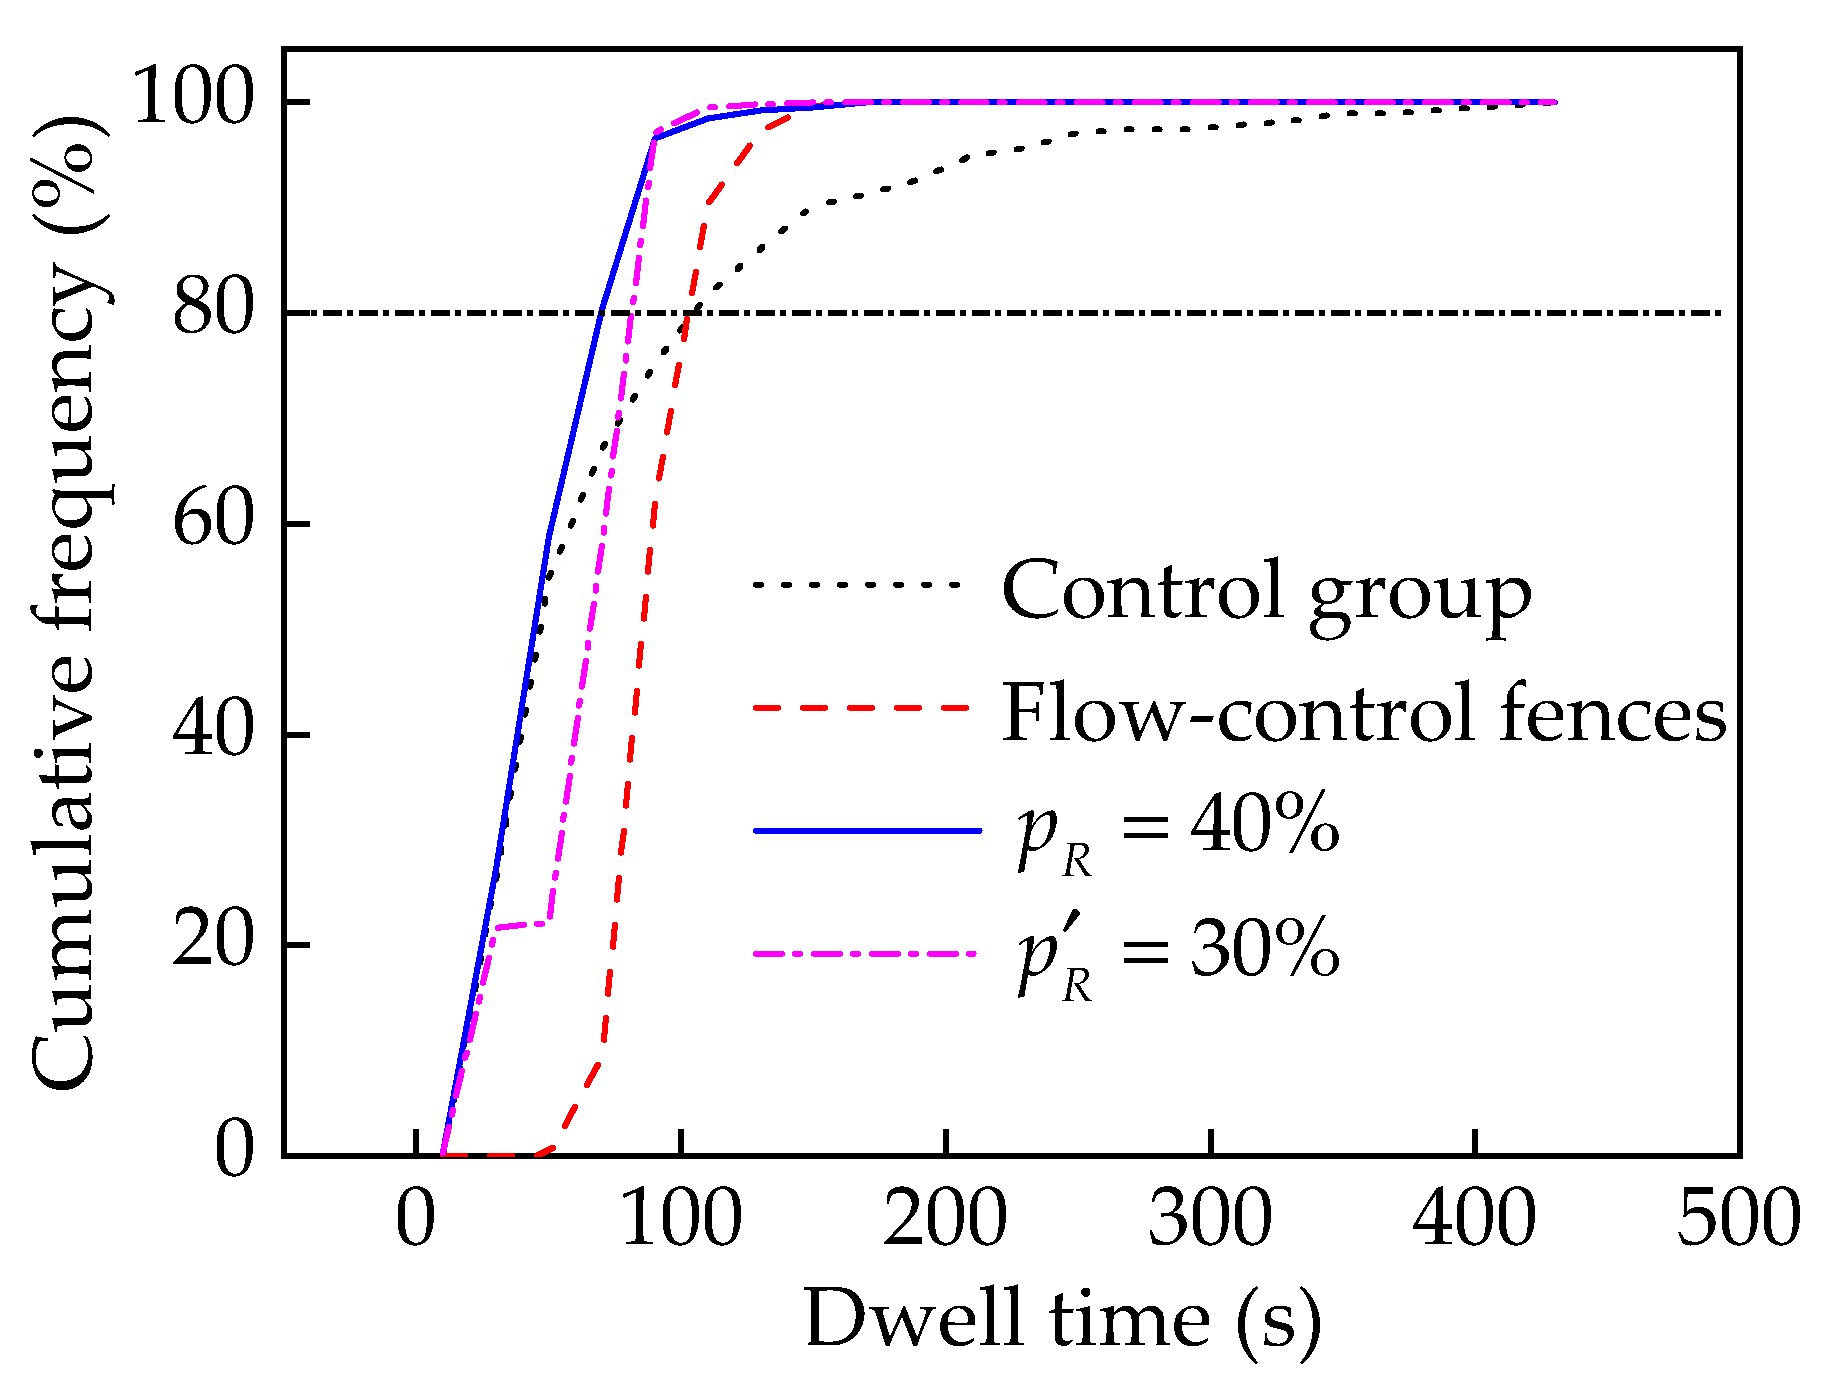
Figure 7 illustrates the following key findings:
  • The travel reservation strategy (reservation proportion: 40%): in this scenario, approximately 80% of passengers can navigate the area within a mere 80 s, showcasing the efficiency of this strategy.
  • The flow-control fences strategy: In this approach, nearly all individuals successfully navigate the flow-control fences within the initial 50 s. Subsequently, approximately 80% of the population can traverse the area within 110 s, indicating effective flow control.
  • The combined strategy: in this strategy, in which certain passengers need to circumvent the flow-control fences, approximately 80% of individuals can complete the passage within 87 s, representing a balanced compromise between the two strategies.
Figure 8 illustrates the fluctuations in passenger density within the internal area while using various strategies for managing passenger flow. It becomes evident that when the proportion of reservations is either excessively low or high, congestion develops at the entrances labeled B and C, resulting in a lower passenger density within the internal area. In contrast, when the reservation proportion falls within an appropriate range, the passenger density within the internal area increases. However, it is crucial to note that an elevated passenger density within the internal area does not necessarily equate to congestion. Instead, it signifies that the density tends to stabilize over time, converging to a certain value. Naturally, this outcome is also influenced by entrances A, D, E, and F.

3.4. Sensitive Analysis

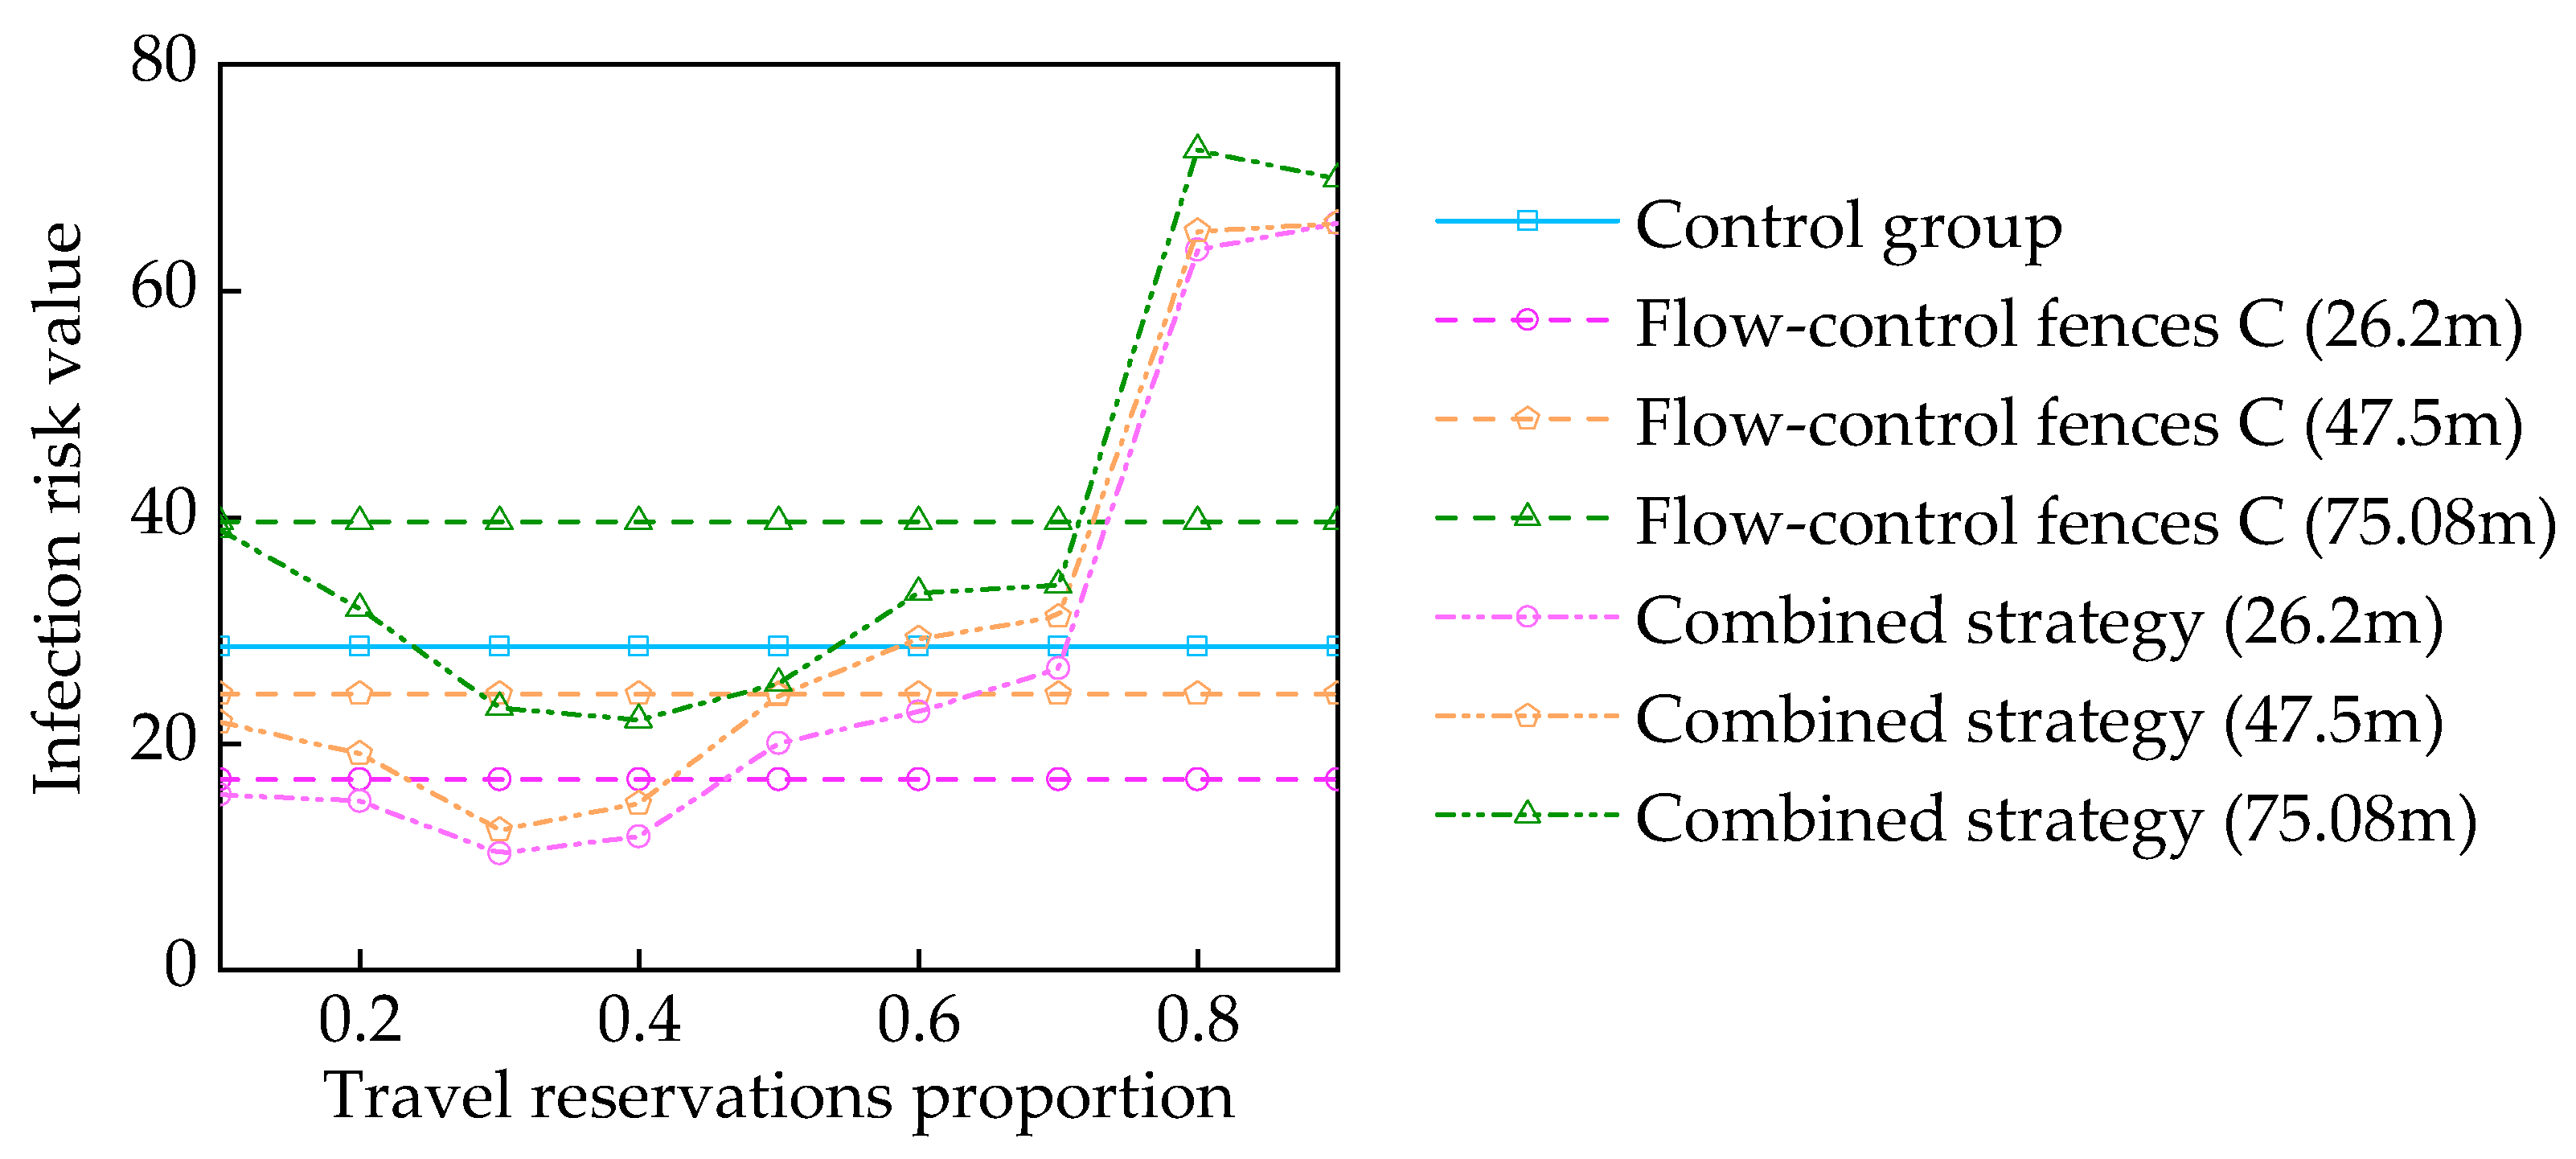
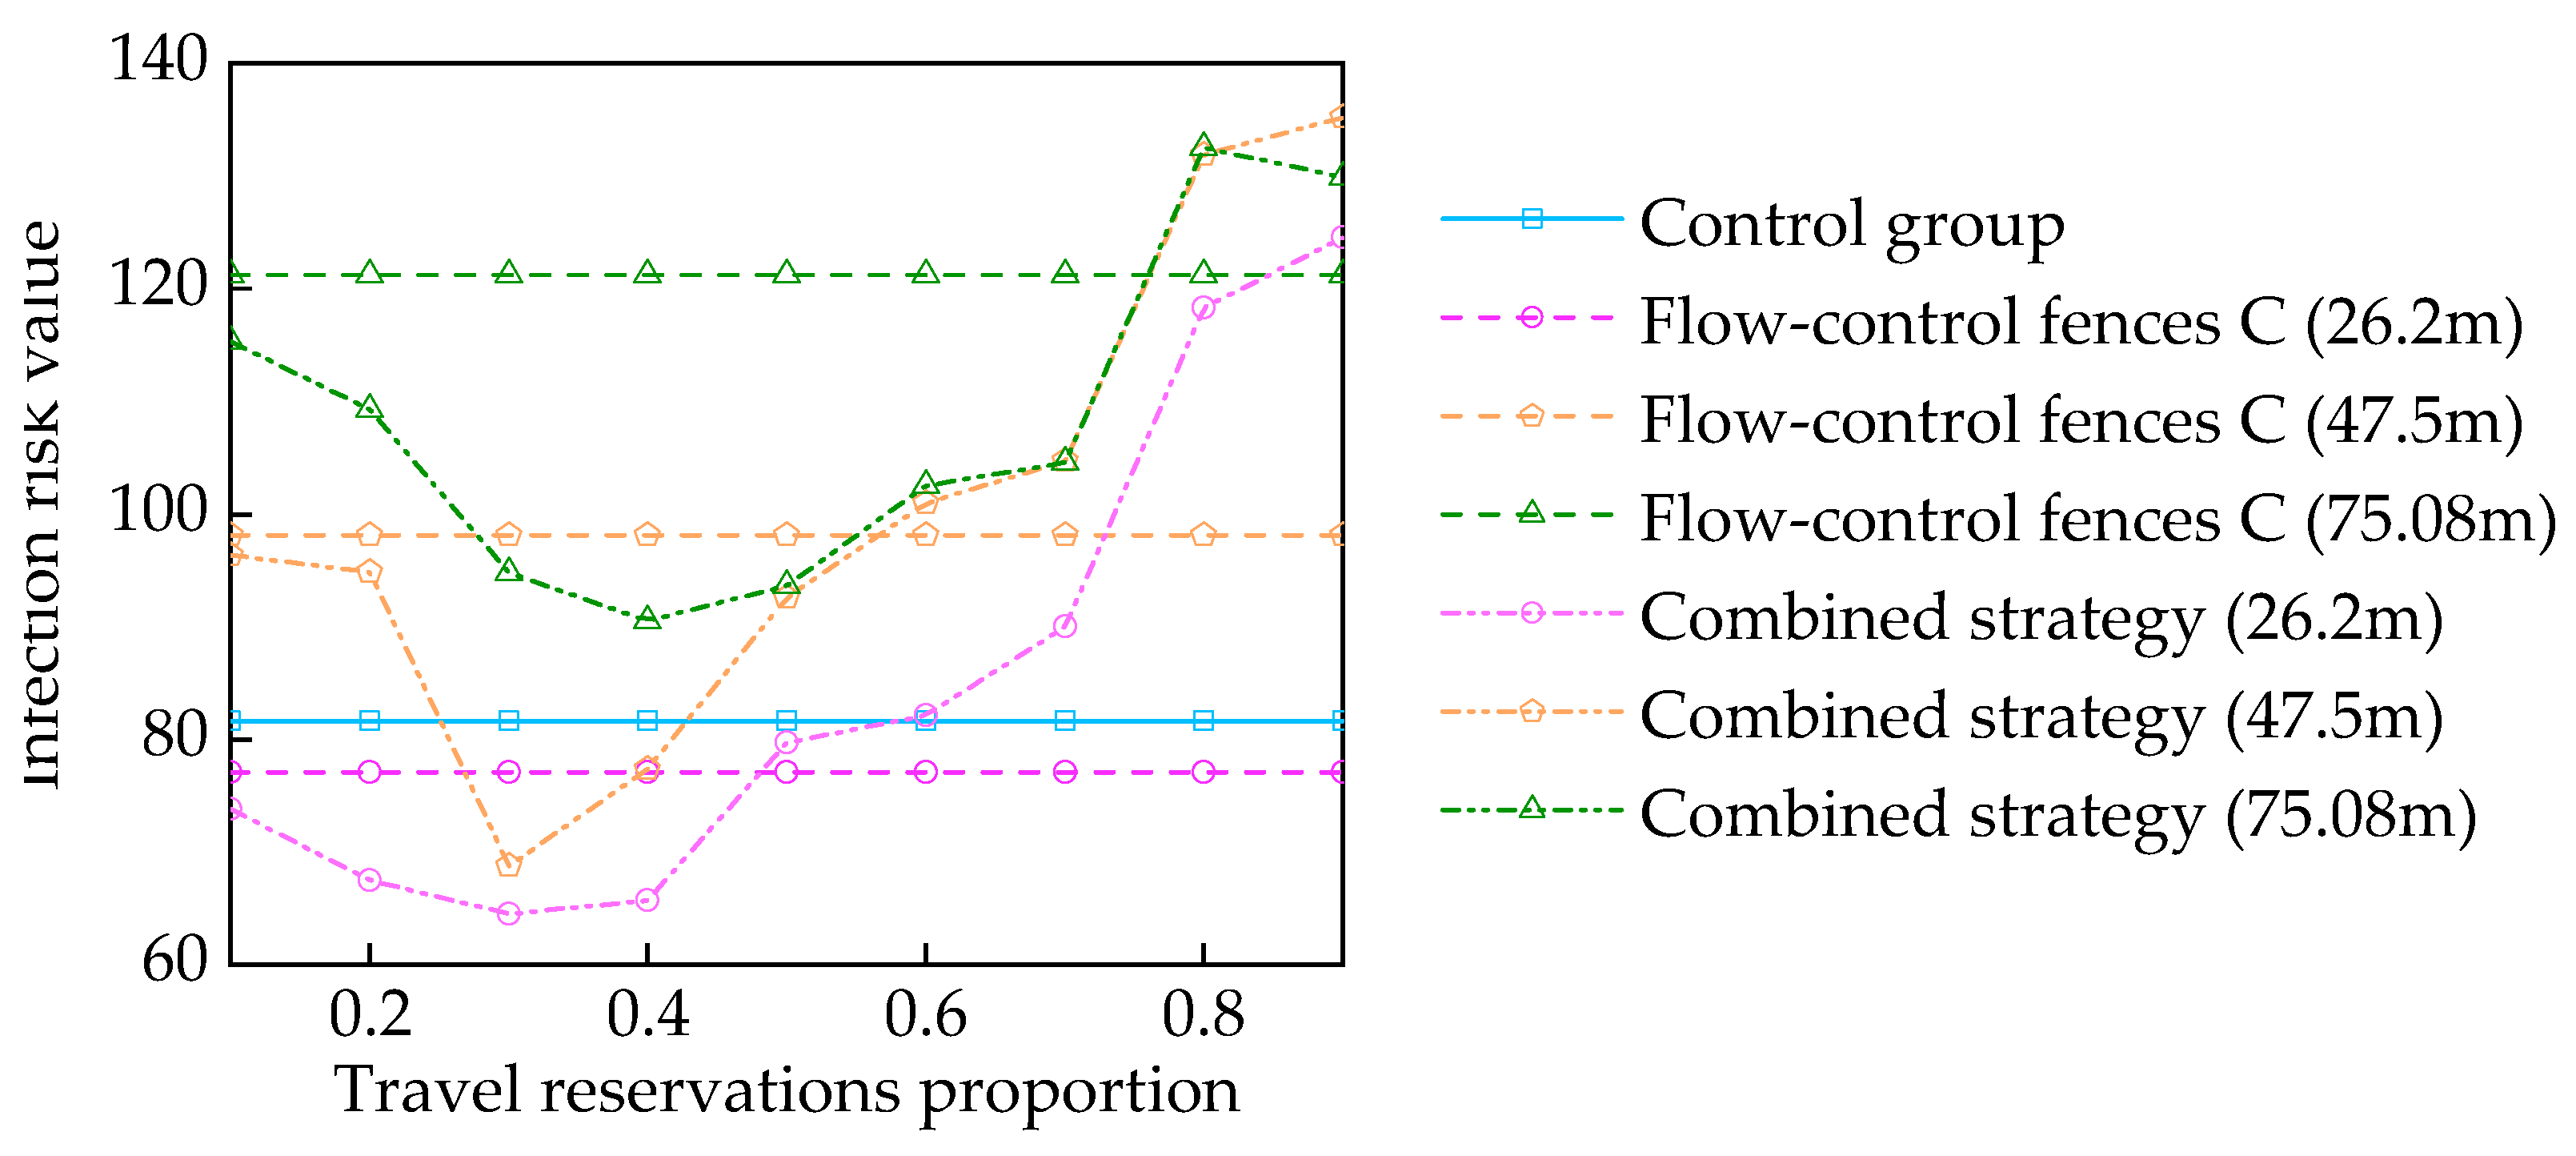
Next, the influence of the flow-control fences’ length on various parameters was analyzed. As shown in Figure 9 and Figure 10, maintaining the length of the flow-control fences B while decreasing the length of the flow-control fences C to 26.2 m results in a concomitant reduction in both the risk of passenger infection and the average dwell time. The effect is more pronounced alongside a reservation proportion between 30% and 40%, with 30% emerging as the most favorable option, improving travel efficiency by 20.98% and reducing the infection risk by 63.97%, as shown in Table 6. In comparison to the travel reservation strategy (Table 5), a superior performance is evident across the reservation proportions ranging from 10% to 30%.
Conversely, increasing the length of the flow-control fences C to 75.08 m generates an elevation in both passenger infection risk and average dwell time. The optimization effect is more pronounced within a reservation proportion spanning from 30% to 40%, with 40% emerging as the most optimal choice. In this scenario, the absence of congestion necessitates that passengers to traverse extended distances, consequently heightening the associated infection risk. It is obvious that the optimal reservation proportion experiences an increase under these circumstances. This augmentation stems from the concept that, in a non-congested fast track, a greater proportion of reservations serves to offset the prolonged detours undertaken by non-reservation passengers, thereby increasing travel efficiency and minimizing the infection risk; this finding aligns with Wang’s research [14].

3.5. Comparative Study

In this section, we conducted a comparative study with the work of Lu et al. [39], in which different passenger flow control strategies in metro stations were proposed and investigated. Their strategies include: (1) controlling the inflow and outflow; (2) setting up flow-control fences; and (3) adjusting the timetable of the trains. They examined the efficiency of different strategies and their results suggested that reducing the inflow and outflow of the passengers and shortening the departure interval of trains can effectively alleviate the congestion in metro stations. In the following comparison, we first introduce the optimal strategy from ref. [39] (defined as strategy 1) into our simulation and compare it with the proposed strategies of our study. Then, a new combined strategy is proposed and analyzed by incorporating the timetable of the trains into our strategy.
  • Strategy 1: reducing the inflow by 45% and the outflow by 40%, setting the length of the flow-control fences to 7.5 m, and setting the departure interval of line 2 to 2 min 15 s [39].
  • Strategy 2: without restricting the inflow and outflow, adopting a travel reservation proportion of p R = 40 % and setting the departure interval of line 2 to 2 min.
  • Strategy 3: reducing both the inflow the outflow by 40%, adopting the travel reservation proportion of p R = 40 % and setting the departure interval of line 2 to 2 min.
We conducted different simulations using the three strategies. The results are sumarized in Table 7 and Table 8. For the study area, as shown in Table 7, we find that if the inflow and outflow are not restricted, the average dwell time is similar between strategy 1 and our strategy 2, while the infection risk increases by 1.4 times that of strategy 1. When the inflow and outflow are restricted as they are in strategy 1, we find that the average dwell time of our strategy 3 decreases by 36.77%, compared to strategy 1, and the infection risk reduces by 52.82%.
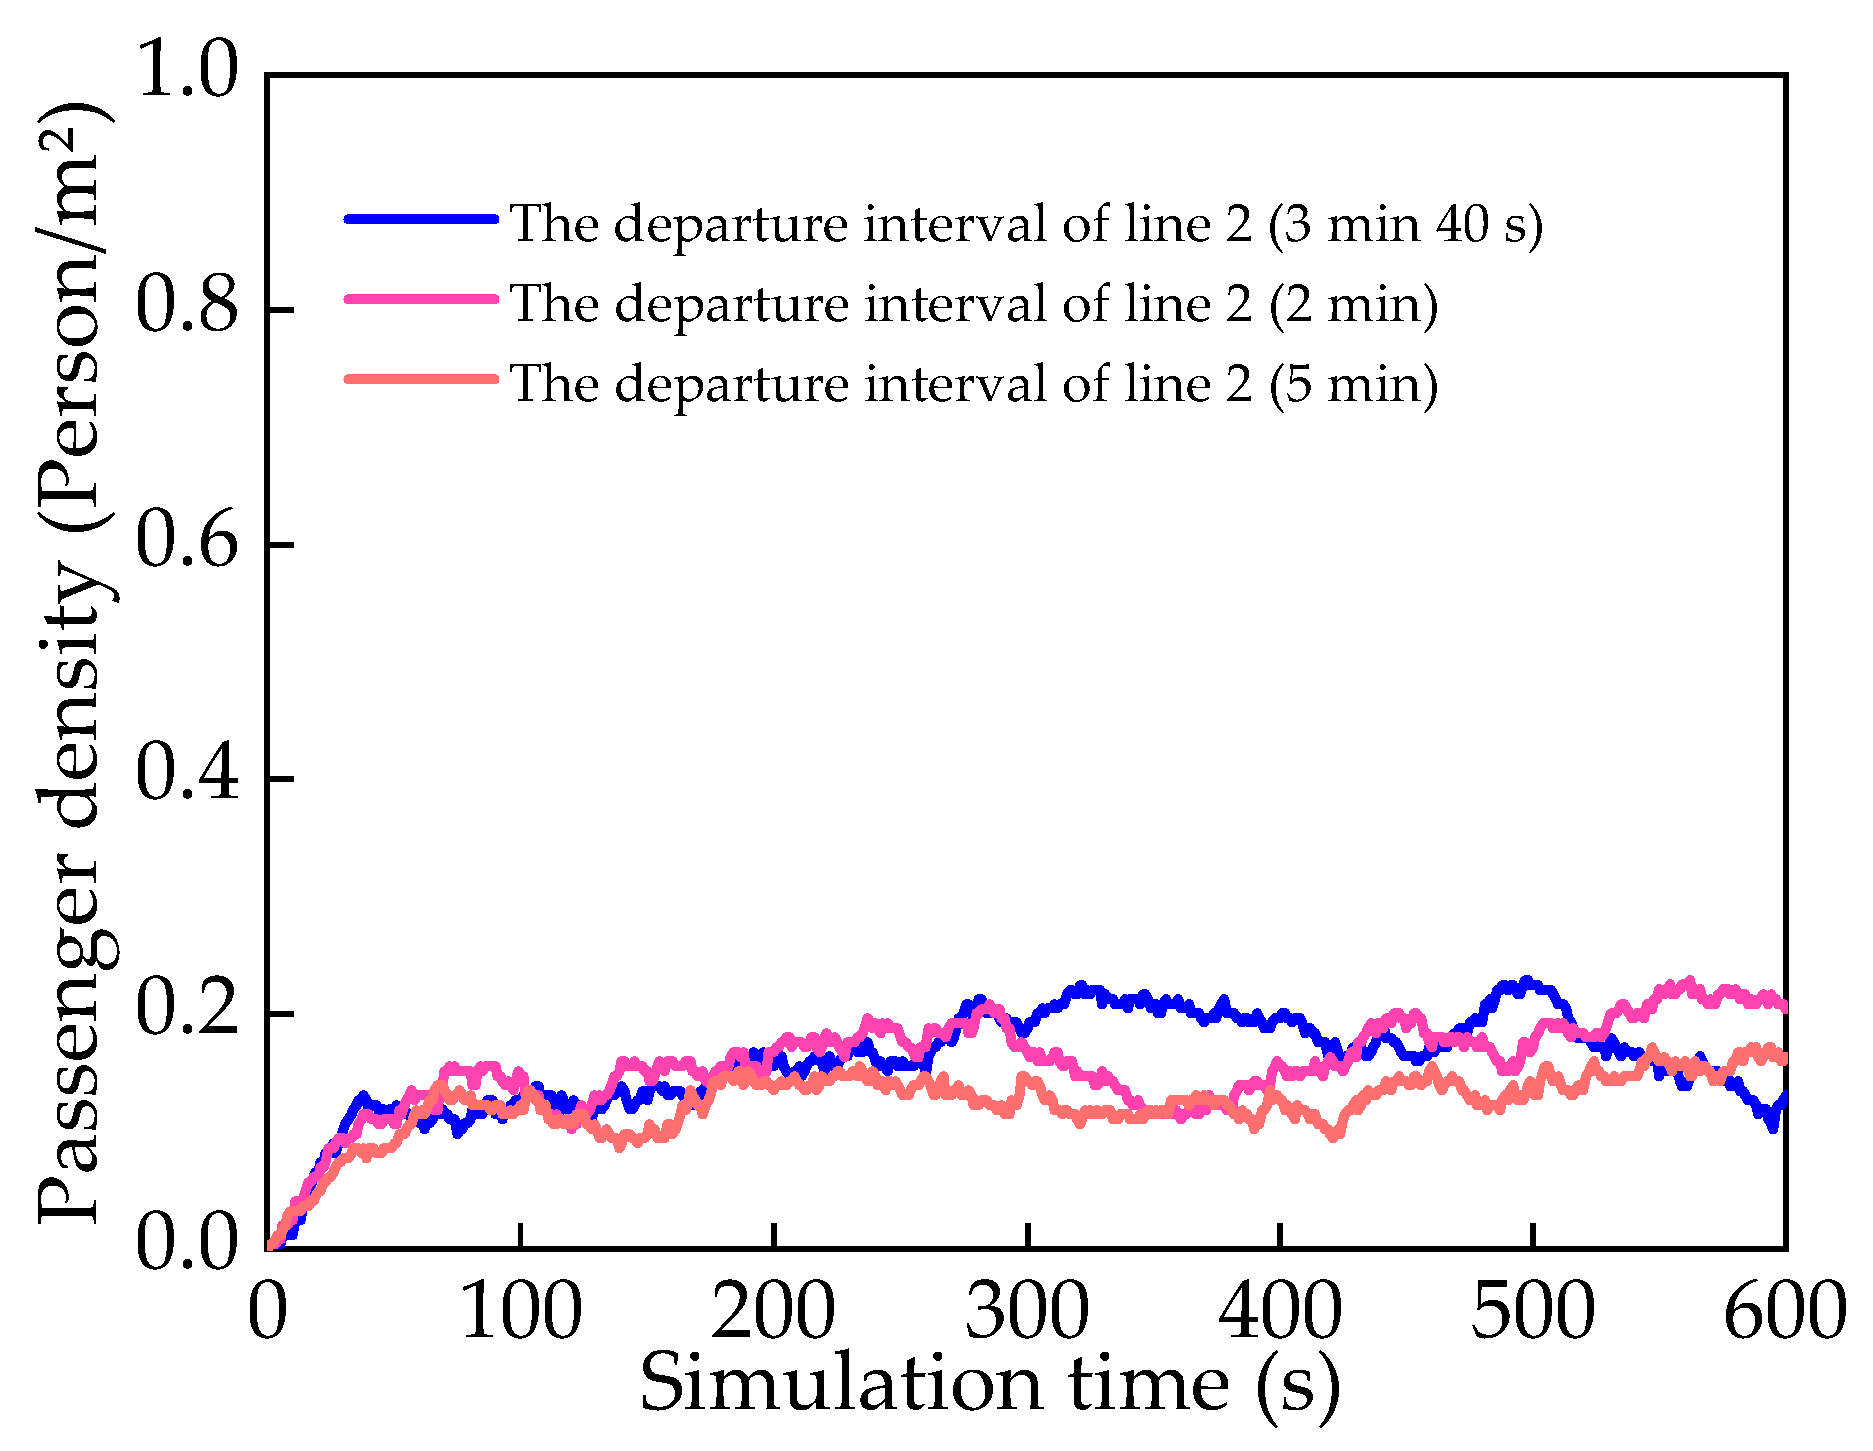
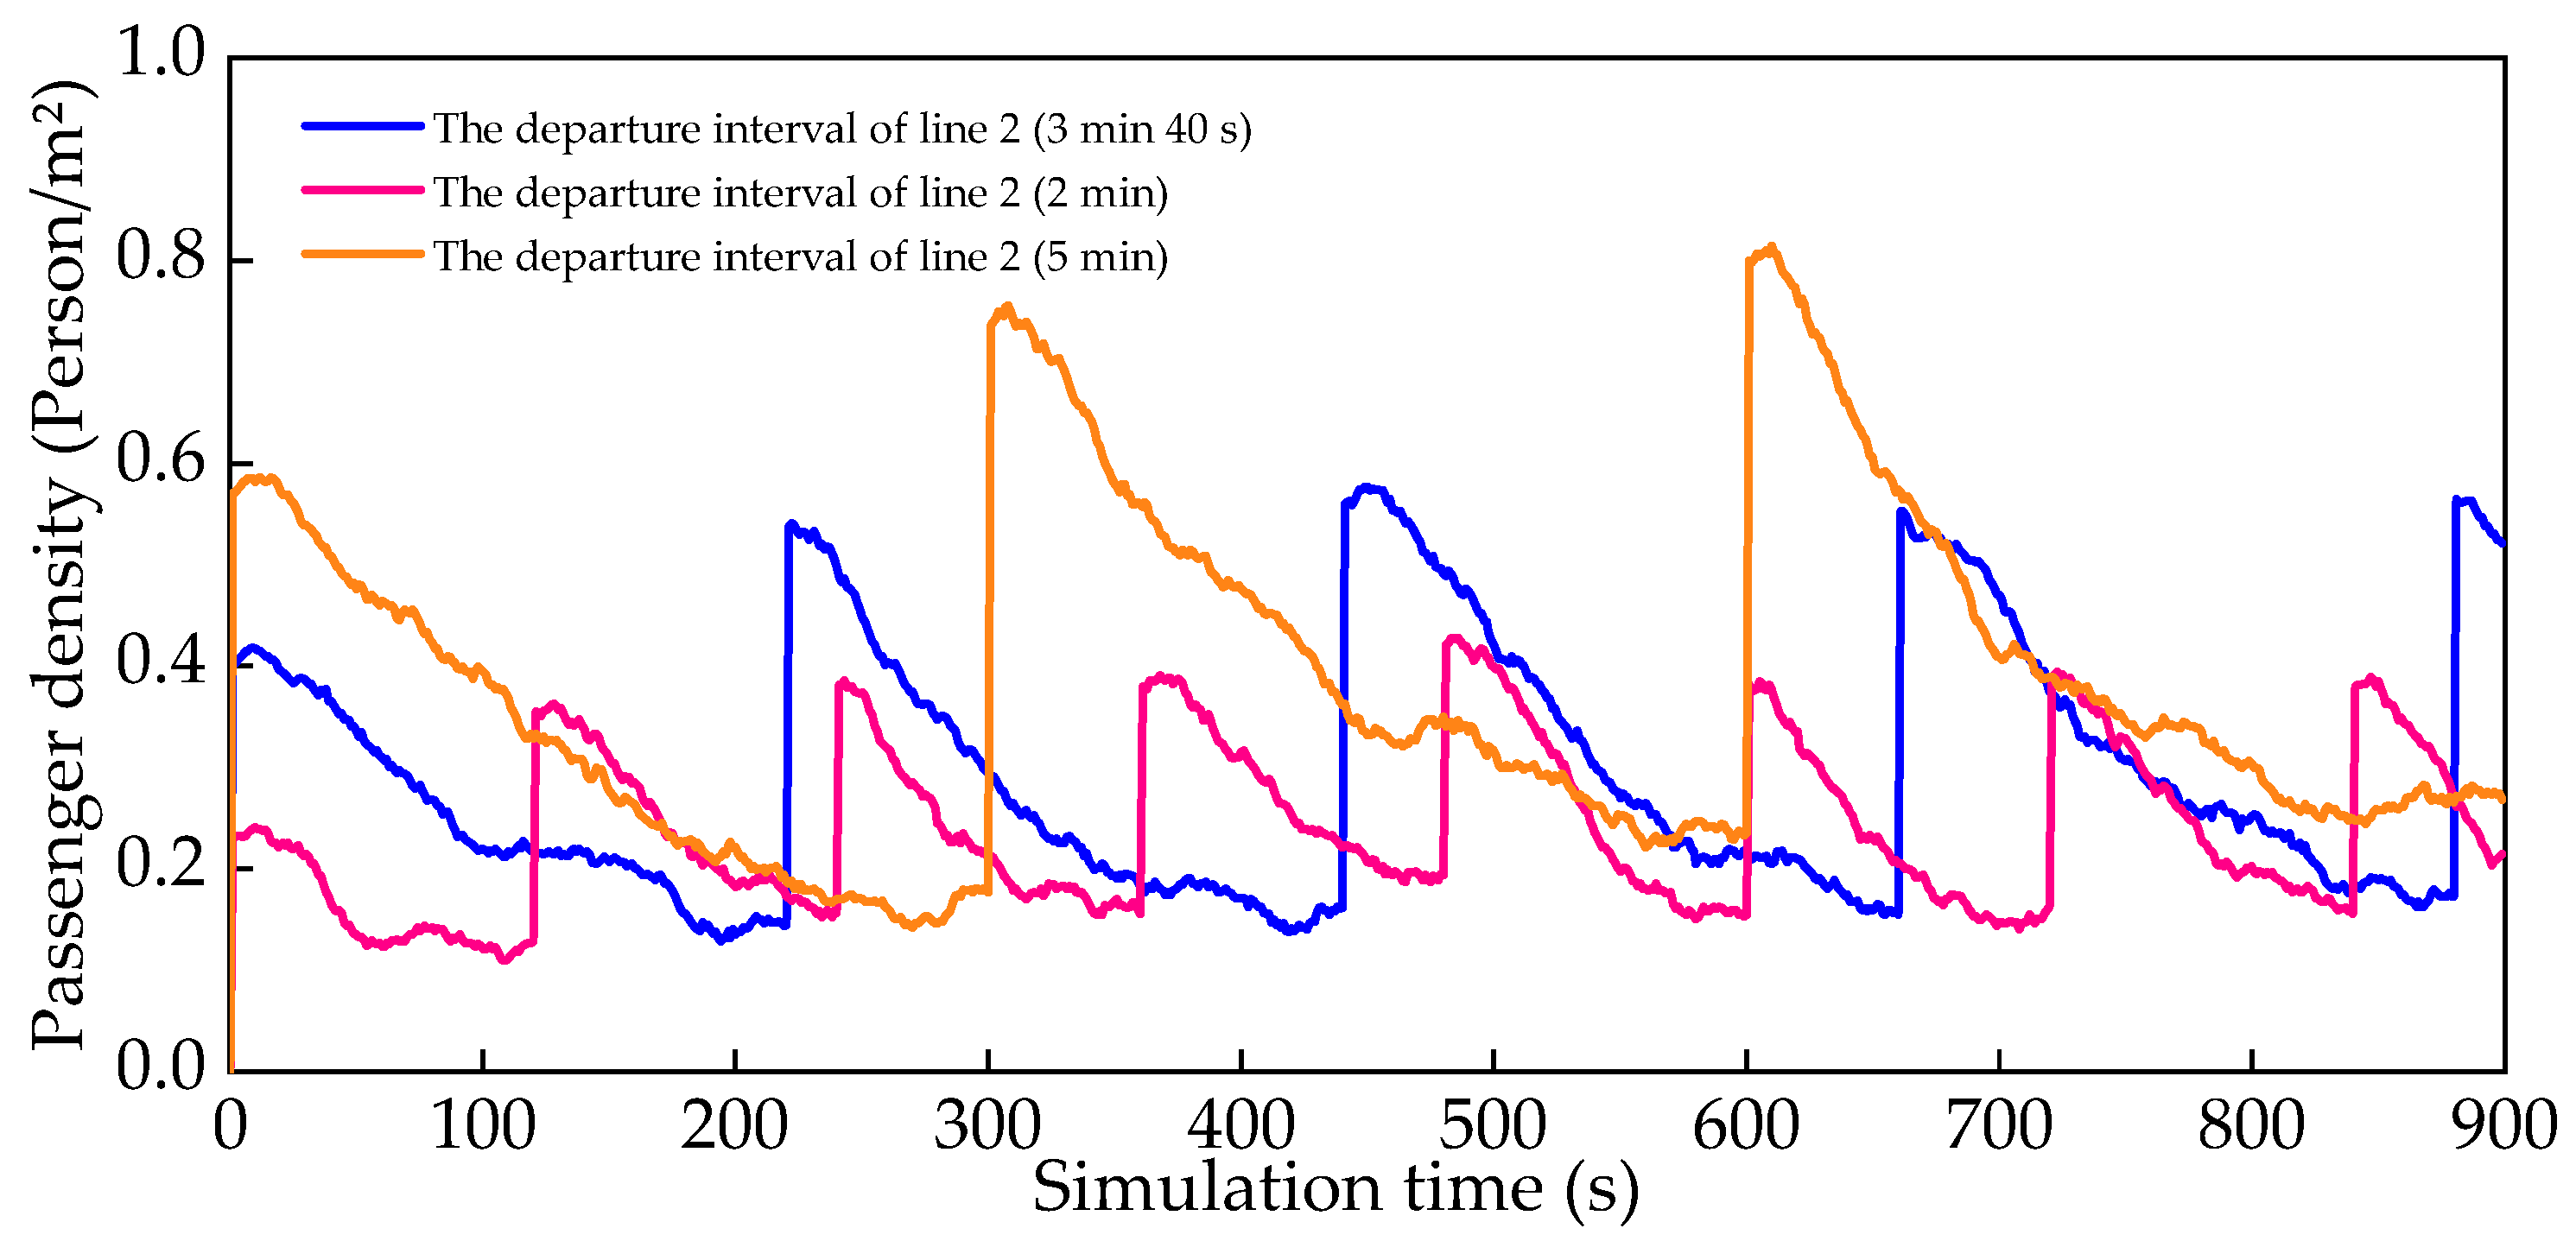
We further propose a new combined strategy by considering the departure interval of the trains. Its influence on the efficiency of the combined strategy is investigated without restricting the inflow and outflow, by adopting a travel reservation proportion of p R = 40 % , and setting the departure interval of line 2 to 3 min 40 s, 2 min, and 5 min, respectively.
For the study area, as shown in Table 8 and Figure 11, it can be observed that different departure intervals have no significant impact on the infection risk, dwell time, and passenger density in the study area. But for the internal area, as shown in Table 9 and Figure 12, adjusting the departure interval of line 2 to 2 min can effectively reduce the risk of infection, dwell time, and the passenger density in the internal area, while adjusting the departure interval of line 2 to 5 min can lead to longer passenger dwell times and a higher infection risk. In terms of practical operation, it is necessary to shorten the departure interval as much as possible to increase the operational efficiency and safety level of the entire subway station.

4. Conclusions and Limitations

4.1. Conclusions

This study investigates three distinct strategies for the passenger flow control of a metro station during the COVID-19 pandemic: flow-control fences, travel reservations, and the combined strategy. Two critical indices related to passenger infection risk and travel efficiency were analyzed and compared. The key findings of this study can be summarized as follows:
  • The flow-control fences strategy: The implementation of flow-control fences effectively reduced the risk of passenger infection. However, this method extended the average dwell time of passengers in the study area, and when the length of the flow-control fences is 47.5 m, the travel efficiency experienced a decrease of 20.15%. It is highlighted that excessively long flow-control fences will neither alleviate congestion nor reduce the infection risk.
  • The travel reservation strategy: Introducing a fast track for users with reservations within the travel reservation strategy demonstrated improved passenger travel efficiency. In this scenario, this enhancement was most notable when the length of the flow-control fences was 47.5 m, and the reservation proportion fell within the range of 30% to 60%, with 40% being the optimal proportion; travel efficiency increased by 29.05% in this case. Additionally, when the reservation proportion ranged from 30% to 70%, the risk of infection decreased, with a 40% proportion of reservations yielding the best results, reducing the infection risk by 67.12%.
  • The combined strategy: Employing a strategy that combined travel reservations and flow-control fences improved passenger travel efficiency. In this case, when the length of the flow-control fences was 47.5 m, particularly when the reservation proportion ranged from 30% to 40%, with 30% being the most effective proportion, travel efficiency improved by 15.80%. Furthermore, when the reservation proportion was within the range of 10% to 50%, the risk of passenger infection decreased, with a 30% reservation proportion demonstrating the best results, reducing the infection risk by 56.77%. When the reservation proportion in the combined strategy is between 10 and 30%, its infection risk reduction is better than that of the travel reservation strategy, but this improvement is not necessarily true for travel efficiency.
Based on these conclusions, the following recommendations are proffered to managers of Xiaozhai metro station:
  • In heavy passenger traffic scenarios, set an appropriate length of diversion fencing to improve travel efficiency. Concomitantly, perform periodic assessments of the flow-control fences’ length to ensure their alignment with the prevailing passenger flow, thereby averting superfluous congestion.
  • It is advisable to implement a travel reservation system and diligently oversee its use, guaranteeing optimal outcomes across various passenger flow scenarios.
  • In the practical operation of the station, if possible, the operational efficiency and safety level of the entire metro station can be improved by shortening the departure intervals of trains.

4.2. Limitations

4.2.1. Flow Control Strategies

The passenger flow control strategies we considered may not be applicable to all metro stations because the characteristics and passenger flow conditions of each station are different. Some metro systems may have difficulty implementing a travel reservation system because their structural layout or passenger flow situation is not suitable. And if these strategies can be implemented in other metro stations, the determination of diversion fence lengths and reservation ratios will require specific experiments.

4.2.2. Simulation Model

The simulation model we use simplifies the actual situation. Passengers in the model obey the social force model and we do not consider the changes to passenger routes caused by other reasons (security inspection, machine failures, etc.) or personal reasons (contraband, insufficient balance, etc.).

4.2.3. The Literature Data

The data from the literature is from the peak hours of the Xiaozhai metro station, and our findings naturally apply to situations with a high passenger flow. When the passenger flow is small, an increase in flow-control fences may have a counterproductive effect.
Furthermore, this study does not consider the impact of cost, public acceptance, logistical challenges, and the accessibility and affordability for different socioeconomic groups, on the implementation of these flow control strategies, which would be an interesting issue worthy of future research.

Author Contributions

Conceptualization, S.X., H.Z. and N.S.; methodology, S.X. and H.Z.; software, S.X. and H.Z.; validation, S.X. and H.Z.; formal analysis, S.X., N.S. and H.Z.; investigation, S.X. and H.Z.; data curation, S.X. and H.Z.; writing—original draft preparation, S.X. and H.Z.; writing—review and editing, S.X., H.Z. and N.S. All authors have read and agreed to the published version of the manuscript.

Funding

This research received no external funding.

Data Availability Statement

Data are contained within the article.

Conflicts of Interest

The authors declare no conflict of interest.

References

  1. Xiang, W.; Chen, L.; Yan, X.; Wang, B.; Liu, X. The impact of traffic control measures on the spread of COVID-19 within urban agglomerations based on a modified epidemic model. Cities 2023, 135, 104238. [Google Scholar] [CrossRef] [PubMed]
  2. Wang, Y.; Shi, L.; Que, J.; Lu, Q.; Liu, L.; Lu, Z.; Xu, Y.; Liu, J.; Sun, Y.; Meng, S.; et al. The impact of quarantine on mental health status among general population in China during the COVID-19 pandemic. Mol. Psychiatry 2021, 26, 4813–4822. [Google Scholar] [CrossRef] [PubMed]
  3. Zhang, X.; Luo, W.; Zhu, J. Top-Down and Bottom-Up Lockdown: Evidence from COVID-19 Prevention and Control in China. J. Chin. Polit. Sci. 2021, 26, 189–211. [Google Scholar] [CrossRef]
  4. Gao, Y.; Chen, J.; Ji, K.; Liu, K.; Liu, H.; Wang, L. Effects of Individual and Built Environmental Features on Commuting Mode Shifts before and after the COVID-19 Outbreak in Guangzhou, China. J. Adv. Transp. 2023, 2023, e8955504. [Google Scholar] [CrossRef]
  5. Yin, Y.; Li, D.; Zhang, S.; Wu, L. How Does Railway Respond to the Spread of COVID-19? Countermeasure Analysis and Evaluation Around the World. Urban Rail Transit 2021, 7, 29–57. [Google Scholar] [CrossRef]
  6. Huang, J.; Zhang, T.; Wei, R. Urban Railway Transit Timetable Optimisation Based on Passenger-and-Trains Matching—A Case Study of Beijing Metro Line. Promet-Traffic Transp. 2021, 33, 671–687. [Google Scholar] [CrossRef]
  7. Liao, X.; Chen, W.; Guo, X.; Zhong, J.; Hu, X. Crowd Management Through Optimal Layout of Fences: An Ant Colony Approach Based on Crowd Simulation. IEEE Trans. Intell. Transp. Syst. 2023, 24, 9137–9149. [Google Scholar] [CrossRef]
  8. Zhong, J.; Cheng, T.; Liu, W.L.; Yang, P.; Lin, Y.; Zhang, J. An Evolutionary Guardrail Layout Design Framework for Crowd Control in Subway Stations. IEEE Trans. Comput. Soc. Syst. 2023, 10, 297–310. [Google Scholar] [CrossRef]
  9. Zhuang, Y.; Zhou, X.D.; Ni, Y.; Yang, L. Passengers’ behavioral intentions towards congestion: Observational study of the entry restrictions at traffic bottleneck. KSCE J. Civ. Eng. 2017, 21, 2393–2402. [Google Scholar] [CrossRef]
  10. Chen, Q.; Bai, Y.; Zheng, N. Simulation and Optimization of Pedestrian Regular Evacuation in Comprehensive Rail Transit Hub—A Case Study in Beijing. Promet-Traffic Transp. 2020, 32, 383–397. [Google Scholar] [CrossRef]
  11. Li, D.; Han, B. Behavioral effect on pedestrian evacuation simulation using cellular automata. Saf. Sci. 2015, 80, 41–55. [Google Scholar] [CrossRef]
  12. Minegishi, Y. Tracer observation of egress and way-home crowd behavior at stadiums: From the perspective of crowd control in emergency evacuations. Jpn. Archit. Rev. 2023, 6, e12358. [Google Scholar] [CrossRef]
  13. Zhou, J.; Ma, C.; Dong, S.; Zhang, M. Unconventional prevention strategies for urban public transport in the COVID-19 epidemic: Taking Ningbo City as a case study. China J. Highw. Transp. 2020, 33, 1–10. [Google Scholar]
  14. Wang, Q.; Guo, J.; Ge, Y.; Liang, C.; Xian, K.; Diao, J.; Zhang, L.; Ma, Y. Practice and thoughts on reservation travel in Beijing Metro Stations. Urban Transp. China 2021, 19, 89–94. [Google Scholar]
  15. Hörcher, D.; Singh, R.; Graham, D.J. Social distancing in public transport: Mobilising new technologies for demand management under the Covid-19 crisis. Transportation 2022, 49, 735–764. [Google Scholar] [CrossRef] [PubMed]
  16. Yin, Y.; Li, D.; Han, Z.; Dong, X.; Liu, H. Maximizing network utility while considering proportional fairness for rail transit systems: Jointly optimizing passenger allocation and vehicle schedules. Transp. Res. Part. C Emerg. Technol. 2022, 143, 103812. [Google Scholar] [CrossRef]
  17. Bailey, N.T. A study of queues and appointment systems in hospital out-patient departments, with special reference to waiting-times. J. R. Stat. Soc. Ser. B (Methodol.) 1952, 14, 185–199. [Google Scholar] [CrossRef]
  18. Edara, P.; Teodorović, D. Model of an advance-booking system for highway trips. Transp. Res. Part. C Emerg. Technol. 2008, 16, 36–53. [Google Scholar] [CrossRef]
  19. Virginus, U.N.; Madu, N.O.; Okafor, L.I.; Loveline, A.C.; Ugwuanyi, P.N.; Tobechukwu, N.P.; Darlington, A.C. A Bus Reservation System On Smartphone. Bus. Manag. 2021, 25, 240–250. [Google Scholar] [CrossRef]
  20. Yin, Y.; Liu, H.; Zhang, S.; Yang, Y.; Li, D. Joint optimization of modular vehicle schedule and fair passenger flow control under heterogeneous passenger demand in a rail transit system. Comput. Ind. Eng. 2022, 173, 108749. [Google Scholar] [CrossRef]
  21. SOHU. Thoughts on Governing Urban Traffic Congestion by Trip Reservation Management. Available online: https://www.sohu.com/a/309167179_601552 (accessed on 20 November 2023).
  22. Mei, Z.; Feng, C.; Ding, W.; Zhang, L.; Wang, D. Better lucky than rich? Comparative analysis of parking reservation and parking charge. Transp. Policy 2019, 75, 47–56. [Google Scholar] [CrossRef]
  23. Xu, D.; Sun, H. Research on Parking Service Optimization Based on Permit Reservation and Allocation. J. Adv. Transp. 2022, 2022, e8364988. [Google Scholar] [CrossRef]
  24. How, C.C.; Farhana Kamsin, I.; Zainal, N.K.; Aysa Abdul Halim Sithiq, H.; Abd Rahman, N.A. Smart Parking Reservation Mobile Application. In Proceedings of the 2022 IEEE International Conference on Distributed Computing and Electrical Circuits and Electronics (ICDCECE), Ballari, India, 23–24 April 2022; pp. 1–5. [Google Scholar]
  25. Wang, J.; You, L.; Hang, J.; Zhao, J. Pre-trip reservation enabled route guidance and signal control cooperative method for improving network throughput. Phys. A Stat. Mech. Its Appl. 2023, 609, 128405. [Google Scholar] [CrossRef]
  26. Koolstra, K. Potential Benefits of a Freeway Slot-Reservation System: Queuing Costs versus Scheduling Costs. In Urban. Transport Systems Proceedings from The 2nd Kfb Research Conference in Lund, Sweden, 7–8 June, 1999 (Bulletin 187); 2000. Available online: https://trid.trb.org/view/715509 (accessed on 25 April 2023).
  27. Liu, K.; Chan, E.; Lee, V.; Kapitanova, K.; Son, S.H. Design and evaluation of token-based reservation for a roadway system. Transp. Res. Part. C Emerg. Technol. 2013, 26, 184–202. [Google Scholar] [CrossRef]
  28. Sadreddini, Z.; Guner, S.; Erdinc, O. Design of a Decision-Based Multicriteria Reservation System for the EV Parking Lot. IEEE Trans. Transp. Electrif. 2021, 7, 2429–2438. [Google Scholar] [CrossRef]
  29. Zhou, X.; Xi, J.; Guan, Z.; Ji, X. Dispatching Design for Customized Bus of Hybrid Vehicles Based on Reservation Data. J. Adv. Transp. 2021, 2021, e8868291. [Google Scholar] [CrossRef]
  30. Sun, L.; Song, R. Improving Efficiency in Congested Traffic Networks: Pareto-Improving Reservations through Agent-Based Timetabling. Sustainability 2022, 14, 2211. [Google Scholar] [CrossRef]
  31. Patel, R.; Levin, M.W.; Boyles, S.D. Effects of Autonomous Vehicle Behavior on Arterial and Freeway Networks. Transp. Res. Rec. 2016, 2561, 9–17. [Google Scholar] [CrossRef]
  32. Takemura, T.; Iwase, K.; Zhang, J.; Abe, S.; Ohkubo, T.; Hayashi, H. A Public Transportation Reservation System for Congestion Relief with E-tickets. In Proceedings of the 2022 12th International Congress on Advanced Applied Informatics (IIAI-AAI), Kanazawa City, Japan, 2–7 July 2022; pp. 397–402. [Google Scholar]
  33. Su, Y.J.; Zhou, L.L.; Wei, Q.B. CUIA Traffic management under public health emergencies: A case study of Guangzhou. Urban Transp. China 2020, 18, 20–27. [Google Scholar]
  34. Shi, J.; Qin, T.; Yang, L.; Xiao, X.; Guo, J.; Shen, Y.; Zhou, H. Flexible train capacity allocation for an overcrowded metro line: A new passenger flow control approach. Transp. Res. Part. C Emerg. Technol. 2022, 140, 103676. [Google Scholar] [CrossRef]
  35. Patel, R.; Venkatraman, P.; Boyles, S.D. Optimal Placement of Reservation-Based Intersections in Urban Networks. Transp. Res. Rec. 2019, 2673, 781–792. [Google Scholar] [CrossRef]
  36. Mei, Z.; Wei, D.; Ding, W.; Wang, D.; Ma, D. Multi-agent simulation for multi-mode travel policy to improve park and ride efficiency. Comput. Ind. Eng. 2023, 185, 109660. [Google Scholar] [CrossRef]
  37. Qin, H.; Xu, N.; Zhang, Y.; Pang, Q.; Lu, Z. Research on Parking Recommendation Methods Considering Travelers’ Decision Behaviors and Psychological Characteristics. Sustainability 2023, 15, 6808. [Google Scholar] [CrossRef]
  38. Zhang, L.; Li, M.; Wang, Y. Research on Design Optimization of Subway Station Transfer Entrance Based on AnyLogic. Procedia Comput. Sci. 2022, 208, 310–318. [Google Scholar] [CrossRef]
  39. Lu, Y.; Ou, D.; Zhou, Z.; Li, H.; Deng, Y.; Deng, Y.; Zhang, Z. Simulation analysis of passengers’ rescheduling strategies in metro station under COVID-19. Tunn. Undergr. Space Technol. 2023, 134, 105023. [Google Scholar] [CrossRef]
  40. Guo, K.; Zhang, L.; Wu, M. Simulation-based multi-objective optimization towards proactive evacuation planning at metro stations. Eng. Appl. Artif. Intell. 2023, 120, 105858. [Google Scholar] [CrossRef]
  41. Goscé, L.; Johansson, A. Analysing the link between public transport use and airborne transmission: Mobility and contagion in the London underground. Environ. Health 2018, 17, 84. [Google Scholar] [CrossRef]
  42. Sui, X.; Chen, S.; Han, B.; Yu, S. Evaluation of the Thermal Environment of Xi’an Subway Stations in Summer and Determination of the Indoor Air Design Temperature for Air-Conditioning. Sustainability 2023, 15, 6111. [Google Scholar] [CrossRef]
  43. Zhou, H.; Wang, Y.; Huscroft, J.R.; Bai, K. Impacts of COVID-19 and anti-pandemic policies on urban transport—An empirical study in China. Transp. Policy 2021, 110, 135–149. [Google Scholar] [CrossRef]
  44. Wang, J.; Zhang, N. Simulation and Optimization of the Passenger Streamline of Xiao-Zhai Subway Interchange Station in Xi’an. In Proceedings of the 2018 World Transport Convention, Beijing, China, 18–21 June 2018. [Google Scholar]
  45. Helbing, D.; Farkas, I.; Vicsek, T. Simulating dynamical features of escape panic. Nature 2000, 407, 487–490. [Google Scholar] [CrossRef]
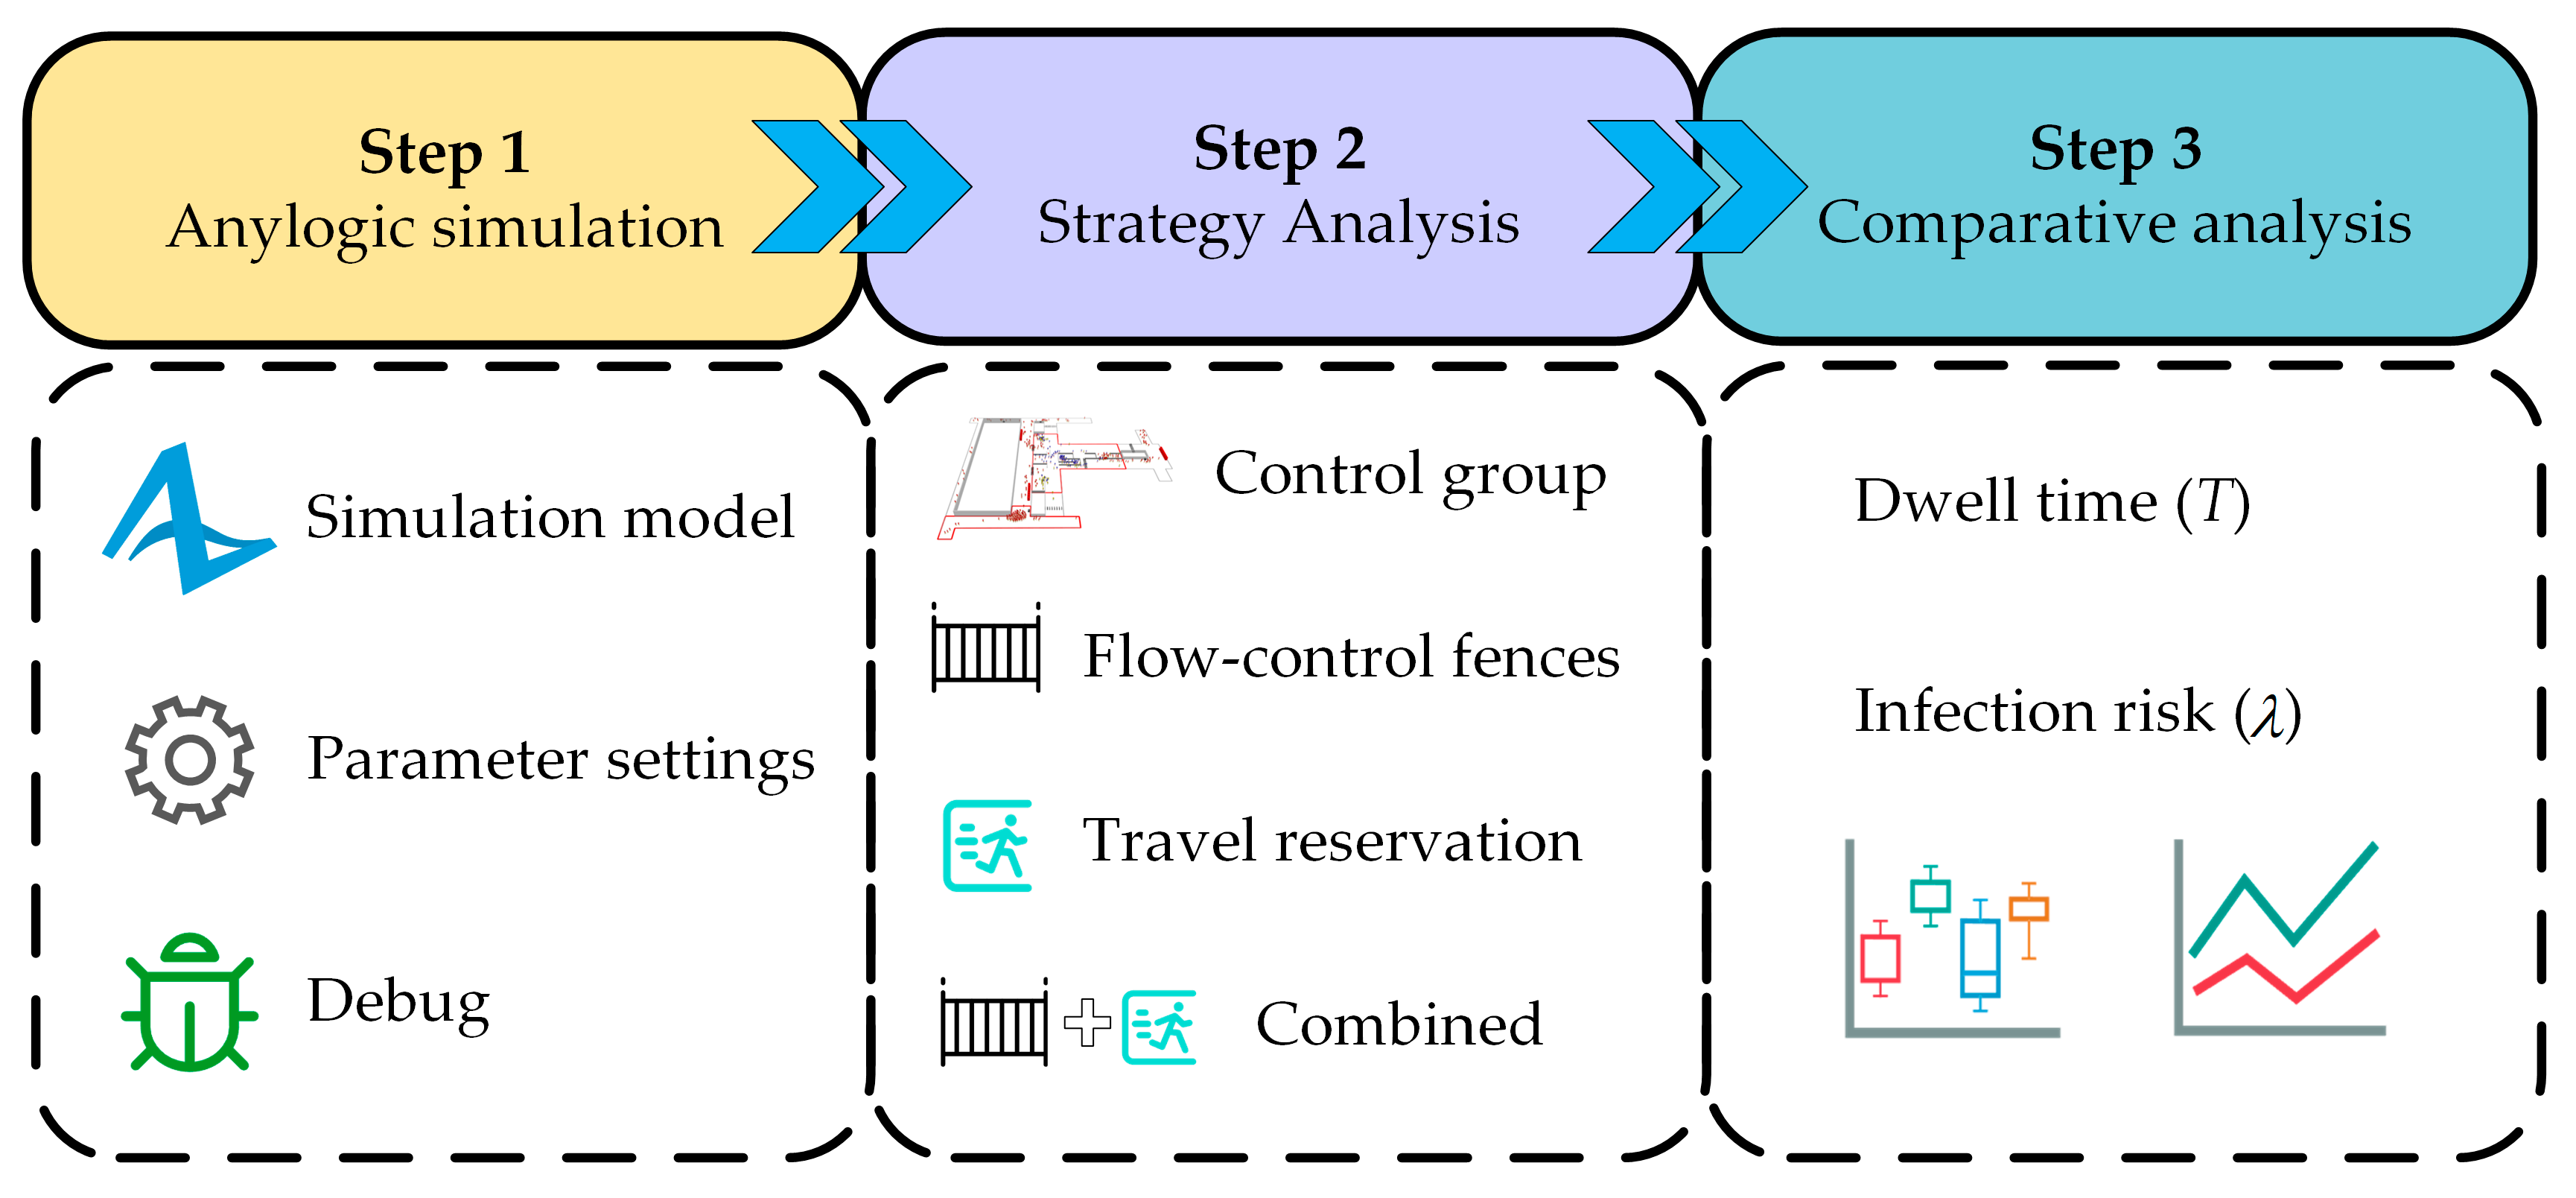
Figure 1. Overall roadmap of the proposed methodology.
Systems 11 00555 g001
Figure 2. Xiaozhai metro station layout. (a) Plane layout; (b) 3D model.
Systems 11 00555 g002
Figure 3. Schematic diagram of different flow-control strategies (B and C are two entrances).
Systems 11 00555 g003
Figure 4. Passenger density variation curves under different passenger flow control strategies. (a) Passenger density variation curve under the travel reservation strategy; (b) passenger density variation curve under the combined strategy.
Systems 11 00555 g004
Figure 5. Passenger dwell time under different passenger flow control strategies.
Systems 11 00555 g005
Figure 6. Infection risk values for different passenger flow control strategies.
Systems 11 00555 g006
Figure 7. Cumulative frequency of dwell time.
Systems 11 00555 g007
Figure 8. Passenger density in the internal area under different passenger flow control strategies.
Systems 11 00555 g008
Figure 9. Infection risk value for different lengths of the flow-control fences C.
Systems 11 00555 g009
Figure 10. Dwell time for different lengths of the flow-control fences C.
Systems 11 00555 g010
Figure 11. Passenger density in the study area under different departure intervals of line 2.
Systems 11 00555 g011
Figure 12. Passenger density in internal area under different departure intervals of line 2.
Systems 11 00555 g012
Table 1. Parameter definition.
ParameterDefinition
λ ξ Infection risk value at time ξ .
C A constant greater than 0.
T ξ Total time spent passing through the study area at moment ξ by passengers.
ρ ξ Density of passengers in the study area at the moment ξ : number of people per unit area.
N ξ Total number of people passing through the study area at moment ξ .
Δ t Statistical spacing.
Table 2. The inbound passenger flow of Xiaozhai station.
Entrance/ExitInbound Cross-Sectional Passenger FlowInbound Escalator Passenger Flow
NamePassenger Flow/(Person*h)NamePassenger Flow/(Person*h)
AAD cross-section39202-12113
D2-02416
BBC cross-section2700
C2-21946
EEF1 cross-section11083-00
FEF2 cross-section3843-1952
3-2829
Table 3. The outbound passenger flow of Xiaozhai station.
Line 2 Outbound Passenger FlowLine 3 Outbound Passenger FlowStation Concourse-Level Interchange Passenger Flow
2-1 to
BC exit
2-1 to
EF exit
2-2 to
AD Exit
2-2 to
EF Exit
3-0 to
AD
Exit
3-0 to
BC
Exit
3-1 to
AD
Exit
3-1 to
BC
Exit
3-2 to
AD
Exit
3-2 to
BC
Exit
Line 2 interchange with Line 3Line 3 interchange with Line 2
2-12-23-03-13-2
746102816991440443563916790155157558822041974
Table 4. Parameter settings.
Parameter TypeParameterParameter Settings
Environmental
settings
Security inspection timeuniform (2.0, 3.0)
Ticket purchase timeuniform (2.0, 3.0)
Ticket checking timeexponential (3.9)
The length of the flow-control fences B (Passenger detour distance at entrance B)11.2 m
The length of the flow-control fences C (Passenger detour distance at entrance C)47.5 m
Fast track width 0.8 m
Departure interval of line 23 min 40 s
Departure interval of line 34 min 40 s
Pedestrian settingsDesired speednormal (0.17, 1.14) m/s
Initial speeduniform (0.5, 0.7) m/s
Diameteruniform (0.4, 0.5) m
Table 5. Comparison of simulation results for different strategies.
StrategyEvaluating IndicatorReduction Rate
Infection Risk Value (/)Average Dwell Time (s)Infection Risk Value (%)Average Dwell Time (%)
Control group28.5981.64
Flow-control fences24.3698.0914.80%−20.15%
p R 10%41.96102.90−46.76%−26.04%
20%32.7489.00−14.52%−9.02%
30%22.4176.5521.62%6.23%
40%9.4057.9267.12%29.05%
50%10.4859.6863.34%26.90%
60%19.6675.5431.23%7.47%
70%21.5384.5424.69%−3.55%
80%61.29118.73−114.38%−45.43%
90%67.42128.86−135.82%−57.84%
p R 10%21.8896.3123.47%−17.97%
20%19.1494.8633.05%−16.19%
30%12.3668.7456.77%15.80%
40%14.7477.3448.44%5.27%
50%24.2592.5715.18%−13.39%
60%29.27100.97−2.38%−23.68%
70%31.22104.73−9.20%−28.28%
80%65.25131.92−128.23%−61.59%
90%66.00135.23−130.85%−65.64%
Notes: Bold indicates the best results.
Table 6. The influence of flow-control fences’ length on various parameters.
StrategyFlow-Control Fences 26.2 m in LengthFlow-Control Fences 75.08 m in Length
Reduction Rate (%)Reduction Rate (%)
Infection Risk ValueAverage Dwell TimeInfection Risk ValueAverage Dwell Time
Flow-control fences41.17%5.60%−38.51%−48.49%
Combined strategy with a travel reservation proportion of10%45.68%9.62%−35.99%−41.28%
20%47.81%17.37%−11.68%−33.82%
30%63.97%20.98%18.85%−16.05%
40%58.83%19.52%22.60%−10.86%
50%29.80%2.41%11.40%−14.74%
60%20.04%−0.62%−16.72%−25.59%
70%6.79%−10.28%−18.85%−28.12%
80%−122.70%−44.89%−153.48%−62.33%
90%−130.88%−52.56%−144.53%−59.11%
Notes: Bold indicates the best results.
Table 7. Study area simulation results under different strategies.
StrategyEvaluating IndicatorReduction Rate
Infection Risk Value (/)Average Dwell Time (s)Infection Risk Value (%)Average Dwell Time (%)
Strategy 13.9053.47
Strategy 29.4758.68−142.82%−9.74%
Strategy 31.8433.8152.82%36.77%
Notes: Bold indicates the best results.
Table 8. Study area simulation results under different departure interval of line 2.
Departure IntervalEvaluating Indicator
Infection Risk Value (/)Average Dwell Time (s)
3 min 40 s9.4057.92
2 min9.4758.68
5 min9.4657.51
Table 9. Internal area simulation results under different departure intervals of line 2.
Departure IntervalEvaluating IndicatorReduction Rate
Infection Risk Value (/)Average Dwell Time (s)Infection Risk Value (%)Average Dwell Time (%)
3 min 40 s18.88 66.57
2 min12.69 53.70 32.77%19.34%
5 min27.19 85.00 −44.03%−27.68%
Disclaimer/Publisher’s Note: The statements, opinions and data contained in all publications are solely those of the individual author(s) and contributor(s) and not of MDPI and/or the editor(s). MDPI and/or the editor(s) disclaim responsibility for any injury to people or property resulting from any ideas, methods, instructions or products referred to in the content.