Article

A New Decision-Making Strategy for Techno-Economic Assessment of Generation and Transmission Expansion Planning for Modern Power Systems

by
Mohamed M. Refaat
1,2,*,
Shady H. E. Abdel Aleem
3,
Yousry Atia
1,
Essam El Din Aboul Zahab
2 and
Mahmoud M. Sayed
2
1
Photovoltaic Cells Department, Electronics Research Institute, Cairo 11843, Egypt
2
Electrical Power Department, Faculty of Engineering, Cairo University, Giza 12613, Egypt
3
Electrical Engineering Department, Valley High Institute of Engineering and Technology, Science Valley Academy, Qalubia 44971, Egypt
*
Author to whom correspondence should be addressed.
Systems 2023, 11(1), 23; https://doi.org/10.3390/systems11010023
Submission received: 1 December 2022 / Revised: 29 December 2022 / Accepted: 31 December 2022 / Published: 4 January 2023

Abstract

:
Planning for the intensive use of renewable energy sources (RESs) has attracted wide attention to limit global warming and meet future load growth. Existing studies have shown that installing projects such as transmission lines, energy storage systems (ESSs), fault current limiters, and FACTs facilitate the integration of RESs into power systems. Different generation and transmission network expansion planning models have been developed in the literature; however, a planning model that manages multiple types of projects while maximizing the hosting capacity (HC) is not widely presented. In this paper, a novel planning framework is proposed to enhance and control the HC level of RESs by comparing various kinds of renewables, ESSs, fault current limiters, and FACTs to choose the right one, economically and technically. The proposed problem is formulated as a challenging mixed-integer non-linear optimization problem. To solve it, a solution methodology based on a developed decision-making approach and an improved meta-heuristic algorithm is developed. The decision-making approach aims to keep the number of decision variables as fixed as possible, regardless of the number of projects planned. While an improved war strategy optimizer that relies on the Runge-Kutta learning strategy is applied to strengthen the global search ability. The proposed decision-making approach depends primarily on grouping candidate projects that directly impact the same system state into four separate planning schemes. The first scheme relies on the impedance of devices installed in any path to optimally identify the location and size of the new circuits and the series-type FACTs. The second scheme is based on optimally determining the suitable types of ESSs. On the other hand, the third scheme optimizes the reactive power dispatched from the ESSs and shunt-type FACTs simultaneously. The fourth scheme is concerned with regulating the power dispatched from different types of RESs. All of the simulations, which were carried out on the Garver network and the 118-bus system, demonstrated the ability of the investigated model to select the appropriate projects precisely. Further, the results proved the robustness and effectiveness of the proposed method in obtaining high-quality solutions in fewer runs compared to the conventional method.

1. Introduction

Recently, countries have moved toward more sustainable power systems, and the wide use of renewable energy sources (RESs) is crucial for meeting the future growth of electrical demands and mitigating climate change [1,2]. By 2050, the RESs will likely shape 27% of global energy consumption [3]. The unplanned penetration of RESs may threaten the power systems’ resilience and security. The renewables have stochastic and unpredictable behavior. The networks with renewables are more prone to complete blackouts [4,5]. Through generation and transmission expansion planning (G&TNEP), the hosting capacity (HC) levels of RESs can safely increase in modern power systems.
The G&TNEP are conventionally applied to identify the location and size of power technologies, such as generation units, transmission lines (TL), and energy storage systems (ESSs), in order to optimally expand networks and meet future consumption [6,7]. G&TNEP is a challenging computational problem and obtaining its global solution is complicated. The G&TNEP problem is commonly formulated as a non-linear, non-convex optimization problem with either a single objective function or multi-objective functions and a set of constraints. The objective functions are designed to minimize the investment and operating costs of projects. The constraints comprise the economic and technical requirements set by the system operator and planner [8,9,10].
The technical studies required for G&TNEP, which are the main concern of this work, can be classified into power flow analysis, the generation units’ capability analysis, short-circuit current (SC) analysis, and transient stability analysis, as visualized in Figure 1. The DC and AC optimal power flow-based models are commonly applied to perform the load flow studies and generation units’ capability analyses. The AC models are more accurate and flexible than the DC models. It allows for incorporating many technologies’ models into the G&TNEP model [8,9,10].
Transient and dynamic stability analysis covers the studies required to guarantee system voltage and frequency stability after contingencies [11,12,13]. On the other hand, the short-circuit current analysis intends to study the impact of the presence of new transmission lines and generation stations on the SC levels. Adding a new line or generation unit to a network may increase the SC. It must be ascertained that this increase is within the permitted limits. In the literature, some studies have embedded the short-circuit current constraints (SCC) into the planning model and depended on the placements of the new transmission lines and generating units in order to limit the SC [14]. Other studies have relied on fault current limiters (FCLs) and the integration of the SCC into the model to decrease the SC [15].
To meet the technical requirements, candidate generation units and transmission lines may not be sufficient. Moreover, they are sometimes not economically feasible compared to other facilities such as ESSs, static VAR compensators (SVCs), thyristor-controlled series compensators (TCSCs), and reactive compensators. Most of the current studies have been directed at integrating the planning models of many technologies into G&TNEP [8,10]. FACTSs are commonly used in power systems to increase the transmission and loading capability and to compensate for the reactive power. FACTSs, whether they are series, shunt, or shunt-series devices, according to their connection to power systems, have shown a significant improvement in the operation of power systems and its planning costs [16].
ESS is an evolving technology-based solution to deal with many challenges facing power grids, especially in the presence of renewable energy sources. The existing studies have shown that using ESSs in addition to TL and distributed generators decreased the power system’s vulnerability more effectively than in the case where TL and RESs were the only options. Generally, the ESSs, considering their nominal power and energy, can be classified into long-, medium-, and short-term ESSs [17]. Pumped hydroelectric storage (PHS) and above-ground and underground compressed air energy storage systems (UCAES and ACAES) are long-term types. The medium-term types are vanadium redox batteries (VR), zinc-bromine batteries (ZnBr), lithium-ion batteries (Li-ion), lead-acid batteries (LA), sodium-sulfur batteries (NaS), nickel-cadmium batteries (Ni-Cd), and hydrogen-based energy storage (HES). Short-term technologies include flywheel energy storage (FWES), superconducting magnetic energy storage (SMES), and super-capacitors (SCs). Long-term ESSs have an efficiency not exceeding 90%. In addition, their rated power can surpass 50 MW, and their lifetime is no less than 20 years and can reach 60 years [17]. Long-term technologies have higher rated power and capacity than medium- and short-term technologies, which lead to a longer discharge time. The medium-term type commonly has high power and energy densities compared to the long-term ESSs. This type’s discharge time almost ranges from seconds to hours. The medium-term ESSs are more appropriate for applications with a lifetime of fewer than 20 years. Short-term technologies, such as FWES, SMES, and SCs, are characterized by a fast time of response, reaching milliseconds. In addition, they have the highest power density compared to other types. Although short-term ESSs have high efficiencies compared to most of the other ESS types, their usage is limited to applications that require a fast response time, such as mitigating the grid’s frequency fluctuation [17]. The SMES and SCs are featured with an efficiency of 97%, while the FWES’s efficiency can reach 95% [17].
The G&TNEP problem becomes complex if several technologies’ planning models are included. The number of decision-making variables increases, and the search space is wider [9]. These have adverse impacts on the efficiency of the optimization techniques. Efforts are still required to introduce new methods of finding optimal or high-quality solutions. Mathematical and meta-heuristic-based methods are commonly employed to solve the G&TNEP problem. Mathematical methods efficiently solve simple and linear optimization problems [9,10]. Many research papers have employed a linearization approach to simplify and deal with non-linear problems. However, the quality of the obtained solutions mainly depends on the efficiency of the linearization technique applied [18,19,20].
On the other hand, meta-heuristics are preferred in solving complex non-linear G&TNEP problems [21,22]. They are efficient in handling non-linear equations. It is easy to apply the algorithm directly. Although these methods avoid errors resulting from the linearization process, the optimal solution cannot be ensured in a single run [10,23]. Meta-heuristics should be executed several times to reach optimal or high-quality solutions. Another obstacle to using meta-heuristics is that the algorithm parameters selected for a specific problem may not be suitable for other problems [24,25,26]. Many studies have recently resorted to combining the features of several techniques into one algorithm to improve the performance of meta-heuristics [27]. These studies concluded that hybrid algorithms, whether combining two meta-heuristics or combining a meta-heuristic with mathematical techniques, significantly improved the quality of the obtained solutions. The efficiency of the hybrid algorithm fundamentally depends on the hybrid strategy adopted [15,28,29,30,31].
Based on the above discussion, the shortcomings observed in the previous studies can be summarized as follows:
  • A G&TNEP model that compares various project types in order to maximize the HC is rarely presented in the literature. Most existing models allow for integrating a single type of project for each planned project. Several case studies should be implemented to assess each class separately.
  • The implementation of mathematical methods may increase the computational burden. Thus, a linearization approach is essential to deal with non-linear equations and avoid trapping at local optimums.
  • Although the hybrid of meta-heuristic algorithms is more effective in solving the G&TNEP problem compared to non-hybrid algorithms, the performance of these algorithms degrades if several types of projects are planned simultaneously. The number of decision variables and the search space increase proportionately with the number of projects designed.
To address the above-mentioned research gaps, this work suggests a co-planning model that allows the incorporation of planning models of RES, such as PV units and wind farms, and many technologies, such as TCSCs, FCLs, and SVC, into the G&TNEP model. The proposed model facilitates the planning of many projects simultaneously, without affecting the size of the search space. This feature helps improve the planning process technically and economically and saves computational time. An improved algorithm is suggested to solve the proposed problem. A decision-making approach is also developed to improve the performance of the algorithm. Figure 2 illustrates the proposed planning and solving strategy. The main contributions of this paper can be summarized as follows:
1.
Planning models of RESs, ESSs, TCSCs, FCLs, and SVCs are integrated into the G&TNEP to enhance the planning process and achieve the technical requirements. These projects give the system operator more options for improving the system security and lowering planning costs.
2.
A HC planning model with a reduced search space is investigated to compare many types of RESs, FACTs and ESSs and to select the most suitable, technically and economically.
3.
A decision-making approach is suggested to decrease the problem’s complexity. Four schemes are proposed to reduce the number of decision-making variables.
4.
An improved war strategy optimizer based on the Runge-Kutta learning strategy is proposed to solve the problem.
Figure 2. The strategy proposed for solving the G&TNEP problem in this work.
Systems 11 00023 g002

2. Problem Formulation

The proposed problem is formulated as an optimization problem with a single objective function and is subjected to technical constraints. The target is to meet future loads, promote HC levels, and maintain the system’s resilience.
The AC model is adopted to formulate the proposed problem to ensure the planning’s accuracy and to consider the capability of the generation units. This feature cannot be achieved using the DC model.

2.1. Objective Function

The proposed objective function is formulated to reduce the investment and operation costs of the built projects, as follows:
O F = m i n   { F 1 + F 2 + F 3 + F 4 + F 5 + F 6 +   F 7 }
The first term (F1) in (1) denotes the cost of constructing the new circuits. The scenario-based method is employed to simulate the uncertainties in the systems. Several scenarios are gathered to represent the stochastic behavior of the loads and RESs. The problem is solved for each scenario based on the projects defined in the previous scenarios. According to (2), the new circuits installed in each scenario equal the difference between the circuits needed in the current scenario h and those existing in the previous scenario h-1. The capital recovery factor, F C R F , is introduced to consider the time value of money. It is a constant that depends on the project’s lifetime in years ( Y ) and the discount rate ( τ ), as given in (3).
F 1 = h H i , j B   F C R F   C i j   ( N i j l , h N i j l , h 1 )
F C R F = τ   ( 1 + τ ) Y ( 1 + τ ) Y 1
F 2 explains the investment cost of the newly built conventional and renewable units, as given in (4). It also covers the operating costs for new and existing generation units. F 2 is designed to choose the best RES, either a wind farm or a PV unit, or both at the same site. The candidate sites are supposed to be suitable for installing wind farms and PV systems. Equation (5) points to the investment cost model, while Equation (6) describes the operation costs. In (6), Δ P g , i h , Δ P w , i h and Δ P p v , i h represent the incremental value in the rated power of generation units in scenario h compared to the power calculated in scenario h − 1.
F 2 = C i n v e s t G + C o p G
C i n v e s t G = h H g G   F C R F   (   C g , t h i n v s N g t h ,   h   Δ P g t h , h + C g , W i n v s   N g w ,   h   Δ P g ,   r a t e d w , h                                                             + N g p v ,   h   Δ P g ,   r a t e d p v , h )
C o p G = h H g G 365   Δ T F C R F   (   C g , t h v o p N g t h ,   h   P g t h ,   h + C g , w v o p   N g w ,   h   P g w , h + C g , p v v o p   N g p v ,   h P g p v , h + C g , t h f o p   N g t h ,   h   Δ P i t h , h + C g , w f o p   N g w ,   h Δ P g w , h + C g , p v f o p   N g p v ,   h   Δ P g p v , h )
The third term F 3 illustrates the cost of carbon capture and storage systems (CCSSs) to reduce the CO2 emitted from the thermal generation units. Moreover, it calculates the economic revenue gained from the tax credits, as given in (7). The CCSS’s cost is formulated in (8), and the revenue from the tax credits is calculated using (9) [32].
F 3 = C C C S S g C c a r b , r e v g
C C C S S g = h H g G 365   N g G ,   h   F C R F   (   C g , t h C C S S   P g t h ,   h )
C c a r b , r e v g = h H g G 365   N i G ,   h F C R F   (   C g , t h r e v   P g t h ,   h )
F 4 describes the planning cost for K types of ESSs, as provided in (10). The capital cost, the replacement cost, and the end-of-life cost for type k are expressed in (11)–(13), while (14) explains the operating cost [31]. The capital cost includes the cost of a storage container, a power conversion component, and ESS’s balance, as shown in (11). Equation (12) points to the replacement cost of the ESSs. Some ESS parts may be perishable during the project’s lifetime and must be replaced, representing an additional cost to consider. The end-of-life cost is due to the recycling of the ESSs at the end of the project. It is calculated as expressed in (13). Equation (14) reveals the fixed and operating costs of the ESSs. It is worth noting that   Δ E i E S S , k ,   h and Δ P i E S S , k , h are the incremental increases in the storage capacity and rated power compared to the calculated values in the previous scenario.
F 4 = k K C c a p E S S , k + C r e p E S S , k + C e l E S S , k + C o p E S S , k
C c a p E S S , k = h H b E S S   N b E S S ,   k , h   F C R F   ( c s c ,   k   Δ E b E S S ,   k ,   h + c p c ,   k   Δ P b E S S ,   k , h + c p b ,   k   Δ P b E S S ,   k , h )
C r e p E S S , k = h H b E S S N b E S S ,   k ,   h   F C R F   B r e p ,   k N r e p ,   k   Δ E b E S S ,   k ,   h γ R e p , k 1 ( 1 + τ ) γ k , b × A k , b
C e l E S S ,   k = h H b E S S N b   F C R F   E S S ,   k ,   h B e l ,   k Δ P b E S S ,   k , h
C o p E S S , k = h H b E S S N b   E S S ,   k ,   h   F C R F ( c fixed , k Δ P b E S S ,   k , h y Y ( 1 + V e l e c ,   k ) y ( 1 + τ ) y + B e l e c ,   k   365   Δ T     P b E S S ,   k ,   h   η E S S ,   k y Ω Y ( 1 + V e l e c ,   k ) y ( 1 + τ ) y + B g a s ,   k   d   h d    G r ,   k   P b E S S ,   k ,   h 10 3   η E S S ,   k y Ω Y ( 1 + V g a s ,   k ) y ( 1 + τ ) y )
F 5 indicates the cost of the FCLs, which are installed as follows:
C F C L = h H r o , p   F C L C F C L   F C R F   ( Z o p h Z o p h 1 )
Finally, F 6 and F 7 calculate the cost of constructing the TCSCs and SVC. The cost of the TCSCs is calculated by (16), whereas the cost of the SVCs is obtained by (17) [33]. It is worth mentioning that C 1 T C S C , C 2 T C S C and C 3 T C S C represent the cost coefficient for the TCSC, while C 1 S V C , C 2 S V C and C 3 S V C refer to the cost coefficient for the SVC.
C T C S C = h H   m , n T C S C F C R F   N m n T C S C ,   h   ( C 1 T C S C ( S m n h , T C S C S m n h 1 , T C S C ) 2 + C 2 T C S C ( S m n h , T C S C S m n h 1 , T C S C ) + C 3 T C S C )
C S V C = h H   s S V C F C R F   N s S V C ,   h   ( C 1 S V C ( Q s h , S V C Q s h 1 , S V C ) 2 + C 2 S V C   ( Q s h , S V C Q s h 1 , S V C ) + C 3 S V C )

2.2. Problem Constraints

The technical constraints are described in (18)–(57). These are categorized into project constraints (18)–(24), power flow constraints (25)–(38), capability constraints (39)–(54), the HC constraint (55), and the short-circuit current constraints (56)–(57).
During normal operations, the constraints (18)–(22) and (24)–(55) are taken into account. Meanwhile, during three-phase short-circuit fault contingencies, the short-circuiting current restrictions (56) and (57) are considered, along with project constraints, power flow limitations, capability constraints, and HC requirements, which are given in (18)–(55).

2.2.1. Project Constraints

The project constraints ensure that the number of projects installed does not surpass the permissible limits. The box-type restrictions (18)–(22) enforce the number of circuits, generation units, ESSs, TCSCs, and SVCs to be within the upper and lower bounds. It should be noted that all constraints are designed to guarantee that the previously built projects exist in all of the subsequent scenarios.
N i j l , h 1 N i j l ,   h N i j l ,   m a x   ;     { h H ,     i , j B }
N g G , h 1 N g G ,   h N g G ,   m a x   ;     {   h H ,   g G }
N b E S S , k , h 1 N b E S S ,   h N b E S S , k ,   m a x ;     {   h H ,   k K ,   b E S S }
N s S V C , h 1 N s S V C ,   h N s S V C ,   m a x ;     {   h H , s S V C }
Equations (23) and (24) restrict the size of the FCLs and TCSCs installed. The FCLs are used to govern the short-circuit current levels in the network during three-phase short-circuit fault contingencies. While the maximum compensation level, λ m a x , is shown in (24) to control the size of the TCSCs installed.
  Z o p F C L , h 1   Z o p F C L , h Z o p F C L ,   m a x   ;     { h H ,     o , p F C L }
  X m n T C S C , h 1   X m n T C S C , h λ m a x X m n l ,   m a x   ;     { h H ,     m , n T C S C }

2.2.2. Power Flow Constraints

Equations (25) and (26) refer to the power balance constraints. They reveal that the injected power relies on the active and reactive powers generated, the transmission line losses, the output active and reactive powers of ESSs, and the power consumed by the loads. Typically, ESSs are interfaced with the grid by bi-directional converters (BDCs). The use of BDCs facilitates the control of the power injected or absorbed by the ESSs to or from the network. Most studies in the literature related to G&TNEP ignore this feature [34,35].
g M i N g t h ,   h   P i t h , h + w M i N g w ,   h   P i w ,   h + p v M i N g p v ,   h   P i p v ,   h 0.5   l M i P i l o s s , h + l M i P i j s , h + l M i P i j r , h = P i d , h + B D C ,   b M i N b B D C ,   h P i B D C , k ,   h   ;     { h H }
g M i N g t h ,   h   Q i t h , h 0.5   g M i Q i l o s s , h + l M i Q i j s , h + l M i Q i j r , h = Q i d , h + B D C , b M i   N b B D C ,   h   Q i B D C , k ,   h   ;     { h H }
where
P i j s , h = V i h 2 G i j V i h V j h   G i j cos ( θ i h θ j h ) V i h V j h   B i j sin ( θ i h θ j h )   ;     {   h H ,   i , j B }
Q i j r , h = V i h 2 ( B i j + B s h ) V i h V j h G i j sin ( θ i h θ j h ) + V i h V j h B i j cos ( θ i h θ j h ) ;     {   h H ,   i , j B }
P i j r , h = V j h 2 G i j V i h V j h G i j cos ( θ i h θ j h ) + V i h V j h   B i j sin ( θ i h θ j h )   ;     {   h H ,   i , j B }
Q i j r , h = V j h 2 ( B i j + B s h ) + V i h V j h G i j sin ( θ i h θ j h ) + V i h V j h B i j cos ( θ i h θ j h )   ;     {   h H ,   i , j B }
The conductance ( G i j ) and substance of the line ( B i j ) of the TCSC-equipped lines are calculated using (31) and (32), respectively [36].
G i j = R i j ( R i j ) 2 + ( X i j ( 1 λ i j ) ) 2
B i j = X i j ( 1 λ i j ) ( R i j ) 2 + ( X i j ( 1 λ i j ) ) 2
The power flowing through the transmission lines equipped with TCSCs is governed as follows:
S i j s , h ( N i j l , h   S i j m a x + N i j T C S C , h   S i j T C S C , h )   ;     { h H , i , j B , i , j T C S C }
S i j r , h ( N i j l , h   S i j m a x + N i j T C S C , h   S i j T C S C , h ) ;     { h H , i , j B , i , j T C S C   }
where
S i j s , h = ( P i j s , h ) 2 + ( Q i j s , h ) 2
S i j r , h = ( P i j r , h ) 2 + ( Q i j r , h ) 2
It is worth mentioning that λ m n and N m n T C S C , h are set to 0 if the line m-n does not have a TCSC. The angles and voltages of the nodes are regulated through (37) and (38). They should be within the predefined bounds.
θ i m i n θ i h θ i m a x   ;     { h H , i B   }
V i m i n V i h V i m a x   ;     { h H , i B   }

2.2.3. Capabilities Constraints of ESSs, SVCs, and Generation Units

The constraints of the RESs are imposed through (39) and (40). The RESs are controlled only to generate active power. The active and reactive power capabilities of the thermal units are investigated in (41) and (42). The output of the thermal units should not violate their limits in steady-state or congestion conditions.
P g w ,   m i n , h P g w , h P g w ,   m a x , h ;     { h H , g G   }
P g p v ,   m i n , h P g p v , h P g p v ,   m a x , h   ;     { h H , g G   }
P g t h ,   m i n P g t h , h P g t h ,   m a x   ;     { h H , g G   }
Q g t h ,   m i n Q g t h , h Q g t h ,   m a x   ;     { h H , g G   }
Equation (43) controls the minimum and maximum capacities of the SVCs installed in each scenario.
Q s S V C ,   m i n Q s S V C ,   h Q s S V C ,   m a x   ;     { h H , s S V C   }
The technical constraints of the ESSs are explained in (44)–(54). The box-type Equations (44) and (45) govern the charging and discharging active power of the ESSs through BDCs, whereas (46) and (47) regulate the injected or absorbed reactive power. The inequality constraints (48) and (49) illustrate that the total absorbed and injected reactive powers through BDCs should not exceed the maximum charged and discharged powers by ESSs.
0 P d c h , b B D C , K , h P d c h , b E S S , K , m a x , h   ;     { h H , k K , b E S S   }
0 P c h , b B D C , K , h P c h , b E S S , K ,   m a x , h ;     { h H , k K , b E S S   }
0 Q d c h , b B D C , K , h P d c h , b E S S , K , m a x , h ;     { h H , k K , b E S S   }
0 Q c h , b B D C , K , h P c h , b E S S , K ,   m a x , h ;     { h H , k K , b E S S   }
( P d c h , b B D C , K , h ) 2 + ( Q d c h , b B D C , K , h ) 2 P d c h , b E S S , K , m a x , h   ;     { h H , k K , b E S S   }
( P c h , b B D C , K , h ) 2 + ( Q c h , b B D C , K , h ) 2 P c h , b E S S , K , m a x , h   ;     { h H , k K , b E S S   }
P d c h , b E S S , K , m a x , h and P c h , b E S S , K , m a x , h are managed in each scenario based on the SOC of the ESSs. P d c h , b E S S , K , m a x , h is calculated using (50). P c h , b E S S , K , m a x , h is obtained by (51). It relies on the rated power and the current SOC of the selected ESS. In this work, ∆T is set to one hour.
P d c h , b E S S , K , m a x , h = min ( P E S S , K , r   , S O C E S S , K , i h E E S S , K , b m i n Δ t )   ;     { h H , k K , b E S S   }
P c h , b E S S , K , m a x , h = m i n ( P E S S , K , r   , E E S S , K , i m a x S O C E S S , K , b h Δ T ) ;     { h H , k K , b E S S   }
Equation (52) is used to calculate the SOC of the built ESS. Constraints (53) and (54) imply that the ESS’s storage capacity should be less than the maximum of the selected ESS type.
S O C b E S S , K , h = S O C b E S S , K , h 1 + η E S S , K c h   P c h , K , b h P d c h , K , b h η E S S , K d c h   ;     { h H , k K , b E S S   }
E b E S S , K , h E b E S S , k , m a x   ;     { h H , k K , b E S S   }
E b E S S , K , h = E b E S S , K , h 1 + P d c h , K , b h η E S S , K d c h D O D E S S , K , b m a x   ;     { h H , k K , b E S S   }

2.2.4. Hosting Capacity Constraint

The constraint (57) regulates the HC levels in the power systems. In this study, the total rated power of the wind turbines and PV systems should not exceed a certain percentage of the system’s peak load.
H C m i n r R P r ,   r a t e d w , h + P r   ,   r a t e d p v , h i B P i d , m a x H C m a x

2.2.5. Short-Circuit Current Constraints

Several faults commonly occur in the power networks, such as a single line-to-ground fault, a double line-to-ground fault, and a line-to-line fault. However, the three-phase short-circuit fault is the worst and is considered in this work. It is calculated by (55). The fault current should be less than the pre-defined level I m a x S C , as described in (56). V i h ( 0 ) is the pre-fault voltage and Z i i is the bus i diagonal value in the impedance matrix.
I i S C = V i h ( 0 ) Z i i h ;     { h H , i B   }  
I i S C , h I m a x S C     ;     { h H , i B   }

3. Proposed Decision-Making Approach

The model provided in (18)–(57) reveals that planning several sources for reactive power compensation and many types of ESSs and RESs increases the problem’s complexity. The search space is large, and the number of manipulated parameters is huge. Further, a significant computational burden is needed. By reducing the number of optimized variables, the meta-heuristic algorithm can preserve its efficiency regardless of the increase in the number of projects planned.
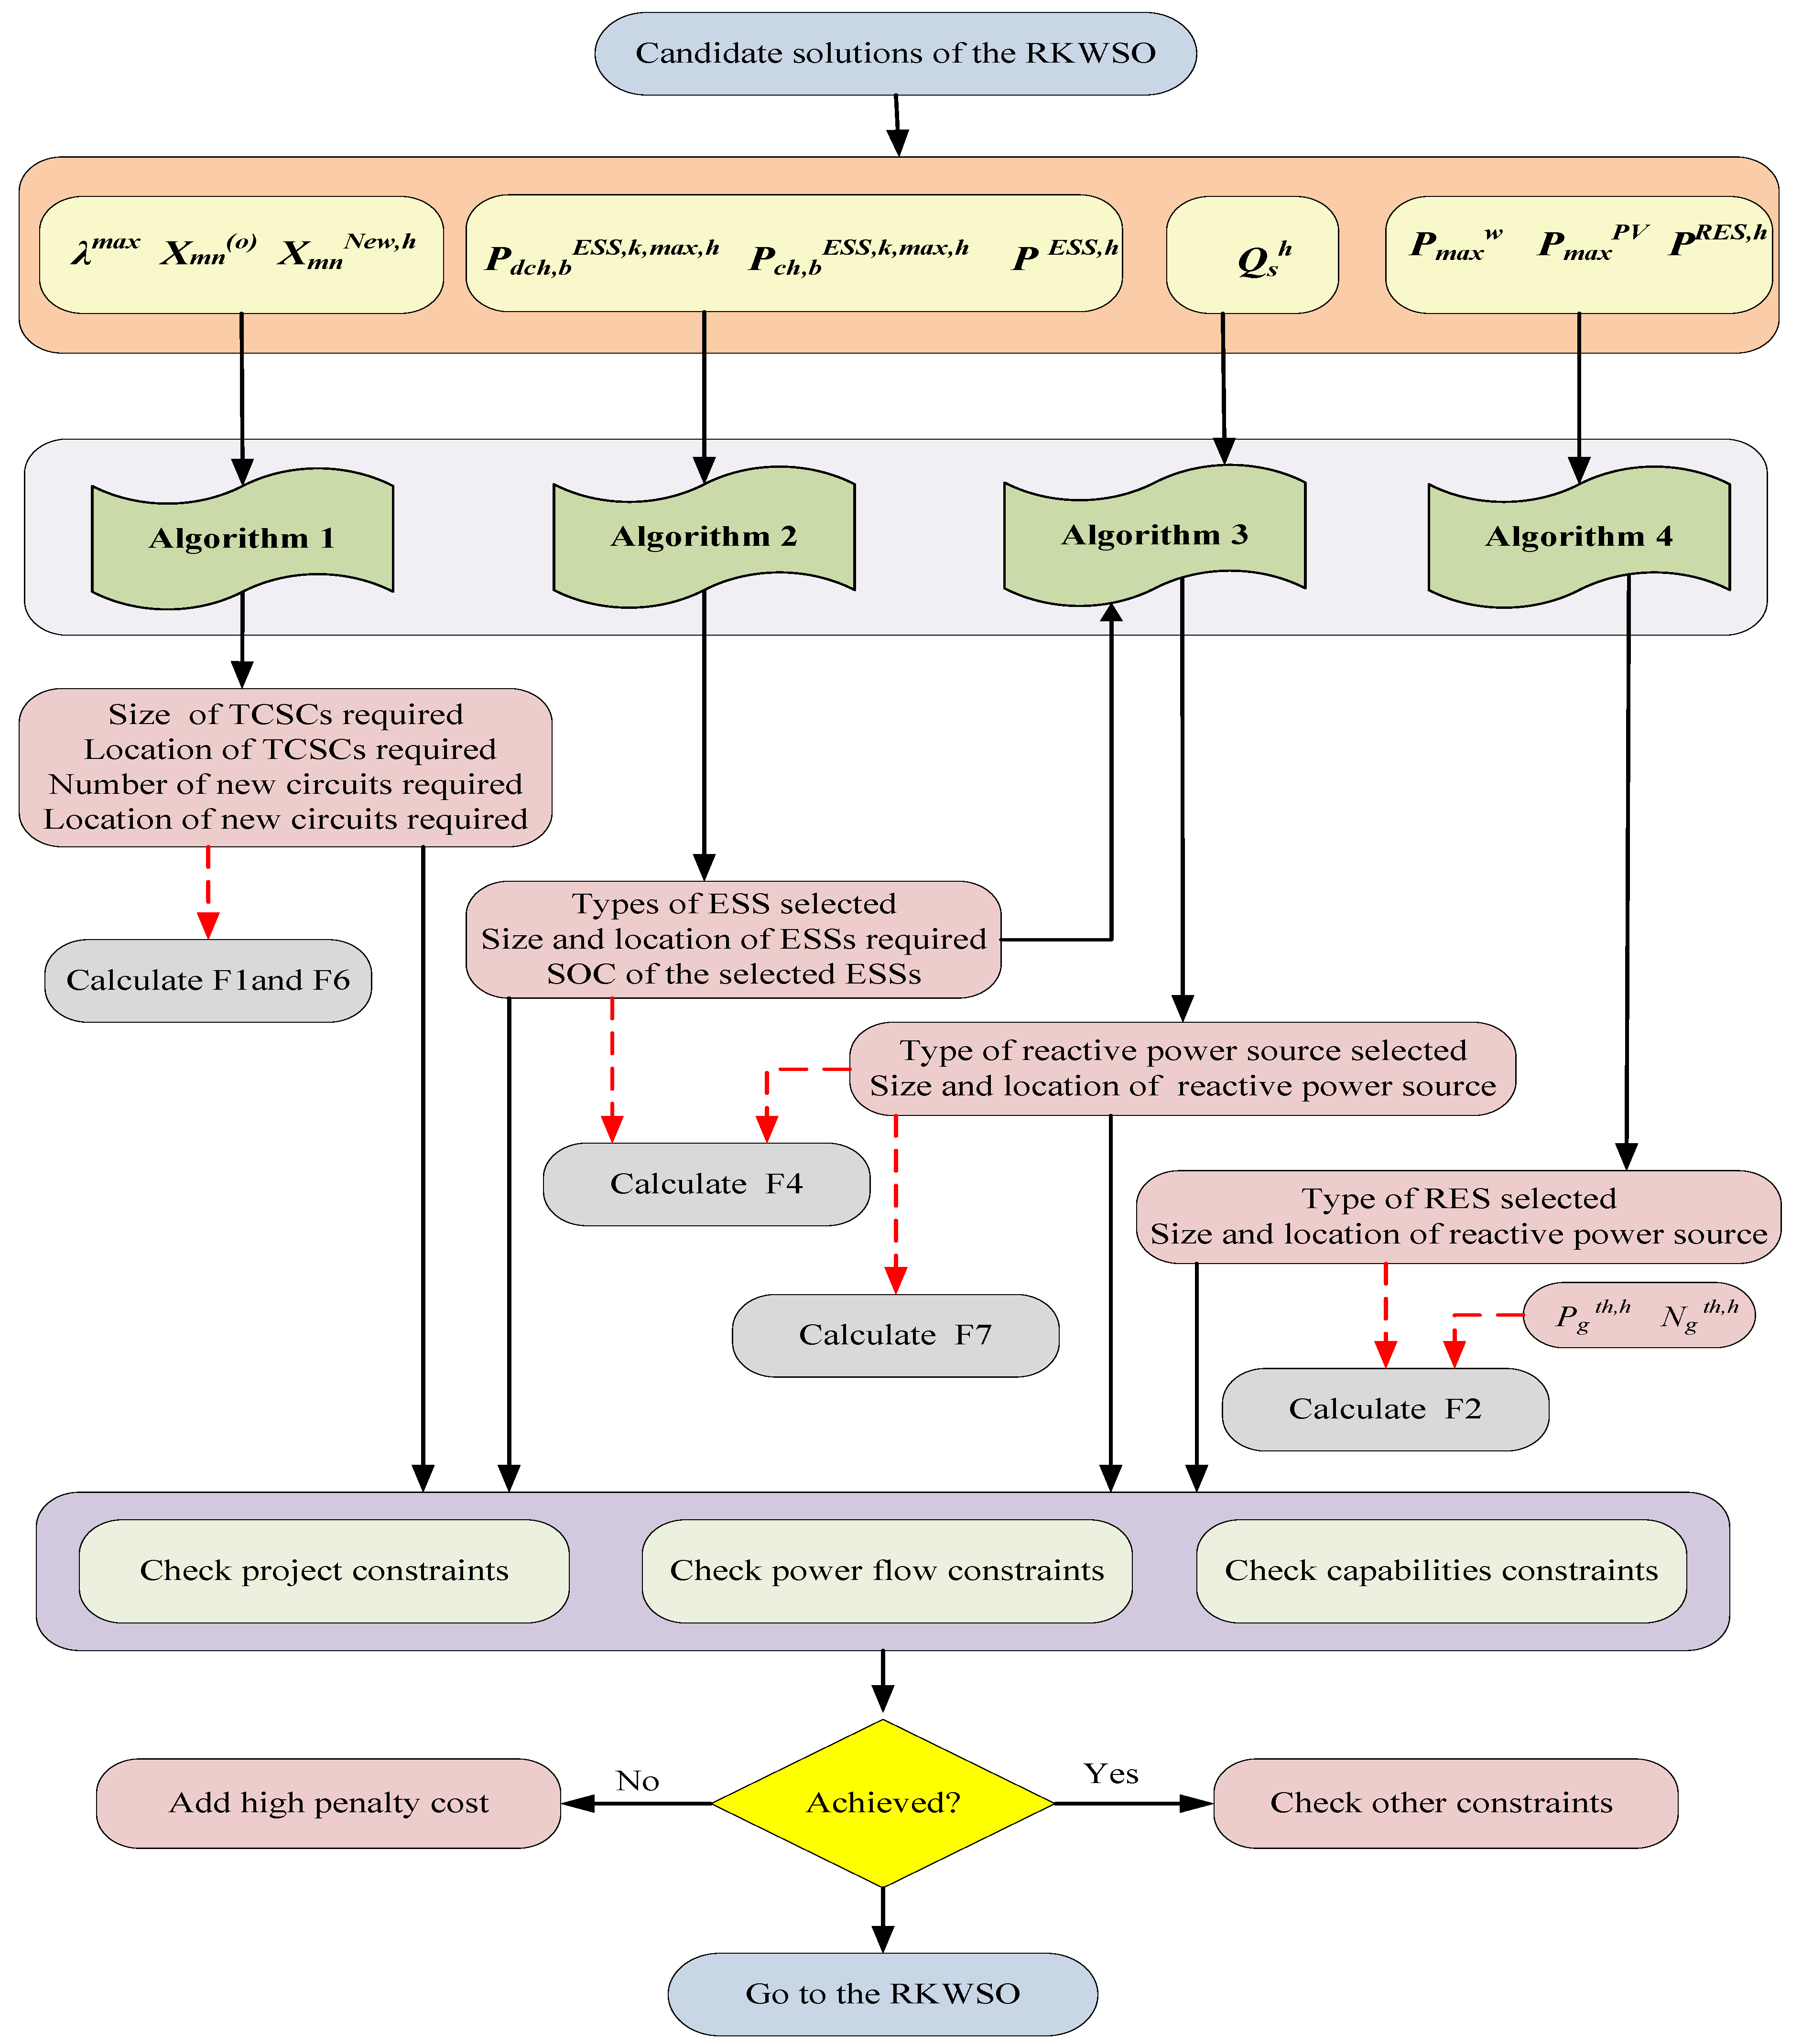
The proposed approach depends primarily on grouping candidate projects that directly impact the same system state, as illustrated in Figure 3. For example, new circuits and TCSCs installed between buses m and n directly impact the impedance of the transmission line connecting the two buses. Thus, new circuits and TCSC devices can be determined by controlling the impedance of the lines between buses. Similarly, all of the considered ESS types affect the active or reactive power of buses where they are located. Thus, they can be grouped together, and the best ESS configuration can be determined by employing a suitable scheme.
SVCs and ESSs are designed to inject or absorb reactive power into or from the grid. Hence, another scheme can be designed to select the best of them or a mix of them to meet the quantity of reactive power required. The variables assigned for controlling the reactive power that is injected or absorbed can be kept constant regardless of the number of VAR sources considered. In addition, the optimal size of the wind farms and PV units required to increase the HC can be determined. The wind and PV units are planned to inject active power into the system, and the appropriate source can be assigned by optimizing the amount of active power needed and selecting the best one based on their technical and economical characteristics.
According to Figure 3, the proposed approach is carried out through four schemes. The first, second, and fourth schemes operate in parallel, whereas the third scheme is an extension of the second scheme, through which the appropriate reactive power source is selected. The first scheme receives a vector of calculated reactance ( X N e w ,   h ) from the optimizer, the vector of the circuits’ reactance ( X ( o ) ) and λmax, and the output is a vector representing the size and location of TCSCs, and the number and location of the new circuits. The second scheme concerns the ESS’s active powers. It receives a vector of calculated power ( P E S S , h   ) and the ESS’s maximum charging and discharging powers ( P d c h B D C , k , m a x , h and P c h B D C , k , m a x , h ), and generates a vector of the selected types and their sizes and location. Based on the results of the second scheme, the ESS’s maximum charging and discharging reactive powers are defined, and the third scheme determines the suitable source for supplying the required reactive power (   Q S V C , h ). The fourth scheme controls the power dispatched from each type of RES. It receives a vector of the calculated power ( P R E S , h ), as well as a maximum capacity of each source, and the output is a vector of the amount of power each type can share.

3.1. Planning Scheme for New Circuits and TCSCs

The suggested approach primarily relies on the impedance of the transmission lines in defining the TNEP projects. The impedance of the transmission lines becomes the new independent variable assigned for planning the candidate lines and TCSCs in the planned model. As a result, the number of decision variables decreases from 2   N m a x l to N m a x l . It is worth mentioning that if many projects influence the transmission lines’ impedance, there is no impact on the number of decision variables. The location of these projects can be directly defined through monitoring the changes that occur in the impedance of the transmission lines, as illustrated in Algorithm 1.
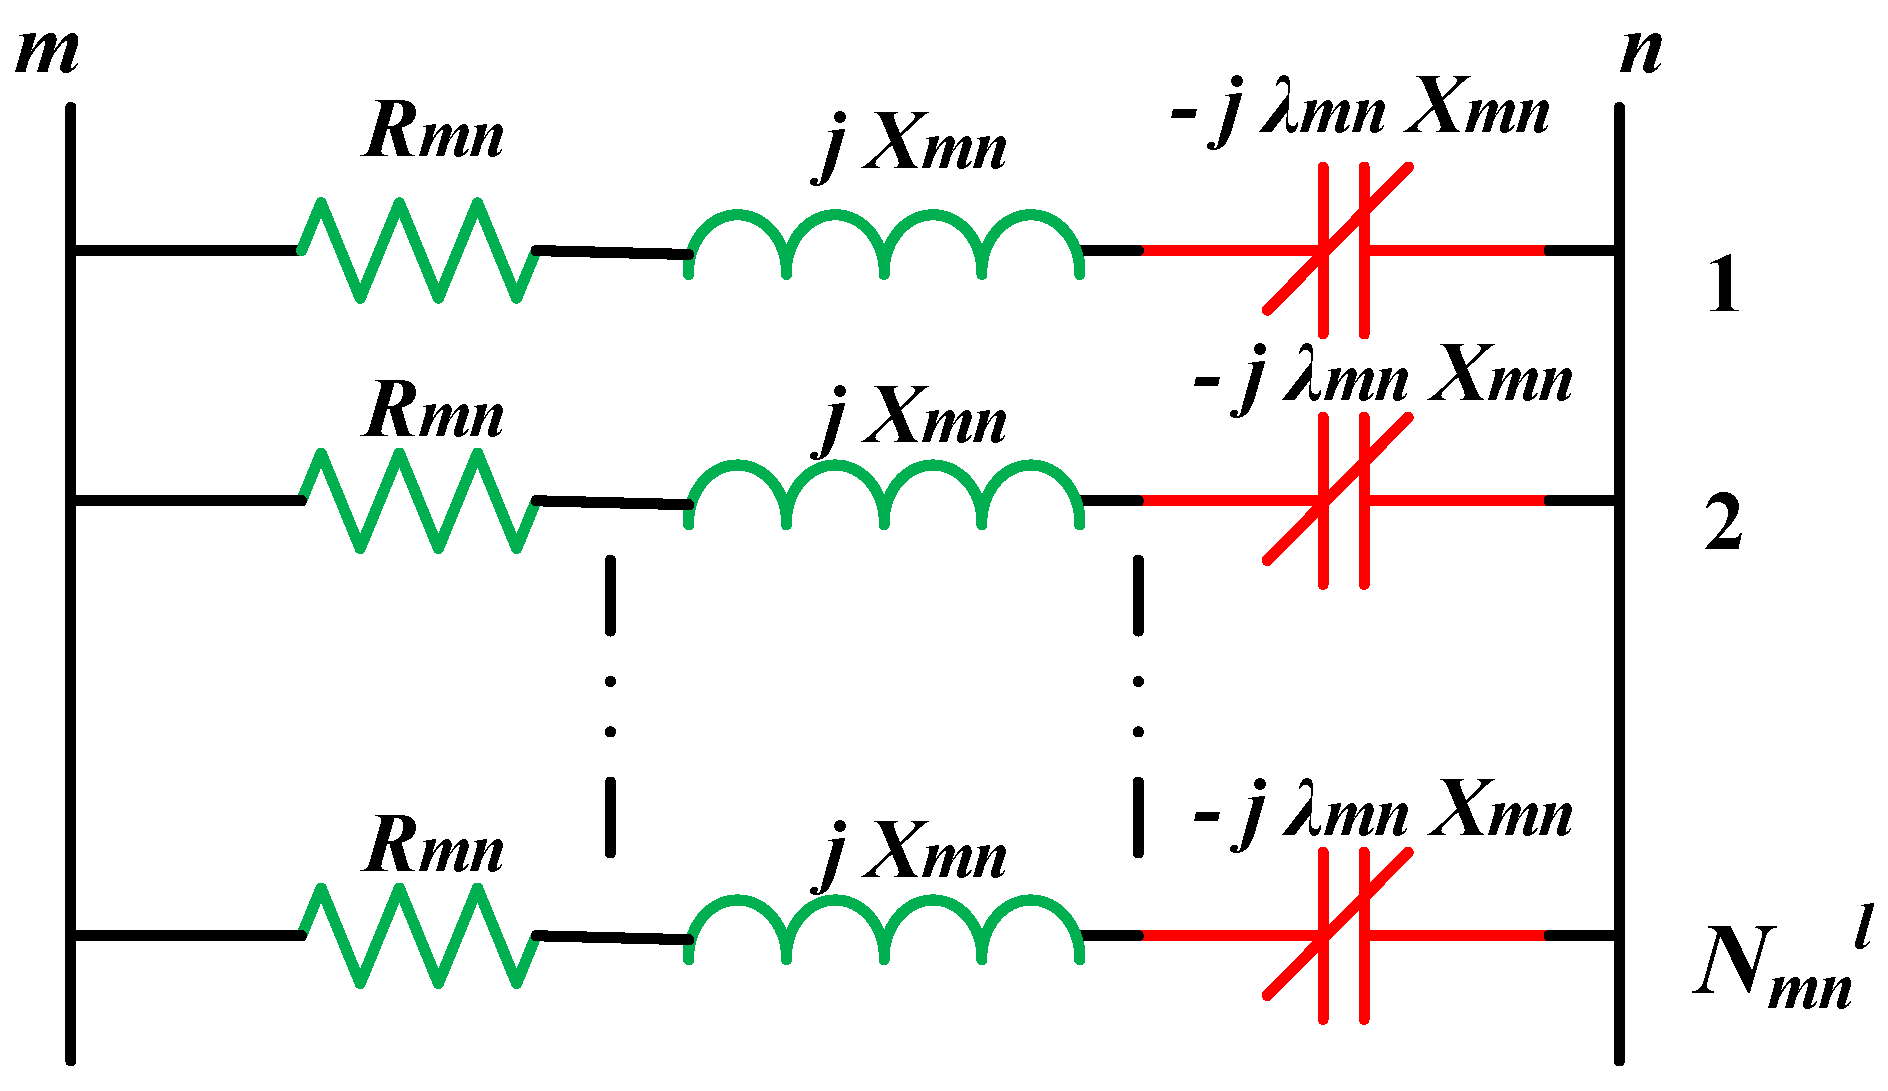
TCSCs only affect the reactance of the transmission lines, as shown in (24), (31), and (32). As a result, the transmission line reactance is only considered to define the projects required. If N m n l , h circuits and TCSCs are installed between the node m and the node n, as shown in Figure 4, the reactance x m n n e w , h can be calculated by:
X m n n e w , h = X m n ( o ) N m n l , h ( 1 λ m n h   )
Algorithm 1: Pseudo-code of circuits and TCSCs planning scheme.
1:Inputs: the maximum compensation level ( λ m a x ) ,   X m n ( o )   and   X m n n e w , h .
2:For   i = 1   N m a x l .
3:      Calculate the number of new circuits required using: ( N m n l , λ , h ) using (59).
4:       If   N m n l , λ , h < 4
5:        N m n l , λ , h = 0
6:      end
7:      Calculate the number of new circuits required using:
                N m n l , h = c e i l ( ( 1 λ m a x )   N m n l , λ , h )
8:      Calculate N m n λ , h using (61).
9:   Calculate the compensation level required in each route ( λ i j h ) using (62).
10:end
Therefore, by calculating X m n ( o ) x m n n e w , h , the location of the new transmission lines and the size and the location of the TCSCs are determined as follows:
N m n l , λ , h = N m n l , h + N m n l , h   λ m n h   1 λ m n h
where N i j l , λ , h is the total projects built in the route m-n. Equation (59) reveals that X m n ( o ) X m n n e w , h < 1 points to there being no projects installed in this route.
The number of new transmission lines required is defined by:
N m n l , h = ( 1 λ m n h )   N m n l , λ , h
It is noteworthy that the project selection scheme prioritizes installing a new TCSC over installing a new transmission line. The location and the compensation level are decided by (61), and the size of the installed TCSC can be calculated using (62).
N m n λ , h = N m n l , λ , h N m n l , h
λ m n h = N m n λ , h N m n l , h + N m n λ , h
It is worth mentioning that (58)–(61) guarantee that the TCSCs are only constructed if the number of new and existing circuits allows. The range of X m n n e w , h can be constrained by (63). M T C S C is a number greater than or equal to 1.
( 1 λ m a x )   X m n ( o ) N m n l ,   m a x X m n n e w , h M T C S C   X m n ( o ) N m n l , h 1

3.2. Planning Scheme for ESSs

The suggested model allows the use of a mix of many ESSs, whether long- or medium-term, at the same location. Increasing the number of candidate ESS types increases the number of variables assigned to ESS planning. It may degrade the performance of the applied meta-heuristic algorithm. The proposed strategy is based on determining the required charging and discharging power, irrespective of the type of ESS. Following that, Algorithm 2 is used to select the best ESS for meeting the calculated power. The range of power calculated,   P b E S S , h , is restricted by:
k K P d c h , b B D C , k , m a x , h   P b E S S , h k K P c h , b B D C , k , m a x , h
The strategy starts with defining P d c h , b B D C , k , m a x , h and P c h , b B D C , k , m a x , h for each type and P E S S , h   . Then, the suitable type, in terms of its economic and technological factors, at each bus is decided through three paths:
1.
First path: All types meet P b E S S , h
In this case, the planning cost is calculated for each type, and the type that provides the lowest installation cost is selected.
2.
Second path: One or more types cannot meet P b E S S , h
In this case, the sources that meet P b E S S , h are selected for comparison, and the type that provides the lowest installation cost is determined. The types that fail to achieve P E S S , h   are excluded.
3.
Third path: All types cannot meet P b E S S , h
In this case, the preferred type is first assigned with the highest priority to compensate P b E S S , h . It is the type selected in the first scenario. The preferred type’s sharing level is then calculated (   P i , p r i o E S S , h ), which equals its maximum power depending on the operating mode (charging mode or discharging mode). After that, the sharing levels of the other types are calculated using (65).
  P b E S S , k , h = P b E S S , h P b , p r i o E S S , h
If the   P b E S S , k , h of each type exceeds its maximum, it will be excluded from the comparison, whereas types that technically meet (65) are compared in terms of the cost to select the one suitable for integration with   P b , p r i o E S S , h to meet P b E S S , h .
If the   P b E S S , k , h of all types exceeds the maximum charging and discharging powers at each scenario (   P b B D C , k , m a x ), the sharing power of each type will be   P b E S S , k , m a x . The type that has the maximum   P b E S S , k , h is chosen to incorporate with   P i , p r i o E S S , h .
Algorithm 2: Pseudo-code of ESSs planning scheme.
1:Inputs: P d c h , b B D C , k , m a x , h ,   P c h , b B D C , k , m a x , h , and the vector of required power injected or absorbed from or by ESSs ( P E S S , h   ).
2:For     b E S S
3:  Define the preferred ESS that has the priority to compensate P E S S , h   .
4:For each ESS type
5:      If P d c h , b B D C , k , m a x , h P b E S S , h     P c h , b B D C , k , m a x , h  
6:            P b E S S , k , h = P b E S S , h
7:      else
8:        Define P b , p r i o E S S , h .
9:        Calculate P b E S S , k , h using (65).
10:      end
11:      Calculate the cost of ESS installed.
12:   end
13:  If   P b E S S , k , h for all types equals P b E S S , h
14:   The selected ESS is the type that has the lowest investment and operation cost.
15:      P b E S S , k , h = P b E S S , h
16:  else
17:      Define P b , p r i o E S S , h .
18:      Find types of P b E S S , k , h > P b E S S , k ,   max ,   h
19:      If all types except the preferred type meet 18
        Select the type that has the highest P b E S S , k ,   max ,   h to integrate with P b , p r i o E S S , h .
20:      else
21:       Select types that do not meet 18
22:       Select the ESS type with the lowest cost to integrate with the preferred type.
23:   end
24:   Define the power shared by the selected ESS ( P E S S , m i x   )
25:   P b E S S , h =   P i , p r i o E S S , h + P b E S S , m i x
26:  end
27: Update SOC of selected types.
28:end

3.3. Planning Scheme for Reactive Power Sources

The ESSs and SVCs are planned to be the main sources for the reactive power compensation. To reduce the assigned decision variables, the reactive power required is calculated and then the suitable source is determined based on the cost, rated values, and available capacity of the ESSs, as explained in Algorithm 3. The constraint (66) limits the calculated reactive power.
( k K Q d c h , b B D C , k , m a x ,   h + Q s S V C ,   m i n ) Q s h ( k K Q c h , b B D C , k , m a x ,   h + Q s S V C ,   m a x )
The suggested strategy starts with defining the maximum charging and discharging reactive powers of the ESSs. They are updated based on the charging and discharging of the active powers, as illustrated in (67) and (68).
Q d c h , b B D C , k , m a x , h = ( P d c h , b E S S , k , m a x , h ) 2 ( P d c h , b B D C , k , h ) 2   ;     { h H , k K , b E S S   }
Q c h , b B D C , k , m a x ,   h = ( P c h , b E S S , k , m a x , h ) 2 ( P c h , b B D C , k , h ) 2   ;     { h H , k K , b E S S   }
The sharing level of each source is then determined by taking the upper and lower bounds into account. For the ESSs, Algorithm 2 is applied to calculate their sharing level. If each source of VAR can provide the required reactive power, the source selected is decided based on the cost. Otherwise, a mix of VAR sources is selected, as explained in Algorithm 3.
Algorithm 3: Pseudo-code of VAR planning scheme.
1:Inputs: the maximum charging and discharging reactive power for each ESS type ( Q d c h , s B D C , k , m a x , h ,   Q c h , s B D C , k , m a x , h ), and
required power injected or absorbed from or by SVCs and ESSs ( Q s h )
2: Reactive powers shared by ESSs are determined using the same steps in Algorithm 2.
3:For    s S V C
4:    Calculate the planning cost of VAR and selected ESSs.
5:    If Q s S V C , h   =   Q s E S S , h
6:      A type that has the lowest cost is selected.
7:     else
8:       If Q s S V C , h = Q s h
9:        The selected type is SVC.
10:       else If Q s E S S , h = Q s h
11:        The selected type is ESS.
12:       else
13:        Define the preferred source regarding the source selected in the first scenario ( Q s , p r i o h ).
14:        Calculate the required capacity of the other type:
                     Q s , m i x h = Q s h Q s , p r i o h
15:        Calculate the planning cost of SVC and selected ESS.
16:         end 
17:    end 
18:  end

3.4. Planning Scheme for RESs

As discussed in Section 2, the proposed model allows for the comparison of many types of RES to select the most suitable, technically and economically, during the planning process. The power injected at each bus from the RESs is calculated to hold the number of decision variables constant. Then, the sharing level of each type is selected based on the power available in each scenario. The power needed from the RES is restricted by (69).
0     P r R E S , h (   P r w , h + P r p v , h )
Setting the sharing level of each source is the core of the proposed strategy. Commonly, the rated capacity of the wind farms and PV systems is known, and based on the wind speed and irradiance in each scenario, the available power to supply to the grid is obtained, as shown in (70) and (71) [37].
  P r w , h = { 0 ,       f o r   v w v i n w     a n d   v w v o u t w         P r ,   m a x w × ( v w v i n w v r w v i n w ) ,   f o r   v i n w v w v r w       P r ,   r a t e d w ,       f o r   v r w < v w v o u t w
  P r p v , h = {   P r , m a x p v × ( G s 2 G s t d × R c ) ,   f o r   0 < G s < R c     P r ,   r a t e d p v × ( G s G s t d   ) ,   f o r   G s R c
In contrast to the previous studies, this work adopts a reverse strategy. The power needed to supply is first defined, and then the rated power of each RES necessary to meet it is calculated using (72) and (73). M R E S is a very large number.
  P r ,   r a t e d w , h = { M R E S ,       f o r   v w v i n w     a n d   v w v o u t w         P r w , h × ( v r w v i n w v w v i n w ) ,   f o r   v i n w v w v r w       P r w , h ,       f o r   v r w < v w v o u t w
  P r ,   r a t e d p v , h = {   P r p v , h × ( G s t d × R c G s 2 ) ,   f o r   0 < G s < R c     P r p v , h × ( G s t d G s ) ,   f o r   G s R c
After calculating the rated values, there are three paths, as described in Algorithm 4:
1.
First path: The rated values needed of all types are lower than or equal to their maximum.
In this case, the sharing level of each type is equal to the   P r R E S , h , and the type that provides the lowest installation cost is selected.
2.
Second path: The rated values of one or more types exceed the maximum.
In this case, the types that fail to supply the required power are excluded, and the types that meet   P r R E S , h are compared in terms of installation cost to select the suitable type.
3.
Third path: The rated values of all types exceed the maximum.
In this case, the sharing level for the type that has the priority to inject power into the grid   ( P r , p r i o R E S , h ) and is calculated using (70) or (71), considering its maximum power. Similar to ESSs planning, this source is the type selected in the first scenario. The sharing level of the other types (   P r , t y p e R E S , h ) is obtained as follows:
  P r , t y p e R E S , h = P r R E S , h P r , p r i o R E S , h
If   P r , t y p e R E S , h for a type exceeds P g , t y p e R E S , m a x , this type is excluded. Types that can incorporate with the preferred type are only those that meet   P r R E S , h P r , p r i o R E S , h .   P g , t y p e R E S , m a x is the output of the other source using (70) or (71), considering its maximum power.
Algorithm 4: Pseudo-code of RESs planning scheme.
Inputs:   P m a x w ,     P m a x p v and P R E S , h .
1: FOR      r R
2:  Define the RES that has the priority to inject   P r R E S , h .
3:  Calculate P r ,   r a t e d w , h and P r ,   r a t e d p v , h using (72) and (73) considering the output   P r R E S , h
4:        If P r ,   r a t e d w , h       P r ,   m a x w     and   P r ,   r a t e d p v , h       P r ,   m a x p v    
5:        Select the RES with the lowest cost.
6:        end
7:        If   P r ,   r a t e d w , h >   P r ,   m a x w or   P r ,   r a t e d p v , h >   P r ,   m a x p v
8:         Exclude this type.
9:       end
10:      If   P r ,   r a t e d w , h >   P r ,   m a x w and   P r ,   r a t e d p v , h >   P r ,   m a x p v
11:        Calculate   P i , p r i o R E S , h using (70) or (71).
12:        Calculate   P r , t y p e R E S , h using (74).
13:        Calculate the planning cost for types that meet (74).
14:        Select the type with the lowest cost to incorporate with the preferred type
15:      end
16:end

4. Algorithm Preliminaries

After applying the decision-making approach, the algorithm becomes concerned with fewer control variables. The planning model can be represented as:
Minimize: OF
subjected to: (23), (25)–(38), (41)–(43), (57), (63), (64), (66), and (69)
The new control variables are presented in a vector form as follows:
φ = [ X i j h ,   P b E S S , h , Q s h , P r R E S , h ,   Z i j F C L , h , P g t h , h ] ;     { h H , i , j B , b E S S , s S V C , r R E S , g G   }
The problem is still non-linear and non-convex, and achieving a globally optimal solution may not be guaranteed. This work suggests an improved WSO based on the Runge Kutta learning strategy (RKS). WSO is effective in dealing with unimodal and multimodal functions. It proved its supremacy in solving some well-known engineering problems [38]. Meanwhile, RKS helped improve the convergence capability of the Runge-Kutta optimizer (RUN) [39].

4.1. War Strategy Optimization Algorithm

WSO was developed by Ayyarao et al. [38] in 2022. The WSO approach was inspired by the strategic movement of army troops during wars. The mechanism of operation of WSO can be described as follows. The positions of the army troops are randomly distributed on the war field, as described in (76). L B and U B are the lower and upper bounds of the decision-making variables.
X = L B + r a n d × ( U B L B )
All soldiers are candidates to become kings or commanders based on each soldier’s combat strength (the fitness value). The soldier with the best attack force is the king, while the second-best attack force is the commander. The king and the commander are leaders of all the troops, and their movements on the battlefield determine the next positions of the soldiers. The positions’ updating scheme is carried out through two strategies: the attack strategy and the defense strategy.
In WSO, the transition from attack to defense or vice versa occurs randomly. In the attack strategy, it is assumed that the king has the best position to launch attacks on the opposing troops, and the soldiers’ next positions are defined by:
X i t e r + 1 = X i t e r + 2 × ρ × ( C K ) + r a n d × ( W 1 × K X i t e r )
where K and C are the positions of the king and the commander, respectively. ρ is a random number. W 1 is the weight vector. It primarily depends on each soldier’s rank ( R i ) as shown in (78). α is constant. R i of soldiers increases by one if their attack forces improve. The attack forces represent the fitness values of soldiers. It is worth mentioning that all soldiers have the same rank and weight at the beginning of the war.
W 1 , i = W 1 , i × ( 1 R i i t e r m a x ) α
In the defense strategy, the soldiers’ next positions depend on the positions of the king, the commander, and any soldier selected randomly, as given in (79). The defense strategy explores more search space to avoid trapping in local optimums.
X i t e r + 1 = X i t e r + 2 × ρ × ( K X r a n d i t e r ) + r a n d × W 1 × ( C X i t e r )
In each iteration, the soldier who has the weakest attack force (the worst fitness value) is randomly replaced using (76).

4.2. Runge-Kutta Optimization Algorithm

RUN was first developed in 2021 by Ahmadianfar et al. in [39]. Its main idea is based on the Runge-Kutta (RK) theory, applied to find the numerical solution for ordinary differential equations. The RUN algorithm updates the decision variables through three main stages. The first stage employs a search mechanism (SM) based on the RK method to calculate the new position of individuals in the population as follows:
x n + 1 = ( x c + r × S F × g × x c ) + S F × S M + μ × r a n d n × ( x m x c )
x n + 1 = ( x m + r × S F × g × x m ) + S F × S M + μ × r a n d n × ( x r 1 x r 2 )
If the random number,   r a n d , is less than 0.5, the new positions are calculated by (80). Otherwise, the new positions are defined by (81). r is an integer that equals 1 and −1. g is a random number between 0 and 2, and μ is a random number with a normal distribution. S F is an adaptive factor. More details about SM, SF, x m and x c can be found in Ahmadianfar et al. [39].
The second stage applies the enhanced solution quality scheme to improve the quality of the solutions gained, as shown in (82) and (83). The new variable, x n e w 2 , is obtained by (82) if W 2 < 1 , otherwise, x n e w 2 is computed by (83). It is worth noting that Equations (82) and (83) are carried out if a randomly generated number between 0 and 1 is less than 0.5.
x n e w 2 = x n e w 1 + r × W 2 × | ( x n e w 1 x a v g ) + r a n d n |
x n e w 2 = ( x n e w 1 x a v g ) + r × W 2 × | ( u × x n e w 1 x a v g ) + r a n d n |
where β is a random number in the range of [0, 1]. c is a random number, which is equal to 5 × r a n d . x b e s t is the best solution explored so far. W 2 , x a v g and x n e w 1 are calculated using (84), (85), and (86), respectively.
W 2 = r a n d ( 0 ,   2 ) × e x p ( c ( i t e r i t e r m a x ) )
x a v g = x r 1 + x r 2 + x r 3 3
x n e w 1 = β × x a v g + ( 1 β ) × x b e s t
The third stage provides another chance to improve the quality of solutions. It is executed if solutions gained from the second stage have lower quality than the first stage’ solutions. The new positions in the third stage are calculated as follows:
x n e w 3 = ( x n e w 2 r a n d × x n e w 2 ) + S F × ( r a n d × x R K + ( v × x b x n e w 2 ) )
where v is a random number with a value of 2 × r a n d .

4.3. RKWSO

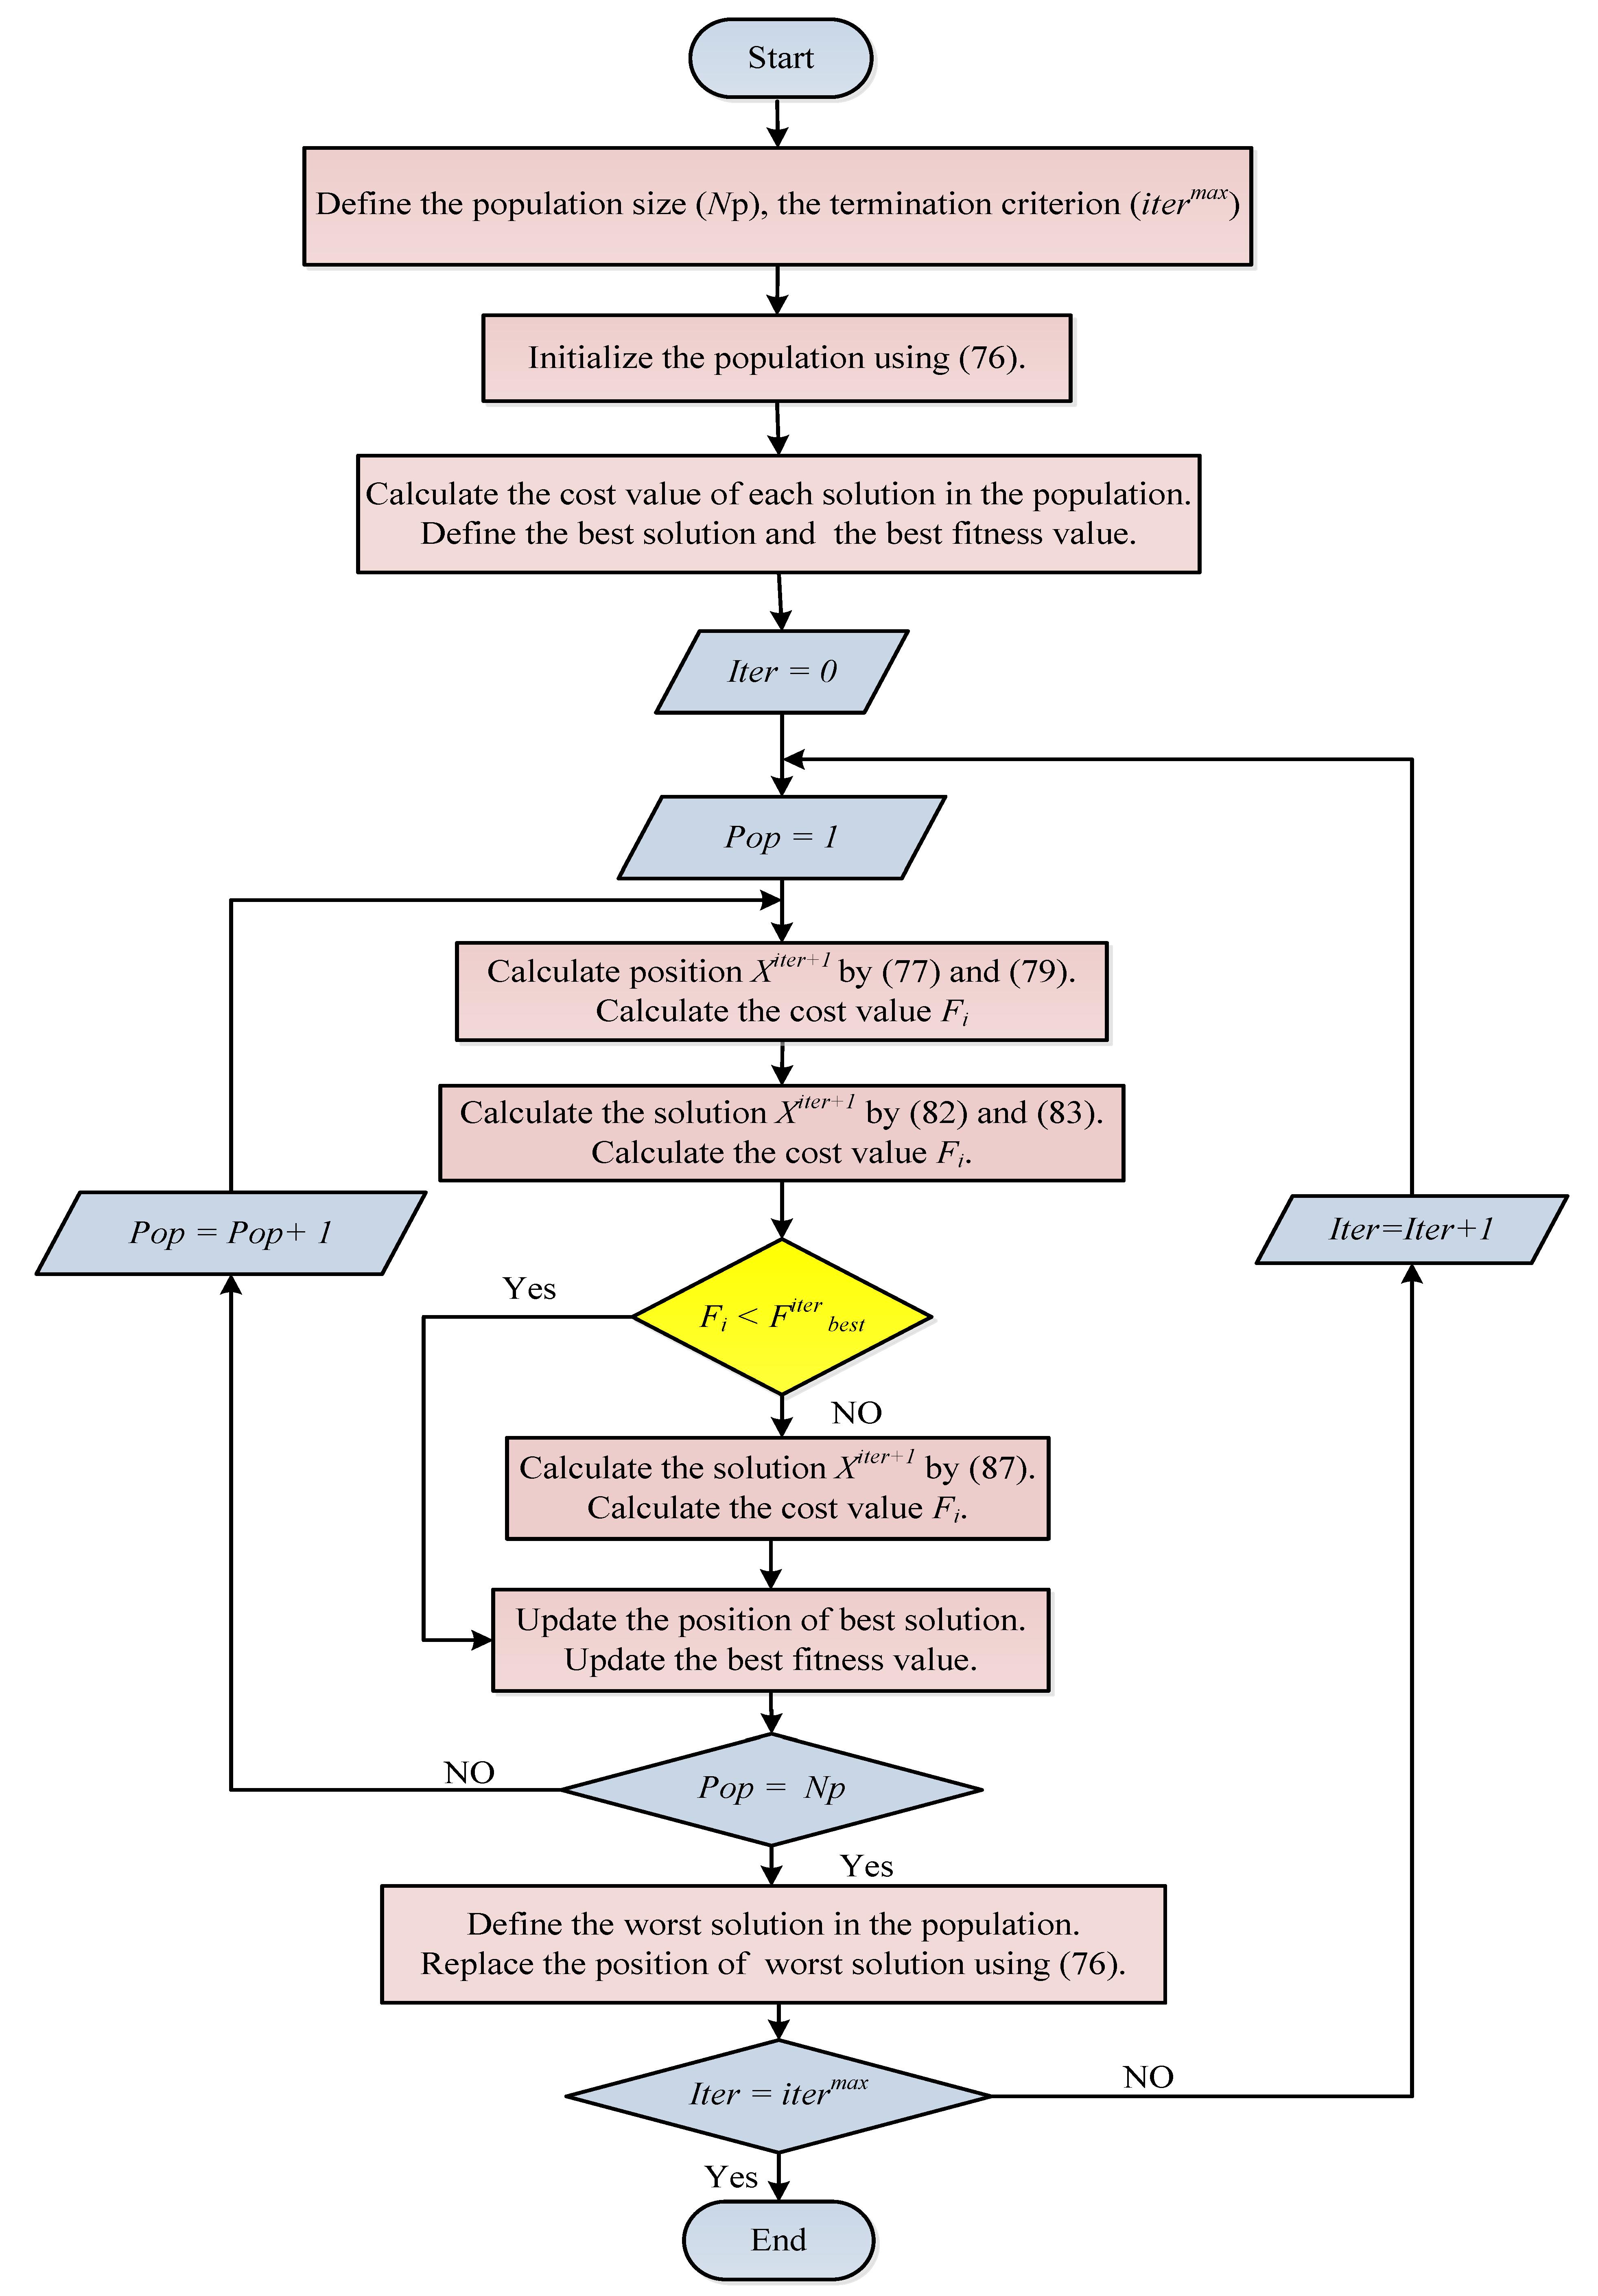
The proposed RKWSO is based on incorporating the second and third stages of the RUN algorithm into the WSO algorithm. The RKWSO algorithm is illustrated in Figure 5. The RKWSO starts by generating a random population using (76). Then, the best and worst solutions are calculated. In each iteration, the new solutions are calculated in four phases. The individuals’ positions are first updated using (77) and (79). After that, the learning schemes (82) and (83) are applied to improve the quality of the solutions obtained in the first phase. If the fitness value of the individual is greater than the best fitness, the third phase (87) is employed. Otherwise, the updating scheme terminates. The final step is to replace the solution with the worst fitness value with a random solution, determined by (76).
The application of the RKWSO in solving the proposed problem can be explained as follows. For each scenario, the following steps are executed to solve the problem:
(a)
In each iteration:
  • The RKWSO solver optimally updates the location of the new transmission lines, and the size of the FCL modules, FACTs, ESSs, and RESs.
  • Apply the proposed decision-making approach to define each project type.
  • Check the normal operation constraints (18)–(22) and (24)–(55).
  • Apply a three-phase short-circuit fault and check the short-circuit constraint (18) and (57).
  • Add a high penalty cost to solutions that violate the problem constraints.
  • Repeat the above steps until the maximum number of iterations is reached.
(b)
Repeat step (a) until the maximum number of runs is reached.
(c)
Determine the best solution by comparing the results of each run.
(d)
Update the lower bound of the decision-making variables.
(e)
Go to the next scenario.

5. Numerical Results

5.1. Test Systems

The Garver network and IEEE 118-bus system were selected for conducting the proposed study. The results were gathered over ten separate runs driven on the MATLAB r2021a platform via a DELL PC, with a model name of OptiPlex7050, having an Intel® Core™ i7’ CPU at 2.6 GHz-16 GB RAM.
The Garver system has two thermal units and six existing circuits. The candidate circuits and generation units are presented in [40]. In this work, the candidate locations for the ESSs are buses 2 and 5, while the new location of the RESs is bus 5. The rated power of the PV system and wind farm was 300 MW, and their characteristics are given in [37]. The maximum reactive powers of the thermal units were reduced by 50%.
The PHS and Li-ion were used in this study. The rated capacity of PHS was 50 MW, and the rated capacity was 200 MWh. Li-ion’s rated power and capacity were 10 MW and 20 MWh, respectively. The other technical and economic specifications of PHS and Li-ion can be found in [17]. At each candidate location for building the ESS, the maximum number of the PHS and Li-ion units were one and five, respectively.
The 118-bus system consists of 118 buses, 54 thermal generation units, and 186 existing lines [41]. The total loads are 6.886 GW. It is planned that a new circuit can be installed at each route. The candidate places for the RESs are on buses 2, 50, 81, 93, 101, 115, and 118, while buses 2, 15, 49, 50, 56, 80, 81, 93, 101, 115, and 118 are candidates for the ESSs. The maximum number of PHS and Li-ion units at each candidate bus were two and ten, respectively. The rated capacities of the PV system and wind farm were 500 MW.
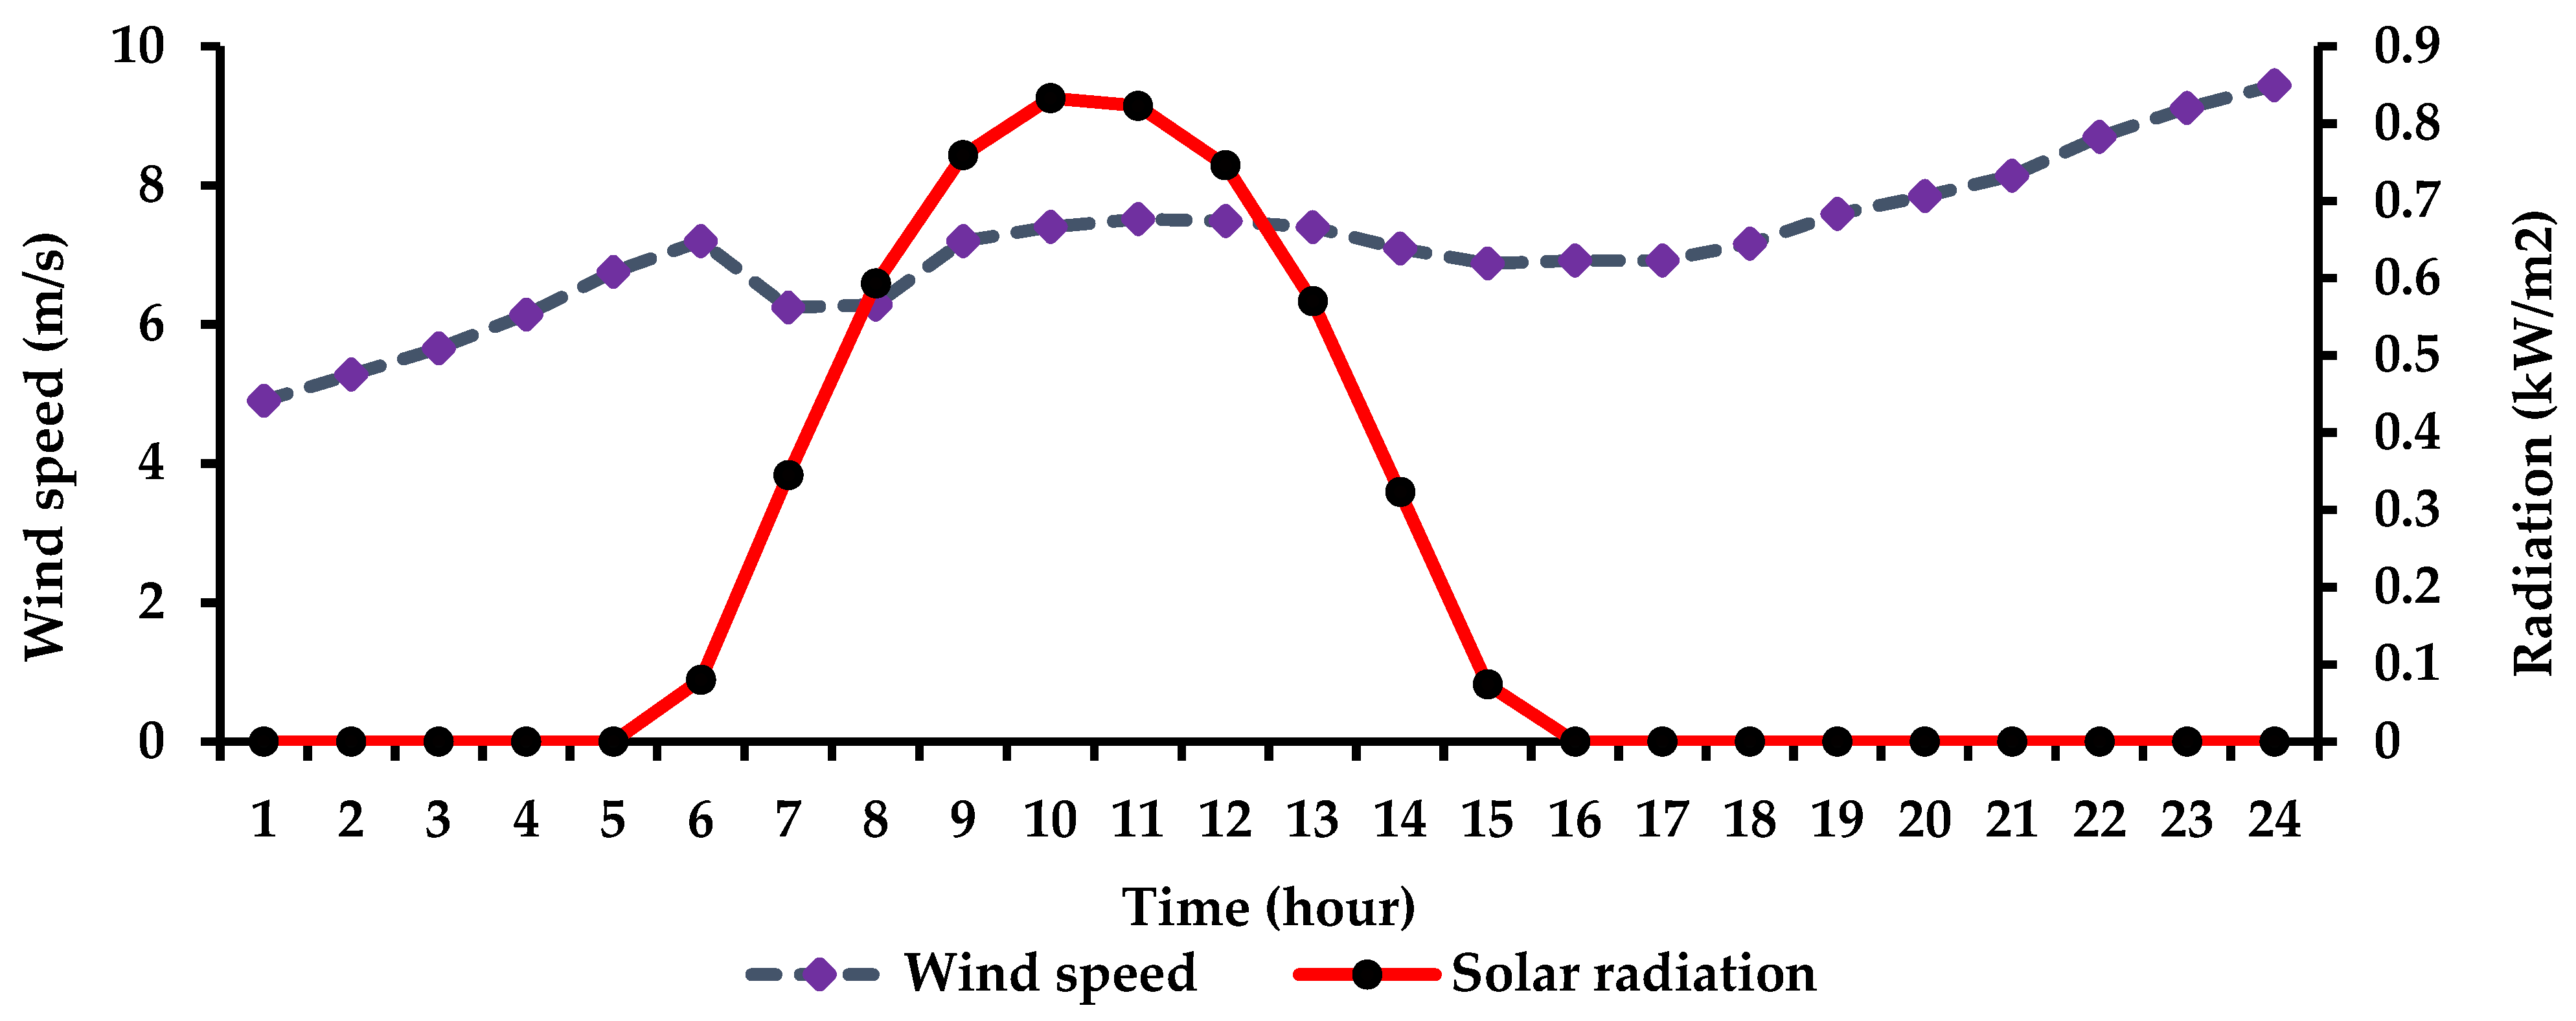
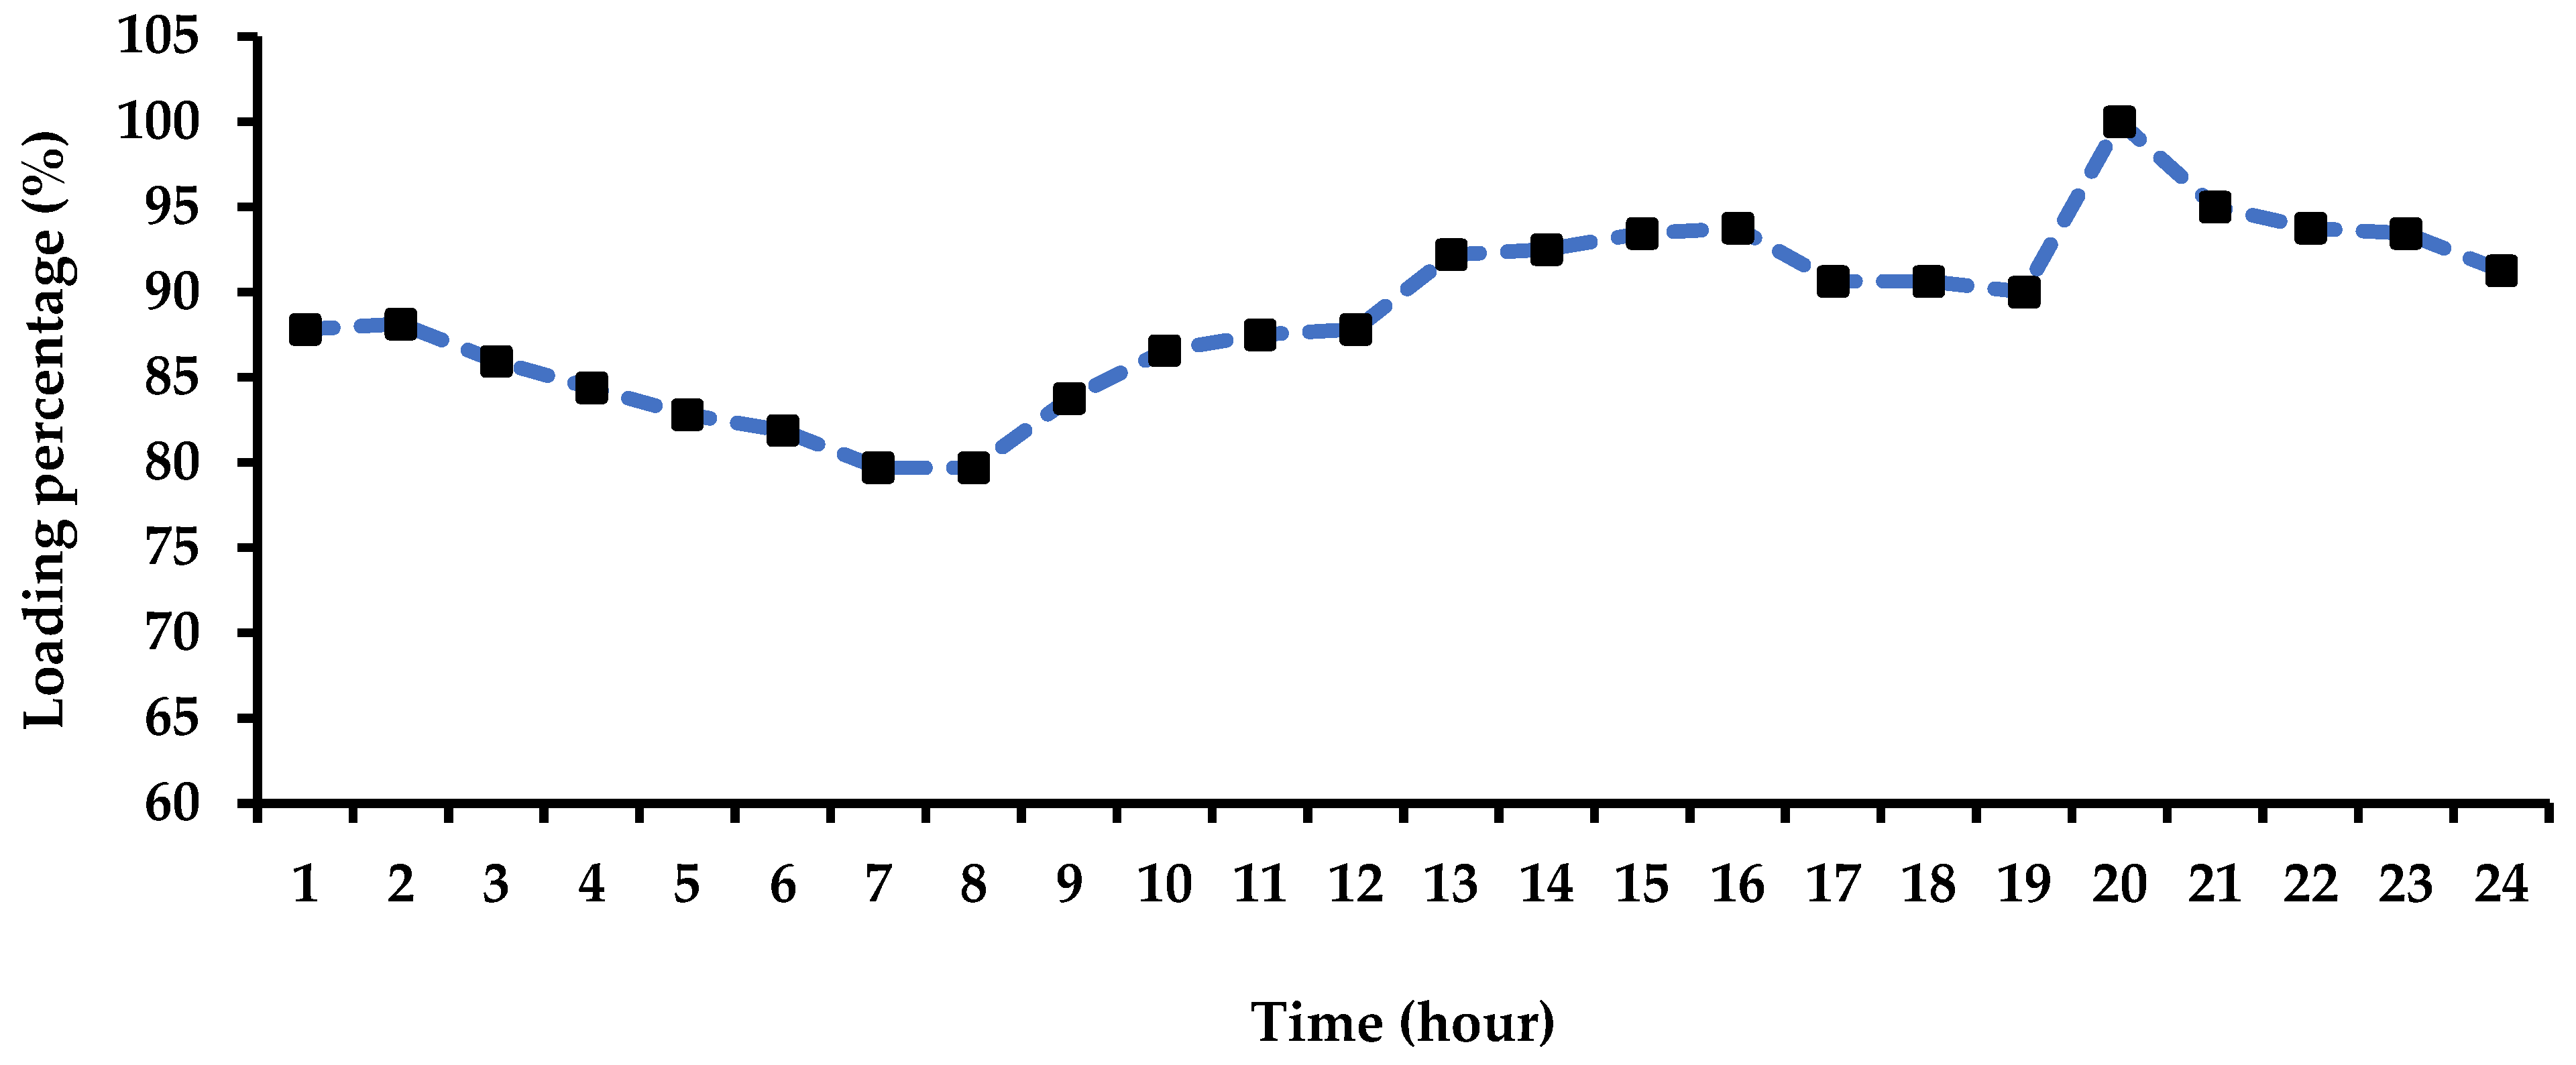
For both systems, two curves were employed to simulate the variation of the wind speed and solar radiation over 24 h, as shown in Figure 6. The consumption variation over the 24 h is described in Figure 7. The investment and operating costs of the generation units are presented in [42]. The investment and operating costs of the generation units and the cost and revenue of the CCSSs are given in [32].

5.2. Garver Network

5.2.1. Validation of the Proposed Solution Method

The proposed strategy was tested and compared to the conventional method in solving five models. The test models varied in the number of candidate projects and decision variables. The comparison aimed to evaluate the effectiveness of each scheme separately. The first model examined the dependency on the lines’ impedance in determining the optimal location and number of new circuits. Only one ESS type was used, and SVCs, FCLs, and TCSCs were not planned. The second and third models evaluated the performance of the circuits, the TCSCs, and the reactive power planning schemes. The fourth model tested the impact of adding the FCL’s planning model to the G&TNEP problem. The fifth model was adopted to test both methods of controlling the HC levels and the power dispatched from two types of ESS. Simulations were carried out, taking into account two HC levels. It is worth mentioning that the simulations started with scenario number 16, and this section only presents the results of this scenario.
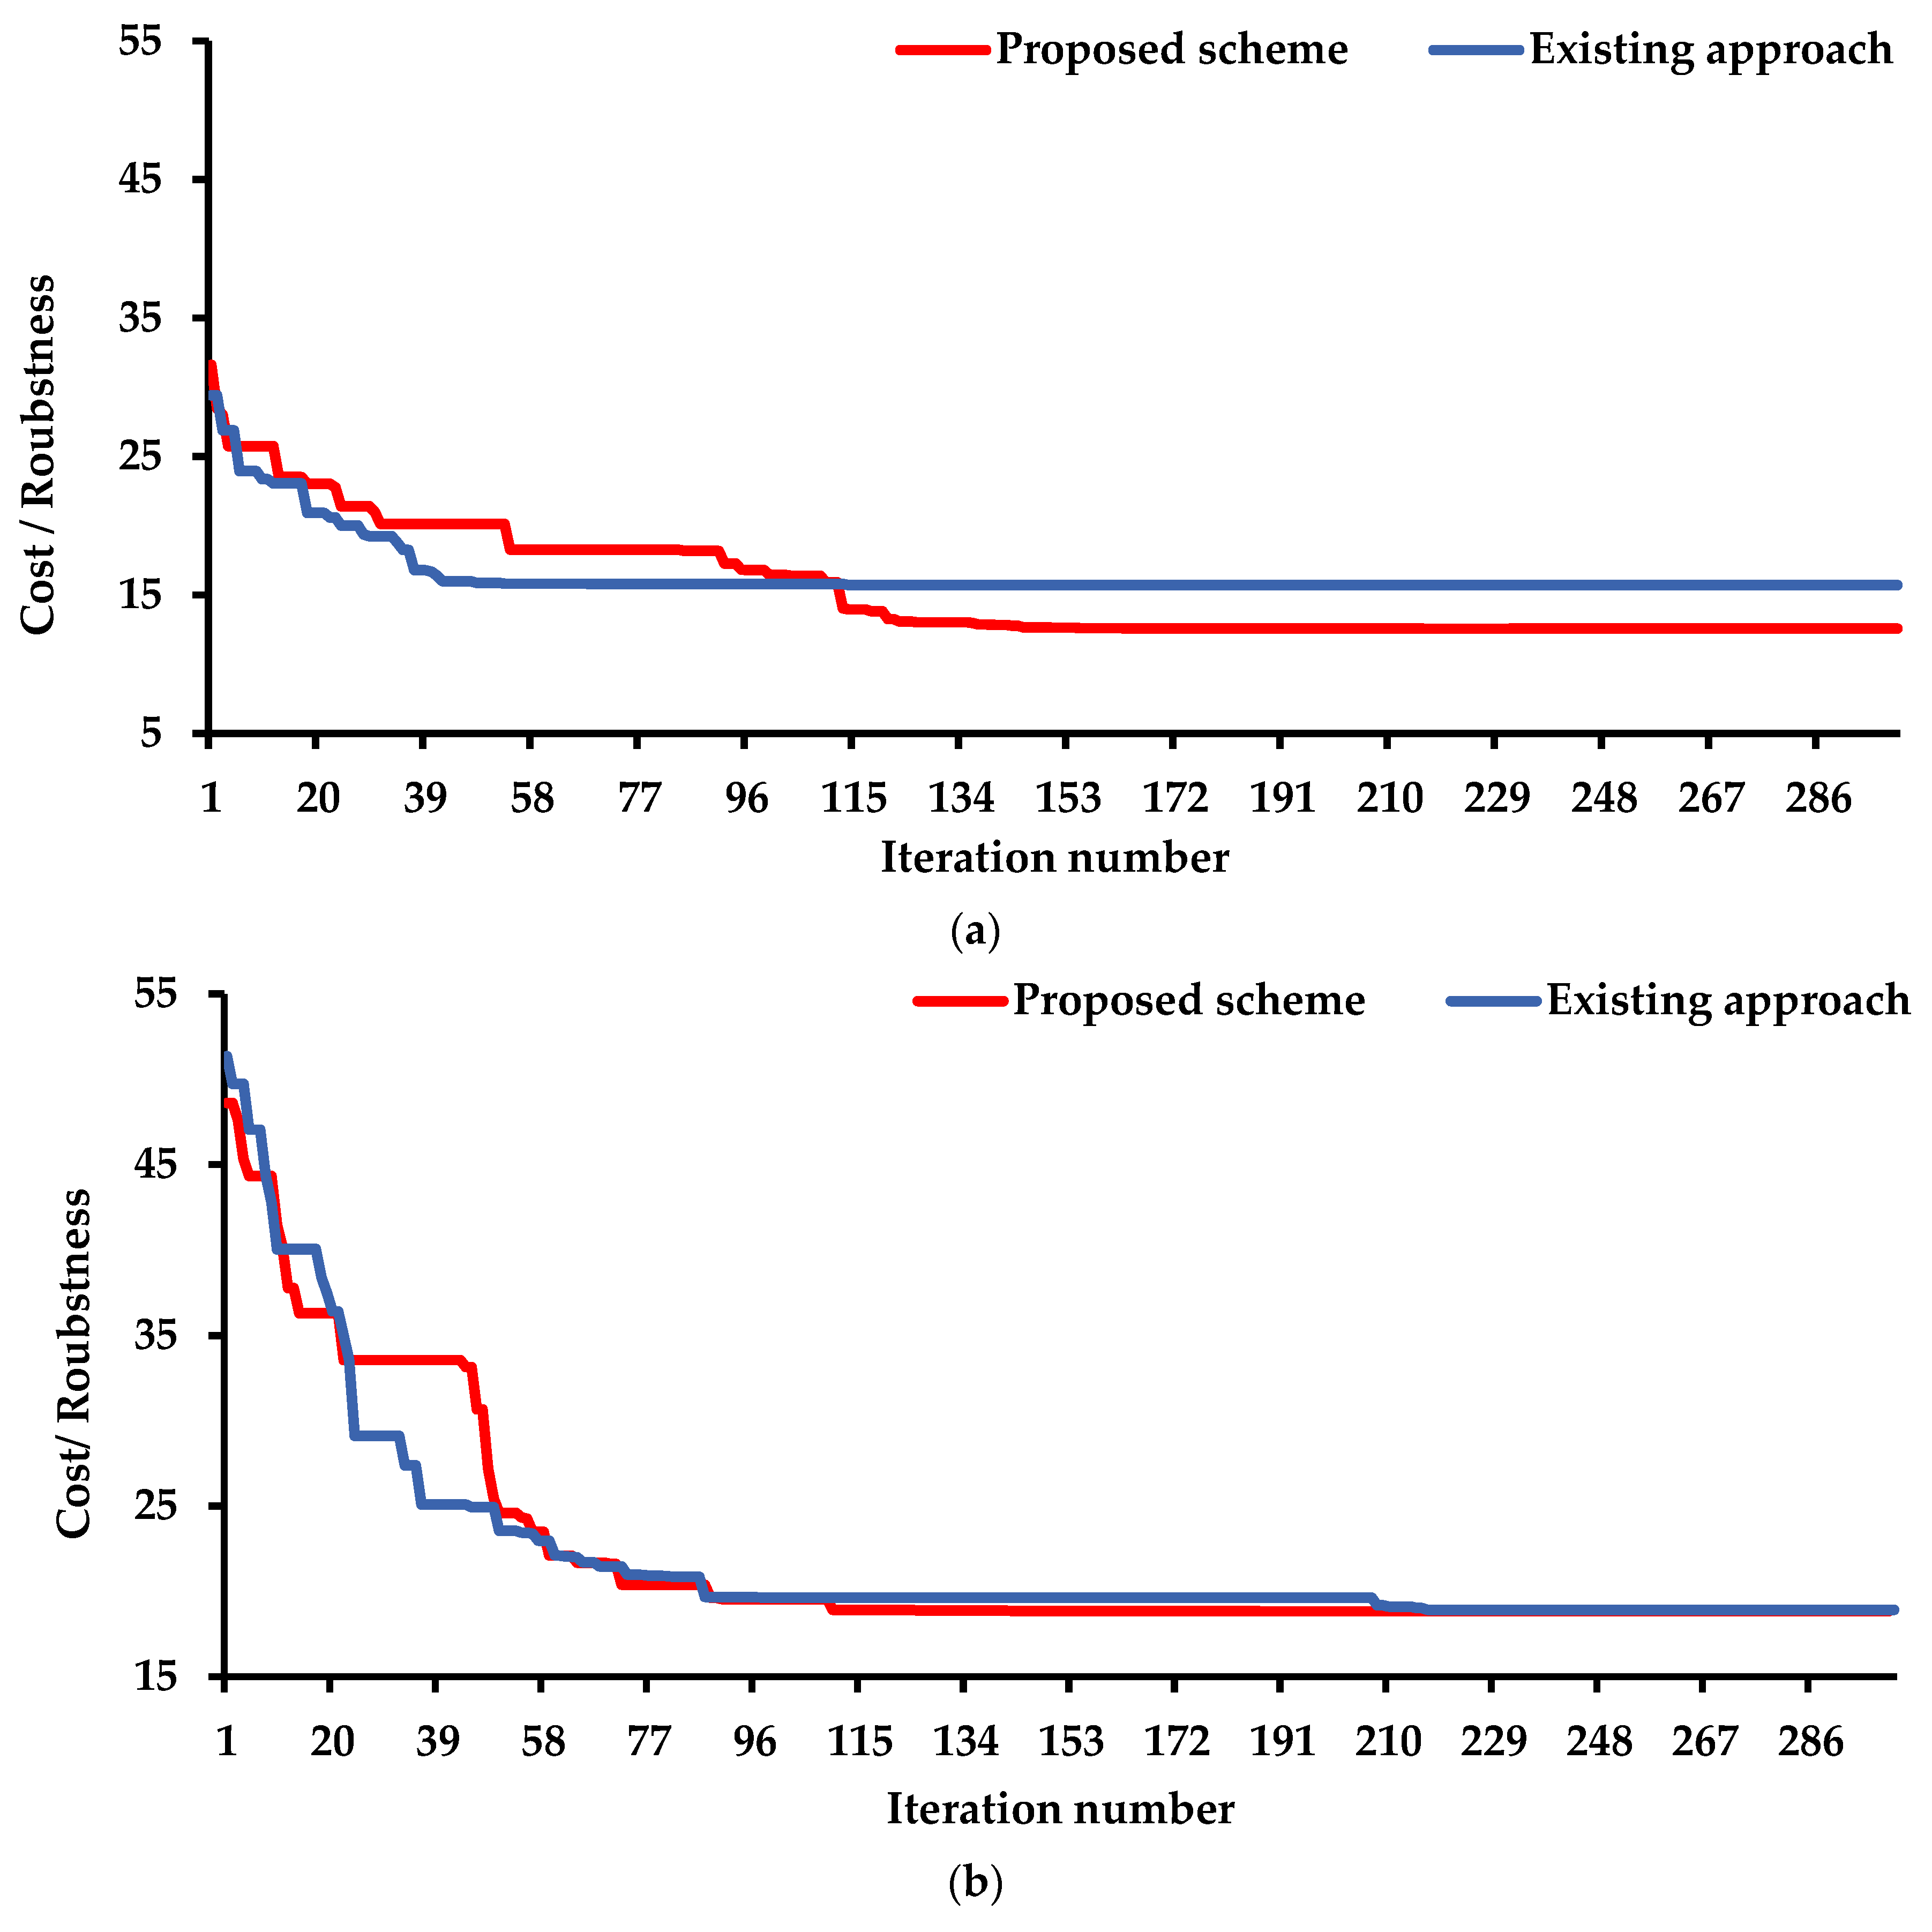
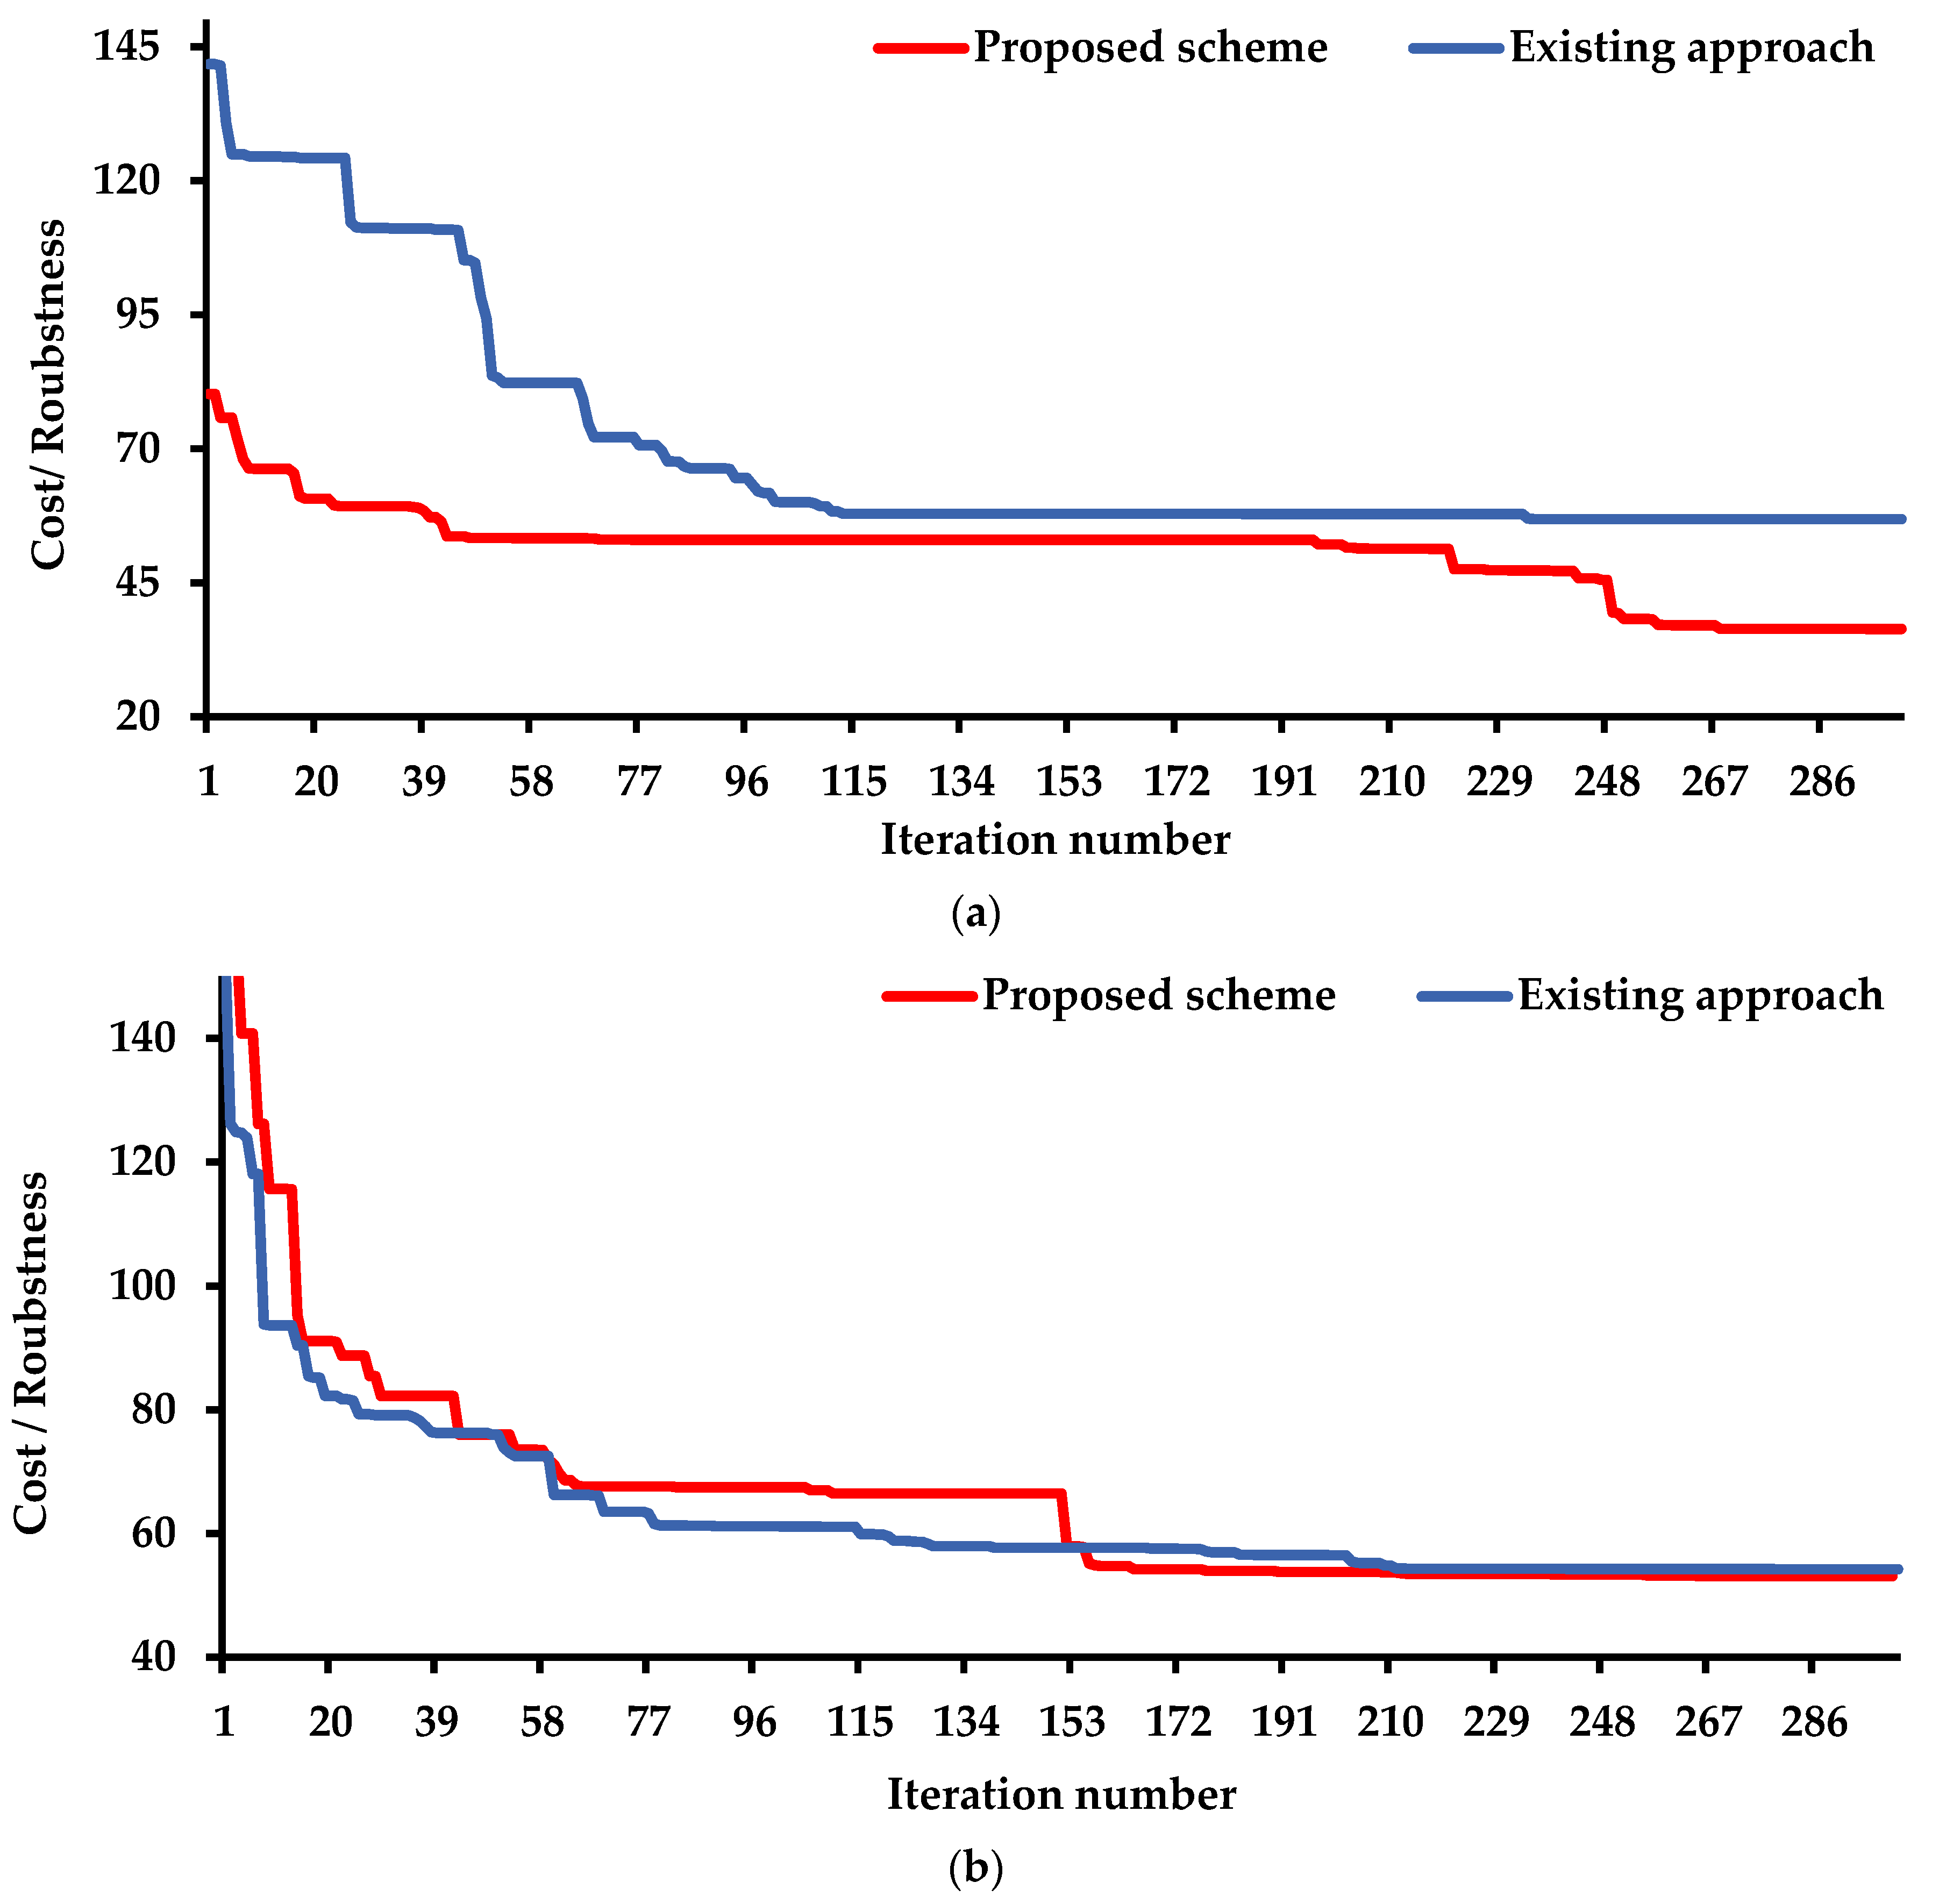
Table 1 summarizes the results gained for the Garver network. The first model’s results showed effective circuit planning through the lines’ impedance. Both approaches gave approximately the same solutions (see Figure 8a). The best-case planning cost was approximately 62.8 million USD. The results reported that there was no need for ESSs. The candidate circuits and the capacity of the generation units were economically and technically sufficient to meet the loads. The statistical analysis proved the superiority of the proposed method in terms of standard deviations (SD) and the mean, as shown in Table 1. The means were approximately 65.9 million USD and 68.49 million USD for the proposed and existing approaches, respectively. The SD was 2.19 and 2.65 for both, respectively. The proposed approach was robust, and out of ten runs, it reached the best solution five times. The execution times of both methods are almost equal. The proposed method needed 98.51 s, while the conventional approach consumed 100.16 s to conduct one run.
Table 1 also explains that the circuits and TCSCs planning scheme (the second model) was more efficient in reaching better solutions than the existing method. The proposed approach sped up the convergence to the best solution. The time required for executing one run was approximately 105.3 s for the proposed strategy, whereas the convergence time of the conventional approach was approximately 142.23 s. The convergence curves are described in Figure 8b. The supremacy also appeared in the value of SD, robustness measurement, and the mean of the obtained solutions. The best SD and mean were 1.585 and 60.1 million USD, respectively.
The results showed that increasing the number of projects planned reduced the efficacy of the conventional scheme and increased the convergence time compared to the suggested approach. When the SVC model was considered, the decision-making variables increased for the traditional approach. However, the proposed approach kept the number of variables constant. Table 1 indicates that the proposed method prompted the RKWSO to give better solutions. The best solution obtained by the proposed approach costs 54.41 million USD, while the best solution calculated by the conventional approach costs 54.655 million USD. It is worth noting that the standard deviations were 3.05 and 3.218 for the solutions gained by the proposed and conventional approaches, respectively. The G&TNEP-based decision-making approach could conserve its robustness, although extra projects were planned. The convergence curves of both methods are described in Figure 8c.
When the FCL’s planning problem was considered, the superiority of the proposed problem was also noticed. The best configuration planned by the proposed approach costs 54.85 million USD, whereas it costs 55.87 million USD using the conventional approach, as shown in Figure 8d. Table 1 proved that the proposed approach was also superior in terms of SD. The standard deviation was 3.26 and 3.68 for both methods, respectively. Although the robustness of the proposed method decreased compared to its value in the third model, it was still higher than the robustness of the conventional approach. The proposed approach enabled the RKWSO to converge faster.
When the RESs expansion model was considered, and two types of ESSs were compared in the co-planning model, the problem complexity increased even more. The fifth model was examined by simulating two HC levels, of 30% and 0%, and by decreasing the maximum capacity of the thermal unit at bus 6 to 160 MW. The results showed the efficiency of the proposed strategy in optimally integrating the RESs into the power systems. The proposed methodology could compare several types of ESSs without affecting the robustness of the solvers. On the other hand, the performance of the conventional approach was affected by the increase in the research space. This is noticed in the SD, mean, and robustness measurement values. The convergence curves are explained in Figure 8d,f.
Based on all of the above results, it can be concluded that the proposed solution method significantly contributed to improving the performance of RKWSO. Although the Garver network was a small-scale testing system, increasing the projects considerably affected the performance of the employed algorithm. The proposed approach kept the number of decision variables as constant as possible. It encouraged comparing several types of projects without increasing the problem’s complexity.

5.2.2. Technical and Economic Analysis

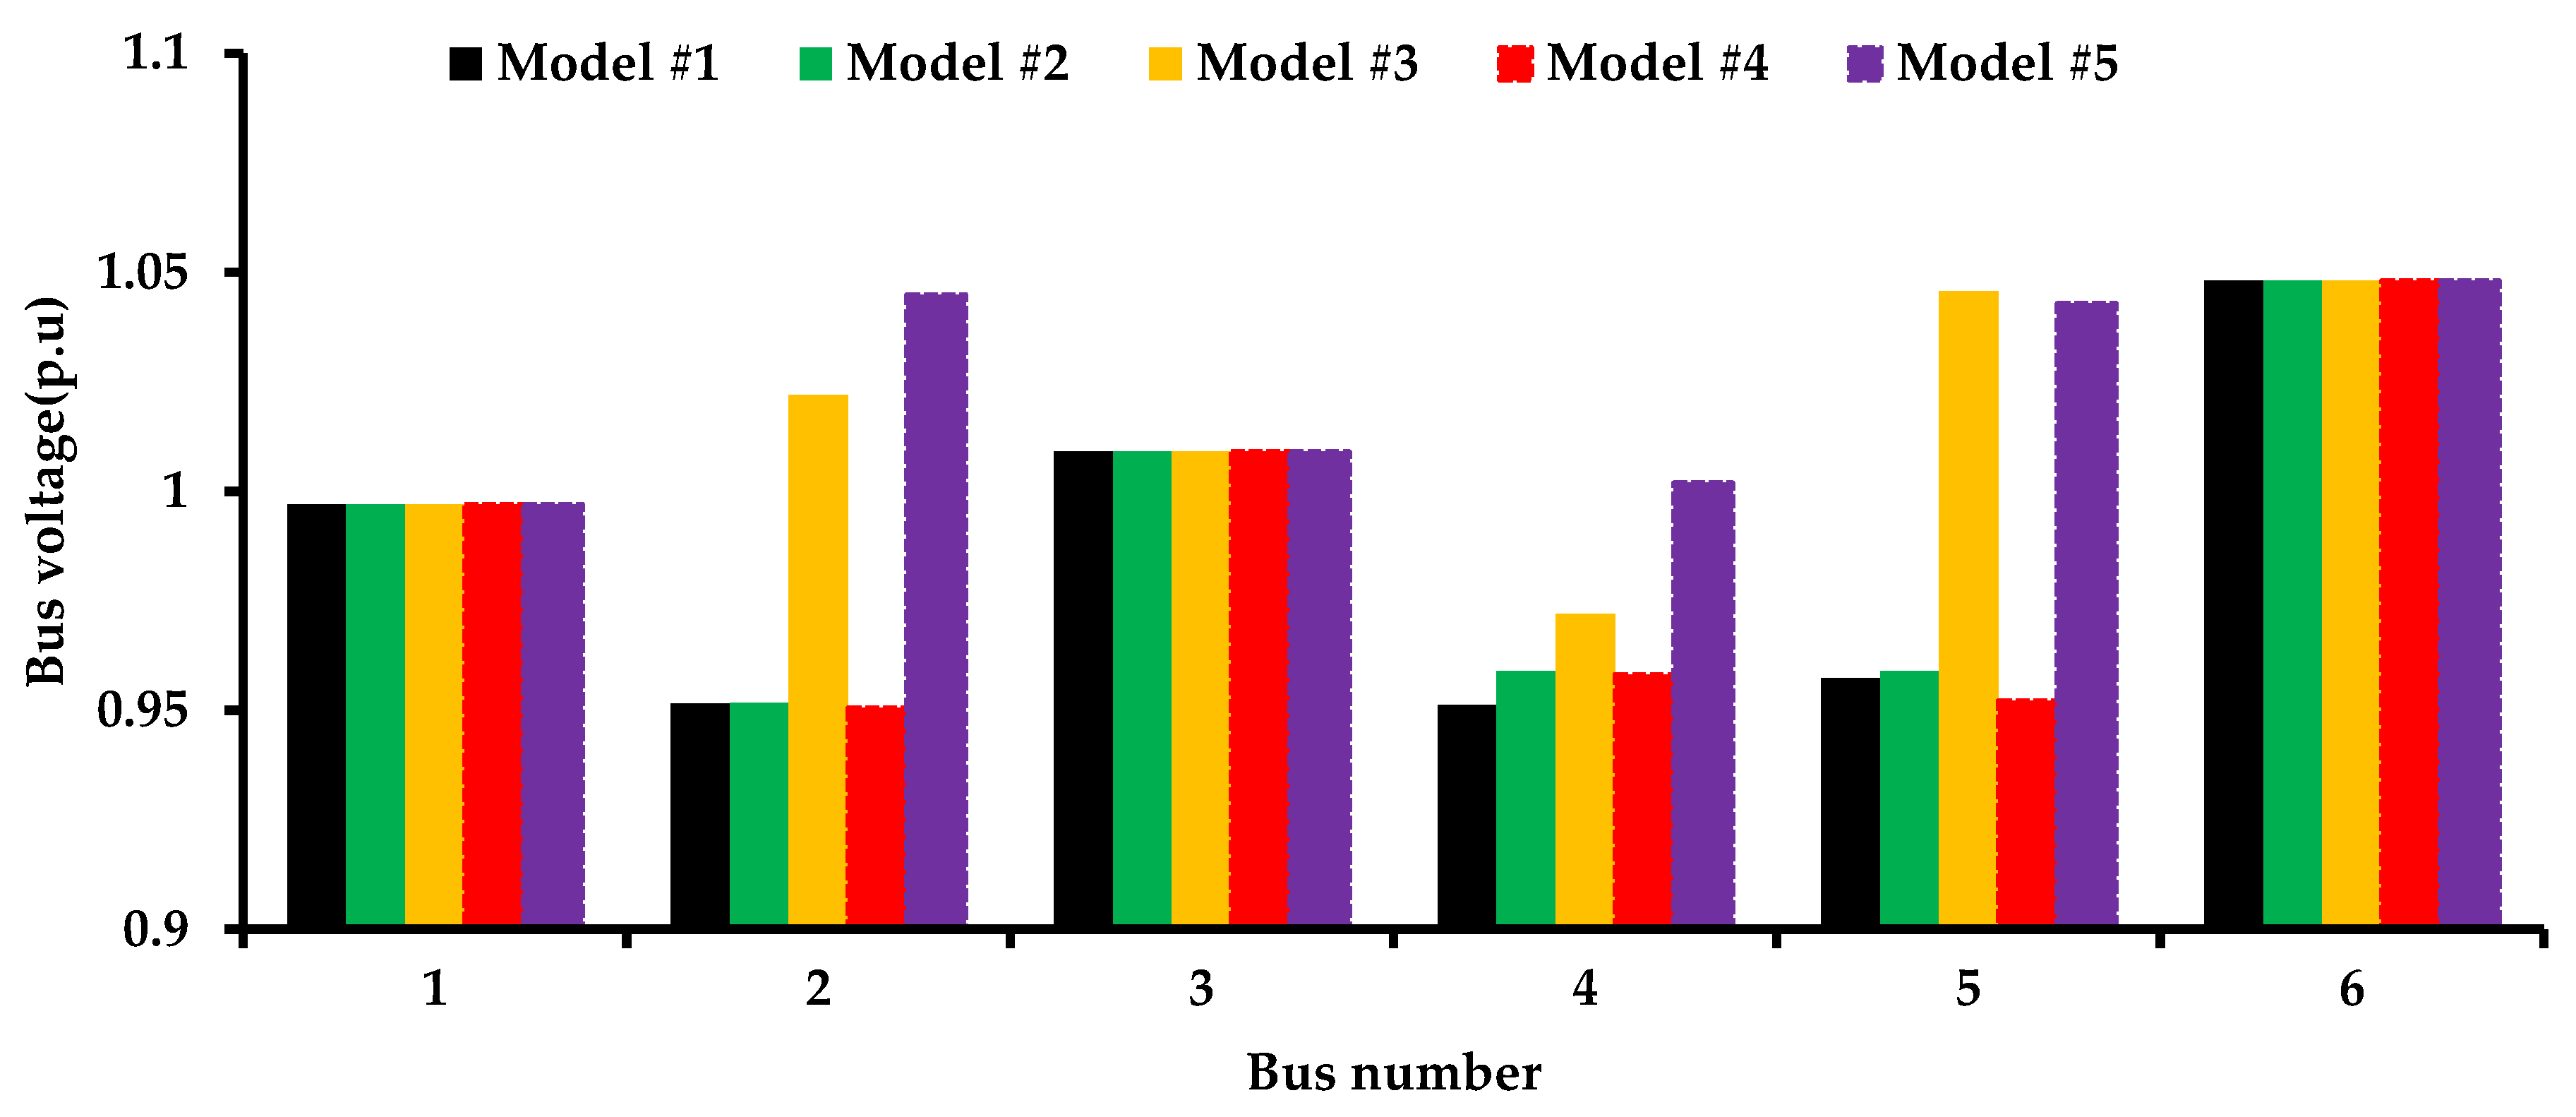
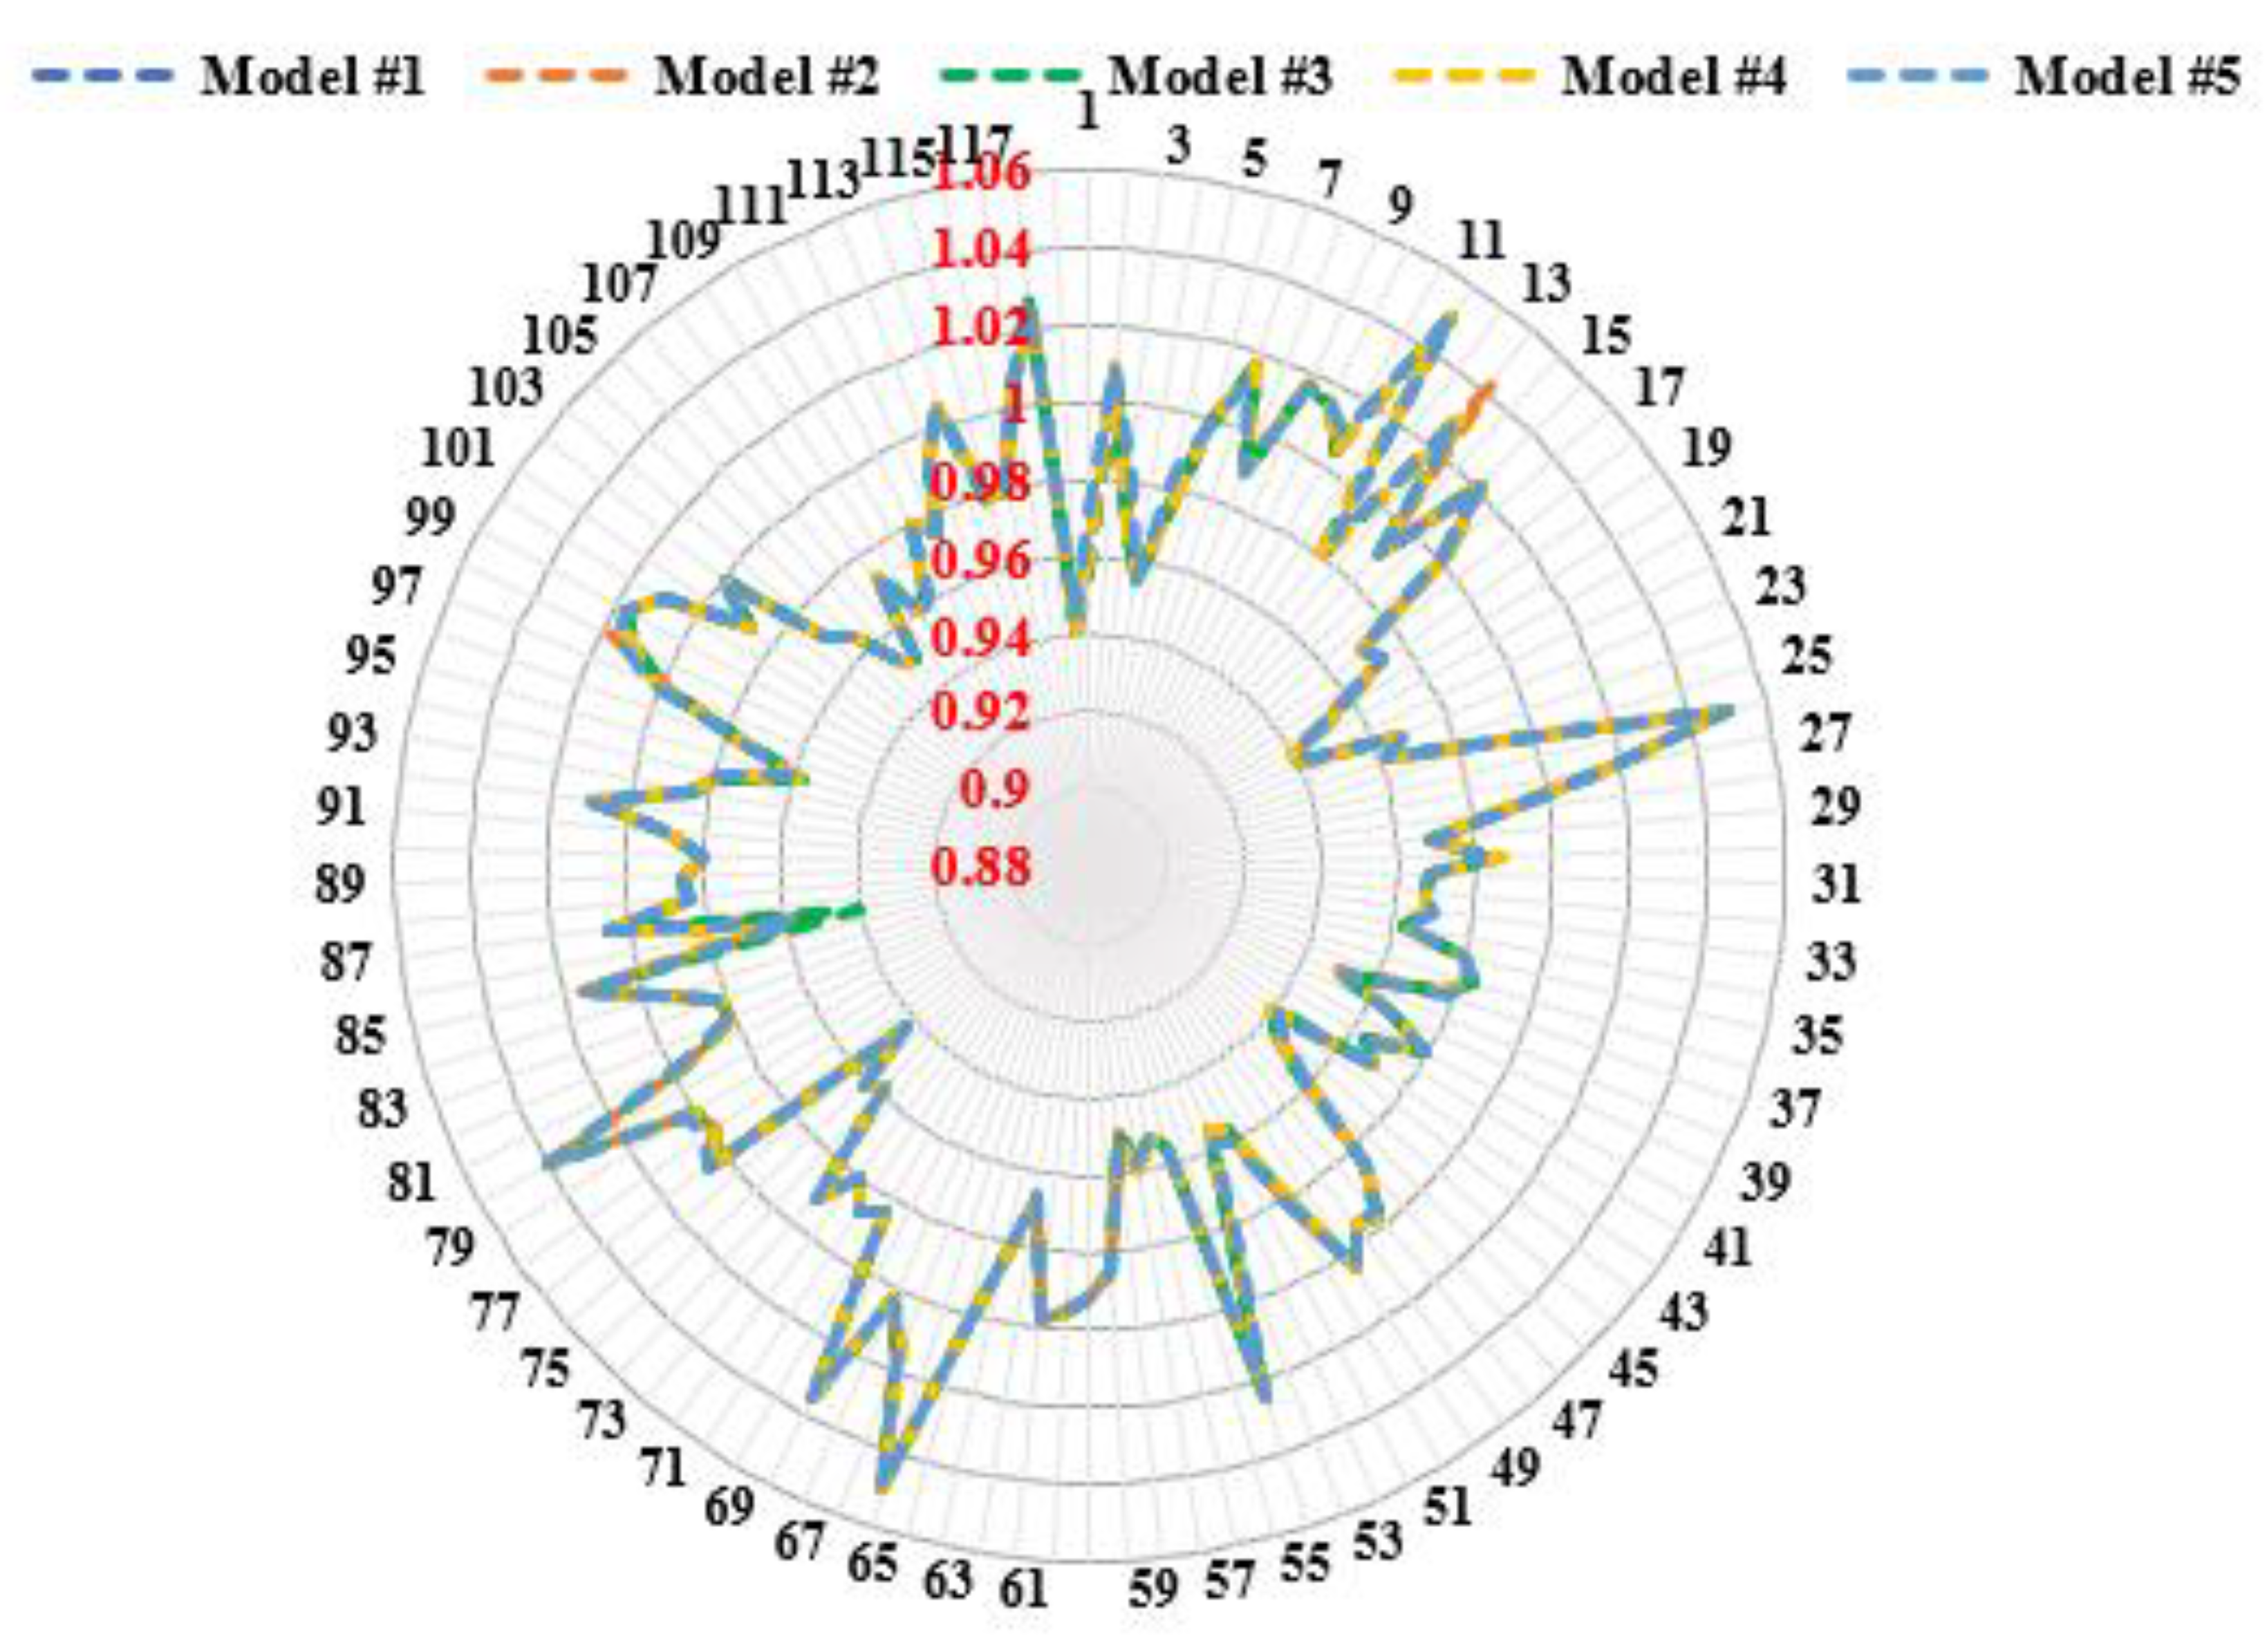
Figure 9 illustrates the economic impact of including TCSCs, SVCs, ESS, and short-circuit constraints on the G&TNEP. The results showed that using TCSCs decreased the planning cost by 6.31 million USD compared to the first model. The TCSCs increased the circuit capacity, and the system could compensate for the increase in the power flow through the transmission lines. The technical analysis showed that the use of TCSCs did not affect the voltage stability. The buses’ voltages were still within permissible limits, as shown in Figure 10.
The results also indicated that the mix of TCSCs and SVCs struck a balance between the technical and economic requirements. An improvement in the voltage stability was observed, as depicted in Figure 10. In addition, the use of SVCs reduced the cost by 2.1 million USD compared to the use of TCSCs only, and by 8.41 million USD in the case of using neither SVCs nor TCSCs, as explained in Figure 9.
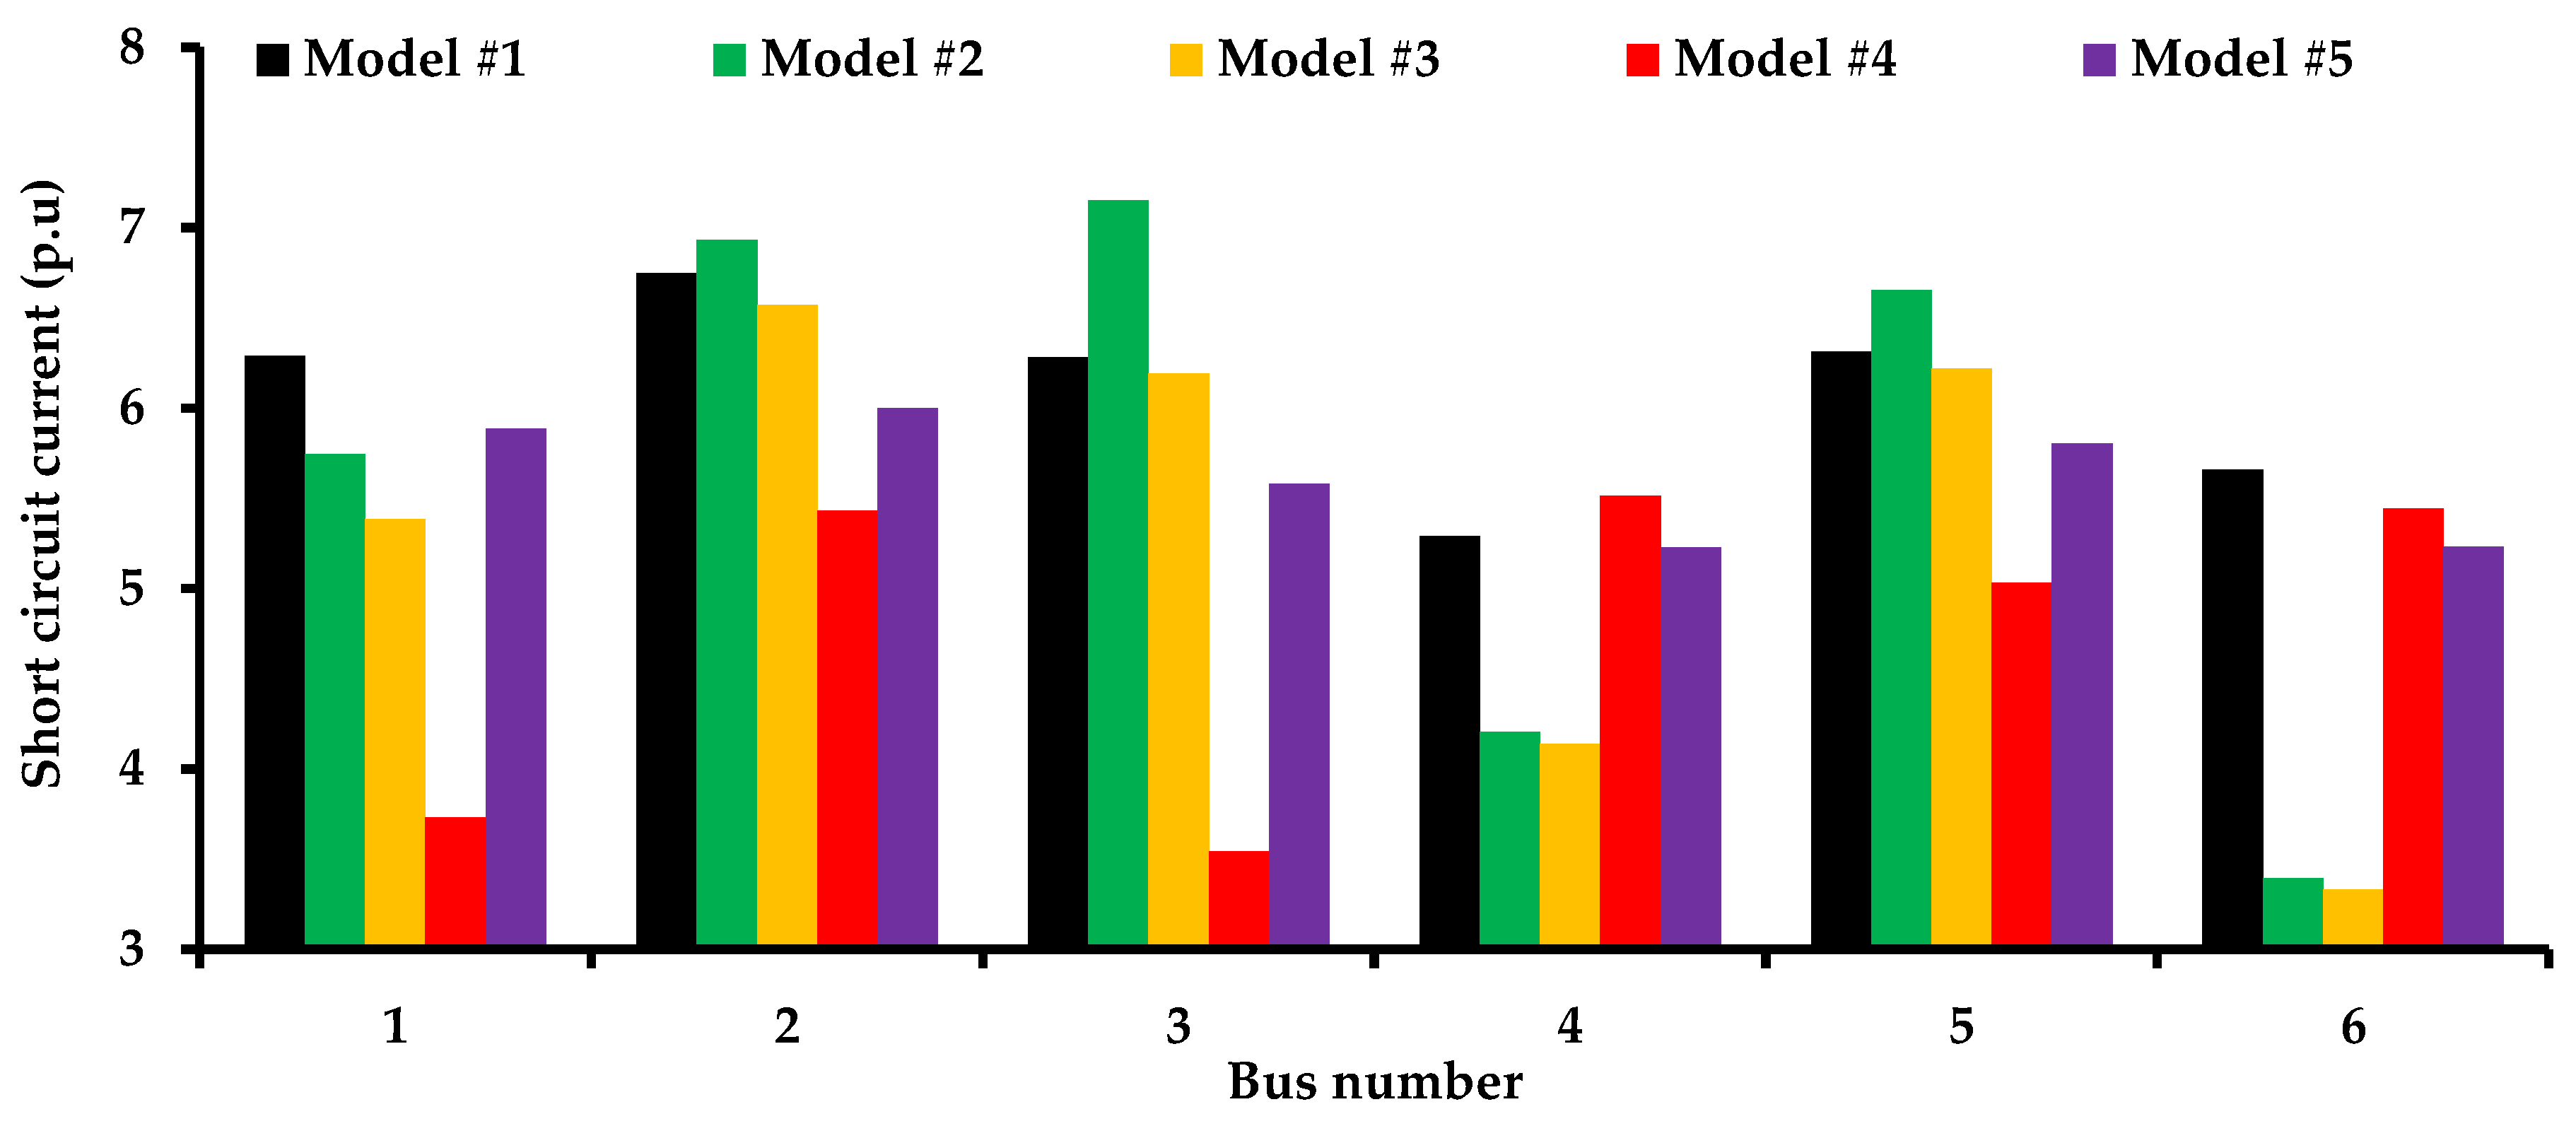
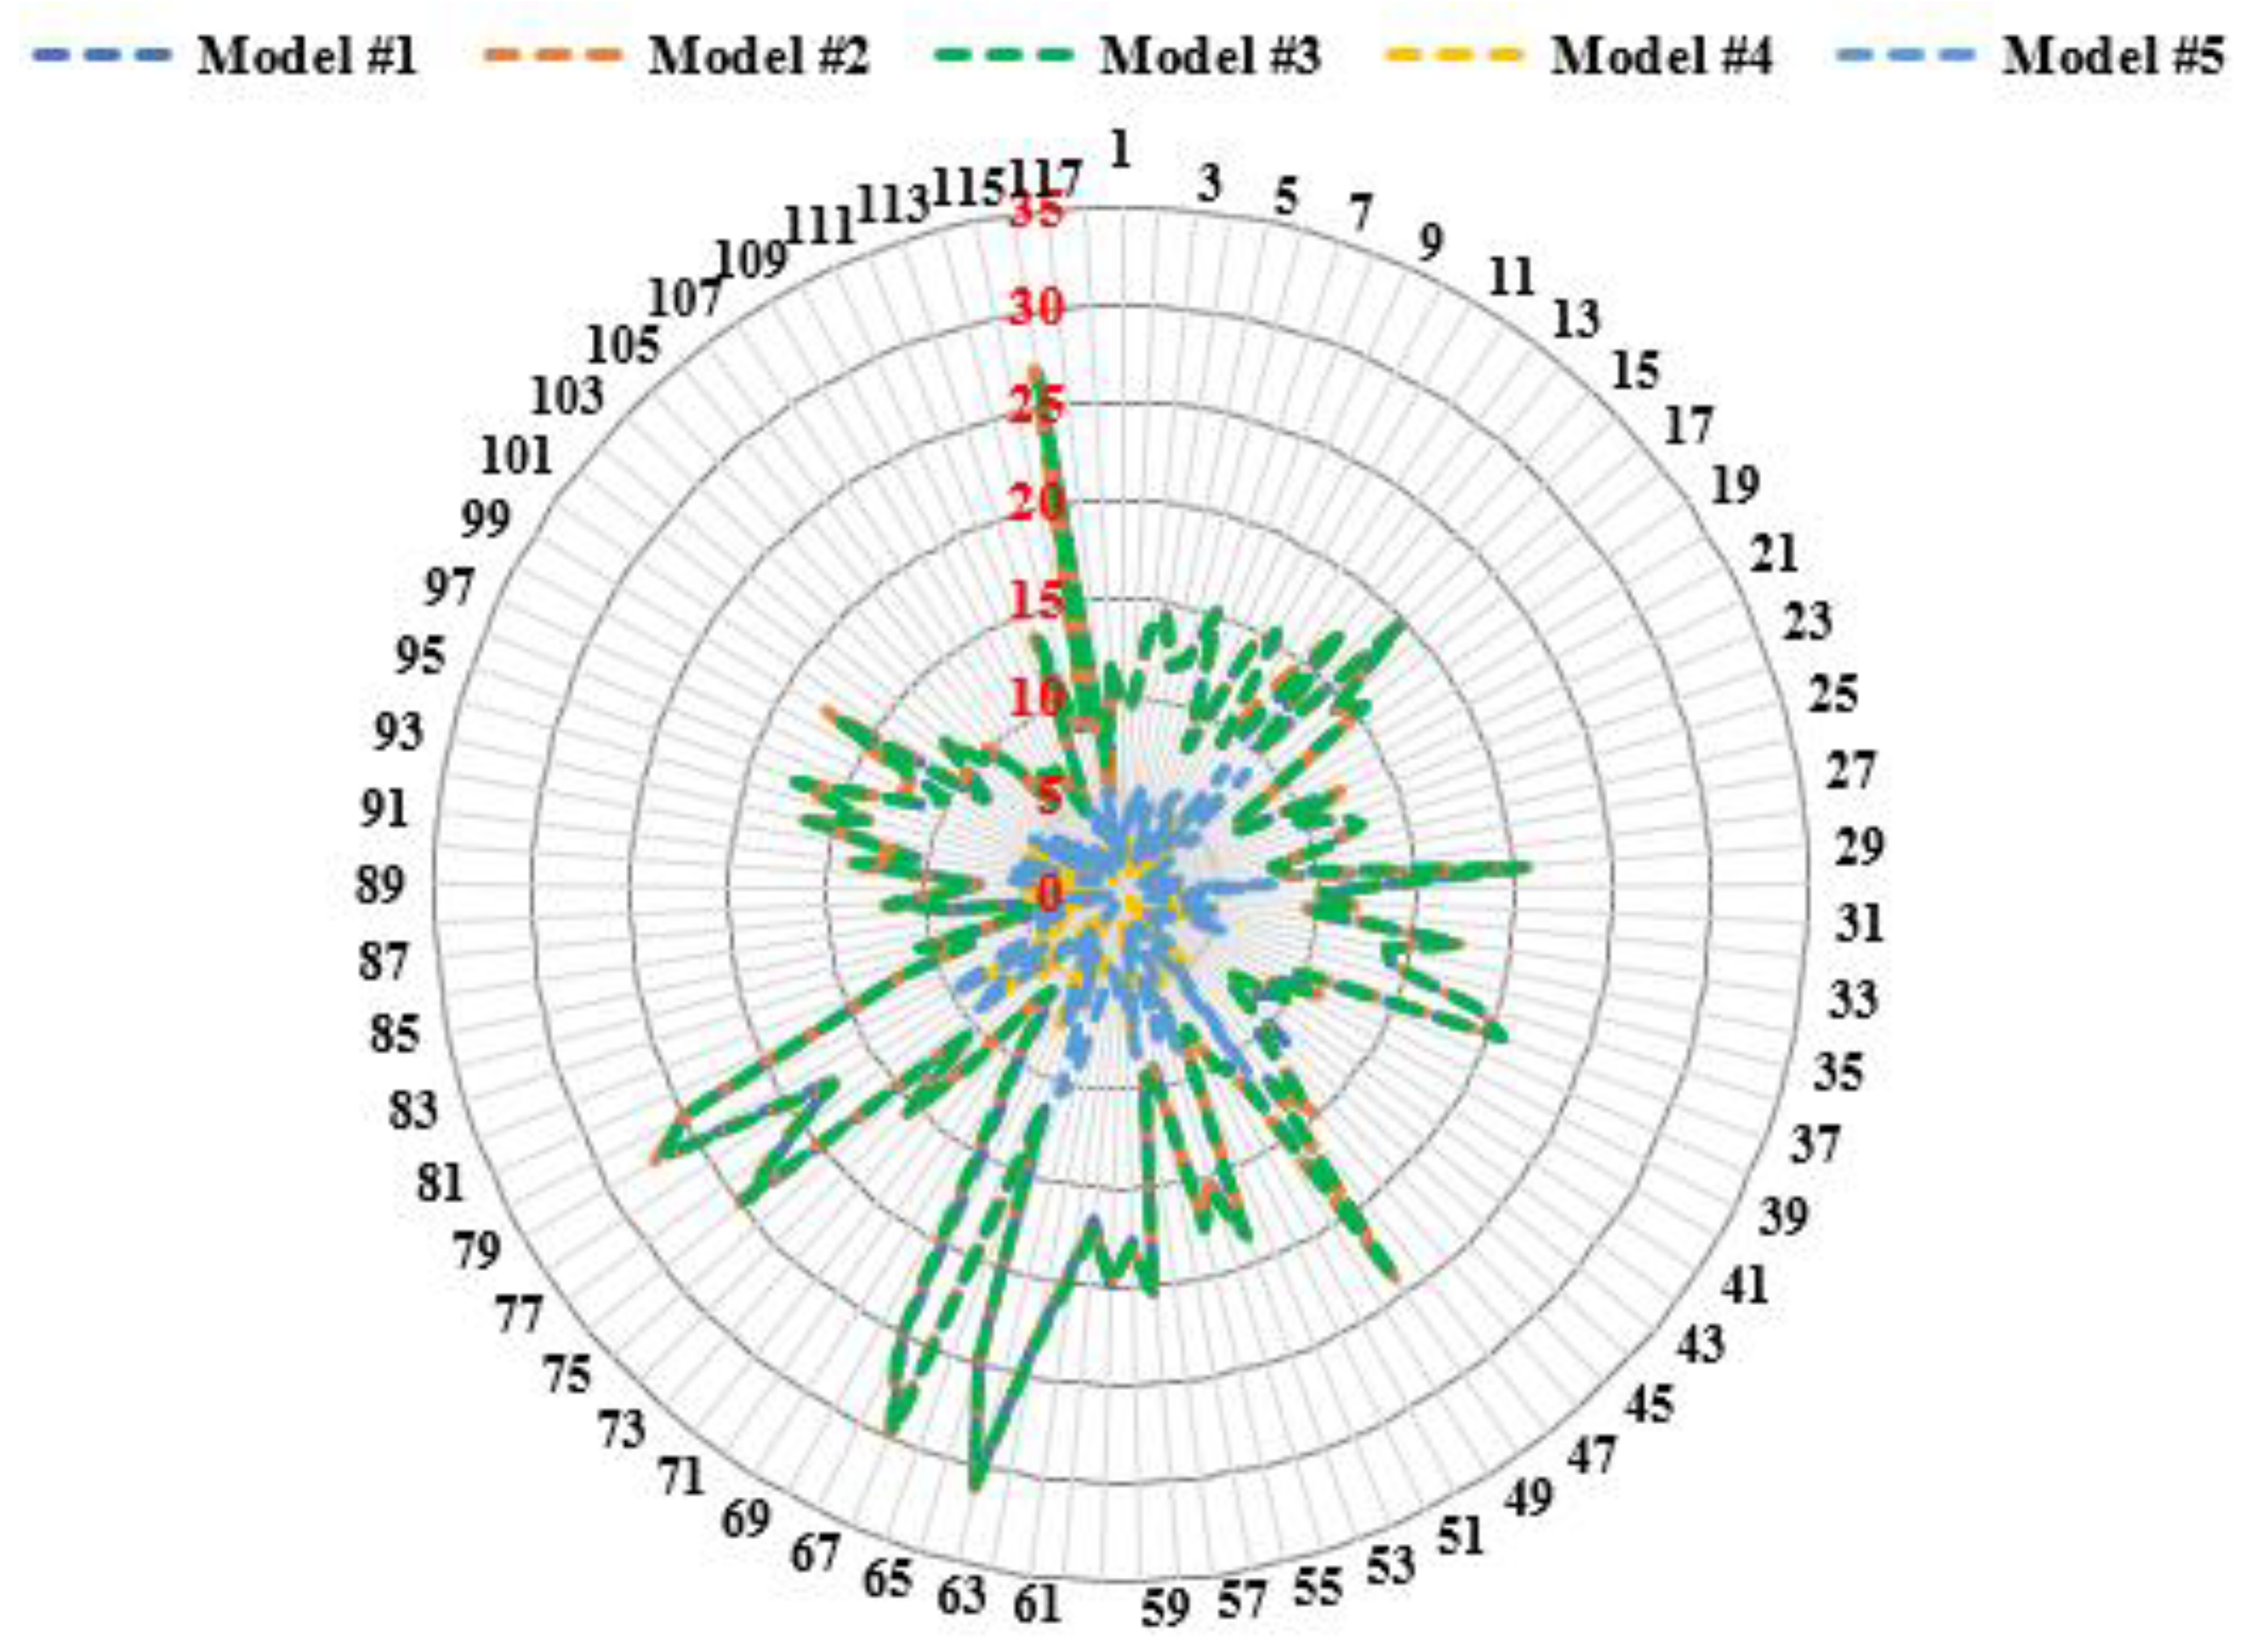
Embedding FCLs was essential for maintaining the short circuit current below 6 p.u, as shown in Figure 11. The use of FCLs slightly increased the planning cost. The calculated cost exceeded the cost of the third model by 0.44 million USD. It is worth remarking that using ESSs was not economically preferred compared to other facilities.
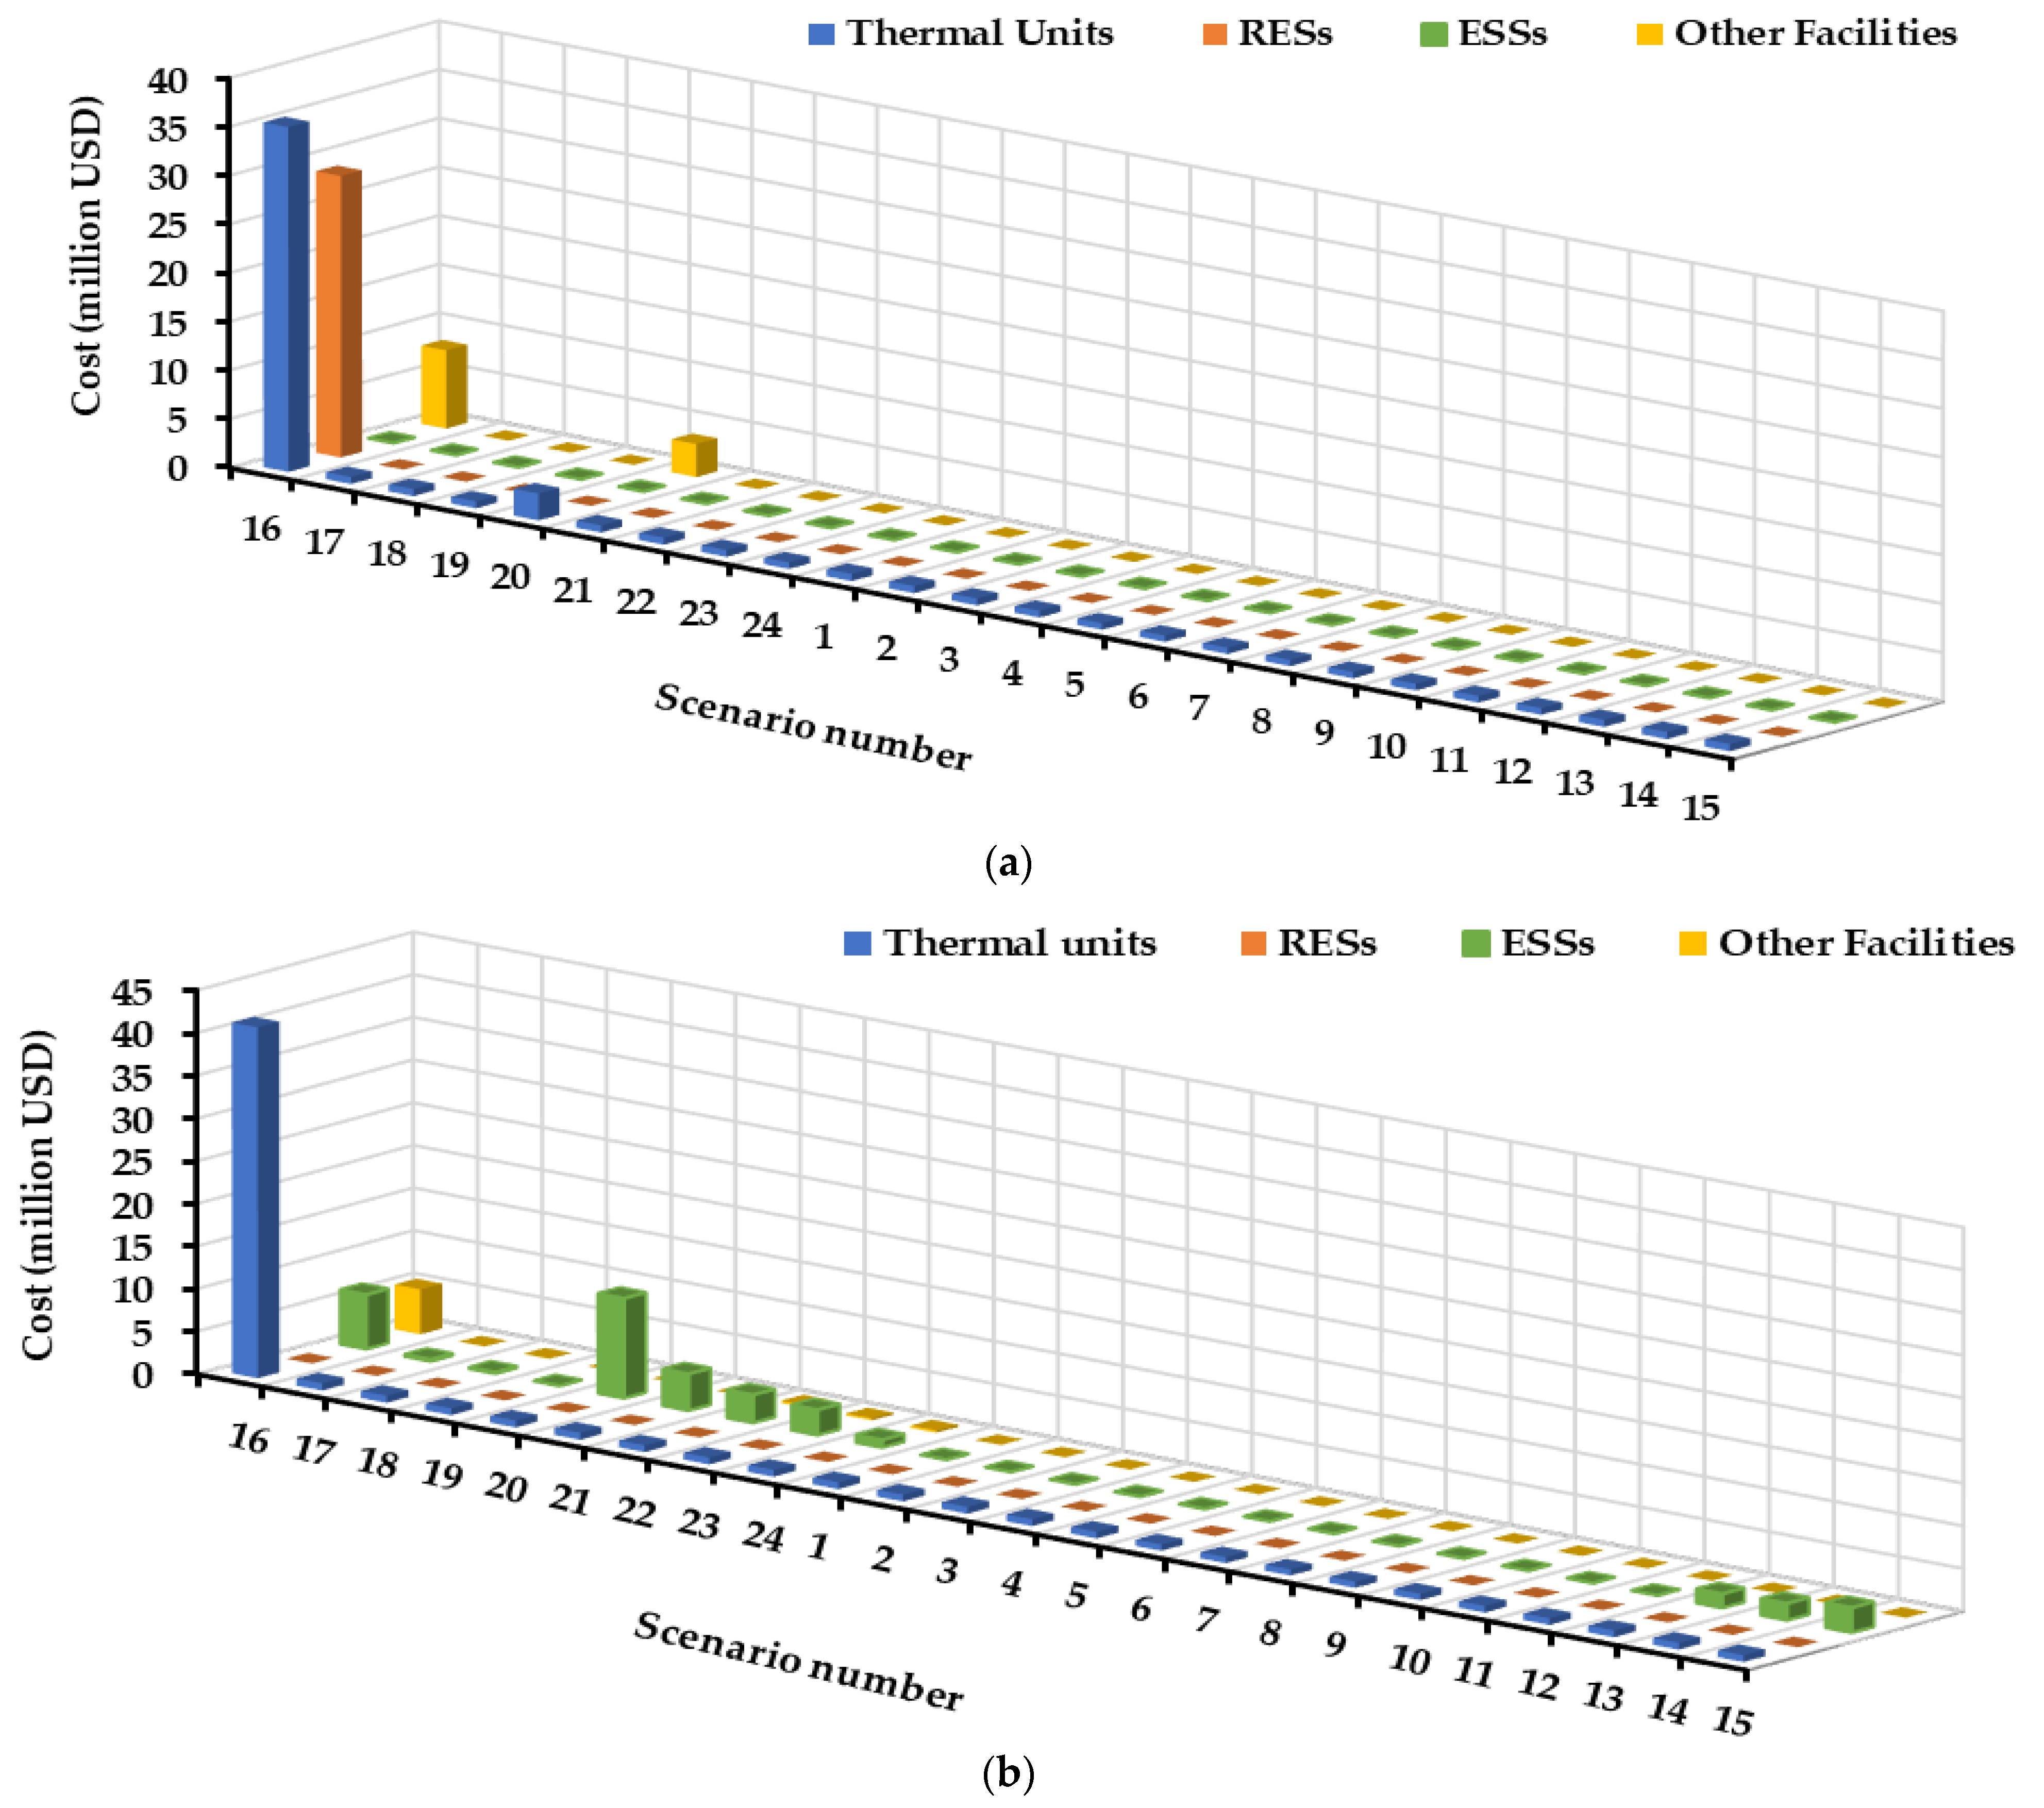
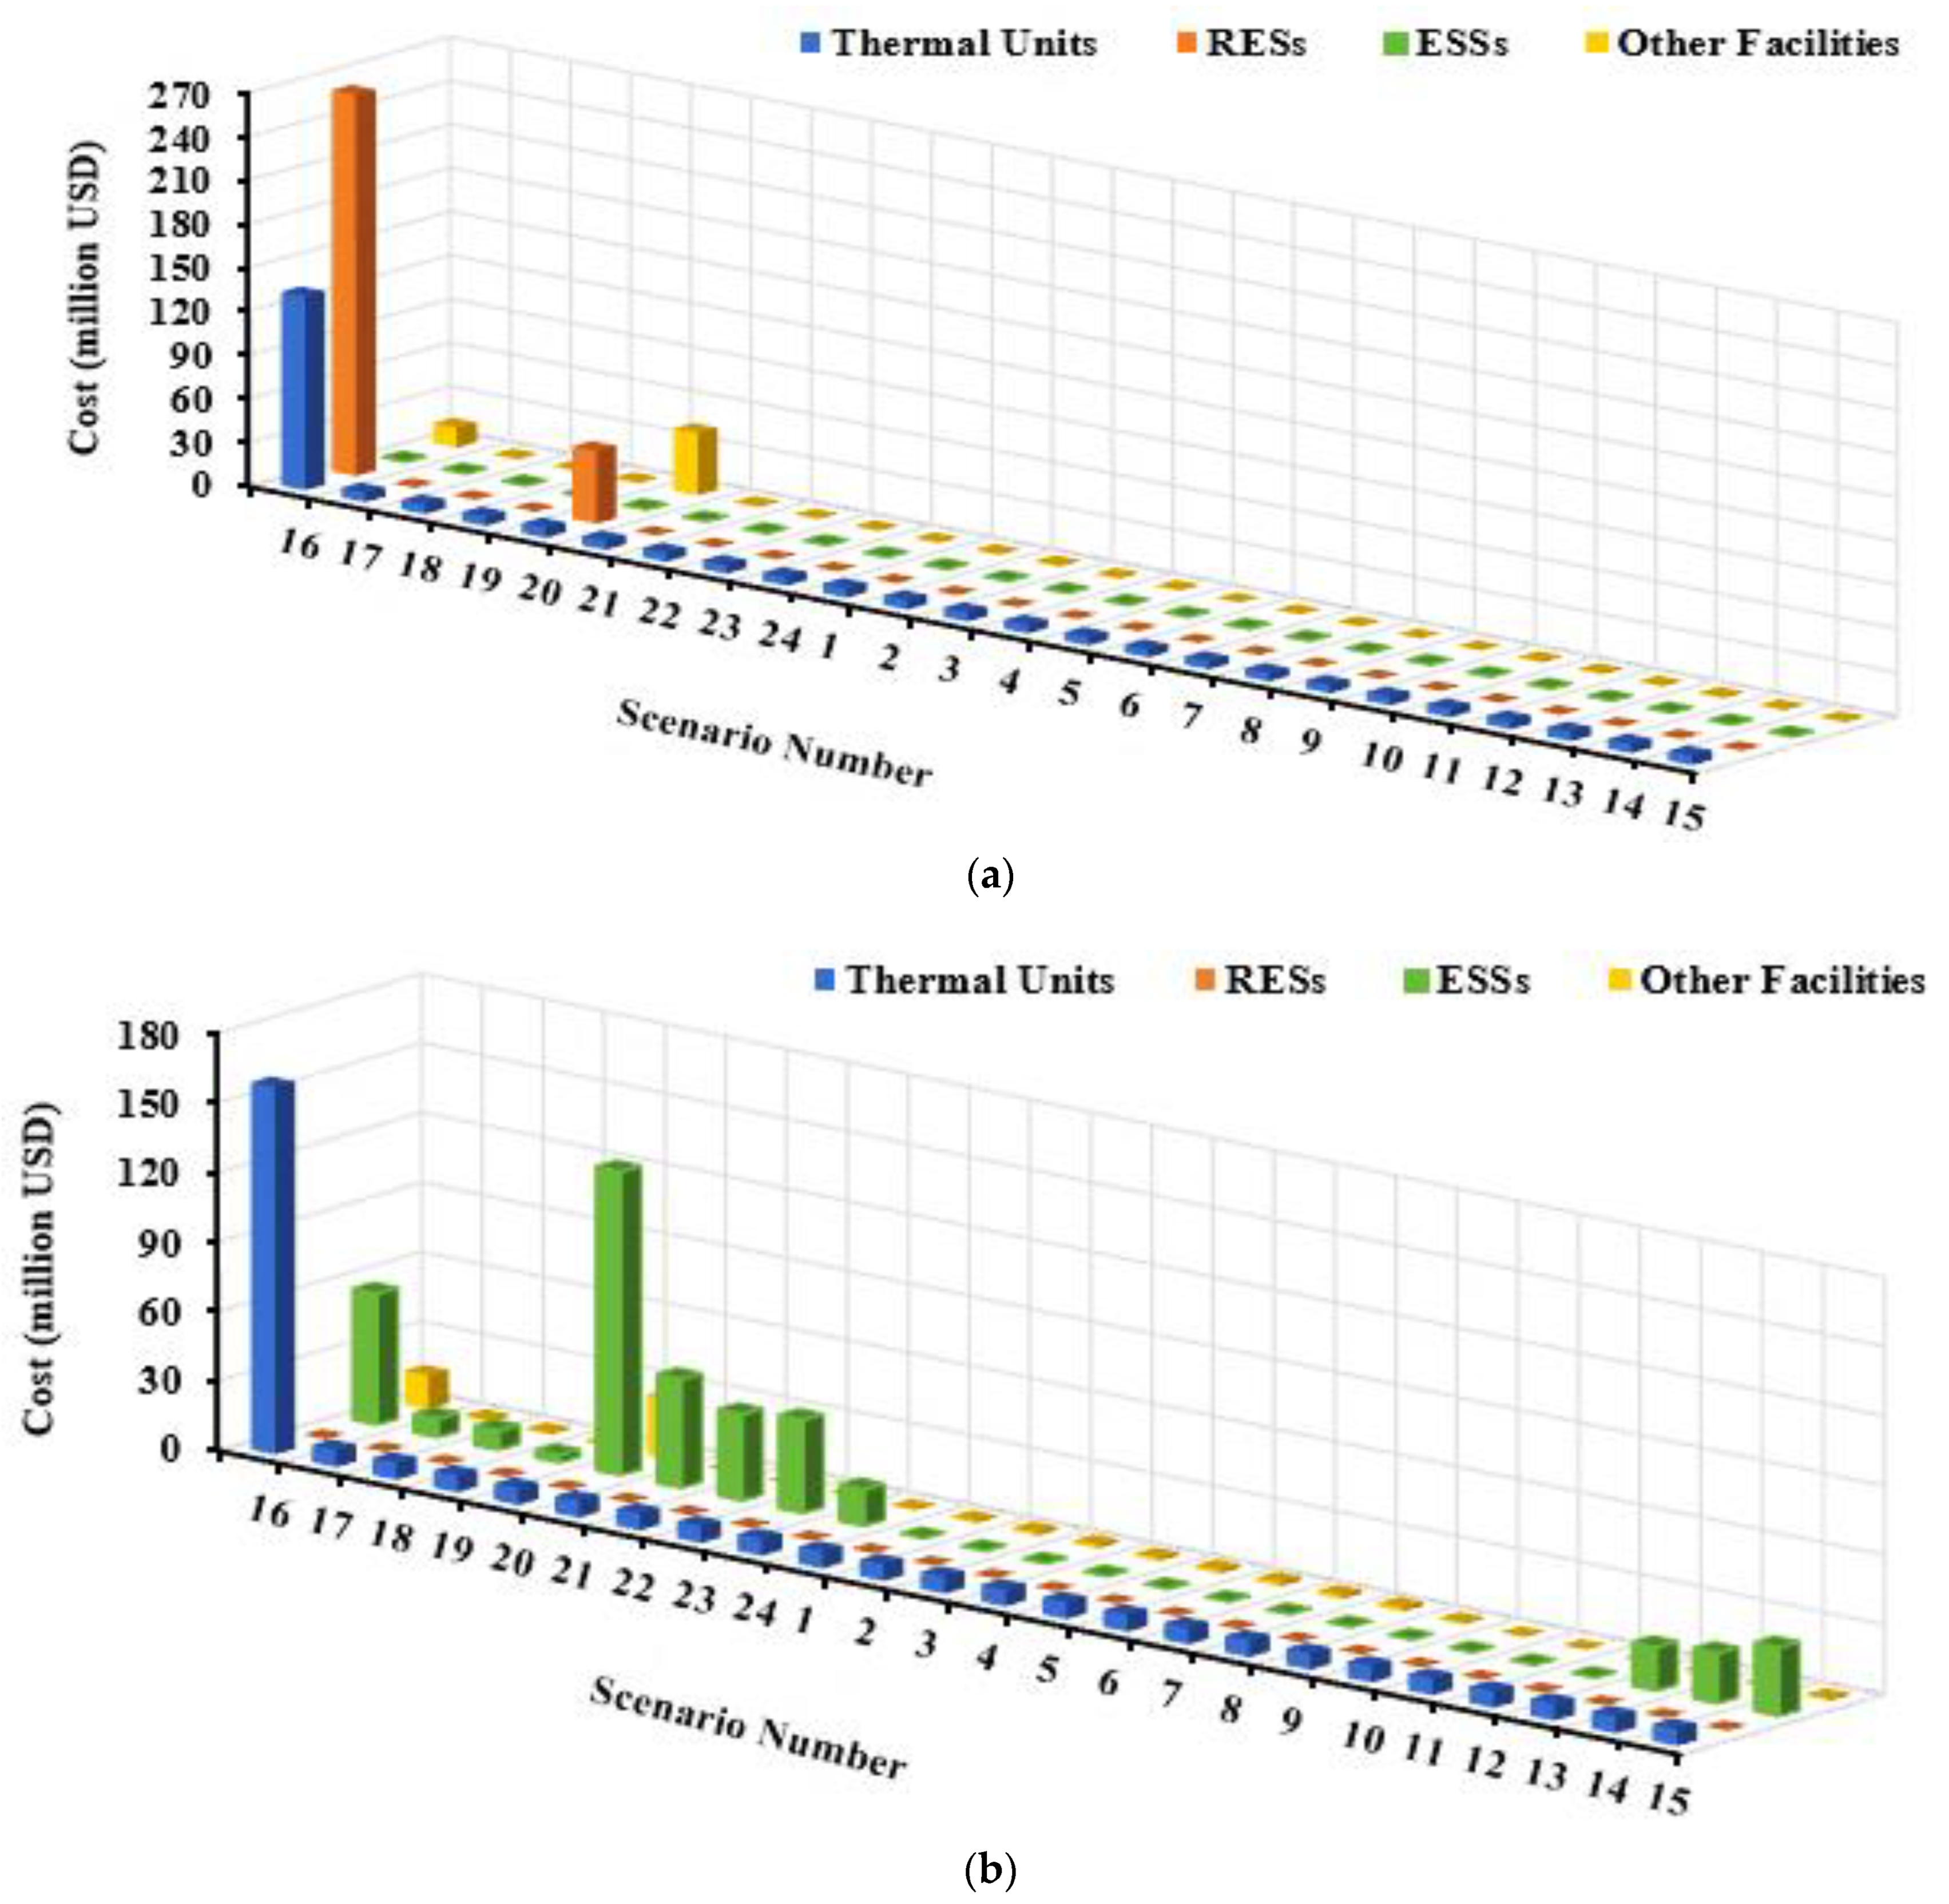
Two HC levels were proposed to assess the approach’s capability in controlling the HC and regulating the various types of ESSs. For HCmin equaling 30%, there was no need for ESSs, and the output of the wind farms was sufficient to supply the loads over the course of 24 h. The results showed that using PV systems was unsuitable for achieving the technical and economic targets. A wind farm rated at 228.01 MW was installed. The total planning cost is 94.0337 million USD, and the cost over the 24 scenarios is illustrated in Figure 12a. It is worth mentioning that the thermal units were economically preferred to the wind turbines. Forcing the HC level of the RESs is the only way to integrate RESs when the thermal units’ capacities are sufficient to meet the consumption.
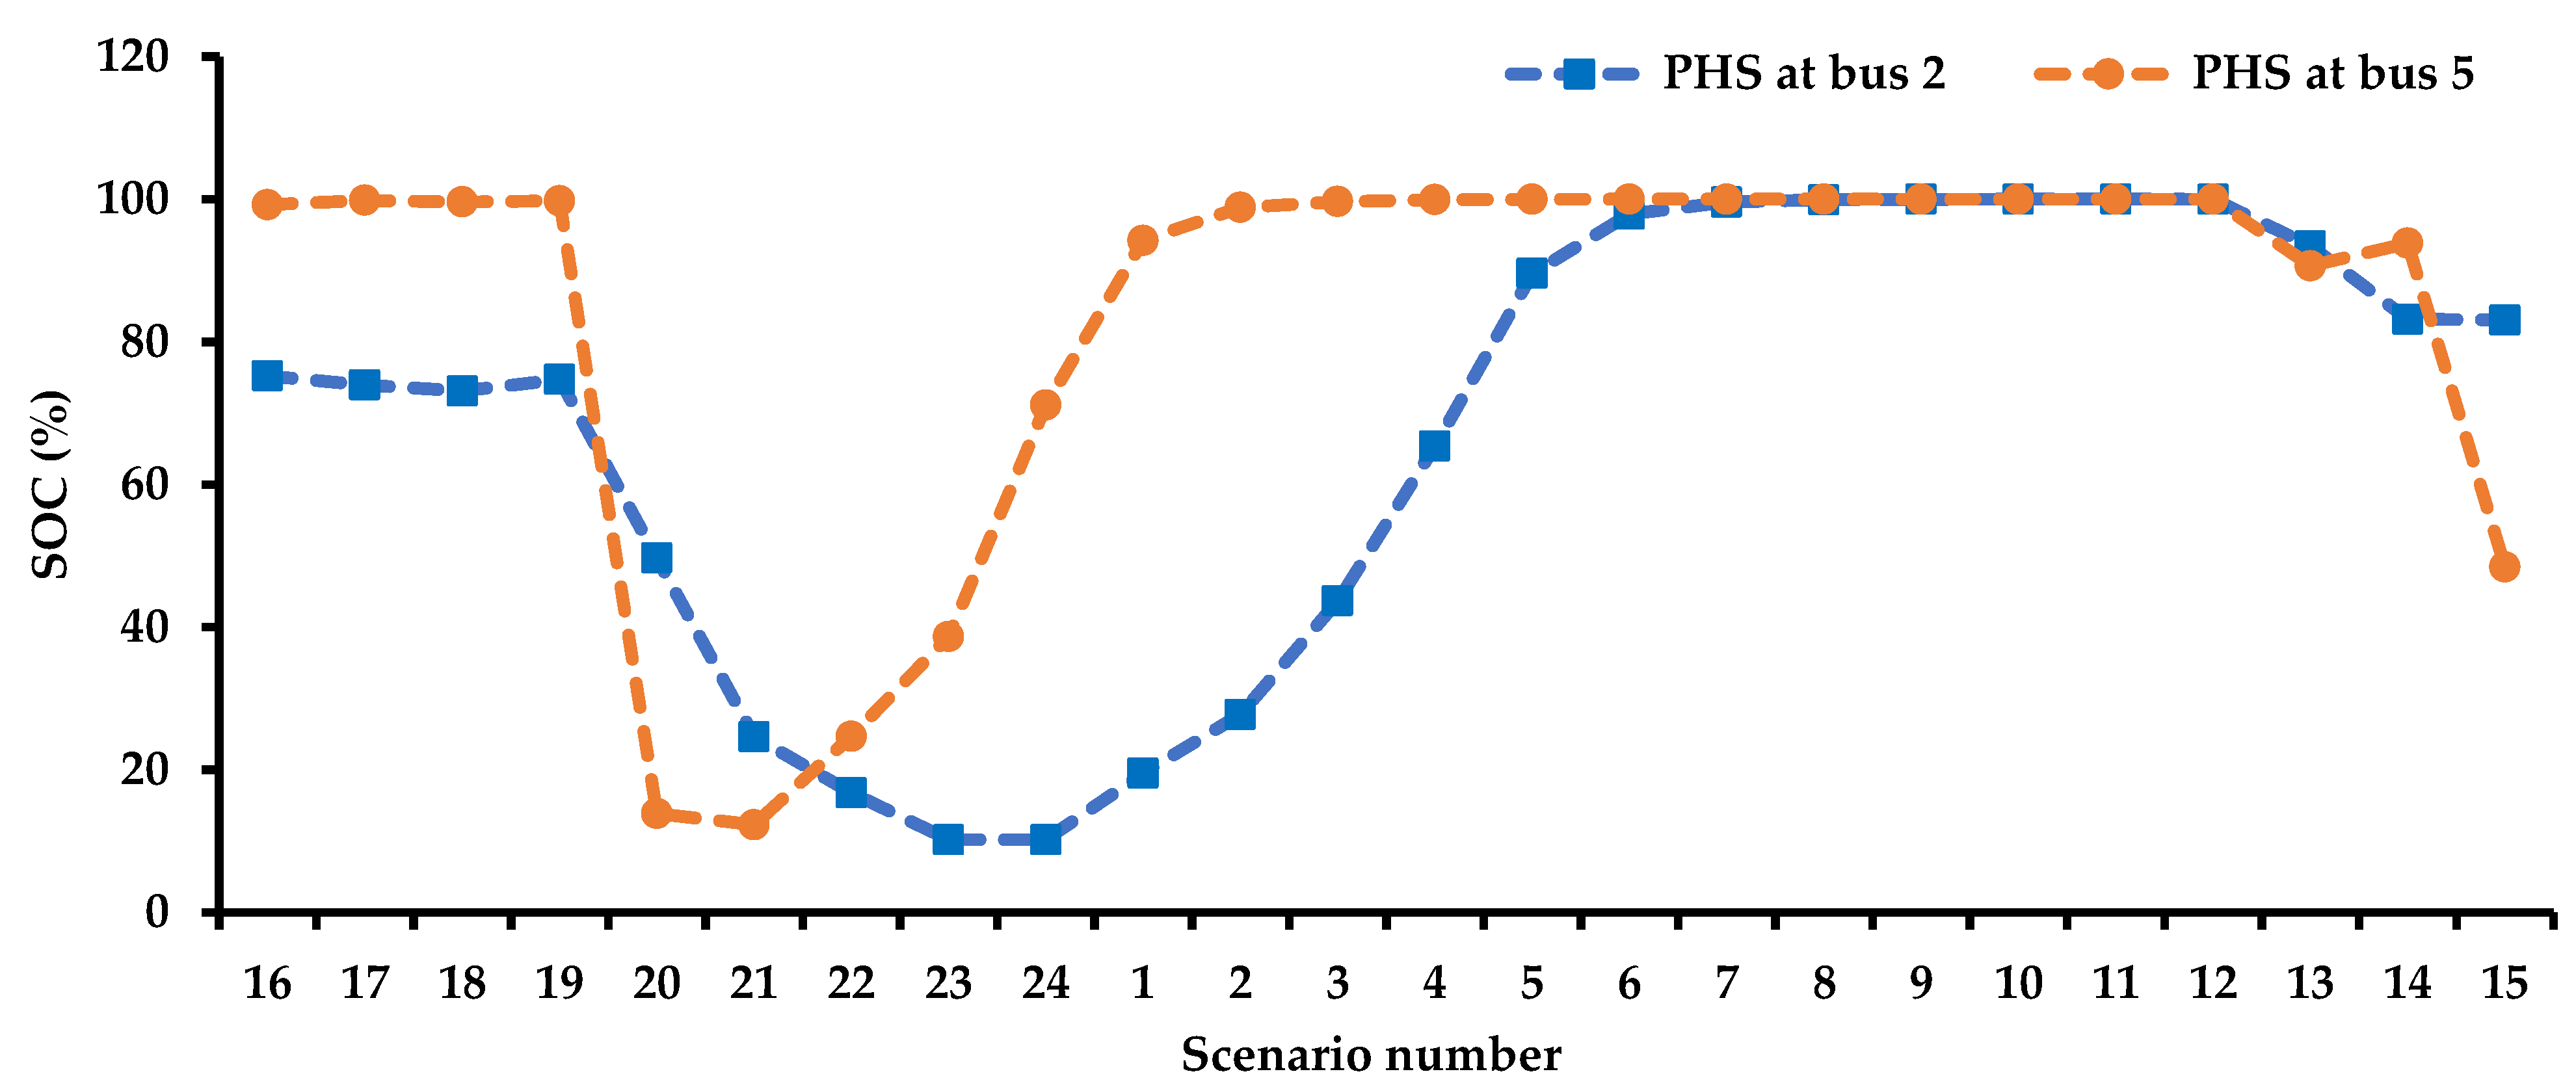
For HC equal to 0%, the unbalance between the generation and consumption was handled by installing ESSs. Two PHS, at buses 2 and 5, with rated capacities of 165 and 55 MWh were enough. The total planning cost was 102.08 million USD. The planning cost and the SOC of the PHS over the 24 scenarios are shown in Figure 12b and Figure 13, respectively.
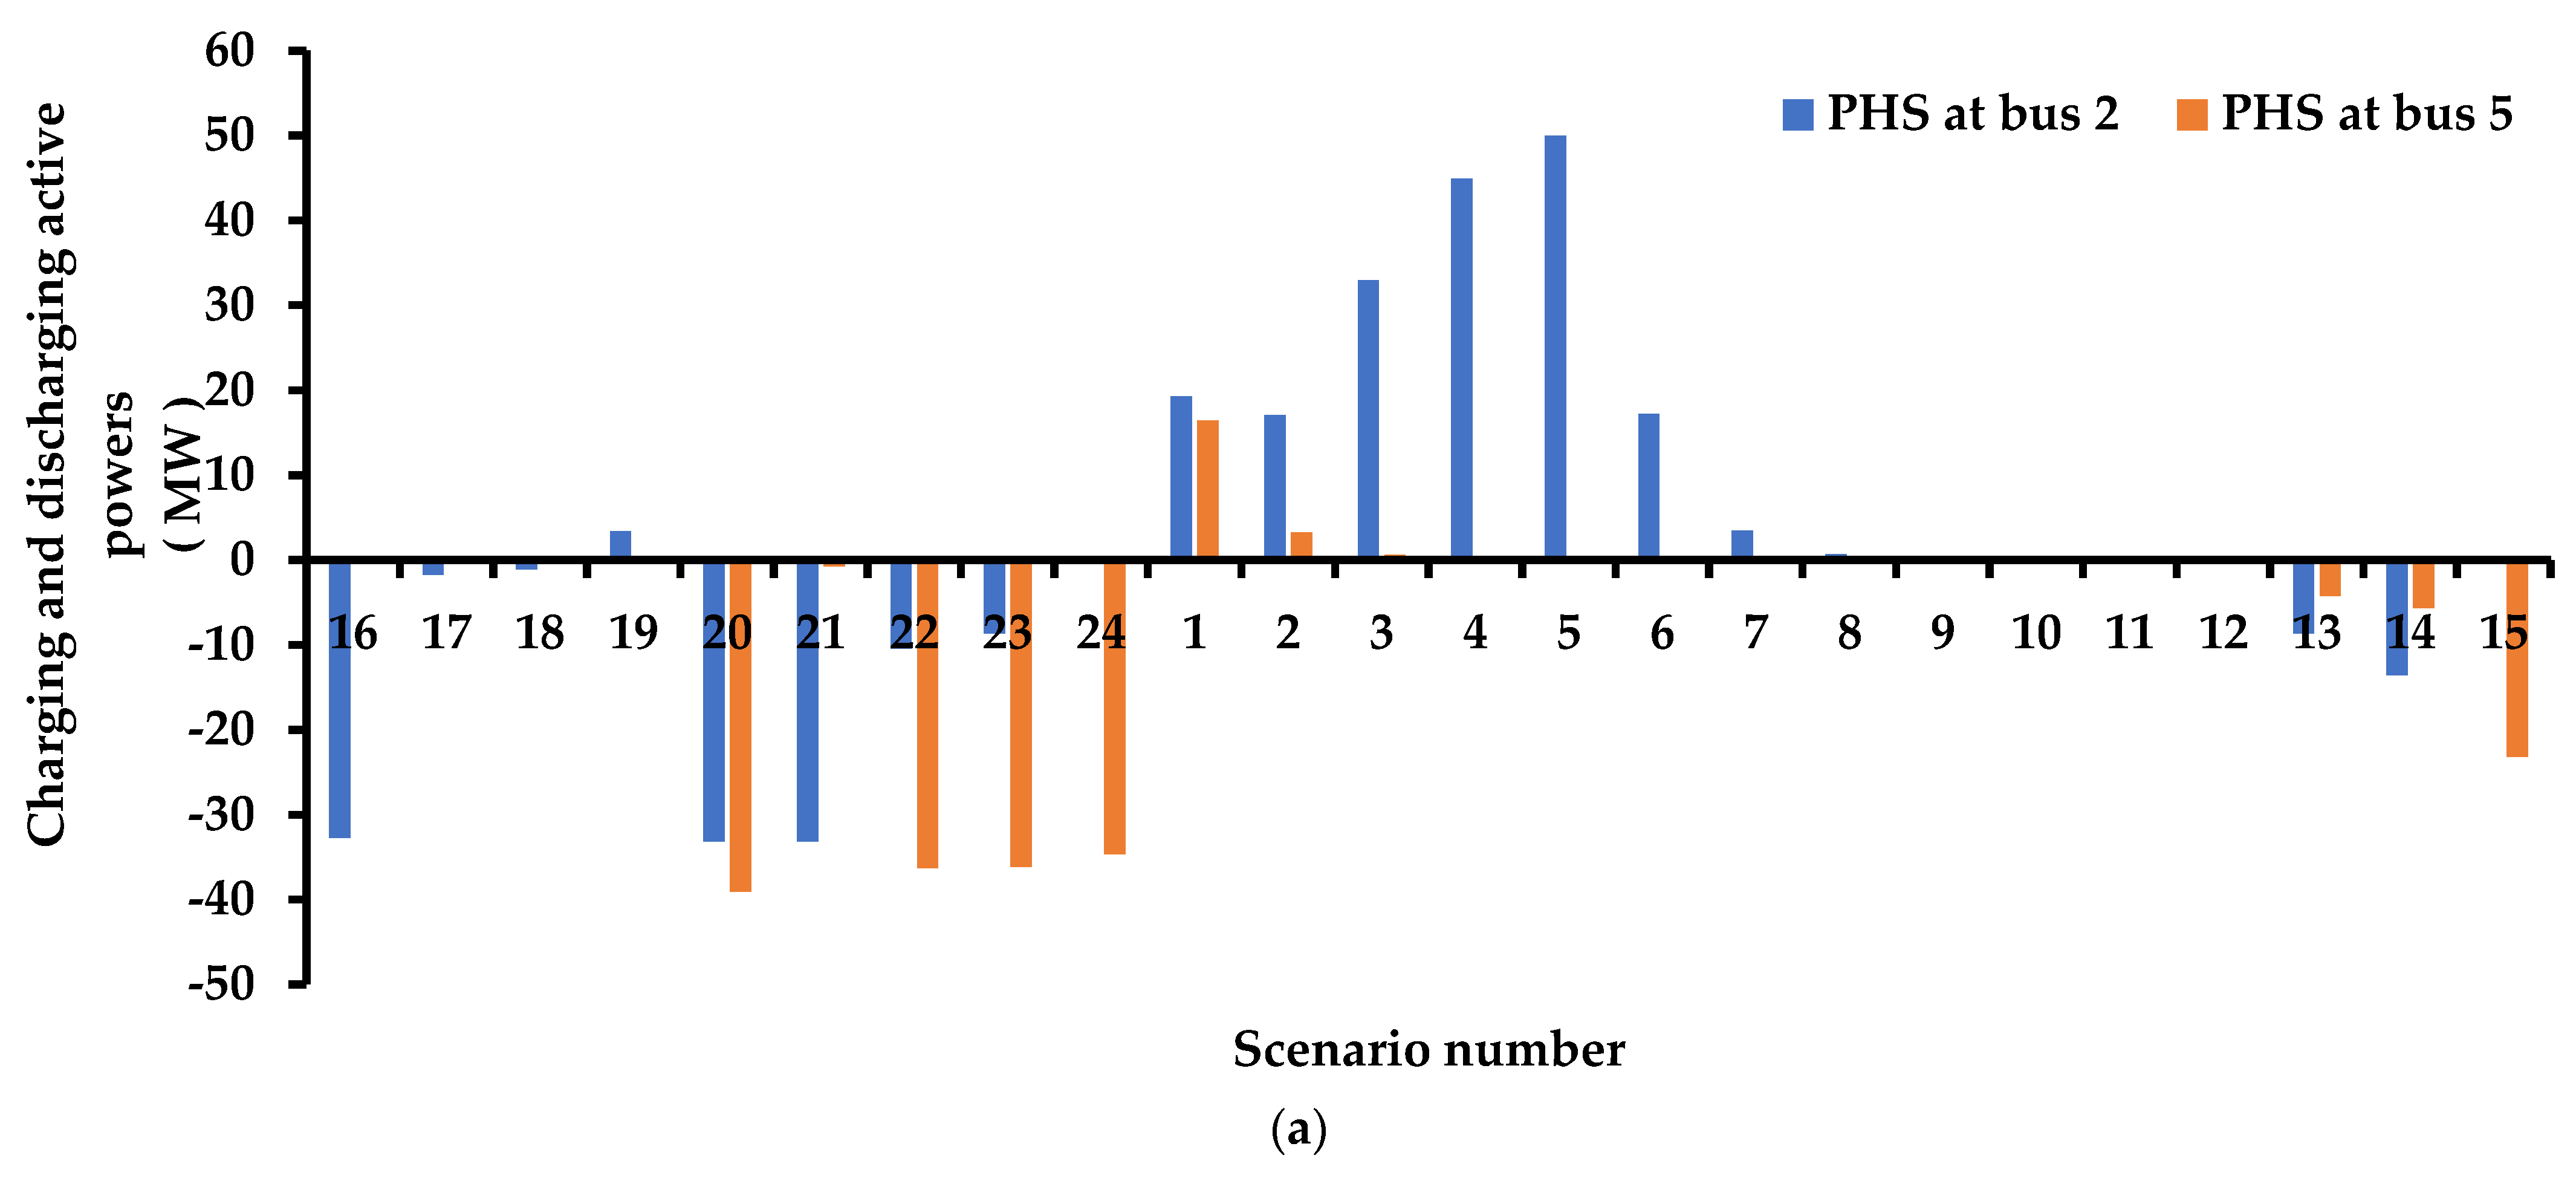
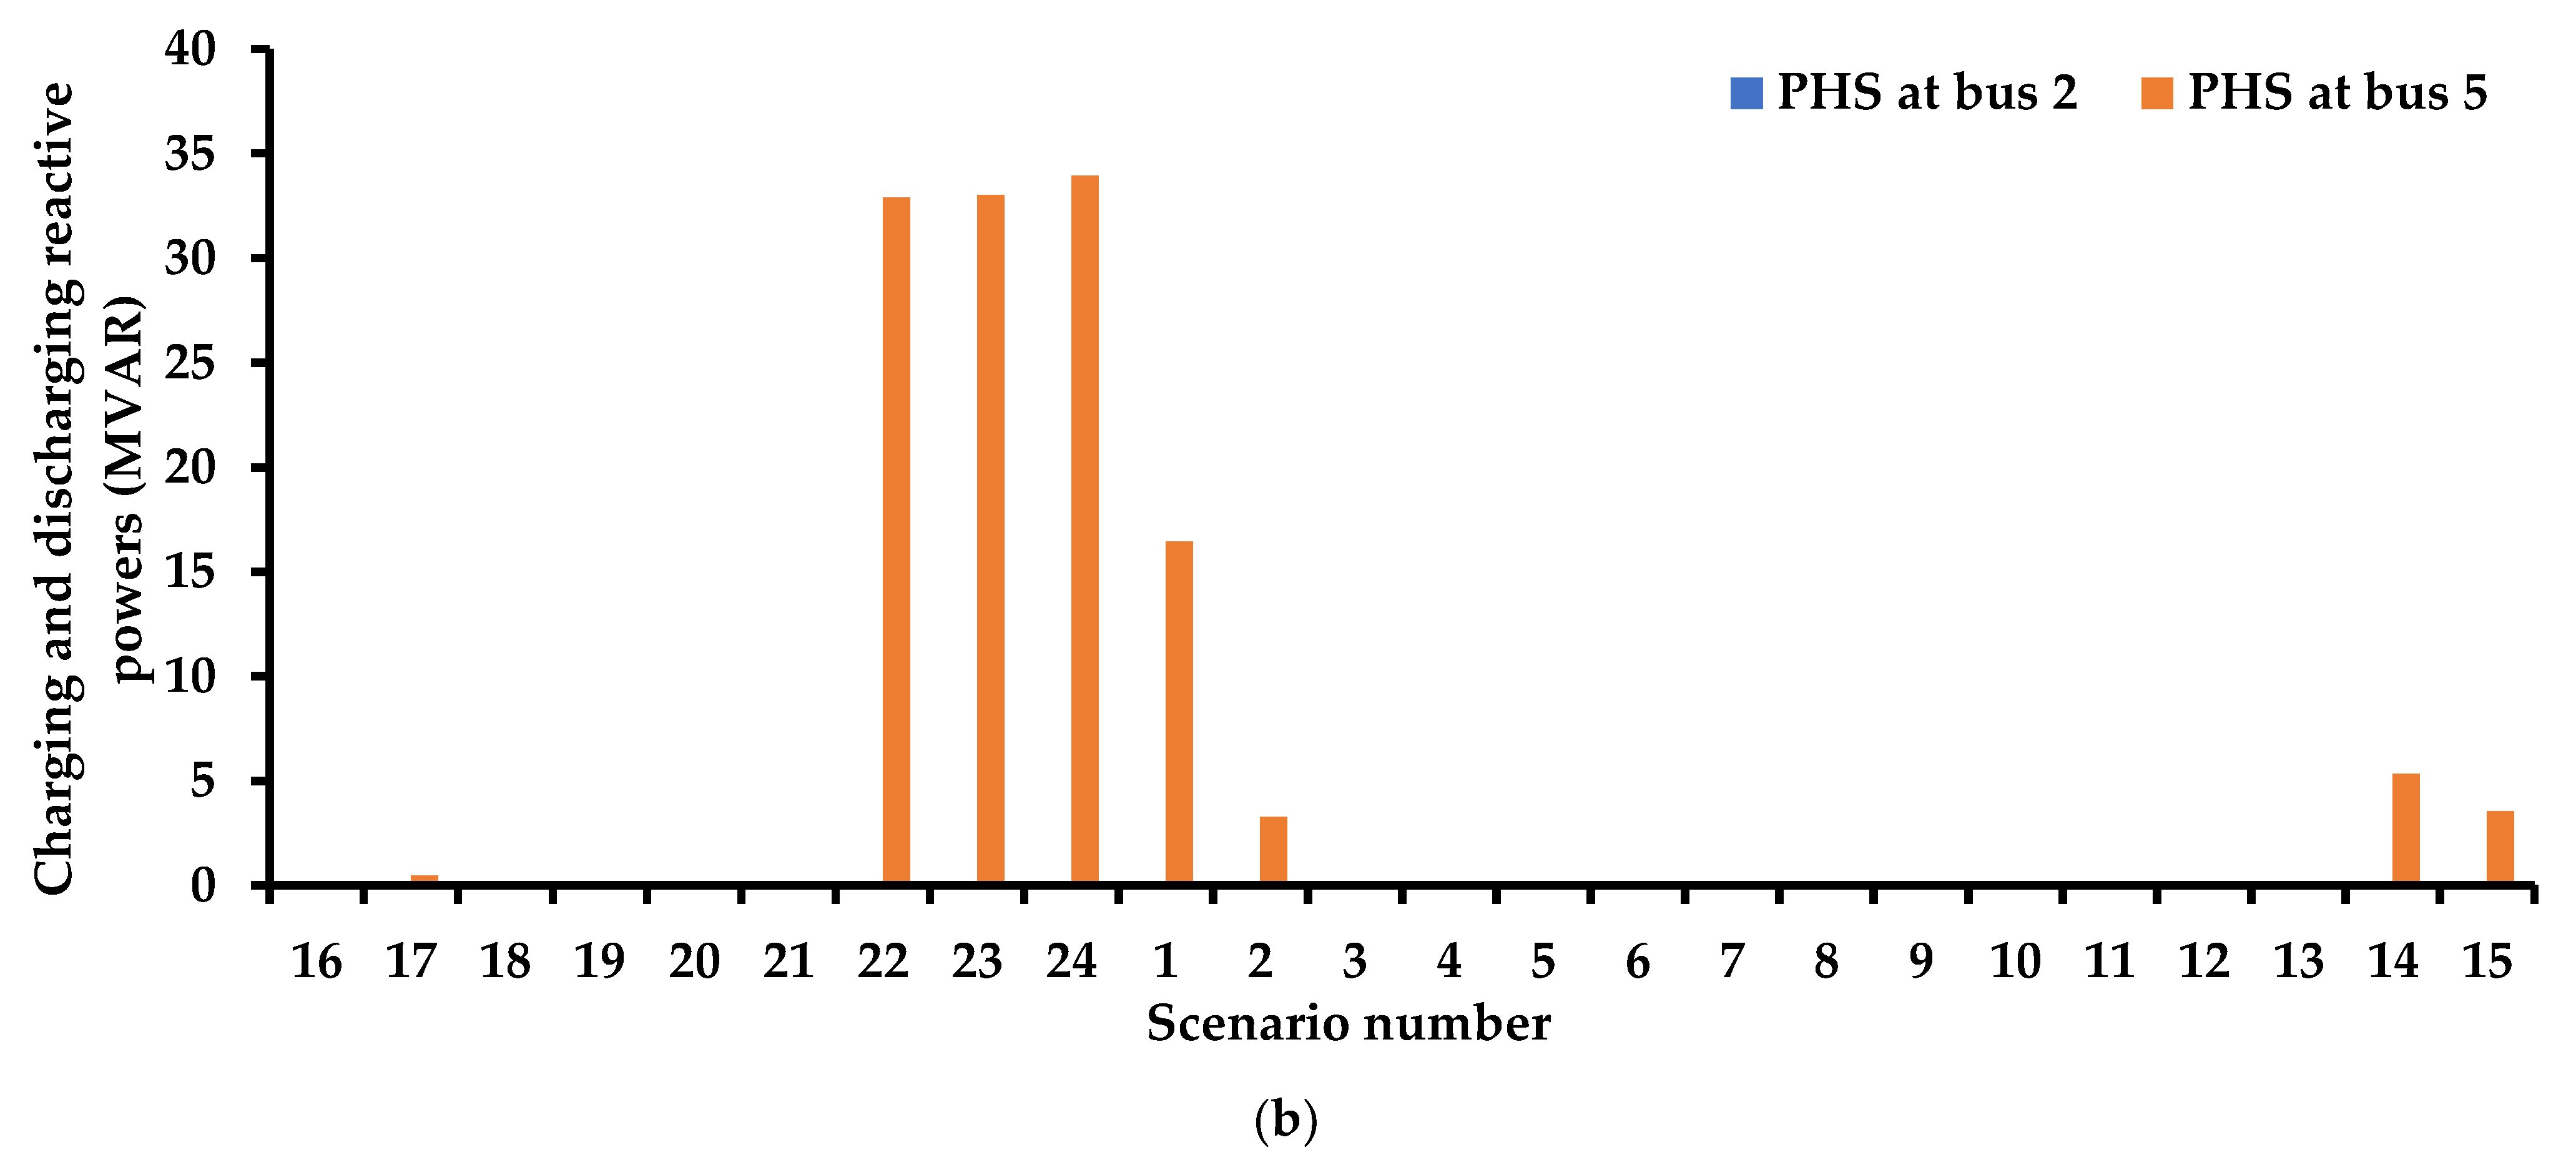
Figure 14 depicts the charging and discharging powers of the ESSs across the 24 scenarios. Figure 14b shows that the ESS at bus 5 absorbed the reactive power through the BDC over eight scenarios. The capability of the ESSs to absorb the reactive power sped up the charging process and decreased the capacity of the ESSs. As a result, the cost of installing the ESSs was reduced. The rated MWh decreased from 177.78 MWh to 55 MWh.

5.2.3. Testing the Efficiency of RKWSO

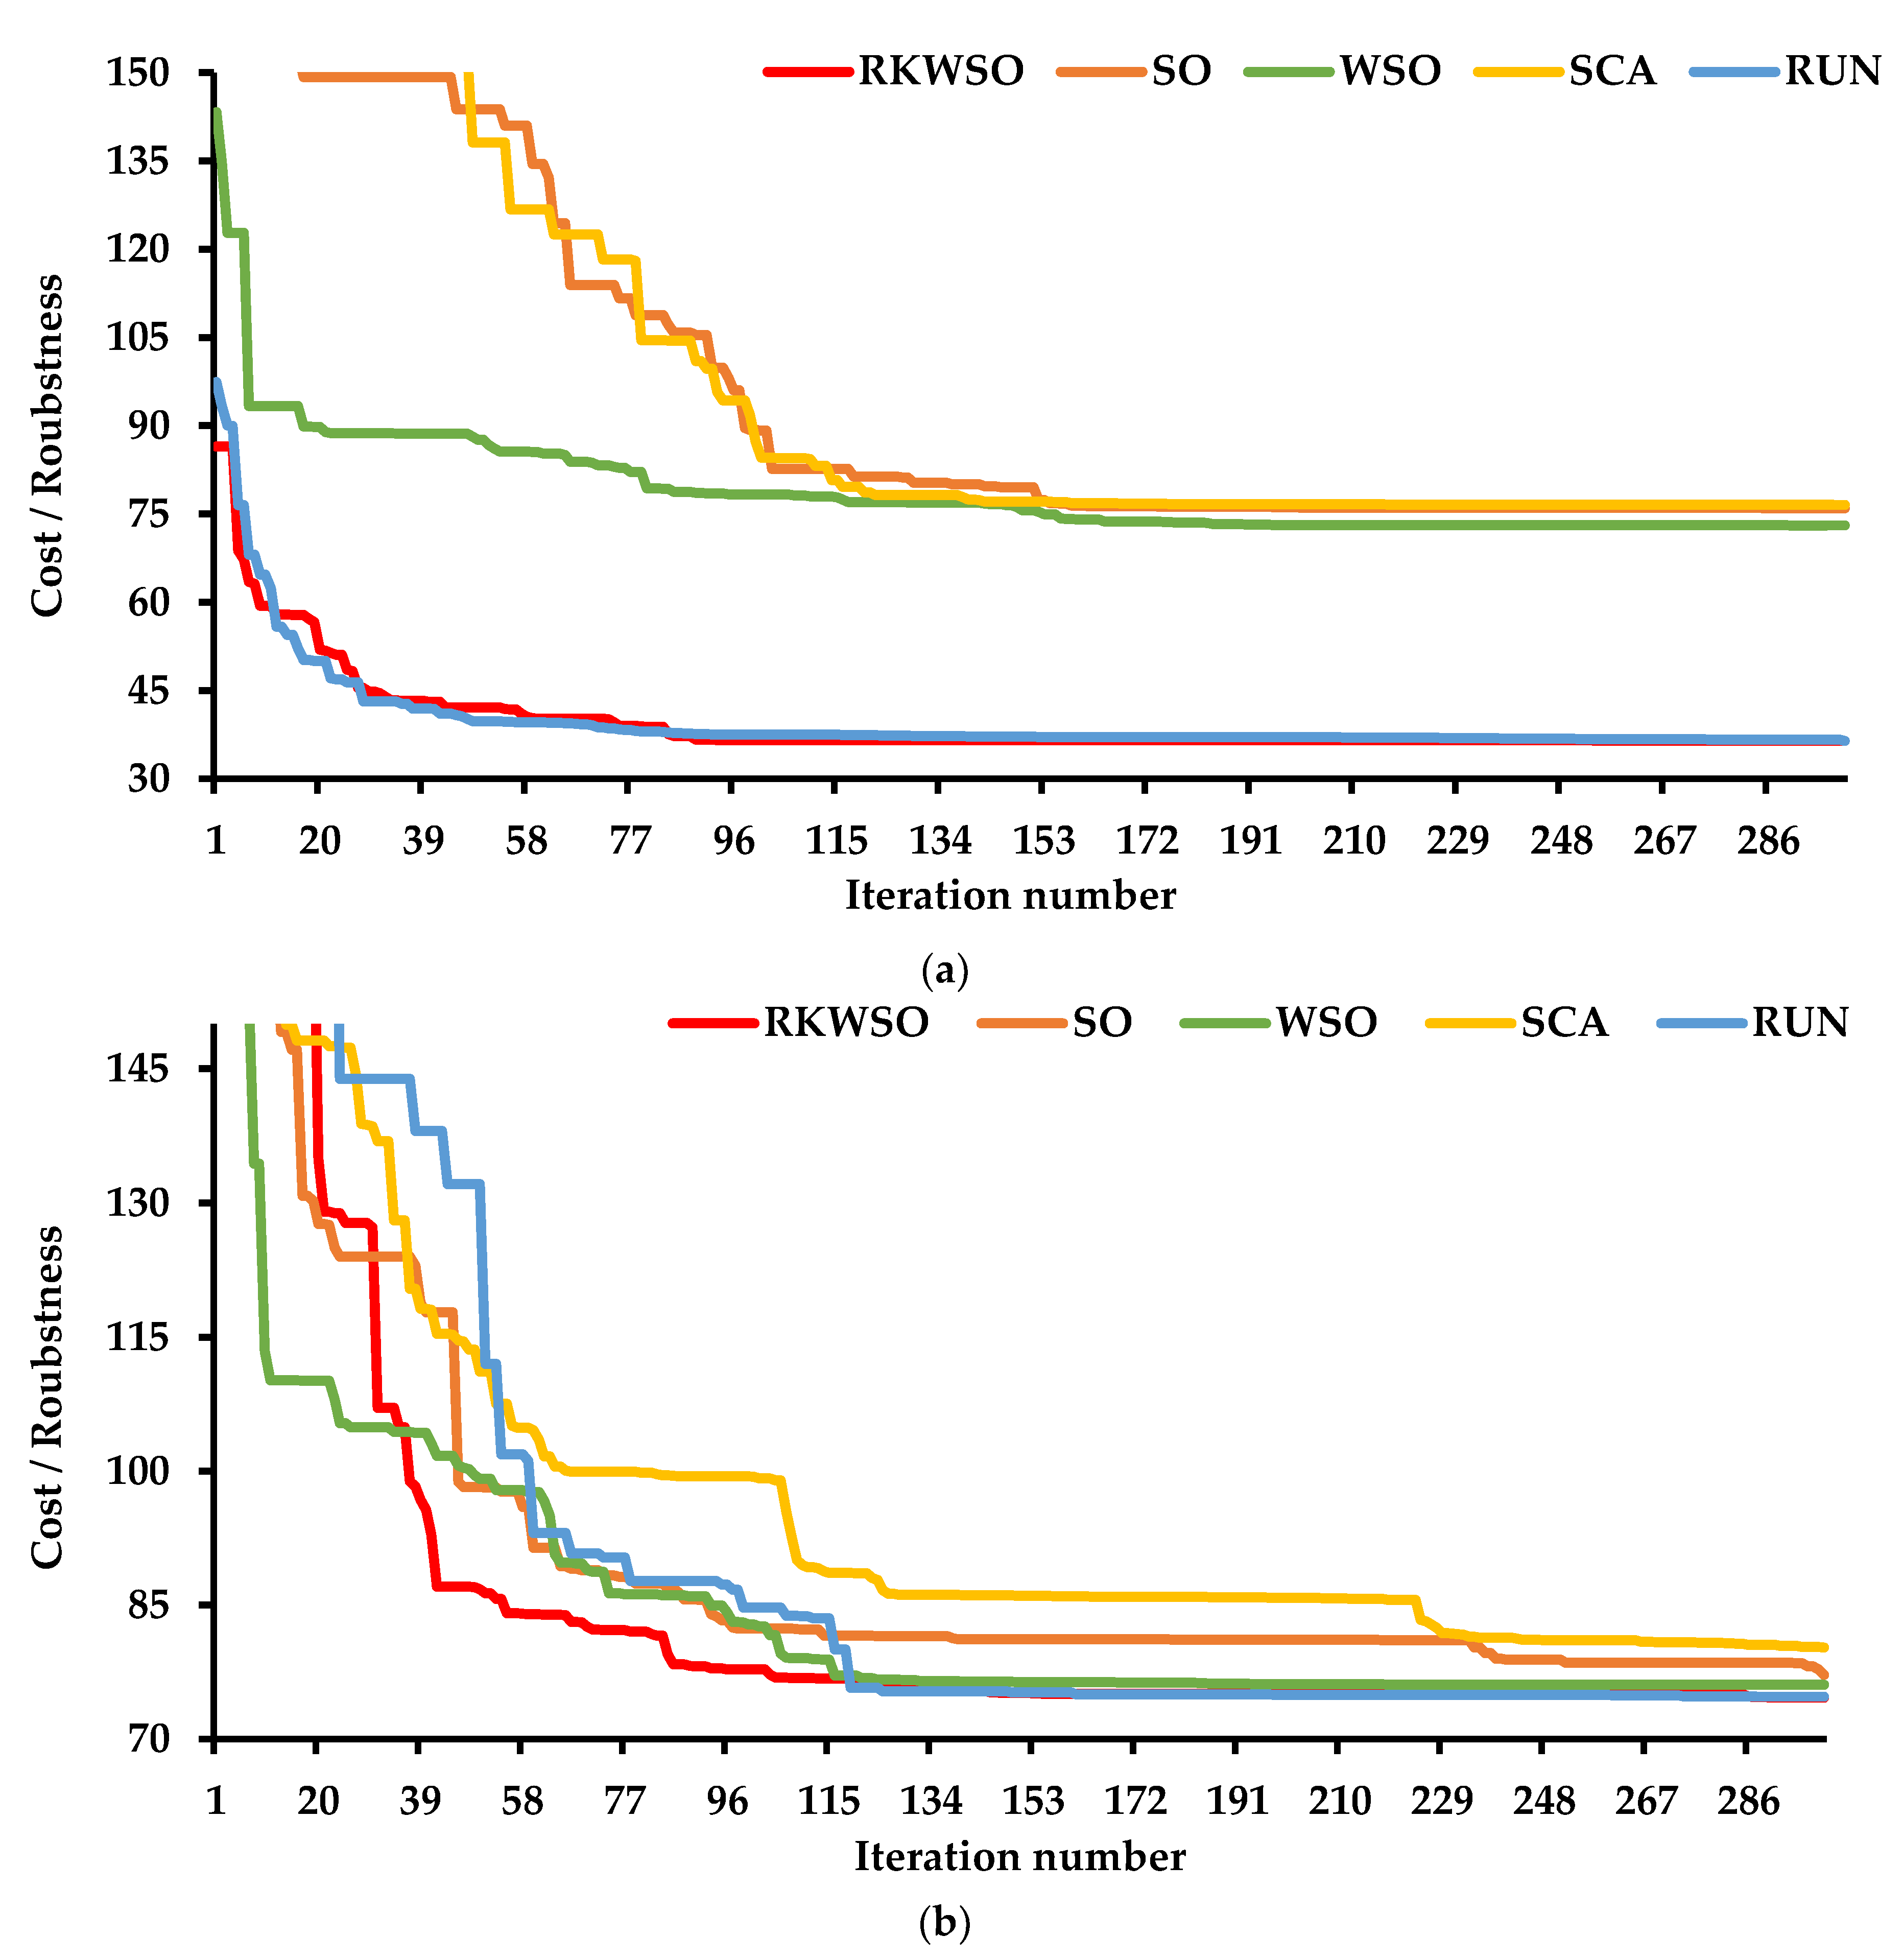
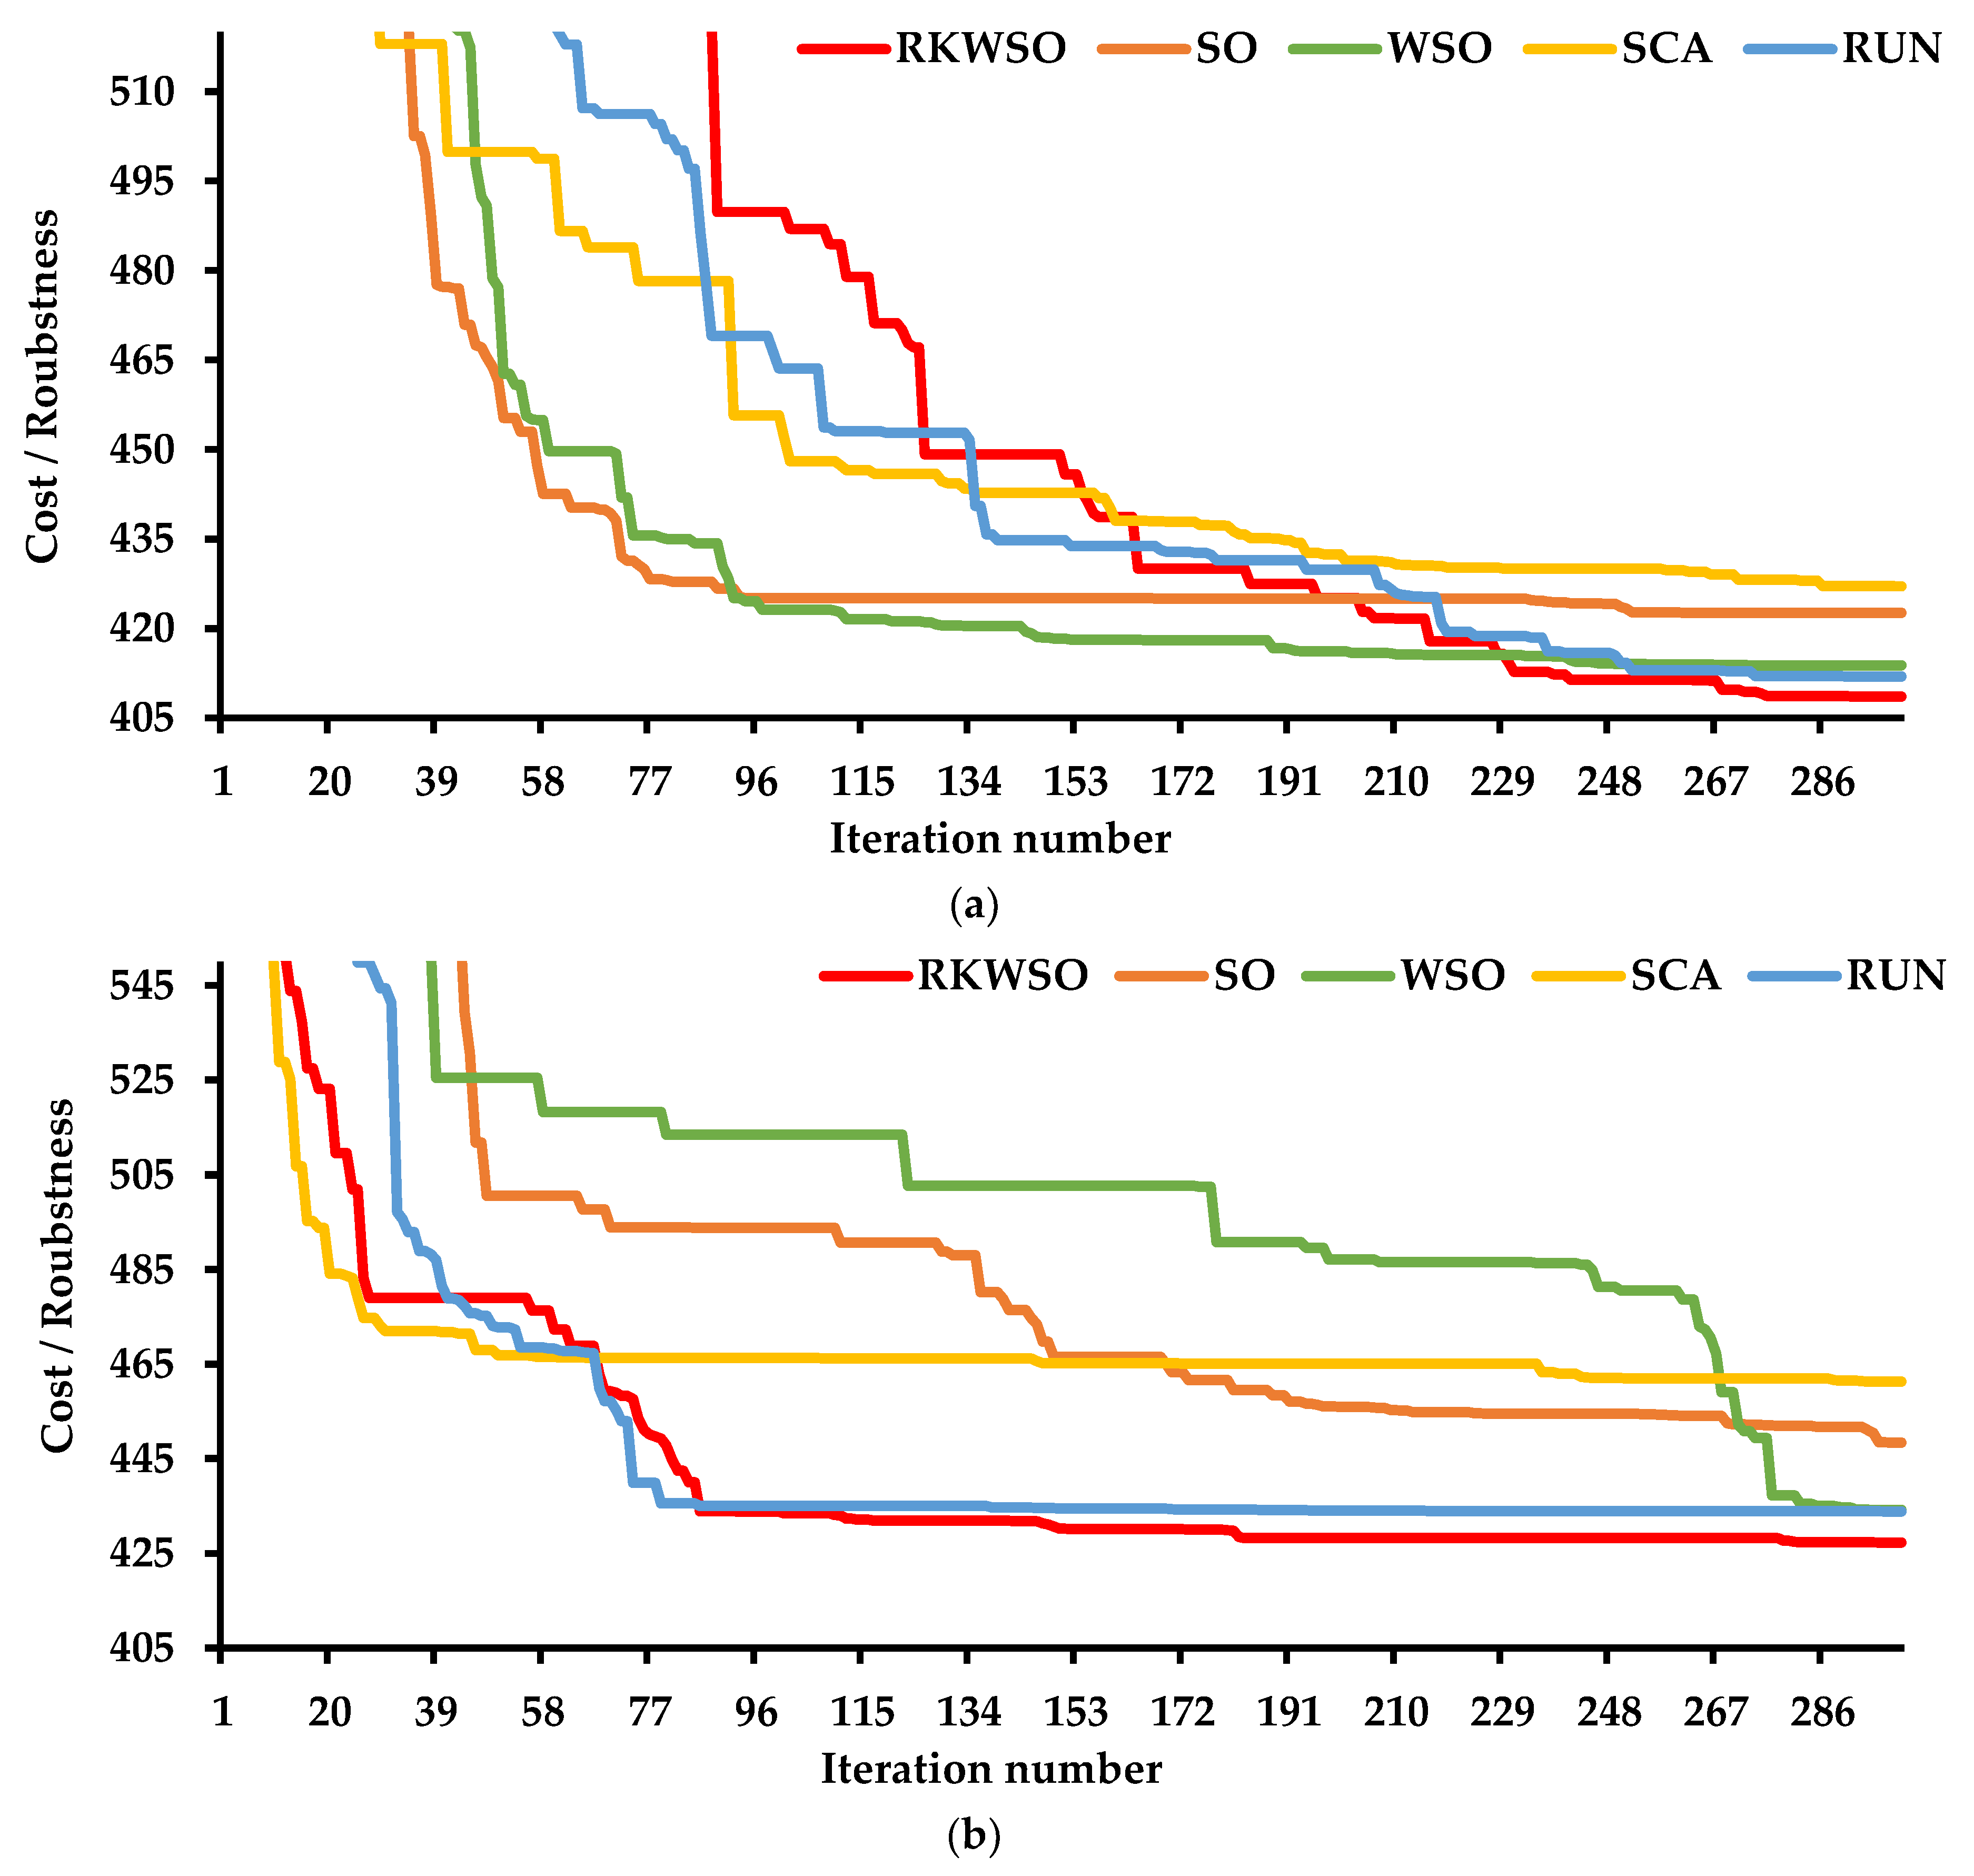
Table 2 summarizes the results obtained for the RKWSO when it was applied to solving the fifth model, at HCmin = 30%. The performance of the RKWSO was compared with that of the snake optimizer (SO) [25], the WSO, the sine-cosine algorithm (SCA) [26], and RUN. The results proved the superiority of the RKWSO in solving the reduced-scale and full-scale models in terms of reaching the best solution, SD, and the mean.
The results also showed that the proposed decision-making approach helped all of the algorithms give better solutions and converge faster than the full-scale model. This confirms that the impact of the suggested approach was not limited to RKWSO but also effectively improved the performance of the other solvers. The convergence curves are presented in Figure 15.

5.3. IEEE 118-Bus System

5.3.1. Validation of the Proposed Solution Method

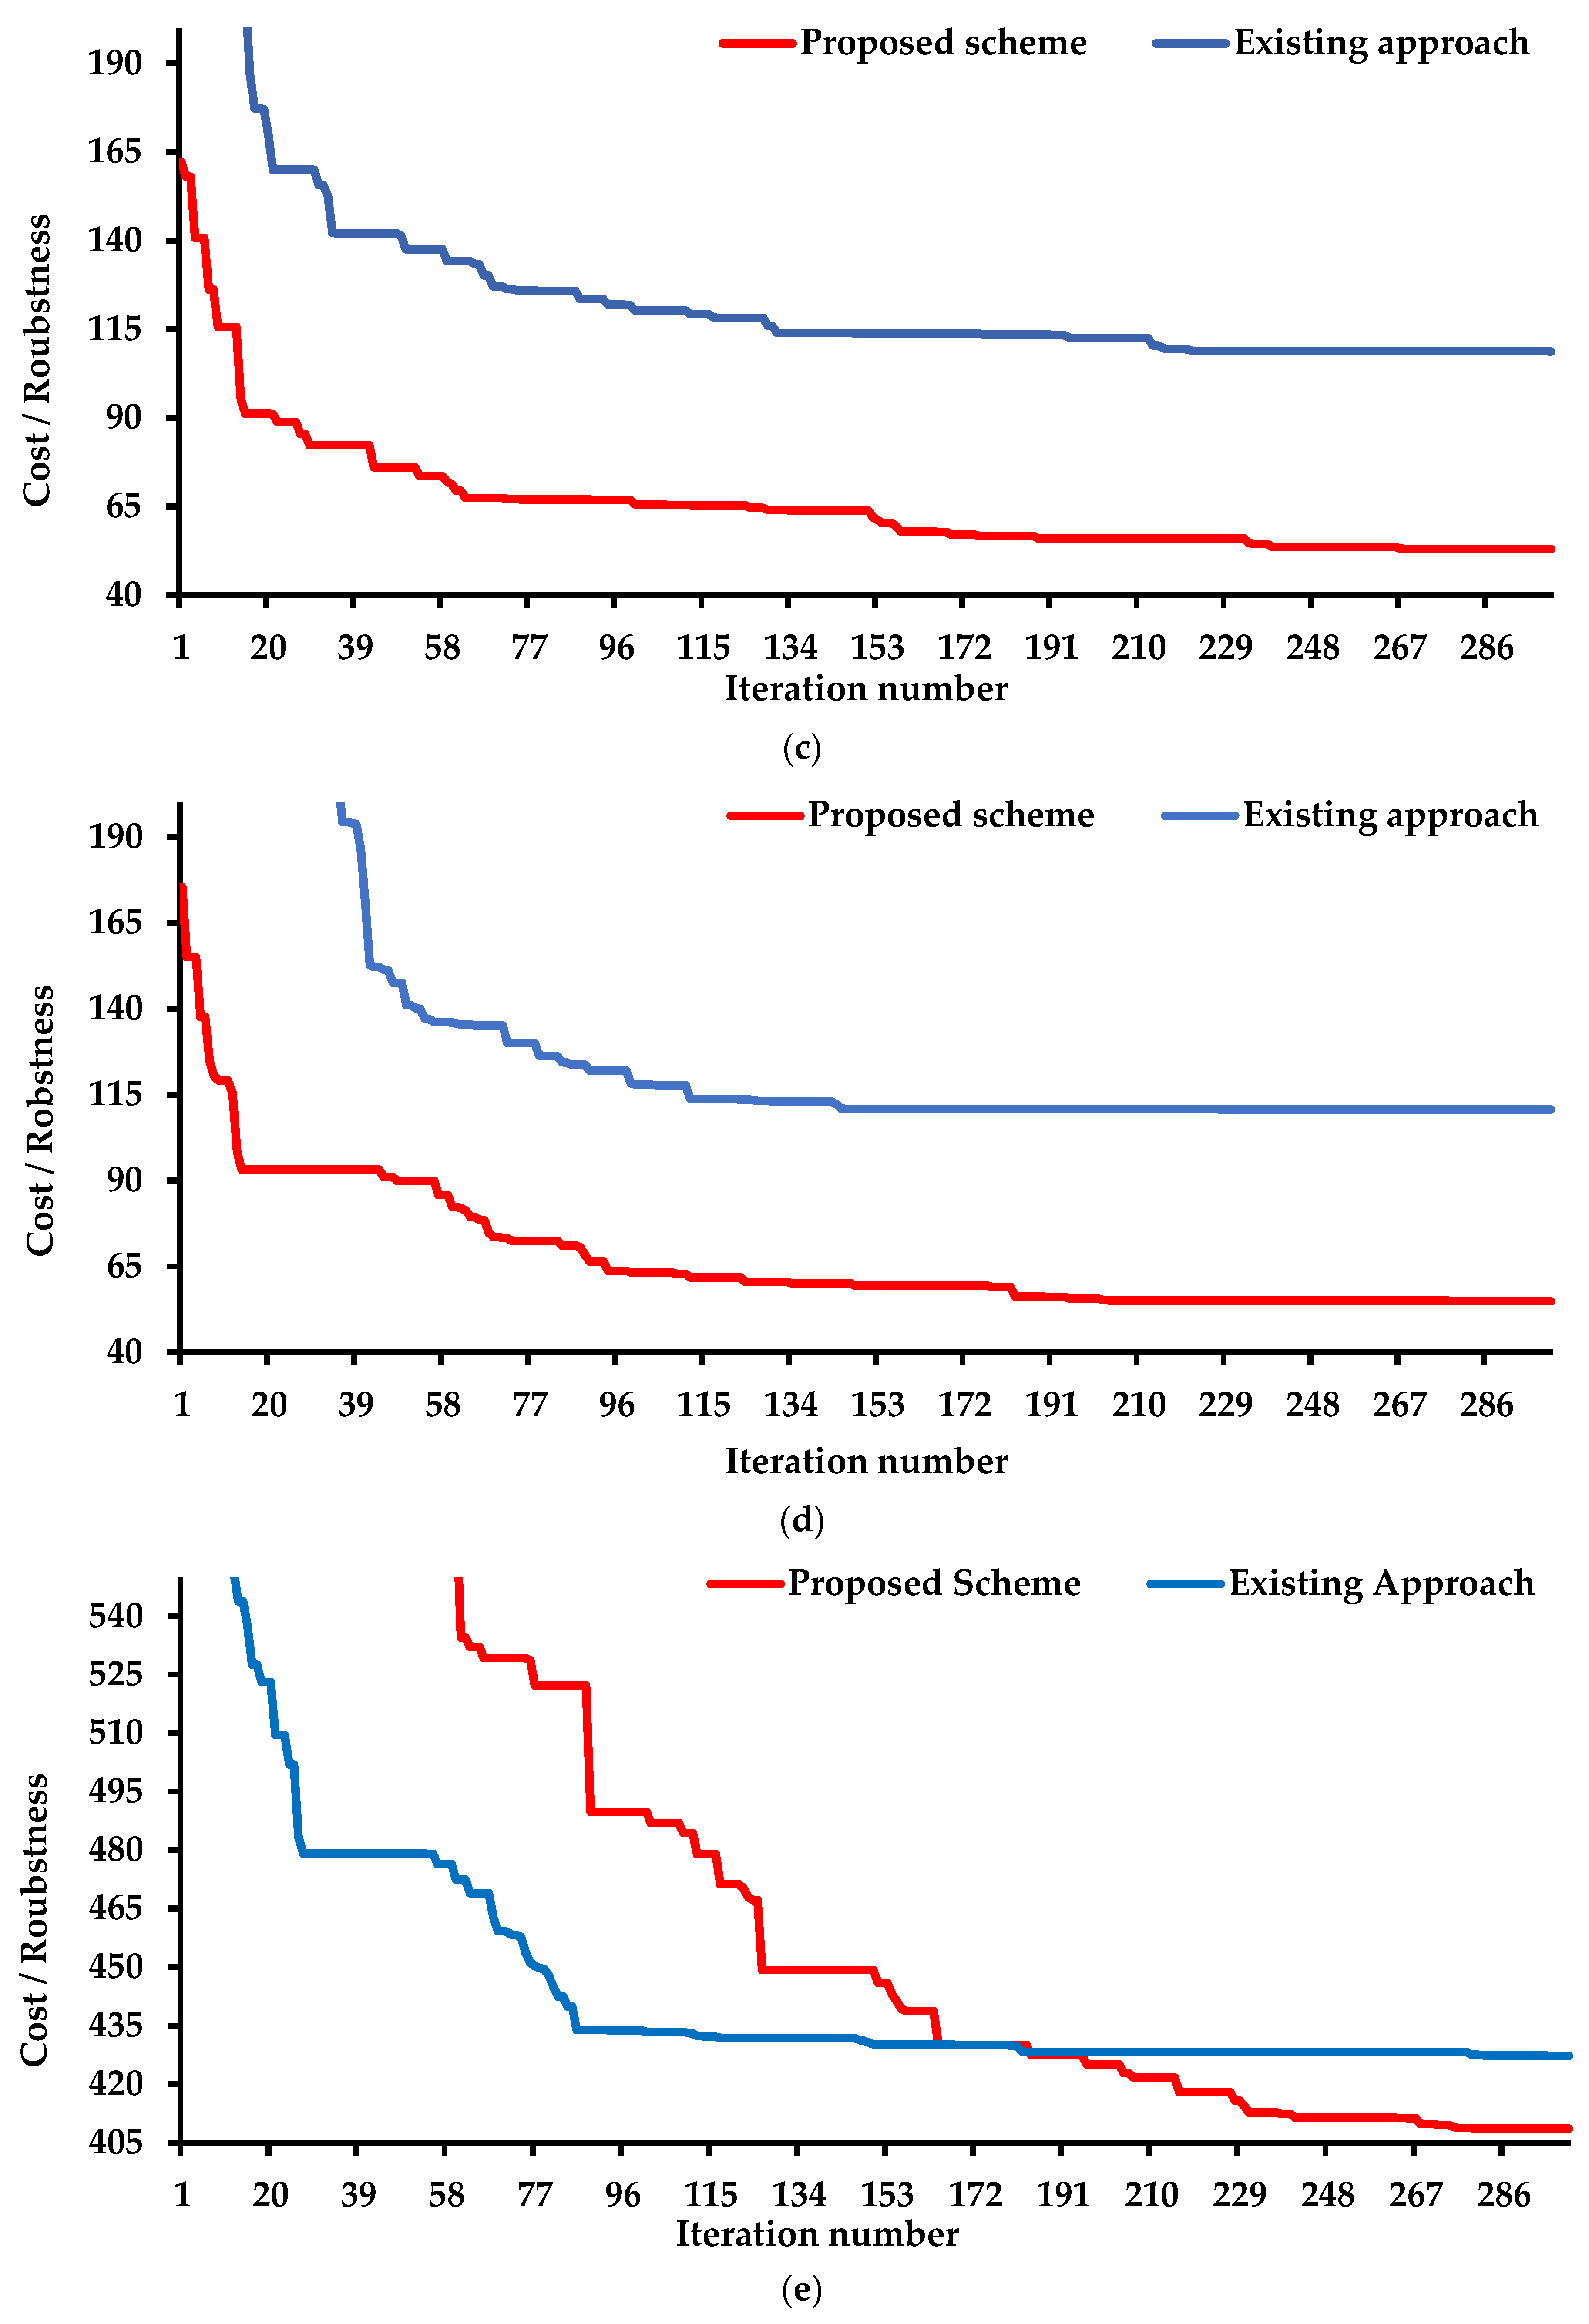
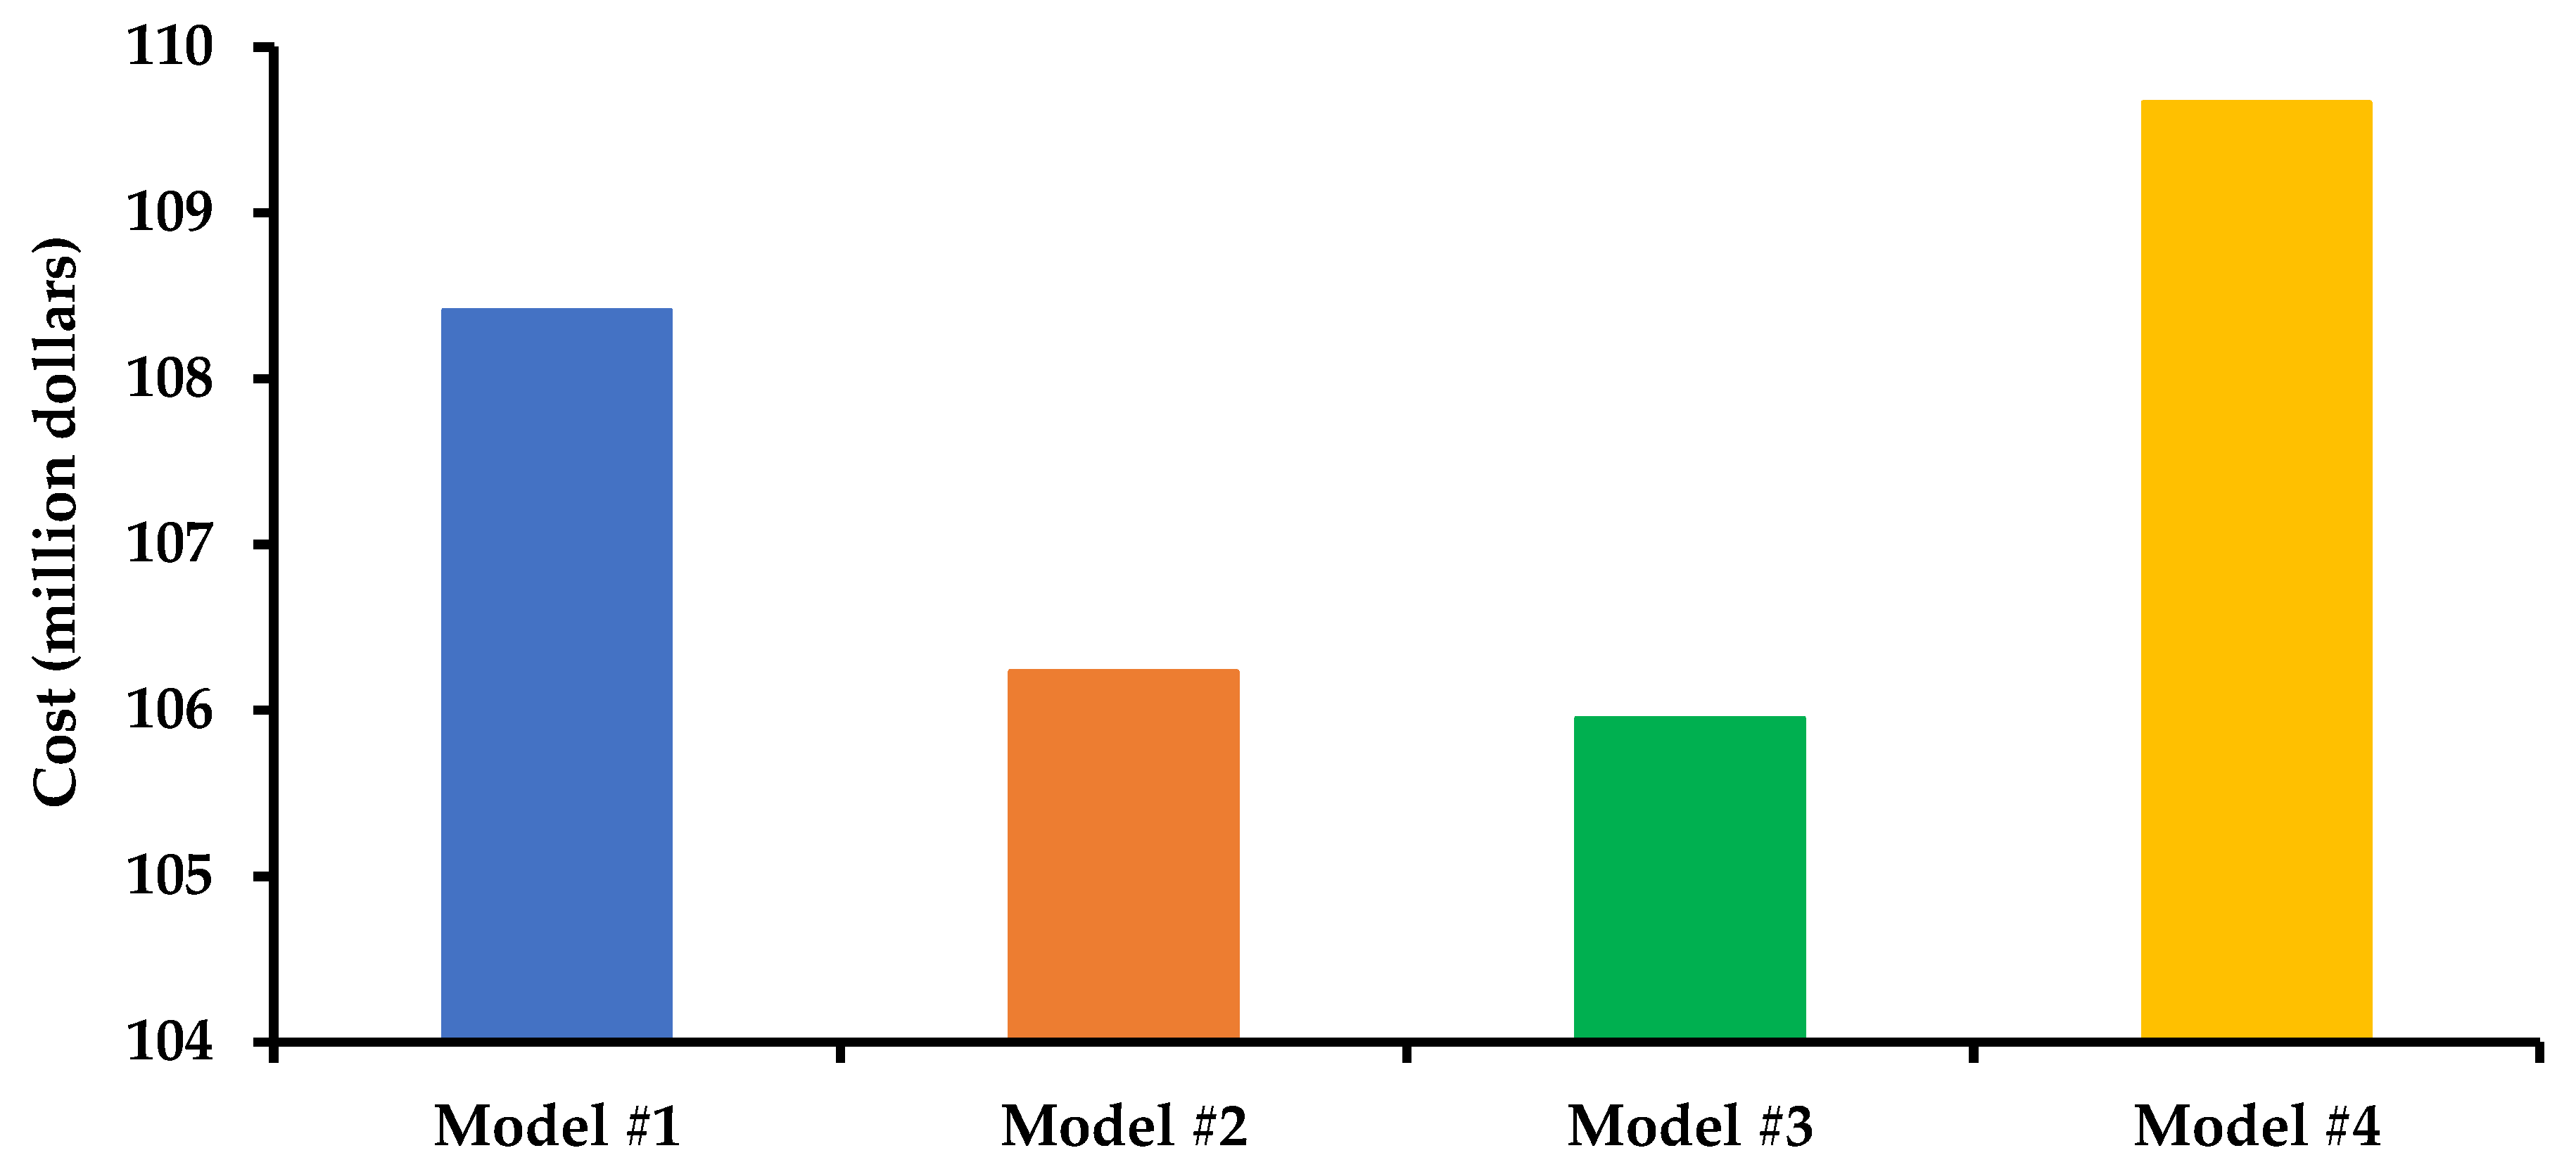
The proposed solution was also tested on the 118-bus system using the five models to evaluate each scheme individually. The results gathered for the 118-bus system are presented in Table 3. Like the Garver network, the results confirmed that the reliance on the reactance of the transmission lines was effective and superior in selecting the TNEP projects. The best configuration using the proposed approach cost approximately 108.411 million USD, whereas the best solution calculated by the conventional approach was 108.629 million USD, as shown in Figure 16a. The outperformance of the proposed methodology was shown in the mean, the convergence time, the robustness measurement, and the SD of the calculated solutions. The best mean was approximately 112.22 million USD, and the best SD was 2.17. These findings also encourage TCSC plans based on transmission line reactance.
Table 3 illustrates that the application of the suggested circuits and TCSC planning scheme significantly improved the RKWSO performance. The planning scheme reduced the number of decision variables by 186. This reduction contributed to gathering high-quality solutions compared to the conventional approach. The SD of the solutions calculated by the proposed and conventional approaches was 2.305 and 2.424, respectively. Moreover, the best solution was less expensive than the one obtained by the conventional approach, at 2.2 million USD. The convergence curves of both approaches are described in Figure 16b. The results showed an improvement in the proposed approach’s convergence time.
By investigating the results of the third model, it was noticed that the proposed method mitigated the impact of the increase in the number of variables due to the integration of the SVC planning model. As depicted in Figure 16c, the proposed approach promoted the performance of the RKWSO in reaching better solutions. The best solution was 105.952 million USD, while the best solution obtained by the conventional approach was 108.697 million USD. The results proved that the increase in the decision variables had an adverse effect on the optimizer’s performance. The weakness of the conventional approach was not limited to failing to reach the best solution; it also had less robustness than the proposed approach. The statistical analysis also showed improved solutions quality using the proposed approach. The SD was 3.863, and the mean was 110.436 million USD.
The results explained that including the FCL planning model did not affect the performance of the proposed approach. It preserved its good performance and outperformed the performance of the conventional approach. It gave the best solution of 109.665 million USD, as shown in Figure 16d. It also gave the best mean and SD, as shown in Table 3.
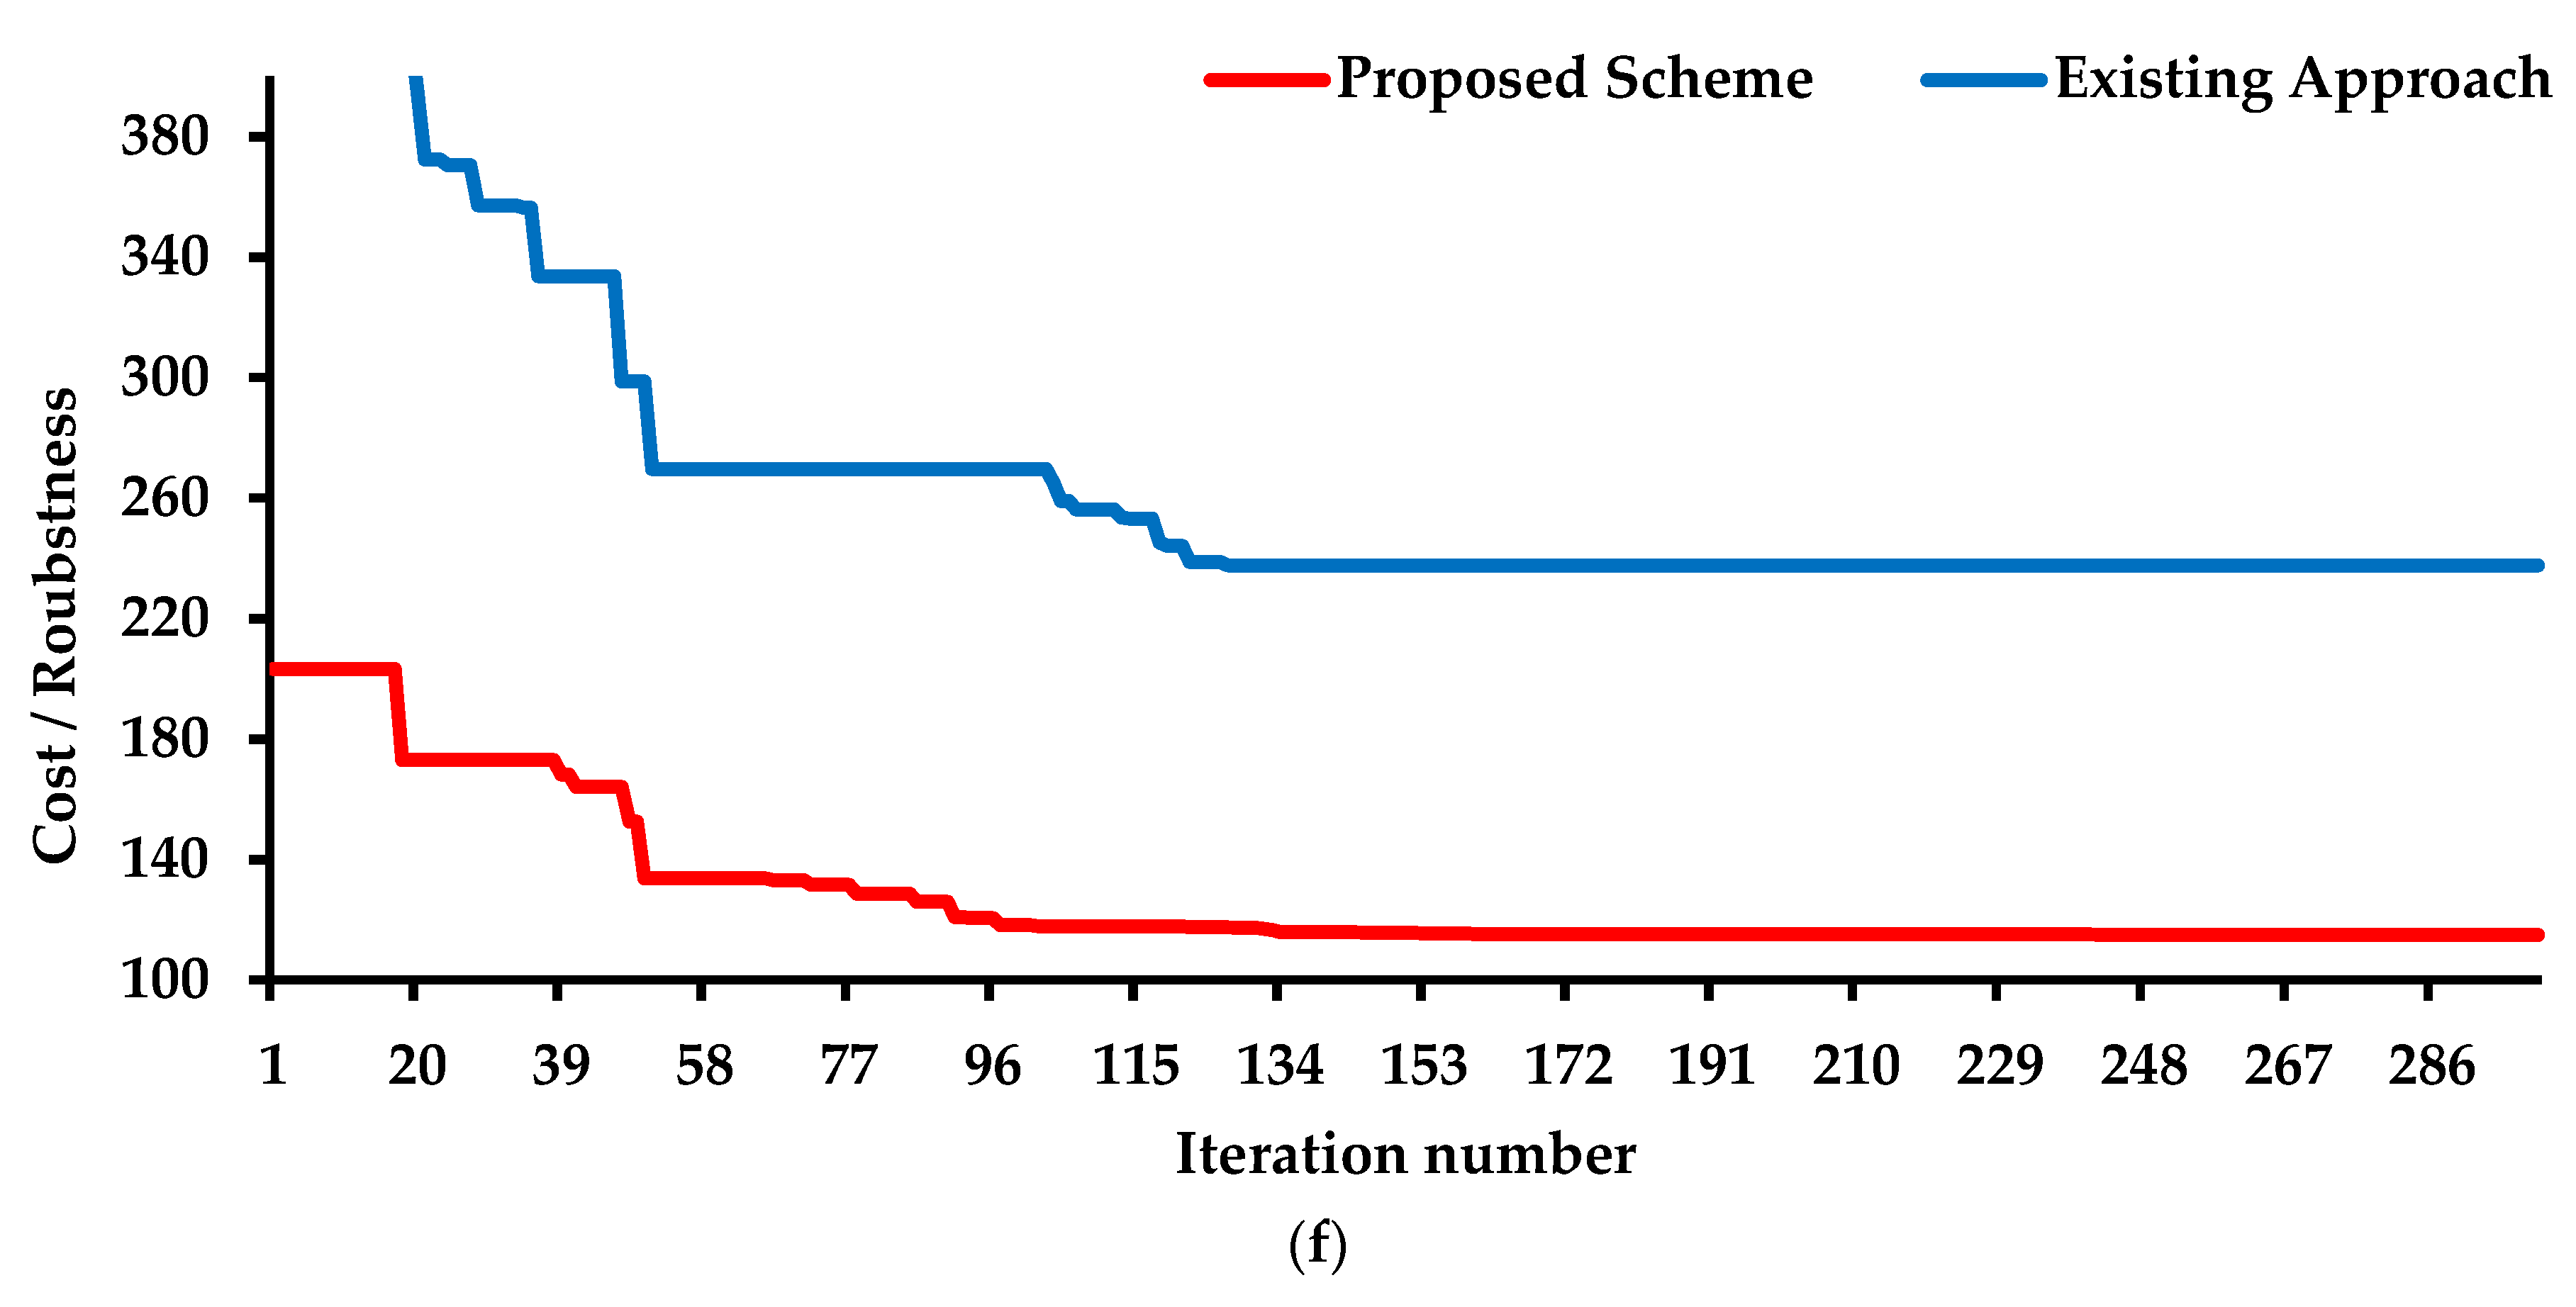
When the RESs and two types of ESSs were considered, the robustness of the proposed algorithm slightly decreased but was still better than the conventional approach, as shown in Table 3. The proposed method was superior to the conventional approach in terms of the mean, the SD, and the quality of the solutions. Figure 16e,f present the convergence curves of both approaches for two HC levels. It is worth mentioning that HCmin = 0 was simulated when the total generation from the thermal units was constrained not to exceed 6260 MW.

5.3.2. Technical and Economic Analysis

Figure 17 indicates that embedding the TCSCs in the system decreased the planning cost by 2% compared to the first model. The findings also demonstrated that the optimal mix of TCSCs and SVCs improved the planning efficiency. The planning cost decreased by 0.282 million USD when only the TCSCs were used. Figure 18 points to the capability of the proposed model to limit the buses’ voltage within the planned limits. Incorporating the SCC into the planning model affected the projects selected. The planning cost increased by 3.5% compared to the cost of the third model. The FCLs were necessary to maintain the SC below 12.5 p.u., as shown in Figure 19.
The results found that using ESSs was only crucial when the output of the thermal units was insufficient to compensate for an unbalance between generation and consumption. The results also showed that the reliance on the RESs for compensating for a deficiency in the generation was economically preferred to ESSs for long-term expansion, as depicted in Figure 20. The planned cost for achieving HCmin equal to 30% was 660.427 million USD, whereas the use of ESSs increased the cost to 809.41 million USD for HCmin equal to 0%.
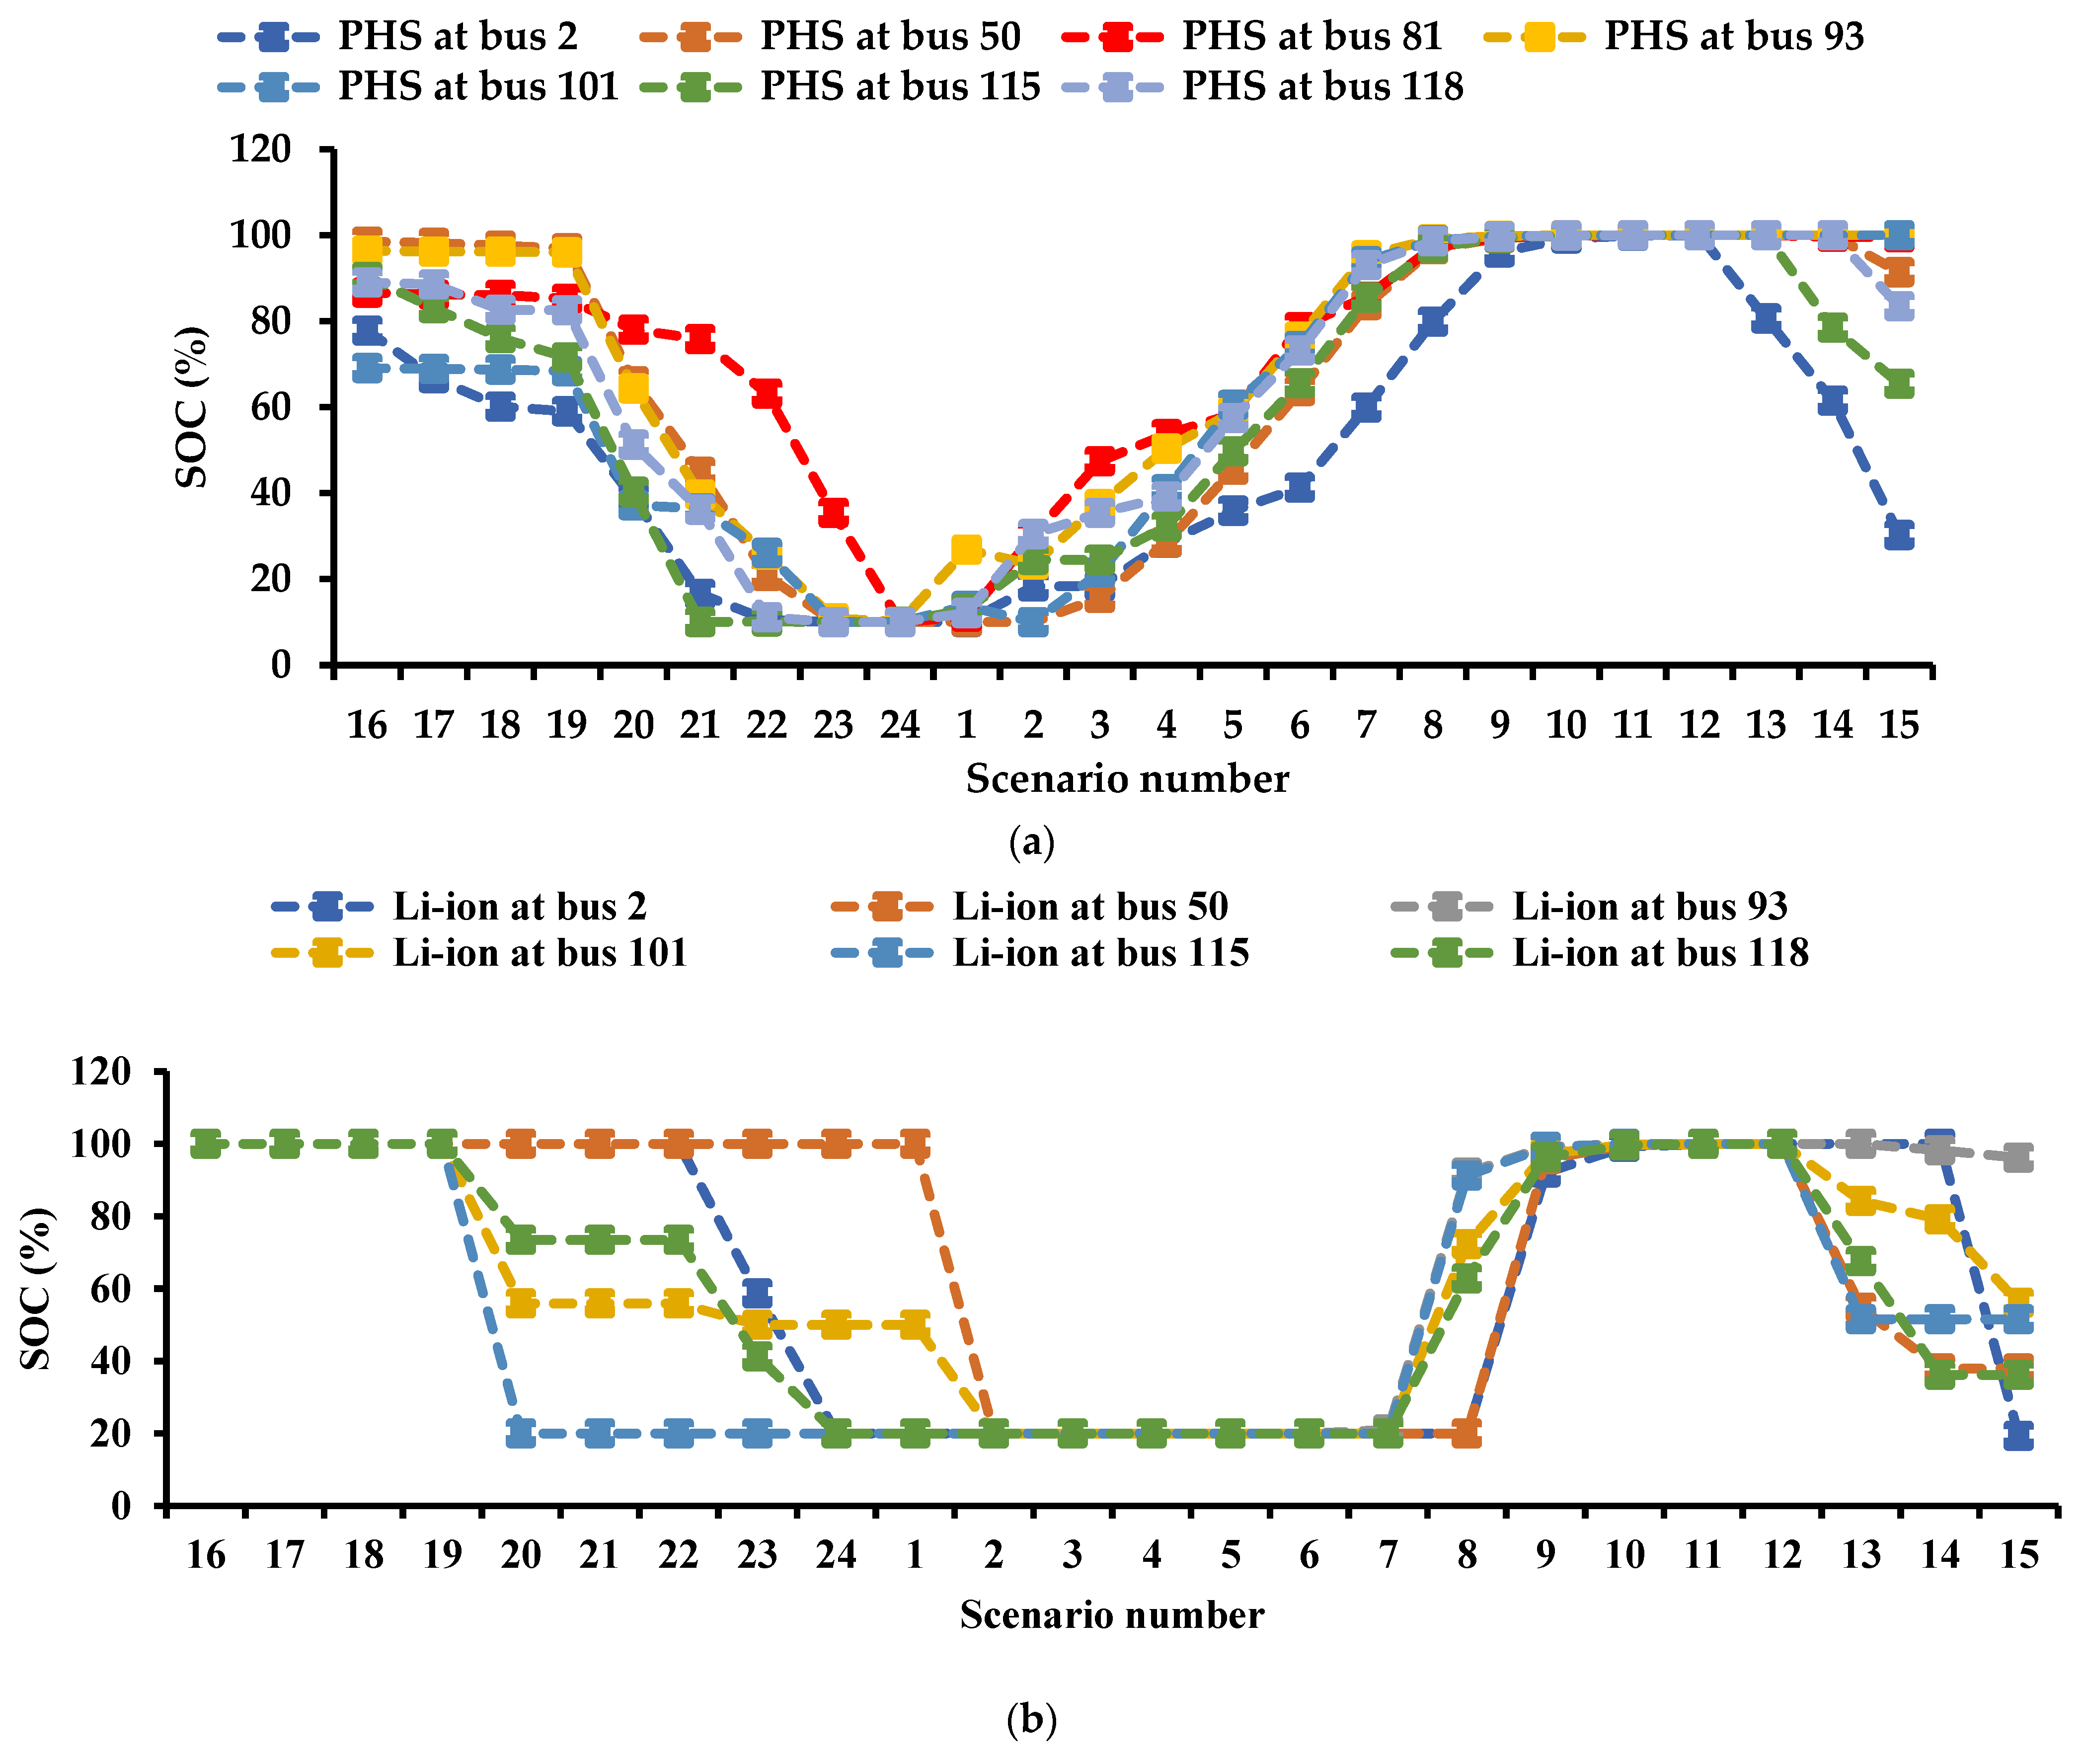
For the HCmin equal to 0%, using PHS and Li-ion was essential. The PHS was given priority to inject power into the grid, and the Li-ion served as a backup for the PHS in scenarios where the PHS’s capacity and rated power were insufficient to meet the demand. The SOC of the PHS and Li-ion over the 24 h is depicted in Figure 21. It is worth mentioning that if the number of PHS increased, there would be no need to use Li-ion.

5.3.3. Testing the Efficiency of RKWSO

The efficiency of the RKWSO was not limited to solving small-scale systems but was extended to larger systems such as the 118-bus system. The results demonstrated that the RKWSO was more functional than SO, WSO, SCA, and RUN in solving the reduced- and full-scale models. The RKWSO had the lowest SD, the best mean, and the highest robustness, as shown in Table 4. Figure 22 shows that the reduced-scale model gave better solutions for all of the algorithms than the full-scale model.

5.4. Discussion

Based on all of the presented results, some points can be concluded. The use of the devices’ impedance installed in any path was effective in determining the location and size of new TLs and series-type FACTs without impacting the efficiency of the meta-heuristic algorithm. The proposed decision-making approach enhanced the performance of the meta-heuristic algorithm. For both systems, the proposed solution strategy succeeded in giving better solutions in a shorter computational time compared to the conventional approach. The computational time was reduced by 36.9 s in the Garver network and 119.21 s in the 118-bus system, with an improvement in the SD of 40.6% in the Garver network and 6.3% in the 118-bus system.
When the shunt-type FACTs, such as the SVC, were planned to integrate into the system, the number of decision-making variables increased in the conventional approach. However, it remained fixed when the proposed approach was applied. The computational time was enhanced by 31.87% in the Garver network and by 15.3% in the 118-bus system. Furthermore, the robustness of both systems increased by 50% and 100%, respectively.
When the planning model for the FCLs modules was considered, the proposed approach was still more robust than the conventional method, and a reduction in the execution times of 58.22 s and 264.08 s was noticed in both systems, respectively.
The results demonstrated that any extension of the planning model using the proposed strategy to allow systems to host multiple types of ESSs and different RES concurrently had no significant impact on the solver’s efficiency when compared to the conventional method. The proposed approach proved its superiority in obtaining high-quality solutions. The meta-heuristic algorithm’s ability to define the best ESS type or a combination of them was enhanced. Regardless of the types of ESSs considered, the solver’s performance was not affected. The superiority of the proposed algorithm was not limited to the quality of solutions obtained but was extended to reaching final solutions in a shorter period.
The proposed strategy was able to control the hosting levels of multiple types of RES without affecting the efficiency of the meta-heuristic algorithms. When the decision-making strategy was executed in simulations with five meta-heuristic optimizers, their performance was better than in the standard case.
Finally, the simulations showed encouraging results for the use of a combination of many meta-heuristic algorithms in solving this type of problem. The proposed RKWSO was more efficient than WSO, RUN, SO, and SCA in terms of robustness and the quality of solutions obtained.

6. Conclusions

In this paper, a co-expansion model was proposed to facilitate the integration of RESs into power systems and plan many types of ESSs and FACTs. The problem was complex, and to simplify it, a decision-making approach was embedded in the meta-heuristic algorithm to reduce the search space and ensure the capture of high-quality solutions. The suggested approach was based on applying four separate planning schemes to decrease the model’s decision variables. The first scheme relied on the impedance of the transmission lines to techno-economically identify the location and size of the new circuits and TCSC devices required for system expansion. The second scheme was investigated to optimally select the appropriate types of ESSs. The third scheme controlled the reactive power dispatched from the ESSs and SVCs. The fourth scheme was concerned with regulating the power dispatched from the RESs to achieve the technical and economic requirements. The RKWSO was also suggested to improve the global search capability of the WSO algorithm. The RKWSO was elaborated by combining the enhancement scheme of the RUN with the conventional WSO. The main findings of this paper can be summarized as follows:
  • The reliance on the reactance of the transmission lines efficiently determined the location and quantity of the new circuits required. It was more robust than the conventional method. Furthermore, the first scheme helped the RKWSO optimally plan circuits and TCSCs simultaneously without increasing the search space. The proposed RKWSO-based approach was superior in terms of the best solution gained, the SD, and the robustness measurement. Considering the transmission line reactance as a new control variable facilitates the planning of many devices that directly affect the impedance of the lines without impacting the number of decision-making variables or affecting the performance of the meta-heuristic algorithm.
  • The second scheme effectively controlled the charging and discharging powers of PHS and Li-ion without affecting the performance of the RKWSO. Many types of ESSs can be efficiently planned and compared. The PHS was economically preferable to the Li-ion. The optimal mix of both was essential for the 118-bus system under the cases studied in this work. The use of ESSs was necessary only when the output of the thermal units was not enough to supply the loads. Given the ability of the ESSs to absorb the reactive power, the required capacity of the ESSs was reduced, as was the planning cost. The use of many ESS types is essential in some networks for improving the networks’ performance during steady state and contingencies.
  • Incorporating the planning model of SVCs through the third scheme into the co-planning model did not affect the number of control variables or the efficiency of the solver. The SVCs were economically more suitable than the ESSs for injecting reactive power for long-term planning.
  • The fourth scheme succeeded in controlling the HC of many RESs without degrading the performance of the meta-heuristic algorithms. The wind farms were technically and economically preferred to the PV systems. The planning cost of the RES is high and should be ignored in the hope of increasing the HC and mitigating climate change.
  • The effectiveness of the proposed decision-making approach was tested through the RKWSO, SO, WSO, SCA, and RUN. The results showed an improvement in the performance of all the algorithms after applying the proposed approach. By adding the proposed decision-making approach, the convergence time of all the algorithms was found to be faster.
  • The RKWSO was superior to SO, WSO, SCA, and RUN in terms of the SD, the robustness measurement, and the mean. The use of a combination of many meta-heuristic algorithms is more effective in solving this type of problem than a single algorithm.
Further work is required to study the impact of other technologies, such as voltage regulators and transformer phase shifting, on power system reliability and investment costs. Furthermore, additional research is required to investigate the impact of embedding transient stability constraints on system configuration and the possibility of cascading failures. Modern power systems are moving towards green transportation electrification. Therefore, more efforts are still needed to investigate the impacts of increasing the HC of RESs and electric vehicles, simultaneously. Additional planning schemes to the proposed approach are required to accommodate the problem’s increased complexity.

Author Contributions

M.M.R. and S.H.E.A.A. designed the problem under study; M.M.R. performed the simulations and obtained the results; S.H.E.A.A. analyzed the obtained results; M.M.R. wrote the paper, which was further reviewed by S.H.E.A.A., Y.A., E.E.D.A.Z. and M.M.S. All authors have read and agreed to the published version of the manuscript.

Funding

This research received no external funding.

Data Availability Statement

The data presented in this study are available on request from the corresponding author.

Conflicts of Interest

The authors declare no conflict of interest.

Nomenclature

i , j ,   m ,   n , o , p , s B Indices and set for buses
b E S S Index and set for ESSs
o , p F C L Index and set for FCLs
g G Index and set for generators
h H Index and set for scenarios
k K Index and set for types of ESSs
l l Index and set for transmission lines
M i Set for generators, transmission lines, and ESSs connected to bus i
r R Index and set for types of RESs
γ R e p , k Index and set for the number of replacements for ESS of type k
s S V C Index and set for SVCs
m , n T C S C Index and set for SVCs
A k ,     b Period until the replacement for ESS b of type k
β i j Susceptance of the route between bus i and j
B e l e c , k Market energy price for ESS of type k (millions USD/MWh)
B g a s ,   k Natural gas cost per gas unit for ESS of type k
B r e p ,   k , b Replacement cost coefficient for ESS b of type k (millions USD/MWh)
  C g , t h i n v s ,     C g , W i n v s ,   C g , p v i n v s Investment cost of thermal, wind, and PV stations, respectively
  C g , t h v o p ,     C g , w v o p ,     C g , p v v o p Variable operating cost of thermal, wind, and PV stations, respectively
  C g , t h f o p ,     C g , w f o p ,     C g , p v f o p Fixed operating cost of thermal, wind, and PV stations, respectively
C g , t h C C S S ,     C g , t h r e v Cost and revenue of CCSS built for thermal unit g (million USD/metric tonne)
C i j Cost of circuits installed between bus i and bus j
c s c ,   k Storage container cost for type k (millions USD/MWh)
c p c ,   k ,   c p b ,   k Power conversion and balance of plant costs for type k (millions USD/MW)
c f i x e d , k Factor of the fixed operating cost for ESS of type k (millions USD/MW)
D O D E S S ,   K m a x Maximum depth of discharge for ESS of type k
E b E S S , K , h ,   E b E S S , k , m a x Installed capacity at hour h and rated capacity for ESS b of type k (MWh)
G i j Conductance of the route between bus i and j
G r , k Rate of gas consumption for ESS of type k (MJ/kWh)
N m a x l Maximum number of routes in the system
N i j l , h Number of circuits between bus i and j at hour h
N b E S S ,   k , h ,   N b E S S , k ,   m a x Required number and the maximum number for ESS of type k at hour h, respectively.
N g G ,   h Number of units for generator g installed at hour h
N g t h ,   h ,   N g w ,   h ,   N g p v ,   h Number of thermal, wind, and PV units for generator g installed at hour h
N s S V C ,   h Number of components for SVCs at hour h
N i j T C S C , h Number of TCSC components for the route i-j at hour h
P d c h , b B D C , K , h ,   P c h , b B D C , K , h Injected and absorbed active power by BDC for ESS b of type k (MW)
P d c h , b E S S , K , m a x , h , P c h , b E S S , K , m a x , h   Maximum charging and discharging power for ESS b of type k at hour h (MW)
P i d , h Active power consumed by the load at bus i (MW)
P R E S , h Vector of active power injected by RESs at hour h (MW)
P m a x w Vector of the maximum capacity of wind turbines (MW)
P m a x p v Vector of the maximum capacity of PV systems (MW)
P g t h ,   h , P g w ,   h ,   P g p v ,   h     Output active power of thermal, wind, and PV units at location g at hour h, respectively (MW)
P b E S S ,   k , h ,   P b E S S , K ,   m a x , h   Required power and rated power for ESS b of type k at hour h (MW)
  P E S S , h Vector of calculated ESSs’ power at hour h (MW)
P i l o s s , h Power losses for line l connected with bus i
P i j s , h ,   P i j r , h Active power flows in the circuit i-j in both terminals at hour h and their limits (MW)
P g t h ,   m i n ,   P g w ,   m i n , h ,   P g p v ,   m i n , h Minimum active power of thermal, wind, and PV units at location g
P g t h ,   m a x ,   P g w ,   m a x , h ,   P g p v ,   m a x , h Maximum active power of thermal, wind, and PV units at location g
Q h Vector of reactive power injected by reactive sources at hour h (MVAR)
Q d c h , b B D C , K , h ,   Q c h , b B D C , K , h Injected and absorbed reactive power by BDC for ESS b of type k (MVAR)
Q i d , h Reactive power consumed by the load at bus i (MW)
Q i j s , h ,   Q i j r , h reactive power flows in the circuit i-j in both terminals at hour h and their limits (MVAR)
Q s S V C ,   h ,   Q s S V C ,   m i n ,   Q s S V C ,   m a x Capacity of SVCs installed and its limits (MVAR)
Q g t h , h ,   Q g t h ,   m i n ,   Q g t h ,   m a x Output reactive power for the thermal unit g and its limits (MVA
  S i j s , h ,   S i j r , h ,   S i j m a x Apparent power flows in the circuit i-j in both terminals at hour h and their limits (MVA)
  S i j T C S C Increment in the maximum apparent power of circuit i-j due to building a TCSC with λ i j compensation levels
S O C E S S , i h SOC of ESS at bus i and hour h
V e l e c , k Rate of variation of B e l e c , k
V f c , k Rate of variation of the fixed operation and maintenance cost for ESS of type k
V g a s , k Rate of variation of the gas price for ESS of type k
V i h Voltage at bus i (p.u)
X i j ( o ) Initial reactance for the circuit i-j
x i j n e w , h Reactance calculated of projects installed in the route i-j
λ m a x ,   λ m n Compensation and needed compensation level of a TCSC installed in the circuit between bus m and bus n
θ i h Voltage angle at bus i (p.u)
η E S S , k c h ,   η E S S , k d c h Charging and discharging efficiencies for ESS of type k
τ , YDiscount rate and the lifetime of the project
Δ T Time interval between any two successive scenarios

References

  1. Ansari, M.R.; Pirouzi, S.; Kazemi, M.; Benbouzid, M.; Naderipour, A. Renewable Generation and Transmission Expansion Planning Coordination with Energy Storage System: A Flexibility Point of View. Appl. Sci. 2021, 11, 3303. [Google Scholar] [CrossRef]
  2. Latvakoski, J.; Mäki, K.; Ronkainen, J.; Julku, J.; Koivusaari, J. Simulation-Based Approach for Studying the Balancing of Local Smart Grids with Electric Vehicle Batteries. Systems 2015, 3, 81–108. [Google Scholar] [CrossRef] [Green Version]
  3. Annual Energy Outlook Introduction—Key Takeaways from the Reference Case and Side Cases—U.S. Energy Information Administration (EIA). Available online: https://www.eia.gov/outlooks/aeo/narrative/introduction/sub-topic-01.php (accessed on 13 July 2022).
  4. Sund, L.; Talari, S. Stochastic Wind Power Generation Planning in Liberalised Electricity Markets within a Heterogeneous Landscape. Energies 2022, 15, 8109. [Google Scholar] [CrossRef]
  5. Xie, Y.; Xu, Y. Transmission Expansion Planning Considering Wind Power and Load Uncertainties. Energies 2022, 15, 7140. [Google Scholar] [CrossRef]
  6. Naderi, E.; Pourakbari-Kasmaei, M.; Lehtonen, M. Transmission Expansion Planning Integrated with Wind Farms: A Review, Comparative Study, and a Novel Profound Search Approach. Int. J. Electr. Power Energy Syst. 2020, 115, 105460. [Google Scholar] [CrossRef]
  7. Aschidamini, G.L.; da Cruz, G.A.; Resener, M.; Ramos, M.J.S.; Pereira, L.A.; Ferraz, B.P.; Haffner, S.; Pardalos, P.M. Expansion Planning of Power Distribution Systems Considering Reliability: A Comprehensive Review. Energies 2022, 15, 2275. [Google Scholar] [CrossRef]
  8. Koltsaklis, N.E.; Dagoumas, A.S. State-of-the-Art Generation Expansion Planning: A Review. Appl. Energy 2018, 230, 563–589. [Google Scholar] [CrossRef]
  9. Mutlu, S.; Şenyiğit, E. Literature Review of Transmission Expansion Planning Problem Test Systems: Detailed Analysis of IEEE-24. Electr. Power Syst. Res. 2021, 201, 107543. [Google Scholar] [CrossRef]
  10. Mahdavi, M.; Sabillon Antunez, C.; Ajalli, M.; Romero, R. Transmission Expansion Planning: Literature Review and Classification. IEEE Syst. J. 2019, 13, 3129–3140. [Google Scholar] [CrossRef]
  11. Esmaili, M.; Ghamsari-Yazdel, M.; Amjady, N.; Chung, C.Y. Convex Model for Controlled Islanding in Transmission Expansion Planning to Improve Frequency Stability. IEEE Trans. Power Syst. 2021, 36, 58–67. [Google Scholar] [CrossRef]
  12. Gjorgiev, B.; David, A.E.; Sansavini, G. Cascade-Risk-Informed Transmission Expansion Planning of AC Electric Power Systems. Electr. Power Syst. Res. 2022, 204, 107685. [Google Scholar] [CrossRef]
  13. Armaghani, S.; Hesami Naghshbandy, A.; Shahrtash, S.M. A Novel Multi-Stage Adaptive Transmission Network Expansion Planning to Countermeasure Cascading Failure Occurrence. Int. J. Electr. Power Energy Syst. 2020, 115, 105415. [Google Scholar] [CrossRef]
  14. WANG, J.; ZHONG, H.; XIA, Q.; KANG, C. Transmission Network Expansion Planning with Embedded Constraints of Short Circuit Currents and N-1 Security. J. Mod. Power Syst. Clean Energy 2015, 3, 312–320. [Google Scholar] [CrossRef] [Green Version]
  15. Refaat, M.M.; Aleem, S.H.E.; Atia, Y.; Ali, Z.M.; El-Shahat, A.; Sayed, M.M. A Mathematical Approach to Simultaneously Plan Generation and Transmission Expansion Based on Fault Current Limiters and Reliability Constraints. Mathematics 2021, 9, 2771. [Google Scholar] [CrossRef]
  16. Ordóñez, C.A.; Gómez-Expósito, A.; Maza-Ortega, J.M. Series Compensation of Transmission Systems: A Literature Survey. Energies 2021, 14, 1717. [Google Scholar] [CrossRef]
  17. Mostafa, M.H.; Abdel Aleem, S.H.E.; Ali, S.G.; Ali, Z.M.; Abdelaziz, A.Y. Techno-Economic Assessment of Energy Storage Systems Using Annualized Life Cycle Cost of Storage (LCCOS) and Levelized Cost of Energy (LCOE) Metrics. J. Energy Storage 2020, 29, 101345. [Google Scholar] [CrossRef]
  18. Esmaili, M.; Ghamsari-Yazdel, M.; Amjady, N.; Chung, C.Y.; Conejo, A.J. Transmission Expansion Planning Including TCSCs and SFCLs: A MINLP Approach. IEEE Trans. Power Syst. 2020, 35, 4396–4407. [Google Scholar] [CrossRef]
  19. Mehrtash, M.; Cao, Y. A New Global Solver for Transmission Expansion Planning with AC Network Model. IEEE Trans. Power Syst. 2022, 37, 282–293. [Google Scholar] [CrossRef]
  20. Bhattiprolu, P.A.; Conejo, A.J. Multi-Period AC/DC Transmission Expansion Planning Including Shunt Compensation. IEEE Trans. Power Syst. 2022, 37, 2164–2176. [Google Scholar] [CrossRef]
  21. Mahfoud, S.; Derouich, A.; Ouanjli, N.E.L.; Mahfoud, M.E.L.; Taoussi, M. A New Strategy-Based Pid Controller Optimized by Genetic Algorithm for Dtc of the Doubly Fed Induction Motor. Systems 2021, 9, 37. [Google Scholar] [CrossRef]
  22. Schockenhoff, F.; Zähringer, M.; Brönner, M.; Lienkamp, M. Combining a Genetic Algorithm and a Fuzzy System to Optimize User Centricity in Autonomous Vehicle Concept Development. Systems 2021, 9, 25. [Google Scholar] [CrossRef]
  23. Almalaq, A.; Alqunun, K.; Refaat, M.M.; Farah, A.; Benabdallah, F.; Ali, Z.M.; Aleem, S.H.E.A. Towards Increasing Hosting Capacity of Modern Power Systems through Generation and Transmission Expansion Planning. Sustainability 2022, 14, 2998. [Google Scholar] [CrossRef]
  24. Ahmadianfar, I.; Heidari, A.A.; Noshadian, S.; Chen, H.; Gandomi, A.H. INFO: An Efficient Optimization Algorithm Based on Weighted Mean of Vectors. Expert Syst. Appl. 2022, 195, 116516. [Google Scholar] [CrossRef]
  25. Hashim, F.A.; Hussien, A.G. Snake Optimizer: A Novel Meta-Heuristic Optimization Algorithm. Knowl. Based Syst. 2022, 242, 108320. [Google Scholar] [CrossRef]
  26. Mirjalili, S. SCA: A Sine Cosine Algorithm for Solving Optimization Problems. Knowl. Based Syst. 2016, 96, 120–133. [Google Scholar] [CrossRef]
  27. Li, T.; Liu, Y.; Chen, Z. Application of Sine Cosine Egret Swarm Optimization Algorithm in Gas Turbine Cooling System. Systems 2022, 10, 201. [Google Scholar] [CrossRef]
  28. Morquecho, E.G.; Torres, S.P.; Matute, N.E.; Astudillo-Salinas, F.; Lopez, J.C.; Flores, W.C. AC Dynamic Transmission Expansion Planning Using a Hybrid Optimization Algorithm. In Proceedings of the 2020 IEEE PES Innovative Smart Grid Technologies Europe (ISGT-Europe), The Hague, The Netherlands, 26–28 October 2020; pp. 499–503. [Google Scholar] [CrossRef]
  29. Rawa, M. Towards Avoiding Cascading Failures in Transmission Expansion Planning of Modern Active Power Systems Using Hybrid Snake-Sine Cosine Optimization Algorithm. Mathematics 2022, 10, 1323. [Google Scholar] [CrossRef]
  30. Gutierrez, A.; Dieulle, L.; Labadie, N.; Velasco, N. A Hybrid Metaheuristic Algorithm for the Vehicle Routing Problem with Stochastic Demands. Comput. Oper. Res. 2018, 99, 135–147. [Google Scholar] [CrossRef]
  31. Rawa, M.; AlKubaisy, Z.M.; Alghamdi, S.; Refaat, M.M.; Ali, Z.M.; Aleem, S.H.E.A. A Techno-Economic Planning Model for Integrated Generation and Transmission Expansion in Modern Power Systems with Renewables and Energy Storage Using Hybrid Runge Kutta-Gradient-Based Optimization Algorithm. Energy Rep. 2022, 8, 6457–6479. [Google Scholar] [CrossRef]
  32. Saboori, H.; Hemmati, R. Considering Carbon Capture and Storage in Electricity Generation Expansion Planning. IEEE Trans. Sustain. Energy 2016, 7, 1371–1378. [Google Scholar] [CrossRef]
  33. Cai, L.-J.; Erlich, I.; Stamtsis, G. Optimal Choice and Allocation of FACTS Devices in Deregulated Electricity Market Using Genetic Algorithms. In Proceedings of the IEEE PES Power Systems Conference and Exposition, 2004, New York, NY, USA, 10–13 October 2004; IEEE: New York, NY, USA, 2004; pp. 201–207. [Google Scholar]
  34. Lukačević, O.; Almalaq, A.; Alqunun, K.; Farah, A.; Ćalasan, M.; Ali, Z.M.; Abdel Aleem, S.H.E. Optimal CONOPT Solver-Based Coordination of Bi-Directional Converters and Energy Storage Systems for Regulation of Active and Reactive Power Injection in Modern Power Networks. Ain Shams Eng. J. 2022, 13, 101803. [Google Scholar] [CrossRef]
  35. Luburić, Z.; Pandžić, H.; Carrión, M. Transmission Expansion Planning Model Considering Battery Energy Storage, TCSC and LINEs Using AC OpF. IEEE Access 2020, 8, 203429–203439. [Google Scholar] [CrossRef]
  36. Ansaripour, R.; Barati, H.; Ghasemi, A. Multi-Objective Chance-Constrained Transmission Congestion Management through Optimal Allocation of Energy Storage Systems and TCSC Devices. Electr. Eng. 2022, 104, 4049–4069. [Google Scholar] [CrossRef]
  37. Biswas, P.P.; Suganthan, P.N.; Mallipeddi, R.; Amaratunga, G.A.J. Optimal Reactive Power Dispatch with Uncertainties in Load Demand and Renewable Energy Sources Adopting Scenario-Based Approach. Appl. Soft Comput. J. 2019, 75, 616–632. [Google Scholar] [CrossRef]
  38. Ayyarao, T.S.L.V.; Ramakrishna, N.S.S.; Elavarasan, R.M.; Polumahanthi, N.; Rambabu, M.; Saini, G.; Khan, B.; Alatas, B. War Strategy Optimization Algorithm: A New Effective Metaheuristic Algorithm for Global Optimization. IEEE Access 2022, 10, 25073–25105. [Google Scholar] [CrossRef]
  39. Ahmadianfar, I.; Heidari, A.A.; Gandomi, A.H.; Chu, X.; Chen, H. RUN beyond the Metaphor: An Efficient Optimization Algorithm Based on Runge Kutta Method. Expert Syst. Appl. 2021, 181, 115079. [Google Scholar] [CrossRef]
  40. Rider, M.J.; Garcia, A.V.; Romero, R. Power System Transmission Network Expansion Planning Using AC Model. IET Gener. Transm. Distrib. 2007, 1, 731–742. [Google Scholar] [CrossRef]
  41. Zhang, H. Transmission Expansion Planning for Large Power Systems. Ph.D. Thesis, Arizona State University, Tempe, AZ, USA, 2013. [Google Scholar]
  42. Bhuvanesh, A.; Jaya Christa, S.T.; Kannan, S.; Karuppasamy Pandiyan, M. Aiming towards Pollution Free Future by High Penetration of Renewable Energy Sources in Electricity Generation Expansion Planning. Futures 2018, 104, 25–36. [Google Scholar] [CrossRef]
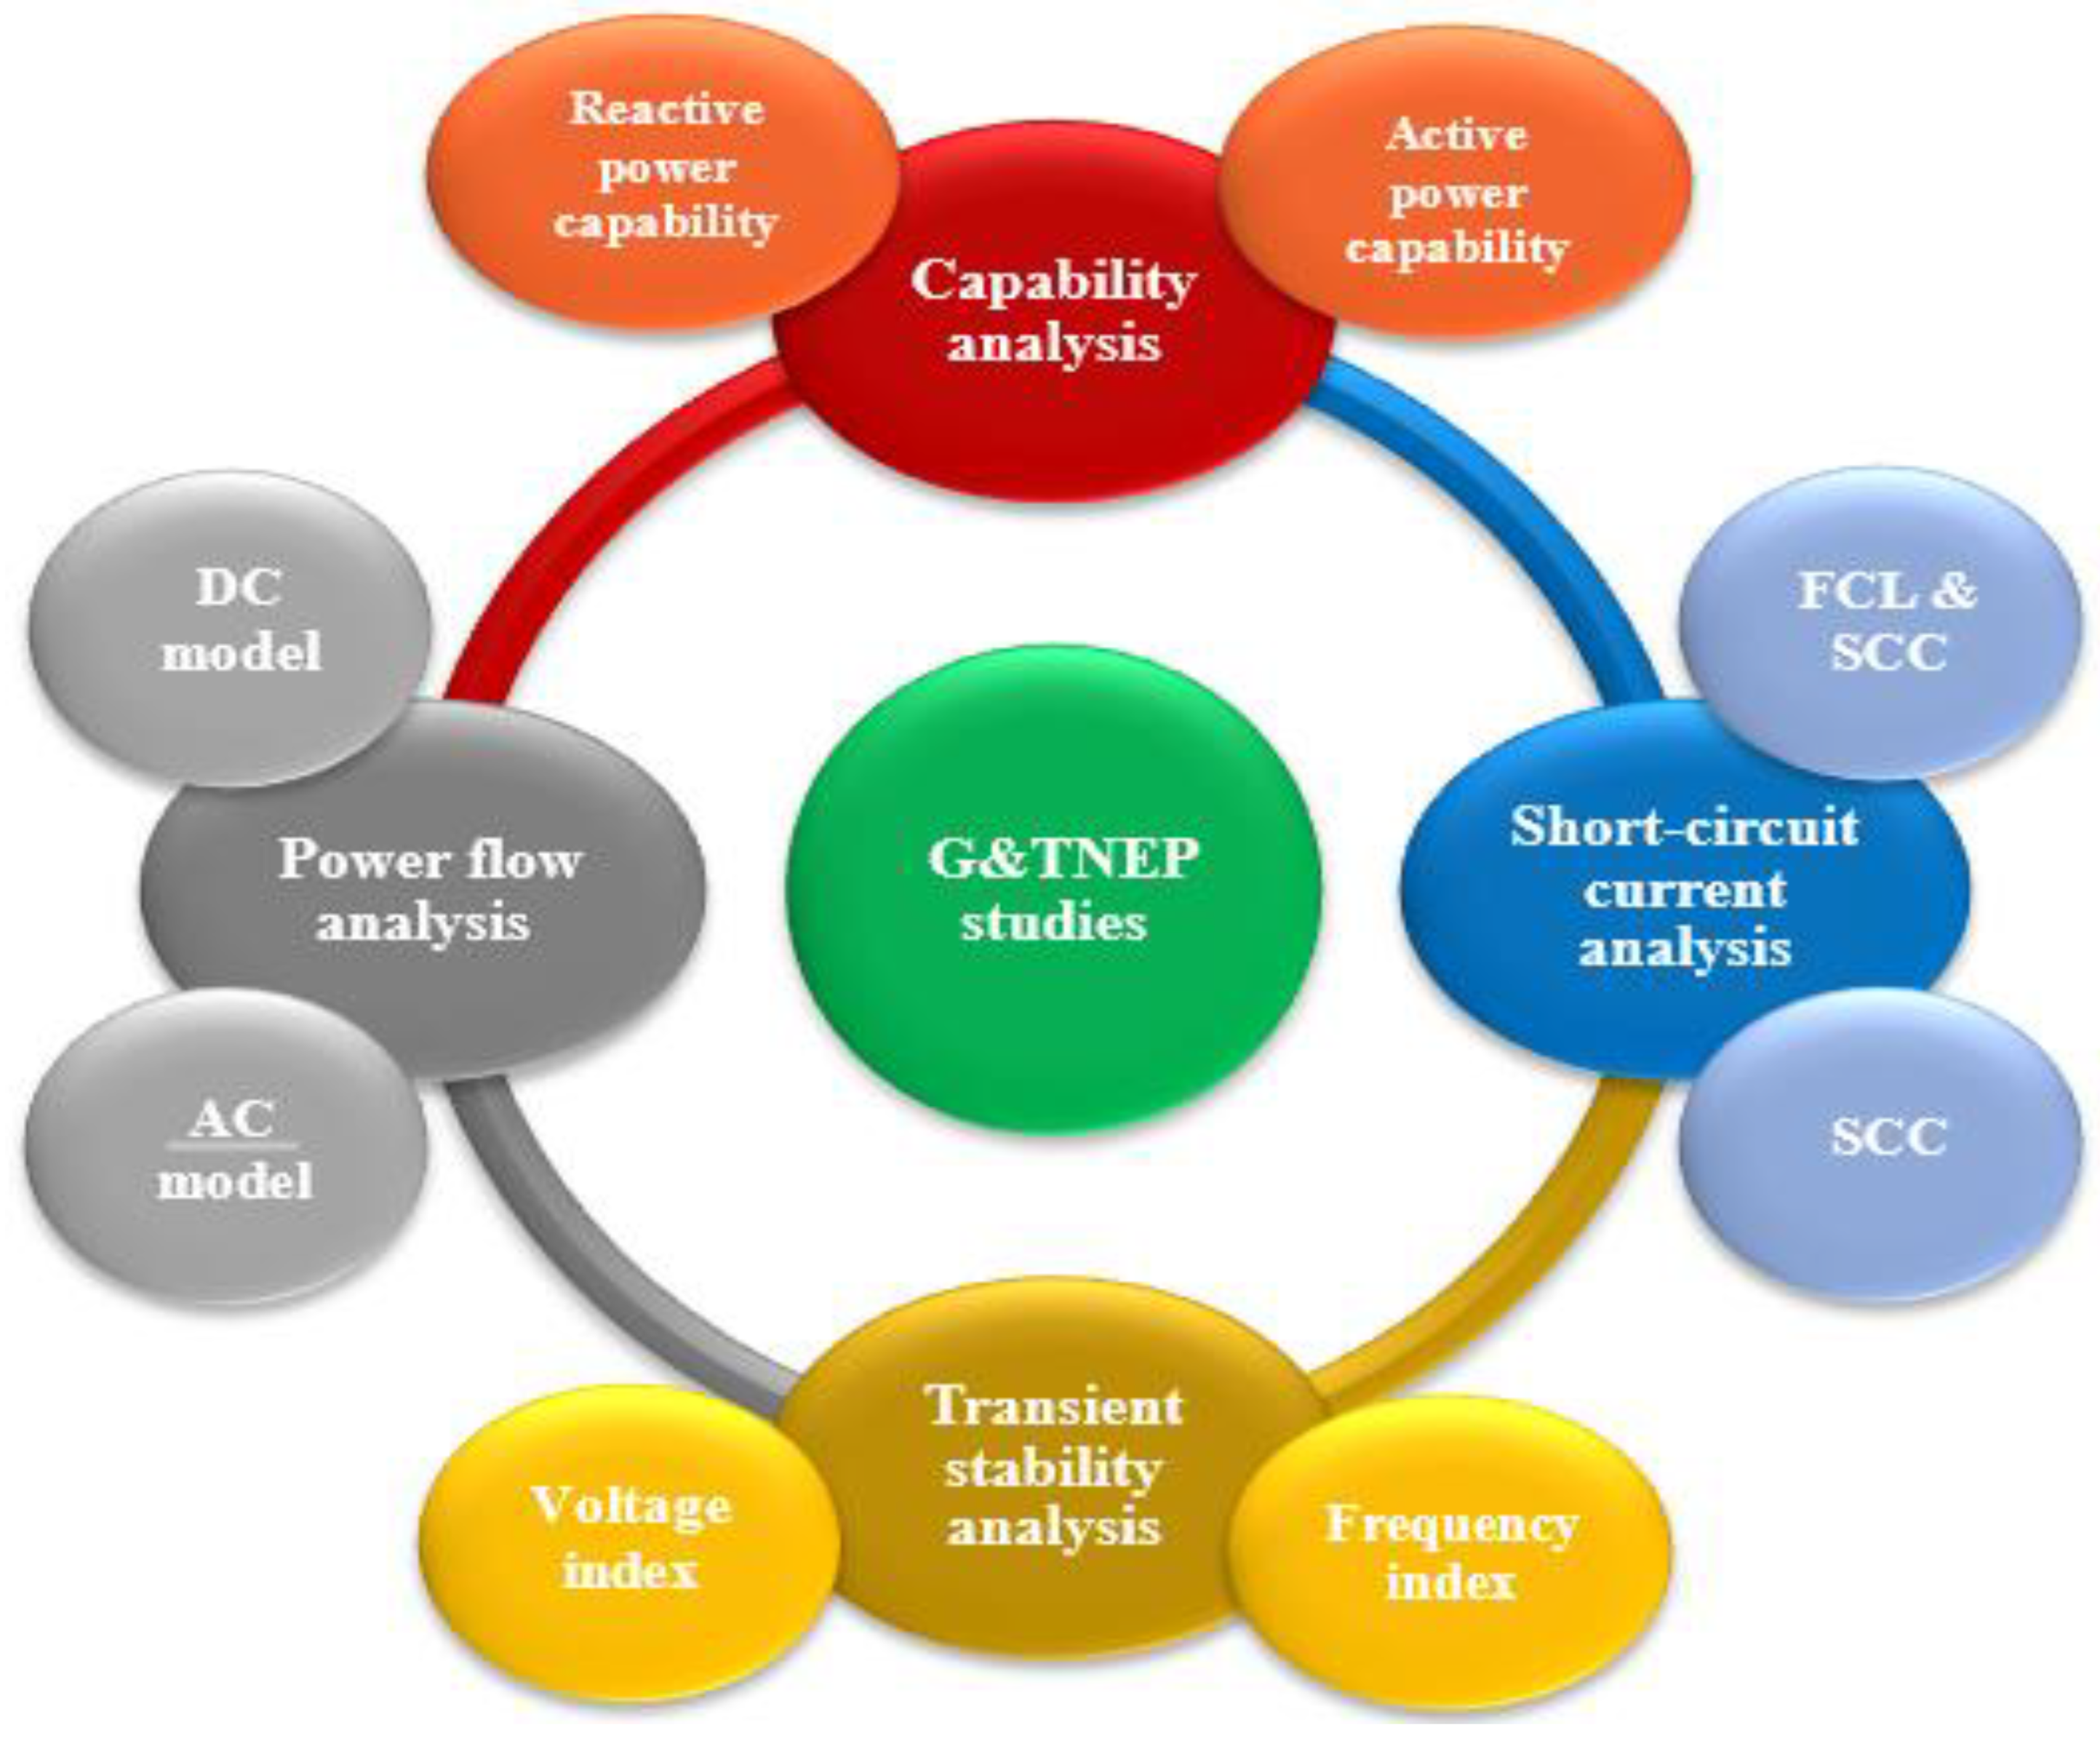
Figure 1. Technical studies required for implementing G&TNEP.
Systems 11 00023 g001
Figure 3. Flowchart of the proposed decision-making approach.
Systems 11 00023 g003
Figure 4. Impact of adding new circuits and TCSCs between buses m and n.
Systems 11 00023 g004
Figure 5. Flowchart of the proposed RKWSO.
Systems 11 00023 g005
Figure 6. Wind speed and solar radiation profiles over 24 h.
Systems 11 00023 g006
Figure 7. Loads profiles over 24 h.
Systems 11 00023 g007
Figure 8. Convergence curves of the proposed and existing approaches for solving the Garver network: (a) the first model, (b) the second model, (c) the third model, (d) the fourth model, (e) the fifth model for HC = 30% and (f) the fifth model for HC = 0%.
Systems 11 00023 g008aSystems 11 00023 g008bSystems 11 00023 g008c
Figure 9. Impact of using different technologies on the cost of planning of Garver network.
Systems 11 00023 g009
Figure 10. Voltage profile of the Garver network.
Systems 11 00023 g010
Figure 11. Short-circuit current profile of the Garver network.
Systems 11 00023 g011
Figure 12. Planning cost of different projects for the Garver network: (a) the fifth model at HC = 30%, and (b) the fifth model at HC = 0%.
Systems 11 00023 g012
Figure 13. SOC of ESSs at buses 2 and 5 for the Garver network.
Systems 11 00023 g013
Figure 14. Charging and discharging powers of PHS: (a) charging and discharging active powers and (b) charging and discharging reactive powers.
Systems 11 00023 g014aSystems 11 00023 g014b
Figure 15. Convergence curves of the RKWSO, SO, WSO, SCA, and RUN for the Garver network: (a) the reduced-scale model and (b) the full-scale model.
Systems 11 00023 g015
Figure 16. Convergence curves of the proposed and existing approaches for solving the 118-bus system: (a) the first model, (b) the second model, (c) the third model, (d) the fourth model, (e) the fifth model for HC = 30% and (f) the fifth model for HC = 0%.
Systems 11 00023 g016aSystems 11 00023 g016bSystems 11 00023 g016c
Figure 17. Impact of including different technologies on the planning cost for the 118- bus system.
Systems 11 00023 g017
Figure 18. Voltage profile of the 118-bus system.
Systems 11 00023 g018
Figure 19. Short-circuit current profile of the 118-bus system.
Systems 11 00023 g019
Figure 20. Planning cost of different projects for the 118- bus system: (a) the fifth model at HCmin = 30%, and (b) the fifth model at HCmin = 0%.
Systems 11 00023 g020
Figure 21. SOC of ESSs for the 118-bus system: (a) PHS, and (b) Li-ion.
Systems 11 00023 g021
Figure 22. Convergence curves of the RKWSO, SO, WSO, SCA, and RUN for the 118-bus system: (a) the reduced-scale model and (b) the full-scale model.
Systems 11 00023 g022
Table 1. Results of the proposed and the existing approaches for the Garver network.
ApproachStatistical TestModel #1Model #2Model #3Model# 4Model# 5
(HCmin = 30%)
Model# 5
(HCmin = 0%)
Proposed SchemeThe best cost62.813756.505954.41554.85372.8653.55
The worst cost73.5961.819266.54365.08480.2360.86
Robustness533222
T * (s)98.51105.30121.87155.68199.32190.31
SD *2.191.5853.053.262.121.94
Mean65.90460.10860.18958.92175.9356.28
Existing ApproachThe best cost62.814856.761954.65555.87374.6257.62
The worst cost76.13666.900169.50965.00586.3375.005
Robustness432111
T (s)100.16142.23178.66213.90343.14355.24
SD2.652.673.2183.683.414.18
Mean68.49460.83860.80959.99781.1662.97
* T: the time required to execute one run, SD: standard deviation.
Table 2. Comparison between the RKWSO and SO, WSO, SCA, and RUN for solving the Garver network.
ApproachStatistical TestRKWSOSOWSOSCARUN
Proposed schemeThe best cost72.8675.9773.0676.5473.30
The worst cost80.2397.5886.94102.2284.31
Robustness21112
T (s)199.32183.34115.52142.52328.78
SD2.124.513.5045.113.12
Mean75.9381.9178.4188.5377.58
Existing approachThe best cost74.6277.1876.0780.2374.73
The worst cost86.3398.7090.14104.6190.65
Robustness11111
T (s)343.14276.23246.33270.02501.87
SD3.415.423.716.853.22
Mean81.1684.683.0495.5182.49
Table 3. Results obtained for the 118-bus system.
ApproachStatistical TestModel #1Model #2Model #3Model #4Model #5
(HCmin = 30%)
Model #5
(HCmin = 0%)
Proposed schemeThe best cost108.411106.2339105.952109.665408.57229.99
The worst cost117.518113.973118.76120.095417.23248.917
Robustness322212
T (s)703.24732.2768.18840.022409.562398.38
SD2.172.3053.8633.6022.8555.034
Mean112.2201109.645110.436116.571413.478235.67
Existing approachThe best cost108.629108.435108.697110.697427.27237.69
The worst cost124.249113.862120.453130.192443.79267.023
Robustness221111
T (s)811.22851.41907.051104.102904.872969.51
SD2.642.4244.1237.6064.022510.401
Mean118.832110.462115.6895119.253433.224248.14
Table 4. Comparison between the RKWSO and SO, WSO, SCA, and RUN for solving the 118-bus system.
ApproachStatistical TestRKWSOSOWSOSCARUN
Proposed schemeThe best cost408.57422.62413.81427.06411.94
The worst cost417.23450.53448.31462.32422.41
Robustness11111
T (s)2409.562343.552244.392200.932785.71
SD2.8555.6519.34910.763.152
Mean413.478432.827429.335445.234417.14
Existing approachThe best cost427.27448.42443.17461.33433.85
The worst cost443.79469.254462.024486.78448.230
Robustness11111
T (s)2904.872851.112765.022723,913147.33
SD4.02257.216.496.2134.2814
Mean433.224456.526452.051473.847439.908
Disclaimer/Publisher’s Note: The statements, opinions and data contained in all publications are solely those of the individual author(s) and contributor(s) and not of MDPI and/or the editor(s). MDPI and/or the editor(s) disclaim responsibility for any injury to people or property resulting from any ideas, methods, instructions or products referred to in the content.