Abstract
The importance of a port’s strategic position has long been recognized, during which process inter-port competition is becoming increasingly fierce. This paper aims to assess the domestic and international competition patterns of 43 coastal container ports in China. A global port competition network model (GPCN) is developed based on the global liner shipping network (GLSN) model and the multiple linkage analysis (MLA) method. In the GPCN model, three competition indicators (competition degree, competition intensity, and competitive pressure) are proposed to quantitatively describe the competitive patterns of Chinese container ports. This study has found that ports tend to compete with other ports that have similar competition degrees, and competition among large ports may be more intense. Additionally, a port’s traffic volume is correlated well with its competitiveness; the larger Chinese ports, such as Shanghai, Shenzhen, Ningbo-Zhoushan, and Hong Kong, have put much more competitive pressure on their smaller competitors than they are subjected to, and Singapore and Busan ports are found as the main competitive threats to the development of Chinese coastal container ports. The methodology developed in this study can provide a good strategic decision-making and guidance tool to quantitatively assess the competition situations of other countries’ coastal container ports.
1. Introduction
Port competition has a key influence on the development orientation of ports, the resource allocation among ports, and the daily operation of ports [1], due not only to the large volume of goods involved in port throughput—a direct measure of a port’s competitiveness—but also to derived effects, such as development in employment, investment, and related supporting industries.
China, as the world’s main “commodity processing plant,” has become a port giant, as its container throughput accounted for almost 34% of the world total in 2020 [2], and 7 Chinese container ports are among the top ten in the world in terms of the container throughput volume. Although the Chinese container port system occupies a large market share, it experiences severe competition resulting from highly dynamic business environments, such as a trend toward larger vessels, economic fluctuations, overinvestment in infrastructure, pandemic adaptation, and resilience [3].
The Ministry of Transport of the People’s Republic of China issued the Bulletin of the 2021 Transport Development Industry. The data show that many ports in China continue to integrate together or cut investment to mitigate the vicious competition. For both inland and coastal ports, the number of productive berths is decreasing. However, the number of container berths in ports shows an increase of 6 compared with 2020, indicating the investment in container port infrastructures.
Looking into the future, China will continue to open up and trade with countries worldwide [4], a policy that relies on the sustainable development of coastal container ports because containership transport has always been an essential part of maritime trade [5]. Awareness of the competition pattern of container ports can inform policymakers on the need to enact relevant policies or make better investment decisions to develop their ports, especially against the backdrop of competition among container ports intensifying since the COVID-19 pandemic heavily impacted maritime supply chains.
The topic of port competition is quite important in transport economics and beyond [6]. The study of the subject grew rapidly in the mid-1990s during a boom in the containerization process [7]. The existing studies discuss port competition mainly in three aspects: port competitiveness, port selection, and port hinterland delimitation.
Port competitiveness refers to the capability to achieve comparative advantage [8]. As Talley pointed out, it is useful to improve port competitiveness to compete with other ports [9]. Many scholars have discussed port competition by examining port competitiveness, providing useful insights into key factors that influence port competitiveness, such as infrastructure, geographical location, operational efficiency, port price, hinterland connectivity, and hinterland economy [10,11,12,13,14,15]. The factors impacting port competitiveness are many and vary over time [16]. For instance, Hales et al. built a hierarchical framework to assess several criteria for port competitiveness and found that port location was the most important competitiveness criterion [17]; however, Kaliszewski et al. concluded that port service quality, social harmony with labor, and accessibility were the critical factors impacting port competitiveness [18]. Moreover, graph theory provides important measures that define a port’s competitiveness [19]. That is, taking ports as nodes and sailing routes between ports as links in the shipping network, the port position can be well assessed by calculating the node centrality as a general measurement [20,21,22,23].
Port selection is related to port competitiveness; namely, strong competitiveness increases the likelihood that a port will be chosen. Considering that different groups of port clients may favor different factors that impact port performance, researchers have studied port selection mainly from two main perspectives: carriers, which directly choose their ports of call to form the shipping network [24], and shippers (consignees and consignors), who indirectly choose their ports of origin and destination for shipments [25,26]. In their research, Ng et al. concluded that cost and demand were the most important factors in the port choice decision of carriers [24]. Kolar and Rodrigue examined the issue of port selection criteria by freight forwarders in the landlocked Czech Republic and stressed the significance of intermodal service frequency and reliability [25]. Moreover, Baştuğ et al. conducted research on port choice to identify the competitiveness criteria of port operators and found that port location was the most important factor impacting port competitiveness, which was quite different for port users [8].
The expansion of the port hinterland is at the core of ensuring the competitiveness of modern ports [27]. In this sense, port hinterland, which refers to a geographical area that provides the majority of business for a given port, is another main component of port competition. Rodrigue suggested that the hinterlands of a port comprise the captive hinterland, where a port has a dominant market share, and the contestable hinterland, which is connected to several ports, and the focal port has a limited market share [28]. Competition among ports for contestable hinterland tends to be increasingly fierce because of the development of land infrastructure [29] and the boom in containerization and multimodal transport [30,31]. Many researchers have made an effort to delimitate the captive hinterland and the contestable ones of different ports [32,33] since a reasonable hinterland can effectively avoid homogeneous competition [34]. For instance, Peng et al. investigated the hinterland evolution of the eight Chinese container ports exporting to Europe and demonstrated that the dominant hinterlands of northern ports continued expanding in the assumed scenarios [33]. In addition, port hinterland connectivity has been well discussed [35,36] since the better a port’s connection is to its markets, the larger the potential to enlarge its overall hinterland [30].
Although numerous and rich methods, such as the Huff model [32], social network analysis [37], and game theory [38], are used to explore port competition in the above three aspects, providing a useful reference for this study, two main research gaps associated with port competitions are found. On the one hand, most studies have focused on their themes from the traditional port-centered perspective [39,40], assessing the outperformance or underperformance of specific ports to indirectly describe port competition, but they neglect the fact that port competition involves not only the competitiveness of the ports involved in the competition but also involves the examination of the existence of competitive relationships between ports and the quantification of their intensity. On the other hand, existing studies tend to be limited to describing competition through port hinterland division, especially in the case of ports with relatively distant geographical relations, and the majority of studies focus on the delimitation of hinterland boundaries in the case of only a handful of ports [41].
The current work adopts a complex network perspective paying attention to the competitive relations between ports and the whole competition network structure, which involves both ports as nodes and competitions between ports as links, instead of only focusing on ports in most of the existing literature. The method of constructing the competition network in this article can be traced to the literature of Cullinane and Wang [42], which mentions that significant flows in a shipping network may uncover the competitive relationship between ports. The research questions are as follows. Which ports are the main competitors for Chinese container ports? How fierce is the competition, and how great is the competitive pressure? Where do Chinese container ports stand in this competition? To the best of our knowledge, little attention has been given to such issues, so it is inspiring to measure and map the competition profile faced by Chinese container ports.
This paper proceeds as follows: Section 2 constructs the complex network models; Section 3 briefly discusses the data and addresses the methodology; Section 4 presents the empirical results, namely, the distribution of significant flows and competition analysis, followed by a brief discussion; and finally, Section 5 presents the research findings, policy implications, limitations, and directions for further study.
2. Development of the GPCN Model
A global port competition network (GPCN) model composed of ports as nodes and inter-port competitions as links is developed in a three-step approach in this study. First, a global liner shipping network (GLSN) is built as the basis for further analysis since port competition is a relative process during which ports see their positions modified in a given shipping network [20]. Second, a new GLSN (GLSN*) retaining only the significant flows between ports is derived by employing multiple linkage analysis (MLA), as Cullinane and Wang proposed that the distribution of significant flows in the network indicates the potential overlapping of hinterlands, thus yielding inter-port competition [42]. Third, inter-port competition is determined by the existence of significant flows within the GLSN*.
The GLSN model is composed of ports as nodes and connections realized by shipping routes as links, where two ports visited by the same vessel on service would be connected since shipping networks are generally built upon a majority of indirect calls [43]. To make the GLSN model more realistic, we weight the network by considering the tightness of the routes connecting two ports on the basis of a previous study by Hu and Zhu that used the number of shipping routes as substitutes for container traffic volume on each link [44].
As the edge weight of GLSN, is suggested as a relative measurement of the container traffic volume between any two ports i and j, and can be calculated according to the following formula:
where is the aggerate number of connections on all the shipping routes from port to port [44]; and are sets of shipping routes passing through port and port . For two-port pairs with the same value of , the greater the value of is, the closer the connection between the port pair is. also holds in a directed network.
The relative total traffic of port denoted by is the sum of the weights of all the edges connecting the focal port.
where is calculated from Equation (1), is the out-traffic of port i, and is the in-traffic of port i. is correlated with the container throughput (i.e., taking 54 container ports as the sample, containing 43 Chinese container ports and 11 other ports ranking in the top 20 in the world, the correlation coefficient is 0.887); thus, can be a reasonable proxy for the actual link weight.
The GLSN* is a network model that modifies the GLSN by removing nonsignificant links. With the MLA applied, a criterion can be found to distinguish the significant flows from the nonsignificant flows. To expedite the MLA, the method suggested by Holmes and Haggett is adopted [45], and the goodness-of-fit of determination coefficient is calculated as:
where is calculated from Equation (1), is the expected flow, and is the mean of the observed values.
Wang et al. suggested that competition occurs when sectors share the same providers/consumers because resources are limited [46]. Similarly, inter-port competition may occur when two ports share a common origin of significant flows [47].
Figure 1 presents an example of competition relations extracted from significant flows. For origin ports A1 and A2, significant flows head to destination ports B, C, and D. Then, competition exists to varying intensities among the three destination ports, which depends on the number of common origin ports issuing significant flows. Port pairs with a competition intensity of 1, such as the BD and CD pairs, are rendered nonsignificant and thus could be reasonably deleted with little impact on the network structure.
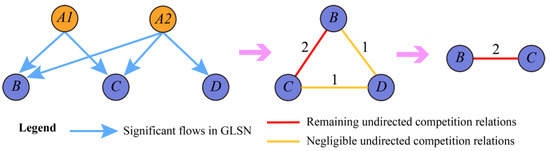
Figure 1.
Determination of competition between ports. A1 and A2 are origin ports, while B, C, and D are destination ports.
Although the competitive relation between any two ports is undirected, it may be of different importance for different focal ports. For example, in Figure 2, the BD pair, which is significant for port D, is negligible compared with the BC pair for port B. Competitive relation BD is potential for the two ports since only one port (i.e., port D) recognizes the competition. However, actual competition exists between B and C since the two ports consider each other significant competitors. MLA could also be applied to detect significant competitive relations for each port.
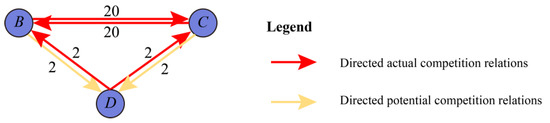
Figure 2.
Actual and potential competitions due to different emphases on the same competition pair by different ports.
3. Data and Methods
3.1. Data Description
The vessel sailing schedule data used in this study consist of all the service routes operated by the global top 30 individual liner companies in the fourth quarter of 2020. As the transportation capacity of these large shipping lines is 92.3% of the global total, it is large enough to reflect the structure of the GLSN. There are 2292 liner shipping service routes (excluding repeated routes) collected, with detailed port rotation information referring to the list of ports at which a container ship consecutively calls during the voyage from the port of origin to the port of destination. A total of 751 container ports located in 19 different maritime regions were collected [48], including 43 Chinese container ports with their container throughput in 2020, listed in Table 1.

Table 1.
List of Chinese container ports in GLSN.
3.2. Competition Indicators
To analyze the competition patterns of Chinese container ports in the GPCN from different dimensions, three indicators were proposed: competition degree, competition intensity, and competition pressure.
The competition degree (CD) of a port , denoted as CDi, is borrowed from the concept of Freeman’s degree in complex networks [20], indicating the total number of other ports connected with the focal port in the GPCN; that is, the number of competitors of port . The higher the competition degree value of a port is, the more competitors it has in the GPCN.
where if port and port are in competition; otherwise, 0.
The competition intensity (CI) of a port , denoted as CIi, is the average number of ports of origin issuing significant flows for which focal port i competes with the other ports. To some extent, CI can be used to depict how much contestable market share a port is competing for with its competitors. The more markets that can be contested, the higher the competition intensity of a port is, and thus more intense the competition.
where is the competition intensity between port and port , indicating the tightness of competition between port i and port j.
The competition pressure (CS) from/to the focal port i, denoted as CSi, can be measured by the market share of its competitors weighted by the importance of these markets for the port and the competitors’ size in terms of total relative traffic volume.
where is the competitive pressure put on the other linked ports by focal port i; is the pressure from port i; is the competitive pressure from port i to port j; is the competitive pressure from port j to port i, subfix a represents the common origin port issuing significant flows to both port i and port j; and and represent the relative traffic volume from common origin port a to port i and port j, respectively. and represent the total volume of significant flows possessed by port i and port j, respectively.
4. Results and Discussion
4.1. Network Characteristics and Significant Flow
The topological characteristics of the three network models are summarized in Table 2. Notably, only 22 Chinese container ports participate in the competition because 5 Chinese ports have no significant flows, and 16 ports that undertake significant flows have no competitive relations.
Table 2.
Structural characteristics of the GLSN, GLSN*, and GPCN.
We found that the GLSN and GLSN* were nearly neutral (i.e., −0.2 < assortativity index < 0.2), while the GPCN is weakly assortative (i.e., 0.2 < assortativity index < 0.6) by computing assortativity [49], which is used to evaluate the tendency for nodes to connect to other nodes with similar degrees (i.e., positive assortativity) or dissimilar degrees (i.e., negative assortativity). Tests on the power-law distribution of the GLSN and the GPCN failed with a p-value for the significance of likelihood ratio > 0.05, based on the method of Clauset et al. [50]. In addition, GLSN* is fitted using an exponential function instead of a power law since the p-value for the goodness-of-fit test <0.1. Thus, in the three networks, fewer ports possess a large number of links, while more ports possess small numbers.
Figure 3 presents significant flow distribution among 19 maritime regions, showing the unevenness of the distribution of significant flows. Inter-regional significant flows account for 35.15% of the total number of significant flows, which is smaller than the number of intra-regional ones to a greater extent. We found that inter-regional significant flows mainly occurred between maritime region pairs that were usually geographically close to each other because ports located close to each other are more likely to connect tightly with each other to a certain degree, such as Europe–Mediterranean and West Asia, North Africa and Europe–Mediterranean, and China and Southeast Asia. The volume of inter-regionally significant flows is relatively large in East Asia; Chinese ports undertake significant flows from Northeast Asia and Southeast Asia, and the flow volume from China to Southeast Asia is also quite significant.
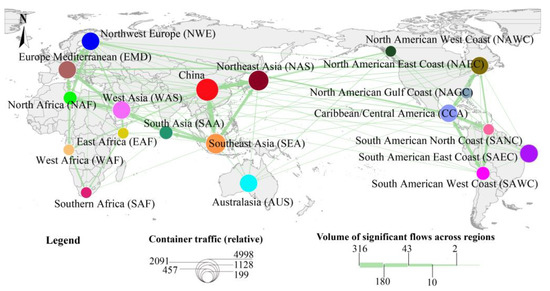
Figure 3.
Distribution of significant flows among 19 maritime regions.
Figure 4 presents the 18 ports that have significant flows greater than or equal to 20. However, a significant number of ports, i.e., 407 ports (accounting for 54.19% of the total), have no more than three significant inflows. Three Chinese container ports are among the top 18 ports by the number of significant inflows, among which Hong Kong ranked third, following Singapore in Southeast Asia and Piraeus in Europe–Mediterranean. Shenzhen and Shanghai are not prominent in the rankings, but regarding the volume of significant flows, Shenzhen ranked first, followed by Shanghai, which has the largest container throughput for 10 consecutive years and comes at the top in terms of both degree centrality (i.e., the number of edges directly connected to the node) and node strength (i.e., the total relative container traffic) in the GLSN. However, other ports (e.g., Piraeus, Jeddah) with a relatively large number of significant flows did not perform well regarding the volume of significant flows. Another example is Ningbo-Zhoushan, which is not displayed in Figure 4 but ranks among the top 5 in terms of significant flow volume, which indicates more control of container traffic from other subordinate ports. Ports that have a higher propensity to communicate with other ports in quality and quantity instead of only aiming at quality may have a relatively high position and function as a hub in the GLSN and, thus, can be more competitive. Chinese ports perform better in terms of volume than in terms of the number of significant connections, possibly because the ports’ functions are mainly as regional gateways, not as transshipment hubs for international liner shipping services [48].
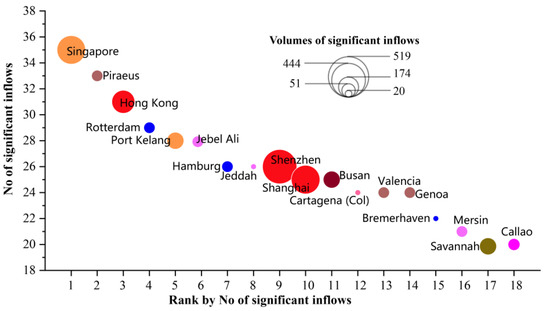
Figure 4.
Ports that have no fewer than 20 significant flows.
4.2. Port Competition Analysis
As mentioned above, competition degree (CD) and competition intensity (CI) can be used to describe the number of competitors for ports and to measure the strength of the competition, respectively. Moreover, the competition pressure indicator (CS) is calculated as a supplement to depict port competition since the pressures felt by the ports at both ends of the same competitive relationship are different, as illustrated in Figure 2. The competition pattern of Chinese container ports is analyzed at both the national and international levels, employing the three indicators in Table 3, where CS is characterized by CSin and CSout jointly.
Table 3.
Competition situation indicated by three indicators for 22 Chinese container ports in the GPCN.
The domestic port competition network of China (see Figure 5a) contains 22 container ports and 60 pairs of competitive relations, among which 41 pairs denote actual competition, while 19 pairs represent potential competition. Most domestic potential competitions are relatively weak, with competition intensity values of less than 5, and the direction of potential competition is mainly from ports with low CI to ports with high CI. For instance, Shanghai is a potential competitor for both Xiamen and Dalian, and Hong Kong is a potential rival for Keelung and Beibu Gulf.
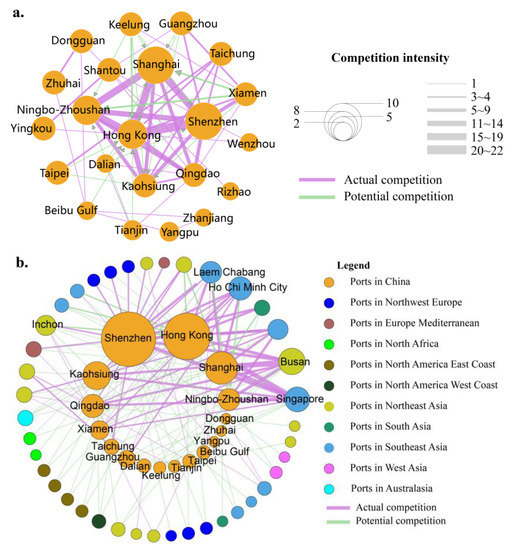
Figure 5.
Domestic and international competition patterns depicting Chinese container ports with CI and CD. (a) maps the domestic competition among Chinese container ports, while (b) presents international competition with the thickness of the edges and sizes of nodes representing competition intensity.
With regard to CD, Hong Kong ranks first, followed by Shenzhen, Qingdao, Shanghai, and Kaohsiung, and the number of actual competitors of these 5 ports is greater than 5. However, Qingdao has the most actual competitors, including gateway hub ports, such as Shanghai, Hong Kong, and Kaohsiung; regional gateway ports, such as Ningbo-Zhoushan, Xiamen, Tianjin, and Dalian; and small-scale seaports, namely, Shantou. Shanghai possesses the highest CI, followed by Shenzhen, Ningbo-Zhoushan, and Hong Kong, which indicates that the competition between the four ports and their rivals is fiercer and more intense.
The competition between Hong Kong and Shenzhen in the Pearl River Delta is the most intense, with the highest competition intensity of 22, followed by the competition between Shanghai and Hong Kong (19), Shanghai and Shenzhen (18), and Shanghai and Ningbo-Zhoushan (16) in the Yangtze River Delta (16). Since the four large-scale ports (i.e., ports with large container throughput) take on a gateway or hub function to a certain degree in China’s foreign trade, it is easy to understand that fierce competition occurs among them due to the greater overlap of accessible internal or external markets. Other ports participating in domestic competition mainly face weak competition and possess a relatively low CI.
The results indicate that most large-scale ports are more powerful in terms of significant traffic consolidation than medium- or small-scale ports, which is related to the hub-and-spoke arrangement used in shipping services. Therefore, larger ports compete quite fiercely for more significant flows both in volume and number, which results in more competitors, much stronger competitive relations, and a larger competition scope.
For international competition, 17 Chinese container ports and an additional 40 foreign container ports, among which there are 11 ports in Northeast Asia and 9 ports in Southeast Asia, form 128 competitive relations, containing 63 pairs denoted as actual competition and 65 pairs considered potential competition. However, all the potential competitions are quite weak since 57 of these pairs have a competition intensity with the value of 2, and the intensity of the other 8 pairs is no more than 4. Moreover, most potential competitive relations are directed from other maritime regions to China.
Concerning the international competition degree, Shenzhen takes first place with 13 actual competitors and 16 potential competitors, followed by Hong Kong, Shanghai, and Kaohsiung, which have 24, 15, and 12 competitors, respectively. Qingdao, Ningbo-Zhoushan, Xiamen, and Guangzhou have more competitors (i.e., no less than 5). However, Tianjin and Dalian, as relatively large container ports, are less active in the competition. Other ports in China, such as Beibu Gulf and Dongguan, possess relatively weak competitive relations with their international competitors. For CI, Ningbo-Zhoushan ranks as the top port, with an intensity value of 5.50, followed by Shanghai (5.13), which indicates that these two ports compete fiercely with their rivals. The CI values for Hong Kong, Shenzhen, and Qingdao, all between 3 and 4, are higher than those of other ports in China. Among the large-scale ports in China, Guangzhou, a port located in the Pearl River Delta that has a large volume of container throughput and is comparable with Shenzhen in the same port group, is considered to have the least ambition to compete with existing hubs for the international market regarding the number of competitors and the competition intensity.
It is also interesting to consider the competitive situation from the other perspective; that is, we can detect which foreign ports are the main rivals for Chinese container ports by examining the three competition indicators. Singapore in Southeast Asia, having large container throughput and ranking second only to Shanghai in recent years, and Busan in Northeast Asia, performing well in container traffic, are the most challenging opponents for Chinese ports because, on the one hand, both ports compete with more than 10 Chinese ports; on the other hand, both of them possess a high CI, which indicates intense competition with their Chinese competitors. In addition, Port Kelang, Ho Chi Minh City, Colombo, and Laem Chabang are key rivals for Chinese container ports.
Figure 6 provides insight into the competitive pattern of Chinese container ports from the perspective of competitive pressure.
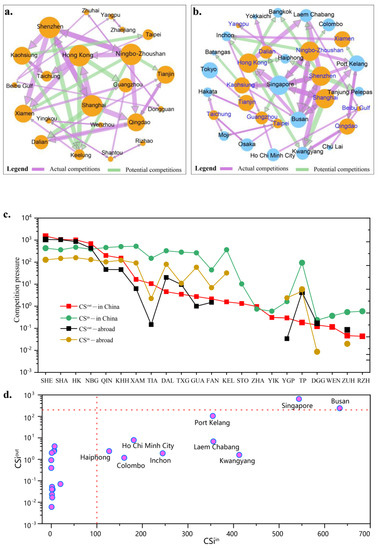
Figure 6.
A portrayal of competitive pressure for container ports. (a,b) present the domestic and international competition pressure faced by ports, respectively. The amount of pressure is indicated by the edge thicknesses, and the total relative traffic of ports is denoted by the circle sizes. For both domestic and international competitions, ports assuming or imposing less competitive pressure are not mapped. (c) depicts the pressure of 22 Chinese ports on other ports (CSout), including domestic (CSout−in China) and foreign (CSout−abroad) ports, and the pressure they face (CSin−in China, CSin−abroad). Panel (d) maps the pressure from and to foreign ports in competition with Chinese ports.
Several Chinese ports are under greater domestic pressure from their potential competitors than from their actual competitors (Figure 6a). For example, the potential pressure Shanghai in the Middle sub-region of China puts on Dalian in the Northeast sub-region is greater than the actual pressure Qingdao, also in the Northeast, puts on Dalian, which indicates not only a challenge in the hub ports structure in each sub-region of China but also a collapse in the barrier between the different sub-regions. The greatest competitive pressure on ports may come not from within the port group but from the main large ports of other port groups. For example, Shenzhen, located in the Pearl River Delta, is the most influential competitor of Ningbo-Zhoushan and Shanghai, both of which are located in the Yangtze River Delta. Shanghai is also the largest competitor of Shenzhen.
Additionally, in the domestic competition, Shenzhen and Shanghai bring immense pressure to 7 ports (Xiamen, Kaohsiung, Ningbo-Zhoushan, Shanghai, Keelung, Guangzhou, and Taichung) and 5 ports (Shenzhen, Hong Kong, Qingdao, Dalian, Xiamen), respectively, making Xiamen Port and Kaohsiung Port face the greatest domestic competition pressure (see Figure 6c). Compared with other domestic ports, Shenzhen, Shanghai, Hong Kong, and Ningbo Zhoushan have exerted far greater pressure on the development of domestic ports than they have received, which indicates the competitiveness of the four ports.
In international competition, most Chinese container ports have a close competitive relationship with ports located in Southeast Asia and Northeast Asia (Figure 6b), which indicates that geographical factors have a key influence on the formation of intense competition. Additionally, large potential competition pressures are mostly imposed by Chinese ports on foreign ports since Chinese container ports occupy a large market share in container throughput. Although Singapore’s status as the world’s largest container port has been overturned by Shanghai since 2012, Singapore puts the most pressure on Chinese container ports, with a CSout value of more than 700 (see Figure 6d) and represents the most significant competitor for 10 Chinese ports, including Shanghai Shenzhen, Ningbo-Zhoushan, Hong Kong, Xiamen, Qingdao, and other world-class container ports. Moreover, Busan places great pressure on Chinese container ports compared with other foreign ports. However, most foreign ports, including Busan, Port Kelang, Colombo, etc., face greater pressure from Chinese ports than they exert. Although the Northeast Asian ports of Tokyo, Nagoya, and Yokohama put slightly more pressure on Chinese container ports than Chinese ports exert on them, the quantified pressure value is small.
4.3. Discussion
Our results show that fierce competition is prone to exist between major ports in the same port group and between large ports in different groups, with a little neglect of small-scale ports. Here, we treat the ports in each maritime region as a whole to explore the profile of port competition at the maritime region level by using several competition analysis indicators. We also discuss the correlation between port container traffic and competition-related indicators.
The competition between maritime regions that are far apart tends to be low (see Figure 7a) since it is less likely for ports that serve relatively distant markets to compete fiercely with each other. The phenomenon that more competition occurs between maritime regions that are geographically closer illustrates the effectiveness of the method of constructing competitive relations proposed in this study to a certain extent.
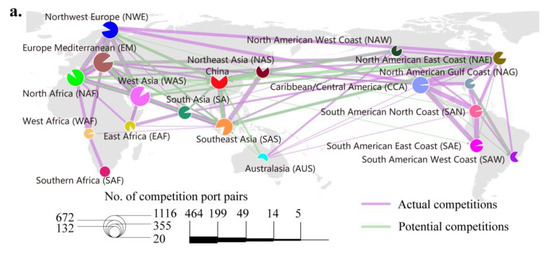
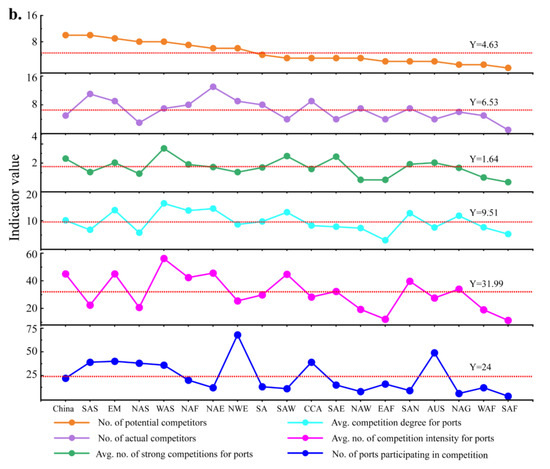
Figure 7.
Port competition at the regional maritime level. (a) presents the actual and potential competition among maritime regions. The central angle of the sector indicates the proportion of actual competition. The number of competitors for each region is denoted by the circle size, and the edge weight between any two regions is the total number of competition port pairs obtained by adding the competition among ports in the two regions. In (b), the value of Y is the average value of the indicators of the entire GPCN.
China has few actual competitors (i.e., 5) but many potential competitors (i.e., 10). Southeast Asia and Northeast Asia are the main potential competitors since more competitor port pairs exist between China and these two regions, which indicates more intense competition. For potential competitors, it is interesting that ports in China recognize only ports in Southeast Asia and Northeast Asia as their potential competitors but are considered potential competitors by ports in the other 8 regions, among which Australasia, North American East Coast, North Africa, North American West Coast, and West Asia are not competitors from the perspective of Chinese ports. Figure 7b summarizes the competitive characterizations of different maritime regions for comparison with the overall characteristics of Chinese port competition. Among the 5 indicators describing competition characteristics (i.e., apart from the number of ports participating in the competition, which is certainly related to the total number of ports in each region), 4 indicators of the Chinese container port system are all above the average, which is the case in the other four maritime regions (i.e., West Asia, Europe Mediterranean, North Africa, and South America North Coast). Therefore, the Chinese container port system faces relatively high competition as a whole.
The total container traffic has been used to effectively reflect the position of a port in the GLSN [51]. In this study, the relative total container traffic (Si) is used to replace the real total container traffic, which is feasible, as mentioned above. Therefore, we report the correlation between Si and various competition-related indicators in Figure 8. The volume of significant flow (SIF-Volume) possessed by the port has the closest relationship with Si, with correlation coefficients of more than 96% at both the global port level and the Chinese port level. The pressure released by the port is also significantly related to Si. This shows that large ports would have more control over the significant cargo flows of other ports and tend to put greater pressure on other ports in the shipping network. Moreover, at the global and Chinese port levels, the pressure faced by ports (CS) is moderately related to the total container cargo flow since medium-sized or small ports are pressured by large ports, and vice versa. In terms of the respective correlation coefficients between Si and CI, CD, and SIF-No, significant differences exist between the Chinese port level and the global level; that is, the three correlation coefficients of Chinese container ports are higher than those obtained at the global port level. This may be because Chinese ports’ container traffic volume and SIF-No, which are largely representative of connectivity, CD, and CI are highly relevant, while at the global port level, there are some ports in other maritime regions that have better connectivity but less container traffic volume.
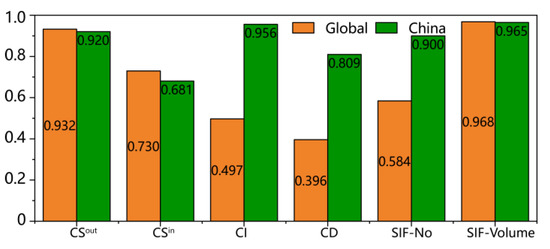
Figure 8.
Correlation between the relative total container traffic and competition-related indicators of ports. We show for ports the Pearson correlation coefficients between the relative total container traffic (Si) and the competition pressure exerted (CSout), between Si and the competition pressure faced (CSin), between Si and the competition intensity (CI), between Si and the competition degree (CD), between Si and the number of significant flows, and between Si and the volume of significant flows at the global (yellow bar) and country (green bar) levels.
5. Conclusions
The results and discussions above help explore the domestic and international competition situation of Chinese container ports from a complex network perspective. Some main conclusions can be summarized as follows:
- (1)
- The GLSN, GLSN*, and GPCN are reconfirmed to follow the exponential distribution. The distribution of significant flows in the GLSN is uneven, with few ports possessing numerous significant flows and more significant flows occurring in the same maritime regions. The GLSN and GLSN* are nearly neutral networks, while the GPCN is weakly assortative, which indicates that container ports tend to compete with other ports with similar degrees of competition.
- (2)
- Compared with small and medium-sized ports, large ports in the same port group and large ports in different groups are prone to experience fierce competition. China’s large-scale ports, such as Shanghai, Shenzhen, Ningbo-Zhoushan, and Hong Kong, exert far greater pressure on their competitors than they receive, and the four ports put greater pressure on the development of regional gateway ports in China.
- (3)
- The container ports in Singapore in Southeast Asia and followed by Busan in Northeast Asia pose greater competitive pressure on those in China than do on other foreign ports in the GPCN. More than 10 Chinese container ports have high-intensity competition with those in Singapore and Busan.
- (4)
- The port’s traffic volume is correlated well with its competitiveness, and the position of a container port could be built up by the consolidation of significant flows generated by large-scale ports rather than small and medium-sized ports since the total traffic of a container port has a good correlation with the pressure placed on its competitors and with the volume of significant flows.
The container-port competition is a double-edged sword. Fierce competition implies great pressure on ports and also an impact reflection on local port policies and strategies. The international competition unfolds mainly between foreign ports and large-scale Chinese ports, associated with the behavior of the most influential customers of ports (i.e., shipping lines) and the normal operation of trade patterns. Relatively, the great competition pressure that Chinese ports put on their foreign rivals mainly comes from large traffic volume that is closely related to China’s vigorous economic growth. Intending to enhance ports’ international competitiveness, it is of necessity to speed up the construction of other routes with the large-scale ports as backing to attract more shipping companies and promote seaborne trade. In addition, some provincial port groups in China have been set up to address the port oversupply issues and ease port competition pressures. However, the port cities and operators only implement port integration in the provincial administrative boundary, which is quite different from the market boundary. There is a need to define the functions and roles of each port and get an insight into the driving forces of container port development. The aim of “revitalizing with the port” to expand ports by different port cities can lead to over-investment and resource waste according to the causality between the port container throughput and economic growth. Policymakers are advised to keep these in mind.
This paper provides a new network perspective for understanding port competition; however, it is limited in that it ignores the factors affecting the formation of port competition, e.g., the similar and the same market. In addition, since the GLSN herein is constructed based on statistical physics, mostly involving theoretical analysis and data modeling, there indeed exists some disparity with the real liner shipping network, which may lead to different results. Nevertheless, the paper is exploratory and of significance in developing an approach for detecting and analyzing port competition, which can facilitate similar research in academia. Further studies are needed to reveal the driving forces behind port competition and study port cooperation, which is one of the most important aspects of port relations. Additionally, it could be more interesting to conduct a comparative study by using time series data rather than cross-sectional data on the same port samples.
Author Contributions
Conceptualization, W.L. and Z.Y.; methodology, W.L. and Z.Y.; software, W.L.; validation, K.L. and Z.W.; formal analysis, W.L.; investigation, W.L., Z.W., and Z.Y.; resources, W.L. and K.L.; data curation, W.L. and K.L.; writing—original draft preparation, W.L.; writing—review and editing, W.L. and Z.Y.; visualization, W.L.; supervision, Z.Y. All authors have read and agreed to the published version of the manuscript.
Funding
This research was funded by the Liaoning Province Talent Foundation for Pandeng Scholars (XLYC2002025), the National Natural Science Foundation of China (Grant No. 52001042).
Data Availability Statement
Raw data on world liner shipping services are provided from the websites of the top 30 individual liner companies in 2020, which is not publicly available for the sake of scientific confidentiality. All data generated during this study are, however, available from the corresponding authors on reasonable request.
Conflicts of Interest
The authors declare no conflict of interest.
References
- Dong, G.; Huang, R. Inter-port price competition in a multi-port gateway region. Res. Transp. Econ. 2022, 94, 101178. [Google Scholar] [CrossRef]
- UNCTAD. Review of Maritime Transport 2021. Available online: https://unctad.org/webflyer/review-maritime-transport-2021 (accessed on 1 July 2022).
- Cuong, T.N.; Kim, H.-S.; Xu, X.; You, S.-S. Container throughput analysis and seaport operations management using nonlinear control synthesis. Appl. Math. Model. 2021, 100, 320–341. [Google Scholar] [CrossRef]
- Jiang, Z.; Pi, C.; Zhu, H.; Wang, C.; Ye, S. Temporal and spatial evolution and influencing factors of the port system in Yangtze River Delta Region from the perspective of dual circulation: Comparing port domestic trade throughput with port foreign trade throughput. Transp. Pol. 2022, 118, 79–90. [Google Scholar]
- Wang, L.; Lau, Y.-Y.; Su, H.; Zhu, Y.; Kanrak, M. Dynamics of the Asian shipping network in adjacent ports: Comparative case studies of Shanghai-Ningbo and Hong Kong-Shenzhen. Ocean Coast. Manag. 2022, 221, 106127. [Google Scholar] [CrossRef]
- Lagoudis, I.N.; Theotokas, I.; Broumas, D. A literature review of port competition research. Int. J. Ship. Trans. Log. 2017, 9, 724–762. [Google Scholar] [CrossRef]
- Suárez-Alemán, A.; Serebrisky, T.; De León, O.P. Port competition in Latin America and the Caribbean: The role of concessions and competition policy. Marit. Policy Manag. 2017, 45, 665–683. [Google Scholar] [CrossRef]
- Baştuğ, S.; Haralambides, H.; Esmer, S.; Eminoğlu, E. Port competitiveness: Do container terminal operators and liner shipping companies see eye to eye? Mar. Policy 2022, 135, 104866. [Google Scholar] [CrossRef]
- Talley, W.K. Port Economics; Routledge: New York, NY, USA, 2009. [Google Scholar]
- Parola, F.; Risitano, M.; Ferretti, M.; Panetti, E. The drivers of port competitiveness: A critical review. Transp. Rev. 2016, 37, 116–138. [Google Scholar] [CrossRef]
- Yeo, G.-T.; Ng, A.K.; Lee, P.T.-W.; Yang, Z. Modelling port choice in an uncertain environment. Marit. Policy Manag. 2013, 41, 251–267. [Google Scholar] [CrossRef]
- Onut, S.; Tuzkaya, U.R.; Torun, E. Selecting container port via a fuzzy ANP-based approach: A case study in the Marmara Region, Turkey. Transp. Policy 2010, 18, 182–193. [Google Scholar] [CrossRef]
- Wang, Y.; Yeo, G.-T.; Ng, A.K. Choosing optimal bunkering ports for liner shipping companies: A hybrid Fuzzy-Delphi–TOPSIS approach. Transp. Policy 2014, 35, 358–365. [Google Scholar] [CrossRef]
- Kim, J.-Y. Port user typology and representations of port choice behavior: A Q-methodological study. Marit. Econ. Logist. 2013, 16, 165–187. [Google Scholar] [CrossRef]
- Steven, A.B.; Corsi, T.M. Choosing a port: An analysis of containerized imports into the US. Transp. Res. Part E Logist. Transp. Rev. 2012, 48, 881–895. [Google Scholar] [CrossRef]
- Kim, S.; Kang, D.; Dinwoodie, J. Competitiveness in a Multipolar Port System: Striving for Regional Gateway Status in Northeast Asia. Asian J. Shipp. Logist. 2016, 32, 119–125. [Google Scholar] [CrossRef]
- Hales, D.; Lam, J.S.L.; Chang, Y.-T. The Balanced Theory of Port Competitiveness. Transp. J. 2016, 55, 168–189. [Google Scholar] [CrossRef]
- Kaliszewski, A.; Kozłowski, A.; Dąbrowski, J.; Klimek, H. Key factors of container port competitiveness: A global shipping lines perspective. Mar. Policy 2020, 117, 103896. [Google Scholar] [CrossRef]
- Tovar, B.; Hernández, R.; Rodríguez-Déniz, H. Container port competitiveness and connectivity: The Canary Islands main ports case. Transp. Policy 2015, 38, 40–51. [Google Scholar] [CrossRef]
- Ducruet, C.; Lee, S.-W.; Ng, A.K. Centrality and vulnerability in liner shipping networks: Revisiting the Northeast Asian port hierarchy. Marit. Policy Manag. 2010, 37, 17–36. [Google Scholar] [CrossRef]
- Bartholdi, J.J.; Jarumaneeroj, P.; Ramudhin, A. A new connectivity index for container ports. Marit. Econ. Logist. 2016, 18, 231–249. [Google Scholar] [CrossRef]
- Ducruet, C.; Wang, L. China’s Global Shipping Connectivity: Internal and External Dynamics in the Contemporary Era (1890–2016). Chin. Geogr. Sci. 2018, 28, 202–216. [Google Scholar] [CrossRef]
- Wan, C.; Zhao, Y.; Zhang, D.; Yip, T.L. Identifying important ports in maritime container shipping networks along the Maritime Silk Road. Ocean Coast. Manag. 2021, 211, 105738. [Google Scholar] [CrossRef]
- Ng, A.S.-F.; Sun, D.; Bhattacharjya, J. Port choice of shipping lines and shippers in Australia. Asian Geogr. 2013, 30, 143–168. [Google Scholar] [CrossRef]
- Kolar, P.; Rodrigue, J.P. Container port selection by freight forwarders in central and eastern Europe hinterland: The case of the Czech Republic. NAŠE MORE Znanstveni Časopis za More i Pomorstvo 2018, 65, 1–7. [Google Scholar] [CrossRef]
- Baert, L.; Reynaerts, J. An examination of the determinants of inter-port competition for U.S. imports. Case Stud. Transp. Policy 2020, 8, 281–292. [Google Scholar] [CrossRef]
- Shi, X.; Li, H. Developing the port hinterland: Different perspectives and their application to Shenzhen Port, China. Res. Transp. Bus. Manag. 2016, 19, 42–50. [Google Scholar] [CrossRef]
- Rodrigue, J.P. The Geography of Transport Systems, 4th ed.; Routledge: New York, NY, USA, 2017. [Google Scholar]
- Wan, S.; Luan, W.; Ma, Y.; Haralambides, H. On determining the hinterlands of China’s foreign trade container ports. J. Transp. Geogr. 2020, 85, 102725. [Google Scholar] [CrossRef]
- Ferrari, C.; Parola, F.; Gattorna, E. Measuring the quality of port hinterland accessibility: The Ligurian case. Transp. Policy 2011, 18, 382–391. [Google Scholar] [CrossRef]
- Guerrero, D. Deep-sea hinterlands: Some empirical evidence of the spatial impact of containerization. J. Transp. Geogr. 2014, 35, 84–94. [Google Scholar] [CrossRef]
- Moura, T.G.Z.; Garcia-Alonso, L.; Salas-Olmedo, M.H. Delimiting the scope of the hinterland of ports: Proposal and case study. J. Transp. Geogr. 2017, 65, 35–43. [Google Scholar] [CrossRef]
- Peng, Y.; Li, Z.; Duan, W.; Li, X.; Bao, Q. Evolution of the hinterlands of eight Chinese ports exporting to europe under the Polar Silk Road: Three hypothetical scenarios. Ocean Coast. Manag. 2021, 205, 105549. [Google Scholar] [CrossRef]
- Yin, C.; Ke, Y.; Chen, J.; Liu, M. Interrelations between sea hub ports and inland hinterlands: Perspectives of multimodal freight transport organization and low carbon emissions. Ocean Coast. Manag. 2021, 214, 105919. [Google Scholar] [CrossRef]
- Guerrero, D. Impacts of transport connections on port hinterlands. Reg. Stud. 2018, 53, 540–549. [Google Scholar] [CrossRef]
- Garcia-Alonso, L.; Monios, J.; Vallejo-Pinto, J. Port competition through hinterland accessibility: The case of Spain. Marit. Econ. Logist. 2017, 21, 258–277. [Google Scholar] [CrossRef]
- Wanke, P.; Falcão, B.B. Cargo allocation in Brazilian ports: An analysis through fuzzy logic and social networks. J. Transp. Geogr. 2017, 60, 33–46. [Google Scholar] [CrossRef]
- Kavirathna, C.A.; Kawasaki, T.; Hanaoka, S.; Bandara, Y.M. Cooperation with a vessel transfer policy for coopetition among container terminals in a single port. Transp. Policy 2020, 89, 1–12. [Google Scholar] [CrossRef]
- Allate, B.M. Competitiveness evaluation of West Africa coastal countries ports: Structure conduct performance approach. Open J. Appl. Sci. 2018, 8, 381–397. [Google Scholar] [CrossRef][Green Version]
- Mueller, M.A.; Wiegmans, B.; van Duin, R. The geography of container port choice: Modelling the impact of hinterland changes on port choice. Marit. Econ. Logist. 2020, 22, 26–52. [Google Scholar] [CrossRef]
- Yang, J.L.; Luo, M.F.; Ji, A. Analyzing the spatial-temporal evolution of a gateway’s hinterland: A case study of Shanghai, China. Transp. Res. E Logist. Transp. Rev. 2016, 95, 355–367. [Google Scholar] [CrossRef]
- Cullinane, K.; Wang, Y. The hierarchical configuration of the container port industry: An application of multiple linkage analysis. Marit. Policy Manag. 2012, 39, 169–187. [Google Scholar] [CrossRef]
- Ducruet, C. The polarization of global container flows by interoceanic canals: Geographic coverage and network vulnerability. Marit. Policy Manag. 2015, 43, 242–260. [Google Scholar] [CrossRef]
- Hu, Y.; Zhu, D. Empirical analysis of the worldwide maritime transportation network. Phys. A Stat. Mech. its Appl. 2009, 388, 2061–2071. [Google Scholar] [CrossRef]
- Holmes, J.H.; Haggett, P. Graph Theory Interpretation of Flow Matrices: A Note on Maximization Procedures for Identifying Significant Links. Geogr. Anal. 2010, 9, 388–399. [Google Scholar] [CrossRef]
- Wang, D.; Guan, J.; Liu, C.; Jiang, C.; Xing, L. Simulation of Cooperation Scenarios of BRI-Related Countries Based on a GVC Network. Systems 2022, 10, 12. [Google Scholar] [CrossRef]
- Wang, Y.; Cullinane, K. Traffic consolidation in East Asian container ports: A network flow analysis. Transp. Res. Part A Policy Pract. 2014, 61, 152–163. [Google Scholar] [CrossRef]
- Xu, M.; Li, Z.; Shi, Y.; Zhang, X.; Jiang, S. Evolution of regional inequality in the global shipping network. J. Transp. Geogr. 2015, 44, 1–12. [Google Scholar] [CrossRef]
- Newman, M.E.J. Assortative Mixing in Networks. Phys. Rev. Lett. 2002, 89, 208701. [Google Scholar] [CrossRef]
- Clauset, A.; Shalizi, C.R.; Newman, M.E.J. Power-Law Distributions in Empirical Data. SIAM Rev. 2009, 51, 661–703. [Google Scholar] [CrossRef]
- Zhao, C.; Wang, Y.; Gong, Y.; Brown, S.; Li, R. The evolution of the port network along the Maritime Silk Road: From a sustainable development perspective. Mar. Policy 2021, 126, 104426. [Google Scholar] [CrossRef]


Disclaimer/Publisher’s Note: The statements, opinions and data contained in all publications are solely those of the individual author(s) and contributor(s) and not of MDPI and/or the editor(s). MDPI and/or the editor(s) disclaim responsibility for any injury to people or property resulting from any ideas, methods, instructions or products referred to in the content. |
© 2023 by the authors. Licensee MDPI, Basel, Switzerland. This article is an open access article distributed under the terms and conditions of the Creative Commons Attribution (CC BY) license (https://creativecommons.org/licenses/by/4.0/).