Article

Comprehensive Evaluation of Low-Carbon City Competitiveness under the “Dual-Carbon” Target: A Cross-Sectional Comparison between Huzhou City and Neighboring Cities in China

1
School of Business, Ningbo University, Ningbo 315211, China
2
School of Statistics and Mathematics, Zhejiang Gongshang University, Hangzhou 310012, China
*
Author to whom correspondence should be addressed.
Systems 2022, 10(6), 235; https://doi.org/10.3390/systems10060235
Submission received: 18 October 2022 / Revised: 15 November 2022 / Accepted: 23 November 2022 / Published: 27 November 2022
(This article belongs to the Special Issue Decision-Making Process and Its Application to Business Analytic)

Abstract

:
Under the background of “dual-carbon” target construction, the low-carbon environmental protection and ecological construction of Huzhou city in China have received high attention. To scientifically measure the low-carbon construction effect of the city, this study constructs a reasonable comprehensive evaluation system of low-carbon city competitiveness from four aspects, including low-carbon economic foundation, low-carbon lifestyle, low-carbon environmental construction, and low-carbon technology development. An integrated weight model of attributes consisting of the analytic hierarchy process (AHP) and entropy weight method is then established, and on this basis, an integrated TOPSIS model is constructed to assess the development of low-carbon competitiveness in Huzhou City. A horizontal comparative analysis of five cities around Huzhou is also conducted, and the current level of low-carbon competitiveness of cities in the central region of the Yangtze River Delta is further explored. Finally, several relevant reference suggestions for Huzhou city are provided to build an ecological model city and a green low-carbon national model and help the government to accelerate the pace of building a low-carbon city in the whole region.

1. Introduction

At the 75th session of the United Nations, Jinping Xi, President of the People’s Republic of China, pointed out the need to accelerate green development and living patterns and proposed for the first time that “China will strive to achieve carbon peaking by 2030 and carbon neutrality by 2060”. The 2021 State Council Government Work Report indicated that various reports on carbon peaking and carbon neutrality were going to be promoted. The Yangtze River Delta, as the leading economic region in China, has seen a high concentration of development over the past five years, which has led to a large scale of carbon emissions in the region, amounting to 20% of the country’s total carbon emissions. Therefore, how to form a “carbon management” brain is an urgent challenge for the Yangtze River Delta region. As the birthplace of the “Two Mountains” theory and the central hinterland of the Yangtze River Delta region, Huzhou City of Zhejiang Province, has achieved certain success in low-carbon environmental protection, becoming the birthplace of China’s beautiful countryside, China’s first prefectural and municipal ecological civilization pilot demonstration zone, China’s first batch of national ecological civilization construction demonstration cities, and China’s only “ecology + electricity” demonstration city. So far, its low-carbon construction and development have attracted much attention. To carry new expectations and new requirements, make persistent efforts, follow the trend, and ride the wind and waves, the Huzhou municipal government held a symposium on carbon peaking and carbon neutrality, emphasizing that “we must take the initiative, reform and innovation, focus on building an ecological model city, and make every effort to build a low-carbon green national model”, so it is of great significance to comprehensively evaluate the low-carbon development of Huzhou.
Therefore, it is necessary to further discuss the following questions: What are the time series changes in the overall level of the comprehensive evaluation of low-carbon city competitiveness? Is the low-carbon development of cities in the hinterland of the Yangtze River Delta balanced? What are the obstacles to improving the low-carbon competitiveness of Huzhou? Based on the above research questions, this paper improves the existing index system of low-carbon city competitiveness evaluation and constructs a set of evaluation systems covering economy, social life, resources and environment, technology, and other aspects. Secondly, this paper uses a combination of entropy weight and the AHP method to confirm the weights of indicators at all levels. Finally, combined with the current strategic goal of “dual-carbon” construction in China, this study constructs an integrated TOPSIS method to comprehensively evaluate the low-carbon construction level of Huzhou City and makes a comparative analysis of the surrounding cities in the Yangtze River Delta, so as to provide policy suggestions for promoting the coordinated development of low-carbon construction in the hinterland of the Yangtze River Delta.
The main innovations of this research are as follows:
(1) Construct an analytical framework for the competitiveness of low-carbon cities under the construction of “dual-carbon” goals. This paper combines the development of low-carbon city competitiveness with the “dual-carbon” goal, discusses the development trend and direction of low-carbon city competitiveness under the background of “dual-carbon” development, and provides a meso-level research perspective for the theoretical analysis and practical exploration of the comprehensive evaluation of low-carbon city competitiveness in the Yangtze River Delta region.
(2) Under the guidance of fully embodying the scientific, hierarchical, and operable principles of the low-carbon city competitiveness development system, this paper preliminarily discusses the evaluation index factors of a low-carbon city under the background of “dual-carbon” development and subdivides the main factors into 20 indexes. Following the principle of establishing low-carbon city evaluation indexes, a comprehensive evaluation index system for the competitiveness of low-carbon cities under the “dual-carbon” goal has been established, which has laid a certain foundation for further evaluating the development of low-carbon cities under the “dual-carbon” goal.
(3) The integrated TOPSIS evaluation framework was preliminarily constructed by qualitative and quantitative analysis methods, wherein the integrated weight of the index was determined by the combination of AHP and entropy method, and the comprehensive evaluation of low-carbon city competitiveness was realized by the TOPSIS method. Then, empirical research and analysis are carried out on the low-carbon competitiveness of Huzhou City and its neighboring cities. The assessment results are very consistent with the actual low-carbon development of these cities. It provides certain guidance and theoretical support for better solving the practice of low-carbon city competitiveness evaluation in the context of “dual-carbon” goals and further enriches the existing low-carbon city evaluation theoretical system.
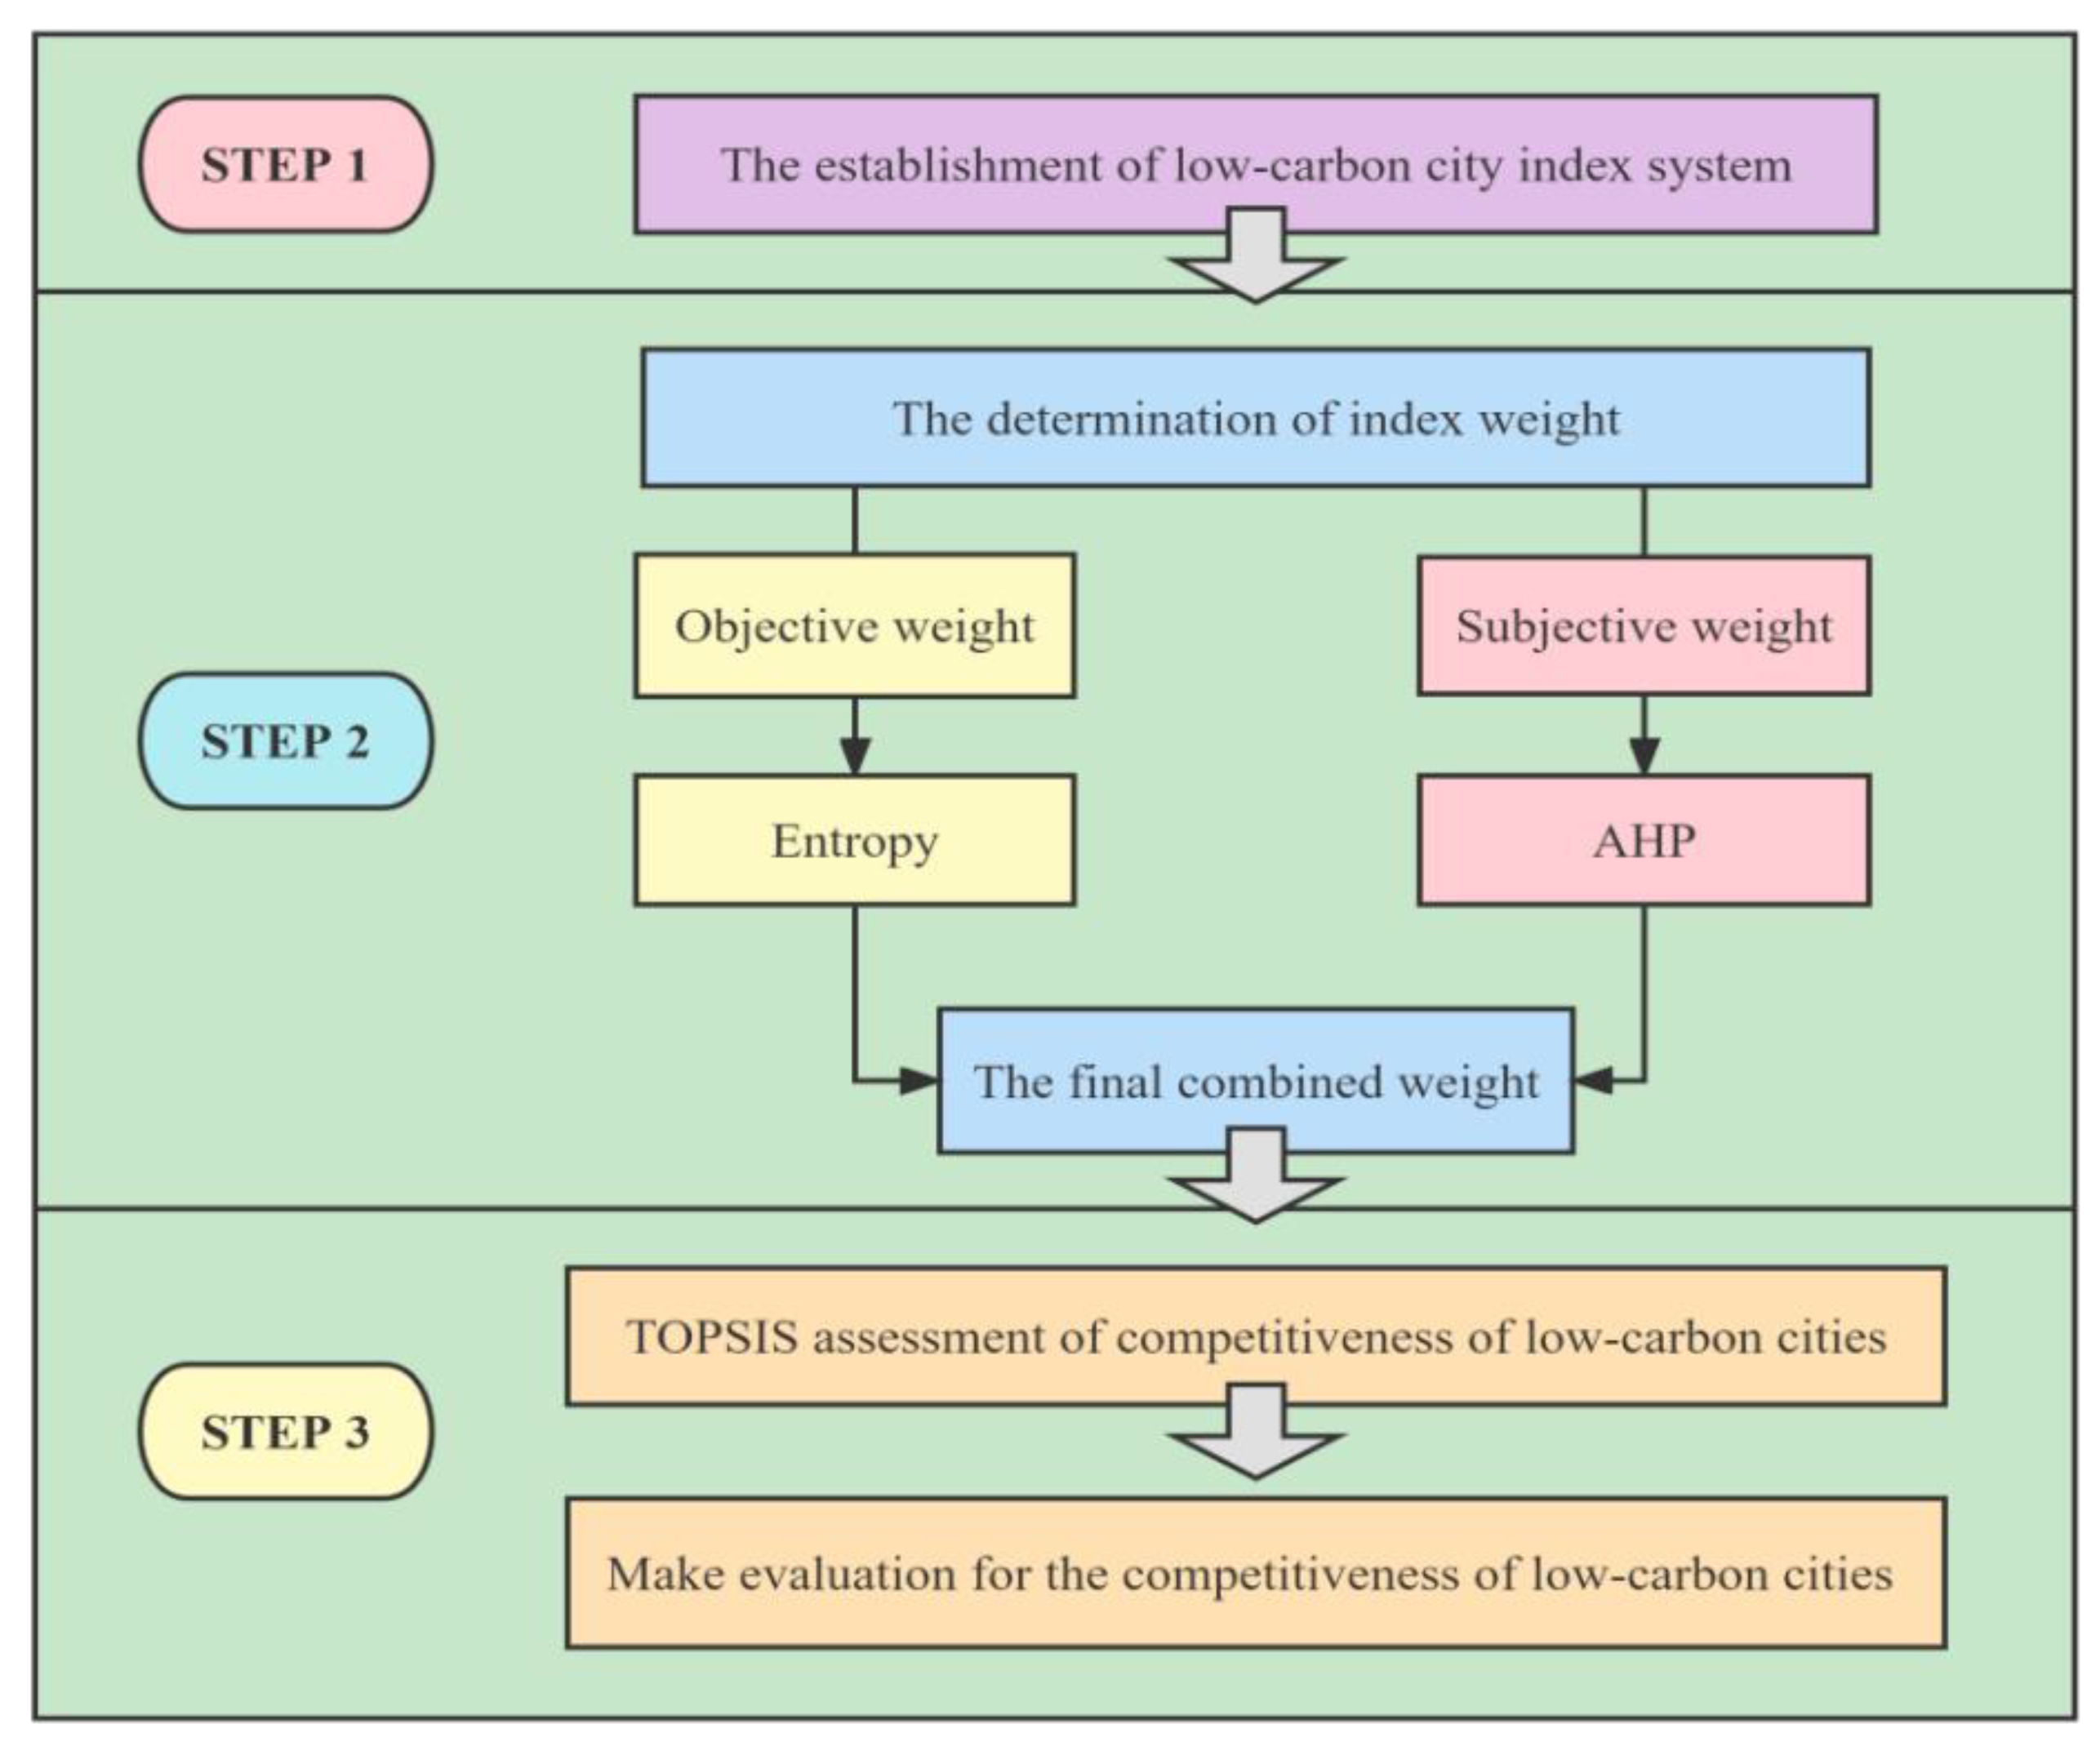
The rest of this paper is arranged as follows: the first part includes the literature review, and the second part is to construct the low-carbon city index system and determine the weight value based on the integrated TOPSIS method. The third part is an empirical study on the evaluation of low-carbon city competitiveness in Huzhou City based on the proposed approach. The last part summarizes the research and makes recommendations. The technical roadmap of the paper is presented in Figure 1.

2. Literature Review

In recent years, research on the construction methods of low-carbon city evaluation index systems has gradually emerged. According to the content of their index systems, it can be divided into two main categories. One is to consider the city as a comprehensive system from various aspects such as economy, politics, environment, and technology. Some scholars focus on the impact of several factors on the evaluation of low-carbon cities. For example, Guo et al. [1] focused on the economic strength and scientific and technological strength of city, supplemented by social and environmental force, to establish a dynamic evaluation index system. Yang et al. [2] studied sectoral energy consumption and low-carbon policy choices to analyze the low-carbon level of city. Qu et al. [3] applied the Driving Forces–Pressures–State–Impact–Responses (DPSIR) model to explore the role of social life and low-carbon environments. However, the low-carbon city is a complex dynamic system composed of several subsystems, and multidimensional indexes should also be considered to evaluate the low-carbon city. Wang et al. [4] constructed an evaluation index system of five aspects: low-carbon economy, low-carbon society, urban planning, energy use, and low-carbon environment to assess the quality of low-carbon development in cities. Wang et al. [5] established an index system including two subsystems of low-carbon potential and low-carbon efficiency using the coordination degree model. Ouyang et al. [6] constructed the evaluation system with the concept of Target–Path–Security, using low-carbon development, low-carbon energy, low-carbon production, low-carbon living, low-carbon layout, and low-carbon management as key indexes. The other is to establish the evaluation index system from the perspective of carbon sources and carbon sinks through the functional analysis of urban ecosystems. For example, Paloheimo et al. [7] calculated carbon sources and sinks from the perspective of producers and consumers to assess the low-carbon strength of a region. Liu et al. [8] constructed the carbon source–carbon sink analysis framework from the aspects of carbon sources for production, transportation, buildings, and residents’ lives, as well as carbon sinks for forests and green areas. Shi et al. [9] integrated the process of carbon sinks and carbon sources and established an evaluation index system combined with the original common indexes. Zhang and Gao [10] established a comprehensive index system by considering the low-carbon output, low-carbon energy, low-carbon environment, carbon sink construction, and low-carbon technology indexes. Research on the establishment of a low-carbon city evaluation system is generally considered to be a comprehensive system combining both subjective and objective aspects [11].
From the perspective of research listed in Table 1, the existing studies on the evaluation system of the low-carbon city need to be improved. On the one hand, it only pays attention to theory analysis [12,13] and lacks practical data support [6]. On the other hand, there is a lack of meso-level research and there are few comparisons between cities [1,8]: either they only evaluate cities with a single target [2,9,14,15,16,17,18] or they analyze them at national–provincial macro-level [3,4,5,7,10,19,20]. Such studies can hardly reflect the competitiveness of low-carbon cities intuitively and lack substantive countermeasures and recommendations.
The current evaluation methods for the competitiveness of low-carbon cities mainly include: the entropy weight method [8,9,14], principal component analysis (PCA) [1], mutation level method [5], Delphi method [6], analytic hierarchy process (AHP) [15,19], fuzzy comprehensive evaluation method [21], etc.; there are also some integrated evaluation methods were proposed, such as entropy weight TOPSIS method [3,4], entropy gray correlation TOPSIS method [10], game theory TOPSIS method [16], fuzzy TOPSIS [23], and TOPSIS–BP neural network and grey relational analysis [24]. As shown in Table 2, although there are many existing studies on low-carbon city competitiveness methods, there are still some shortcomings. As the low-carbon city evaluation system is complex, involving multi-objective and multi-level studies, the data are large and difficult to handle. In the literature on the evaluation of low-carbon city competitiveness, several scholars have used the AHP method to determine the weights of low-carbon competitiveness indexes [19], analyze low-carbon development [15], and validate the research results [21]. As a classical subjective weighting method, AHP is able to quantify the evaluator’s qualitative analysis of complex systems. Because different types of regions need to combine their own development characteristics to establish personalized low-carbon city competitiveness evaluation systems, AHP can make full use of experts’ empirical knowledge and subjective initiative to make the evaluation system match the local low-carbon development characteristics. However, it is not entirely reasonable to use people’s subjective judgment as the basis for weighting. For example, Ouyang et al. [6] used the Delphi method to evaluate the qualifications of low-carbon cities, which is subjective and one-sided. Due to the large scope of the study, the assignment process was only based on subjective judgments, which was not convincing. The entropy weight method is more accurate and objective than the subjective method. Due to the large amount of data and the multifaceted comparisons involved, the entropy weight method can avoid the interference of subjective factors in determining the weighting coefficients, and more reasonably reflect the importance of each index in the comprehensive evaluation. In addition, without taking into account subjective opinions, the calculated weights may be divorced from reality, in order to compensate for the shortcomings of the single-assignment method, a combination of subjective and objective assignment methods is generally used to complement each other.
On the other hand, TOPSIS is a common and effective objective evaluation method in multi-objective decision analysis, which can rank a limited number of evaluation objects according to their proximity to an idealized target. Qu and Liu [3] used the TOPSIS method for ranking analysis of research objects to study the measurement of low-carbon development levels. Wang et al. [4] used the TOPSIS method to calculate low-carbon development. Peng et al. [16] used the TOPSIS method to assess the low-carbon competitiveness ranking of the study participants. In general, the TOPSIS method can rank the relative strengths and weaknesses of the evaluation subjects in a more objective and scientific manner, which improves the scientificity, accuracy, and operability of evaluating the competitiveness level of low-carbon cities.
Based on the above analysis, the first aim of this study is to refine the existing index system for evaluating the competitiveness of low-carbon cities and constructs a set of evaluation systems, including economic, social life, resources and environment, technology, and other aspects. Secondly, this paper uses a combination of AHP and entropy to determine the weights of indexes at all levels. Finally, we combine China’s current strategic goal of “dual-carbon” construction with the TOPSIS method to comprehensively evaluate the low-carbon construction level of Huzhou City and to provide policy suggestions for promoting the low-carbon construction of cities in the Yangtze River Delta hinterland through comparative analysis of the surrounding cities.

3. Construction of a Low-Carbon City Index System

3.1. Principles of Index Selection

The development of a set of scientific, systematic, and comprehensive evaluation index systems is crucial to assess the competitiveness of low-carbon cities, and this paper adheres to the following principles as far as possible. First, the principle of scientificity refers to the principle that the design of the entire index system is in line with the objective laws of low-carbon city development. From the evaluation system to the selection of indexes, the content of the calculation of indexes to the calculation method is scientific, accurate, and reasonable. Second, the principle of hierarchy refers to the logic of the selection and arrangement from the entire index system to the content of individual indexes. From the target level of evaluation indexes to the guideline level and then to the construction of specific indexes should have relevance. Third, there is consistency with the evaluation method. Different comprehensive evaluation methods have some differences in the requirements for the evaluation index system. In the process of constructing the evaluation index system, the integrated weight method is determined first before constructing the corresponding indexes. Fourth is the principle of operability. When selecting the low-carbon city index system, it is necessary to consider both the comprehensiveness of the index system and the factors that have a key impact on the specific operation of the indexes, such as whether the index data are easy to collect and whether the indexes are representative. As the low-carbon city evaluation index system involves a wide range and complex content, when selecting indexes, key indexes that have a greater impact on the development of low-carbon cities or on the evaluation results should be chosen.

3.2. Analysis of the Composition of the Index System

Based on the existing studies from other researchers, this paper integrates the city as a comprehensive system and the analysis of the functions of the urban ecosystem (carbon source–carbon sink) to build an evaluation system toward low-carbon city competitiveness. This evaluation systems include four aspects: low-carbon economic foundation, low-carbon lifestyle, low-carbon environmental construction level, and low-carbon technology development. The second level evaluation indexes are described in Table 3.
(1) The level of low-carbon economic foundation (B1). The low-carbon economic foundation level is reflected in both the economic level of the city and the degree of rationalization of the industrial structure. The GDP per capita (C11) and Engel’s coefficient for urban residents (C15) are designed to reflect the economic level of a city, which include the level of economic income and consumption. In addition, the low-carbon competitiveness of a city is not blindly based on the amount of carbon emissions, but attaches equal importance to economic development and low-carbon environmental development, so as to achieve overall economic and environmental considerations. The proportion of primary industry (C12), secondary industry (C13), and tertiary industry (C14) reflects the degree of rationalization of the industrial structure. The primary industry accounts for a small but destructive share of pollution, the secondary industry is the main industry that produces carbon emissions, while the tertiary industry has the advantages of low energy consumption and high added value.
(2) The level of low-carbon lifestyle (B1). Electricity consumption per capita (C21), domestic water consumption per capita (C22), and the number of private car ownerships per capita (C23) reflect the low-carbon consumption habits of urban residents. These three indexes also reflect the main sources of carbon emissions for residents, such as water consumption, electricity consumption, and travel. Electricity consumption of the whole society (C24) summarizes the total consumption of electricity in the city and accounts for a large proportion of the carbon source.
(3) The level of low-carbon environment construction (B3). Air quality (C31) is the direct manifestation of the results of a low-carbon economy in the quality of the atmospheric environment. Forest cover (C32), urban greenery coverage (C33), and green space per capita (C34) are important manifestations of low-carbon construction in land greening. The total amount of emission for industrial waste gases (C35) is the target of low-carbon cities in the pursuit of “zero emission”. The energy consumption of a city is reflected in its comprehensive energy consumption (C36). From the perspective of carbon sources and carbon sinks, the urban atmosphere is the host of natural carbon in the air, and the air quality (C31) reflects its strengths and weaknesses. The forest cover (C32) is the change in urban forest carbon sinks. The urban greenery coverage (C33) reflects the green space carbon sinks in the macro urban space, while the green space per capita (C34) reflects its status at the micro level. The total amount of emission for industrial waste gases (C35) is one of the important measures of urban carbon sources. The index of comprehensive energy consumption (C36) is a direct reflection of the source of carbon emissions in the city.
(4) The level of low-carbon technology development (B4). The R&D fund investment (C41) shows the support of advanced technologies for the construction of low-carbon cities. Additionally, the investment in industrial pollution control sources (C43) is the core driving force for the development of industrial pollution control technologies. These two indexes reflect the potential for the development of low-carbon city competitiveness. The index of harmless treatment rate of urban domestic waste (C42) and the comprehensive solid waste utilization rate (C45) reflects the technical level of energy conservation and carbon emission reduction through the recycling of resources from the perspective of life and production. The energy consumption per unit of GDP (C44) is a reflection of the high level of economic and technological intensification in low-carbon cities. The development of low-carbon technologies is the main means of reducing the source of carbon in cities.

3.3. Integrated Weights Based on AHP and Entropy Methods

3.3.1. Subjective Weight Derived by AHP Method

The analytic hierarchy process (AHP) [25] is a commonly used model to determine the weight of indexes, and it verifies the results through the consistency degree of the model. Its main steps are given below:
First step: compare the importance between the index and construct the comparison matrix H,
H = [ 1 h 12 h 13 h 1 n h 21 1 h 22 h 2 n h 31 h 32 1 h 3 n h n 1 h n 2 h n 3 1 ]
where hij is an integer between 1 and 9 and h i j = 1 / h j i .
Second step: solve the indexes weights ω = ( ω 1 , ω 2 , , ω n ) based on the H matrix satisfying:
H ω = η max ω
where η max is the largest eigen root of the comparison matrix H and the weight vector is the corresponding eigenvector.
Third step: in order to test the consistency of the judgment matrix, the following formula is introduced:
C I = η max n n 1
C R = C I R I
where RI is the random consistency index, if the CR of a judgment matrix is less than 10%, its degree of inconsistency is acceptable. Otherwise, the inconsistency is too high, and the judgment matrix needs to be reconstructed or adjusted.

3.3.2. Objective Weight Based on Entropy Weight Method

As a classical objective weight method, entropy weight is simple and widely used. Set x i j ( i = 1 , 2 , , n ; j = 1 , 2 , , m ) as the data of the index Cj in the ith city, the calculation procedure is as follows:
The first step is to calculate the characteristic proportion of the ith city under the Cj:
p i j = x i j i = 1 n x i j
where x i j 0 , i = 1 n x i j .
The second step is to calculate the entropy value of the jth index:
e j = k i = j n p i j ln ( p i j )
where k > 0 , e i j > 0 .
The third step is to calculate the proportion of the difference coefficient of index x i j :
g j = 1 e j
The fourth step is to determine the weight w j ( j = 1 , 2 , , m ) :
ω j = g j i = 1 m g i

3.3.3. Calculation of Integrated Weight

To improve the scientificity of evaluation index weighting, this paper determines the integrated weight by integrating the AHP and entropy method. The calculation formula of integrated weight ω j is given as follows:
ω j = ( ω j ω j ) ( k = 1 m ω j ω j )

4. Empirical Study on the Low-Carbon City Competitiveness Evaluation of Huzhou

4.1. Data Sources and Processing

(1) Data source: According to the statistical yearbook of Zhejiang Province and Huzhou City and the Provincial and Municipal Water Resources Bulletin, we obtained the data related to the competitiveness index of low-carbon cities from 2015 to 2020 (See Appendix A).
(2) Dimensionless data: For different types of indexes, the following methods are adopted for processing.
Case 1: As air quality (C31) has a capping problem, we adopt the method of fixed equivalent value for single index:
z i j = { 1 0.8 0.6 if   reach   sec ond   level   if   reach   inferior   sec ond   level   if   not   reaching   sec ond   level  
Case 2: Some indexes are not the higher the better or the lower the better, such as green space per capita C34.
z 34 = { 1 , x 34 / ( 15 10 ) , x 34 / ( 25 20 ) ,             i f   15 < x 34 < 20 i f   x 34 < 15 i f   x 34 > 20
Case 3: For other indexes, we use the generalized index method:
z i j = x i j / j = 1 n x i j

4.2. Low-Carbon City Competitiveness Based on Integrated TOPSIS Method

TOPSIS method, also known as the advantage and disadvantage solution distance method, is a commonly used effective comprehensive evaluation method. The main steps are as follows: firstly, a decision matrix X = [ x i j ] is established according to the established evaluation index system of low-carbon city competitiveness, where x i j is the value of the jth index of the ith alternative city. We use a dimensionless process to obtain the standardized matrix Z = [ z i j ] . According to the integrated weight method proposed in Section 2, the index weights are calculated, and the standardized weighted evaluation matrix is established as U = ( u i j ) m × n . Then, we shall calculate the sum of distances from each unit to the best and worst solutions A+ and A, so as to obtain the relative closeness of each scheme C i = A A + A + , 0 C i 1 , and then sort according to the value of C i . The detailed evaluation process is listed in Figure 2.
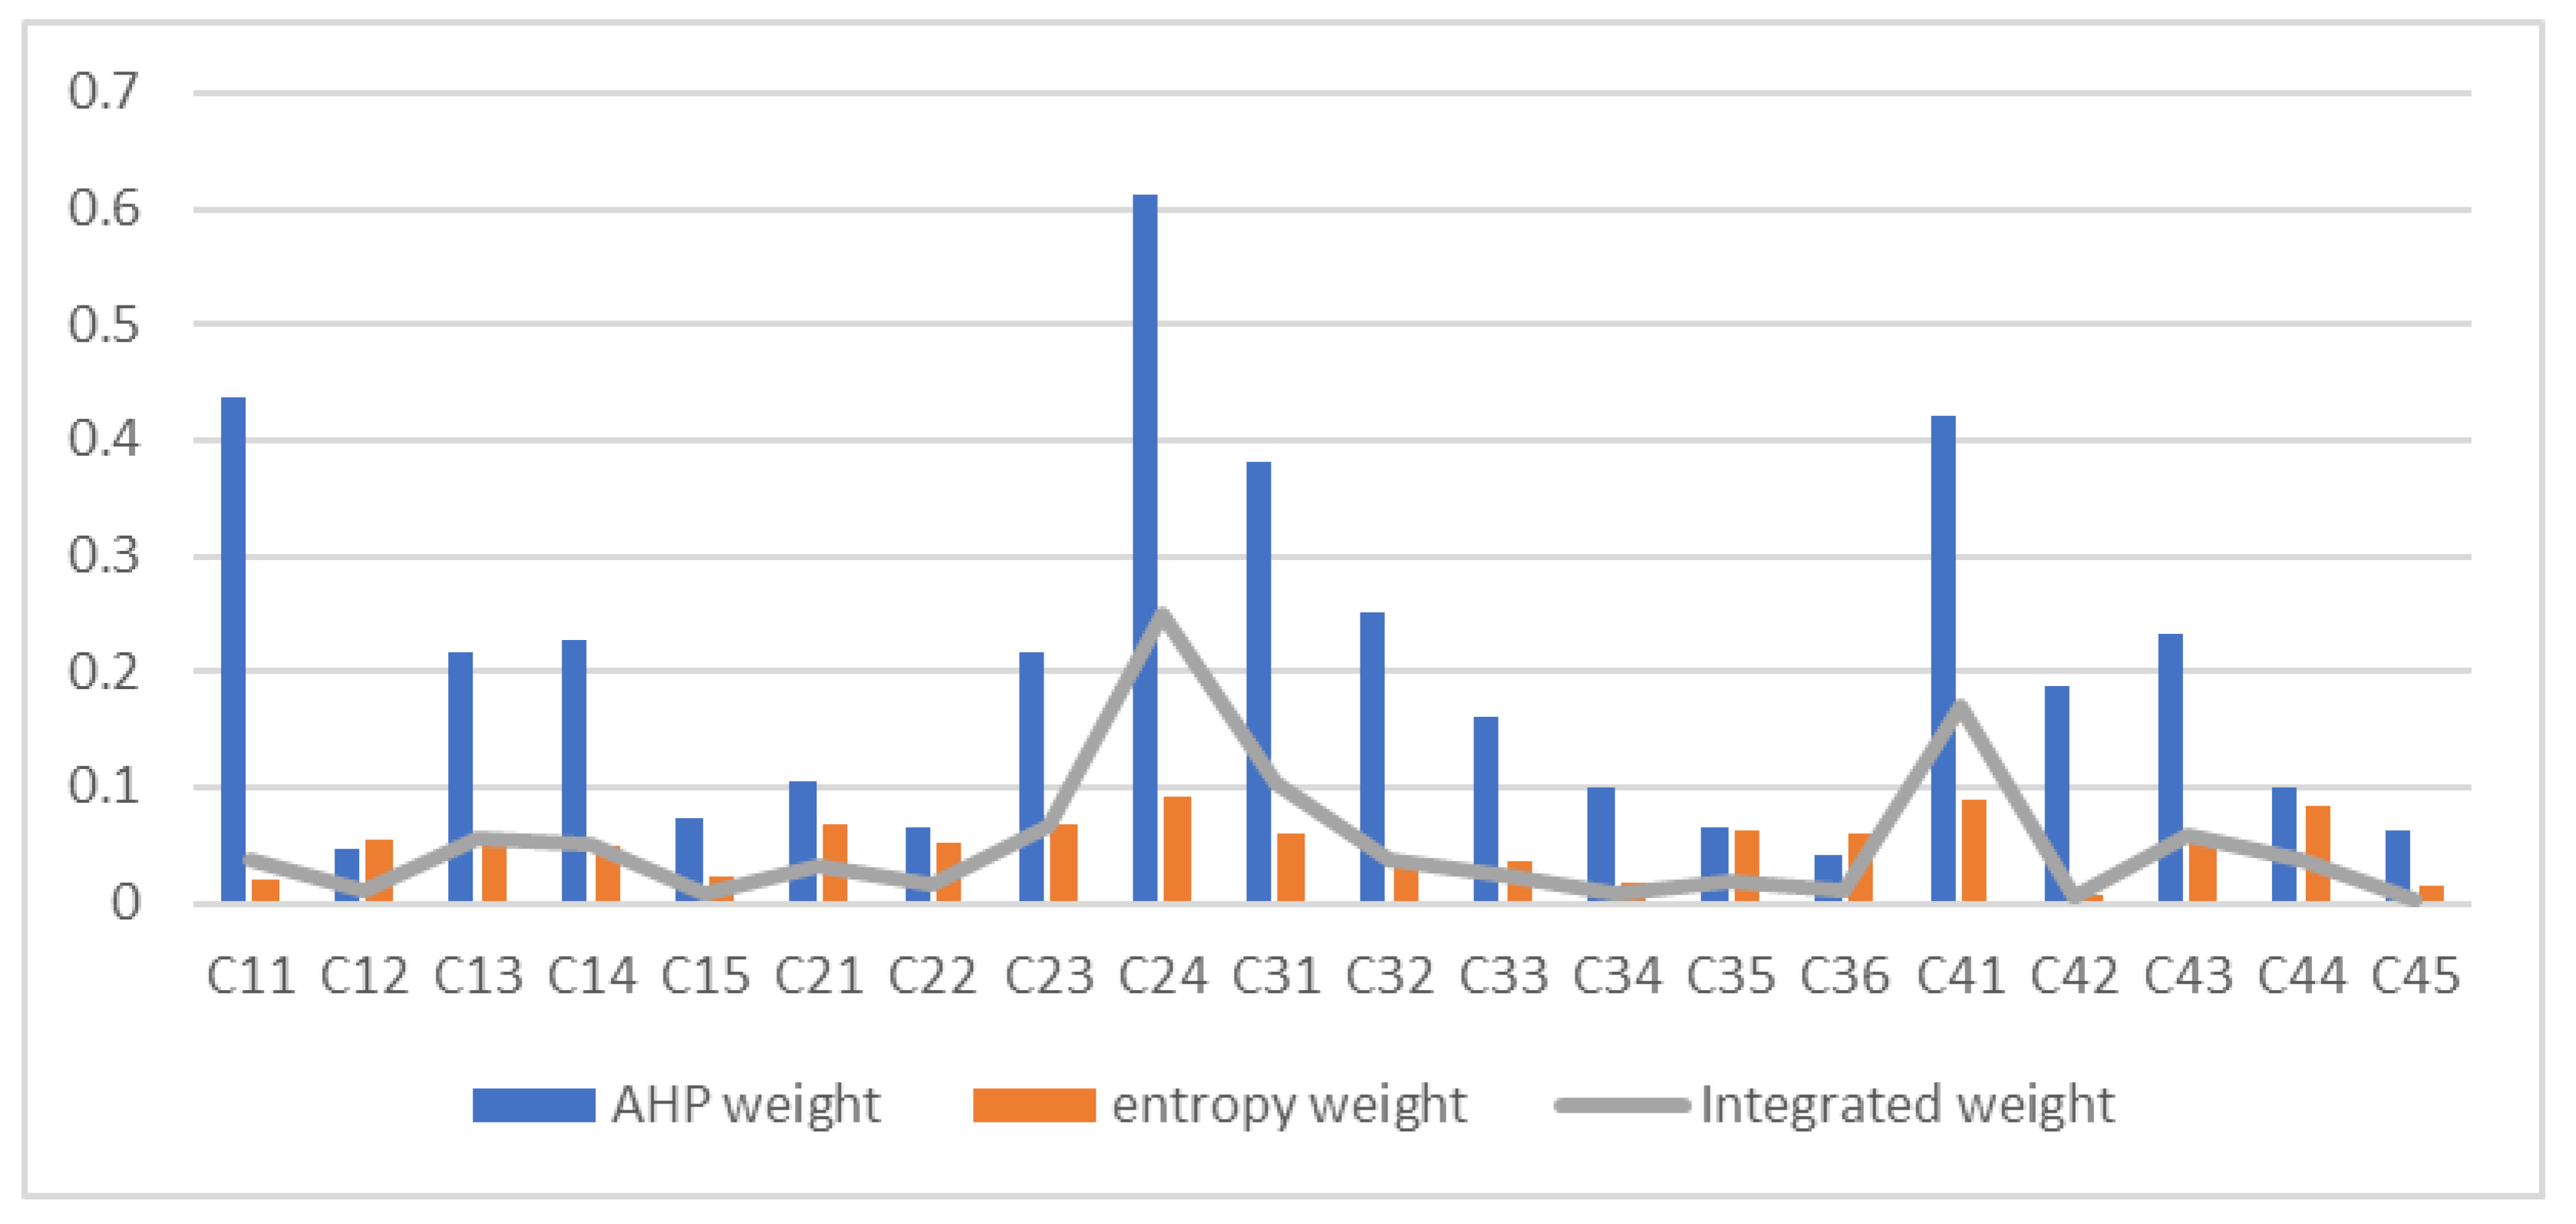
Firstly, the subjective weight, objective weight, and integrated weight of each index are calculated, shown in Table 4 and Figure 3, respectively.
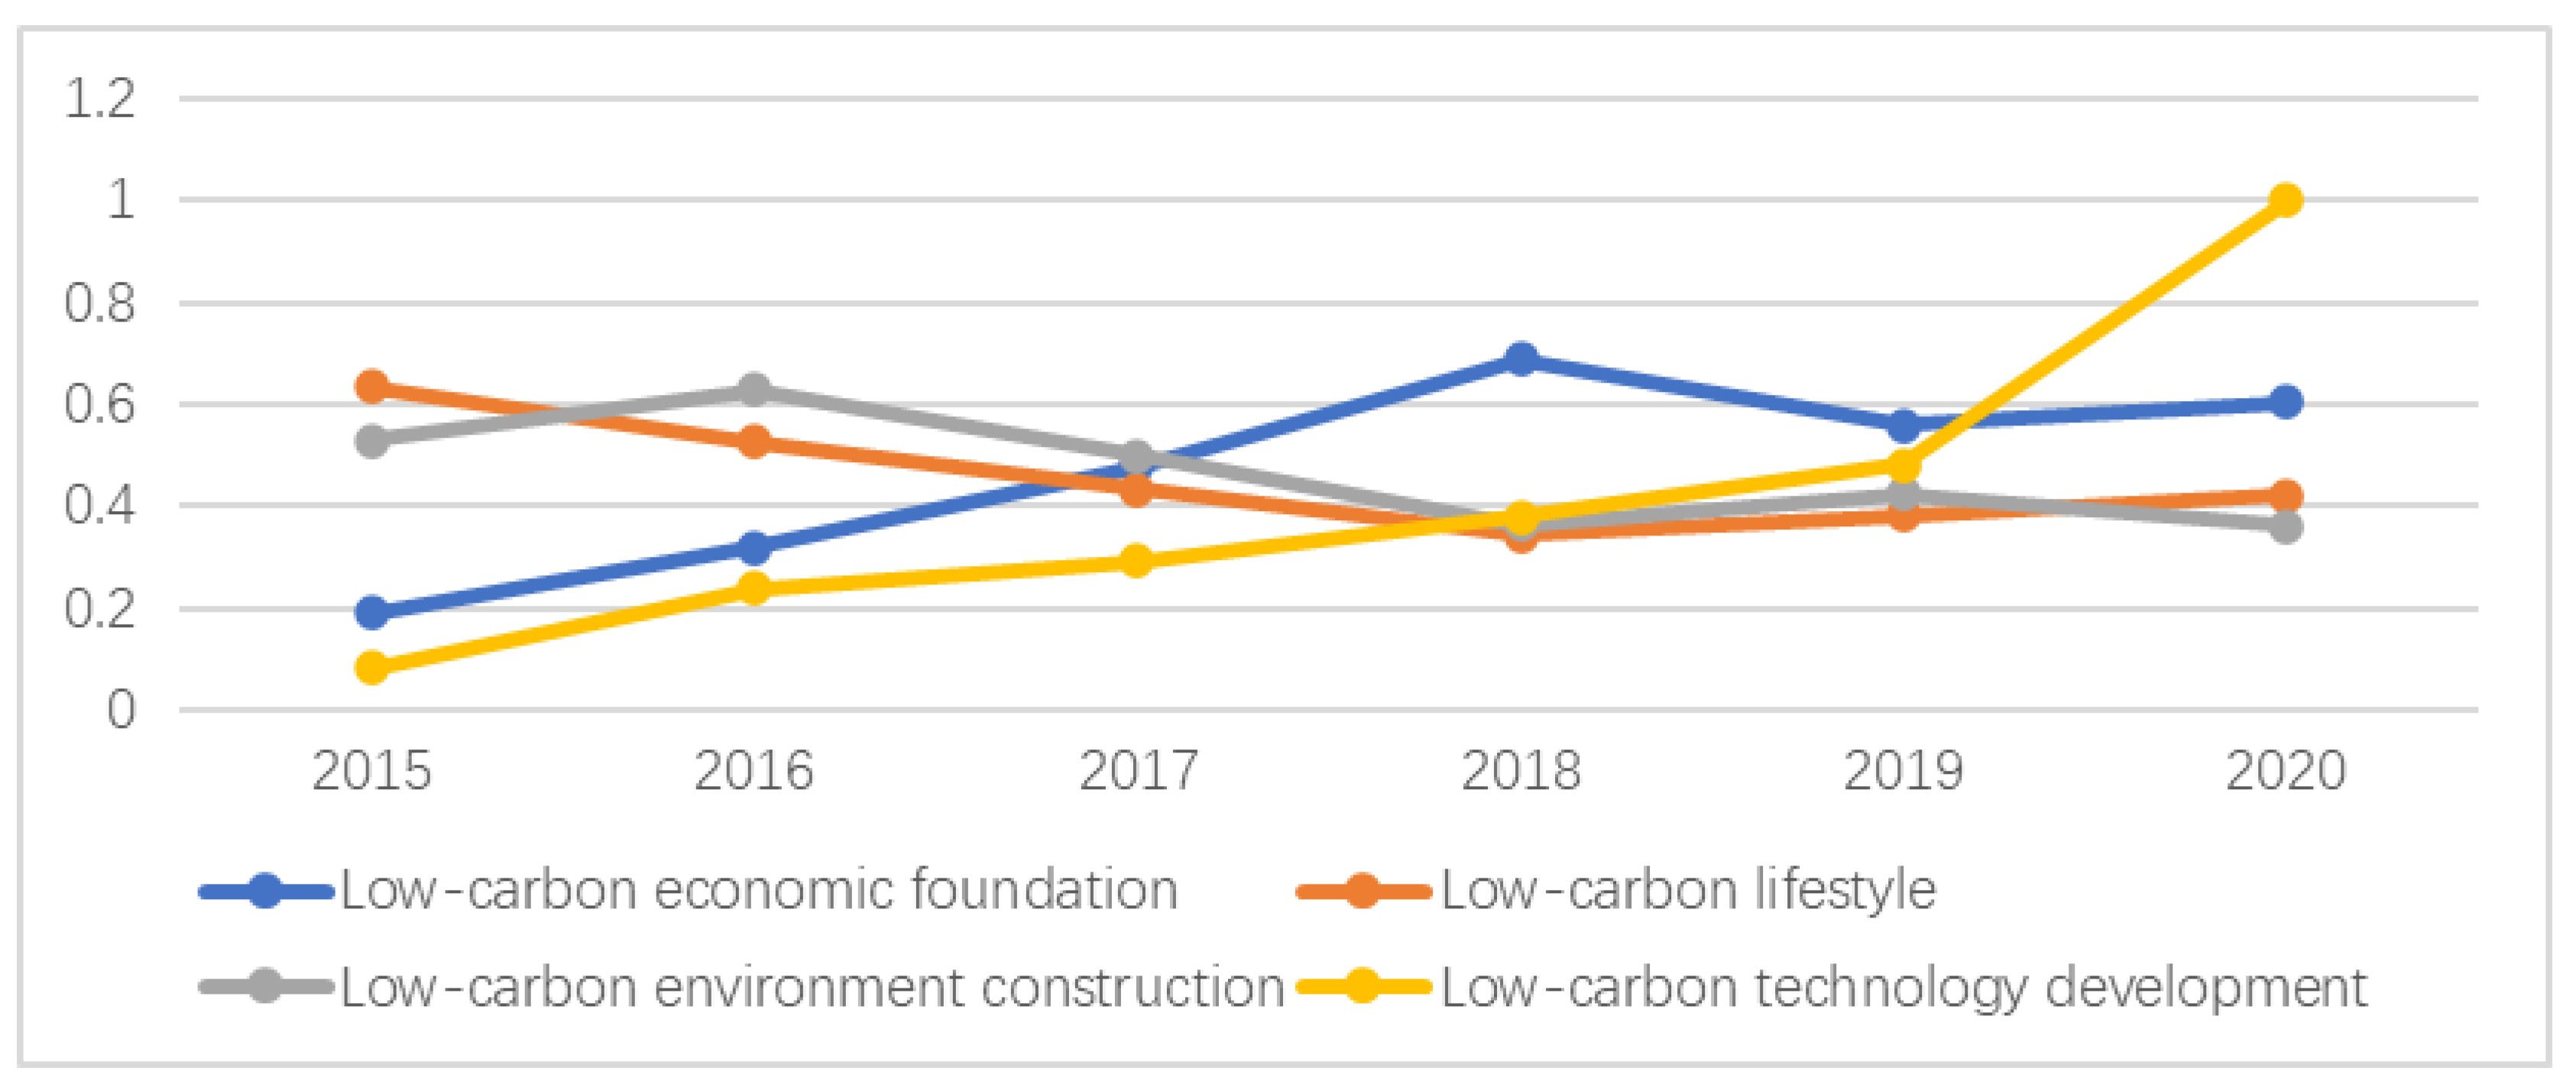
Based on the above calculation, the score and ranking of comprehensive evaluation of low-carbon city of Huzhou City from 2015 to 2020 are obtained, as shown in Table 5 and Figure 4.
As observed from Table 5, the competitiveness of Huzhou’s low-carbon city increased from 0.4250 in 2015 to 0.5313 in 2020, with an average annual increase of 0.0177 points. Among them, the comprehensive strength level of the low-carbon economy foundation was better, with an average score of 0.4731. In terms of growth rate, the growth rate of low-carbon technology development is fast, with an average annual increase of 0.1529 points in six years. Steady progress has been made in building a low-carbon environment construction. For the low-carbon lifestyle, its comprehensive score has declined, mainly because of the improvement of people’s living standards, the number of private cars, per capita domestic water consumption, and electricity consumption increased year by year, but people’s low-carbon life concept has not been translated into practical action.

4.3. Horizontal Comprehensive Evaluation and Analysis with Surrounding Cities

As one of the regions with the most active economic development, the highest degree of openness, and the strongest innovation ability in China, the Yangtze River Delta region has a decisive strategic position in the overall situation of national modernization and all-round opening up, so low-carbon development should also be at the forefront of China. The practice of low-carbon construction in various cities shows that even in the same region, the degree of development of low-carbon competitiveness of cities is different, which is precisely the significance of studying the synergy of the development level of low-carbon competitiveness of various cities. By comparing the development of low-carbon competitiveness between Huzhou and surrounding cities horizontally, we can understand the level of low-carbon competitiveness development of various cities at this stage, which is conducive to coordinated development and promotes Huzhou City and even the Yangtze River Delta region to further move closer to the “dual-carbon” goal.
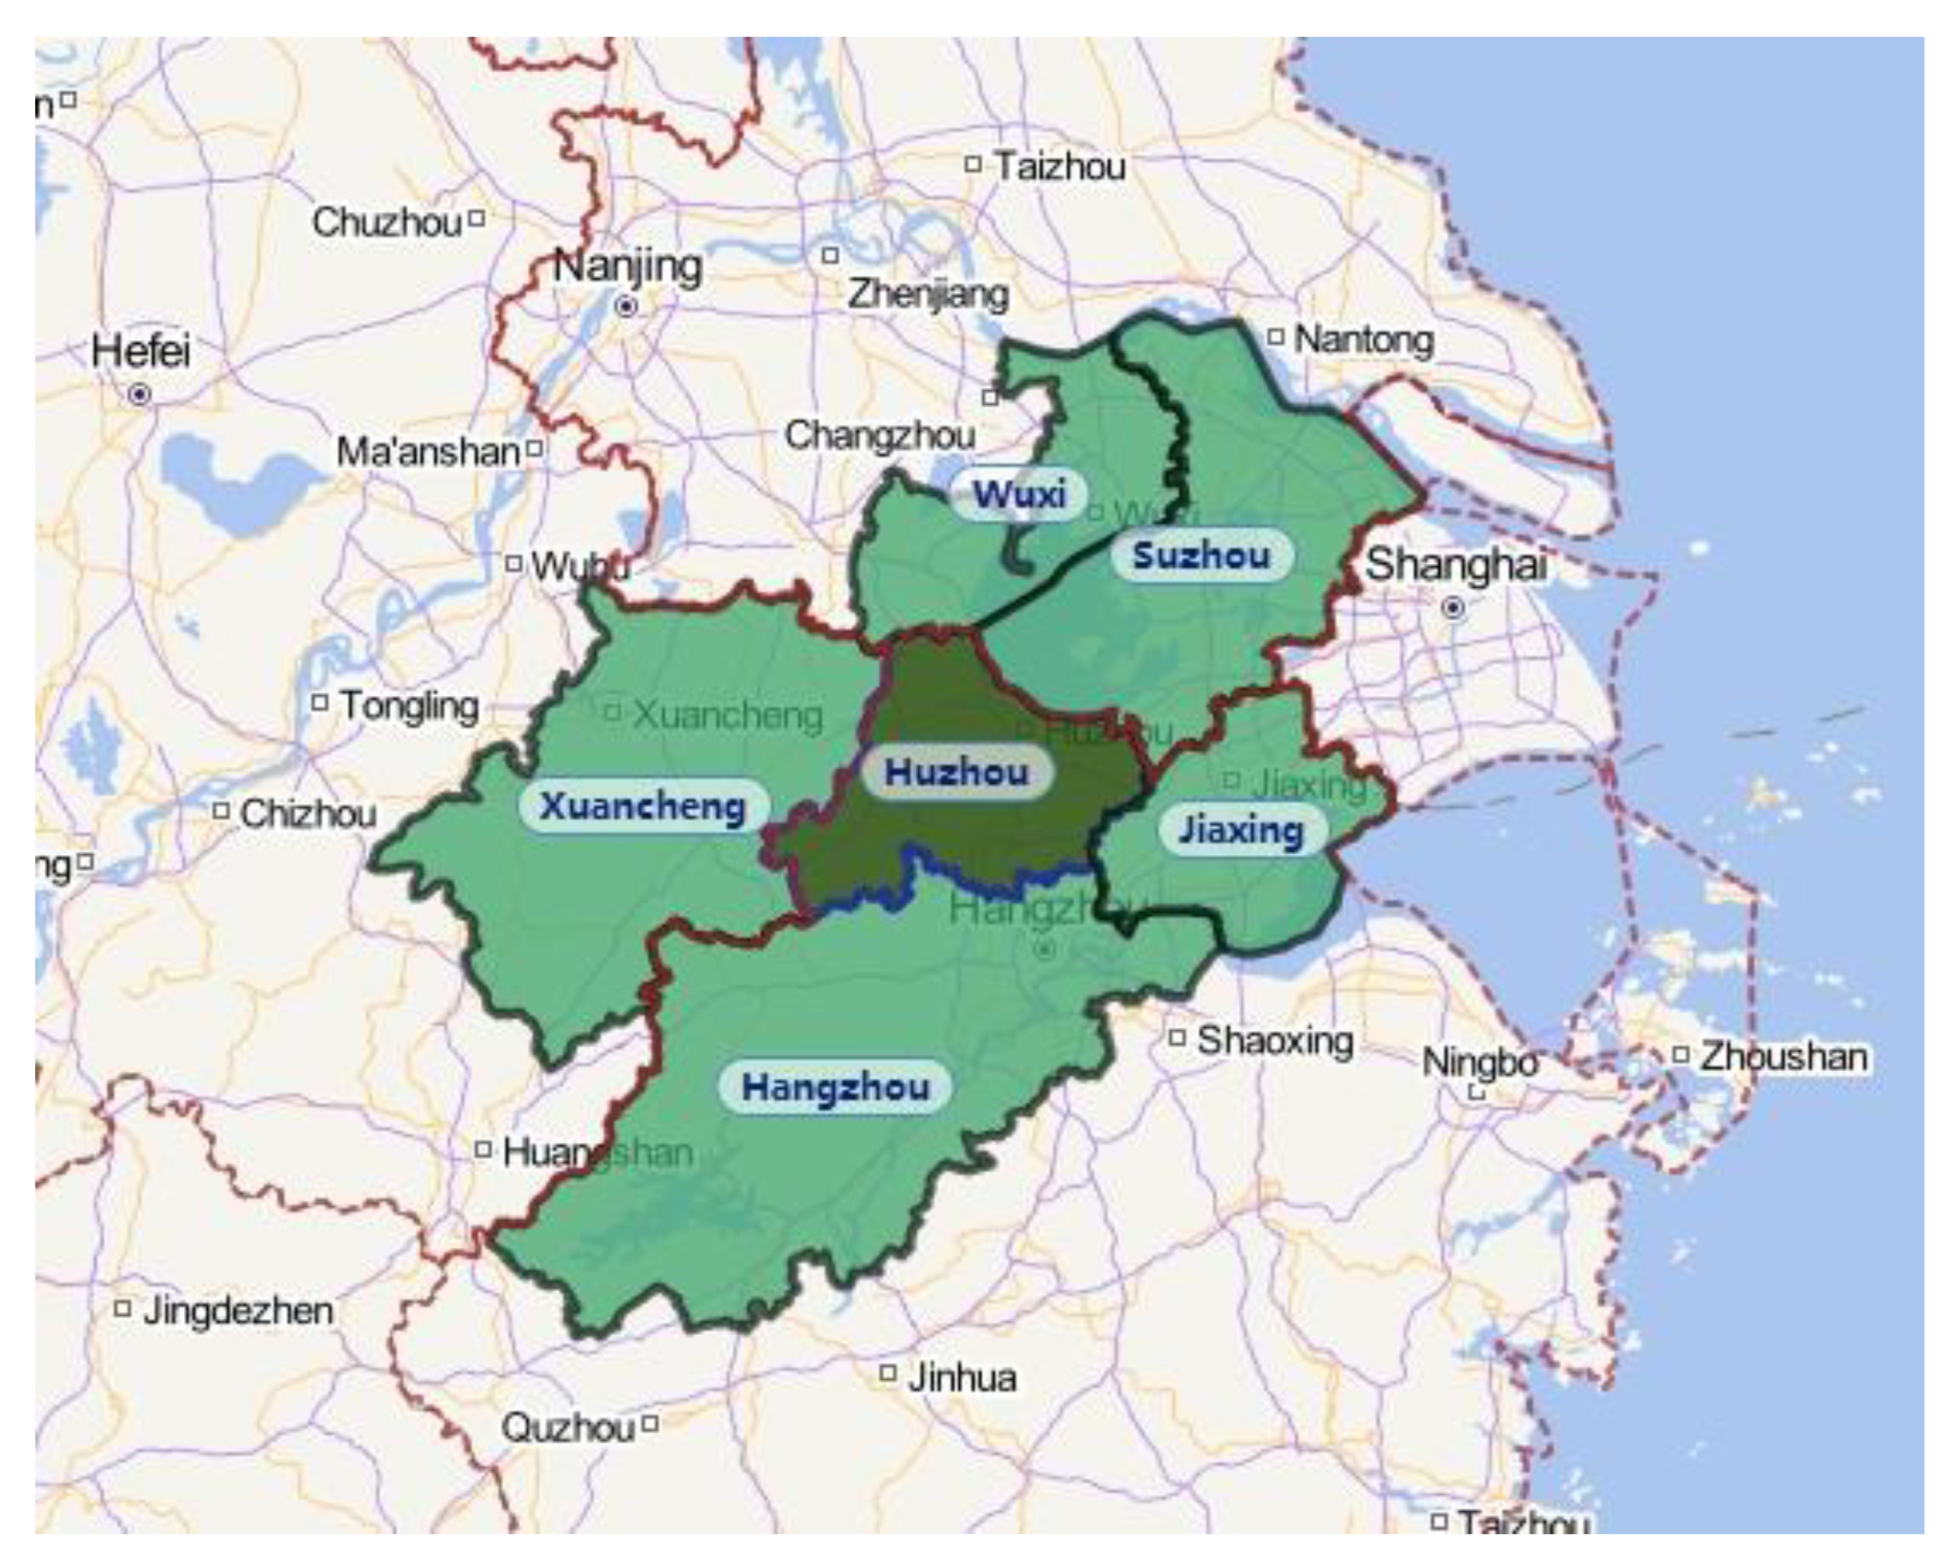
We select five neighboring cities of Huzhou as samples for comparative analysis, namely Suzhou, Wuxi, Hangzhou, Jiaxing, and Xuancheng, listed in Figure 5. The geographic location of five cities. Suzhou and Wuxi belong to Jiangsu Province. Hangzhou, Jiaxing, and Huzhou belong to Zhejiang Province. In addition, Xuancheng belongs to Anhui Province. Zhejiang, Jiangsu, and Anhui provinces are all located in the Yangtze River Delta, and the five surrounding cities and Huzhou are the central cities in the Yangtze River Delta. The five surrounding cities have certain similarities with Huzhou in natural conditions, economic development, policy implementation, and social development. Each city has its own advantages and disadvantages in different aspects, which have high comparability.
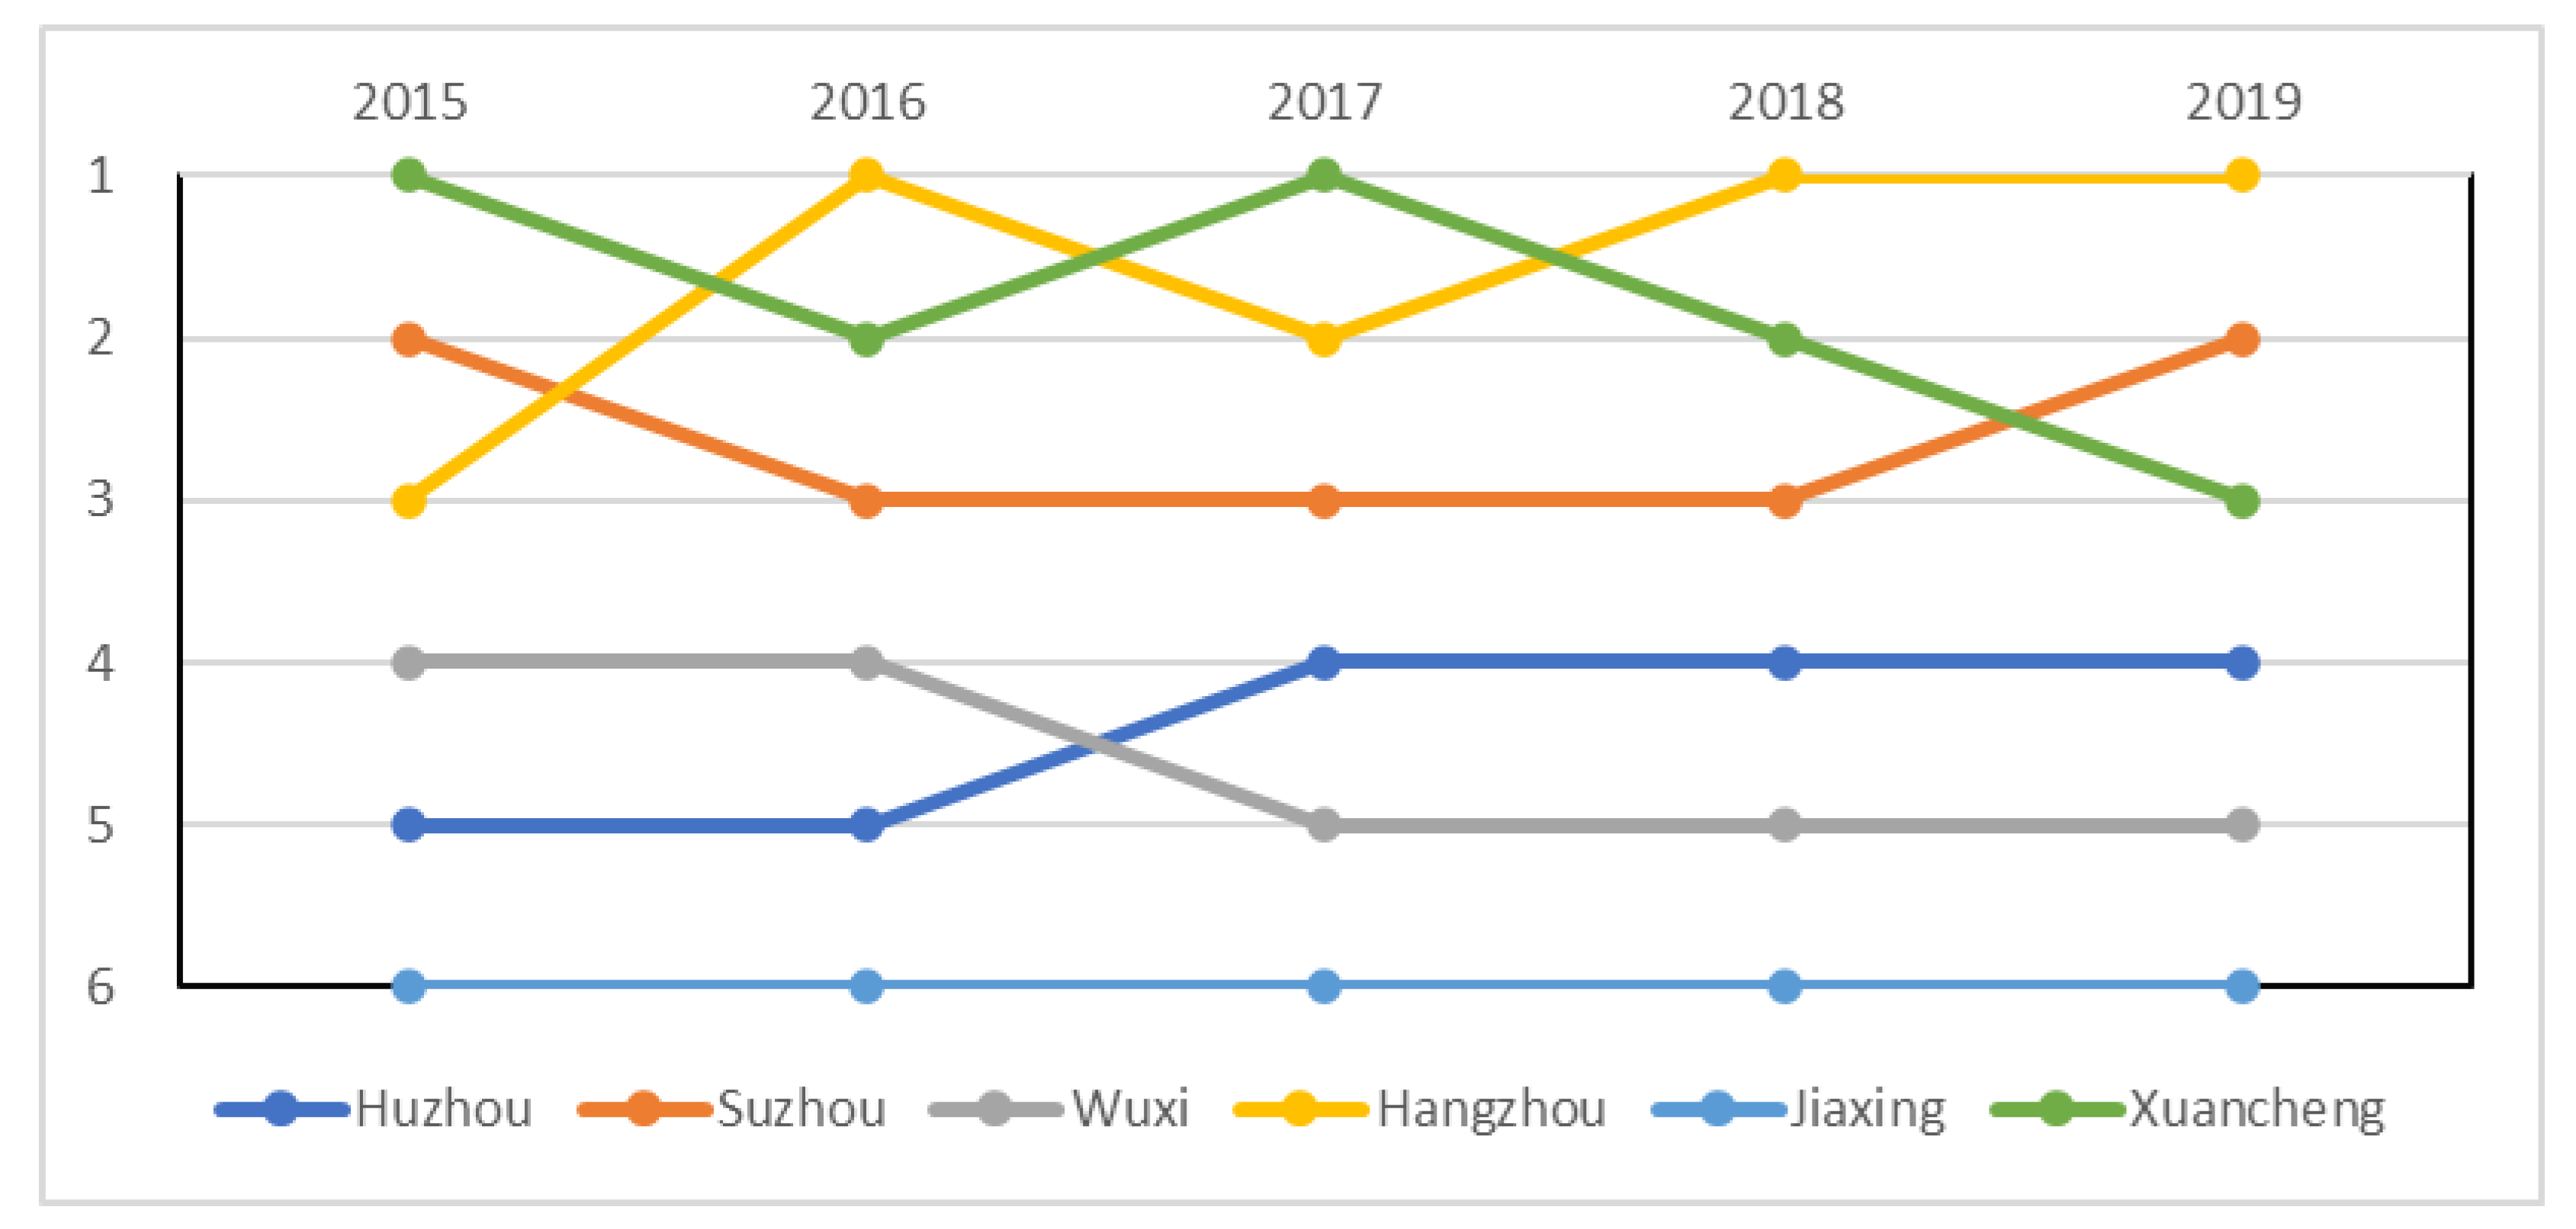
Comprehensive scores and rankings of competitiveness of these cities can be obtained through calculation, as shown in Table 6 and Figure 6.
Referring to the practice of predecessors [20], this paper combines the evaluation index results into five levels: very competitive (0.50–0.59), strong competitiveness (0.40–0.49), medium competitiveness (0.30–0.39), weak competitiveness (0.20–0.29) and uncompetitive (0.10–0.19). From two dimensions, through horizontal comparison with other cities, we can find out the differences in the competitiveness of low-carbon development of each city. Through longitudinal comparison with different years, the development trend of each city’s low-carbon development competitiveness can be obtained. According to the comprehensive score of Huzhou’s low-carbon city competitiveness, it can be found that Huzhou has been at a medium competitiveness level for six years.
From the horizontal comparison, Huzhou’s comprehensive ranking score was stable at fourth place among the six cities, which has the characteristics of unbalanced development in different aspects of low-carbon competitiveness. Huzhou leads other cities in low-carbon environment construction. The level of low-carbon environment construction has been at the top of the list for six years. Compared with other cities, the ranking of low-carbon lifestyle shows a fluctuating trend of progress. In addition, the evaluation scores of the low-carbon technology development level and low-carbon economic foundation level ranked fourth and fifth among the six cities. It has become the main factor restricting the competitiveness of Huzhou’s low-carbon city.
Based on the above results, we can analyze Huzhou‘s low-carbon city construction and development results from 2015 to 2020.
(1) Low-carbon economic foundation level. First, the proportion of the primary industry in Huzhou grew rapidly. The GDP per capita of Huzhou rose from 70,893 CNY/person in 2015 to 102,040 CNY/person in 2019, breaking the CNY 100,000 mark with a growth rate of 43.94%. In 2020, it decreased slightly due to the impact of the epidemic, reaching 95,600 CNY/person. However, Huzhou was still at a disadvantage compared with its neighboring cities, ranking only fifth among the six cities in terms of per capita GDP between 2015 and 2020. Second, the low-carbon economic structure of Huzhou is characterized by “de-agriculturalization”. In 2019, the proportion of primary industry in Huzhou city was 4.29%, which decreased by 1.59% compared with 5.88% in 2015, and decreased year by year. Only in 2020, it increased to 4.39%. However, compared with the other five cities, Huzhou had a higher proportion of agriculture, and the proportion of secondary industry and tertiary industry rises and falls. Third, Engel’s coefficient for urban residents of Huzhou city decreased year by year. It decreased from 0.3042 in 2015 to 0.2866 in 2020 but did not reach the average level of the six cities in the six years.
(2) Low-carbon lifestyle level. Huzhou city is at the forefront of low-carbon travel. In terms of low-carbon consumption, the domestic water consumption per capita in Huzhou ranks first. The electricity consumption of the whole society is better than that of most surrounding cities. However, on the whole, the low-carbon level of Huzhou’s lifestyle is slightly low, and it is only at the middle and lower reaches of the level. In addition, according to the data of Huzhou city from 2015 to 2020, the low-carbon level of Huzhou’s lifestyle has decreased.
(3) Low-carbon environment construction level. Compared with surrounding cities, Huzhou city ranks first in the low-carbon environmental construction level. First, the green environment of Huzhou has been improved. The forest cover and urban greenery coverage both remained at around 50 percent, and the green space per capita increased from 14.91 percent in 2015 to 17.31 percent in 2020, with an increase of 2.4 percentage points. Second, Huzhou led other cities in controlling the total amount of emissions from industrial waste gases. A comparison of the annual average of industrial emissions from 2015 to 2020 shows that Wuxi’s emissions are three times that of Huzhou, while Hangzhou’s are twice that of Huzhou. Third, the comprehensive energy consumption of Huzhou city was far lower than the average level of the six cities. In 2020, Huzhou’s comprehensive energy consumption is only one-fifth of Wuxi’s and one-sixth of Suzhou’s. Fourth, the air quality of Huzhou city has improved year by year. From not reaching the second level in 2015 to the second level in 2020.
(4) Low-carbon technology development level. First, Huzhou’s investment in low-carbon technologies has grown rapidly. From CNY 5.32 billion in 2015 to CNY 9.88 billion in 2020, there was an increase of 85.86%. However, according to the data in 2020, a wide gap still exists between Huzhou’s low-carbon technology investment and Suzhou’s CNY 76.159 billion, and Hangzhou’s CNY 57.879 billion. Second, the low-carbon technology in Huzhou city has a high waste utilization rate. From 2015 to 2020, the harmless treatment rate of urban domestic waste in Huzhou city reached 100%, and the comprehensive utilization rate of solid waste reached over 97%. Third, Huzhou’s investment in industrial pollution control sources is lacking. From the perspective of Huzhou city itself, the total investment decreased by CNY 187.7 million from 2015 to 2019 but increased significantly in 2020. It is speculated that the government increased investment in public utilities to stimulate the economy due to the impact of the epidemic. Compared with surrounding cities, Huzhou ranked last in a total investment of industrial pollution control sources from 2015 to 2019, and third from the bottom in 2020. Fourth, the energy utilization rate of Huzhou city has been improving and the gap has been narrowing compared with other cities. Energy consumption per unit of GDP in Huzhou has decreased year by year, from 0.58 tons of standard coal/CNY million in 2015 to 0.44 tons of standard coal/CNY million in 2020, and the gap with Suzhou has decreased from 0.26 tons of standard coal/CNY million to 0.22 tons of standard coal/CNY million in six years.
Through further comparative analysis, it can be found that the overall competitive strength of Huzhou’s low-carbon city is general, and there are certain defects. First, the level of low-carbon technology development is low. The R&D fund investment in Huzhou has increased from CNY 5.32 billion in 2015 to CNY 9.88 billion in 2020. Although it has achieved rapid growth, the energy consumption per unit of GDP in Huzhou has decreased year by year, indicating that the energy utilization efficiency has been continuously improved, and the technology of energy conservation and emission reduction has made continuous progress. However, from a horizontal comparison, the low-carbon technology level of Huzhou city dropped from fourth place in 2015 to fifth place in 2020, surpassed by Jiaxing. It can be seen that the investment in low-carbon technology in Huzhou city is not enough, and it needs to focus on the development of this aspect. Second, the level of the low-carbon economy foundation is weak. The GDP per capita of Huzhou has increased from CNY 70,893 in 2015 to CNY 95,600 in 2020, but the GDP per capita of Suzhou and Hangzhou in 2020 is 1.65 times that of Huzhou and 1.41 times that of Huzhou, respectively. The secondary industry occupies a large proportion of Huzhou and is the main industry that promotes its economic development. However, the secondary industry is seriously polluted. As a strong industrial city, Huzhou needs to further transform its secondary industry into a new industry in the future. As an emerging industry, the development of the tertiary industry in Huzhou is obviously lagging behind the development of other cities, and the proportion of service-oriented industries is generally low.

4.4. Comparative and Sensitivity Analysis

To analyze the impact of weight changes on the city’s comprehensive score, we first revise the integrated weight formula, i.e., Equation (9) as the following form with parameters α :
ω j = ( ω j ) α ( ω j ) 1 α j = 1 m ( ( ω j ) α ( ω j ) 1 α )
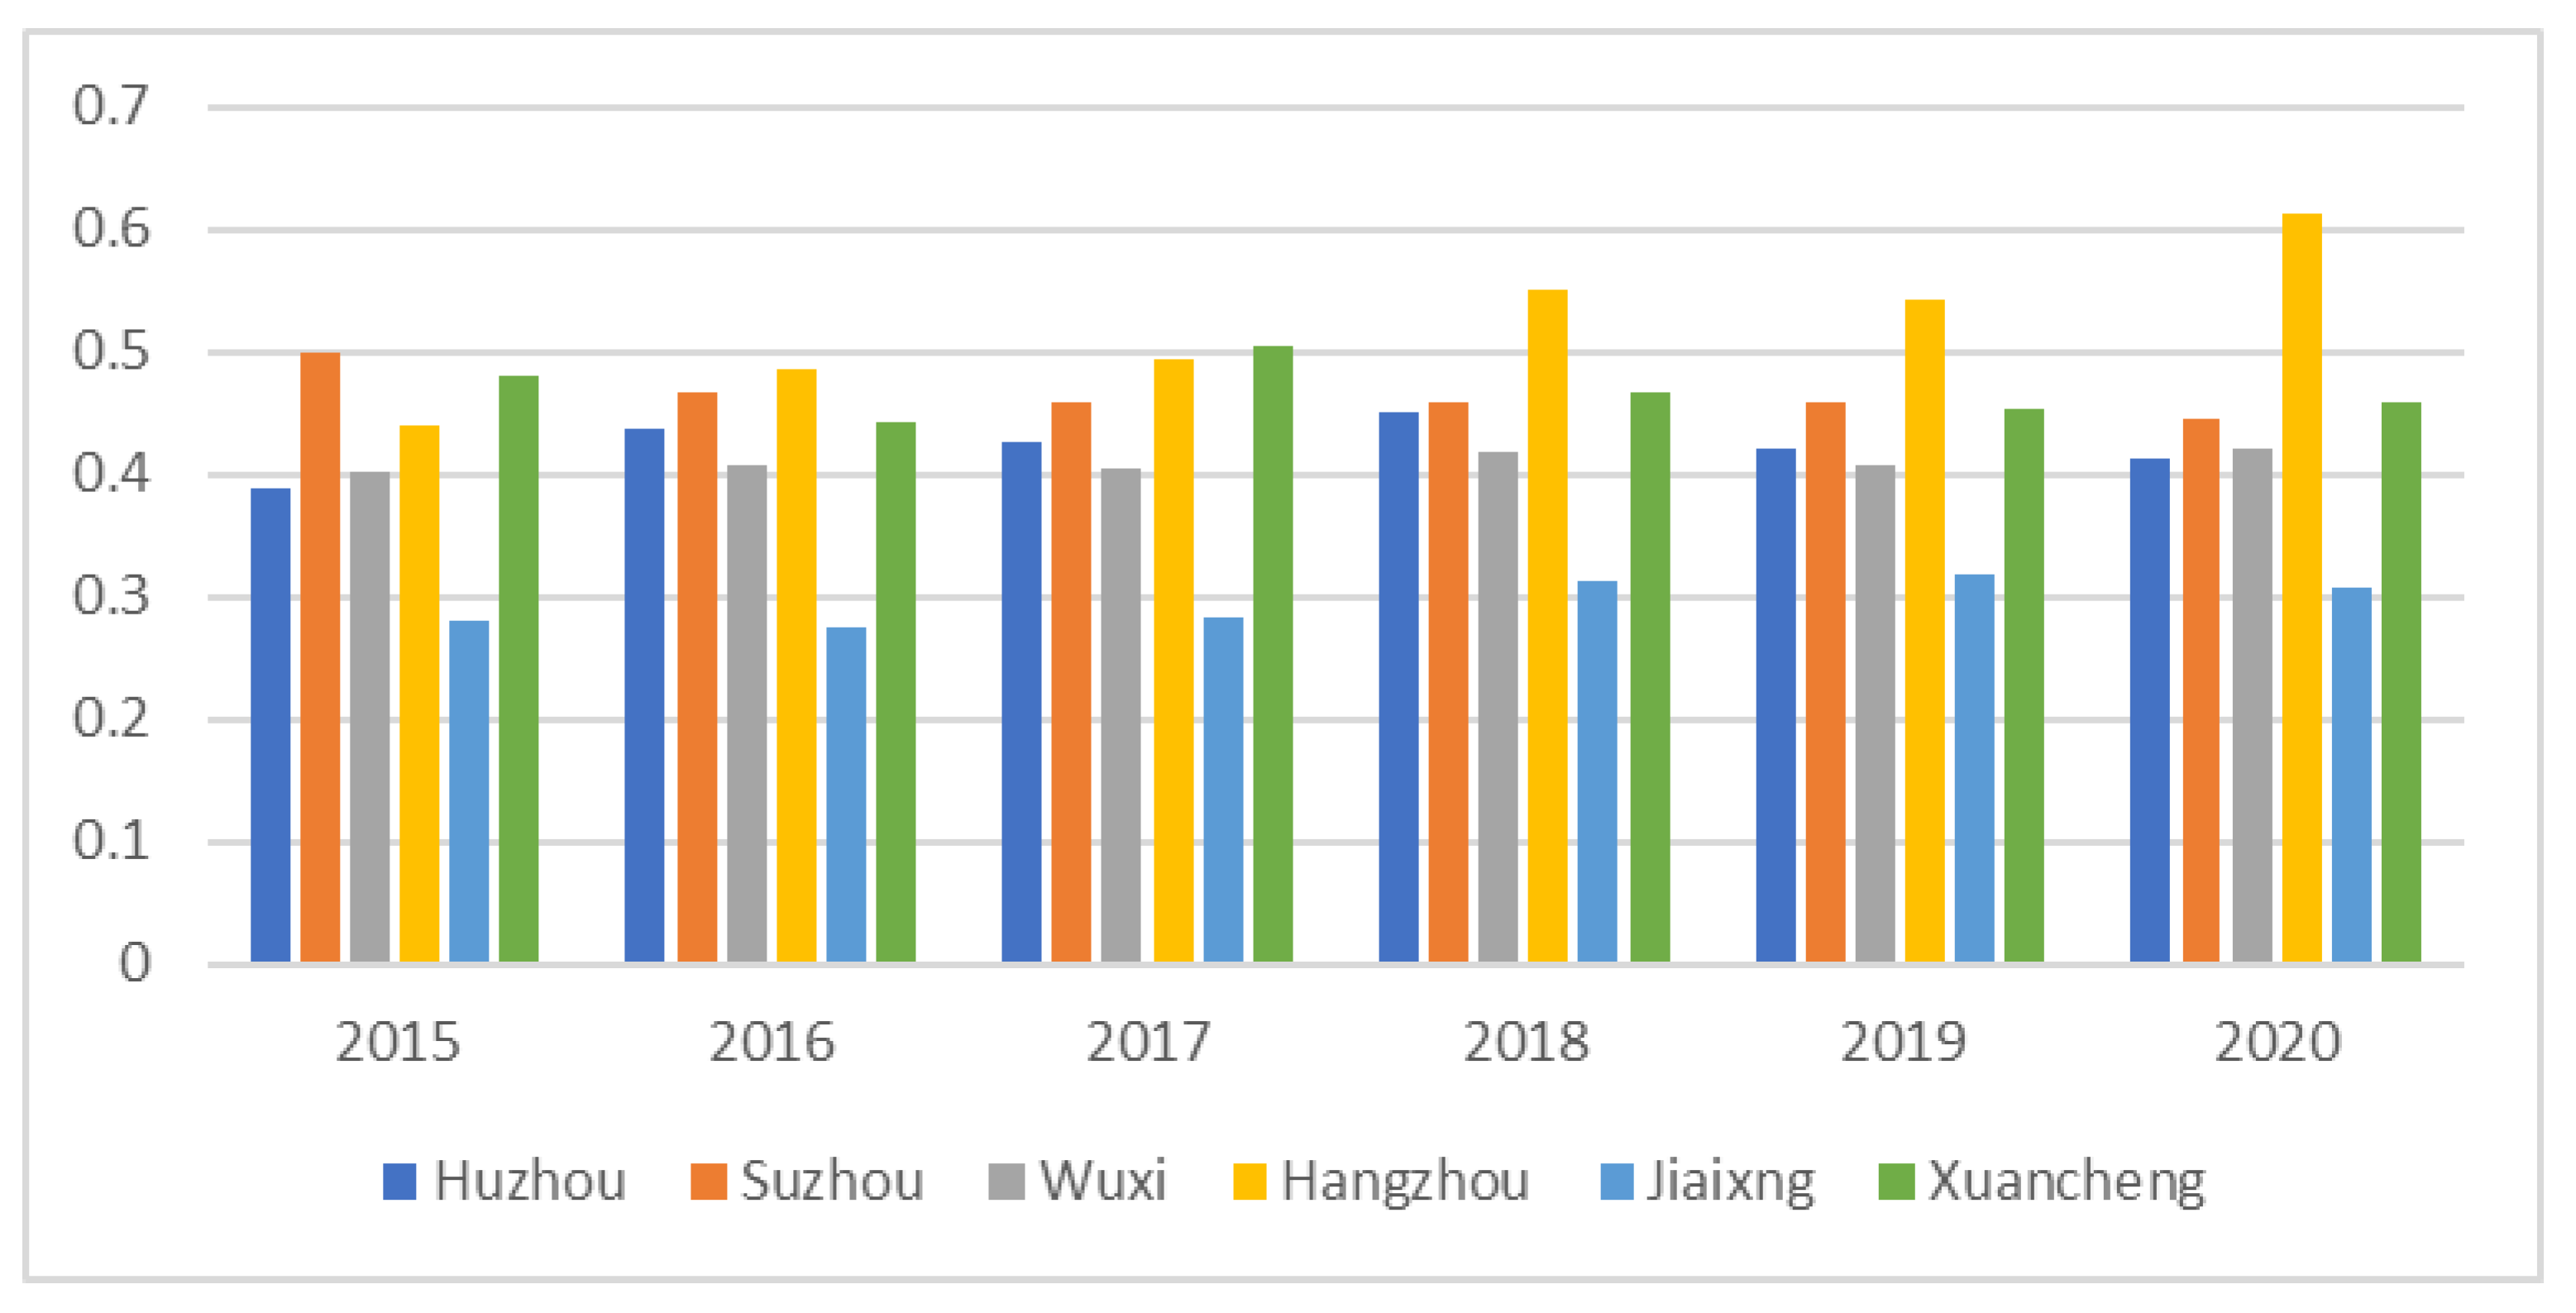
where α [ 0 , 1 ] . If α = 1 , then the integrated weight of indicator determined by Equation (13) is reduced to the subjective weight according to the AHP method, and the AHP-TOSIS method is constructed for this situation. The calculation results based on AHP-TOSIS model ( α = 1 ) are shown in Table 7 and Figure 7.
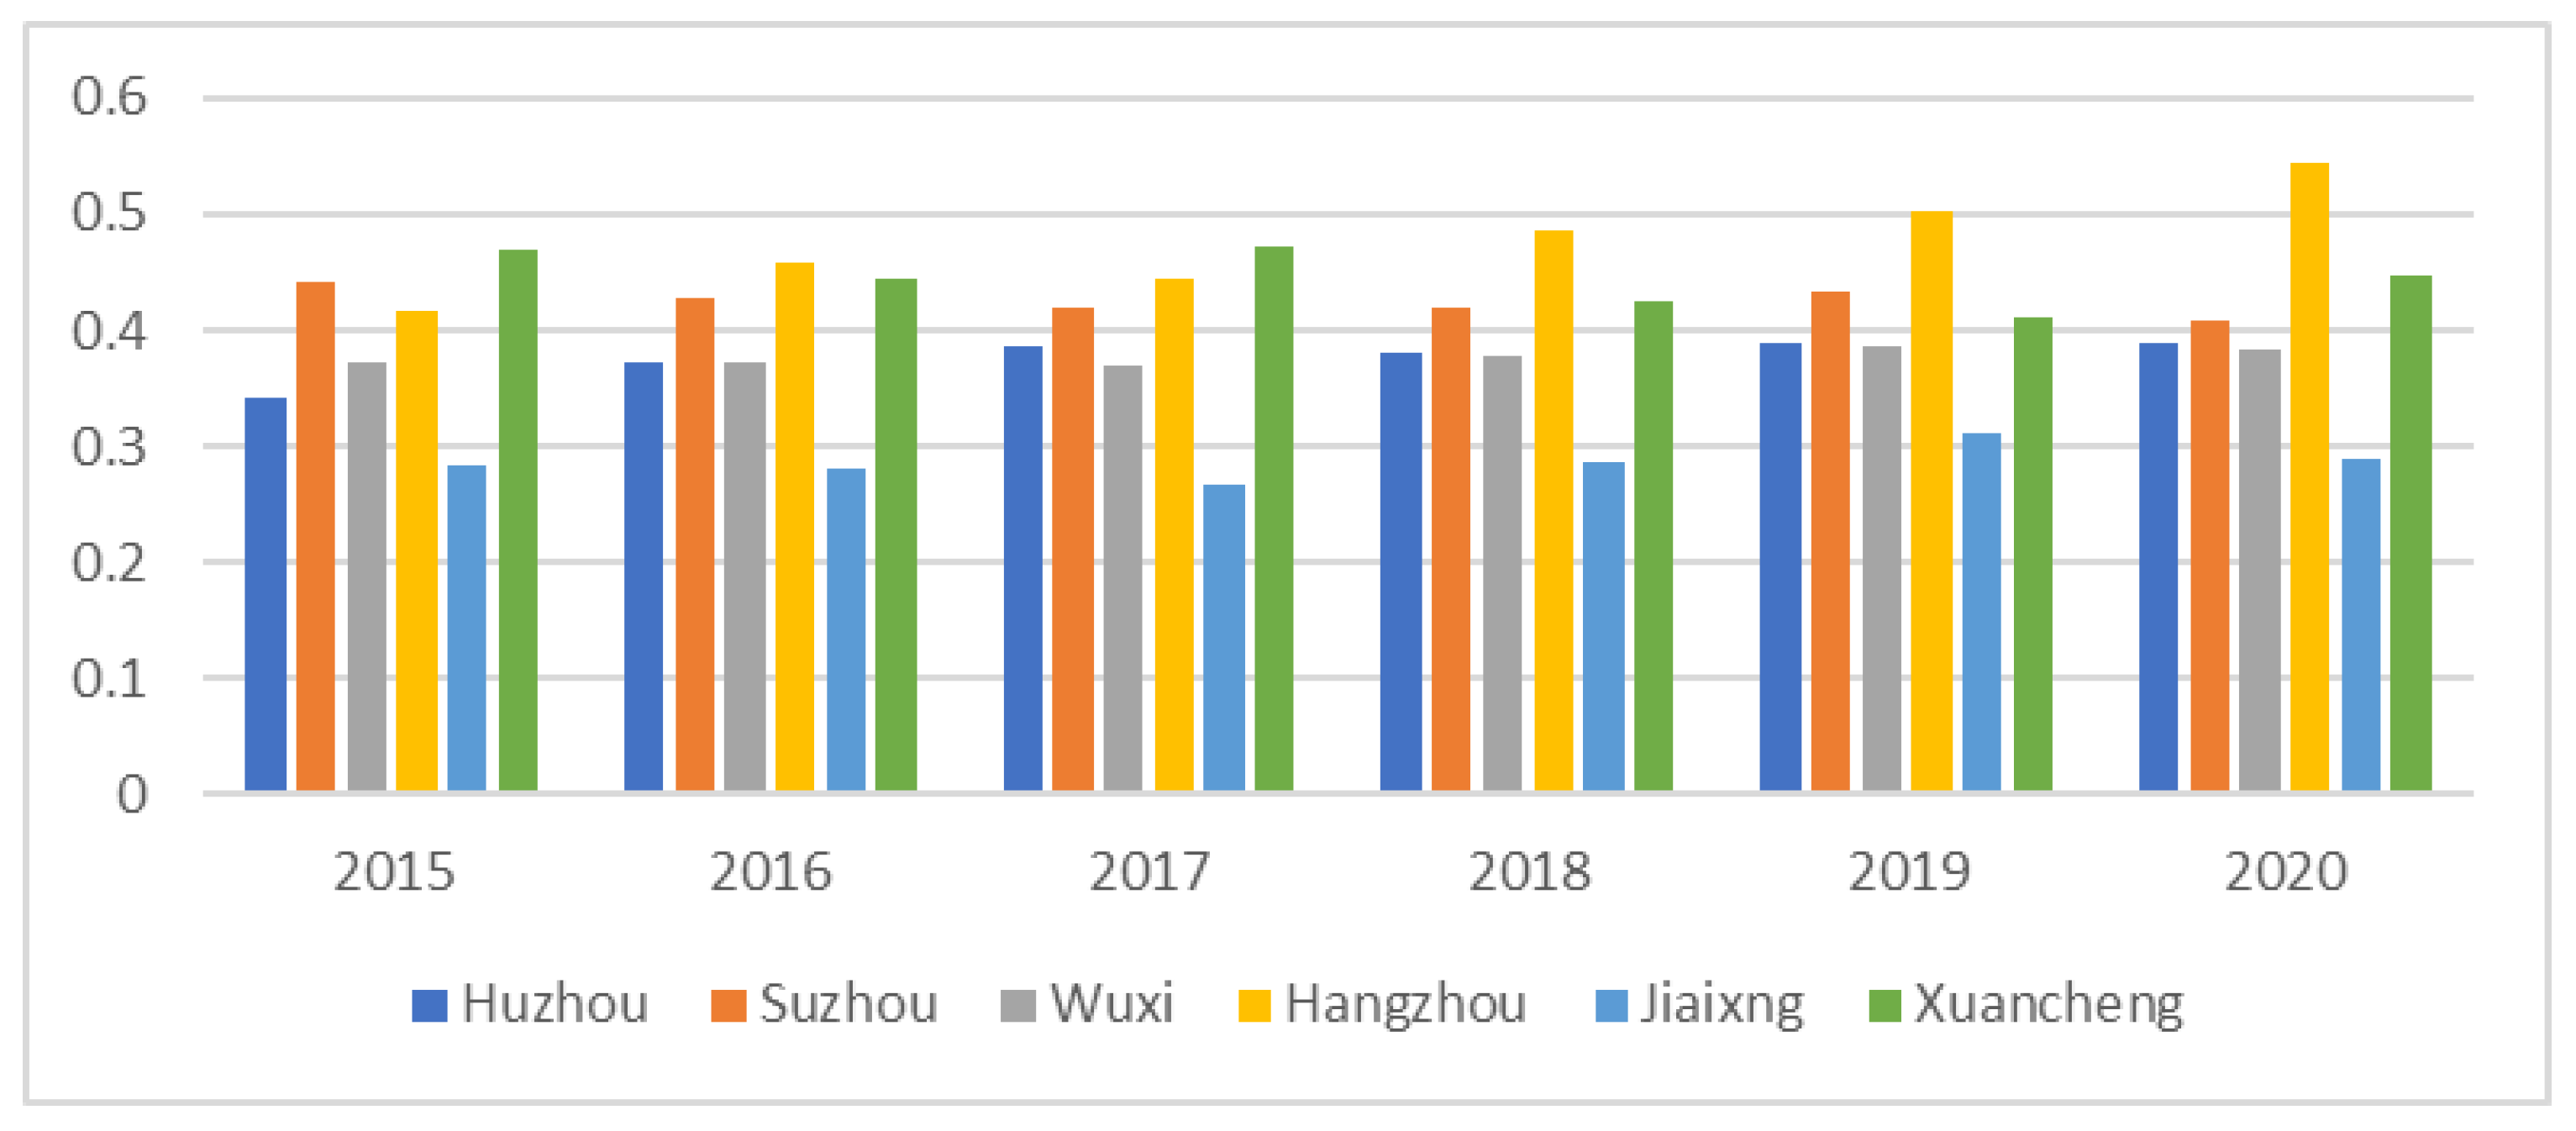
If α = 0 in Equation (13), then the entropy–TOPSIS method is obtained, which can take full advantage of the information about the raw data to assign a weight, and the results can objectively reflect the gap between the evaluation schemes. The results derived by the entropy–TOPSIS method ( α = 0 ) are shown in Table 8 and Figure 8.
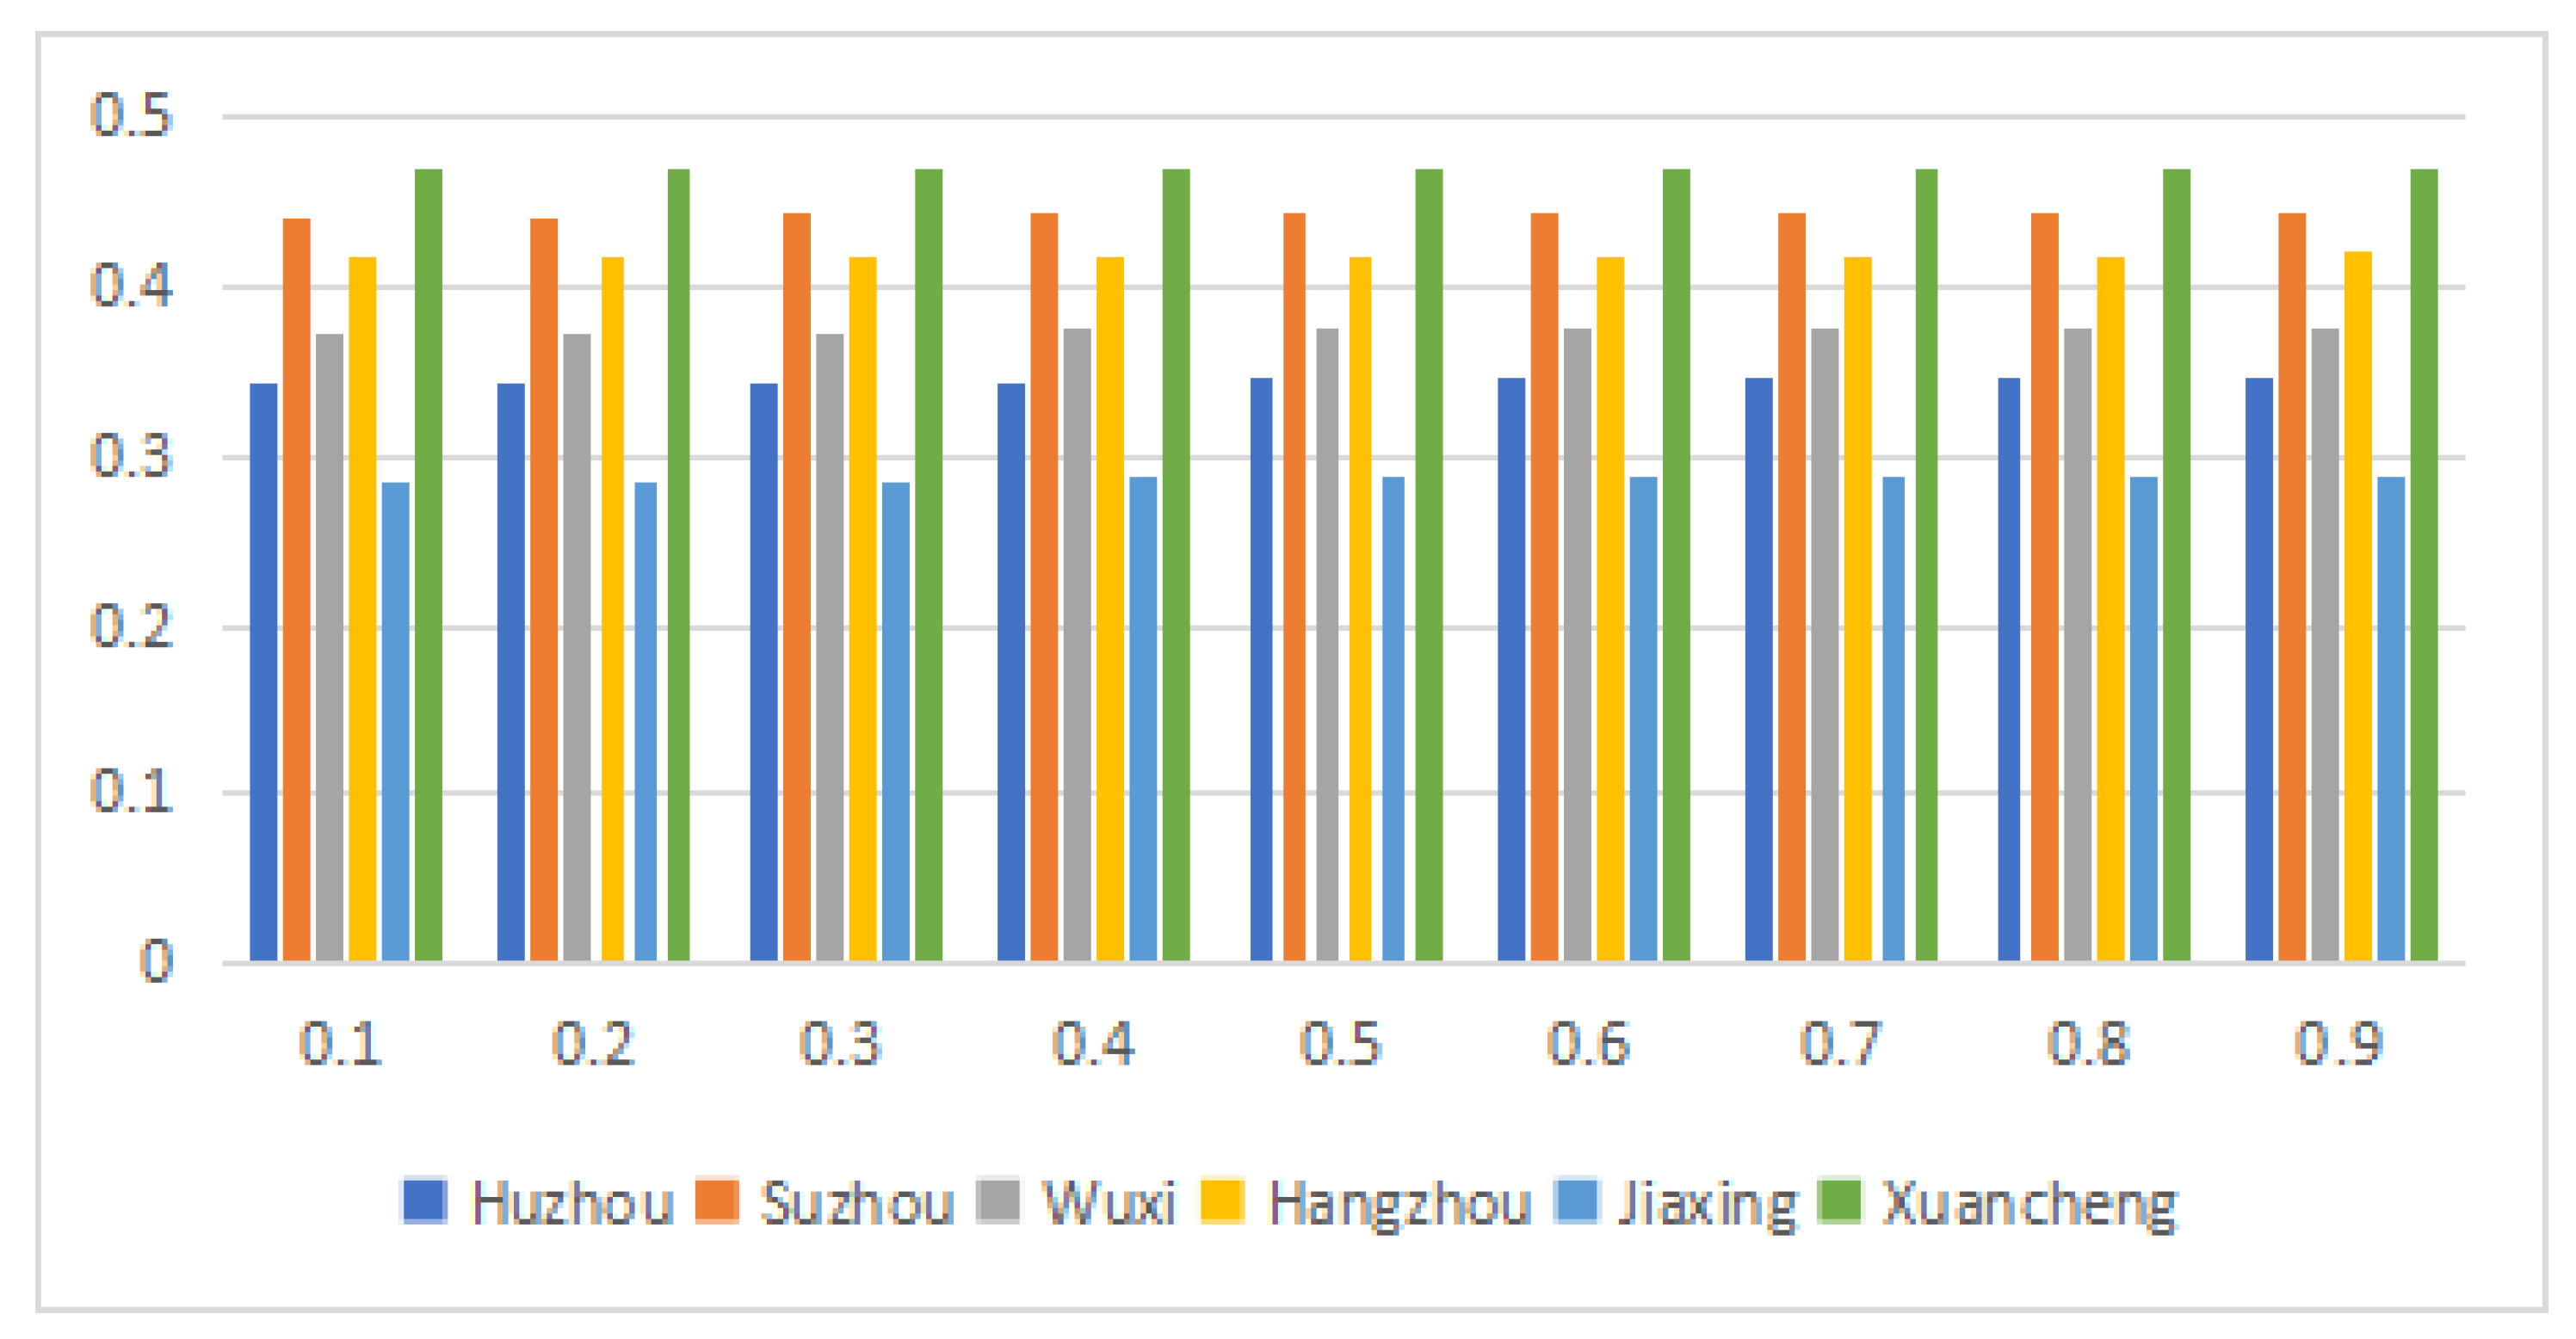
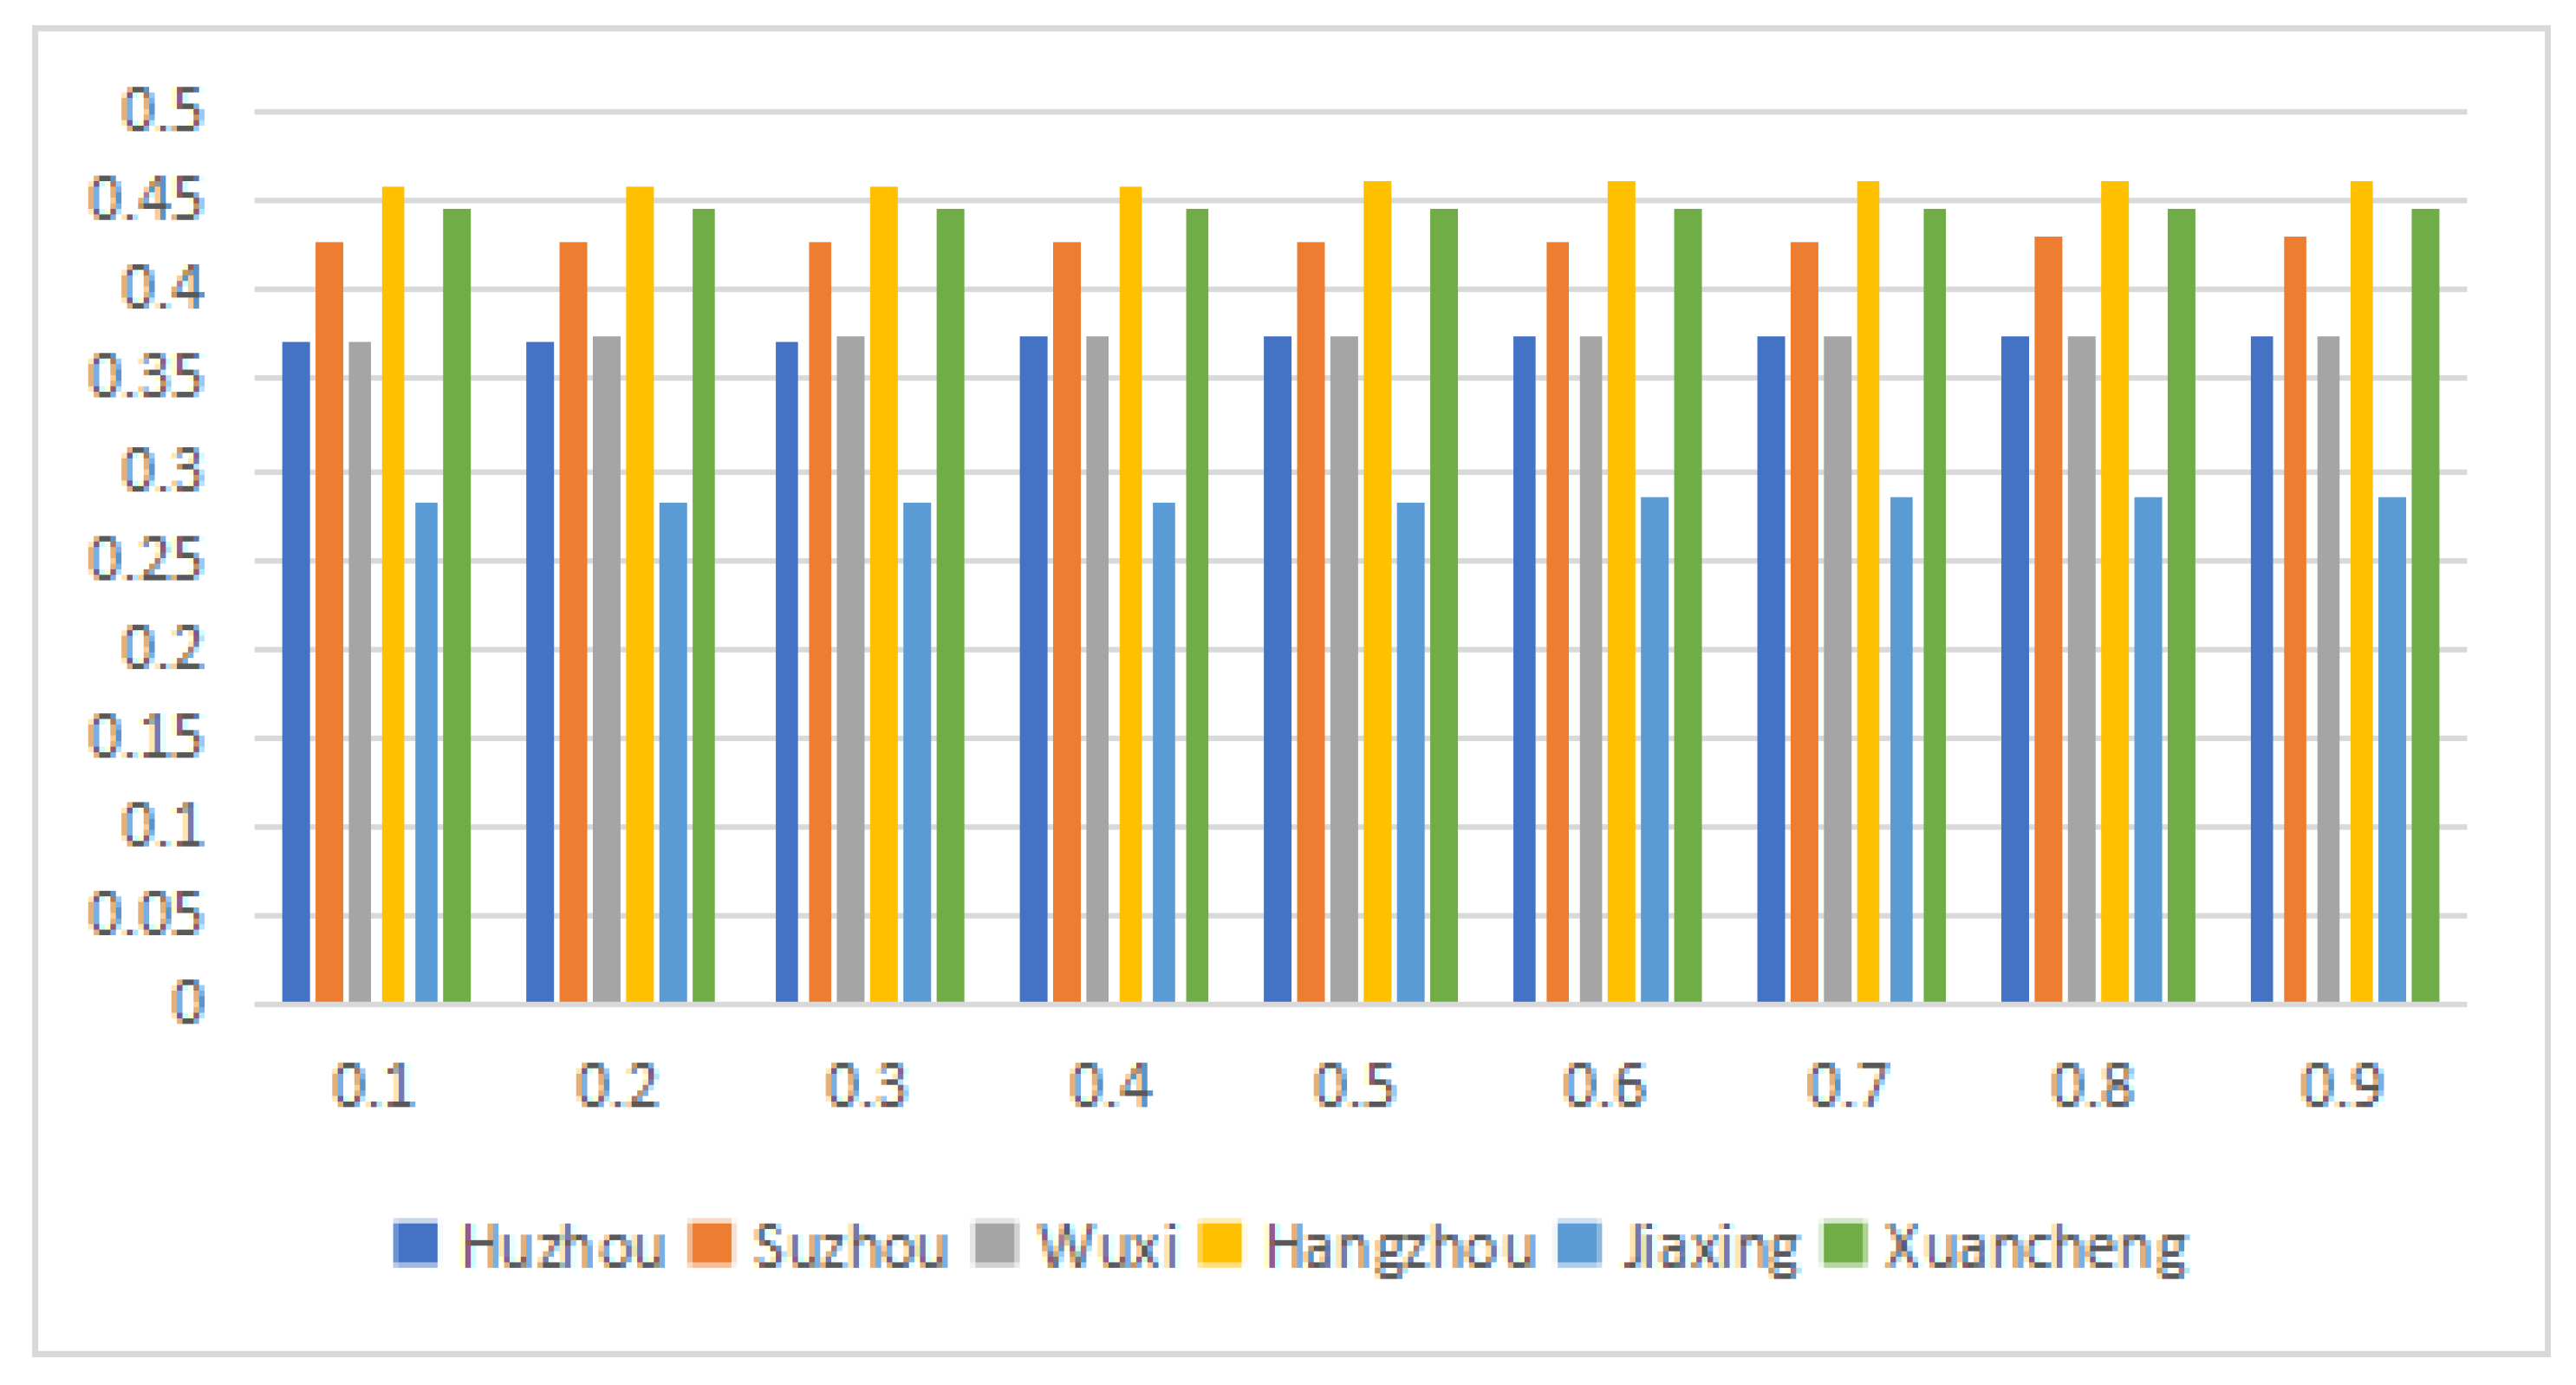
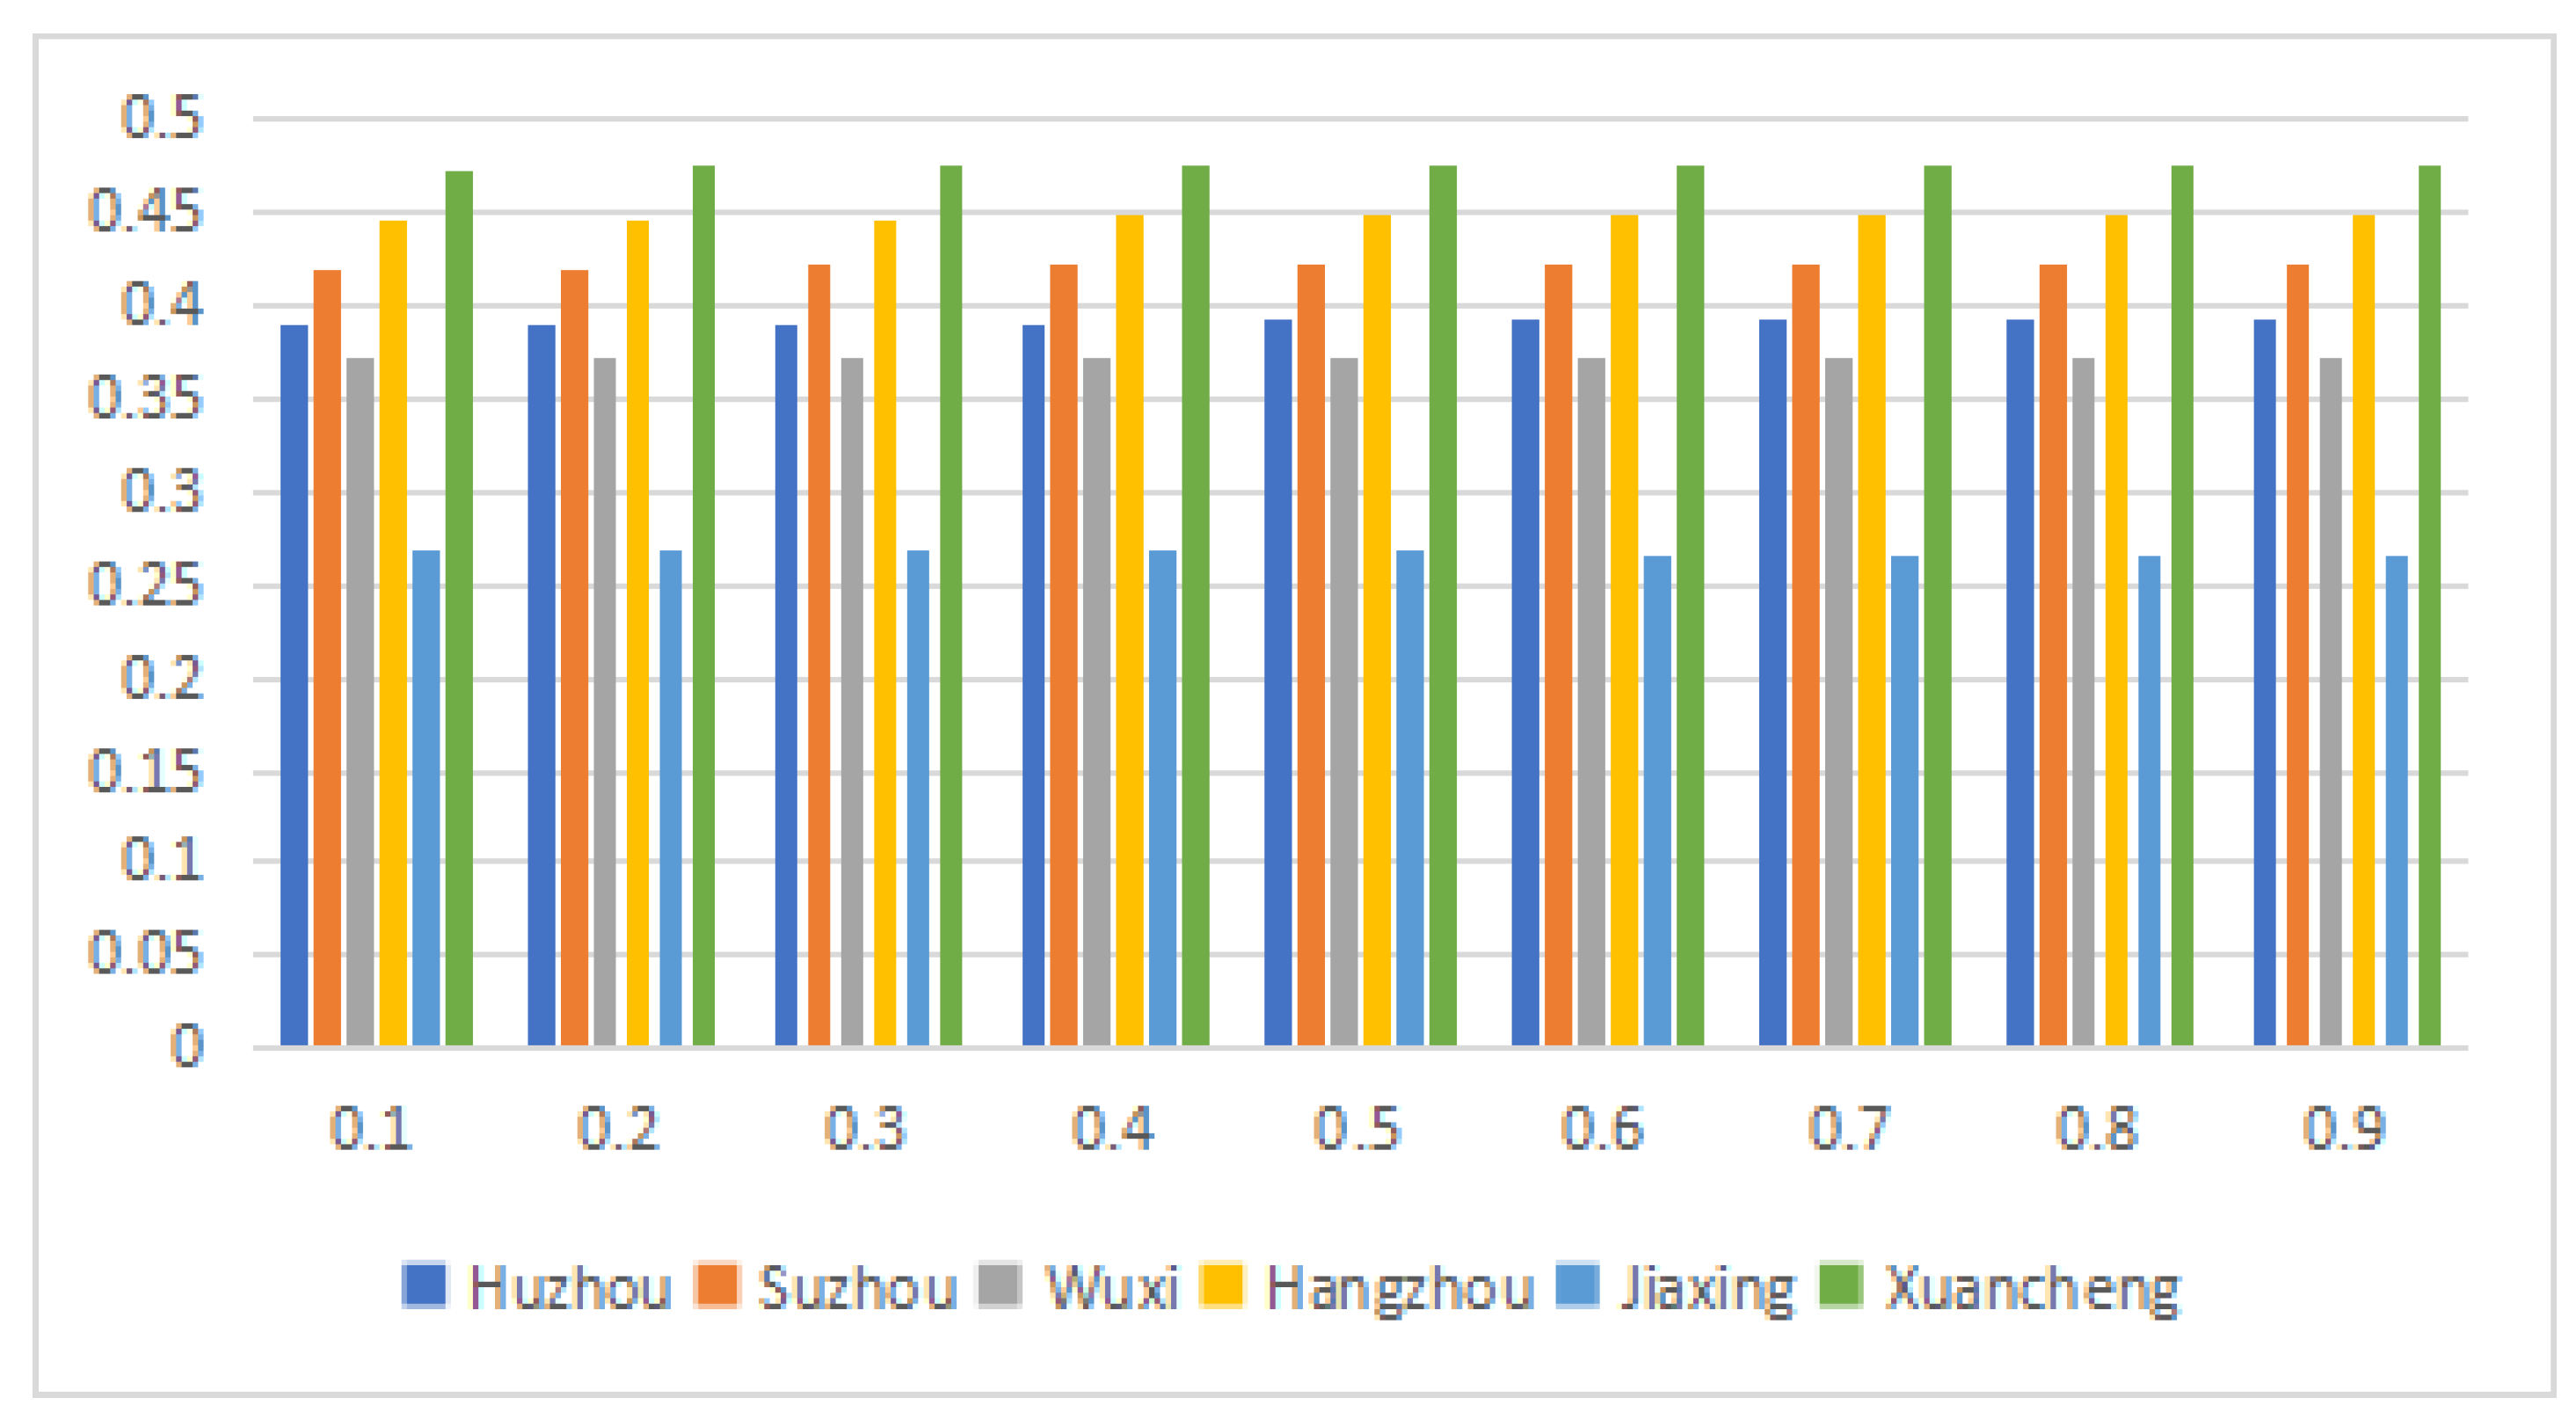
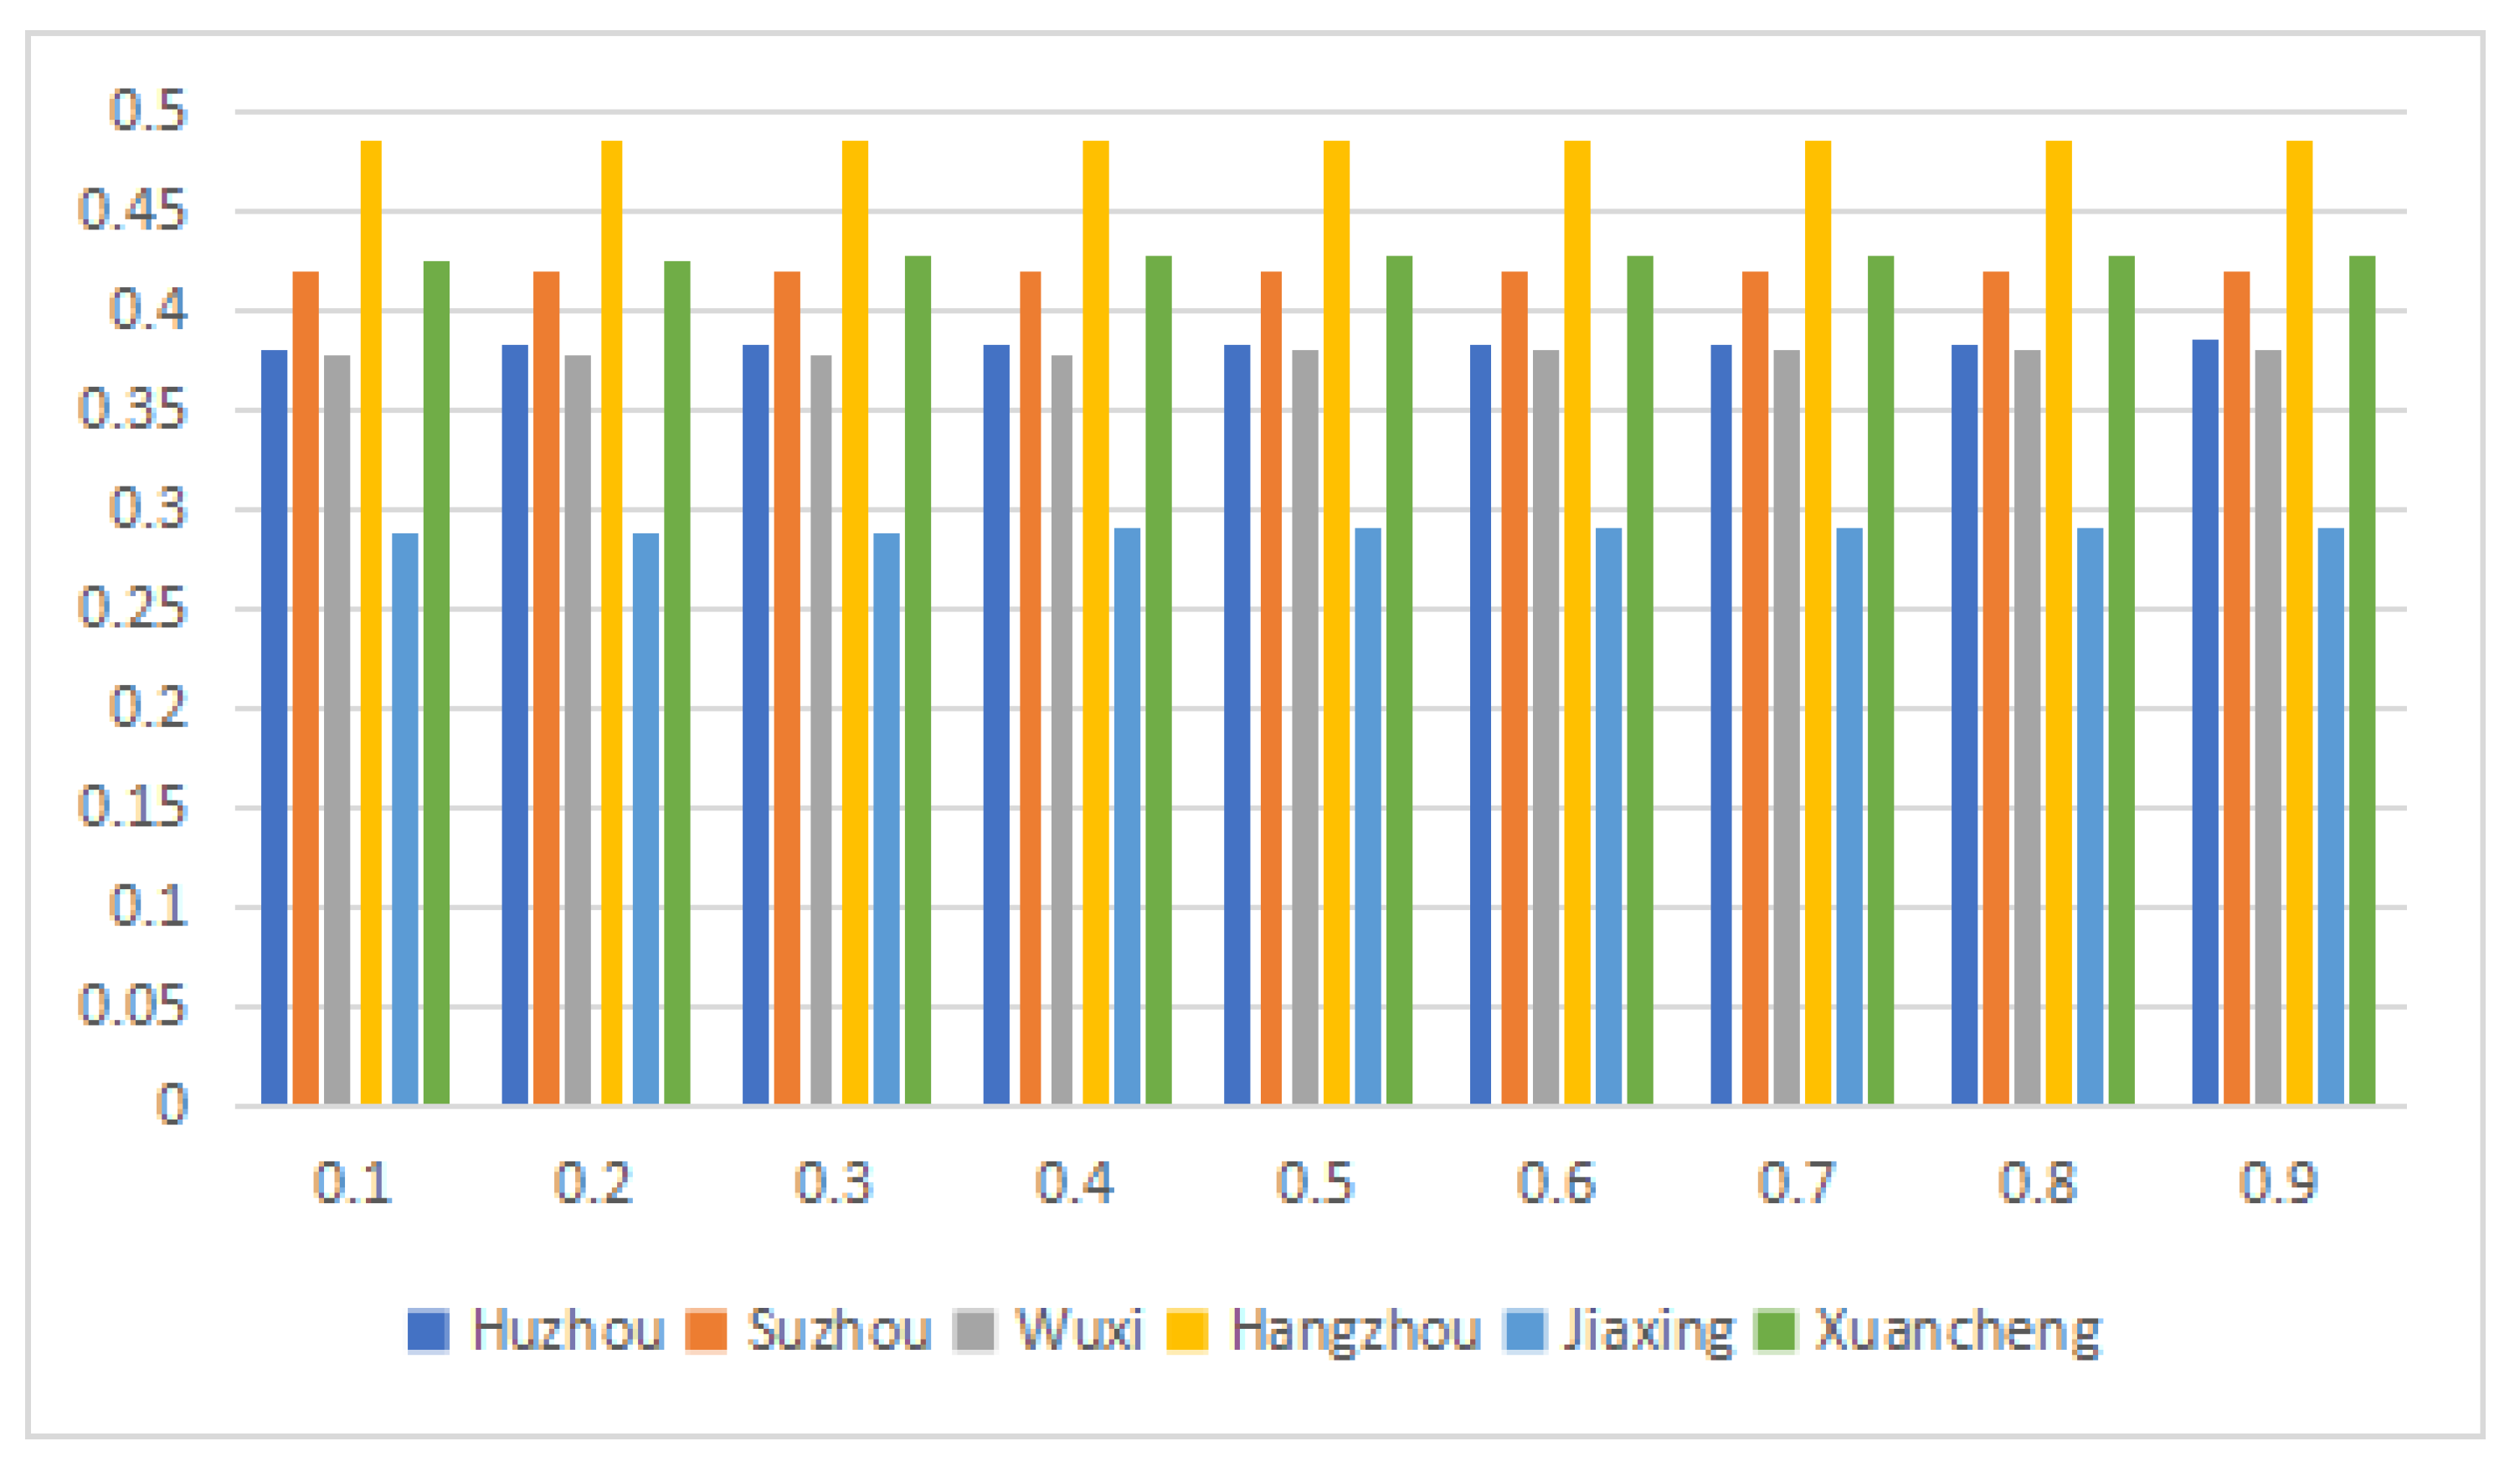
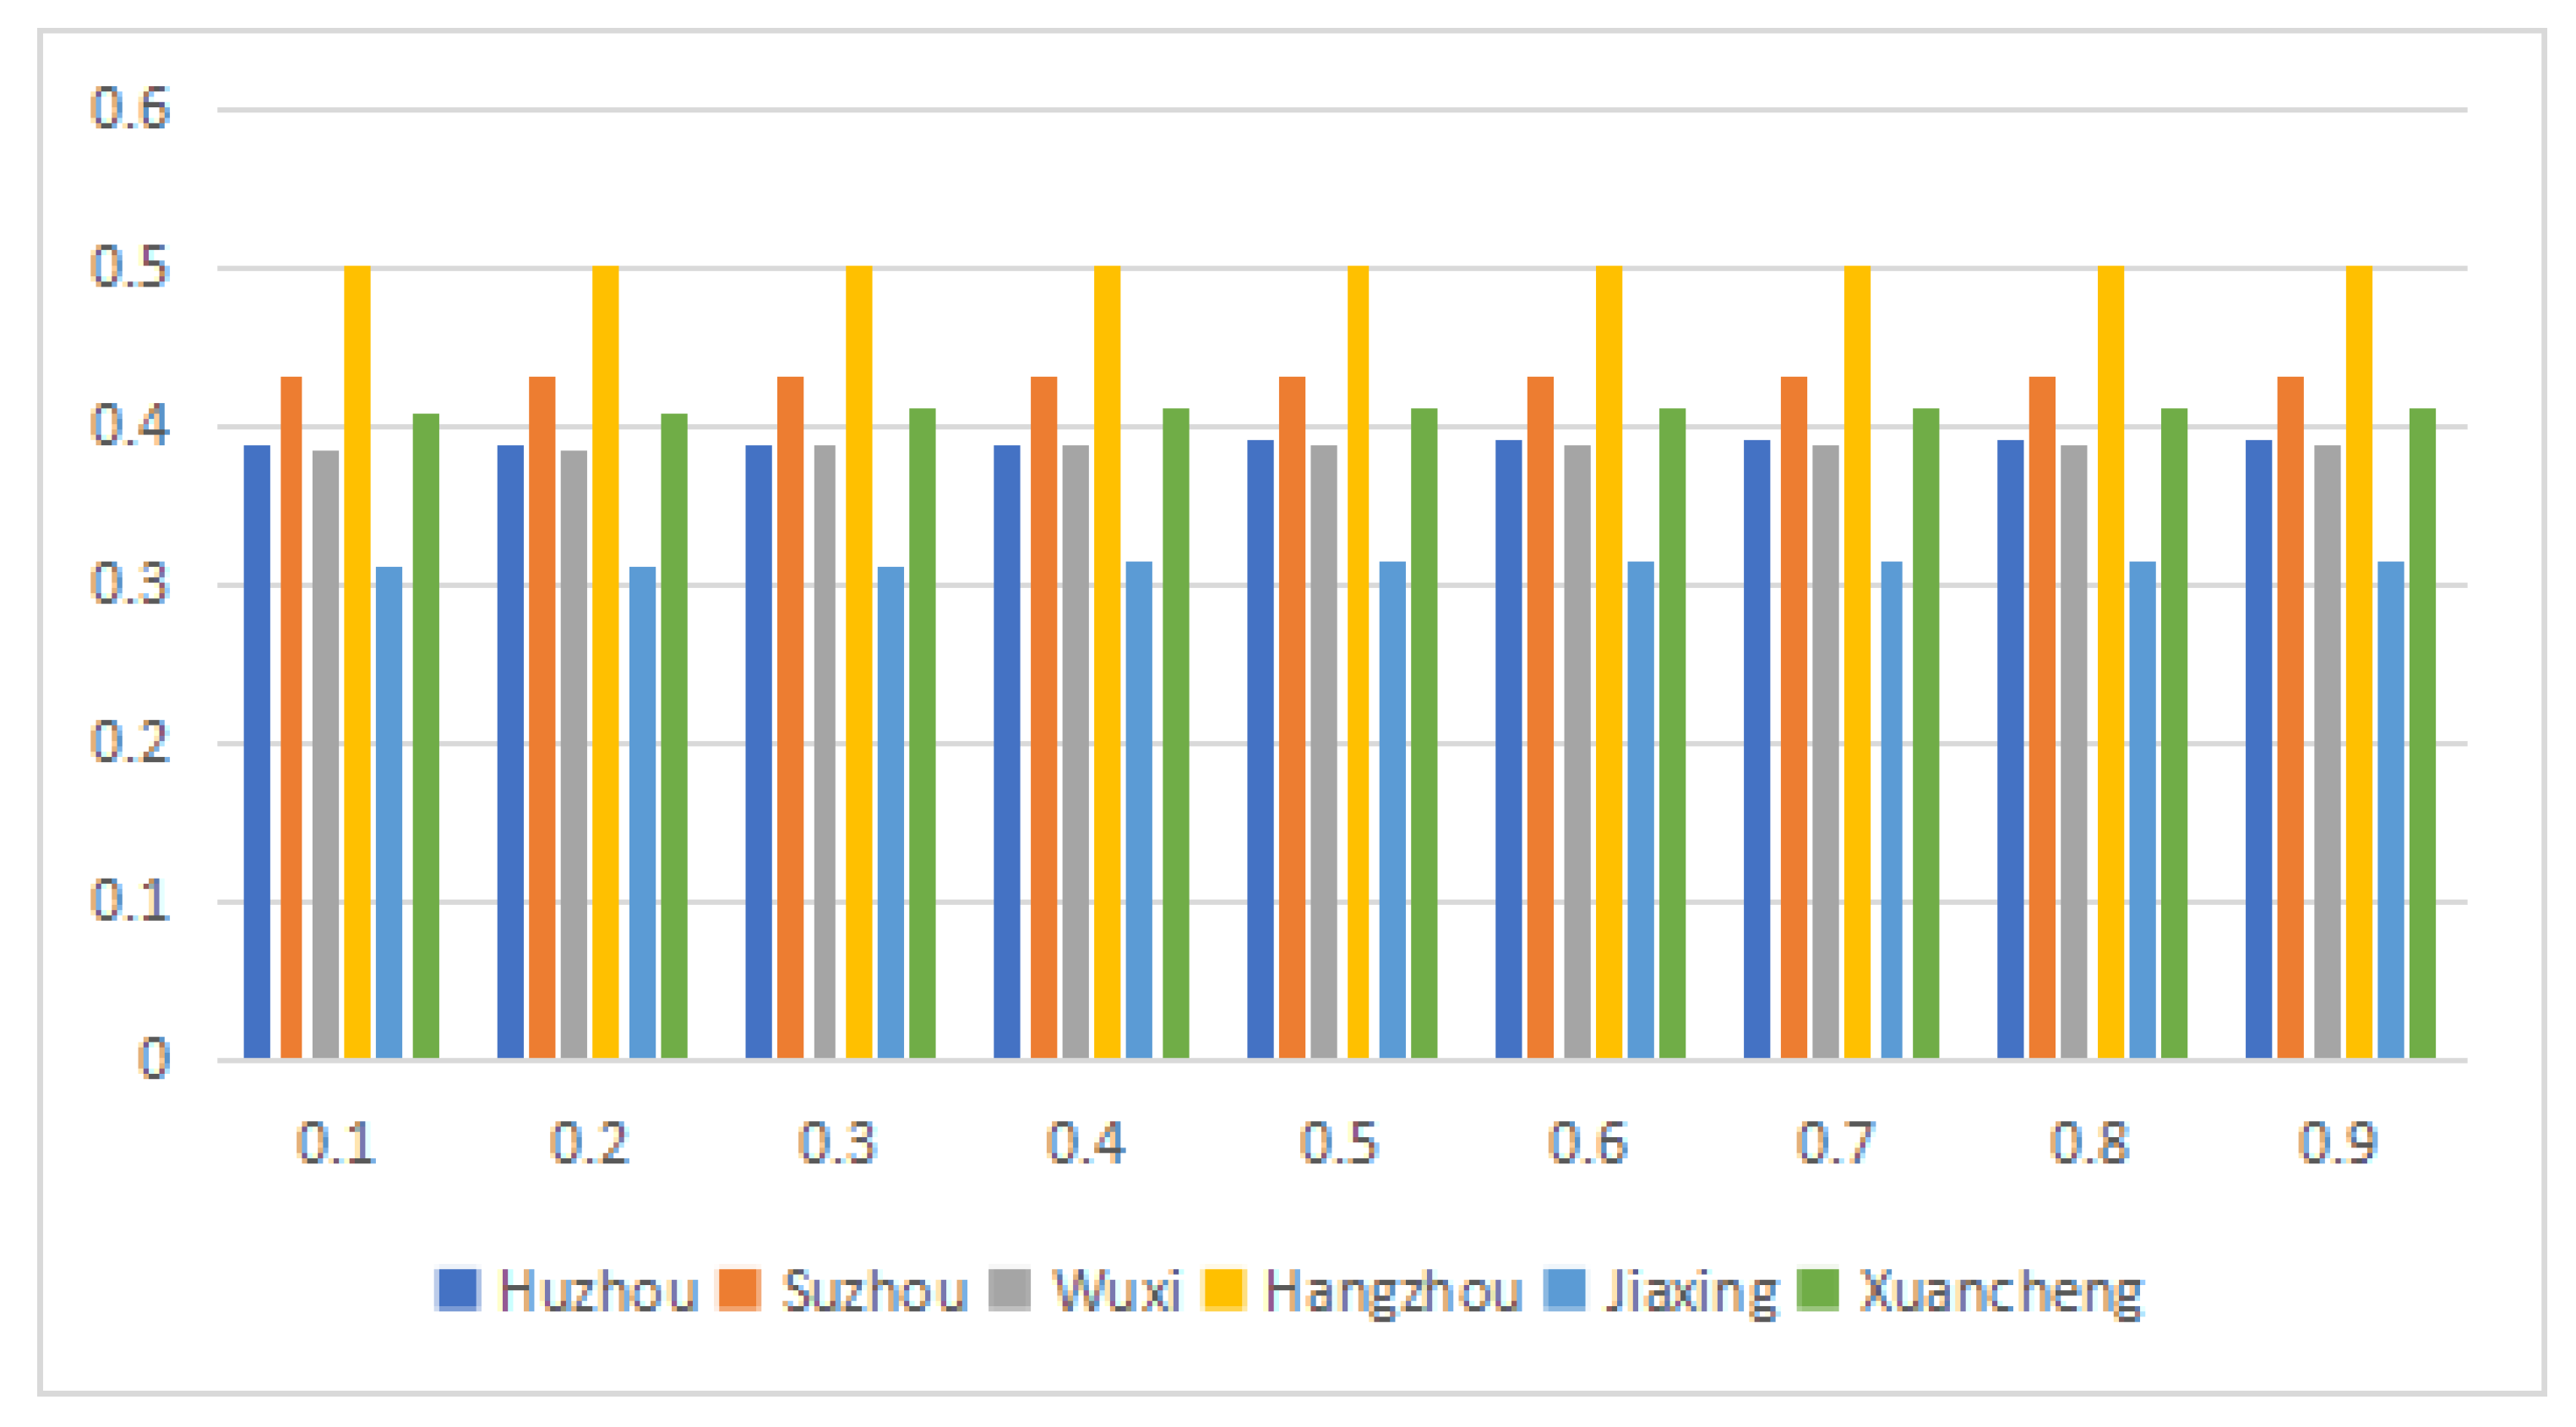
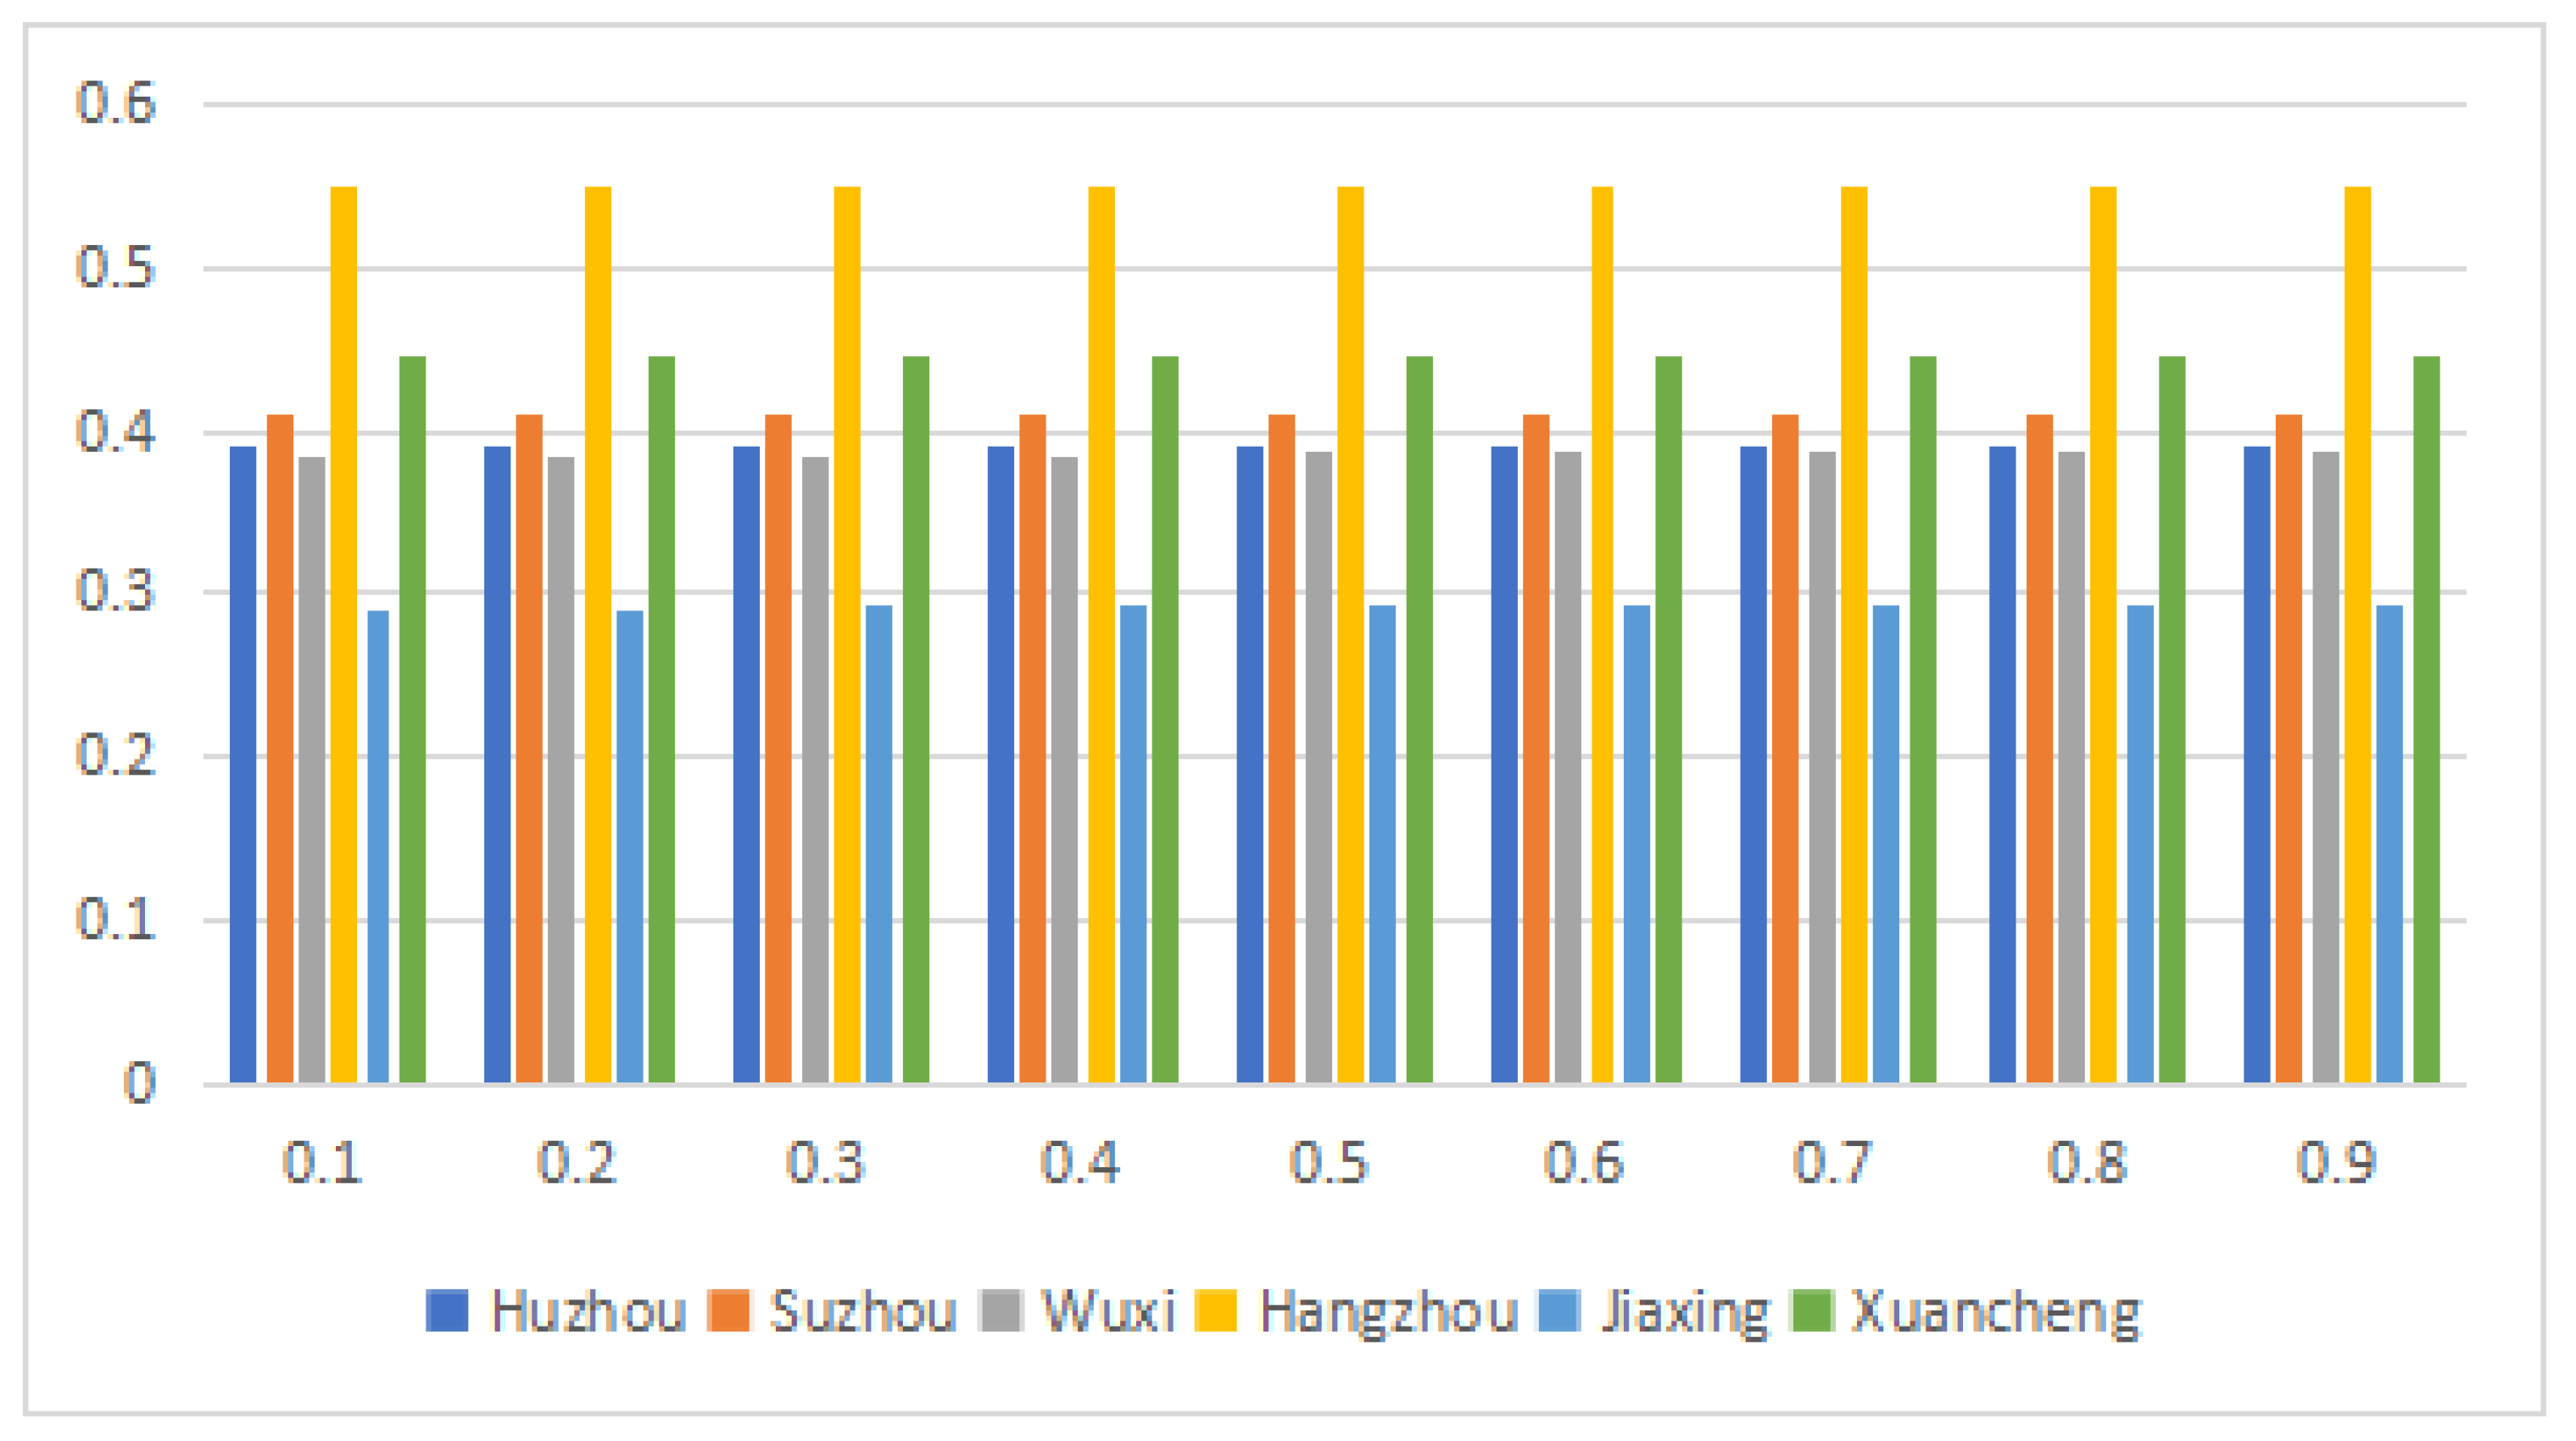
Moreover, we can further analyze the low-carbon scores of cities under other several different values of parameter α ( α = 0.1 , 0.2 , 0.3 , 0.4 , 0.5 , 0.6 , 0.7 , 0.8 , 0.9 ). The results are shown in Figure 9, Figure 10, Figure 11, Figure 12, Figure 13 and Figure 14.
It can be seen that the value of parameter α has no significant impact on the comprehensive score, and the ranking has not changed for α [ 0 , 1 ] . However, compared with AHP–TOPSIS method and entropy–TOPSIS method, it can be concluded that the advantages of the integrated TOPSIS method are as follows:
(1) Compared with AHP–TOPSIS method, the proposed integrated TOPSIS method can reduce its subjectivity while retaining the merits of clarity and flexibility of the AHP method. The integrated weight method can make full use of the information of objective data and avoid the problem of no data support.
(2) Compared with the entropy–TOPSIS method, the proposed method can avoid the weight distortion caused by excessive dependence on data and make up for the absolute treatment defect of the entropy weight method on the index under the consideration of the influence of the indexes.
In conclusion, the integrated weight TOPSIS evaluation method, composed of the AHP method and entropy weight method, has both subjective weighting method and objective weighting method, making up for the shortcomings of using these two types of methods alone and improving the scientificity and accuracy of evaluation results. Moreover, it also provides a mechanism for decision-makers to flexibly select parameters according to actual needs.

5. Summary and Suggestions

Based on the current situation of Huzhou’s low-carbon city competitiveness and the results of comprehensive evaluation and analysis, it can be found that Huzhou has a unique low-carbon natural environment. However, the comprehensive strength of the low-carbon city in Huzhou is not outstanding. The reason is that the construction of a low-carbon city needs to consider multiple factors, rather than just relying on environmental advantages. It is more important to achieve low-carbon construction sustainable development. In order to achieve a higher quality “dual-carbon” target, Huzhou should increase its policy support and promote the comprehensive development of low-carbon economic foundation, low-carbon lifestyle, low-carbon environmental construction and low-carbon technology development, focusing on low-carbon technology investment and low-carbon economic foundation construction.
First, accelerate the transformation of low-carbon industrial structure and build a more competitive green modern industrial system. The industrial structure affects the total energy consumption and the energy intensity of the economy. The primary and tertiary industries among the three industries consume relatively limited energy, and it is the secondary industry that really consumes a lot of energy. The proportion of secondary industry in Huzhou exceeded the proportion of tertiary industry in 2019 by as much as 51.05%, and the proportion of secondary industry was still the highest among the three industries in 2020. Therefore, in the future, Huzhou should consolidate the “strong industrial city” on the basis of efforts to develop green intelligent manufacturing characteristics, a bigger and stronger digital industry, high-end equipment, new materials, life and health, and other four strategic emerging industries, to upgrade the green home furnishing, modern textile two traditional industries.
Second, strengthen the leading role of green science and technology innovation. Huzhou should increase investment in green low-carbon city innovation and strengthen support for the new energy industry in terms of research and development, implementation, and transformation of results. Around the construction of a new energy technology system, develop different kinds of waste reuse technology and energy-saving and environmental protection technology to achieve low-carbon upgrade of the production process.
Third, increase efforts to promote the concept of low-carbon living and build a high level of beautiful and livable cities. At present, most consumers have limited knowledge of the importance of energy conservation and emission reduction and the relationship between their daily consumption behavior and energy conservation and emission reduction. Therefore, while providing guidance, we should also expand the publicity to create a social atmosphere of energy conservation, energy efficiency, and carbon dioxide emission reduction, so that the concept of achieving the “dual-carbon” goal can be implemented in every household. The authorities should adopt a multi-channel approach to promote low-carbon living or develop a series of economic measures to encourage people to adopt low-carbon lifestyles in all aspects of their lives, including food, clothing, housing, and transport.
Fourth, use taxation, subsidies, and other financial means to promote energy conservation and emission reduction in enterprises and improve the efficiency of industrial energy use. Huzhou should actively respond to the national call to actively improve the financial and taxation policy mechanisms for green development. Make full use of financial and market advantages to promote clean technology investment in enterprises, while reducing the cost of carbon dioxide emission reduction and improving the effectiveness of emission reduction by enterprises. The government should levy a low-carbon environmental tax on the carbon dioxide emissions of enterprises, which will not only guide low energy consumption production methods through market price leverage, but also increase government tax revenue to fund other energy-saving and emission-reduction activities. The government should promote research on energy efficiency technologies through subsidies and the setting of special low-carbon funds, accelerate the development of clean energy technologies and strive to achieve an industrial “zero carbon“ in industry.
Fifth, integrate low-carbon green development into the development goals of the Yangtze River Delta integration. Around the goal of creating a leading demonstration area for green development in the Yangtze River Delta, Huzhou City should strengthen the close linkage development with the demonstration area for integrated ecological and green development in the Yangtze River Delta, strive to create a model city for green and low-carbon development in the Yangtze River Delta, build a model ecological city at a high level, and strive to accelerate the pace of green and low-carbon across the region to a new level.
In future research, we will analyze the impact of COVID-19 on China’s low-carbon urban construction and explore corresponding evaluation methods under the complex environment.

Author Contributions

Writing—original draft preparation, Y.C. and Y.Y.; writing—review and editing, S.Z.; methodology, H.L. and P.L. All authors have read and agreed to the published version of the manuscript.

Funding

This work is supported by the Social Sciences Planning Projects of Zhejiang (21QNYC11ZD).

Institutional Review Board Statement

Not Applicable.

Informed Consent Statement

Not Applicable.

Data Availability Statement

Not Applicable.

Conflicts of Interest

The authors declare no conflict of interest.

Appendix A

Table A1. Index data for Huzhou city in 2015–2020.
Year201520162017201820192020
Index
GDP per capita C1170,89377,11082,95290,304102,04095,600
Proportion of primary industry C125.885.585.214.694.294.39
Proportion of secondary industry C1348.9948.1347.3246.8451.0549.59
Proportion of tertiary industry C1445.1346.2947.4648.4644.6246.02
Engel’s coefficient for urban residents C1530.4230.7730.4429.4627.9428.66
Electricity consumption per capita C2175428408920310,30897838956
Domestic water consumption per capita C2254.153.652.075150.348.7
Number of private cars ownership per capita C23525557586269
Electricity consumption of the whole society C24198.91222.2244.33274.8261.52302.23
Air quality C31Not Reaching Second LevelNot Reaching Second LevelInferior Second LevelInferior Second LevelSecond LevelSecond Level
Forest cover C3250.950.948.448.448.1448.2
Urban greenery coverage C3348.0649.3150.9846.3646.3846.45
Green space per capita C3414.9116.416.417.7317.7317.31
Total amount of emission for industrial waste gases C352100.891983.232497.122341.772163.862465.68
Comprehensive energy consumption C36731.77754.63758.68810.52882.64877.01
R&D fund investment C4153.259.1865.5776.1487.0198.88
Harmless treatment rate of urban domestic waste C42100100100100100100
Investment in industrial pollution control sources C4344,37333,93531,96219,25425,603213,232
Energy consumption per unit of GDP C440.580.550.520.500.460.44
Comprehensive solid waste utilization rate C4597.8799.2599.2599.6499.6999.97

References

  1. Guo, H.X.; Yang, C.M.; Liu, X.; Li, Y.; Meng, Q. Simulation evaluation of urban low-carbon competitiveness of cities within Wuhan city circle in China. Sustain. Cities Soc. 2018, 42, 688–701. [Google Scholar] [CrossRef]
  2. Yang, D.W.; Liu, B.; Ma, W.J.; Guo, Q.; Li, F.; Yang, D. Sectoral energy-carbon nexus and low-carbon policy alternatives: A case study of Ningbo, China. J. Clean. Prod. 2017, 156, 480–490. [Google Scholar] [CrossRef]
  3. Qu, Y.; Liu, Y. Evaluating the low-carbon development of urban China. Environ. Dev. Sustain. 2017, 19, 939–953. [Google Scholar] [CrossRef]
  4. Wang, Y.; Fang, X.; Yin, S.; Chen, W. Low-carbon development quality of cities in China: Evaluation and obstacle analysis. Sustain. Cities Soc. 2020, 64, 102553. [Google Scholar] [CrossRef]
  5. Wang, Y.J.; Lan, Q.X.; Jiang, F.; Chen, C. Construction of China’s low-carbon competitiveness evaluation system: A study based on provincial cross-section data. Int. J. Clim. Change Strateg. Manag. 2020, 12, 74–91. [Google Scholar] [CrossRef]
  6. Ouyang, H.; Wang, L.; Liu, B.K. Research on the evaluation index system of national low-carbon cities (towns). Macroecon. Res. 2016, 38, 59–66. [Google Scholar]
  7. Paloheimo, E.; Olli, S. Evaluating the carbon emissions of the low-carbon city: A novel approach for consumer based allocation. Cities 2013, 30, 233–239. [Google Scholar] [CrossRef]
  8. Liu, J.; Hu, J.B.; Luo, Y.L. Construction and empirical evidence of low-carbon city measurement index system. Stat. Decis.-Mak. 2015, 31, 59–62. [Google Scholar]
  9. Shi, L.; Xiang, X.; Zhu, W.; Gao, L. Standardization of the Evaluation Index System for Low-Carbon Cities in China: A Case Study of Xiamen. Sustainability 2018, 10, 3751. [Google Scholar] [CrossRef] [Green Version]
  10. Zhang, C.P.; Gao, W. Comprehensive evaluation of low-carbon economy in Shandong Province based on entropy rights-grey correlation-TOPSIS method. Sci. Technol. Manag. Res. 2014, 34, 37–42. [Google Scholar]
  11. Liu, Q.P. Reflections on the construction of a low-carbon city evaluation index system in China. China Popul. Resour. Environ. 2013, 23, 280–283. [Google Scholar]
  12. Xiu, Y.; Wang, X.C.; Zhou, Z.Y. Development path of Chinese low-carbon cities based on index evaluation. Adv. Clim. Chang. Res. 2018, 9, 144–153. [Google Scholar]
  13. Hunter, G.W.; Sagoe, G.; Vettorato, D.; Ding, J. Sustainability of Low Carbon City Initiatives in China: A Comprehensive Literature Review. Sustainability 2019, 11, 4342. [Google Scholar] [CrossRef] [Green Version]
  14. Xu, Z.; Xu, T.X. Research on the Index System Construction of Low-carbon City for Jinan. Adv. Mater. Res. 2014, 3246, 1726–1729. [Google Scholar] [CrossRef]
  15. Ma, W.T.; Martin, J.; Mark, B.; Mu, R. Mix and match: Configuring different types of policy instruments to develop successful low-carbon cities in China. J. Clean. Prod. 2021, 282, 125399. [Google Scholar] [CrossRef]
  16. Peng, T.; Deng, H. Research on the sustainable development process of low-carbon pilot cities: The case study of Guiyang, a low-carbon pilot city in south-west China. Environ. Dev. Sustain. 2021, 23, 2382–2403. [Google Scholar] [CrossRef]
  17. Wang, Y.F.; Li, L.Y. Analysis on the Index of Building Low-Carbon City in Taiyuan. In Proceedings of the 2019 IEEE 3rd International Conference on Green Energy and Applications (ICGEA), Taiyuan, China, 16–18 March 2019; pp. 188–192. [Google Scholar]
  18. Duan, Y.; Mu, H.; Li, N.; Li, L.; Xu, Z. Research on Comprehensive Evaluation of Low Carbon Economy Development Level Based on AHP-Entropy Method: A Case Study of Dalian. Energy Procedia 2016, 104, 468–474. [Google Scholar] [CrossRef]
  19. Peng, T.; Jin, Z.; Xiao, L. Evaluating low-carbon competitiveness under a DPSIR-Game Theory-TOPSIS model—A case study. Environ. Dev. Sustain. 2021, 24, 5962–5990. [Google Scholar] [CrossRef]
  20. Yuan, K.; Hu, B.; Niu, T.; Zhu, B.; Zhang, L.; Guan, Y. Competitiveness Evaluation and Obstacle Factor Analysis of Urban Green and Low-Carbon Development in Beijing-Tianjin-Hebei Cities. Math. Probl. Eng. 2022, 2022, 5230314. [Google Scholar] [CrossRef]
  21. Pan, W.Y.; Wang, Z.J. Research on the evaluation of domestic and foreign gaps in low-carbon competitiveness. Intell. Mag. 2013, 32, 183–190. [Google Scholar]
  22. Yang, S.; Pan, Y.; Zeng, S.Z. Decision making framework based Fermatean fuzzy integrated weighted distance and TOPSIS for green low-carbon port evaluation. Eng. Appl. Artif. Intell. 2022, 114, 105048. [Google Scholar] [CrossRef]
  23. Zeng, S.Z.; Hu, Y.J.; Llopis-Albert, C. Stakeholder-inclusive multi-criteria development of smart cities. J. Bus. Res. 2023, 154, 113281. [Google Scholar] [CrossRef]
  24. Zhang, W.; Zhang, X.; Li, F.; Huang, Y.; Xie, Y. Evaluation of the urban low-carbon sustainable development capability based on the TOPSIS-BP neural network and grey relational analysis. Complexity 2020, 2020, 6616988. [Google Scholar] [CrossRef]
  25. Saaty, T.L. The Analytic Hierarchy Process; McGraw-Hill: New York, NY, USA, 1980. [Google Scholar]
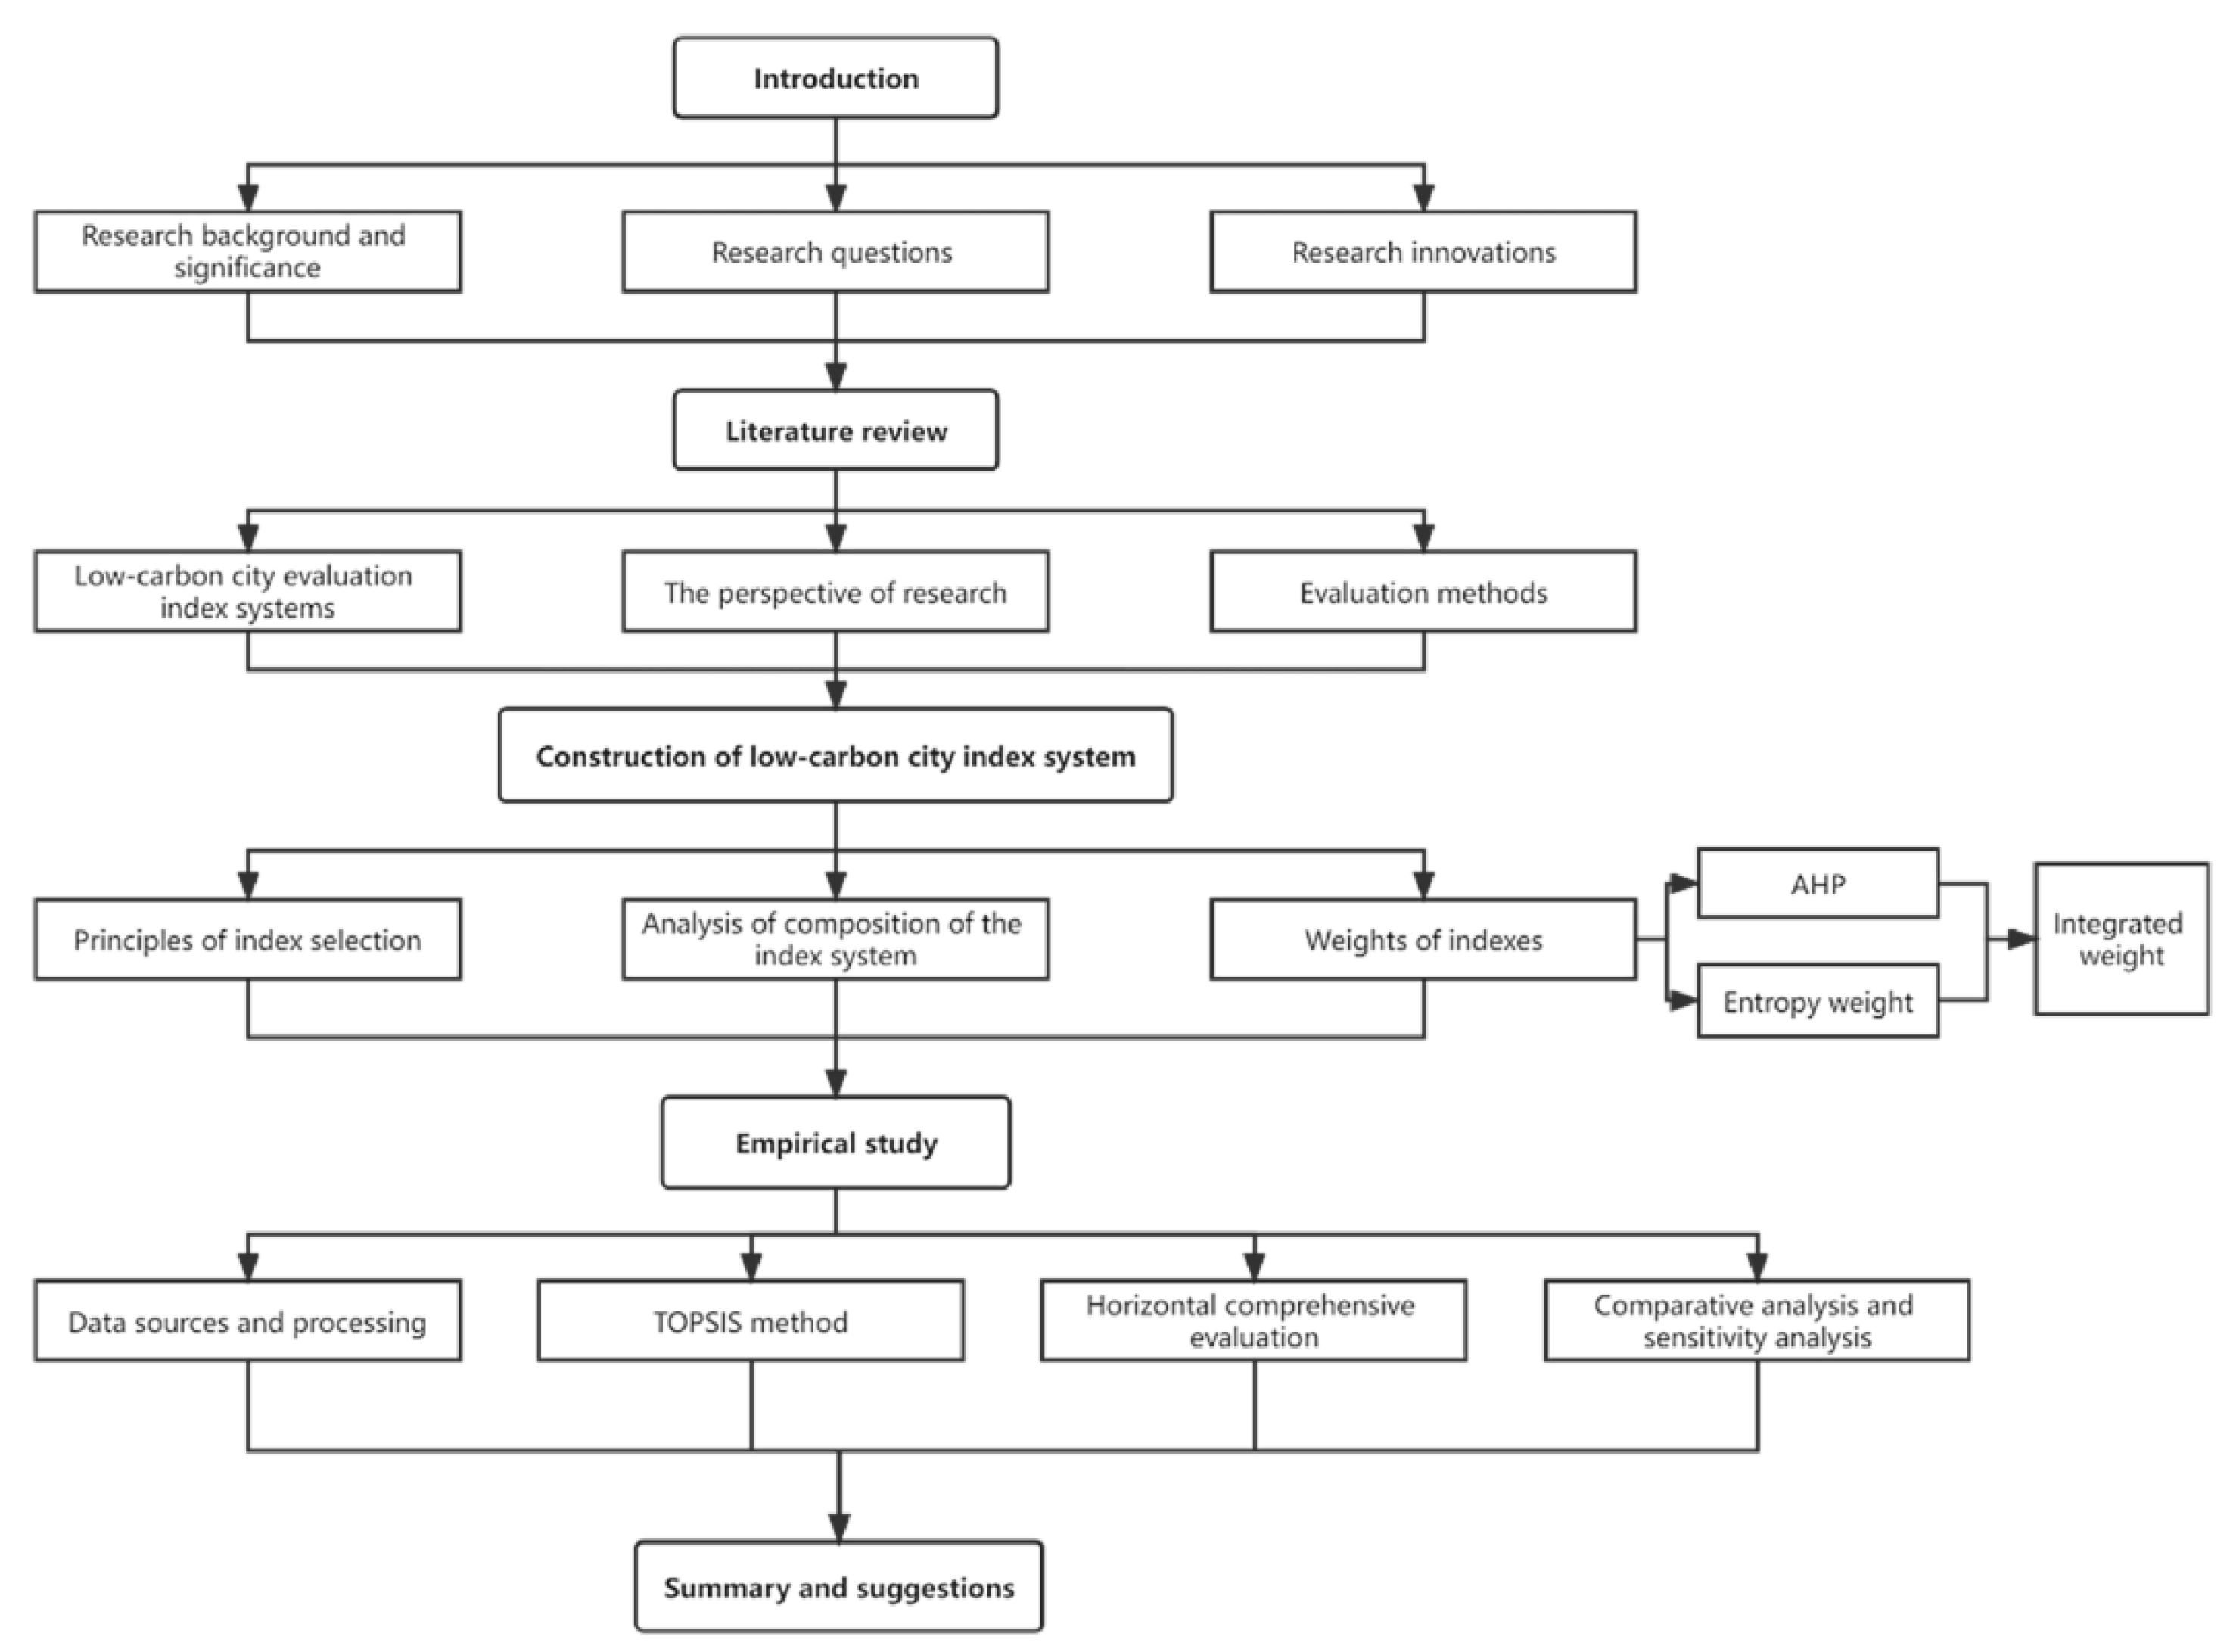
Figure 1. Technical roadmap.
Systems 10 00235 g001
Figure 2. An illustrative diagram for the proposed evaluation method.
Systems 10 00235 g002
Figure 3. The weights of each index under different methods.
Systems 10 00235 g003
Figure 4. Scores of low-carbon city level of Huzhou from 2015 to 2020.
Systems 10 00235 g004
Figure 5. The geographic location of five cities.
Systems 10 00235 g005
Figure 6. Changes in the competitiveness of low-carbon cities from 2015 to 2020.
Systems 10 00235 g006
Figure 7. Scores of low-carbon cities under AHP–TOPSIS method from 2015 to 2020.
Systems 10 00235 g007
Figure 8. Scores of low-carbon cities under the entropy–TOPSIS method from 2015 to 2020.
Systems 10 00235 g008
Figure 9. Scores of low-carbon cities with different values in 2015.
Systems 10 00235 g009
Figure 10. Scores of low-carbon cities with different values in 2016.
Systems 10 00235 g010
Figure 11. Scores of low-carbon cities with different values in 2017.
Systems 10 00235 g011
Figure 12. Scores of low-carbon cities with different values in 2018.
Systems 10 00235 g012
Figure 13. Scores of low-carbon cities with different values in 2019.
Systems 10 00235 g013
Figure 14. Scores of low-carbon cities with different values in 2020.
Systems 10 00235 g014
Table 1. Existing indexes for the low-carbon city evaluation system.
Research PerspectivesEvaluation Criteria123456789101112131415
The city as an integrated systemEconomy
Society
Environment
Technology
Energy
City Layout
Production
Life
Carbon source–carbon sinkProduction
Life
Forests
Greenbelt
Energy
Environment
Technology
1. Guo et al. [1]; 2. Yang et al. [2]; 3. Qu et al. [3]; 4. Wang et al. [4]; 5. Wang et al. [5]; 6. Ouyang et al. [6]; 7. Paloheimo et al. [7]; 8. Liu et al. [8]; 9. Zhang and Gao [10]; 10. Shi et al. [9]; 11. Xu and Xu [14]; 12. Ma et al. [15];13. Peng and Deng [19]; 14. Pan and Wang [21]; 15. Peng et al. [16], Yang et al. [22].
Table 2. Low-carbon city competitiveness evaluation methodology.
Nature of the MethodSpecific MethodsSubject of EvaluationQuotations
A single method of evaluationEntropy weight methodMeasuring and evaluating 36 low-carbon pilot cities identified in China; establishing a standardized evaluation system using Xiamen as an example; constructing a low-carbon evaluation index system for Guiyang[8]
Mutation level methodCompetitiveness of low-carbon cities in 31 Chinese provinces (cities)[5]
Analytic hierarchy process (AHP)Constructing a low-carbon evaluation index system in Jinan; analyzing China’s low-carbon competitiveness and compare it with Western countries [15,19]
Principal component analysisWuhan city circle ULCC evaluation and classification[1]
Fuzzy comprehensive evaluation methodEvaluating low-carbon city policies in different regions[21]
Delphi methodEvaluation of low-carbon city (town) status[6]
Integrated evaluation methodsEntropy weight TOPSIS methodEvaluation of low-carbon development in Chinese cities; evaluation of the quality of low-carbon development in Chinese cities[3]
Entropy gray correlation TOPSIS methodEvaluation of low-carbon development in Shandong province and comparison with ten other eastern coastal provinces[10]
Game theory TOPSIS methodEvaluating spatial and temporal differences in low-carbon city competitiveness in Guiyang[16]
Fuzzy TOPSISEvaluation of smart cities[23]
TOPSIS–BP neural network and grey relational analysisEvaluation of the urban low-carbon sustainable development capability based on the TOPSIS–BP neural network and grey relational analysis[24]
Table 3. Low-carbon city evaluation system.
First-Level IndexSecond-Level IndexType of Index
Low-carbon economic foundation
(B1)
GDP per capita (CNY/person) C11Benefit
Proportion of primary industry (%) C12Cost
Proportion of secondary industry (%) C13Cost
Proportion of tertiary industry (%) C14Benefit
Engel’s coefficient for urban residents (%) C15Cost
Low-carbon lifestyle
(B2)
Electricity consumption per capita (kWh) C21Cost
Domestic water consumption per capita (m3) C22Cost
Number of private cars ownership per capita
(Vehicles per hundred households) C23
Cost
Electricity consumption of the whole society
(billion kWh) C24
Cost
Low-carbon environment construction
(B3)
Air quality C31Benefit
Forest cover (%) C32Benefit
Urban greenery coverage (%) C33Benefit
Green space per capita (m2) C34Benefit
Total amount of emission for industrial waste gases (billion m3) C35Cost
Comprehensive energy consumption (ten thousand tons of standard coal) C36Cost
Low-carbon technology development
(B4)
R&D fund investment (CNY billion) C41Benefit
Harmless treatment rate of urban domestic waste (%) C42Benefit
Investment in industrial pollution control sources (CNY million) C43Benefit
Energy consumption per unit of GDP
(tons of standard coal/CNY million) C44
Cost
Comprehensive solid waste utilization rate (%) C45Benefit
Table 4. Index weights.
IndexAHP WeightEntropy WeightIntegrated Weight
GDP per capita C110.43570.0190.0371
Proportion of primary industry C120.04690.0550.0116
Proportion of secondary industry C130.21560.0580.0560
Proportion of tertiary industry C140.22810.0490.0501
Engel’s coefficient for urban residents C150.07370.0220.0073
Electricity consumption per capita C210.10550.0670.0317
Domestic water consumption per capita C220.06630.0520.0154
Number of private cars ownership per capita C230.21730.0670.0652
Electricity consumption of the whole society C240.61090.0910.2490
Air quality C310.38060.0610.1040
Forest cover C320.25160.0320.0361
Urban greenery coverage C330.16020.0350.0251
Green space per capita C340.10090.0170.0077
Total amount of emission for industrial waste gases C350.06430.0620.0179
Comprehensive energy consumption C360.04250.0610.0116
R&D fund investment C410.42170.090.1700
Harmless treatment rate of urban domestic waste C420.18600.0060.0050
Investment in industrial pollution control sources C430.23170.0560.0581
Energy consumption per unit of GDP C440.09850.0850.0375
Comprehensive solid waste utilization rate C450.06210.0140.0039
Table 5. Comprehensive evaluation score of Huzhou low-carbon city.
YearLow-Carbon Economic FoundationLow-Carbon LifestyleLow-Carbon Environment ConstructionLow-Carbon Technology DevelopmentComprehensive Score
20150.19040.63320.52800.08220.4250
20160.31890.52700.62900.23760.4532
20170.47780.43320.49830.29230.4377
20180.68810.34430.36520.37990.4421
20190.55840.38080.42530.48110.4707
20200.60470.42250.36181.00000.5313
Table 6. Score of low-carbon city competitiveness of cities from 2015 to 2020.
YearHuzhouSuzhouWuxiHangzhouJiaxingXuancheng
2015(0.339) 5(0.439) 2(0.370) 4(0.416) 3(0.281) 6(0.469) 1
2016(0.367) 5(0.425) 3(0.369) 4(0.459) 1(0.276) 6(0.446) 2
2017(0.384) 4(0.417) 3(0.368) 5(0.446) 2(0.263) 6(0.472) 1
2018(0.377) 4(0.417) 3(0.375) 5(0.485) 1(0.283) 6(0.427) 2
2019(0.385) 4(0.431) 2(0.384) 5(0.500) 1(0.309) 6(0.412) 3
2020(0.387) 4(0.409) 3(0.382) 5(0.549) 1(0.286) 6(0.446) 2
Note: The numbers in brackets in Table 6 represent a city’s composite score, while the numbers next to it represent its ranking.
Table 7. Scores and ranking of low-carbon cities under AHP–TOPSIS method from 2015 to 2020.
YearHuzhouSuzhouWuxiHangzhouJiaxingXuancheng
2015(0.387) 5(0.499) 1(0.401) 4(0.439) 3(0.281) 6(0.480) 2
2016(0.436) 4(0.466) 2(0.407) 5(0.485) 1(0.275) 6(0.444) 3
2017(0.427) 4(0.459) 3(0.404) 5(0.495) 2(0.283) 6(0.505) 1
2018(0.450) 4(0.459) 3(0.419) 5(0.551) 1(0.314) 6(0.466) 2
2019(0.421) 4(0.460) 2(0.408) 5(0.542) 1(0.317) 6(0.454) 3
2020(0.412) 5(0.445) 3(0.421) 4(0.613) 1(0.308) 6(0.458) 2
Table 8. Scores and ranking of low-carbon cities under entropy–TOPSIS method.
YearsHuzhouSuzhouWuxiHangzhouJiaxingXuancheng
2015(0.342) 5(0.441) 2(0.372) 4(0.417) 3(0.284) 6(0.468) 1
2016(0.371) 5(0.427) 3(0.372) 4(0.459) 1(0.280) 6(0.445) 2
2017(0.387) 4(0.419) 3(0.370) 5(0.445) 2(0.268) 6(0.473) 1
2018(0.381) 4(0.419) 3(0.377) 5(0.485) 1(0.287) 6(0.426) 2
2019(0.389) 4(0.432) 2(0.387) 5(0.501) 1(0.312) 6(0.410) 3
2020(0.389) 4(0.410) 3(0.384) 5(0.550) 1(0.290) 6(0.446) 2
Publisher’s Note: MDPI stays neutral with regard to jurisdictional claims in published maps and institutional affiliations.