Article

Spatio-Temporal Coordination Analysis of Urban Welfare and Tourism Development in the Yangtze River Delta Region

School of Tourism and Cuisine, Yangzhou University, Yangzhou 225127, China
*
Author to whom correspondence should be addressed.
Systems 2022, 10(6), 222; https://doi.org/10.3390/systems10060222
Submission received: 3 October 2022 / Revised: 5 November 2022 / Accepted: 14 November 2022 / Published: 17 November 2022

Abstract

:
Realizing the coupled coordination between urban welfare (UW) and tourism development (TD) is an important guarantee to achieve healthy and orderly socioeconomic development and move towards a high-quality life. On the basis of constructing the evaluation system of UW and TD, this study explored the interactive response relationship and spatio-temporal coupled coordination characteristics between UW and TD in the Yangtze River Delta urban agglomeration using the entropy weight TOPSIS method, panel vector autoregression (PVAR) model and coupled coordination degree model. The main findings are as follows: (1) UW and TD in the Yangtze River Delta presented an upward trend from 2001 to 2020, while the development level and growth rate of tourism lagged behind urban welfare, and there was obvious spatial heterogeneity at the provincial level. (2) There was a long-run equilibrium and reciprocal feedback relationship between UW and TD, and the contribution of TD was greater than that of UW to TD. (3) There existed a significantly positive spatial association between UW and TD, and their local spatial association pattern was dominated by High-High and Low-Low clustering. (4) The coupled coordination degree between UW and TD in the Delta region generally showed a spatial pattern decreasing from southeast to northwest, with the regional gap diminishing and the coupled coordination type in most cities gradually evolving from mild and near disordered to bare and primary coordination. This study can form a useful reference for the harmonious improvement of UW and TD in the Yangtze River Delta.

1. Introduction

Along with the rapid expansion of economic scale and continuous promotion of urbanization and industrialization, the negative effects of the urban–rural wealth gap [1], regional income gap [2], spatial imbalance of social security level [3], excessive energy consumption [4] and environmental pollution [5] have gradually come to the fore, seriously threatening the improvement of urban life quality and sustainable development. The report of 19th Party Congress pointed out that the main contradiction in society had been transformed into the contradiction between people’s growing need for a better life and unbalanced and insufficient development. In this context, the tourism industry, due to its close relationship with economic development and natural ecology, is considered as a rapidly emerging pillar and an effective means of improving welfare [6]. However, the tourism industry showed great sensitivity and vulnerability to the extraneous interference and continued spread of COVID-19 [7]. The questions thus are whether tourism can promote the improvement of urban welfare; whether urban welfare can help the resilient growth of the tourism industry; is there an interactive response relationship between the two systems; what are their spatial and temporal correlation characteristics; what is the spatio-temporal evolution pattern of their coupled coordination? These urgent issues need to be addressed.
As an important intersection area between the Yangtze River economic belt and the Belt and Road, the Yangtze River Delta has become one of regions with the most active economic growth, the highest degree of openness, a higher level of residents’ welfare and the most developed tourism industry in China. However, “high pollution, high energy consumption, high emission” industries still occupy a large proportion, and there are serious environmental hazards hidden behind the rapid development of regional socioeconomic infrastructure and the tourism industry in the region [8], which is inconsistent with three aspects of sustainability, i.e., environmental, economic and societal considerations [9]. In the context of the all-round development of the Yangtze River Delta integration and the construction of ecological civilization, accelerating the construction of the cross-regional cooperation mechanism between urban welfare and the tourism industry is an important strategic direction to realize the high-quality development of the Yangtze River Delta region.

2. Literature Review

2.1. Research on Urban Welfare

There has been extensive research on the measurement of the urban welfare level. First, the economic welfare level could be reflected by increasing or decreasing positive or negative effects on welfare on the basis of a weighted calculation of residents’ consumption level [10]. Four adjustment factors based on weighted residential consumption were introduced to construct a sustainable economic welfare framework suitable for China’s national conditions [11]. Second, the social welfare level was measured based on life satisfaction. For example, Lu et al. (2012) comprehensively evaluated China’s provincial social welfare level from three aspects, including material welfare, social security and living environment [12]. Third, the composite index was constructed based on Sen’s viable capacity to characterize the comprehensive welfare level [13], such as the typical Human Development Index (HDI) constructed from life expectancy, adult literacy and GDP per capita and the Happy Planet Index (HPI) based on a weighted measurement of experiential well-being, life expectancy and ecological footprint [14,15].
Urban welfare was generally evaluated in terms of multidimensional indicators. However, extant studies have focused more on the effects of economic growth on a single dimension of urban welfare, such as economic welfare, social welfare and ecological welfare. In terms of economic welfare, the threshold hypothesis first proposed by Max-Neef (1995) provided a theoretical framework for exploring the relationship between economic welfare and economic growth [16]. Some researchers further found an inverted U-shaped relationship between the two systems, namely economic welfare showed a significant positive correlation with economic growth in the initial stage of regional development, while economic welfare would stagnate or decline with further economic growth as income inequality increased, state of net fixed capital deteriorated, and state of net international investment deteriorated [17,18]. Moreover, there was a synchronous growth trend between the two systems. For example, Bleys (2008) found that economic welfare and economic growth in Belgium were both effectively improved over the study period [19]. However, Yuan et al. (2021) compared the growth rate of sustainable economic welfare and economic development across Chinese provinces and confirmed the absence of the threshold effect [20].
In terms of social welfare, some researchers focused on the relationship between social welfare and economic growth. For example, Zhuang et al. (2017) built an evaluation indicators system of society welfare and economy growth and analyzed their coupling coordination trend in the Yangtze River Delta region [21]. He et al. (2018) explored the dynamic relationship between population structure, economic growth and social welfare based on endogenous theory and the Ramsey model [22]. Others were more concerned with the relationship between a particular aspect of social welfare and economic growth. For instance, Zhang et al. (2019) explored the impact of social security on economic growth based on a human capital perspective [23]. Vinodh et al. (2022) explored the relationship between public finance spending and economic growth using stationary tests, causality tests and regression analysis [24]. All of these studies indicated that social welfare had a significant effect on economic growth.
With resource and environmental issues becoming a serious threat to sustainable urban development, some studies began to focus on the relationship between ecological welfare and economic growth. For example, Pan et al. (2020) constructed an index system for the evaluation of ecological welfare and economic development, and used a VAR model to empirically analyze the dynamic relationship between them [25]. Xu et al. (2022) used a panel quantile regression model to analyze the factors influencing green development welfare in the Yangtze River Delta region and found that economic development was the main driver of urban green development welfare [26].

2.2. Research on the Relationship between Regional Tourism and Socioeconomic Development and Ecological Environment

The relationship between tourism development and economic growth has long been a hotspot for research on the tourism economy and tourism geography [27], and four different research concepts have been presented: tourism-led economic growth, economy-driven tourism growth, reciprocal relationship and neutral relationship. For example, Faber and Gaubert (2019) confirmed that tourism caused large and significant local economic gains relative to less touristic regions [28]. Sokhanvar and Çiftçioğlu (2018) demonstrated a uni-directional causality from economy growth in developing countries such as China, India and Indonesia [29]. Based on the Dumitrescu and Hurlin technique, Dogru and Bulut (2018) analyzed the causal link between tourism development and economic growth in seven European countries. The findings of the study indicated the existence of bi-directional causality between them [30]. However, by using the Emirmahmutoglu-Kose bootstrap non-causality test, Isik et al. (2017) found that there was no causality between tourist arrivals and economic growth in France, Italy, Mexico, the UK and the USA [31]. All of these studies indicated an interactive relationship between the two systems.
While driving regional economic growth, tourism development has also generated serious ecological environmental problems, which has drawn the attention of scholars. Related studies mainly involved the impact of tourism activities on the ecological environment [32], the effect of climate warming on tourism development [33], and the coupling mechanism between tourism development and ecological environment [34]. Some researchers have focused on the spatio-temporal distribution characteristics of their coupling coordination. For example, Hu et al. (2018) built an evaluation index system of tourism and environment and analyzed their coupling coordination in Changsha City [35]. Based on the theory of PSR, Liu and Hu (2020) empirically investigated the coupling coordination between tourism development and ecological environment in Guizhou Province [36]. Wang et al. (2022) analyzed the spatio-temporal coupling coordination characteristics of tourism development and ecological environment [34]. Overall, the two-way interaction provides a reasonable reference for the study.
With the introduction of the concept of tourism urbanization, scholars began to explore the causal relationship between tourism and urbanization development. On the one hand, tourism can stimulate economic growth, promote infrastructure development, enhance social civilization and improve the living environment, which is conductive to the overall construction of urbanization. On the other hand, rapid urbanization is beneficial to improving infrastructure and increasing the income of residents and their spending power, which provides huge opportunities for tourism development. Tang et al. (2017) noted tourism development played an important role in promoting urban expansion in the east and south of Lhasa [37]. Zhao and Dong (2017) found tourism agglomeration had a positive impact on the improvement of urbanization levels [38]. Wang et al. (2016) confirmed that the scale and quality of urbanization had a significant contribution to tourism economic development [39]. Yang (2018) systematically explained the synergistic development mechanism of the tourism industry and new urbanization [40]. Xie (2020) empirically investigated a positive interaction and harmonious symbiosis between urbanization and the marine tourism industry [41].
To summarize, tourism has been in a dynamic interaction with economy, society and the ecological environment. While it creates enormous socioeconomic opportunities, tourism also results in problems such as price increases, traffic congestion and damage to the ecological environment, which constrain the long-term development of regional tourism. Hence, it is necessary to explore mechanisms to achieve the coupled coordination of the tourism industry with regional economy, urbanization and ecological environment, as well as the organic unity of the three systems. Related studies have explored the coupled coordination mechanisms of the three systems and quantitatively analyzed their spatio-temporal evolution characteristics at provincial and municipal scales [42,43,44]. From the perspective of the mechanism of the regional economy, ecological environment and tourism industry, firstly, the regional economy provides financial guarantees and technical support for the ecological environment on the one hand, and infrastructure and service facilities for the tourism industry on the other hand. Secondly, the tourism industry is not only an effective means to promote economic development but also to protect the ecological environment by developing eco-tourism. Finally, the ecological environment is not only the material basis of economic activities but is also an important guarantee for the sustainable development of the tourism industry. For example, Zhou et al. (2016) empirically analyzed the coupled coordination characteristics of the three systems in the Yangtze River Economic Delta [8]. From the perspective of the mechanism of urbanization, the ecological environment and the tourism industry, firstly, tourism can promote urbanization by driving related industries and providing employment opportunities; however, excessive tourism may have a negative impact on the ecological environment. Secondly, continuous promotion of urbanization will inevitably involve the improvement of infrastructure and service facilities, stimulating tourism demand, which may exceed tourism carrying capacity. For example, Weng et al. (2022) explored the coupled coordination relationship of the three systems in the Beijing-Tianjin-Hebei urban agglomeration [45].

2.3. Research on the Relationship between Urban Welfare and Tourism Development

Relevant studies on the relationship between urban welfare and tourism development are mainly focused on the following four aspects. The first is the impact of tourism activities on the perceived welfare of the residents in tourist communities. Liu et al. (2019) found that farmers of the Dong nationality in Guizhou had a general welfare perception of local tourism development and perceived psychological conditions significantly higher than material [46]. The second is the impact of the tourism industry on urban welfare. Some scholars have proposed that tourism development has a positive effect on the wellbeing of urban residents, including tourism scale, tourism agglomeration and the level of economic development [47,48,49]. However, Kyungmi et al. (2013) noted the relationship between the economic impact of tourism and material wellbeing was strongest in the maturity stage, but decreased in the decline state [50]. The third is the impact of welfare on tourism development. Hjalagar (2005) proposed that welfare had a complex indirect impact on the innovation of tourism products and services, and the concept of welfare affected the scale and scope of tourism in many ways [51]. The fourth is the interactive relationship between tourism and welfare. Khan et al. (2020) innovatively explored the existence of a bi-directional interactive causal relationship between tourism and overall wellbeing by using an econometric model in Pakistan [52].
Related research has extensively analyzed the relationship between the two systems and other external factors, providing a solid theoretical basis and empirical evidence for further research. However, there remain some areas for improvement. Firstly, previous research found the unidirectional effect between urban welfare and tourism development, but a few studies focused on the bi-directional interaction between the two systems. Hence, the theoretical interaction mechanism and the empirical data between the two systems needs to be explored. Secondly, previous studies usually selected a single or a few composite indicators to evaluate the development level of welfare and tourism, ignoring the multidimensional characteristics of the two systems. Thirdly, unlike previous single-time and large-scale studies, the heterogeneously spatio-temporal evolution characteristics between the two systems have not been analyzed, and the coupled response trend of the two systems has rarely been explored at the city level. Therefore, 41 cities in the Yangtze River Delta urban agglomeration were selected as the study units; then, the spatio-temporal interactions, association characteristics, and the coupled coordination degree between urban welfare and tourism development were systematically analyzed. Based on the analysis, relevant policy recommendations were highlighted to promote the high-quality development of urban welfare and the tourism industry.

2.4. Coupled Coordinated Mechanism between Urban Welfare and Tourism Development

There exists reciprocal and mutually reinforcing feedback between urban welfare and tourism development (Figure 1). On the one hand, as an important carrier of people’s aspirations for a better life, urban welfare both guides the healthy development of tourism and provides material carriers for tourism development. On the other hand, because tourism has the characteristics of low resource consumption, large driving coefficient, more employment opportunities and good comprehensive benefits, the development of tourism plays an important role in improving people’s welfare and promoting urban welfare construction.

2.5. Mechanism of the Effect of the Tourism Industry on Urban Welfare

Tourism, as an important part of the national economy and modern service industry, plays an important role in promoting economic growth, promoting social development and protecting the ecological environment, and it is an important means to meet people’s needs for a better life and enhance urban welfare [6,8,45]. Firstly, tourism provides a sustained impetus for improving economic welfare [53]. This is due to the fact that tourism development is usually accompanied by the agglomeration of tourism elements, which promotes the accelerated integration of domestic and foreign passengers, logistics, information and capital flows, forms economies of scale, and generates a transmission effect on the optimization and upgrading of regional industrial structures. Moreover, the tourism industry is a highly interrelated industry, not only effectively stimulating domestic demand and promoting the transformation and upgrading of industrial structures, but also driving other industries toward linkage development [54]. In addition, the development of inbound tourism can not only attract international tourists and international capital investment, but also strengthen inter-regional economic cooperation and exchange, improve the comprehensive strength of the urban economy, and thus increase national income and improve people’s material living standards. Secondly, tourism development is an effective means of improving social welfare. Tourism activities can refresh mind and body [55], improve awareness of natural and cultural heritage [56], and help in personality development and self-identity [57], which enhances people’s sense of happiness. Moreover, the tourism industry can promote the construction of tourism infrastructure, drive the improvement of urban-related supporting facilities, and provide employment opportunities for residents, which provides convenience to tourists and residents. Thirdly, tourism is a facilitator of environmental welfare. A good environment is an important guarantee for the smooth development of tourism activities, and vigorous development of tourism provides financial and technical support for the protection and restoration of the ecological environment [34]. As a resource-saving and environmentally friendly industry, tourism is conducive to enhance residents’ awareness of ecological protection, promote relevant departments and enterprises to strengthen investment in environmental management [58], and create an ecological environment that is pleasant to visit and live in.

2.6. Mechanism of the Effect of Urban Welfare on the Tourism Industry

Urban welfare is the product of a certain period of socio-economic development. Along with the improvement of economic, social and environmental welfare, urban welfare can serve as an important carrier for tourism development. Firstly, economic welfare provides financial support and material security for tourism development. This is because rapid economic growth helps to accelerate the development of regional experience and leisure economies, creating a favorable development environment for the tourism industry. Moreover, adequate capital accumulation helps to develop tourism resources in depth, improve the quality of tourism products, and promote the construction and improvement of tourism industry systems. In addition, the increase of per capita disposable income will stimulate residents’ tourism consumption, broaden their destinations, and provide sufficient and stable source markets for the tourism industry, thus promoting the development of the tourism industry [59]. Secondly, social welfare creates a favorable social and cultural environment for tourism. Cities with better social welfare tend to have high-quality educational, medical and infrastructural resources as well as high cultural literacy of the city’s residents [58], which helps to shape an image of a civilized, harmonious and developed city, thus attracting visitors and consolidating the tourism market. Finally, environmental welfare is the source of vitality and sustainable support for tourism development. The ecological environment itself is an important resource to support tourism development, and cities with better-quality ecological environments are more attractive to tourists. Moreover, with the continuous promotion of ecological civilization and the enhancement of residents’ environmental awareness, tourism will further evolve in the direction of ecology and greening.

3. Methods and Data Sources

3.1. PVAR Model

The Panel Vector Auto Regression Model (PVAR) was proposed by Sims. It combines the advantages of both times series and panel data and is widely used in the analysis of dynamic and causal relationships between variables [60,61]. The PVAR model constructed in this study includes the unit root test, co-integration test, Granger causality test and impulse response analysis; these are used to reveal the interaction between urban welfare and tourism development. The interaction can be expressed as follows:
Y i t = α 0 t + i = 1 m α 1 i Y i t 1 + f i + d c t + u i t
where i and t denote sample unit and year, respectively, Y i t is the endogenous column vector of urban welfare (UW) and tourism development (TD), m denotes the lag order, f i is the cross-sectional individual fixed effects vector, α 0 t is the intercept term, α 1 t represents the coefficients, d c t represents time fixed-effect variables, and u i t represents perturbation terms.

3.2. Coupled Coordination Degree Model

The concept of coupling has its origins in physics, and the degree of coupling is a typical indicator of the degree of interaction and interrelationship between two systems [62,63]; this concept is widely used in empirical studies of the level of coupled development between many systems, including environment, economy, social development and urbanization [64]. The coupled model between urban welfare and tourism development systems can be expressed as follows:
C = CW × TI/[(CW + TI)/2]2
where C is the coupled degree of urban welfare and tourism development; the higher the C value, the better the coupling. Since the coupled degree can only reflect the interaction intensity, it cannot reveal the benefit of coordinated development and the functional state of systems. Therefore, the coupled coordination degree is further applied to measure the coordinated development. The specific formula is expressed as follows:
D = C × T ,   T = α C W + β T I
where D is coupled coordination degree of urban welfare and tourism development, T is a comprehensive evaluation index of urban welfare and tourism development, α and β are the weighted coefficients for urban welfare and tourism development, which are set to be 0.5 since the two systems are equally important. According to the uniform distribution function method, the coupled coordination degree can be divided into ten types (Table 1) [65].

3.3. The Evaluation Index System of Urban Welfare and Tourism Development

Based on theories of welfare economy and tourism economy and abundant studies [12,14,15,58,59,66], and according to the principles of science, authenticity, comparability and data accessibility, the evaluation system was constructed at three levels: the target level, guideline level and index level (Table 2). In terms of urban welfare, 42 indicators from three dimensions of economic welfare, social welfare and environmental welfare were collected to characterize the development level of urban welfare. In terms of tourism development, 12 indicators from three dimensions of tourism industry scale, tourism market scale, and tourism industry economy were used to synthesize the level of tourism development.

3.4. Data Source

This study took 41 cities in the Yangtze River Delta region as study units and selected the study period from 2001 to 2020 based on the stage of economic development and data availability. The corresponding data sources of the evaluation index system were from the statistical yearbooks of each city: Jiangsu Statistical Yearbook, Zhejiang Statistical Yearbook, Anhui Statistical Yearbook, China Environmental Statistical Yearbook, Statistical Bulletin on National Economic and Social Development from 2001 to 2020, and Statistical Bulletin of Urban Health from 2001 to 2020. Moreover, economic data such as GDP, consumption, and income were transformed on a 2001 basis in order to eliminate the effects of inflation. In addition, interpolation was used to estimate and obtain missing values for a few indicators.

4. Results

4.1. Temporal Evolutionary Characteristics of Urban Welfare and Tourism Development

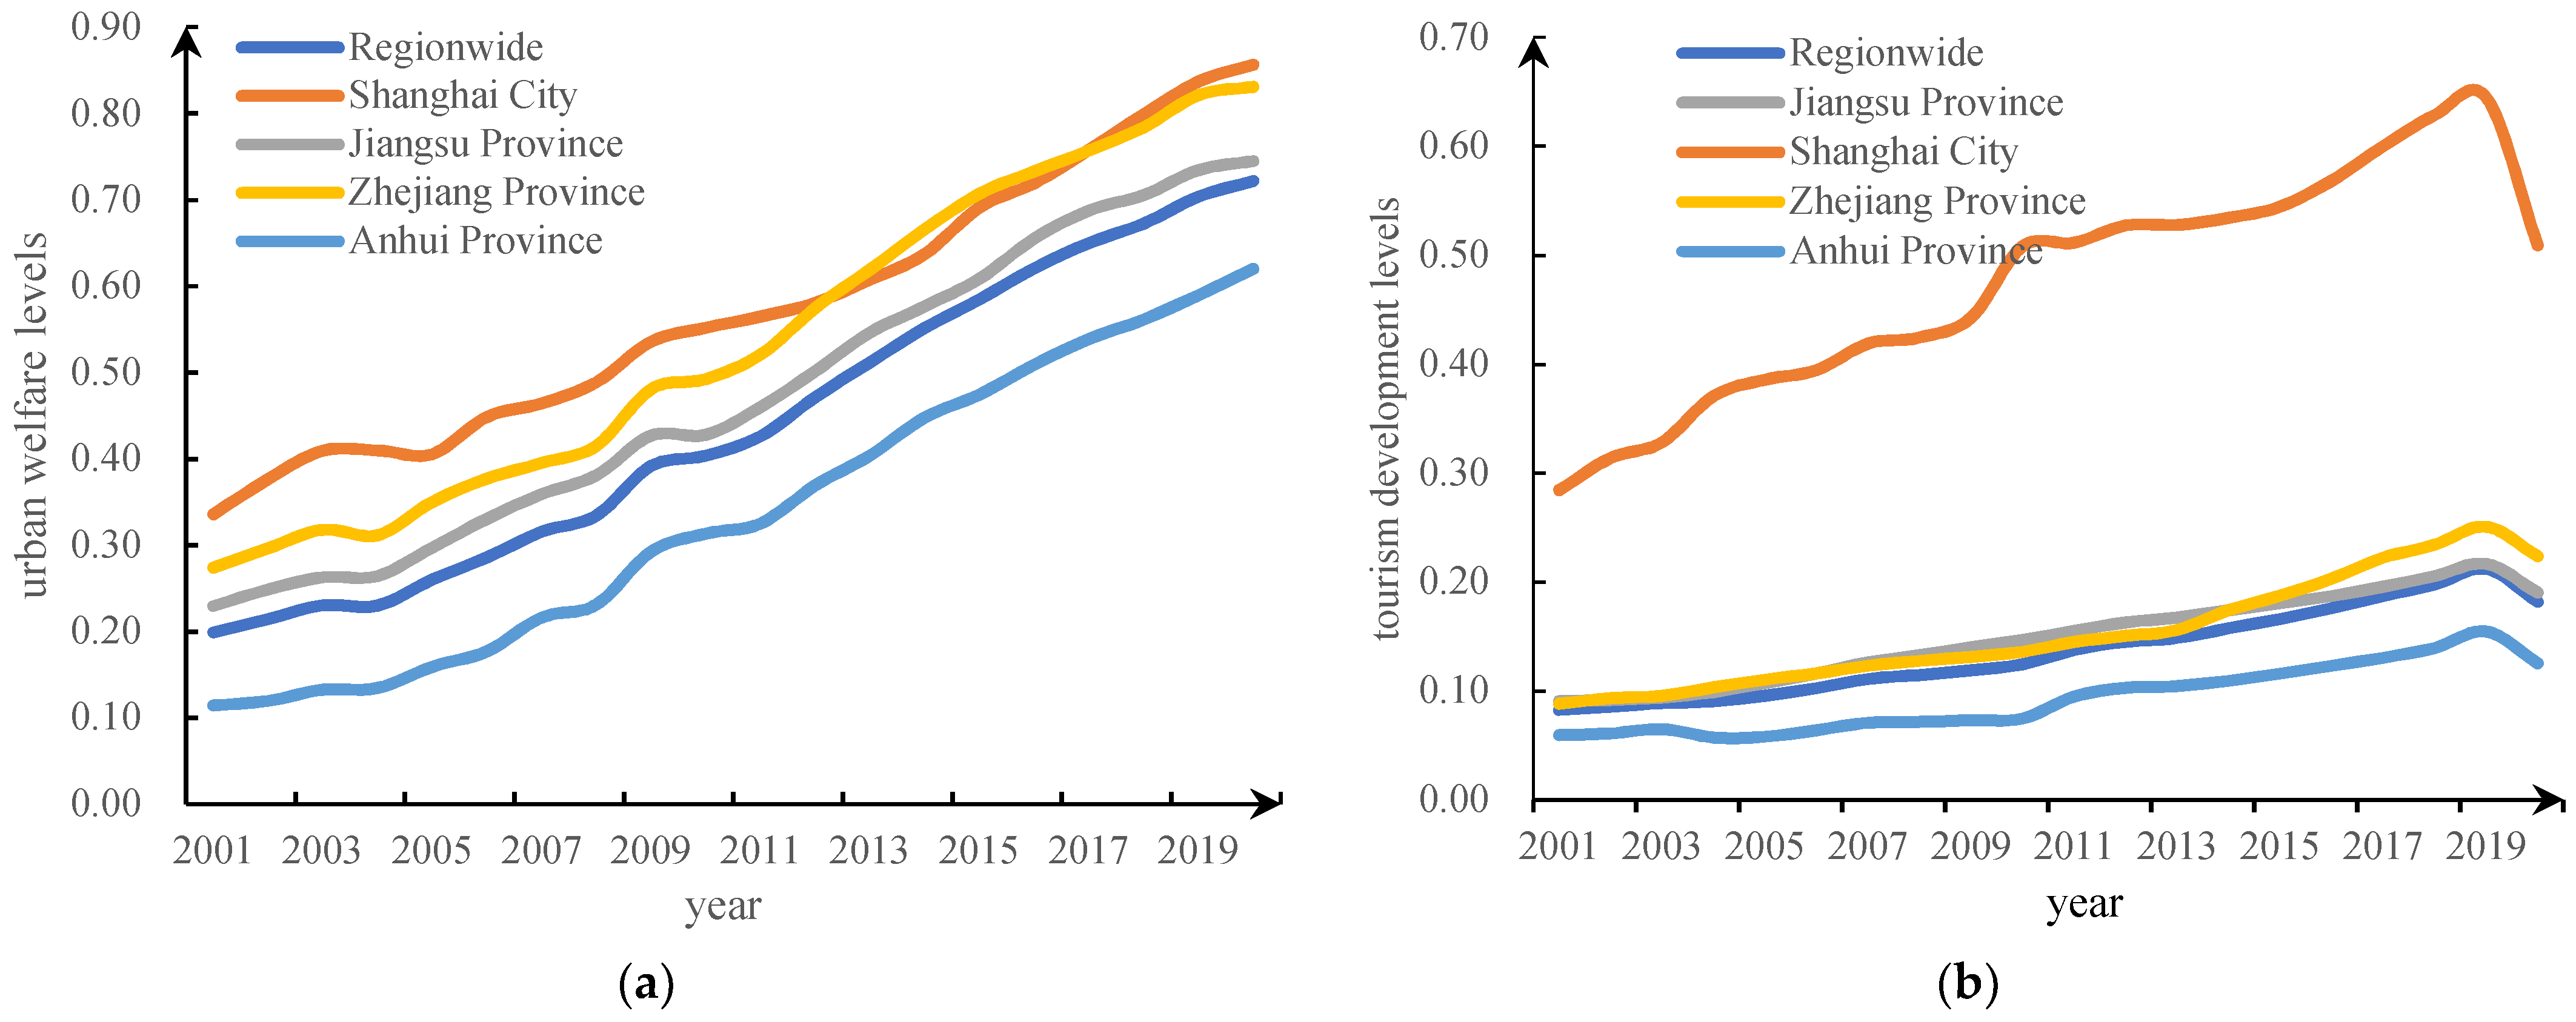
The level of urban welfare and tourism development for each city from 2001 to 2020 was measured, and the annual averages at the provincial level were plotted (Figure 2). As shown in Figure 2a, the development level of urban welfare in the Yangtze River Delta region maintained a steady upward trend at an average annual rate of 13.85% from 2001 to 2020, with only a small decline in 2004. From the provincial perspective, urban welfare in Jiangsu, Zhejiang, Anhui and Shanghai generally maintained a relatively stable upward trend, with the growth rate showing Anhui > the Delta region > Jiangsu > Zhejiang > Shanghai. Shanghai had a high level of urban welfare ahead of other provinces due to a strong economic base and a well-developed social security system from 2001 to 2012; it was surpassed by Zhejiang Province from 2013 to 2016, mainly because its long-term economic development mode, relying on machinery manufacturing and heavy chemical industry, caused considerable pollution to the urban environment and seriously affected the physical and mental health of residents. Urban diseases such as traffic congestion and housing tension caused by overpopulation greatly reduced the quality life of residents. With the introduction of ecological and environmental protection policies and the transformation and upgrading of the industrial structure, environmental pollution was alleviated, boosting Shanghai’s urban welfare ahead of other provinces from 2017 to 2020. Zhejiang Province had the second highest level of urban welfare. This was due to the fact that, on the one hand, Zhejiang Province had a good natural ecological background and formed an industrial structure dominated by the service industry and light industry, with less environmental pollution. On the other hand, Zhejiang Province was actively committed to the construction of livelihood services and protection, such as accelerating the construction of the e-commerce service network, elderly service system and Internet + government services, which drove the rapid growth of social welfare. Under the superimposed effects of superior environmental and social welfare, Zhejiang’s urban welfare surpassed that of Shanghai from 2013 to 2016. The development level of urban welfare in Jiangsu Province was slightly better than the average level of the Delta region, which was primarily due to its industrial structure being dominated by the heavy chemical industry, which pursued economic benefits at the expense of synergistic development with the ecological environment, resulting in a lag in ecological welfare construction. Anhui Province had the lowest welfare level, which was the result of a combination of factors such as the relatively remote location from Shanghai, poor transportation conditions, a single economic development mode, a large exodus of people due to the siphon effect, the lagging economic development in some cities, and the lack of necessary social security.
As shown in Figure 2b, the tourism development level in the Delta generally showed a slow climb, with an average annual growth rate of 6.32% from 2001 to 2019 and a decline in 2020 due to the outbreak of COVID-19. From the provincial perspective, the tourism development level showed an upward trend, and the growth rate of tourism development showed Zhejiang > the Delta region > Anhui > Jiangsu > Shanghai, of which Shanghai had greater fluctuation. As Shanghai is a famous tourist city with a strong economic base, rich tourism resources and a broad tourism market, the tourism industry had the highest level of development. Zhejiang Province and Jiangsu Province had comparable levels of tourism development from 2001 to 2014, but the gap gradually widened after 2015. In the context of supply-side structural reform and all-for-one tourism, Zhejiang Province fully recognized the driving effect of the tourism industry on regional economic development, industrial restructuring, urban and rural integrated development and improvement of people’s living standards, and proactively advanced the construction of beautiful Zhejiang and the creation of a better life by relying on the unique landscape and humanistic tourism resources, which effectively promoted the development and construction of rural tourism and ancient town tourism. While Jiangsu Province was rich in human tourism resources and constantly promoted the integration and innovative development of culture and tourism, the natural tourism resources were relatively homogeneous, and the tourism development in northern, central and southern Jiangsu Province differed greatly. The positive effects were offset by the negative effects, making the overall tourism development in Jiangsu Province slow. Since the 13th Five-Year Plan, Anhui had been upgrading the status of the tourism industry, increasing tourism product supply, innovating operational types of tourism and promoting tourism integration development, which promoted the rapid improvement of tourism development. However, constrained by the low level of economic development, inconvenient regional transportation, relatively crude modes of tourism resource development, and large differences in tourism development between cities, the tourism market in Anhui Province was relatively limited, and the development level of tourism was the lowest in the Delta region.
In general, both urban welfare and tourism development in the Delta region showed a rapid growth trend, but the level of urban welfare was higher than that of tourism development. This was due to the close interaction between urban welfare and tourism development; on one hand, tourism development was more dependent on a stable urban socioeconomic environment, strategic transformation of industrial structures and increasing emphasis on the tourism industry, and on the other hand, tourism development contributed to the improvement of urban welfare. In the future, the existing advantages of urban welfare should be fully utilized to feed regional tourism development.

4.2. Dynamic Interaction Effects between Urban Welfare and Tourism Development

Before testing whether there was a long-run equilibrium and causal relationship between urban welfare and the tourism industry, it was necessary to test the trend of urban welfare and tourism development in order to avoid pseudo-regression using unit root tests, including LLC, IPS, ADF-Fisher and HT methods (Table 3). As shown in Table 3, urban welfare failed the ADF-Fisher test at a 10% significance level, and the tourism industry failed all tests except for the HT test. Therefore, it was necessary to implement first-order differential for urban welfare and tourism development. The results showed that urban welfare and tourism development were significant at the 1% level, indicating the two systems were first-order monotonic. According to the principle of minimum AIC, BIC and HQIC, the optimal lag order was determined to be one, indicating that the impact of urban welfare and tourism industry on each other had a first-order lag. Second, the Johansen co-integration test was used to analyze the co-integration relationship between the two systems (Table 4). As shown in Table 4, the statistical tests all rejected the original hypothesis, implying that there was a unique co-integration relationship and a stable equilibrium relationship between the two systems in the long run. Third, the panel data error correction model was used to further test for causality between the two systems (Table 5). As shown in Table 5, the probability of urban welfare not being the Granger cause of tourism development and the probability of tourism development not being the Granger cause of urban welfare were both below 0.1, indicating that urban welfare and tourism development were Granger causalities of each other, and there was a positive mutual feedback and promotion effect between the two systems in the Yangtze River Delta region.
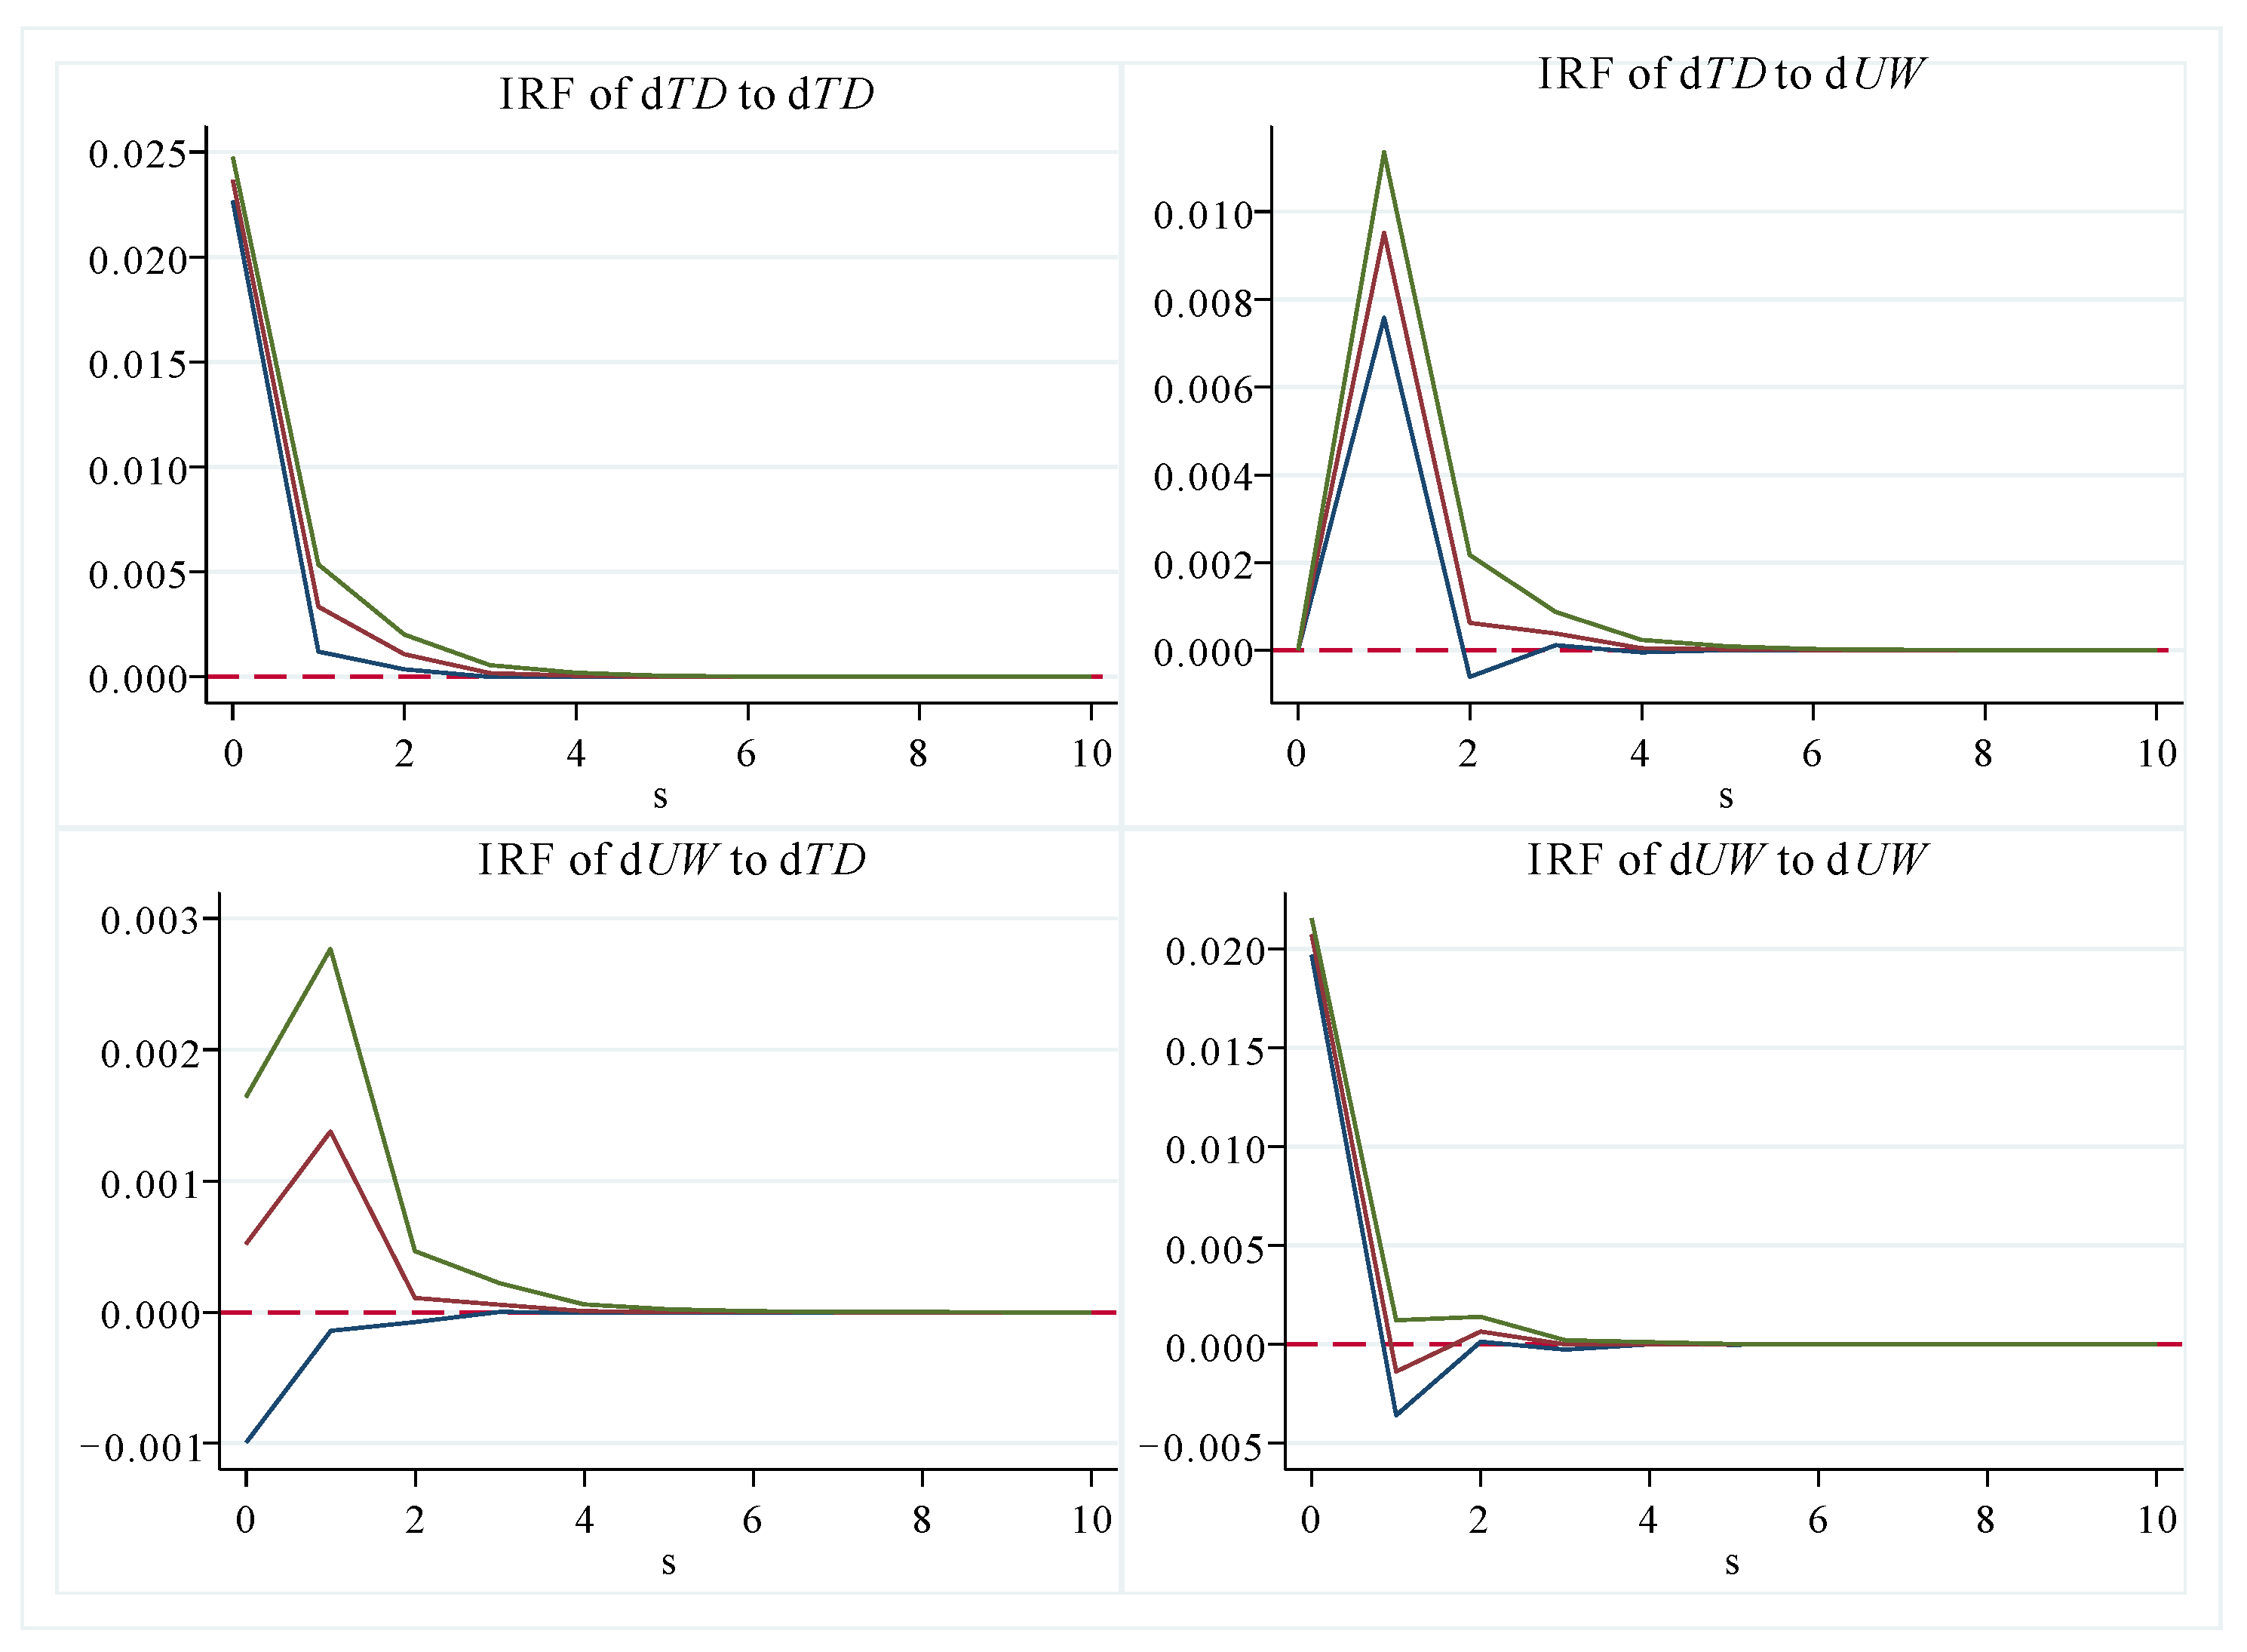
After 500 Monte Carlo simulations, the varying shock effects and volatility characteristics of the two systems on the current and future values were plotted as impulse response functions (Figure 3). As shown in Figure 3, the impact of tourism development on self-shock was significantly positive, with the impact intensity gradually decreasing and converging to zero in the long run. The impact effect of tourism development on urban welfare tended to rise first and then fall, with a positive response in each period. The impulse response peaked at approximately 0.009 in period 1 and then began to decline, with the most pronounced decrease from period 1 to period 2, and the effect diminishing to zero in the 2–4 period. In summary, the stability of tourism development mainly relied on both itself and urban welfare in the first and middle stages, and on its own internal structure in the later stages. Moreover, the impact of urban welfare on tourism development was not significant in the later stages. This was because while rapid industrialization and urbanization had contributed to improving socioeconomic welfare, environmental welfare had not improved simultaneously, which to a certain extent inhibited the driving effect and trickle-down effect of urban welfare on tourism development. Therefore, while pursing economic benefits, cities should strengthen the comprehensive management and effective protection of the ecological environment, so as to form a long-term mechanism of urban welfare feeding back into tourism development.
The impact of urban welfare on the tourism industry showed a general trend of upward and then downward, with each period showing a positive response. Specifically, the strongest impulse response was about 0.015 in the first period, and then the positive shock effect gradually weakened and eventually converged to zero, with an overall inverted “V” shape that rose and then fell. The impact of urban welfare on itself fluctuated around zero in the 1–2 period and then tended to zero in the long run, indicating that the improvement of urban welfare was mainly influenced by its own prior development. In summary, urban welfare had steadily improved under the effects of its own structure and tourism development, which had a lesser effect on urban welfare. This was due to the large inequality in tourism development between cities, especially in Anhui Province, which was constrained by economic development and regional transportation, with a single industry and limited source markets, resulting in a backward tourism development level compared to other cities. Therefore, cities in the Delta region should take the initiative to make up for the shortcomings through industrial structure adjustment, integration of industrial innovation elements, introduction of tourism professionals and other ways, establishing tourism cooperation mechanisms in the future to promote the development of tourism in the entire Delta region and bringing into play the overall effect of tourism-led urban welfare enhancement.

4.3. Spatial Association Pattern between Urban Welfare and Tourism Development

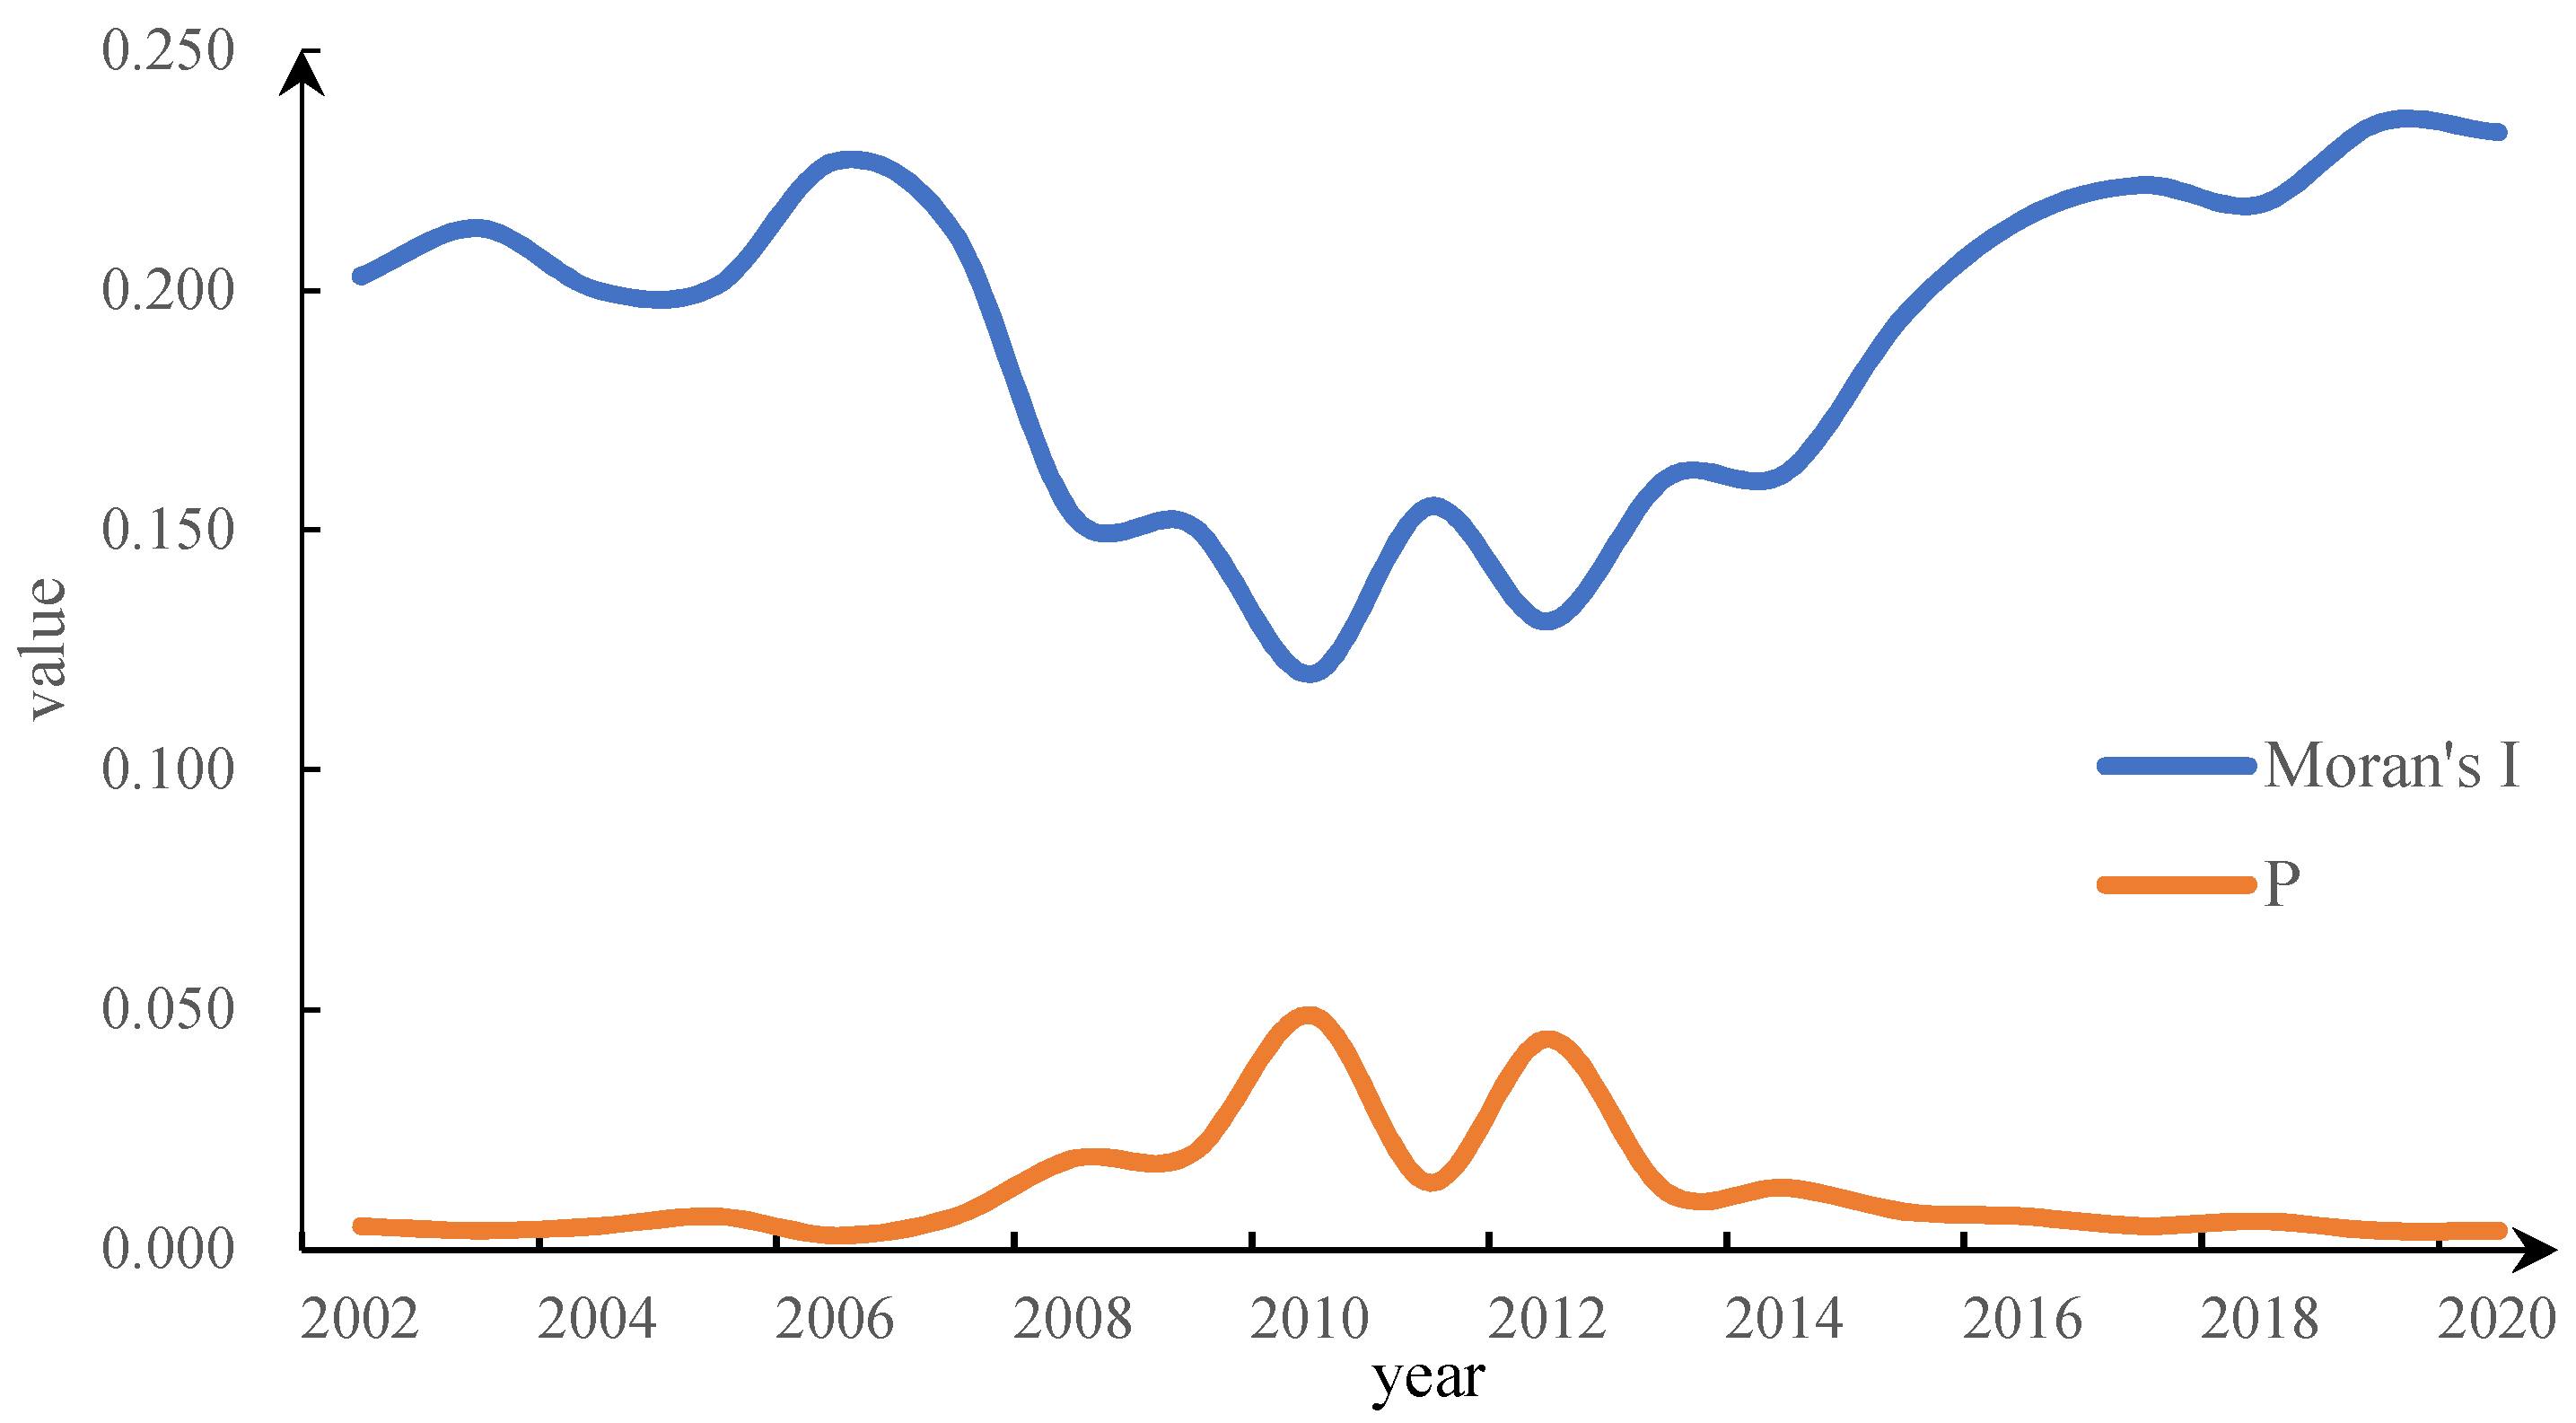
The spatial association between urban welfare and tourism development was analyzed using a bivariate spatial analysis method, and the value of Moran’s I and p was plotted (Figure 4). As shown in Figure 4, the bivariate global Moran’s I values between urban welfare and tourism development in the Yangtze River Delta region was positive and significant at the 0.05 level during the study period, indicating a significant positive spatial correlation between the two systems from 2001 to 2020. Specifically, the global Moran’s I first fluctuated down from 0.203 in 2002 to 0.120 in 2010, and then fluctuated up to 0.233 in 2020, with an overall zigzag evolution pattern, which implied there was a growing cluster of cities in the region where urban welfare was positively correlated with tourism development, and this trend of clustering was increasing.
To further reveal the evolutionary characteristics of the local association between regional urban welfare and tourism development, the local bivariate LISA clustering between urban welfare and tourism development in 2002, 2010 and 2020 was visualized (Figure 5). As shown in Figure 5, the positive association cities dominated the Yangtze River Delta region during study period, except for non-significant cities, with 8, 8 and 10 High-High and Low-Low agglomeration cities in 2002, 2010 and 2020, respectively. The High-High agglomeration type was mainly clustered in the eastern costal region, including Nantong, Jiaxing, Huzhou and Zhoushan, which had high levels of welfare and tourism development themselves and were influenced by the urban and tourism development of Shanghai. The Low-Low agglomeration type was mainly distributed in the northern area of Anhui, showing more stable local spatial variation and spatial path-locked characteristics, and these cities had a low level of urban welfare and tourism development. The number of cities with the High-Low agglomeration type was small, with 3, 2 and 2 cities in 2002, 2010 and 2020, respectively, and there was a tendency for cities of this type to move northwards during study period, with Bengbu gradually becoming the Low-Low type, Xuzhou changing from the insignificant type to the High-Low type, and Hefei showing a certain degree of transfer inertia. Suzhou belonged to the Low-High type, with its urban welfare development relatively lagging behind the tourism development of neighboring cities.

4.4. Spatio-Temporal Coupled Coordination Pattern between Urban Welfare and Tourism Development

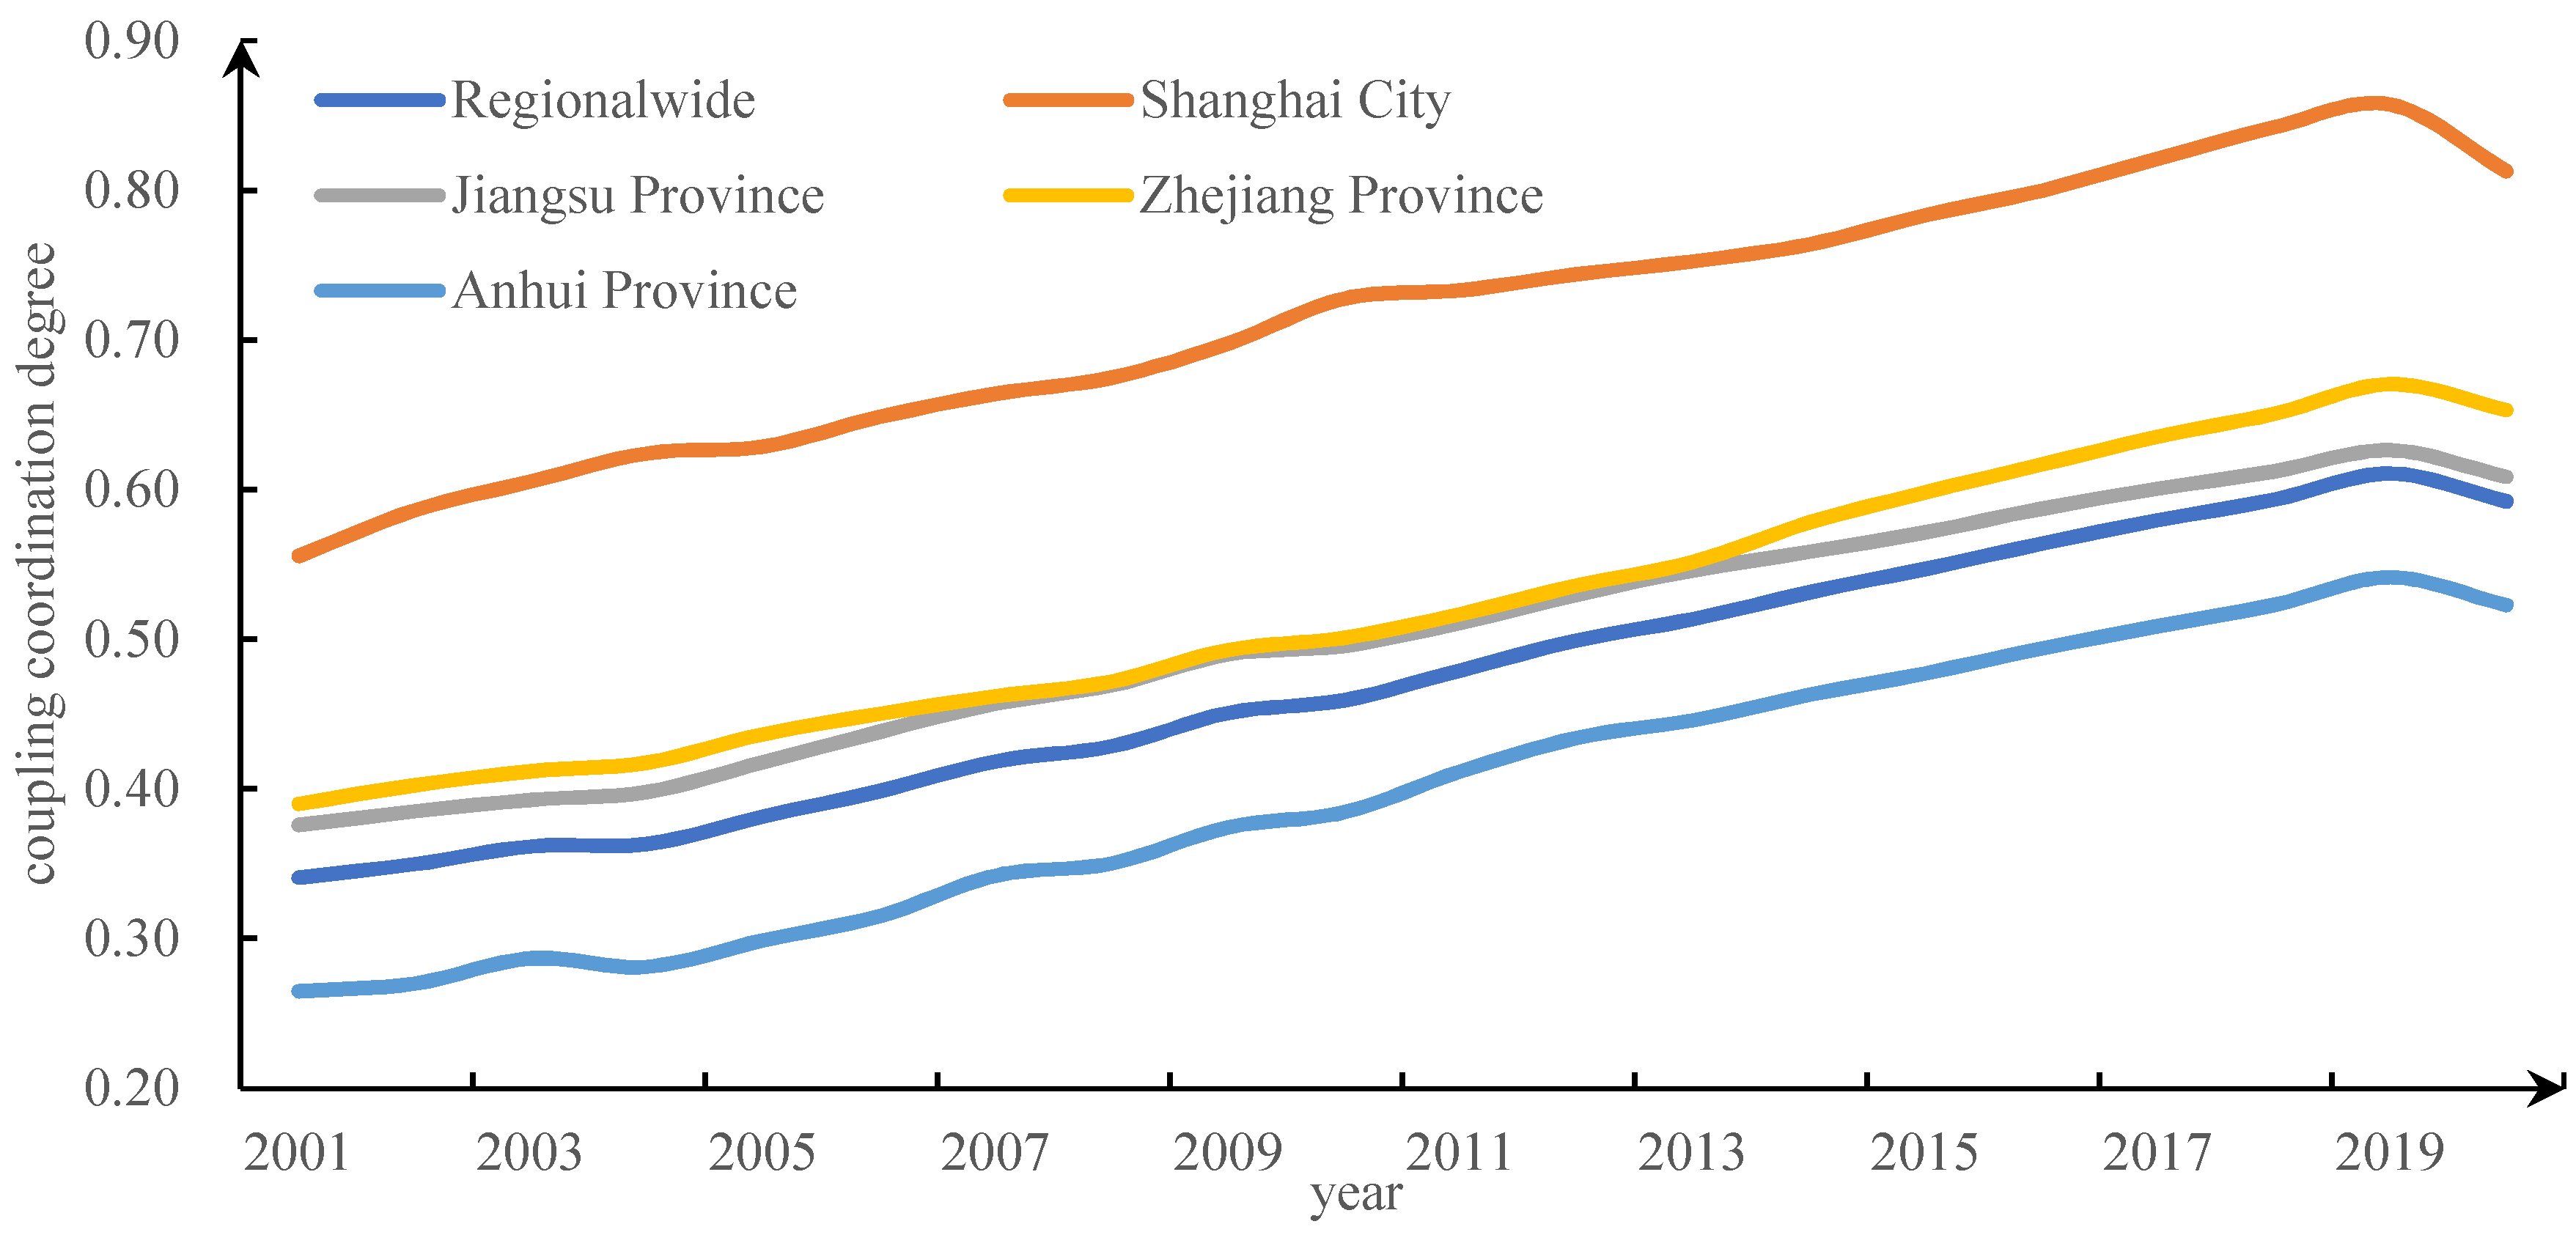
The coupled coordination degree between urban welfare and tourism development for each city was calculated from 2001 to 2020, and the time-series mean values at the provincial level were plotted (Figure 6). As can be seen from Figure 6, the coupled coordination degree of the two systems in the Delta region showed a linear upward trend from 2001 to 2019, with an average annual growth rate of 4.17%, but declined in 2020. The coupled coordination type in the Delta region gradually evolved from mild disorder and near disorder to barely coordinated and primary coordination, indicating that the interaction and feedback processes between the two systems in most cities were moving towards a situation of benign coordination. Comparatively speaking, the coupled coordination degree between urban welfare and tourism development systems in Jiangsu, Zhejiang, Anhui, and Shanghai all showed a relatively consistent upward trend, but the growth rate of coupled coordination degree of the two systems showed Anhui > the Delta region > Zhejiang > Jiangsu > Shanghai.
The coupled coordination degree of Shanghai was far ahead of that of Jiangsu Province, Zhejiang Province, and Anhui Province, and had evolved from barely, primary and intermediate coordination type to good coordination type. Relying on its strong socioeconomic foundation and abundant tourism resources, Shanghai maintained a high level of urban welfare and tourism development, and the two systems achieved a high degree of coupled coordination. The coupled coordination degree of Zhejiang and Jiangsu Provinces increased linearly and in parallel, with an average annual growth rate of 3.55% and 3.25%, respectively, indicating that urban welfare and tourism development in the two provinces formed a highly close development relationship. This was due to the fact that Jiangsu and Zhejiang provinces had a relatively well-constructed urban welfare system, which provided an important guarantee for urban socioeconomic development and effectively promoted the development of the tourism industry, and Jiangsu and Zhejiang provinces had relatively rich tourism resources and a broad tourism market, which played a greater role in promoting regional economic growth, driving urban employment and protecting the ecological environment. Due to the good ecological welfare, the coupled coordination degree of Zhejiang Province was slightly higher than that of Jiangsu Province. The coupled coordination degree between urban welfare and tourism development in Anhui Province was the lowest. This was due to the low level of urban welfare and tourism development in Anhui Province and the failure to form an effective mutual feedback mechanism between the two systems.
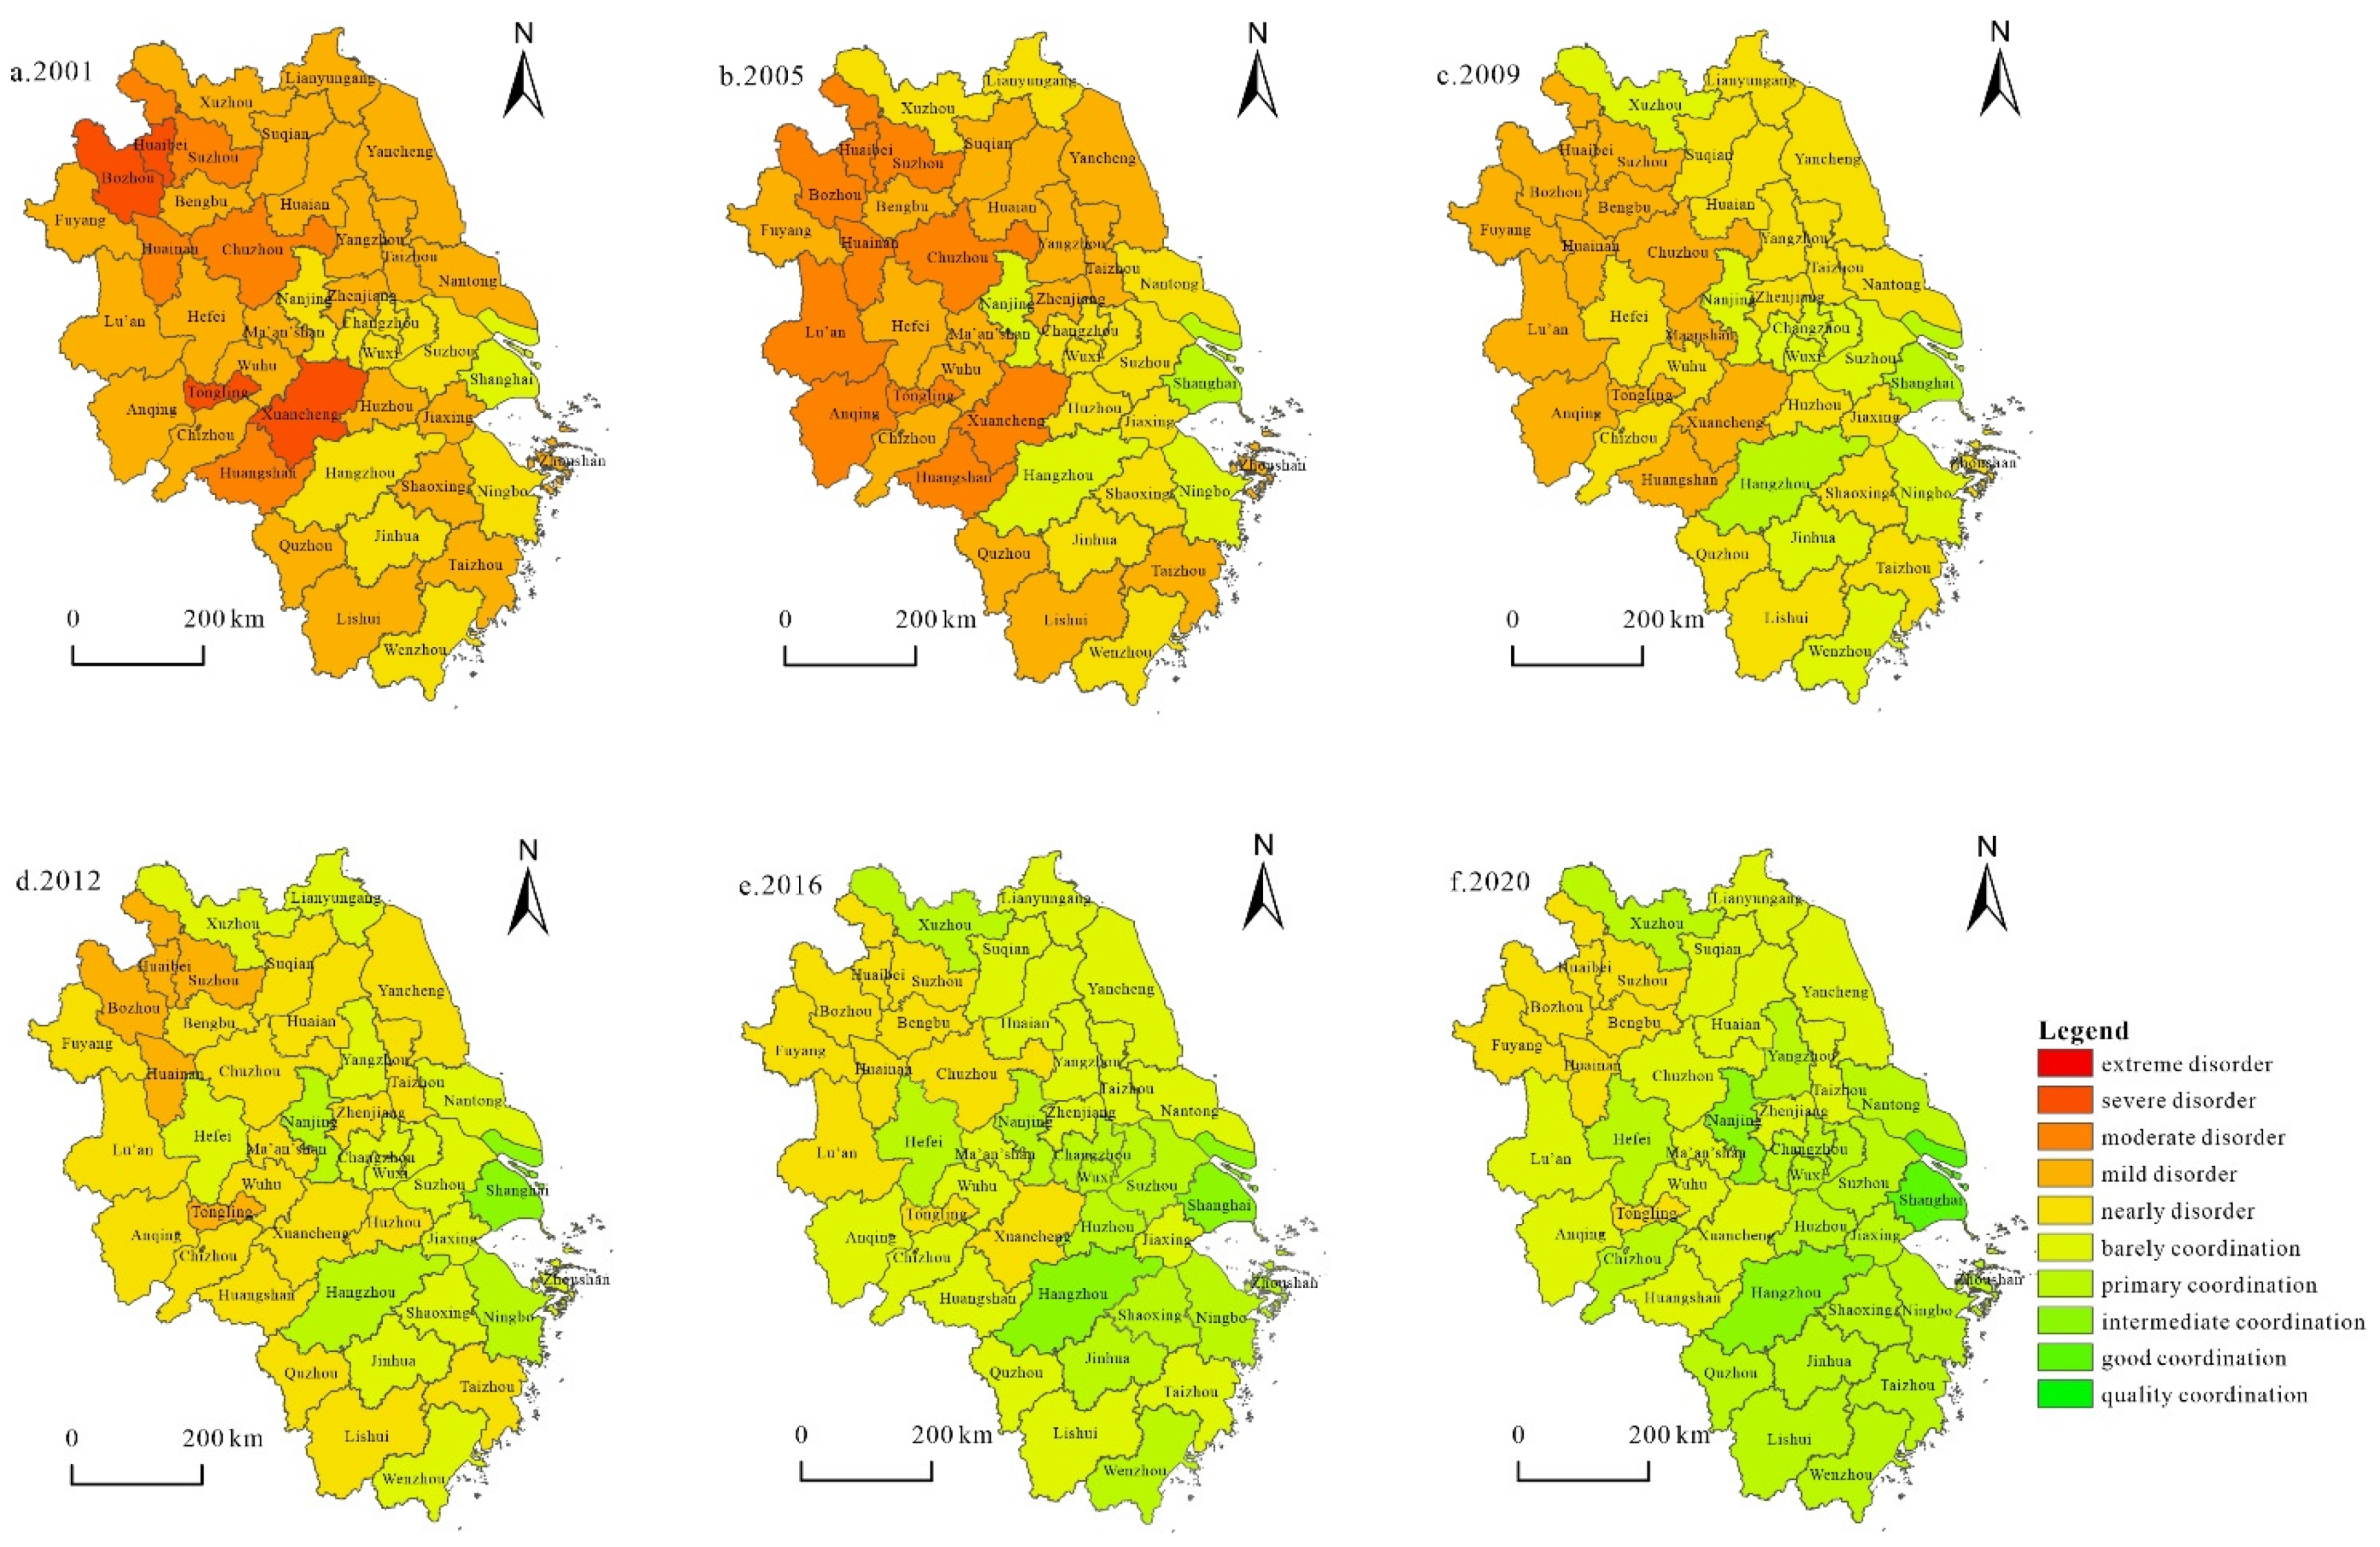
To further reveal the spatial pattern of the coupled coordination degree of urban welfare and tourism development, the coupled coordination degree of each city in 2001, 2005, 2009, 2012, 2016 and 2020 was visualized using ArcGIS10.5 software (Figure 7). Overall, the spatial distribution of the coupled coordination degree in the Delta region showed a decreasing pattern from southeast to northwest.
In 2001, the coupled coordination degree of urban welfare and tourism development in the Delta region was low; 58.54% of the cities belonged to the mild disorder type, mainly concentrated in northern Jiangsu and western Anhui, and 19.51% of the cities belonged to the severe and moderate disorder type, sporadically distributed in Anhui Province. The near disorder type clustered around southern Jiangsu Province and sporadically scattered in Zhejiang Province. Shanghai was the only city belonging to the barely coordinated type. In 2005, the Delta region was dominated by the mild disorder type, with all severe disorder types evolving into moderate disorder types. The number of cities belonging to the moderately and nearly disordered type was almost equal, accounting for 24.39% and 26.83%, respectively. However, there were still few coordinated cities, with Nanjing, Hangzhou and Ningbo moving into the barely coordinated type, while Shanghai took the lead in transforming into a primary coordinated type. In 2009, the moderate disorder type gradually evolved into the mild disorder type, mainly concentrated in Anhui Province. The number of cities belonging to the near disorder and barely coordinated type continued to increase, with the near disorder type becoming the dominant type in the Delta region, and the barely coordinated type tending to cluster in southern Jiangsu Province and scattered sporadically in Zhejiang Province. Hangzhou followed Shanghai into the primary coordination type.
In 2012, the Delta region was still dominated by the near disorder type. The spatial scope of the mild disorder type tended to narrow in the Delta region, while the near disorder and barely coordinated types spread further, with Nanjing and Ningbo becoming the primary coordination type and Shanghai stepping into the intermediate coordination type. In 2016, the number of cities of the barely coordinated type increased significantly, replacing the mild disorder type as the dominant type. The near disorder and primary coordination types tended to concentrate in the northern Anhui, southern Jiangsu and northern Zhejiang. In 2020, with the continued promotion of urban welfare and tourism development, the Delta region was gradually dominated by the barely and primary coordination types, accounting for 31.71% and 43.90%, respectively. However, there were obvious spatial differences between different coupled coordination types. Shanghai, Nanjing and Hangzhou showed the highest coupled coordination levels in the Delta region. The primary and intermediate coordination types covered most cities in Zhejiang Province and southern Jiangsu Province. Anhui Province was dominated by the near disorder and barely coordinated types, while northern Jiangsu was dominated by the barely coordinated type.

5. Discussion

As an important way to promote people’s well-being, urban welfare and tourism development have received wide-ranging attention and achieved research results. However, the study on the intrinsic mechanism and interactive response between them has not been fully explored. This study revealed that urban welfare and tourism development had a bi-directional interactive relationship. The literature has focused on the study of the impact of tourism development on urban welfare [47,48,49,55,56,57]; only a few researchers have concerned with the role of urban welfare in promoting tourism development [51,52]. The Yangtze River Delta region is a pioneer in China’s social and economic construction; a well-developed urban welfare system will benefit tourism development. Hence, this study provides theoretical support and empirical evidence for the causal relationship between urban welfare and tourism development. This study contributes to the current literature in the following ways. First, we explored the bi-directional interaction between urban welfare and tourism development at the macro level. Second, our evaluation index system was more comprehensive, and we further deepened the existing research contents from the perspective of spatial association and coupled coordination. Third, based on the findings that tourism can be an effective means of enhancing urban welfare and that urban welfare has a positive effect on tourism development, we proposed policy recommendations that not only promote the sustainable development of urban welfare and the tourism industry in the Yangtze River Delta region, but also provide policy guidance for developing countries. Fourth, the link of this study to existing theories lies in the fact that the discussion of the relationship between urban welfare and tourism development is a further interpretation of the theory of welfare economics. The welfare economics emphasized the relationship between economic efficiency and social welfare. As the largest economic core of China, exploring the intrinsic association between urban welfare and tourism development in the Delta region is consistent with the emphasis of welfare economics in improving efficiency to enhance social welfare [66].
Admittedly, there are still some deficiencies in this study. First, academics have not reached a consensus on the evaluation system of urban welfare and tourism development. This study mainly selected evaluation indicators used by academics before COVID-19, which may bias the results. More related indicators should be included to fully reflect the multidimensional nature of urban welfare and tourism development in the post COVID-19 era. Second, in terms of the measurement of urban welfare, the study only used objective evaluation methods to measure the development level of urban welfare; the subjective well-being of residents is difficult to characterize by objective indicators. Hence, a combination of subjective and objective methods can be applied to fully reflect the development level of urban welfare. Third, the panel geographically weighted regression model can be used to analyze the influencing factors and formation mechanisms of the coupled coordination degree between urban welfare and tourism development.

6. Conclusions and Recommendations

6.1. Conclusions

Based on the panel data of 41 cities in the Yangtze River Delta region from 2001 to 2020, we applied the PVAR model to explore the dynamic interaction between urban welfare and tourism development, and analyzed the spatial and temporal evolution characteristics of their coupled coordination. The following conclusions were obtained.
First, the level of urban welfare in the Yangtze River Delta steadily increased at an average annual growth rate of 13.85% from 2001 to 2020. The level of tourism development showed a slow growth trend from 2001 to 2019, with an average annual growth rate of 6.32%, but declined in 2020 due to the impact of COVID-19. Meanwhile, the level of urban welfare was significantly higher than tourism development.
Second, there was a long-term equilibrium relationship and mutual Granger causality between urban welfare and tourism development in the Delta region, which validated the interaction between tourism and well-being found in Khan et al. [51]. Both were subject to shocks from themselves and each other. In contrast, their own internal structure had a greater effect of shocks, showing a gradual decline, and tourism development contributed more to urban welfare than urban welfare did to tourism development. There was a significantly increasing positive spatial association between urban welfare and tourism development, and the local spatial association patterns were dominated by High-High and Low-Low agglomeration.
Third, the coupled coordination degree between urban welfare and tourism development in the Delta region maintained a linear upward trend from 2001 to 2019, with an average annual growth rate of 4.17%, but decreased in 2020. The type of coupled coordination gradually evolved from mild and near disorder to barely and primary coordination. Although the coupled coordination degree between the two systems in the Delta region was optimized and the spatial difference of coupled coordination degree among cities decreased, it still showed a decreasing spatial distribution pattern from southeast to northwest.

6.2. Policy Recommendation

Based on the study findings, the following recommendations are made to achieve the coupled coordination development of urban welfare and tourism development.
First, it is necessary to build a resilient tourism industry system to cope with emergencies. On the one hand, it is necessary to actively promote the integration of the tourism industry with other industries to form tourism and agriculture, industry, leisure and other multi-industry types, thus enhancing the tourism industry’s ability to resist and recover from social disruptions. On the other hand, it is necessary to strengthen the construction of tourism science and technology talent support systems. Local government should actively introduce high-level and scarce talents in the field of tourism, build a talent mechanism jointly cultivated by professional colleges, research institutes and training institutions, encourage the use of modern technology to accelerate the iteration and upgrading of tourism products, and consolidate the tourism source markets by enriching tourists’ travelling experience, ultimately achieving the innovative development of the tourism industry.
Second, it is urgent to promote the formation of a mutually supportive cooperation and orderly coordinated development pattern between urban welfare and tourism development. On the one hand, local government should attach importance to the contribution of urban welfare construction to tourism development and cultivate a good physical environment for tourism development through various means such as releasing market economic vitality, stimulating residents’ consumption potential, improving infrastructure construction, expanding greening coverage and strengthening comprehensive environmental management. On the other hand, local government should give full play to the tourism industry’s role in driving urban welfare, extend the tourism industry chain by relying on existing resources and endowments, reduce resource consumption and environmental pollution through innovative technologies and concepts, and promote the tourism industry to transform in the direction of ecology and greening, thereby benefiting urban residents and enhancing urban welfare.
Third, it is necessary to develop differentiated enhancement strategies based on local conditions. Well-coordinated cities, such as Shanghai, Nanjing and Hangzhou, should give full play to their advantages in science, technology and talents and should focus on improving environmental welfare and the efficiency of tourism resource allocation to achieve a breakthrough in high-quality coordination. The intermediate and primary coordinated cities should actively create cities with distinctive welfare and tourism characteristics and implement special actions such as urban–rural integration and co-building, public service sharing, and ecological and environmental management. Cities in near disorder, such as Tongling and Fuyang, on one hand, should further improvement initiatives should optimize the industrial structure, transform the crude economic development mode at the expense of the environment, focus on the integration of ecological governance, reduce the pressure on resources and the environment, and create great green ecological welfare for urban development. On the other hand, they should effectively integrate and utilize red cultural tourism resources, promote differentiated and synergistic development of tourism industries in neighboring cities, create tourism industry clusters and enhance tourism development.
Finally, it is important to break administrative barriers and establish cross-regional cooperation mechanisms. Local government should actively promote the establishment of a cross-regional cooperation mechanism with the provincial capital city as the core, and continuously strengthen the role of well-coordinated cities such as Shanghai, Nanjing and Hangzhou in sharing initiatives related to the coordinated development of urban welfare and tourism. In addition, disordered and poorly coordinated cities should take the initiative to integrate into the Yangtze River Delta integration construction process, learn from the development modes of well-coordinated cities, integrate and promote the orderly flow of production factors such as passenger flow, logistics flow, information flow and technology flow between cities, form complementary advantages and bridge the spatial and temporal imbalance in the synergistic development of the two systems in the Yangtze River Delta.

Author Contributions

Conceptualization, M.H.; methodology, M.H.; software, C.W.; validation, C.W.; investigation, Y.M.; resource, A.Z.; data curation, Y.M.; writing—original draft preparation, C.W.; writing—review and editing, M.H; supervision, A.Z.; project adminstration, A.Z.; funding acquisition, A.Z. All authors have read and agreed to the published version of the manuscript.

Funding

This research was funded by the National Natural Science Foundation of China, grant number “41801123”, Youth Fund for Humanities and Social Sciences Research, Ministry of Education of China, grant number “22YJCZH230”, Postgraduate Research Innovation Program Project in Jiangsu Province, grant number “KYCX21_3179”.

Data Availability Statement

The data presented in this study are available on request from the corresponding author.

Conflicts of Interest

The authors declare no conflict of interest.

References

  1. Donald, J.T. The “difference between heaven and earth”: Urban–rural disparities in well-being in China. Res. Soc. Stratif. Mobil. 2012, 30, 33–47. [Google Scholar]
  2. Lu, Q.Q.; Xu, G.J.; Xu, K. Urbanization, business cycleand regional income distribution disparity: An analysis based on panel threshold model. Econ. Probl. 2020, 2, 25–32. [Google Scholar]
  3. Tang, L.N.; Wan, S.Y. Empirical test of relationship between the level of new urbanization and social security. Stat. Decis. 2022, 38, 62–65. [Google Scholar]
  4. Ding, L.; Shao, Z.F.; Zhang, H.C.; Xu, C.; Wu, D.W. A comprehensive evaluation of urban sustainable development in China based on the topsis-entropy method. Sustainability 2016, 8, 746. [Google Scholar] [CrossRef] [Green Version]
  5. Sun, J.Q.; Shi, J.; Shen, B.Y.; Li, S.Q.; Wang, Y.W. Nexus among energy consumption, economic growth, urbanization and carbon emissions: Heterogeneous panel evidence considering China’s regional differences. Sustainability 2018, 10, 2383. [Google Scholar] [CrossRef] [Green Version]
  6. Liang, X.C. A logical interpretation of the tourism industry to promote social welfare. Tour. Trib. 2019, 34, 3–4. [Google Scholar]
  7. Shen, J.B.; Xu, T.; Lu, M.M.; Zhai, Y.X. Countermeasures for coping with the impacts of the COVID-19 and the development tendency of the tourist industry in the post-epidemic period. Macroecon. Manag. 2020, 8, 55–60. [Google Scholar]
  8. Zhou, C.; Feng, X.G.; Tang, R. Analysis and forecast of coupling coordination development among the regional economy-ecological environmental-tourism industry: A case study of provinces along the Yangtze Economic Zone. Econ. Geogr. 2016, 36, 186–193. [Google Scholar]
  9. Christian, S.; Daniele, L. Investigating students’ eco-misperceptions in applying eco-design methods. J. Clean. Prod. 2022, 342, 130866. [Google Scholar]
  10. Daly, H.E.; Cobb, J.B. For the Common Good; Boston Beacon: Boston, MA, USA, 1989. [Google Scholar]
  11. Zhang, W.B.; Guo, Q. China’s sustainable economic welfare measurement and the analysis of its regional differences. J. Manag. 2019, 32, 19–30. [Google Scholar]
  12. Lu, J.; Chen, Y.; Guo, Z.Y. Social welfare, economic growth, and regional development difference: A coupling analysis based on Chinese Provincial data. Chin. J. Popul. Sci. 2012, 3, 31–43+111. [Google Scholar]
  13. Amartya, S. Capability and well-being. In The Quality Life; Nussbaum, M., Sen, A., Eds.; Oxford University Press: Oxford, UK, 1993. [Google Scholar]
  14. Abdallah, S.; Marks, N. The happy planet index. In Encyclopedia of Quality of Life and Well-Being Research; Springer: Dordrecht, The Netherlands, 2014. [Google Scholar]
  15. Wang, S.Y.; Luo, Y.T.; Han, Y.J.; Li, J. Regional difference and determinants of human well-being in China: Based on the analysis of human development index. Prog. Geogr. 2018, 37, 1150–1158. [Google Scholar]
  16. Max-Neef, M. Economic growth and quality of life: A threshold hypothesis. Ecol. Econ. 1995, 15, 115–118. [Google Scholar] [CrossRef]
  17. Armiento, M. The sustainable welfare index: Towards a threshold effect for Italy. Ecol. Econ. 2018, 152, 296–309. [Google Scholar] [CrossRef]
  18. Mahony, T.; Escardo-Serra, P.; Dufour, J. Revisiting ISEW valuation approaches: The case of Spain including the costs of energy depletion and of climate change. Ecol. Econ. 2018, 144, 292–303. [Google Scholar] [CrossRef]
  19. Bleys, B. Proposed changes to the index of sustainable economic welfare: An application to Belgium. Ecol. Econ. 2008, 64, 741–751. [Google Scholar] [CrossRef]
  20. Yuan, Y.; Zhang, W.B.; Jiao, B. Study on the measurement of sustainable economic welfare and threshold effect in China Province. J. Stat. Inf. 2021, 36, 23–34. [Google Scholar]
  21. Zhuang, R.L.; Mi, K.N.; Chen, Y.; Zhao, B. Temporal-spatial difference of coupling and coordination of social welfare and economic growth in the Yangtze River Delta. Resour. Environ. Yangtze River Basin 2017, 26, 171–179. [Google Scholar]
  22. He, J.; Chen, J.M.; Wan, H.Y. Demographic structure, economic growth and China’s social welfare level. J. Northeast. Univ. 2018, 20, 19–26. [Google Scholar]
  23. Zhang, M.; Zou, X.R.; Sha, L. Social security and sustainable economic growth: Based on the perspective of human capital. Sustainability 2019, 11, 662. [Google Scholar] [CrossRef] [Green Version]
  24. Vinodh, K.N.; Muhammad, A.U.H.; Jayendira, P.S. Causality between public expenditure and economic growth in the Kingdom of Bahrain. Middle East J. Manag. 2022, 9, 209–225. [Google Scholar]
  25. Pan, S.N.; Li, B.W.; Nie, H.G. Research on the interactive relationship between ecological welfare and economic development: Based on the concept of sustainable development. Sci. Technol. Manag. Res. 2020, 40, 237–244. [Google Scholar]
  26. Xu, Y.; Yu, J.J.; Yang, C. The temporal and spatial differentiation and driving factors of urban green development welfare in Yangtze River Delta Region. J. Jiangxi Norm. Univ. 2022, 46, 180–189. [Google Scholar]
  27. Liu, H.H.; Xiao, Y.; Wang, B.; Wu, D.T. Effects of tourism development on economic growth: An empirical study of China based on both static and dynamic spatial Durbin models. Tour. Econ. 2022, 28, 1888–1913. [Google Scholar] [CrossRef]
  28. Faber, B.; Gaubert, C. Tourism and economic development: Evidence from Mexico’s coastline. Am. Econ. Rev. 2019, 109, 2245–2293. [Google Scholar] [CrossRef] [Green Version]
  29. Sokhanvar, A.; Çiftçioğlu, S.; Javid, E. Another look at tourism-economic development nexus. Tour. Manag. Perspect. 2018, 26, 97–106. [Google Scholar] [CrossRef]
  30. Dogru, T.; Bulut, U. Is tourism an engine for economic recovery? Theory and empirical evidence. Tour. Manag. 2018, 67, 425–434. [Google Scholar] [CrossRef]
  31. Isik, C.; Dogan, E.; Ongan, S. Analyzing the tourism-energy-growth nexus for the top 10 most-visited countries. Economics 2017, 5, 40. [Google Scholar]
  32. Wall, G.; Wright, C. The Environment Impact of Outdoor Recreation; University of Waterloo: Ontario, ON, Canada, 1977. [Google Scholar]
  33. Joye, J.F. Tourism development and adaptation to climate change through legal constraint. Worldw. Hosp. Tour. Themes 2018, 10, 244–252. [Google Scholar] [CrossRef]
  34. Wang, Z.F.; Li, J.Y. Verify and study the coupling coordination development and the interactive stress between tourism and eco-environment in the Yellow River Basin. Resour. Environ. Yangtze River Basin 2022, 31, 447–460. [Google Scholar]
  35. Hu, Q.S.; He, X.R.; Guo, H. Coupling coordination between an urban tourism and ecological environment system in Changsha City. J. Nat. Sci. Hum. Norm. Univ. 2018, 41, 9–15. [Google Scholar]
  36. Liu, Y.Z.; Hu, Z.Y. Research on the coordination of tourism development and protection coupling of ecological environment based on PSR model: The empirical evidence from Guizhou Province. Ecol. Econ. 2020, 36, 132–136. [Google Scholar]
  37. Tang, W.; Zhou, T.C.; Sun, J.; Li, Y.R.; Li, W.P. Accelerated urban expansion in Lhasa City and the implications for sustainable development in a plateau city. Sustainability 2017, 9, 1499. [Google Scholar] [CrossRef] [Green Version]
  38. Zhao, L.; Dong, Y.F. Tourism agglomeration and urbanization: Empirical evidence from China. Asia Pac. J. Tour. Res. 2017, 22, 512–523. [Google Scholar] [CrossRef]
  39. Wang, K.; Huang, Z.F.; Yu, F.L.; Cao, F.D. Spatial effects of China’s urbanization on tourism economic development: Empirical research based on the spatial panel econometric model. Tour. Trib. 2016, 31, 15–25. [Google Scholar]
  40. Yang, Z.Q. Study on the mechanism of synergistic development between tourism and new urbanization. Soc. Sci. 2018, 10, 85–90. [Google Scholar]
  41. Xie, N. Coupling of urbanization and the development of the marine tourism industry: An exploratory study. J. Coast. Res. 2020, 106, 213–216. [Google Scholar] [CrossRef]
  42. Zhang, F.T.; Sarker, M.N.I.; Lv, Y. Coupling coordination of the regional economy, tourism industry, and the ecological environment: Evidence from western China. Sustainability 2022, 14, 1654. [Google Scholar] [CrossRef]
  43. Liu, J.S.; Li, C.; Tao, J.Q.; Ma, Y.F.; Wen, X.J. Spatio-temporal coupling factors and mode of tourism industry of tourism industry, urbanization and ecological environment: A case study of Shanxi, China. Sustainability 2019, 11, 4923. [Google Scholar] [CrossRef] [Green Version]
  44. Xie, X.; Sun, H.; Gao, J.; Chen, F.F.; Zhou, C.S. Spatio-temporal differentiation of coupling and coordination relationship of tourism-urbanization-ecological environment system in China’s major tourist cities. Sustainability 2021, 13, 5867. [Google Scholar] [CrossRef]
  45. Weng, G.M.; Tang, Y.B.; Pan, Y.; Mao, Y.Q. Spatio-temporal evolution and spatial difference of tourism-ecology-urbanization coupling coordination in Beijing-Tianjin-Hebei urban agglomeration. Econ. Geogr. 2021, 41, 196–204. [Google Scholar]
  46. Liu, D.G.; Wang, C.J.; Liu, L. Recognition and feelings of rural household towards tourism development in ethic areas: A case study on Dong villages in Zhaoxing, Guizhou. Guizhou Soc. Sci. 2019, 5, 88–93. [Google Scholar]
  47. Urtasun, A.; Gutie’rrez, L. Tourism agglomeration and its impact on social welfare: An empirical approach to the Spanish case. Tour. Manag. 2005, 27, 901–912. [Google Scholar] [CrossRef] [Green Version]
  48. Tokarchuk, O.; Gabriele, R.; Maurer, O. Development of city tourism and well-being of urban residents: A case of German magic cities. Tour. Econ. 2017, 23, 343–359. [Google Scholar] [CrossRef]
  49. Choudhary, P.; Amit, G. Impact of tourism development (TD) on Non-Material Well-Being (NMWB) of residents of Chittorgarh, Rajasthan. J. Tour. Intell. Smartness 2019, 2, 14–26. [Google Scholar]
  50. Kyungmi, K.; Muzaffer, U.; Joseph, M.S. How does tourism in a community impact the quality of life of community residents? Tour. Manag. 2013, 36, 527–540. [Google Scholar]
  51. Hjalagar, A. Innovation in tourism from a welfare state perspective Scandinavian. Scand. J. Hosp. Tour. 2005, 5, 46–62. [Google Scholar] [CrossRef]
  52. Khan, A.; Bibi, S.; Lyu, J.Y.; Alam, M.; Khan, M.M.; Nurunnabi, M. The quest of tourism and overall well-being: The developing economy of Pakistan. PSU Res. Rev. 2021, 5, 120–140. [Google Scholar] [CrossRef]
  53. Raymond, C.; Brown, G. A spatial method for assessing resident and visitor attitudes towards tourism growth and development. J. Sustain. Tour. 2007, 15, 520–540. [Google Scholar] [CrossRef]
  54. Zha, J.P.; Tan, T.; Li, Y.Y.; He, L.M. A decomposition analysis on the tourist industrial linkage in China: An empirical research based on input-output analysis. J. Shanxi Univ. Financ. Econ. 2018, 40, 62–74. [Google Scholar]
  55. Bushell, R.; Sheldon, P.J. Wellness and Tourism: Mind, Body, Spirit, Place; Cognizant Communication Corporation: New York, NY, USA, 2009. [Google Scholar]
  56. Hartwell, H.; Fyall, A.; Willis, C.; Page, S.; Ladkin, A.; Hemingway, A. Progress in tourism and destination wellbeing research. Curr. Issues Tour. 2018, 21, 1830–1892. [Google Scholar] [CrossRef] [Green Version]
  57. Dolnicar, S.; Yanamandram, V.; Cliff, K. The contribution of vacations to quality of life. Ann. Tour. Res. 2011, 39, 59–83. [Google Scholar] [CrossRef] [Green Version]
  58. Shu, X.L.; Gao, Y.B.; Zhang, Y.X.; Yang, C.Y. Study on the coupling relationship and coordinative development between industry and eco-civilization city. China Popul. Resour. Environ. 2015, 25, 82–90. [Google Scholar]
  59. Shi, P.F.; Li, X.M.; Xiong, Y.B. Coupling measurement and prospect forecast of regional “Beautiful China” construction and tourism industry development: A case study of 11 provinces along the Yangtze River Economic Belt. China Soft Sci. 2018, 2, 86–102. [Google Scholar]
  60. Hu, Y.; Zheng, J.Y. Is green credit a good tool to achieve “double Carbon” goal? Based on coupling coordination model and PVAR model. Sustainability 2021, 13, 14074. [Google Scholar] [CrossRef]
  61. Li, Z.J.; Hu, M.J.; Zhang, A.P.; Zhou, N.X. Influence and spillover effect of industrial eco-efficiency on PM2.5 pollution. J. Nat. Resour. 2021, 36, 737–751. [Google Scholar] [CrossRef]
  62. Xing, L.; Xue, M.G.; Hu, M.S. Dynamic simulation and assessment of the coupling coordination degree of the economy-resource-environment system: Case of Wuhan City in China. J. Environ. Manag. 2019, 230, 470–487. [Google Scholar] [CrossRef] [PubMed]
  63. Shi, T.; Yang, S.Y.; Zhang, W.; Zhou, Q. Coupling coordination degree measurement and spatio-temporal heterogeneity between economic development and ecological environment: Empirical evidence from tropical and subtropical regions of China. J. Clean. Prod. 2020, 244, 118739. [Google Scholar] [CrossRef]
  64. Wang, S.J.; Kong, W.; Ren, L.; Zhi, D.D.; Dai, B.T. Research on misuses and modification of coupling coordination degree model in China. J. Nat. Resour. 2021, 36, 793–810. [Google Scholar] [CrossRef]
  65. Liao, Z.B. Quantitative judgement and classification system for coordinated development of environment and economy: A case study of the city group in the Pearl River Delta. Trop. Geogr. 1999, 2, 76–82. [Google Scholar]
  66. Jackso, P. Welfare Economic, in What’s New in Economics? Maloney, J., Ed.; Manchester University Press: Manchester, UK, 1992. [Google Scholar]
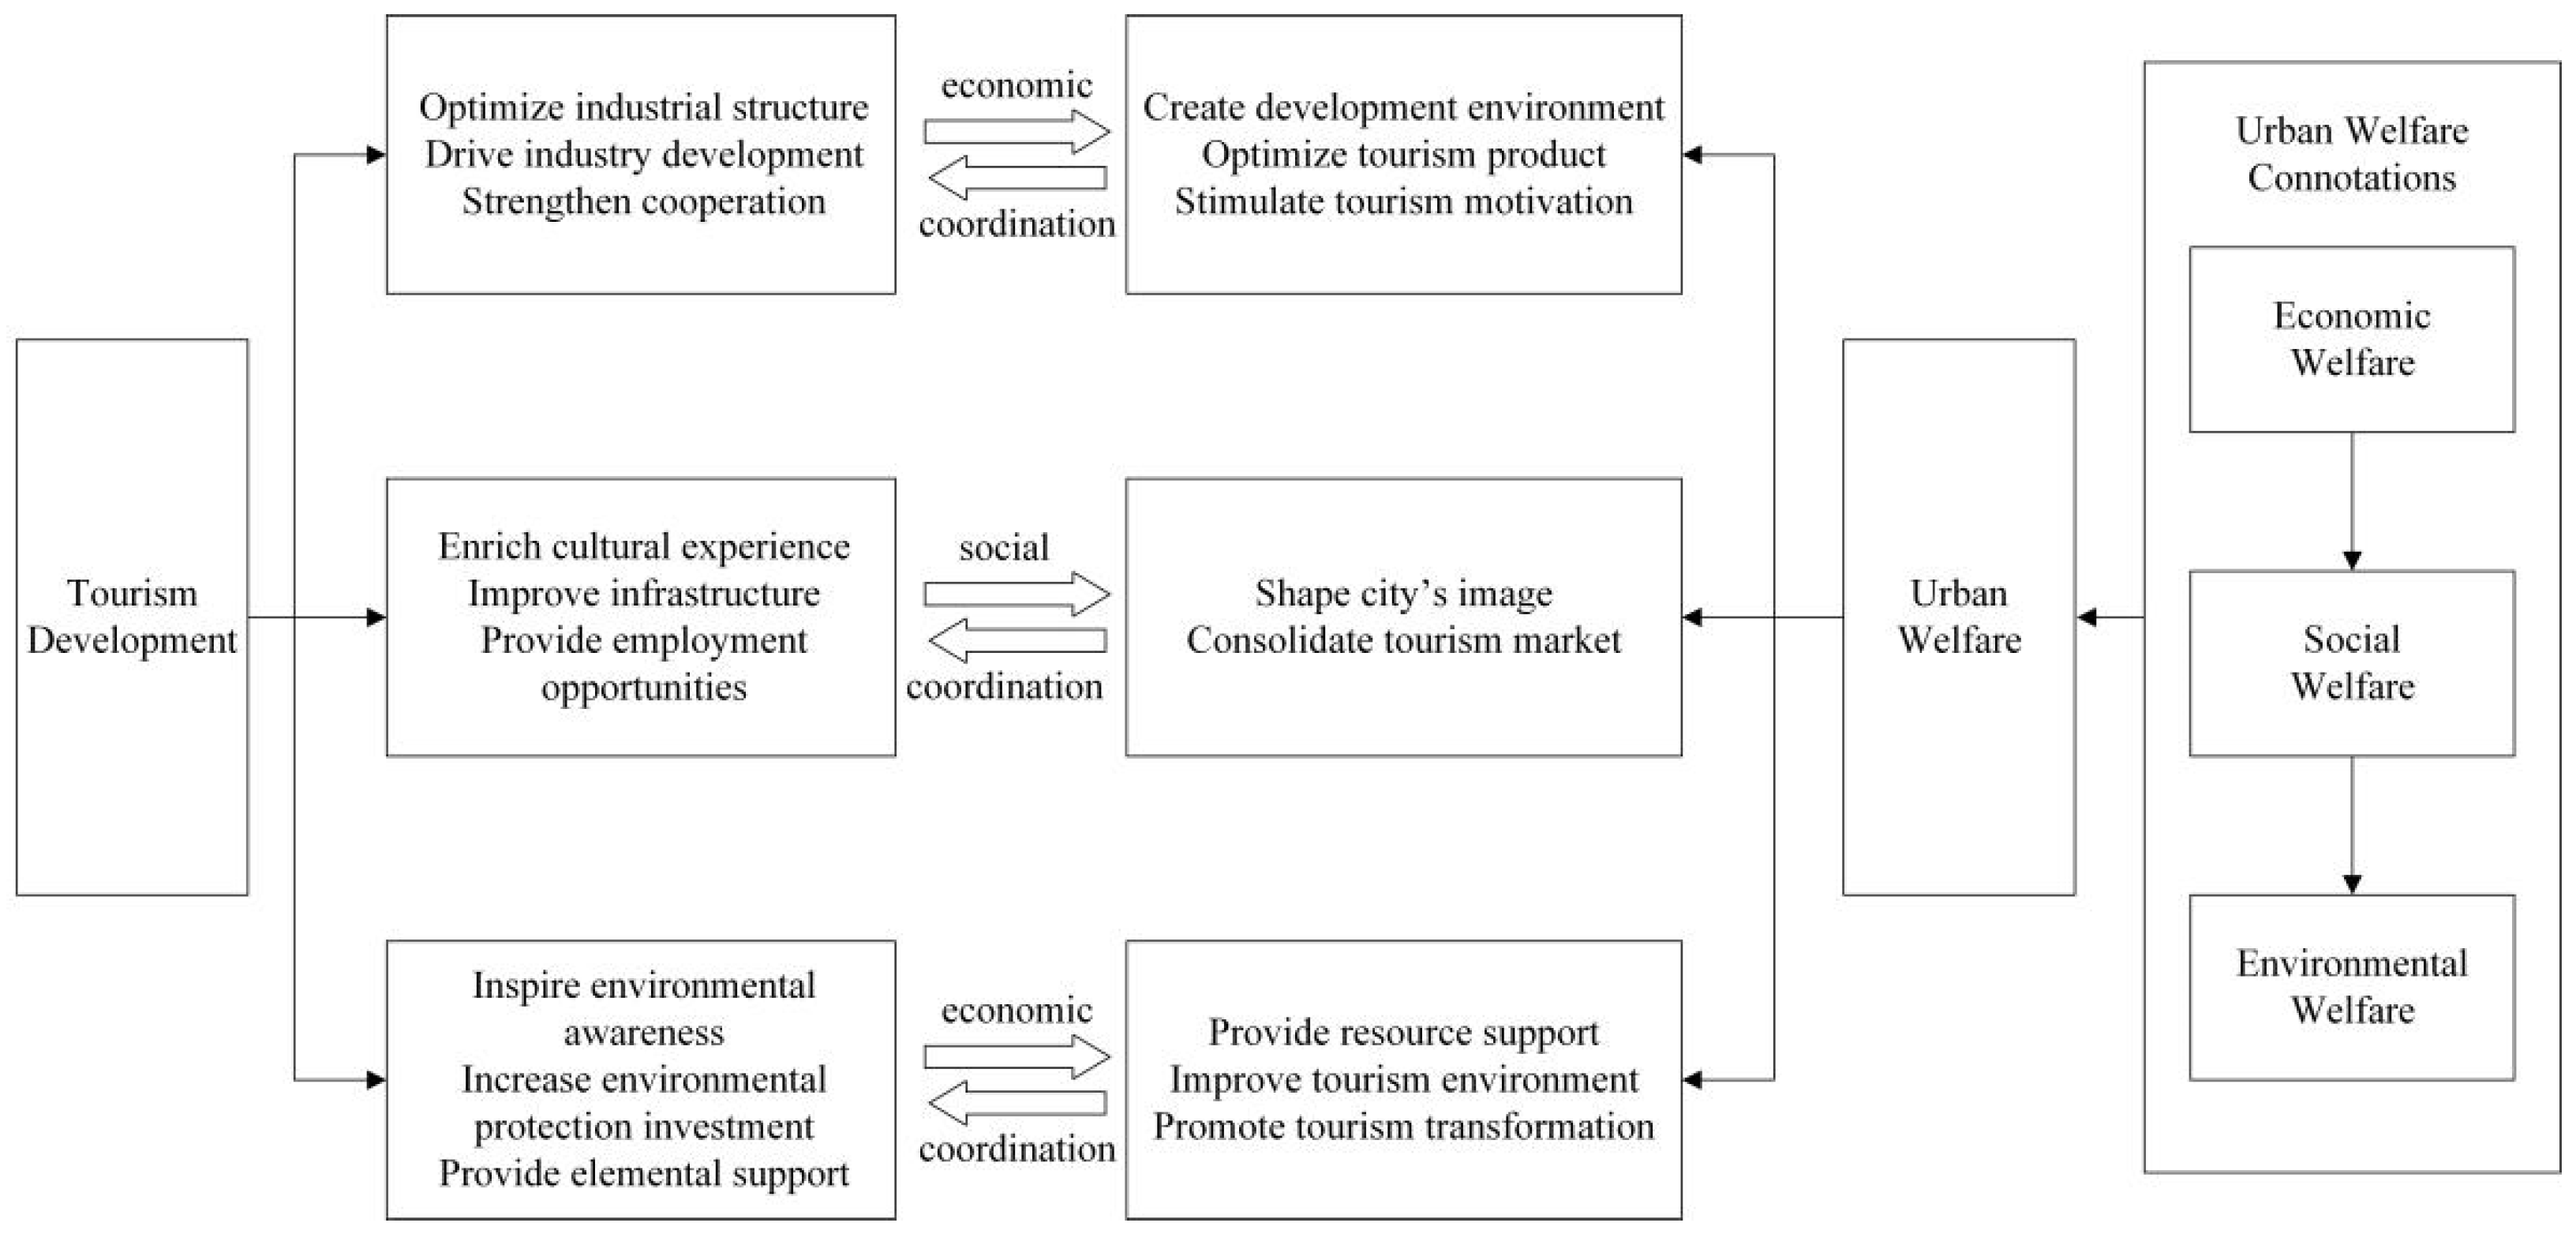
Figure 1. Interaction mechanism between urban welfare and tourism development.
Systems 10 00222 g001
Figure 2. Dynamic changes of urban welfare and tourism development levels. (a) The dynamic change of urban welfare levels; (b) The dynamic change of tourism development levels.
Systems 10 00222 g002
Figure 3. Impulse response between urban welfare and tourism development. Note: the red line represents the impulse response curve, and the green and blue lines represent the 5% and 95% quantile lines.
Systems 10 00222 g003
Figure 4. Bivariate Moran’s I between urban welfare and tourism development.
Systems 10 00222 g004
Figure 5. Bivariate Lisa clustering between urban welfare and tourism development. (a) Represent the bi-variate Lisa clustering between urban welfare and tourism development in 2002; (b) Represent the bivariate Lisa clustering between urban welfare and tourism development in 2010; (c) Represent the bivariate Lisa clustering between urban welfare and tourism development in 2020.
Systems 10 00222 g005
Figure 6. Time series evolution of coupled coordination between urban welfare and tourism development.
Systems 10 00222 g006
Figure 7. Spatial pattern of the coupled coordination degree between urban welfare and tourism devel-opment. (a) Represent the spatial pattern of the coupled coordination degree between urban welfare and tourism development in 2001; (b) Represent the spatial pattern of the coupled coor-dination degree between urban welfare and tourism development in 2005; (c) Represent the spatial pattern of the coupled coordination degree between urban welfare and tourism devel-opment in 2009; (d) Represent the spatial pattern of the coupled coordination degree between urban welfare and tourism development in 2012; (e) Represent the spatial pattern of the coupled coordination degree between urban welfare and tourism development in 2016; (f) Represent the spatial pattern of the coupled coordination degree between urban welfare and tourism devel-opment in 2020.
Systems 10 00222 g007
Table 1. The classification of coupled coordination degree level.
RankCoupled Coordination ValueCoupled Coordination TypeRankCoupled Coordination ValueCoupled Coordination Type
1[0, 0.1)extreme disorder6[0.5, 0.6)barely coordinated
2[0.1, 0.2)severe disorder7[0.6, 0.7)primary coordination
3[0.2, 0.3)moderate disorder8[0.7, 0.8)intermediate coordination
4[0.3, 0.4)mild disorder9[0.8, 0.9)good coordination
5[0.4, 0.5)near disorder10[0.9, 1]quality coordination
Table 2. Evaluation indicators of urban welfare and tourism development.
Target LevelGuideline LevelIndex Level
The development level of urban welfare (UW)Economic WelfareGDP per capita (Y1), urban disposable income per capita (Y2), rural disposable income per capita(Y3), financial income per capita (Y4), fixed asset investment per capita (Y5), average wage of employees (Y6), savings per capita (Y7), urban per capita consumption (Y8), rural per capita consumption (Y9), Engel’s coefficient for urban residents * (Y10), Engel’s coefficient for rural residents * (Y11), consumer price index * (Y12), residence price index * (Y13), fixed investment as a proportion of GDP (Y14)
Social
Welfare
growth rate of health investment (Y15), number of doctors per 10,000 people (Y16), number of hospitals per 10,000 people (Y17), number of hospital beds per 10,000 people (Y18), average years of education (Y19), social literacy rate (Y20), basic medical coverage (Y21), minimum subsistence rate (Y22), social employment rate (Y23), urban registered unemployment rate * (Y24), roads per capita (Y25), buses per 10,000 people (Y26), housing floor area per urban dweller (Y27), housing floor area per rural dweller (Y28), Internet penetration rate (Y29), public toilets per 10,000 people (Y30), share of financial expenditure on social public services (Y31), number of libraries per 10,000 people (Y32)
Environmental Welfaregreenery coverage of built-up areas (Y33), green space per capita (Y34), forest coverage (Y35), number of parks per 10,000 people (Y36), air quality excellence rate (Y37), percentage of investment in environmental pollution control (Y38), industrial wastewater discharge compliance rate (Y39), integrated utilization rate of industrial soild waste (Y40), harmless disposal rate of domestic waste (Y41), urban water conservation reuse rate (Y42)
The development level of tourism (TD)Tourism Industry Scalenumber of star-rated hotels (X1), number of scenic spots above Grade 3A (X2), number of travel agents (X3), tertiary sector employees (X4)
Tourism Market Sizeinbound tourism arrivals (X5), domestic tourism arrivals (X6)
Tourism Industry Economyforeign exchange earnings from tourism (X7), domestic tourism receipts (X8), tourism revenue as a percentage of GDP (X9), destination tourism per capita (X10), domestic tourism spending per capita (X11), inbound tourism spending per capita (X12)
Note: indexes with * are negative indicators.
Table 3. Results of unit root tests for urban welfare and tourism development.
Testing
Methods
LLC TestIPS TestADF-Fisher TestHT TestConclusion
Z-Valuep-ValueZ-Valuep-ValueZ-Valuep-ValueZ-Valuep-Value
UW−3.3930.000−5.2520.000−0.1180.453−1.7630.039unstable
dUW−11.3270.000−14.4670.000−13.4420.000−21.3100.000stable
TD0.8880.813−1.1160.1323.1920.999−2.6980.004unstable
dTD−0.2320.000−11.1760.000−6.0590.000−24.3300.000stable
Table 4. Panel co-integration test.
StatisticValueZ-Valuep-Value
Gt−2.311−8.2160.000
Ga−15.836−16.9410.000
Pt−12.820−8.1830.000
Pa−16.194−33.5450.000
Table 5. Results of Granger’s causality test.
EquationChi2Prob > Chi2Conclusion
UW is not TD’s Granger cause38.2740.000Rejection ***
TD is not UW’s Granger cause3.1170.077Rejection *
Note: *** and * indicate rejection of the original hypothesis at the 1% and 10% significance level, respectively.
Publisher’s Note: MDPI stays neutral with regard to jurisdictional claims in published maps and institutional affiliations.